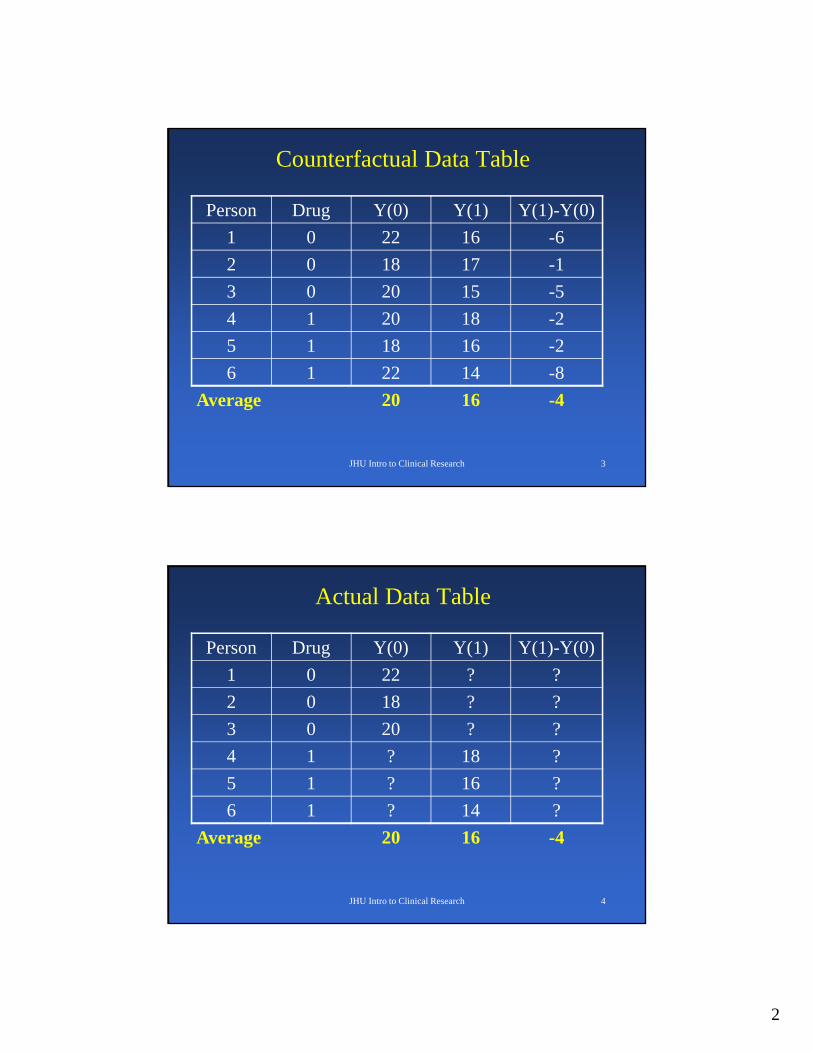
Goal of Statistical “Causal” Inference• “Fill-in” missing information in the counterfactual
data table
• Use data for persons receiving the other treatment to fill-in a persons missing outcome
• Inherent assumption that the other persons are similar except for the treatment: “otherwise similar”
• Compare like-to-like
JHU Intro to Clinical Research 6
Confounding
Confound means to “confuse”
When the comparison is between groups that are otherwise not similar in ways that affect the outcome
Simpson’s paradox; lurking variables,….
4
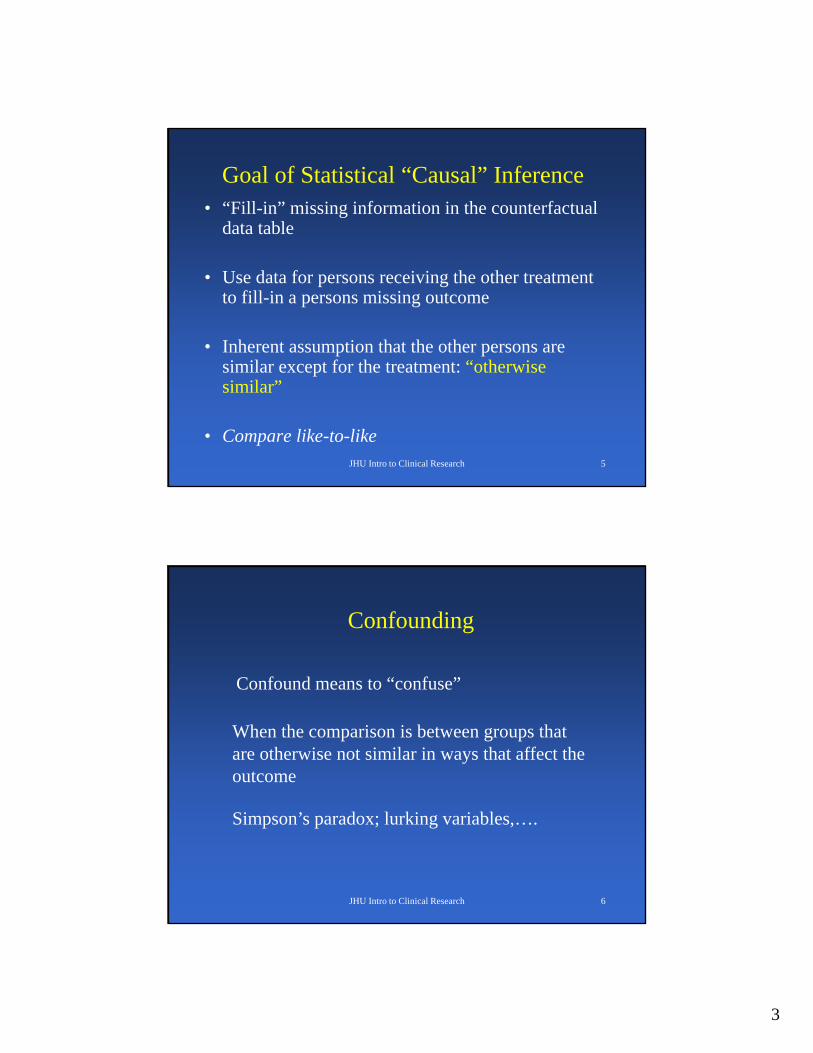
Confounding Example: Drowning and Ice Cream Consumption
JHU Intro to Clinical Research 7Ice Cream consumption
Drowning rate per day
*******
**
*
**
*
*******
**
*
**
*
JHU Intro to Clinical Research 8
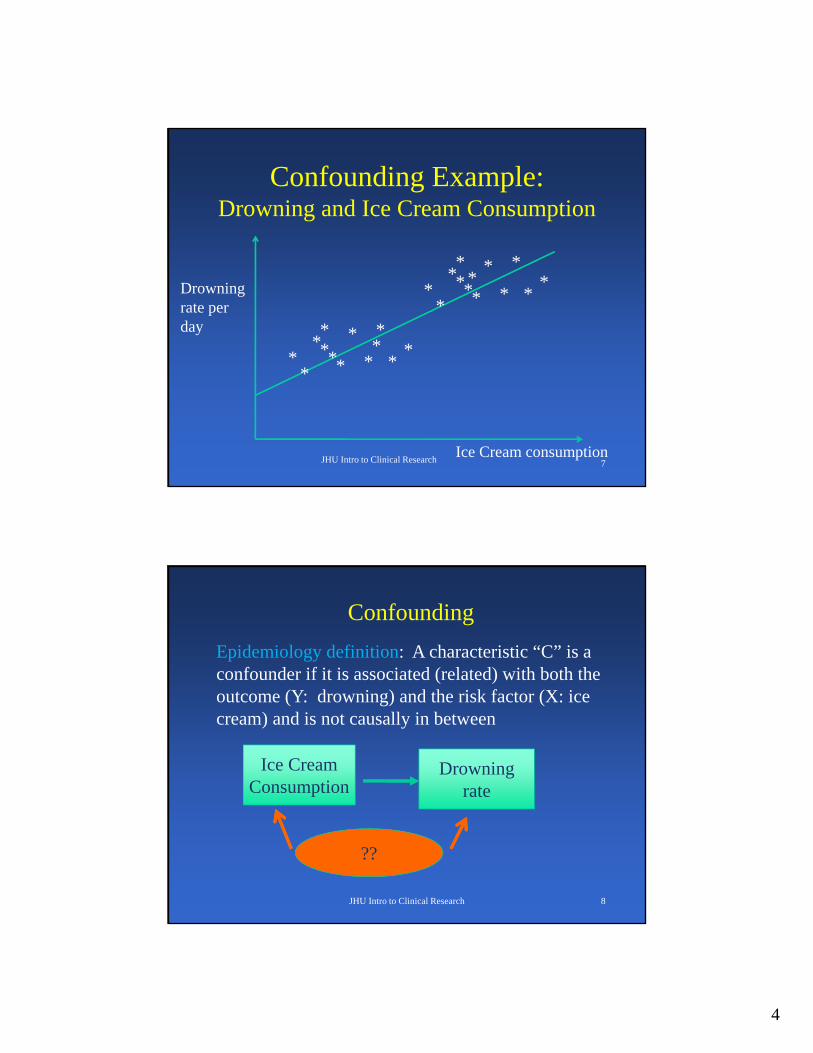
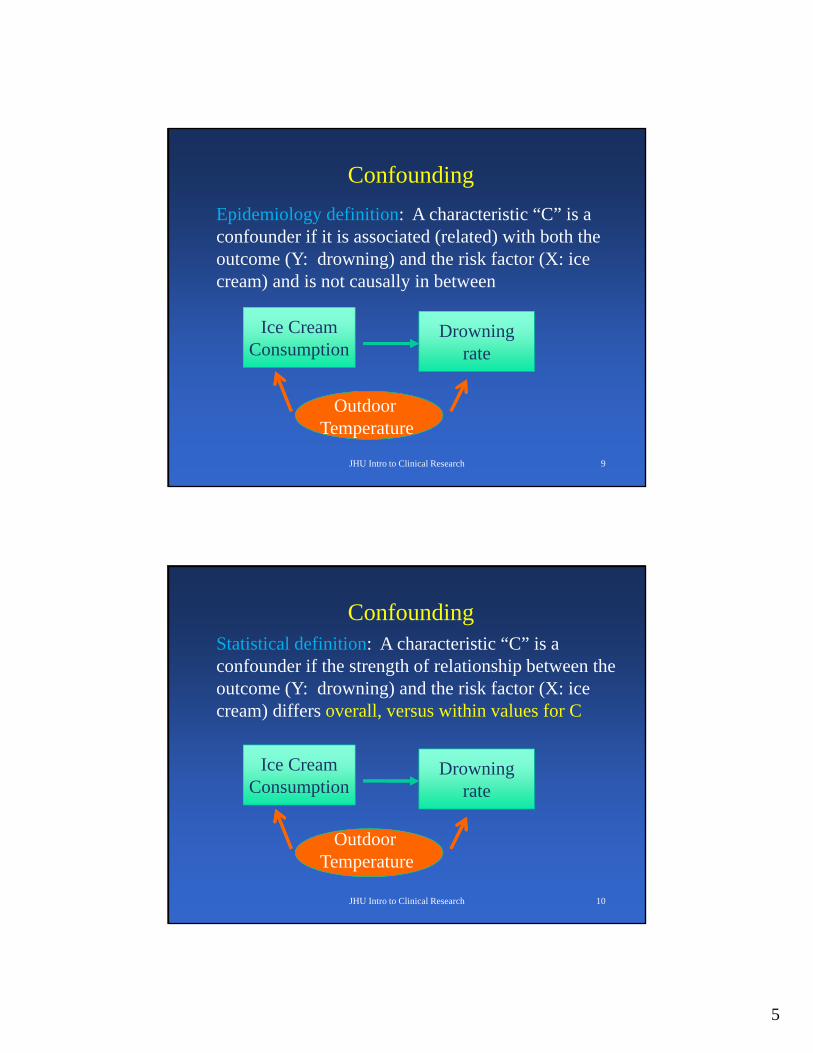
Confounding
Epidemiology definition: A characteristic “C” is a confounder if it is associated (related) with both the outcome (Y: drowning) and the risk factor (X: ice cream) and is not causally in between
Ice Cream Consumption
Drowning rate
??
5
JHU Intro to Clinical Research 9
Confounding
Epidemiology definition: A characteristic “C” is a confounder if it is associated (related) with both the outcome (Y: drowning) and the risk factor (X: ice cream) and is not causally in between
Ice Cream Consumption
Drowning rate
Outdoor Temperature
JHU Intro to Clinical Research 10
ConfoundingStatistical definition: A characteristic “C” is a confounder if the strength of relationship between the outcome (Y: drowning) and the risk factor (X: ice cream) differs overall, versus within values for C
Ice Cream Consumption
Drowning rate
Outdoor Temperature
6
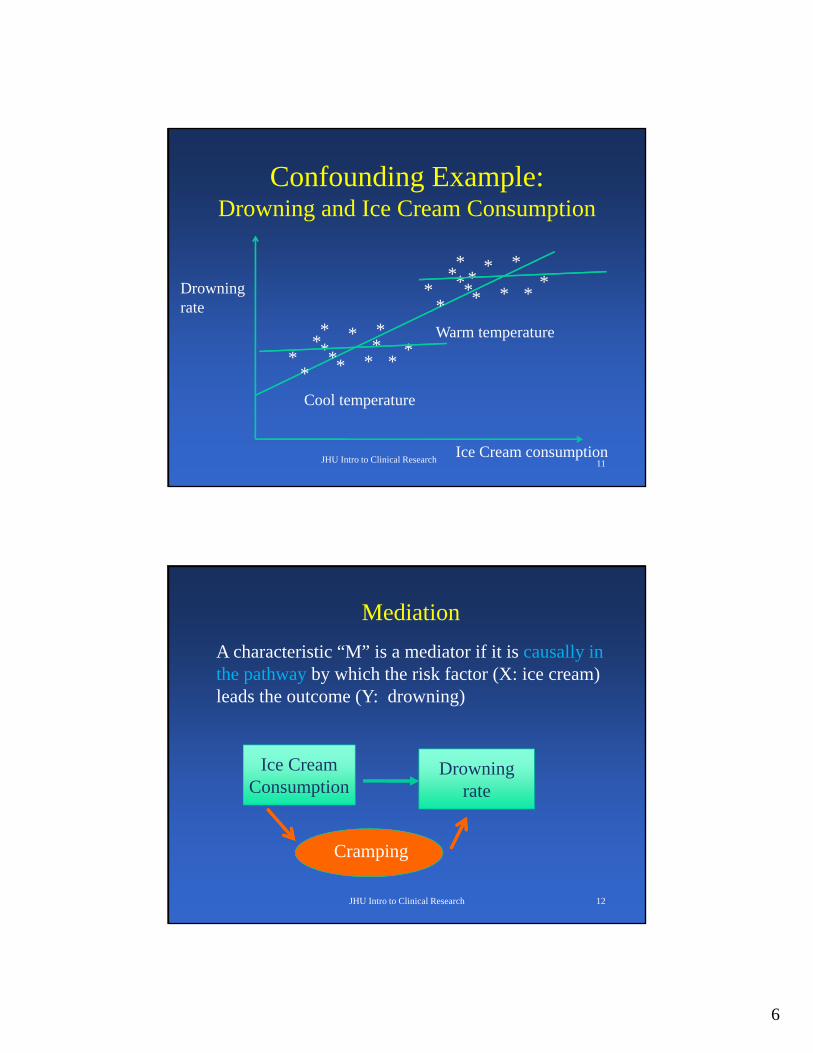
Confounding Example: Drowning and Ice Cream Consumption
JHU Intro to Clinical Research 11Ice Cream consumption
Drowning rate
*******
**
*
**
*
*******
**
*
**
*
Cool temperature
Warm temperature
JHU Intro to Clinical Research 12
Mediation
A characteristic “M” is a mediator if it is causally in the pathway by which the risk factor (X: ice cream) leads the outcome (Y: drowning)
Ice Cream Consumption
Drowning rate
Cramping
7
JHU Intro to Clinical Research 13
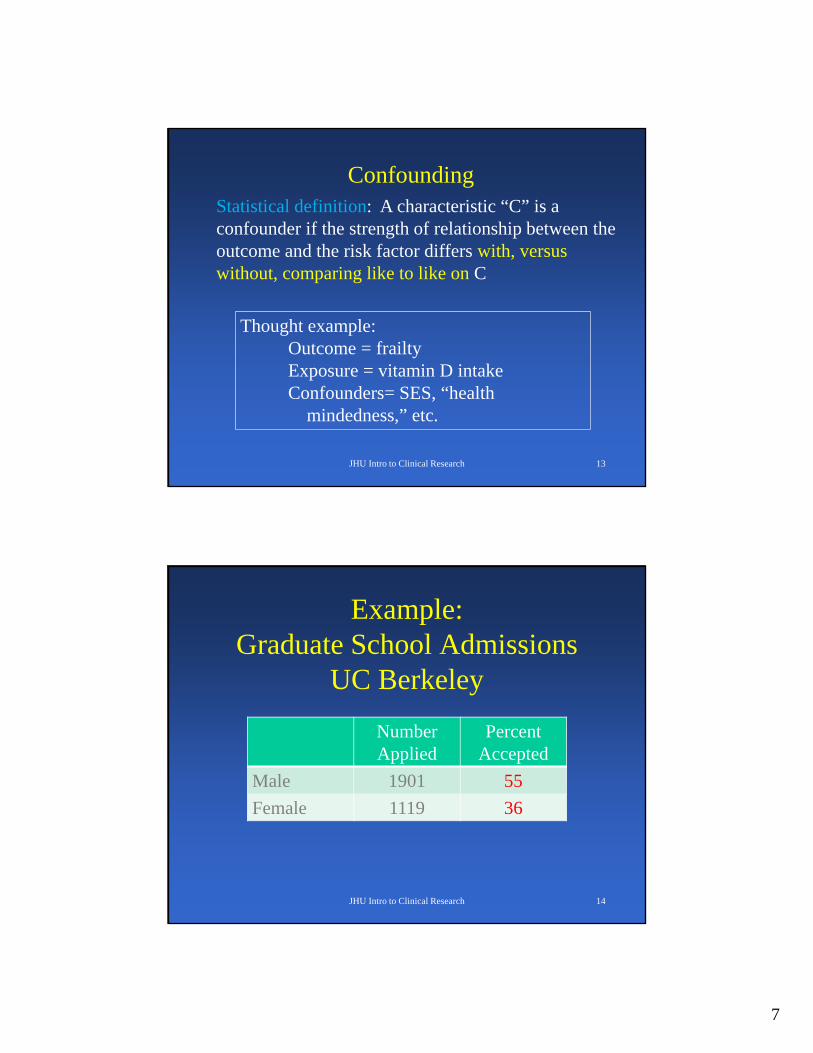
ConfoundingStatistical definition: A characteristic “C” is a confounder if the strength of relationship between the outcome and the risk factor differs with, versus without, comparing like to like on C
Thought example:Outcome = frailtyExposure = vitamin D intakeConfounders= SES, “health
mindedness,” etc.
Example: Graduate School Admissions
UC Berkeley
JHU Intro to Clinical Research 14
Number Applied
Percent Accepted
Male 1901 55
Female 1119 36
8
JHU Intro to Clinical Research 15
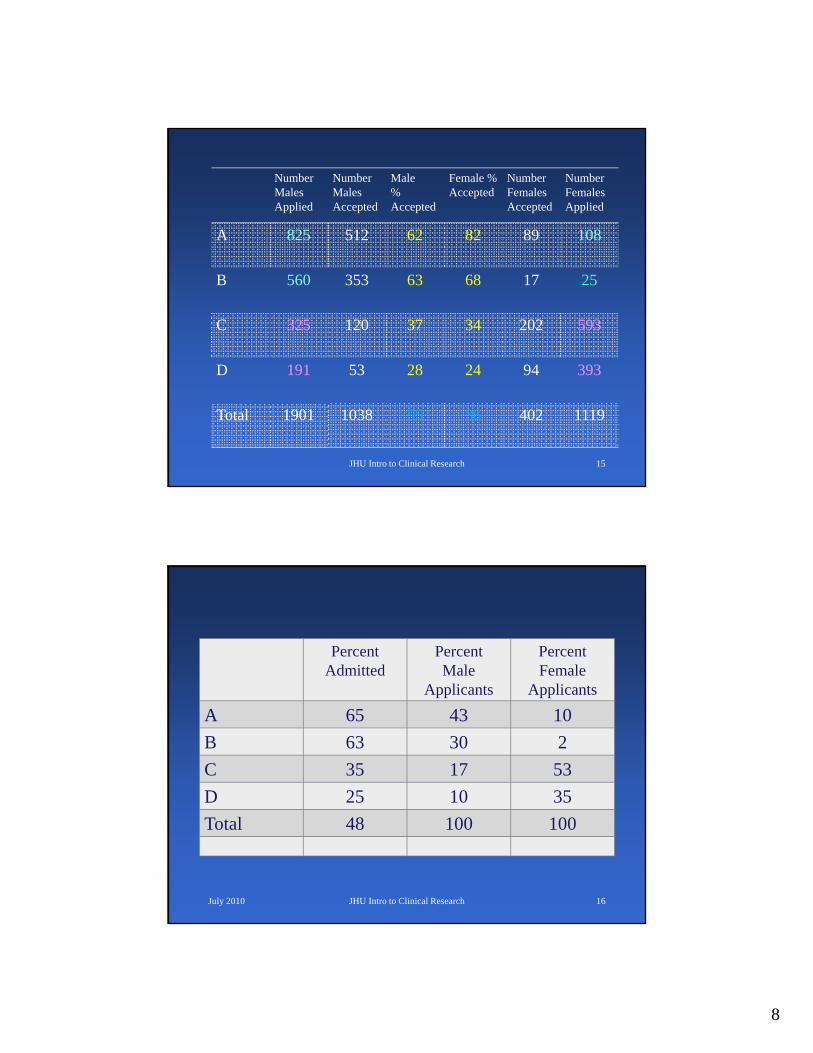
Number Males Applied
Number Males Accepted
Male % Accepted
Female % Accepted
Number Females Accepted
Number Females Applied
A 825 512 62 82 89 108
B 560 353 63 68 17 25
C 325 120 37 34 202 593
D 191 53 28 24 94 393
Total 1901 1038 55 36 402 1119
July 2010 JHU Intro to Clinical Research 16
Percent Admitted
Percent Male
Applicants
Percent Female
Applicants
A 65 43 10
B 63 30 2
C 35 17 53
D 25 10 35
Total 48 100 100
9
JHU Intro to Clinical Research 17
JHU Intro to Clinical Research 18
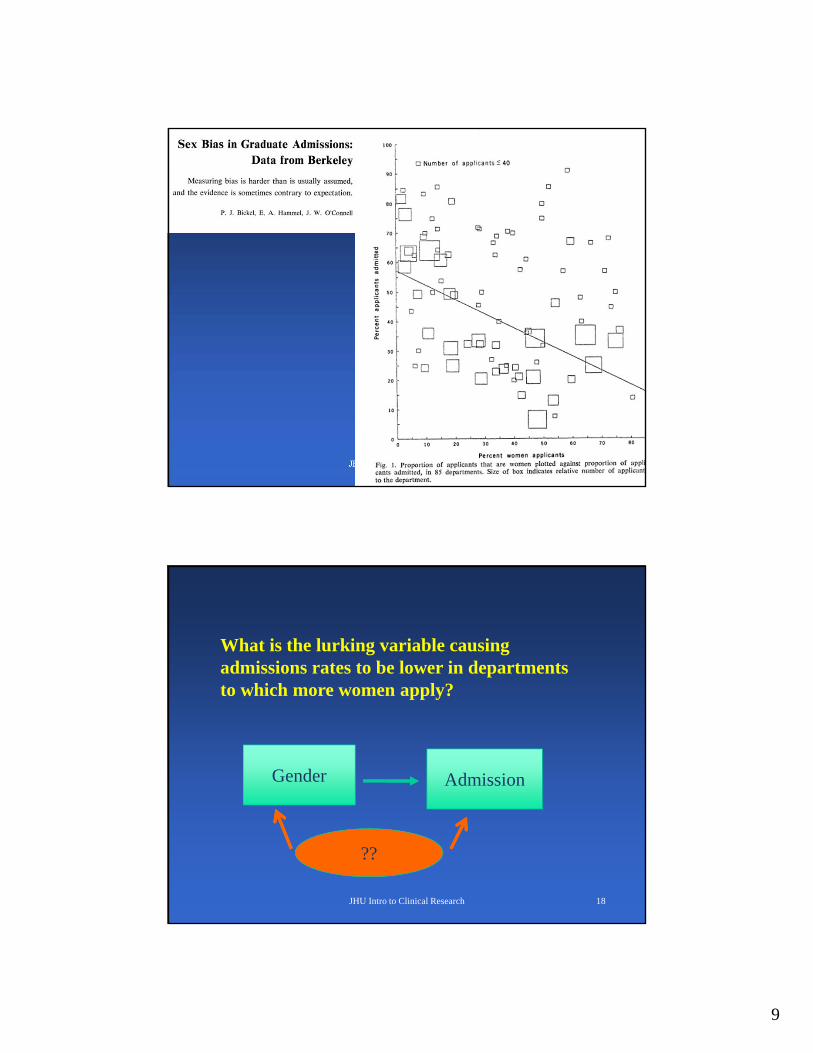
What is the lurking variable causing admissions rates to be lower in departments to which more women apply?
Gender Admission
??
10
JHU Intro to Clinical Research 19
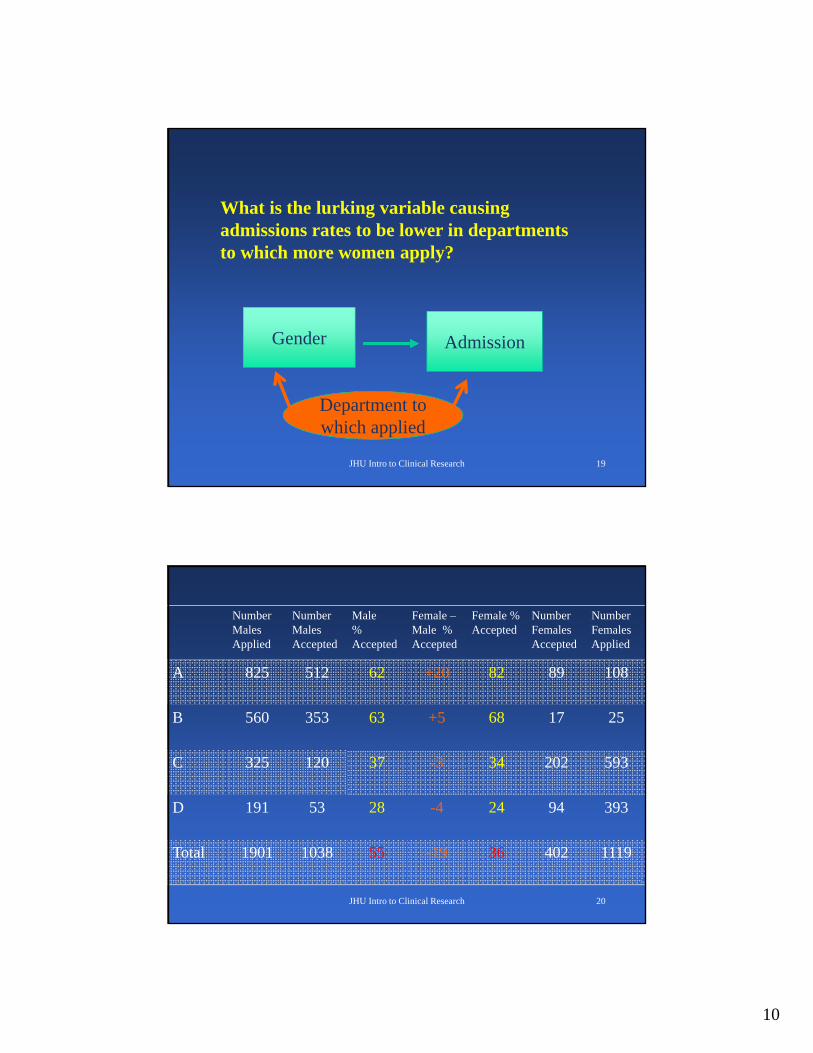
What is the lurking variable causing admissions rates to be lower in departments to which more women apply?
Gender Admission
Department to which appliedDepartment to which applied
JHU Intro to Clinical Research 20
Number Males Applied
Number Males Accepted
Male % Accepted
Female –Male % Accepted
Female % Accepted
Number Females Accepted
Number Females Applied
A 825 512 62 +20 82 89 108
B 560 353 63 +5 68 17 25
C 325 120 37 -3 34 202 593
D 191 53 28 -4 24 94 393
Total 1901 1038 55 -19 36 402 1119
11
July 2010 JHU Intro to Clinical Research 21
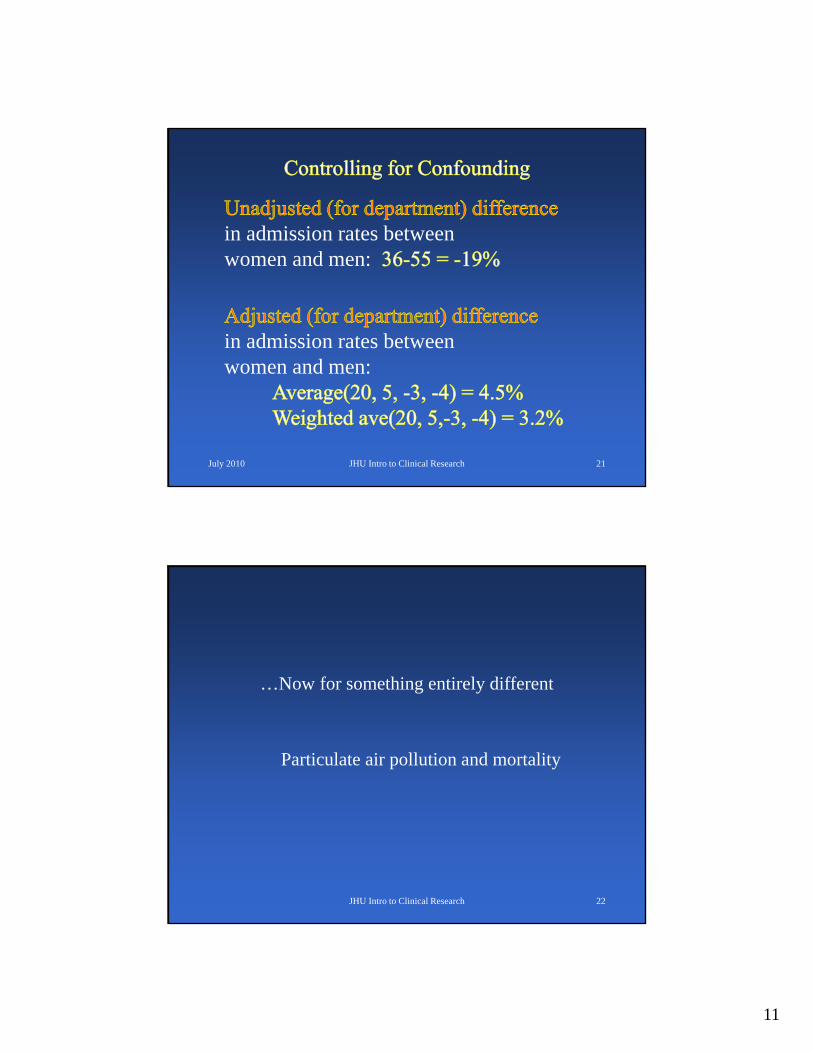
in admission rates between women and men:
in admission rates between women and men:
JHU Intro to Clinical Research 22
…Now for something entirely different
Particulate air pollution and mortality
12
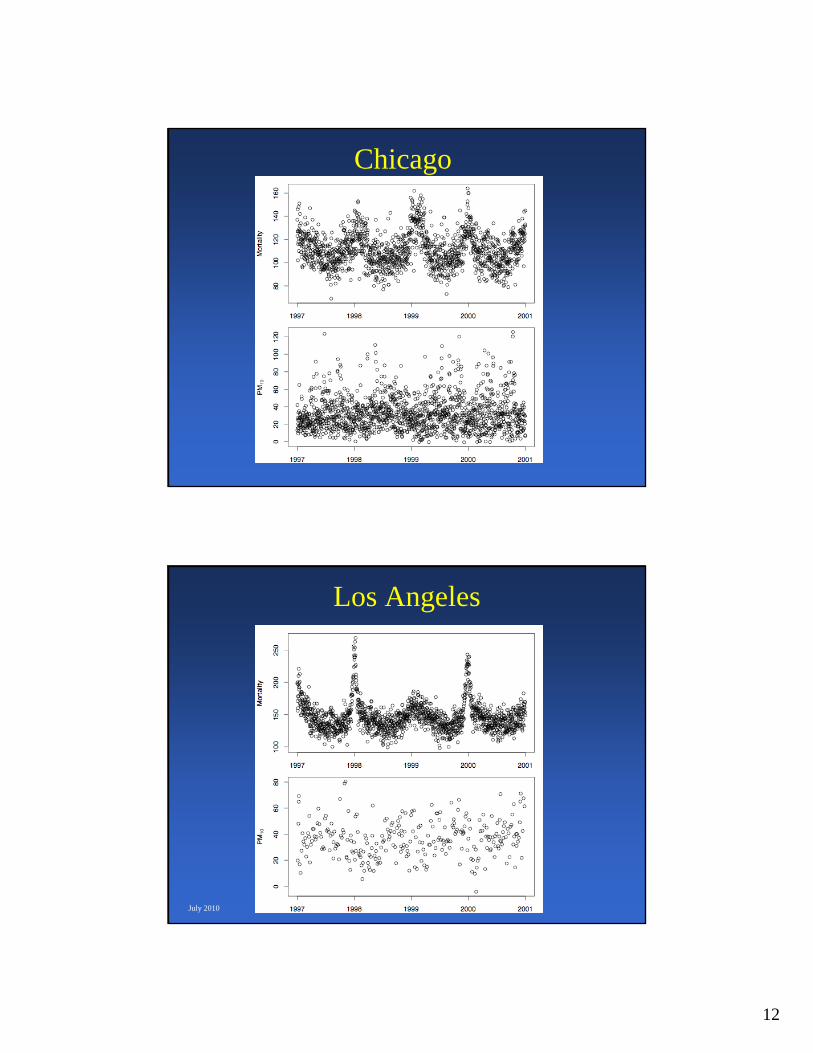
Chicago
Los Angeles
July 2010
13
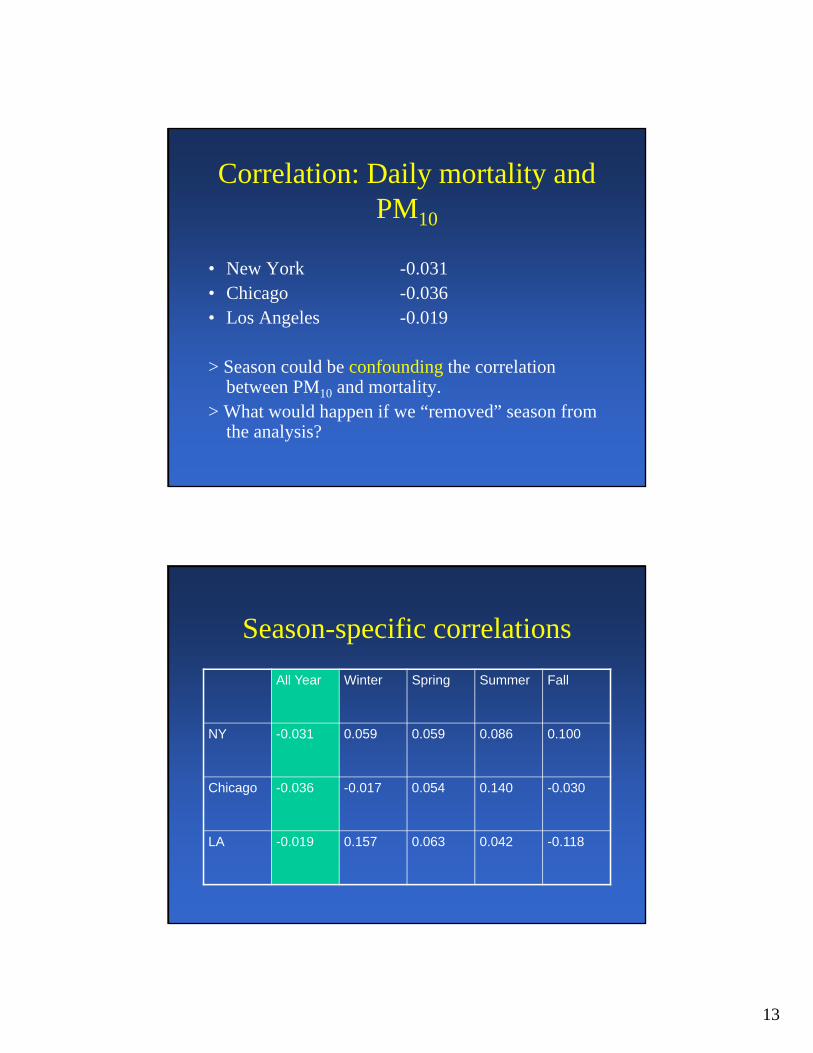
Correlation: Daily mortality and PM10
• New York -0.031• Chicago -0.036• Los Angeles -0.019
> Season could be confounding the correlation between PM10 and mortality.
> What would happen if we “removed” season from the analysis?
Season-specific correlations
All Year Winter Spring Summer Fall
NY -0.031 0.059 0.059 0.086 0.100
Chicago -0.036 -0.017 0.054 0.140 -0.030
LA -0.019 0.157 0.063 0.042 -0.118
14
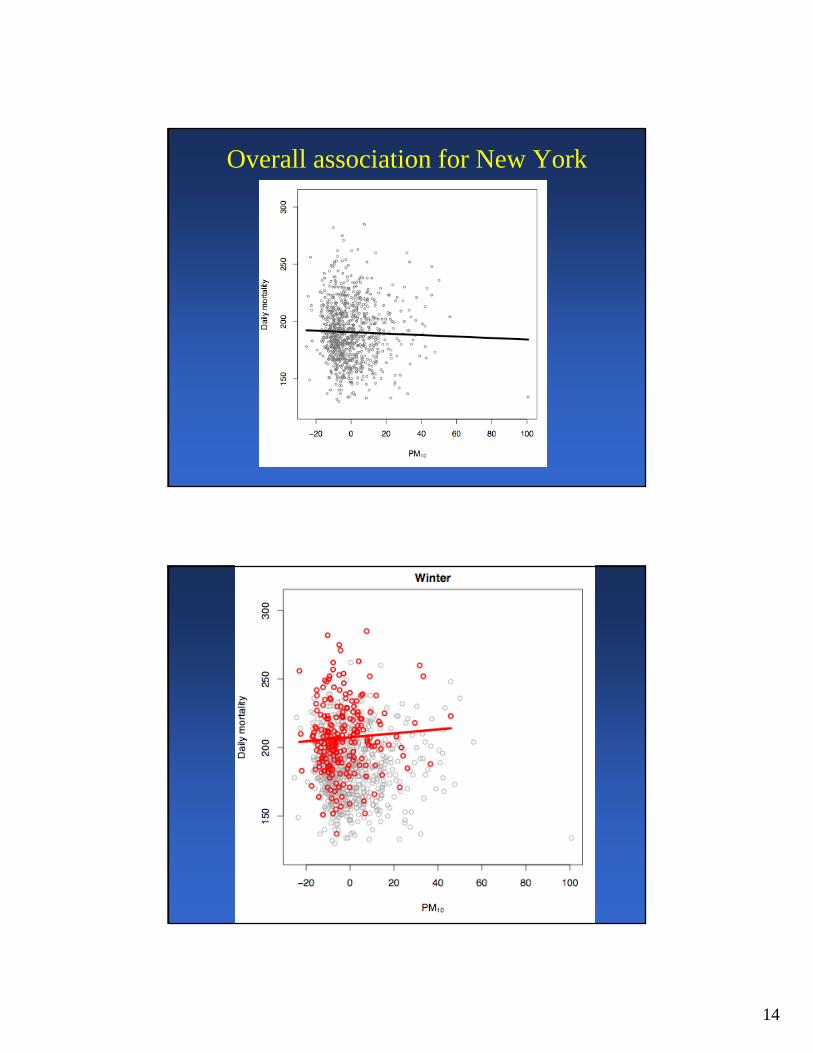
Overall association for New York
15
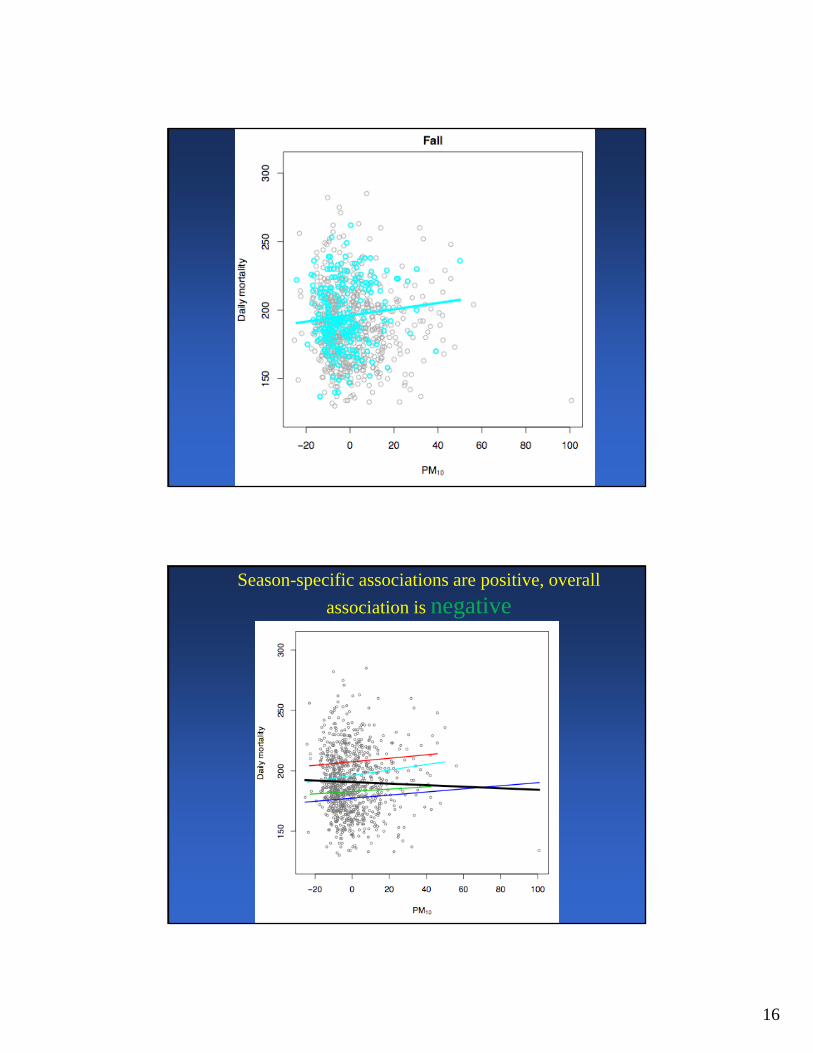
16
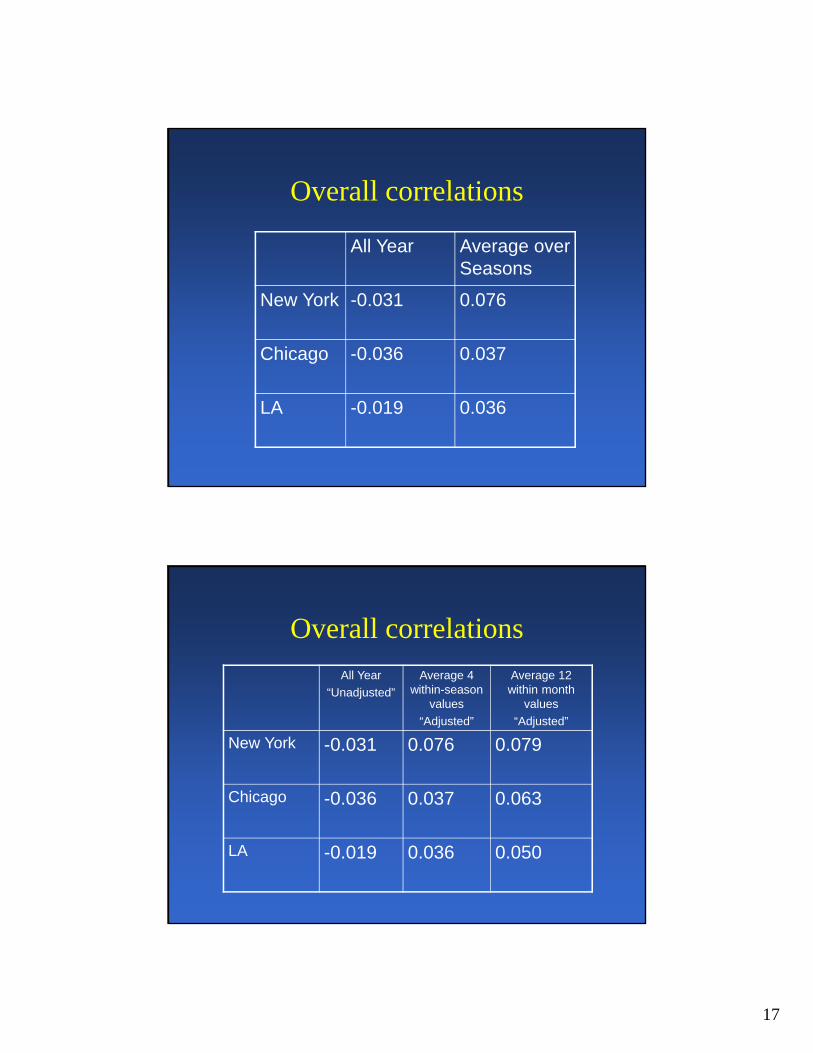
Season-specific associations are positive, overall
association is negative
17
Overall correlations
All Year Average over Seasons
New York -0.031 0.076
Chicago -0.036 0.037
LA -0.019 0.036
Overall correlations
All Year
“Unadjusted”
Average 4 within-season
values
“Adjusted”
Average 12 within month
values
“Adjusted”
New York -0.031 0.076 0.079
Chicago -0.036 0.037 0.063
LA -0.019 0.036 0.050
18
JHU Intro to Clinical Research 35
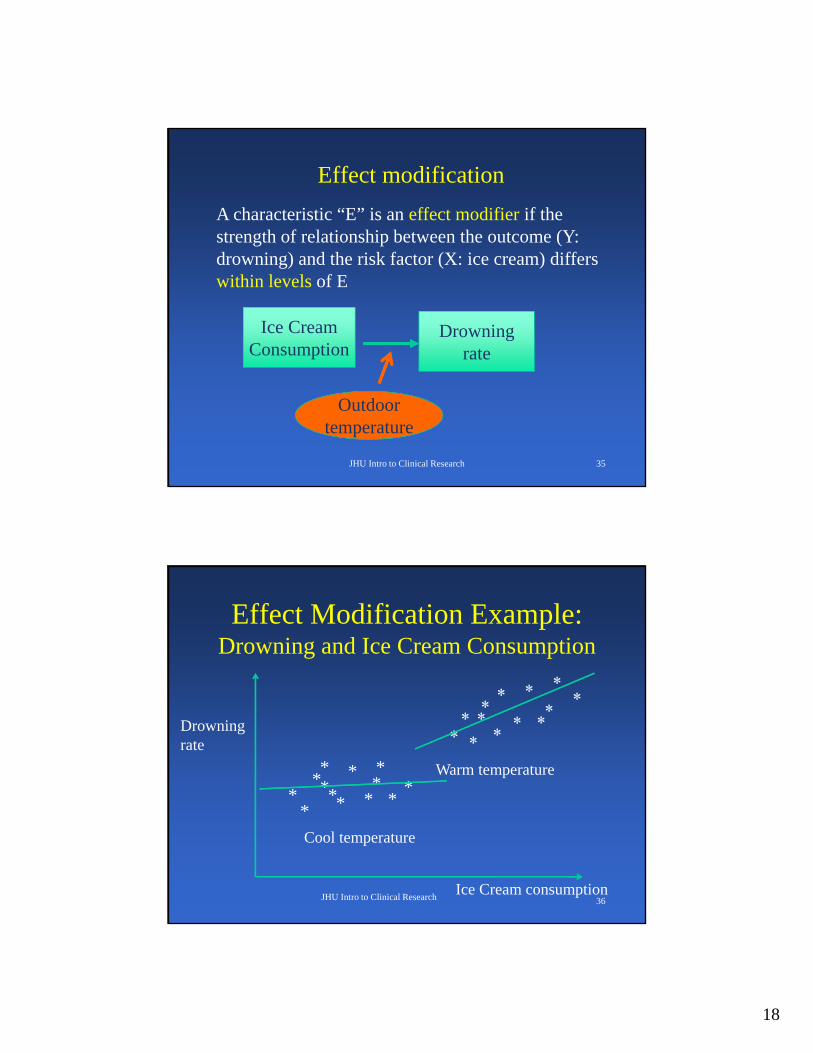
Effect modification
A characteristic “E” is an effect modifier if the strength of relationship between the outcome (Y: drowning) and the risk factor (X: ice cream) differs within levels of E
Ice Cream Consumption
Drowning rate
Outdoor temperature
Outdoor temperature
Effect Modification Example: Drowning and Ice Cream Consumption
JHU Intro to Clinical Research 36Ice Cream consumption
Drowning rate
*******
**
*
**
*
Cool temperature
Warm temperature
19
37
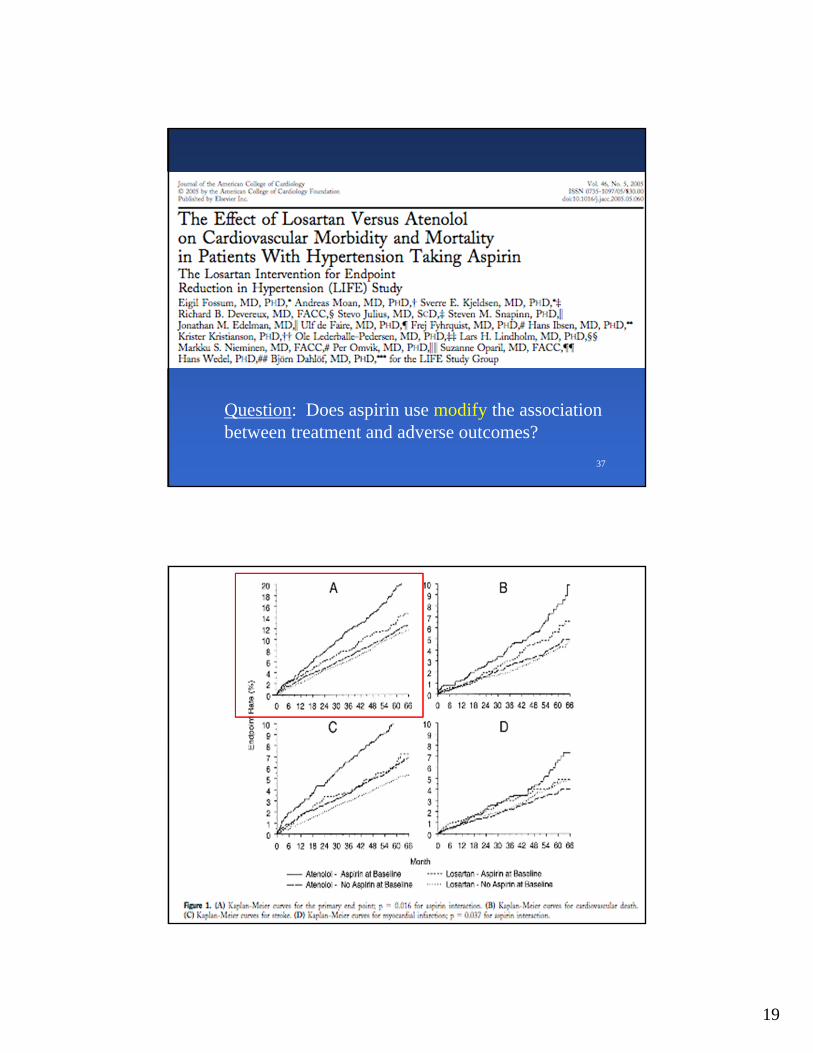
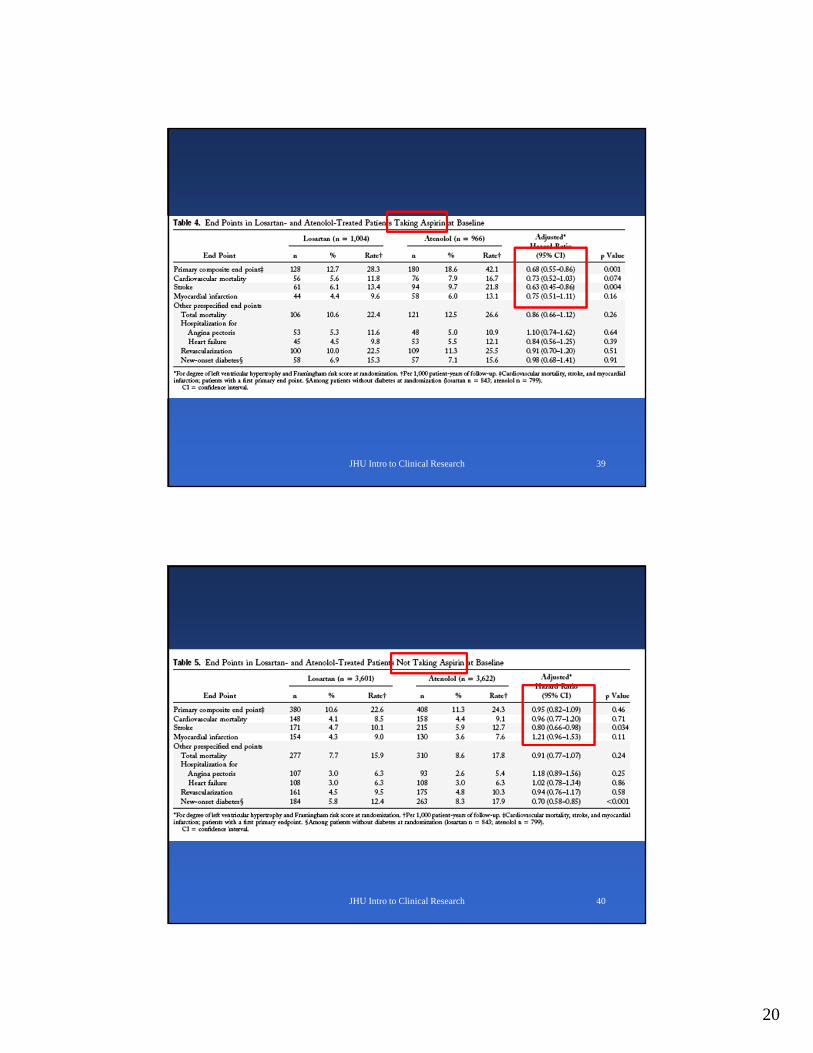
Question: Does aspirin use modify the associationbetween treatment and adverse outcomes?
July 2008 JHU Intro to Clinical Research 38
20
JHU Intro to Clinical Research 39
JHU Intro to Clinical Research 40
21
JHU Intro to Clinical Research 41
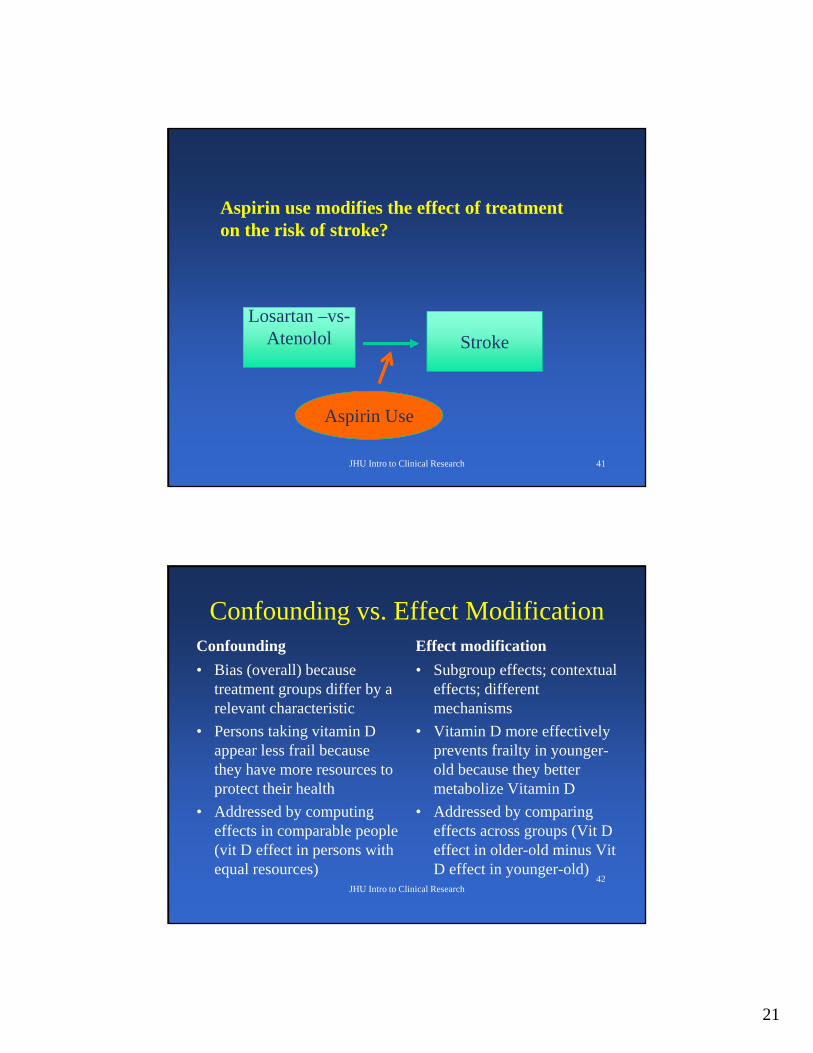
Aspirin use modifies the effect of treatment on the risk of stroke?
Losartan –vs-Atenolol Stroke
Aspirin Use
Confounding vs. Effect ModificationConfounding
• Bias (overall) because treatment groups differ by a relevant characteristic
• Persons taking vitamin D appear less frail because they have more resources to protect their health
• Addressed by computing effects in comparable people (vit D effect in persons with equal resources)
Effect modification
• Subgroup effects; contextual effects; different mechanisms
• Vitamin D more effectively prevents frailty in younger-old because they better metabolize Vitamin D
• Addressed by comparing effects across groups (Vit D effect in older-old minus VitD effect in younger-old)