132
| Date post: | 07-Feb-2018 |
| Category: |
Documents |
| Upload: | truongtruc |
| View: | 220 times |
| Download: | 1 times |


From Studentto (Un)Employed Professional
Findings from the first graduate surveyin Serbia, Bosnia and Herzegovina and Montenegro
within the Tempus project CONGRAD
October 2014

CONGRAD Consortium
Bielefeld University, Germany (Project Coordinator)
Charles University in Prague, Czech Republic
Universitat Politècnica de València, Spain
University of Jyväskylä, Finland
University of Belgrade, Serbia
University of Novi Sad, Serbia
University of Kragujevac, Serbia
Singidunum University, Serbia
Subotica Tech �– College of Applied Sciences, Serbia
School of Higher Technical Professional Education Ni�š, Serbia
Business Technical College U�žice, Serbia
Centre for Education Policy, Serbia
University of Montenegro, Montenegro
University of Banja Luka, Bosnia and Herzegovina
University of Tuzla, Bosnia and Herzegovina

This report was written and edited by the members of the CONGRAD Analytical Unit:
Predrag La�žeti , Centre for Education Policy, author and editorIvana �Živadinovi , Centre for Education Policy, author and editorIsidora Jari , University of Belgrade, Faculty of Philosophy, authorOgnjen Radonji , University of Belgrade, Faculty of Philosophy, author
CONGRAD Analytical Unit members in cooperation with the project coordinator carried out the editingand analysis of the data derived from the CONGRAD Graduate Survey and wrote this report jointly.
In addition special contributions were made by:Jana Nöller, report layout, quality control, review of translationDejan abrilo, online questionnaire developmentJulija Jeremi , cover designMirko Jakovljevi , translation of the report from Serbian into English
The higher education institutions participating in the CONGRAD Graduate Survey implementedproject related activities at the institutional level. The participating institutions provided significantcontributions to the questionnaire development in terms of structure and content. They wereresponsible for the contact data collection for the graduate populations in 2007 and 2012, sendinginvitations and reminders during the actual graduate survey and providing context information aboutthe institutions. Without their precious and crucial work and contributions in data collection, theanalysis presented in this report would not be possible. At the partner institutions the followingindividuals especially contributed to the project success:
University of Belgrade, Serbia:Ivanka Popovi (Institutional Coordinator), Dejana Lazi (Institutional Coordinator, Data Collection),Ana Jankovi Barovi (Executive Coordinator, Data Collection)
University of Novi Sad, Serbia:prof. dr Pavle Sekeru�š, doc. dr Bojan Jani i , Jasna Milo�ševi , Igor Leki
University of Kragujevac, Serbia:prof. dr �Živadin Bugar i (Vice Rector for Science and Research), Olivera Mijatovi (InstitutionalCoordinator), Predrag Vukomanovi (Data Collection), Milica Spasojevi (Data Collection), Ivana Bal�ši(Data Collection)
Singidunum University, Serbia:mr Mihajlo Babin (Institutional Coordinator), prof. dr Marija Kosti (Deputy Institutional Coordinator),prof. dr Verka Jovanovi (Coordinator of Tempus Projects at Singidunum University), prof. dr MilovanStani�ši (Rector)
Subotica Tech �– College of Applied Sciences, Serbia:Miklo�š Pot (College Teacher, Institutional Coordinator), Atila Na (IT specialist)
School of Higher Technical Professional Education Ni�š, Serbia:Boban Cvetanovi (Institutional Coordinator), Nenad Stojkovi (Deputy Institutional Coordinator),Goran Milosavljevi (Technical staff, contacting students), Irina Ceni (Student service, contactinggraduates), Anica Milo�ševi (Professor, contacting graduates)
Business Technical College U�žice, Serbia:Milovan Milivojevi (Institutional coordinator, Teacher), Ljubica Dikovi (Researcher, Teacher),Dragoljub Drndarevi (Researcher, Head of Mechanical Engineering Department), Ana oki(Graduates�’ data acquisition, Officer for students), Predrag Popovi (IT support, Databaseadministrator)
Centre for Education Policy, Serbia:Predrag La�žeti , Ivana �Živadinovi , Vitomir Jovanovi , Jasminka eki Markovi , Milica Grahovac, NinaGnje
University of Montenegro, Montenegro:Sa�ša Mili , PhD (Institutional Coordinator), Mitar Mi�šovi , PhD (Deputy Institutional Coordinator), Bo�žoKrstaji , PhD (Deputy Institutional Coordinator), Milo�š Mrdovi , MA (System Engineer)
University of Banja Luka, Bosnia and Herzgovina:prof. dr Dra�ško Marinkovi (Vice Rector, Institutional Coordinator), Jelena Ro�ži (Deputy InstitutionalCoordinator), doc. dr Goran Janji (Coordinator of Quality Assurance), mr Tatjana Mari (Coordinatordatabase), Ognjen Zec (Coordinator for Financial and Administrative Affairs)
University of Tuzla, Bosnia and Herzgovina:prof. dr Enver Halilovi (Rector), prof. dr Aida Crnki (Institutional Coordinator), Nihada DelibegoviD�žani , Alma Huremovi , Almir �Žigi
EU partners participating in the CONGRAD Project supported the implementation of the graduatesurvey, the data editing and analysis, as well as the production of this report with their expertise(names of institutions and individuals�’ titles are left in original that is used by institutions):
Bielefeld University, Germany (Project Coordinator):Martin Diewald (Project Coordinator, Professor of Sociology), Jana Nöller (Deputy Project Coordinator,Research Associate), Sebastian Sattler (Research Associate), Johanna Huesmann (Research Assistant)
Charles University in Prague, Czech Republic:Radim Ry�ška (Researcher), Martin Zelenka (Reseacher)
Universitat Politècnica de València, Spain:Andrea Conchado Peiró (Professor at the Department of Applied Statistics, Operational Research andQuality), Elena Vázquez Barrachina (Professor at the Department of Applied Statistics, OperationalResearch and Quality)
University of Jyväskylä, Finland:Maarit Virolainen (Researcher), Kari Nissinen (Researcher), Juhani Rautopuro (Researcher), TaruSiekkinen (Project Researcher), and Jussi Välimaa (Professor)
This report and the overall project success would not be possible without the crucial joint efforts of allproject partners.
Special gratitude of the project partners goes also to the administrative and financial staff at allpartner institutions, and the external experts involved in selected stages of the projectimplementation.
This project has been funded with support from the EuropeanCommission. This publication reflects the views only of the author,and the Commission cannot be held responsible for any use which maybe made of the information contained therein.
Tempus Project No.: 517153 TEMPUS 1 2011 1 DE TEMPUS JPGR

Content
1 CONGRAD Project Objectives and Purpose of the Report...................................1
2 Survey and Data................................................................................................2
3 Methodological Approach.................................................................................7
4 Evaluation of Study Programmes and Study Conditions.....................................9
4.1 Study Programme Quality and Study Conditions �– General Overview.........................9
4.2 Use of Different Modes of Teaching...........................................................................18
4.3 Satisfaction with Studies ............................................................................................22
4.4 Looking Back: Retrospective Evaluation of Studies ....................................................23
5 Career Patterns of Graduate Professionals ......................................................29
6 Situation right after Graduation ......................................................................38
6.1 Differences between Systems of Studies....................................................................44
7 First Significant Job .........................................................................................47
7.1 Strategies for Finding the First Significant Job............................................................51
7.2 Number of Contacted Employers and the Duration of Job Search.............................53
7.3 Type and Quality of the First Significant Job ..............................................................55
7.3.1 Relation between Studies and First Significant Job .......................................55
7.4 Quality of the First Significant Job ..............................................................................63
7.4.1 Type of Contract in the First Significant Job ..................................................63
7.4.2 Salary in the First Significant Job ...................................................................65
7.4.3 Utilisation of Acquired Knowledge and Skills in the First Significant Job.......68
8 Current Career and Work Status......................................................................71
8.1 Differences between Graduates according to Type of Institution and Degree Level .72
8.2 Differences in Current Work and Career Status Five Years after Graduationwith Regard to Fields of Study at Universities ............................................................73
8.3 Where Do Graduates Find Employment Five Years after Graduation ........................75
8.4 Quality of Graduate Jobs Five Years after Graduation ...............................................80
8.4.1 Type of Contract and Work Engagement ......................................................81
8.4.2 Salaries Five Years after Graduation..............................................................84
8.4.3 Utilisation of Knowledge and Skills Acquired During Studies and NecessaryQualifications.................................................................................................87
8.4.4 Job Satisfaction..............................................................................................89
9 Job Requirements and Acquired Competences ................................................91
9.1 Level of Acquired and Required Competences...........................................................92
9.2 Job Requirements in Different Economic Activity Branches.......................................94
9.3 Competence Gap........................................................................................................97
10 Instead of a Conclusion .................................................................................103
11 References....................................................................................................104
12 Abbreviations ...............................................................................................105
13 Annex 1: Classification of Occupations ..........................................................106
14 Annex 2: Classification of Economic Activities ...............................................111
15 Annex 3: International Standard Classification of Education (ISCED) ..............114

Tables
Table 1: Number of respondents, number of contacted graduates and response ratesaccording to type of institution/country by cohort (2007 and 2012 cohort) ............3
Table 2: Number of respondents according to type of institution/countryby field of study (2007 and 2012 cohort) ..................................................................5
Table 3: Number of respondents according to type of institution/countryby degree level (2007 and 2012 cohort)....................................................................6
Table 4: Dimensions of study conditions for different respondent categories .....................13Table 5: Dimensions of study conditions for different respondent categories .....................17Table 6: Modes of teaching by type of institution/country
(universities and polytechnics, 2007 and 2012 cohort combined)..........................21Table 7: Satisfaction with the completed study programme according to type of
institution/country ..................................................................................................22Table 8: Extent to which the job right after graduation was related to the field of study
by field of study (5 point scale, universities, 2007 and 2012 cohort)......................44Table 9: First significant job �– Average number of contacted employers by type of
institution/country (universities and polytechnics, 2007 and 2012 cohortcombined) ...............................................................................................................54
Table 10: First significant job �– Average duration of job search by type ofinstitution/country (universities and polytechnics, 2007 and 2012 cohort) ...........54
Table 11: First significant job �– Average duration of job search in monthsby field of study (universities, 2007 and 2012 cohort) ............................................55
Table 12: First significant job �– Average net salary in EUR(universities and polytechnics, 2007 and 2012 cohort combined)..........................66
Table 13: First significant job �– Average net salary in EUR by field of study(universities, 2007 and 2012 cohort).......................................................................68
Table 14: Variance in the level of required generic competencesby economic activity branches ................................................................................94
Table 15: Competence requirements by economic activity branches ....................................96Table 16: Average deficit of competences among graduates of different fields of study
at universities ........................................................................................................100

Figures
Figure 1: Assessment of elements of study programmes and study conditions(5 point scale, universities and polytechnics, 2007 and 2012 cohort)............10
Figure 2: Assessment of elements of study programmes and study conditions bysystem of studies (universities and polytechnics, 2007 and 2012 cohort) .....12
Figure 3: Assessment of elements of study programmes and study conditions(5 point scale, in %) ........................................................................................15
Figure 4: Assessment of different modes of teaching (5 point scale, in %)...................18Figure 5: Lecture as a mode of teaching
in comparison with HEGESCO and REFLEX countries (in %)............................20Figure 6: Satisfaction with the completed study programme (10 point scale, in %) .....22Figure 7: Satisfaction with the completed study programme by system of studies
(10 point scale, in %) ......................................................................................23Figure 8: Answers of graduates regarding the retroactive decision about study
programme and faculty/polytechnic (in %) ....................................................24Figure 9: Answers of graduates regarding the retroactive decision about study
programme and faculty/polytechnic according to type of institution/country(in %)...............................................................................................................24
Figure 10: Reasons for choosing a different faculty/polytechnic (in %) ..........................25Figure 11: Reasons for choosing a different study programme (in %).............................25Figure 12: Reasons for choosing a different faculty/polytechnic by graduate cohort
(in %)...............................................................................................................26Figure 13: Reasons for choosing a different study programme by graduate cohort
(in %)...............................................................................................................26Figure 14: Graduate career patterns
(universities and polytechnics, 2007 and 2012 cohort) ..................................30Figure 15: Graduate career patterns by system of studies First cycle degree
(universities and polytechnics , 2007 and 2012 cohort combined, in %)........32Figure 16: Graduates�’ career patterns by system of studies �– Second cycle degree
(universities and polytechnics, 2007 and 2012 cohort combined, in %) ........32Figure 17: Graduate career patterns by field of study (universities, 2007 cohort, in %) .33Figure 18: Graduate career patterns by field of study (universities, 2012 cohort, in %) .34Figure 19: Average number of employers by graduate career pattern
(universities and polytechnics, 2007 and 2012 cohort, in %) .........................35Figure 20: Average duration of unemployment period(s) and active job search
in months by graduate career pattern(universities and polytechnics, 2007 and 2012 cohort combined) .................36
Figure 21: Situation right after graduation(universities and polytechnics, 2007 and 2012 cohort combined, in %) ........38
Figure 22: Situation right after graduation by fields of study(universities, 2007 and 2012 cohort combined, in %) ....................................39

Figure 23: Graduates continuing the same job as before graduation orstarting a new job right after graduation(universities and polytechnics, 2007 and 2012 cohort combined, in %) ........40
Figure 24: Graduates continuing the same job as before graduationor starting a new job right after graduation by fields of study(universities, 2007 and 2012 cohort combined, in %) ....................................41
Figure 25: Extent to which the job right after graduation was related tothe field of study (5 point scale, universities and polytechnics,2007 and 2012 cohort combined, in %)..........................................................42
Figure 26: Extent to which the job right after graduation was related tothe field of study by field of study (5 point scale, universities,2007 and 2012 cohort, in %)...........................................................................43
Figure 27: Situation right after graduation �– First cycle degree according tothe Bologna system of studies(universities and polytechnics, 2007 and 2012 cohort combined, in %) ........45
Figure 28: Situation right after graduation �– First cycle degree according tothe old system of studies(universities and polytechnics, 2007 and 2012 cohort combined, in %) ........46
Figure 29: Situation right after graduation �– Second cycle degree according toold and Bologna systems of studies(universities and polytechnics, 2007 and 2012 cohort combined in %) .........46
Figure 30: Graduates�’ success in finding first significant job(universities and polytechnics, cohort 2007, in %) .........................................47
Figure 31: Graduates�’ success in finding first significant job(universities and polytechnics, 2012 cohort)..................................................48
Figure 32: Graduates�’ success in finding first significant jobby type of institution/country (2007 cohort, in %) .........................................49
Figure 33: Graduates�’ success in finding first significant jobby type of institution/country (2012 cohort, in %) .........................................49
Figure 34: Graduates�’ success in finding first significant jobby field of study (universities, 2007 and 2012 cohort combined, in %)..........50
Figure 35: Strategies used for finding first significant jobby type of institution/country (2007 and 2012 cohort combined, in %) ........52
Figure 36: Strategies used for finding first significant jobby field of study (universities, 2007 and 2012 cohort combined, in %)..........53
Figure 37: xtent to which the first significant job was related to the field of studyby field of study (5 point scale, universities,2007 and 2012 cohort combined, in %)..........................................................56
Figure 38: First significant job �– Sector(universities and polytechnics, 2007 and 2012 cohort combined, in %) ........57
Figure 39: First significant job �– Sector by field of study(universities, 2007 and 2012 cohort combined, in %) ....................................58
Figure 40: First significant job �– Branches of economic activities(universities and polytechnics, 2007 and 2012 cohorts combined, in %) .......59

Figure 41: First significant job �– Branches of economic activities by field of study(universities, 2007 and 2012 cohort combined, in %) ....................................60
Figure 42: First significant job �– Occupations (universities and polytechnics,2007 and 2012 cohort combined, in %)..........................................................61
Figure 43: First significant job �– Occupations by field of study(universities, 2007 and 2012 cohort combined, in %) ....................................62
Figure 44: First significant job �– Duration of the working contract(universities and polytechnics, 2007 and 2012 cohort combined, in %) ........63
Figure 45: First significant job �– Type of contract(universities and polytechnics, 2007 and 2012 cohort combined, in %) ........64
Figure 46: First significant job �– Duration of the contract by field of study(universities and polytechnics, 2007 and 2012 cohort combined, in %) ........65
Figure 47: First significant job �– Average net salary in EUR(universities and polytechnics, 2007 and 2012 cohort combined) .................66
Figure 48: First significant job �– Average net salary in EUR by field of study(universities, 2007 and 2012 cohort combined) .............................................67
Figure 49: Extent to which knowledge and skills acquired during studieswere required in first significant job, by field of study(5 point scale, universities, 2007 and 2012 cohorts combined, in %) ............69
Figure 50: Current job and career status(universities and polytechnics, 2007 and 2012 cohorts) ................................71
Figure 51: Current job and career status five years after graduation(universities and polytechnics, 2007 cohort, in %) .........................................73
Figure 52: Current job and career status five years after graduationby field of study (universities, 2007 cohort, in %)...........................................74
Figure 53: Current job five years after graduation �– Sector(universities and polytechnics, 2007 cohort, in %) .........................................75
Figure 54: Current job five years after graduation �– Sector by field of study(universities, 2007 cohort, in %) .....................................................................76
Figure 55: Current job five years after graduation �– Branches of economic activities(universities and polytechnics, 2007 cohort, in %) .........................................77
Figure 56: Current job five years after graduation �– Branches of economic activitiesby field of study (universities, 2007 cohort, in %)...........................................78
Figure 57: Current job five years after graduation �– Occupations(universities and polytechnics, 2007 cohort, in %) .........................................79
Figure 58: Current job five years after graduation �– Occupationsby field of study (universities, 2007 cohort, in %)...........................................80
Figure 59: Current job five years after graduation �– Type of contractby field of study (universities, 2007 cohort, in %)...........................................82
Figure 60: Current job five years after graduation �– Type of contractby branches of economic activities(universities and polytechnics, 2007 cohort, in %) .........................................83
Figure 61: Current job five years after graduation �– Working hoursby branches of economic activities(universities and polytechnics, 2007 cohort, in %) .........................................84

Figure 62: Current job five years after graduation �– Net salary in EURby branches of economic activities(universities and polytechnics, 2007 cohort)..................................................86
Figure 63: Current job five years after graduation �– Net salary in EURby field of study (universities, 2007 cohort) ...................................................87
Figure 64: Current job five years after graduation �– Required level of educationalqualifications by type of institution/country (universities and polytechnics, 2007 cohort, in %) ..........................................88
Figure 65: Current job five years after graduation �– Utilisation of knowledge and skillsacquired during studies in jobs requiring higher education qualificationby field of study (universities, 2007 cohort, in %)...........................................89
Figure 66: urrent job five years after graduation �– Average job satisfactionby branchers of economic activities(universities and polytechnics, 2007 cohort)..................................................90
Figure 67: The level of acquired and required generic competences..............................93Figure 68: Competence gap with regard to job requirements ........................................98Figure 69: Differences in the deficit of generic competences by system of studies......102


1CONGRAD Project Objectives and Purpose of the Report
1 CONGRAD Project Objectives and Purpose of the ReportThis report was created within the CONGRAD project �– Conducting graduate surveys andimproving alumni services for enhanced strategic management and quality improvement �–financed with support of the EU Tempus programme. CONGRAD unites fourteen highereducation institutions and one independent research institute from seven countries. Themembers of the CONGRAD Consortium are four universities in Serbia (University of Belgrade,University of Novi Sad, University of Kragujevac and Singidunum University), three polytechnicsin Serbia (polytechnics in U�žice, Ni�š and Subotica), University of Montenegro, two universitiesfrom Bosnia and Herzegovina (University of Banja Luka and University of Tuzla) and fouruniversity partners from EU countries: Bielefeld University (Germany), Charles University inPrague (Czech Republic), Universitat Politècnica de València (Spain), University of Jyväskylä(Finland). The coordinator of the project is Bielefeld University, Germany.
CONGRAD aimed at creating a starting point to enable higher education institutions (HEIs) inSerbia, Montenegro and Bosnia and Herzegovina to continuously and systematically collectinformation on graduates and conduct graduate surveys for the purpose of enhancing studyprogrammes and facilitating modernisation of teaching processes and organisation of studyprogrammes. In addition, CONGRAD was expected to contribute to the improvement ofinstitutional self evaluation processes by collecting systematic and reliable information on thelinks between study programmes and subsequent employment of graduates, as well as enablethe evidence based evaluation of higher education reforms. Taking into account previous studyconditions and the graduates�’ professional careers, CONGRAD aimed at providing a generalinsight in country specific conditions of the transition from higher education to the labourmarket in each of the partner countries, thus enabling partner country HEIs to define andimplement evidence based strategic decisions.
This report represents the general descriptive survey report, offering an overview of results forthe key topics covered by the survey. The report offers basic descriptive analyses intended forthe broad public interested in higher education in the region and its relation to the labourmarket. Additional and more complex analysis based on the rich and reliable source ofinformation such as the CONGRAD survey results shall be the subject of further scientificpublications.
Professional support in the realisation of the survey was provided to the HEIs by the analyticalunit of CONGRAD project, consisting of researchers of the Centre for Education Policy PredragLa�žeti and Ivana �Živadinovi , and teaching staff of the Department of Sociology, Faculty ofPhilosophy, University of Belgrade, Isidora Jari and Ognjen Radonji , and the Deputy ProjectCoordinator Jana Nöller of Bielefeld University. Members of the CONGRAD analytical unittogether with the Deputy Project Coordinator developed this and other reports available on theofficial website of the CONGRAD project, www.congrad.org.

2 Survey and Data
2 Survey and DataThe graduate survey was conducted in Serbia, Bosnia and Herzegovina, and Montenegro in theperiod between March and July 2013. The survey included all graduates who completed theirstudies in calendar year 2007 and calendar year 2012, at the following institutions: University ofKragujevac, University of Montenegro, University of Tuzla and polytechnics in Ni�š and Subotica.In the case of University of Belgrade1, University of Novi Sad2, University of Banja Luka and thepolytechnic in U�žice, all graduates who completed their studies during the academic years2006/07 and 2011/123 were included in the survey. The target group and their contactinformation were identified based on the administrative data provided by the respective studentservice offices. The contact data was updated during year 2012 to the extent possible, and thefinal graduate contact data list included 16,123 graduates of the 2007 cohort and 26,117graduates of the 2012 cohort (Table 1). The survey targeted graduates of undergraduate andpostgraduate studies.
The survey was conducted via an online questionnaire consisting of a total of 125 questionscovering the following topics: socio biographic background, education prior to studies, highereducation, course of studies, study conditions and competences, situation after graduation, firstsignificant job, current job, professional orientation and satisfaction, as well as a section relatedto the respondents�’ comments and recommendations. Respondents accessed the questionnaireby entering an individual PIN code, which they received with the invitation letter that was sentvia e mail or by postal mail to their home addresses. During the fieldwork period from March toJuly 2013, after the initial contact, up to three more reminders were sent to graduates who didnot complete the questionnaire upon earlier contacts. The total response rate for the 2007cohort was 30% and 36% for the 2012 cohort. For both cohorts the response rate was 34%4,which can be considered a satisfactory result for this kind of survey, as the response rate issimilar to those obtained in other graduate surveys conducted across Europe (e.g. REFLEX orHEGESCO5 projects).
1 19 out of 31 faculties at the University of Belgrade participated in the survey.2 11 out of 14 faculties at the University of Novi Sad participated in the survey.3 Hereafter only 2007 and 2012 will be used to make reference to the cohorts of respondents.4 For analytical reasons, the completed questionnaire implies that respondents answered on the first mandatory question inthe questionnaire (labelled as F2) in which they were asked whether they were ever employed after graduation.5 For an overview of response rates obtained in other graduate surveys, see Allen, Pavlin & Van der Velden (2011).

3Survey and Data
Table 1: Number of respondents, number of contacted graduates and response rates according totype of institution/country by cohort (2007 and 2012 cohort)
2007
2012
Total
2007
2012
Total
2007
2012
Total
Universityof
Belgrade
1.811
2.900
4.711
5.807
7.124
12.931
31%
41%
36%
Universityof
NoviSad
1.095
2.240
3.335
3.885
6.318
10.203
28%
35%
33%
Universityof
Kragujevac
290
696
986
1.557
2.539
4.096
19%
27%
24%
Singidun
umUn
iversity
154
519
673
403
1.633
2.036
38%
32%
33%
Universityof
BanjaLuka
396
824
1.220
966
1.910
2.876
41%
43%
42%
Universityof
Tutla
330
388
718
984
1.898
2.882
34%
20%
25%
Universityof
Mon
tene
gro
597
1.381
1.978
2.134
4.046
6.180
28%
34%
32%
Higher
Busine
ssTechnicalSchoo
l,U�žice
31116
147
84232
316
37%
50%
47%
Scho
olof
Higher
TechnicalProfessionalEdu
catio
n,Ni�š
62148
210
172
294
466
36%
50%
45%
Subo
ticaTech
�–Co
llege
ofAp
pliedSciences,Sub
otica
8391
174
131
123
254
63%
74%
69%
Totalfor
allinstitutions
4.849
9.303
14.152
16.123
26.117
42.240
30%
36%
34%
Completed
thequ
estio
nnaire
Contactedgraduates
Respon
serate

4 Survey and Data
Differences in the response rates across institutions are mostly caused by different degrees towhich the graduates�’ contact data was updated and the general availability of contactinformation at various institutions and faculties.
Most graduates belonging to the target population could be contacted: An assessment on thebasis of institutional data obtained from HEIs shows that more than 85% of graduates of the2007 cohort and more than 95% of graduates of the 2012 cohort were contacted. Despite theefforts to acquire precise information on the graduate population of both cohorts, including dataon gender, age, type of financing, disciplinary affiliation of all respondents6 in order to identifythe characteristics of the population, it was not possible to precisely define the populationaccording to all listed criteria. Consequently, weighting was not possible. Nevertheless, thesample size, i.e. the large number of respondents who completed the questionnaire, incombination with the high response rate confirms the reliability of data obtained by theCONGRAD graduate survey.
The following tables show the number of respondents according to type of institution/countrydifferentiated by field of study and level of degree for the 2007 and 2012 cohorts (see Table 2and Table 3).
6 Personal information about the respondents (name and surname, contact information etc.) were available only to the HEIs,whereas other information required to characterise the population and to analyse the sample were gathered separatelyusing a code that could not be linked to the respondents�’ personal information.

5Survey and Data
Table 2: Number of respondents according to type of institution/country by field of study (2007 and2012 cohort)
Universities
Serbia
Universities
Bosniaand
Herzegovina
Universities
Mon
tene
gro
Polytechnics
Serbia
Total
Universities
Serbia
Universities
Bosniaand
Herzegovina
Universities
Mon
tene
gro
Polytechnics
Serbia
Toatal
Teache
rtraininganded
ucationscience
282
9779
0458
334
192
790
605
Arts
1419
100
4379
4339
0161
Humanities
237
7821
0336
632
143
122
0897
Socialandbe
haviou
ralscien
ce271
74190
0535
433
147
330
0910
Journalismandinform
ation
3537
110
8375
3839
0152
Busine
ssandadministration
693
065
14772
1.478
0211
541.743
Law
217
3521
0273
272
81108
0461
Life
sciences
7120
140
105
148
3017
0195
Physicalsciences
5045
80
103
148
429
0199
Mathe
matics
259
120
4627
1910
056
Compu
ting
161
568
20254
332
586
92515
Engine
ering
331
2151
99502
815
4699
751.035
Manufacturin
g113
440
9166
147
381
0186
Archite
ctureandbu
ilding
215
5114
30310
408
6272
72614
Agriculture,forestryandfishe
ry154
380
0192
190
7841
10319
Veterin
ary
430
00
4363
00
063
Health
280
539
0342
379
6840
0487
Person
alservices
(hotel,catering,securityservices,transpo
rt)
182
04
2439
2313
1489
Environm
entalprotection
180
00
1869
212
26109
Securityservices
35
011
193
50
1119
Other
231
160
4083
639
0128
Total
3.251
629
589
176
4.645
6.154
1.068
1.367
354
8.943
*n<30
2007
2012

6 Survey and Data
Table 3: Number of respondents according to type of institution/country by degree level (2007 and2012 cohort)
In the following part of the report, the results are differentiated in four subgroups according totype of institution and country in order specify the differences between types of institution(universities and polytechnics) and differences between the three countries (Serbia, Bosnia andHerzegovina, and Montenegro) included in the survey. The four subgroups are as follows:
1. Universities Serbia2. Universities �– Bosnia and Herzegovina3. Universities Montenegro4. Polytechnics Serbia
The report also provides information differentiated by field of study, i.e. study programmes thatthe respondents completed and which are classified in accordance with the InternationalStandard Classification of Education (see annex to this report).
This approach provides institutions that participated in CONGRAD with the opportunity tocompare information for each of the faculties at CONGRAD partner institutions (available in nonpublic institutional reports and faculty data overviews) with the regional average for each field ofstudy.

7Methodological Approach
3 Methodological ApproachThis overview of the CONGRAD graduate survey results has been envisaged, as the termoverview suggests, to present the results obtained with the CONGRAD survey in a descriptivemanner. A comprehensive research instrument, i.e. the CONGRAD questionnaire, was used tocollect the graduates�’ answers to a large number of questions. Depending on the analyticalapproach the respective items can be treated as dependent or independent variables. Theauthors focused in the presentation of results related to the questions targeting the followingtopics: (1) evaluation of the quality of study programmes and study conditions; (2) firstsignificant job, type and quality of first significant job; (3) current employment and career status,type and quality of job that the graduates had at the time of the survey; (4) competencesacquired during studies and competences required for current job with regard to genericcompetences. Within different subchapters of the report, the questions and items included inthe analysis, i.e. the dependent variables have been listed separately and explicitly at thebeginning of each chapter. A great majority of dependent variables, which were analyseddescriptively in this report are variables that measure attitudes and/or perceptions ofrespondents on a 5 point Likert scale. In the questionnaire five response levels were markedwith values from 1 to 5, while labels were only indicated for the scale anchors (e.g. value 1 waslabelled as �“not at all�” and value 5 was labelled as �“to a very high extent�”).
Even though there is a broad debate within the scientific community whether certain statisticalmethods for continuous variables can be applied to Likert type scales for measuring attitudesand perceptions, the common analytical practice and convention in psychological andsociological research on individuals�’ attitudes (e.g. European Social Survey, World Value Survey)treats these variables as continuous. This is particularly the case if only the extreme values of thescale are labelled. Therefore this approach will be intentionally followed in the present reportand in most cases dependent variables will be described by arithmetic mean, standard deviation,standard error, etc.
Dependent variables related to the analytical topics described above are presented indescriptive overviews in figures and tables, differentiated by selected independent variables.Selected independent variables used in this report are: (1) cohort, i.e. calendar or academic yearin which graduates completed their studies; (2) system of studies according to which thegraduates completed their studies, i.e. the Bologna system of studies or old/pre Bologna systemof studies; (3) type of institution (i.e. universities from Serbia, Bosnia and Herzegovina andMontenegro, and polytechnics from Serbia); (4) field of study or discipline the graduatescompleted.
When comparing the mean answers of graduates of different cohorts, systems of studies andtype of institution, differences in means between groups (if these are variables measured on theLikert type five degree scale or as continuous variables, e.g. salary, duration of the search for jobin months, etc.) were tested using simple statistical techniques such as t test or one wayANOVA7. Basic assumptions for applying t test and one way ANOVA, i.e. at least interval scale(see above) and the independence of observations, can considered fulfilled; whereas the normaldistribution and homogeneity of variance in certain cases were not completely satisfied.Nevertheless, since these are rather robust techniques, lack of to normal distribution in somecases causes only small inaccuracies especially bearing in mind the large sample size with severalthousand respondents. Within this analysis, statistical significance has been reported based on a95% confidence interval (p<0.05) and all confidence intervals demonstrated in the report relate
7 These techniques are used for rejecting the null hypothesis i.e. hypothesis that differences between means of two or moregroups of respondents which can be observed in the sample are random and are the result of the sampling, so they cannotbe generaliseed for the entire population i.e. in the case of the CONGRAD survey on all graduates.

8 Methodological Approach
to this confidence interval. Due to the large size of the sample and small standard errors, mostdifferences between subgroups of respondents from different systems of studies or differentcohorts are in fact statistically significant. Therefore in the key tables showing the differencesbetween graduates from different systems of studies, the effect size (eta squared) is alsopresented. Methods and statistically significant differences between groups and other indicatorsare explained in footnotes within the text as they first appear.
Differences in the distributions within certain categorical answers among graduates who belongto different types of institution are analysed by using pair wise comparison for proportionstaking into account Bonferroni correction. Statistically significant differences are stated in thetext.
Comparisons between graduates of different fields of study are presented only descriptively infigures or tables. Comparisons by discipline are presented only in comparative perspective dueto large differences in the number of respondents according to disciplines, which did not allow areliable use of robust techniques.
In all figures the indicated percentages were rounded to integers, whereas in the textpercentages are stated with one decimal.
9Evaluation of Study Programmes and Study Conditions
4 Evaluation of Study Programmes and Study ConditionsGraduates from seven universities and three polytechnics were asked to evaluate differentaspects of the study programmes they completed in 2007 or 2012. The aspects analysed arerelated to the evaluation of study conditions and other elements of the completed studyprogrammes, as well as to the evaluation of the modes of teaching and satisfaction with studies.In this part of the report special attention is paid to the analysis of the graduates�’ evaluationreferring to: (1) cohort (cohort of respondents who graduated in 2007 compared to the cohort ofrespondents who graduated in 20128); (2) type of institution the respondents graduated from(university/polytechnic); (3) system of studies they completed (old/pre Bologna system ofstudies as opposed to the new/Bologna system of studies); (4) degree level (studies of the first,second and third cycle); and (e) field of study (classified based on ISCED).
In all countries of the region, as part of higher education reforms inspired by the BolognaProcess, the higher education legislation and the system of studies were changed by introducingdegrees organised in three cycles. Nevertheless, Bologna reforms and the introduction of newstudy programmes in the regional context included also a variety of ambitious additionalobjectives, such as improving the professional and practical relevance of study programmes,reorganisation of examination procedures, modularisation of study programmes, increase inefficiency of studies, student centered teaching approach, etc. For these reasons, this part of thereport is focused on analysing the graduates�’ responses with regard to the system of studiesaccording to which they completed their studies, i.e. the comparative analysis of the graduateswho completed their studies according to the old system of studies prior to the reform withgraduates who completed their studies according to the new and reformed system of studies.One of the reasons for selecting the 2007 cohort and the 2012 cohort for the analysis ofgraduates belonging to the respective cohorts was to include graduates from both the old andthe new system of studies and analyse their responses in the context of reforms which were andare still being implemented in HEIs participating in the CONGRAD survey.
4.1 Study Programme Quality and Study Conditions �– GeneralOverview
Study conditions were assessed based on 12 items related to the organisation of studies, theperformance of teaching staff and the quality of the contents of the study programme. A 5 pointLikert scale (from 1 �“very low�” to 5 �“very high�”) was applied for the assessment of the following12 items:
1. Content of study programme2. Schedule and coordination of courses3. Possibility to complete study requirements in the provided time (obligations related to
lectures, exercises, exams, etc.)4. Organisation of exams5. Organisation of teaching process within courses6. Professional competence of teaching staff
8 Four HEIs that participated in this survey (University of Belgrade, University of Novi Sad, University of BanjaLuka and U�žice Polytechnic) keep their records on students and graduates according to the academic yearthat starts on 1 October and ends on 30 September; whereas the remaining six HEIs (University ofKragujevac, University of Montenegro, Singidunum University, University of Tuzla, Subotica Polytechnic andNi�š Polytechnic) keep their records on the graduates according to the calendar year that begins on 1 Januaryand ends on 31 December.

10 Evaluation of Study Programmes and Study Conditions
7. Professional advice and guidance provided by teaching staff related to teachingcontents (discussion of written examinations, assignments)
8. Communication with teaching staff9. Cooperation with fellow students10. Performance of student service office11. Use of contemporary teaching methods12. Practice oriented teaching contents within lectures and exercises
Figure 1 shows the distribution of responses to the 5 point Likert items for elements of studyconditions included in the questionnaire. Graduates awarded the highest average marks tocooperation with fellow students (M=4.19) and professional competence of teaching staff(M=3.87). The lowest rated elements were practice oriented teaching contents (M=2.59) and useof contemporary teaching contents (M=2.91).
Figure 1: Assessment of elements of study programmes and study conditions (5 point scale)(universities and polytechnics, 2007 and 2012 cohort)
Table 4 shows the comparative analysis of average ratings regarding the quality studydifferentiated by type of institution, degree level, cohort and system of studies (5 point scalefrom 1 �“very low�” to 5 �“very high�”). The analysis of variance (ANOVA), i.e. the t test for theanalysed elements of study programmes, indicates that there are statistically significantdifferences in the ratings by different groups of respondents with regard to the listed dimensions(for p<0.05). ANOVA was used for variables with more than two categories (type of institution: 4categories; degree level: 3 categories), while t test was applied for dichotomous variables (typeof institution: university and polytechnic; system of studies: old and new; cohort: 2007 and2012). Statistically significant results are marked with an asterisk (*).
Generally speaking, the highest rated element of study conditions is cooperation with fellowstudents (M=4.19) followed by professional competence of teaching staff (M=3.87) andpossibility to complete study requirements in the provided time (M=3.65). Practice orientedteaching contents (M=2.59) and use of contemporary teaching methods (M=2.91) are rated thelowest. This trend is persistent across all subgroups presented in Table 4: The lowest ratings are

11Evaluation of Study Programmes and Study Conditions
given to practical contents and contemporary teaching methods for all types of institution, alldegree levels, both cohorts and both systems of studies. Still, certain differences do exist: Withregard to the differentiation by type of institution, polytechnics received better ratings thanuniversities, except for the assessment of student services where the ratings are similar. Withinthe group of universities Montenegrin universities received the highest ratings in all dimensionsexcept for cooperation with fellow students (M=4.15), which received the highest score atSerbian universities (M=4.20).
The same general trend is present in the case of results differentiated by degree level: practiceoriented teaching contents received the lowest scores, even though third cycle graduates(M=3.38) rated this dimension considerably better than first cycle graduates (M=2.53) andsecond cycle graduates (M=2.75). From a general point of view, third cycle graduates gave thehighest ratings on all dimensions when compared to the graduates from first cycle and secondcycle levels. It has to be emphasised though that the number of PhD graduates who completedthe CONGRAD questionnaire is very low, and cautious interpretation of the respective results isrequired. While 10,600 first cycle graduates and 2,730 second cycle graduates participated inthe CONGRAD survey, only 52 third cycle graduates are included in the sample.
Statistically significant differences occur also when graduates who completed studies accordingto the old system of studies are compared with those who completed their studies according toreformed study programmes in all dimensions except for the cooperation with fellow students.The greatest difference between the old and reformed systems has been measured in the use ofcontemporary teaching methods (Mold_programme=2.62; Mnew_programme=3.15) and in communicationwith the teaching staff (Mold_programme=3.39; Mnew_programme=3.82). Reforms inspired by theBologna Process had a certain effect on the increase of communication between students andteachers. Results presented in the previous analysis show that graduates positively assessed thischange. The same can be said about the other significant structural change which is related tothe changes in the organisation of lectures and, maybe even more importantly, to the changes inthe manner in which exercises, exams and grading system were organised. Reforms in this fielddefinitely had an effect which is reflected also in answers of CONGRAD graduates: higher meanassessments were given by graduates who completed their studies according to the new systemof studies compared to their colleagues who graduated according to the old system of studies.
The largest differences between systems of studies occurs in the mean assessment thegraduates gave to consultations with the teaching staff (Mold_programme=3.30; Mnew_programme=3.72)and the possibility to complete study requirements in the provided time (Mold_programme=3.44;Mnew_programme=3.86). The criticism of the old system of studies usually targeted the highworkload imposed to the students and cumbersome exams, which lead to an increase of timeneeded for students to finish their studies. One of the aims of the new system of studies was todecrease the students�’ workload and to enable the majority of students to complete theirstudies on time. A detailed analysis of the students' workload and in that sense, the comparisonof new and old study programmes which would lead to the definitive conclusions of the successof the Bologna reform can and should not be solely based on this question, since such ananalysis would require a more detailed assessment of the students�’ workload. Nevertheless, it isimportant to conclude that students who graduated according to the new and reformed systemof studies gave significantly higher marks to the possibility to complete study requirements intime, which implies that a certain decrease of the students�’ workload during studies has beenachieved.
As expected, the smallest differences between the new and the reformed types of studyingoccur in the dimensions that had not been encompassed by reforms, such as the functioning ofstudent service offices and professional competence of teaching staff. The graphical display ofthe graduate answers (means) according to the new and old programmes is given in Figure 2.

12 Evaluation of Study Programmes and Study Conditions
Figure 2: Assessment of elements of study programmes and study conditions by system of studies(universities and polytechnics, 2007 and 2012 cohort)
Differences between the two cohorts are similar to the previously analysed differences betweenthe two systems of studies. The highest difference in answers (means) by the two cohorts occursin the use of contemporary teaching methods (M2007=2.62, M2012=3.06) and consultations withteaching staff (M2007=3.34, M2012=3.62), whereas the smallest difference occurs in cooperationwith fellow students (M2007=4.24, M2012=4.17). The differences between the cohorts are onaverage smaller than the differences between the systems of studies, which may imply that thedifferences between cohorts can in fact be attributed to the differences between two systems ofstudies.

13Evaluation of Study Programmes and Study Conditions
Table 4: Dimensions of study conditions for different respondent categories
Numberofrespondents
Mean
UniversitiesSerbia
UniversitiesBosniaandHerzegovina
UniversitiesMontenegro
PolytechnicsSerbia
UniversitiesCONGRAD
PolytechnicsCONGRAD
Bachelordegree
Specialistdegree,Master/Magistardegree
Doctoraldegree
Other
Oldstudysystem
Bolognastudysystem
2007
2012
Conten
tofs
tudy
prog
ramme
14.499
3,55
3,55*
3,41*
3,72*
3,69*
3,56*
3,69*
3,53*
3,64*
3,85*
3,00*
3,47*
3,63*
3,51*
3,59*
Sche
dule
andcoordina
tion
ofcourse
s14.212
3,37
3,4*
3,1*
3,4*
3,58*
3,36*
3,58*
3,32*
3,54*
3,66*
2,79*
3,26*
3,46*
3,33*
3,39*
Possibilityto
completestud
yrequ
irem
ents
intheprovided
time
14.393
3,65
3,65*
3,49*
3,74*
3,99*
3,64*
3,99*
3,58*
3,91*
3,96*
3,47*
3,44*
3,86*
3,56*
3,70*
Organ
isationof
exam
s14.431
3,43
3,46*
3,12*
3,48*
3,76*
3,42*
3,76*
3,36*
3,71*
3,78*
2,80*
3,28*
3,57*
3,41
3,44
Organ
isationof
teaching
proces
swithincourse
s14.130
3,32
3,36*
2,99*
3,37*
3,57*
3,31*
3,57*
3,27*
3,52*
3,63*
2,64*
3,19*
3,45*
3,26*
3,35*
Profes
sion
alcompe
tenciesof
teaching
staff
14.427
3,87
3,91*
3,63*
3,97*
3,91*
3,88
3,91
3,85*
3,99*
4,33*
3,93*
3,83*
3,93*
3,86*
3,90*
Profes
sion
alad
vice
andgu
idan
ceprovided
byteaching
staff(discus
sion
ofwritten
exam
inations
,assignm
ents
14.443
3,52
3,52*
3,32*
3,68*
3,82*
3,51*
3,82*
3,46*
3,74*
4,07*
3,20*
3,30*
3,72*
3,34*
3,62*
Commun
icationwithteaching
staff
14.473
3,61
3,59*
3,49*
3,79*
3,91*
3,6*
3,91*
3,55*
3,85*
4,29*
3,13*
3,39*
3,82*
3,44*
3,71*
Coop
erationwithfellow
stud
ents
14.449
4,19
4,2*
4,18*
4,15*
4,29*
4,19*
4,29*
4,19
4,23
4,35
4,31
4,19
4,23
4,24*
4,17*
Performan
ceof
stud
ents
ervice
office
14.449
3,45
3,35*
3,57*
3,86*
3,45*
3,45
3,45
3,38*
3,71*
3,93*
3,47*
3,39*
3,50*
3,44
3,46
Use
ofcontem
poraryteaching
metho
ds14.381
2,91
2,94*
2,43*
3,1*
3,37*
2,89*
3,37*
2,83*
3,17*
3,60*
2,43*
2,62*
3,15*
2,62*
3,06*
Practice
oriented
teaching
conten
ts14.432
2,59
2,58*
2,32*
2,74*
3,06*
2,57*
3,06*
2,53*
2,75*
3,38*
2,27*
2,41*
2,70*
2,46*
2,65*

14 Evaluation of Study Programmes and Study Conditions
The Graduates�’ assessment of study conditions was measured using a battery of questions on aLikert type scale (from 1 �“not at all�” to 5 �“to a very high extent�”). Questions were designed tocover the following dimensions: (1) quality and access to equipment in faculties/polytechnics(1.1) access to professional literature, (1.2) access to computers, (1.3) access to internet; (2)student mobility (2.1) number of student exchange programmes, (2.2) access to informationabout student exchange programmes, (2.3) quality of student exchange programmes; (3)acquiring professional and practical knowledge (3.1) internship(s) within study programme (3.2)individual expert occupational advice within the field of study ; and (4) assessment of thefunctioning of career centres through the question (4.1) access to information on careeropportunities provided by the Career Centre 9.
As it can be seen from Figure 3, the quality of equipment in HEIs was assessed better than otherdimensions, with one half of students giving it (very) high marks of 4 and 5. It should be pointedout that the equipment here implies the availability of internet, computers and professionalliterature, which represent the minimum of equipment that HEIs should provide to theirstudents. In this context, (very) low marks (values 1 and 2) for internet and computer availabilitywere awarded by a third of graduates (30.6% of graduates gave (very) low marks to internetavailability), whereas 27.9% of graduates assessed the availability of computers in the same way.For the availability of literature (very) low marks were given by 18.4% of graduates.
One fifth of graduates assessed the possibility for acquiring practical and professional knowledgewith marks 4 and 5, whereas more than a half of graduates awarded marks 1 or 2 to the samequestion. In the previously analysed section, graduates' assessment of practice orientedteaching contents was presented. Lower marks (values 1 and 2) were given by 50.9% ofgraduates, whereas marks 4 and 5 were awarded by 25.6% of respondents. To a similar questionabout the presence of internship(s) within study programme, percentages differ when comparedto the previous question: marks 1 and 2 were given by more respondents: 58.6%, whereas marks4 and 5 were awarded by fewer respondents 19.9%. It can be concluded that internships andorganised teaching practice were definitely missing from the structure of study programmes,and that special attention needs to be paid to organised internships that would be related to thestudy programme content.
Higher education reforms inspired by the Bologna Process implied the inclusion of students inthe programmes of academic mobility in order to introduce them with other education systemsand, broadly speaking, to help them to acquire international experience and interculturalcompetences. Increase of student mobility at the European level has been proclaimed as one ofthe most important aims of the Bologna Process. Through the CONGRAD questionnaire, themobility dimension has been measured through the questions in which graduates assessed theavailability of information, access to and quality of mobility programmes available duringstudies. Access to information on mobility programmes has been well evaluated by less than onefifth of graduates (16.1% values 4 and 5), whereas the offer of mobility programmes wasassessed poorly by 60% of respondents (values 1 and 2). Graduates' assessment on mobilityprogrammes shows that the availability, quality and access to information on programmesimproved in time. Even though the mean concerning this question is low in both cohorts, there isa statistically significant difference between two cohorts. Namely, graduates of the youngercohort assess better availability, quality and access to information about mobility programmesbetter than graduates from the older cohort. These results suggest that the increase ofpossibilities and the level of information on mobility programmes, next to the need for morepractice and practical contents, represent the second dimension that the HEIs should addresswithin institutional efforts aimed at the increase of quality of their study offer.
9Questions in tables and figures have been shortened in order to provide a better overview.

15Evaluation of Study Programmes and Study Conditions
The lowest rated dimension in this battery of question was the access to information on careeropportunities provided by career centre10. Only 14.0% of graduates awarded marks 4 and 5 tothis dimension, whereas 68.9% of graduates gave (very) low marks (values 1 and 2) to thisdimension. The average mark awarded to the functioning of career centres is higher among themembers of the younger cohort, which is understandable since this generation of students hadmore opportunities to get introduced with career centres and use their services.
Figure 3: Assessment of elements of study programmes and study conditions (5 point scale, in %)
Table 5 shows the distribution of graduate answers with regard to the type of HEI, cohort, studylevel and field of studies. The data in the table contain results of the ANOVA analysis and t testfor the analysed study programme elements. The ANOVA analysis has been conducted onvariables with more than two categories (university type and study level �– 4 or 3 categories), andthe t test was conducted on variables with two categories (type of HEI �– university ofpolytechnic, system of studies �– old or reformed, and cohorts �– two categories). The existence ofa statistical significance has been marked with an asterisk (*).
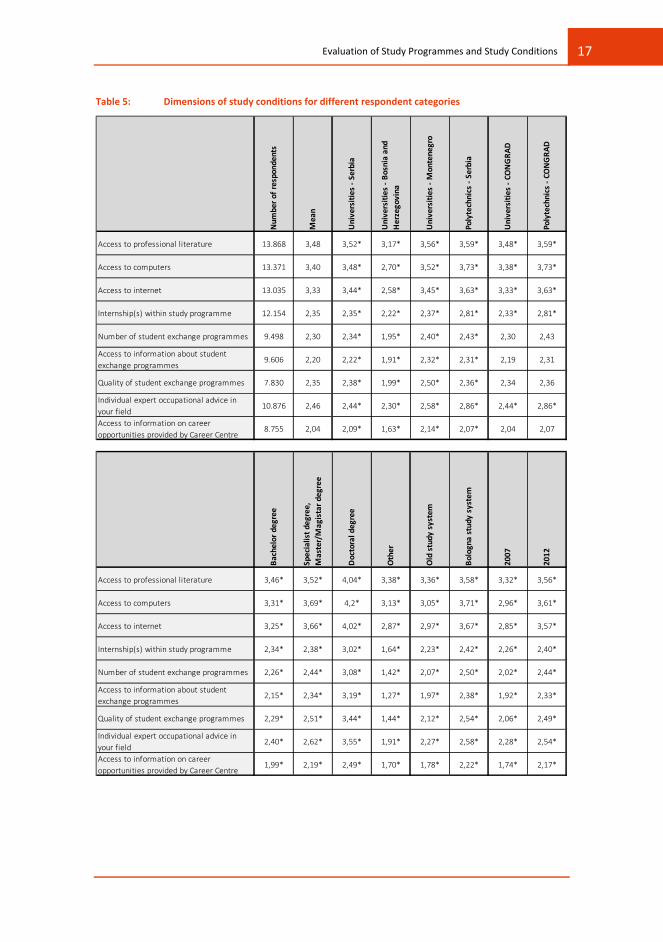
Significant differences with regard to HEI type (university/polytechnic) exist in five out of ninedimensions: (1) access to professional literature, (2) access to computers, (3) access to internet,(4) internship(s) within study programme, and (5) individual expert occupational advice in yourfield. In all five dimensions, respondents from polytechnics awarded higher marks than therespondents from universities.
Statistically significant differences exist in all variables with regard to type of HEI and the countryin which it is located. The graduates from the universities of Montenegro awarded higher marksto the aforementioned dimensions than the graduates from universities of Bosnia andHerzegovina and Serbia. Graduates from the universities of Bosnia and Herzegovina awardedlower marks to the aforementioned quality dimensions compared to their colleagues fromSerbia.
10 Here it should be pointed out that career centres do not exist in all institutions involved in the project and that for a moredetailed analyses of the functioning of career development centres, institutional information should be consulted.

16 Evaluation of Study Programmes and Study Conditions
In the answers to this battery of questions, the graduates from higher levels of studies awardedhigher marks. The lowest marks were awarded by first cycle graduates, whereas the highestmarks were awarded by PhDs. Nevertheless, it is necessary to point out that not many PhDsresponded to the analysed battery of questions: the average number of responses obtainedfrom graduates of first cycle studies was 7,676; the average number for the second cycle studieswas 2,098, whereas there were an average of 44 PhDs (at least 30 PhD graduates assessed eachof the analysed individual study conditions).
When answers of graduates who completed their studies according to the old system of studiesare compared with the answers of graduates who completed the Bologna system of studies, itcan be concluded that internship(s) within study programme is the dimension in which the leastprogress was made. The difference between marks given by graduates who completed the oldand the Bologna programmes is statistically significant, even though it is quite small(M_old_programme=2.23, Mnew_programme=2.39).
17Evaluation of Study Programmes and Study Conditions
Table 5: Dimensions of study conditions for different respondent categories
Num
bero
frespondents
Mean
Universities
Serbia
Universities
Bosniaand
Herzegovina
Universities
Montenegro
Polytechnics
Serbia
Universities
CONGRA
D
Polytechnics
CONGRA
D
Access to professional literature 13.868 3,48 3,52* 3,17* 3,56* 3,59* 3,48* 3,59*
Access to computers 13.371 3,40 3,48* 2,70* 3,52* 3,73* 3,38* 3,73*
Access to internet 13.035 3,33 3,44* 2,58* 3,45* 3,63* 3,33* 3,63*
Internship(s) within study programme 12.154 2,35 2,35* 2,22* 2,37* 2,81* 2,33* 2,81*
Number of student exchange programmes 9.498 2,30 2,34* 1,95* 2,40* 2,43* 2,30 2,43
Access to information about studentexchange programmes
9.606 2,20 2,22* 1,91* 2,32* 2,31* 2,19 2,31
Quality of student exchange programmes 7.830 2,35 2,38* 1,99* 2,50* 2,36* 2,34 2,36
Individual expert occupational advice inyour field
10.876 2,46 2,44* 2,30* 2,58* 2,86* 2,44* 2,86*
Access to information on careeropportunities provided by Career Centre
8.755 2,04 2,09* 1,63* 2,14* 2,07* 2,04 2,07
Bachelor
degree
Specialistd
egree,
Master/Magistard
egree
Doctoraldegree
Other
Oldstudysystem
Bolognastudysystem
2007
2012
Access to professional literature 3,46* 3,52* 4,04* 3,38* 3,36* 3,58* 3,32* 3,56*
Access to computers 3,31* 3,69* 4,2* 3,13* 3,05* 3,71* 2,96* 3,61*
Access to internet 3,25* 3,66* 4,02* 2,87* 2,97* 3,67* 2,85* 3,57*
Internship(s) within study programme 2,34* 2,38* 3,02* 1,64* 2,23* 2,42* 2,26* 2,40*
Number of student exchange programmes 2,26* 2,44* 3,08* 1,42* 2,07* 2,50* 2,02* 2,44*
Access to information about studentexchange programmes
2,15* 2,34* 3,19* 1,27* 1,97* 2,38* 1,92* 2,33*
Quality of student exchange programmes 2,29* 2,51* 3,44* 1,44* 2,12* 2,54* 2,06* 2,49*
Individual expert occupational advice inyour field
2,40* 2,62* 3,55* 1,91* 2,27* 2,58* 2,28* 2,54*
Access to information on careeropportunities provided by Career Centre
1,99* 2,19* 2,49* 1,70* 1,78* 2,22* 1,74* 2,17*

18 Evaluation of Study Programmes and Study Conditions
4.2 Use of Different Modes of TeachingModernisation of study programmes implies the introduction of teaching which is not limited totraditional ex cathedra lectures and the introduction of different interactive teaching methods.The acquiring and developing of generic competences, which will be analysed in more detaillater on, is closely connected to the manner in which students adopt and reproduce studyprogramme contents. It is believed that the aim of usage of different teaching methods is torespond to different learning styles; to stimulate the development of analytical and criticalthinking; to enable students to connect the acquired theoretical knowledge with practicalimplications; and to successfully reproduce and apply the acquired knowledge. The aim of thispart of the survey was to test how graduates evaluate the use of different teaching methods andto determine if differences exist in their use among different HEIs, within different fields of studyand within the pre Bologna and Bologna study programmes. Results for all respondents areshown in Figure 4.
Figure 4: Assessment of different modes of teaching (5 point scale, in %)
Respondents assessed that lectures and theories and paradigms were the only two modes ofteaching which occured more than average (compared with mean answers on this battery ofquestions) than other modes of teaching within the study programmes they completed.Respondents assessed that other, more interactive teaching modes, such as group assignments,participation in research projects, project and/or problem based learning, written assignmentsand oral presentations were present less than average (compared with mean answers on thisbattery of questions). The most common mode of teaching is lecturing, with 86.3% ofrespondents listing it as a mode of teaching.
The graduates�’ responses to this battery of questions mostly confirm the previous findings: theleast used modes of teaching are internships and work placement �– 42.4% graduates claim thatduring studies they had no opportunity for internship (value 1 on the 5 point scale), whereas70.2% of graduates claim to have had very few opportunities for internship or none at all �–

19Evaluation of Study Programmes and Study Conditions
marks 1 and 2 combined. Slightly more than one half of graduates (55.6%) assess that focus onfacts and practical knowledge was present to a (very) small extent.
Study reform inspired by the Bologna Process included also a change in the grading andassessment system, which was mostly reflected in the introduction of continuous assessmentand the broadening of the scope of activities which were assessed prior to the final examination.Such activities include the active participation of students in exercises and lectures, morefrequent writing of seminar papers, and mandatory exercises and lectures. Consequently, asignificant increase in the use of certain modes of teaching occurred, such as writtenassignments, oral presentations by students and group assignments. It was expected that theseforms would be rated higher by graduates who completed their studies according to new studyprogrammes, which was confirmed by the information obtained from the CONGRAD survey.Namely, multiple choice exams, group assignments, project and/or problem based learning,written assignments, oral presentations by students are the dimensions in which highestdifferences exist (ANOVA: p<0.05) between graduates who completed their studies according tothe reformed study programmes and graduates who completed their studies according to thepre Bologna system of studies (Table 6). Information also shows that the use of lecturing has notdecreased. Moreover, an increase in the use of this mode of teaching can be noticed. 85.8%respondents who completed their studies according to the pre Bologna study programmesevaluated that lectures were present to a (very) high extent (marks 4 and 5), whereas for thegeneration that completed their studies according to the Bologna system of studies thispercentage amounts to 88.3%. Other statistically significant differences in graduate evaluationswith regard to the use of different modes of teaching show that graduates who studiedaccording to the Bologna system of studies on average report a significantly higher presence ofgroup assignments, written assignments, multiple choice exams and oral presentations. There isa very small, but statistically significant increase in the presence of internship(s) and workplacement, and the decrease of theories and paradigm teaching. As for the presence of lectures,no substantial differences exist in this variable between universities of Bosnia and Herzegovina,Serbia and Montenegro. On the other hand, in polytechnics, lectures are less present than inuniversities. Due to the vocational orientation of their study programmes, polytechnic graduateshave more opportunities for internship when compared to university graduates. Polytechnicsalso focus less on theories and paradigms in their teaching. On the other hand, respondentsfrom polytechnics report a more frequent use of project and/or problem based learning.
When compared to HEGESCO and REFLEX data11 (Figure 5), CONGRAD polytechnics are theclosest to the European average in terms of the frequency of use of lectures. Still, even thepolytechnics exceed the European average by 10 percentage points. Universities of all threecountries are among the countries, which apply lectures most frequently in Europe, behind onlyLithuania and Estonia. Having in mind that HEGESCO and REFLEX projects included in their surveygraduates who completed their studies 4 to 5 years ago, only the information on the olderCONGRAD cohort served as the basis for comparison expressed in Figure 5.
11 HEGESCO conducted a graduate survey similar to the CONGRAD study in 2008 in Slovenia, Turkey, Lithuania, Poland andHungary. This research can be seen as the addition to an identical survey entitled REFLEX which included graduates fiveyears after their graduation in 2005 in 14 European countries. The overview of data and basic conclusions is available in:Allen, Pavlin & Van der Velden (2011), Competences and Early Labour Market Careers of Higher Education Graduates inEurope. Ljubljana: University of Ljubljana.

20 Evaluation of Study Programmes and Study Conditions
Figure 5: Lecture as a mode of teaching in comparison with HEGESCO and REFLEX countries (in %)
Differences in comparison with HEGESCO and REFLEX countries with regard to the field ofstudies (Table 6) show that internships are most common in teacher training and educationscience and health. The fields of study in which the fewest opportunities for internship werereported are social and behavioural science, business and administration and law. Groupassignments as a mode of teaching are the most common in teacher training and educationscience and personal services. Group assignments were least frequently reported by respondentswho completed their studies in the field of health.Written assignments are most common in artsand humanities, and the least common in agriculture, forestry and fishery, and health. Oralpresentations by students are most frequent in teacher training and education science, whereasthis aspect is least frequent in the field of agriculture, forestry and fishery and in the other fieldof study, which mostly includes sports studies. Multiple choice exams are most common in thefield of health, whereas they are least used in the field of engineering. These differencesdemonstrate the existence of a variety of teaching approaches and teaching traditions indifferent fields of study.

21Evaluation of Study Programmes and Study Conditions
Table 6: Modes of teaching by type of institution/country (universities and polytechnics, 2007 and2012 cohort combined)
Universities
Serbia
Universities
Bosniaand
Herzegovina
Universities
Mon
tene
gro
Polytechnics
Serbia
Oldstud
ysystem
Bolognastud
ysystem
Lectures 4,44* 4,42* 4,48* 4,30* 4,42* 4,48*
Group assignments 2,84* 2,79* 3,04* 3,14* 2,63* 3,10*
Participation in research projects 1,71* 1,56* 1,76* 1,99* 1,59* 1,78*
Internships, work placement 2,06* 2,06* 2,00* 2,49* 1,98* 2,10*
Facts and practical knowledge 2,45* 2,34* 2,58* 2,82* 2,29* 2,59*
Theories and paradigms 4,27* 4,14* 4,14* 3,83* 4,26 4,23
Project and/or problem based learning 2,57* 2,26* 2,65* 2,89* 2,30* 2,80*
Written assignments 3,09* 3,01* 3,53* 3,49* 2,82* 3,44*
Oral presentations by students 2,99* 3,07* 3,40* 3,13* 2,67* 3,40*
Multiple choice exams 2,77* 2,37* 3,18* 2,81* 2,50* 2,95*
Education
Humanities
andarts
Socialsciences,businessa
ndlaw
Science
Engine
eringmanufacturin
gand
constructio
n
Agriculture
Health
andwelfare
Services
Other
Lectures 4,54* 4,50* 4,43* 4,39* 4,42* 4,46* 4,32* 4,58* 4,47*
Group assignments 3,08* 2,85* 2,84* 2,96* 2,99* 2,48* 2,40* 3,08* 2,80*
Participation in research projects 1,86* 1,59* 1,69* 1,71* 1,63* 1,57* 1,93* 1,84* 2,03*
Internships, work placement 2,79* 2,06* 1,81* 2,05* 1,9* 2,24* 2,73* 2,40* 3,06*
Facts and practical knowledge 2,81* 2,57* 2,32* 2,72* 2,35* 2,25* 2,54* 2,58* 3,00*
Theories and paradigms 4,24* 4,16* 4,30* 4,09* 4,19* 4,15* 4,33* 4,22* 3,85*
Project and/or problem based learning 2,60* 2,25* 2,50* 2,74* 2,93* 1,94* 2,02* 2,58* 2,46*
Written assignments 3,58* 3,69* 3,32* 2,87* 2,87* 2,45* 2,48* 3,16* 2,98*
Oral presentations by students 3,40* 3,34* 3,26* 2,87* 2,68* 2,62* 2,79* 3,27* 2,67*
Multiple choice exams 2,87* 2,50* 2,96* 2,76* 2,30* 2,36* 3,87* 2,91* 2,97*

22 Evaluation of Study Programmes and Study Conditions
4.3 Satisfaction with StudiesGraduates are generally satisfied with study programmes they completed (on a scale a 10 pointscale from 1 �“not at all�” to 10 �“to a very high extent�”, the majority of graduates awarded themark 8 to the programme they completed). The average answer for this question is 6.57 (±0.04,95% confidence interval). Marks 1 to 4 were given by 19.1% of respondents, and theserespondents can be designated as unsatisfied, whereas there were 70.4% of respondents (marks6 to 10) who were satisfied. There were 6.2% very unsatisfied graduates (marks 1 and 2),whereas one fifth of graduates, i.e. 19.8%, were very satisfied (marks 9 and 10) (Figure 6).
Figure 6: Satisfaction with the completed study programme (10 point scale, in %)
Comparative analysis of responses given by graduates of universities in Serbia, Bosnia andHerzegovina and Montenegro and polytechnics from Serbia (Table 7) shows that the mostsatisfied graduates are the graduates of the universities of Montenegro (M=6.65). The leastsatisfied graduates are graduates from universities of Bosnia and Herzegovina (M=6.18).
Table 7: Satisfaction with the completed study programme according to type of institution/country
The ANOVA results show that there is a statistically significant difference between the analysedHEIs at the p<0.05 level in all four institution types: F3.13959=30,772, p=0.000. Tukey�’s post hoctest shows that there is a statistically significant difference between the mean values of thefollowing groups:
Universities Serbia (M=6.58, SD=2.266) and Universities Bosnia and Herzegovina(M=6.18, SD=2.280)Universities Serbia (M=6.58, SD=2.266) and Universities Montenegro (M=6.87,SD=2.309)Universities Bosnia and Herzegovina (M=6.18, SD=2.280) and UniversitiesMontenegro (M=6.87, SD=2.309)
Mean Std. error N
Universities Serbia 6,58 2,266 9.593Universities Bosnia and Herzegovina 6,18 2,280 1.905Universities Montenegro 6,87 2,309 1.941Polytechnics 6,65 2,302 524Total 6,57 2,282 13.963
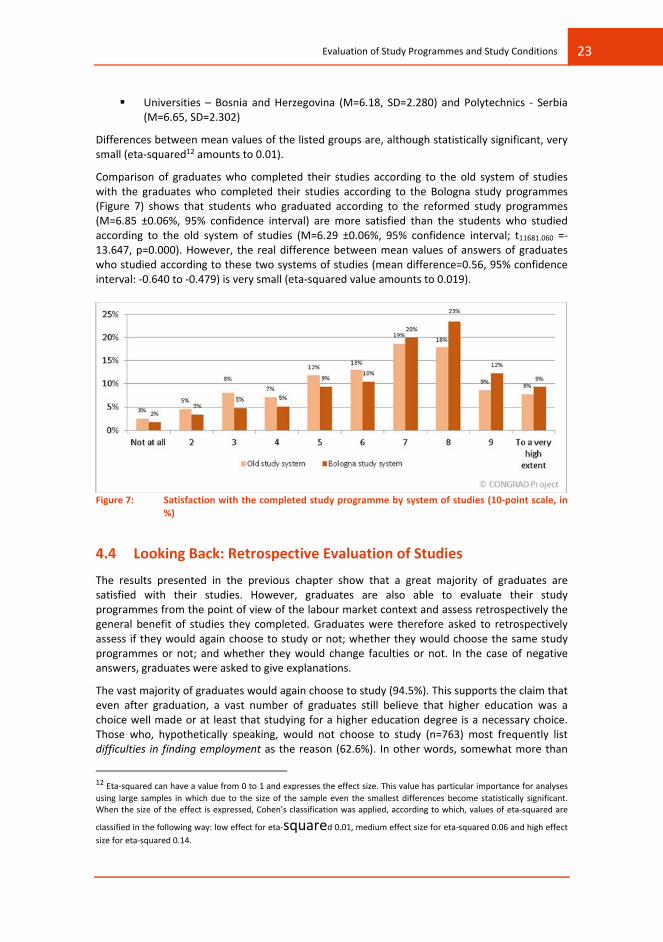
23Evaluation of Study Programmes and Study Conditions
Universities �– Bosnia and Herzegovina (M=6.18, SD=2.280) and Polytechnics Serbia(M=6.65, SD=2.302)
Differences between mean values of the listed groups are, although statistically significant, verysmall (eta squared12 amounts to 0.01).
Comparison of graduates who completed their studies according to the old system of studieswith the graduates who completed their studies according to the Bologna study programmes(Figure 7) shows that students who graduated according to the reformed study programmes(M=6.85 ±0.06%, 95% confidence interval) are more satisfied than the students who studiedaccording to the old system of studies (M=6.29 ±0.06%, 95% confidence interval; t11681.060 =13.647, p=0.000). However, the real difference between mean values of answers of graduateswho studied according to these two systems of studies (mean difference=0.56, 95% confidenceinterval: 0.640 to 0.479) is very small (eta squared value amounts to 0.019).
Figure 7: Satisfaction with the completed study programme by system of studies (10 point scale, in%)
4.4 Looking Back: Retrospective Evaluation of StudiesThe results presented in the previous chapter show that a great majority of graduates aresatisfied with their studies. However, graduates are also able to evaluate their studyprogrammes from the point of view of the labour market context and assess retrospectively thegeneral benefit of studies they completed. Graduates were therefore asked to retrospectivelyassess if they would again choose to study or not; whether they would choose the same studyprogrammes or not; and whether they would change faculties or not. In the case of negativeanswers, graduates were asked to give explanations.
The vast majority of graduates would again choose to study (94.5%). This supports the claim thateven after graduation, a vast number of graduates still believe that higher education was achoice well made or at least that studying for a higher education degree is a necessary choice.Those who, hypothetically speaking, would not choose to study (n=763) most frequently listdifficulties in finding employment as the reason (62.6%). In other words, somewhat more than
12 Eta squared can have a value from 0 to 1 and expresses the effect size. This value has particular importance for analysesusing large samples in which due to the size of the sample even the smallest differences become statistically significant.When the size of the effect is expressed, Cohen�’s classification was applied, according to which, values of eta squared are
classified in the following way: low effect for eta squared 0.01, medium effect size for eta squared 0.06 and high effectsize for eta squared 0.14.

24 Evaluation of Study Programmes and Study Conditions
three fifths of graduates who would retrospectively give up on studying would do so because ofthe poor state of the labour market and the inability to find employment within their profession.This reason is followed by low quality of study programmes and poor study conditions (16.0%)and higher education diploma is not valued enough (4.5%). There are 4.5% of this subgroup ofgraduates who would choose a profession that does not require higher education.
If they were retroactively given the opportunity to choose the faculty/polytechnic and studyprogramme, almost two thirds of graduates (62.5% ±0.8%, 95% confidence interval) wouldchoose the same faculty/polytechnic and the same study programme. 8.8% of graduates (±0.5%,95% confidence interval) would choose the same study programme, but at a differentfaculty/polytechnic, whereas 17.5% (±0,6%, 95% confidence interval) of graduates would changeboth different faculty/polytechnic and different study programme (95% confidence intervals).
Figure 8: Answers of graduates regarding the retroactive decision about study programme andfaculty/polytechnic (in %)
According to the types of institution (Figure 9), there are no significant differences between theanswers of graduates who graduated from universities in Montenegro and Serbia, whereas thereare slightly more graduates who would not choose the same faculty and the same studyprogramme among the graduates of universities in Bosnia and Herzegovina. Graduates of allhigher education institutions gave similar answers when asked if they would choose to studyagain. Most graduates who would again choose to study are Montenegrin university graduates(95.3%), followed by the graduates of universities (95.0%) and polytechnics (93.3%) in Serbia.The lowest percentage of those who would choose to study again was recorded among thegraduates of universities in Bosnia and Herzegovina (91.5%).
Figure 9: Answers of graduates regarding the retroactive decision about study programme andfaculty/polytechnic according to type of institution/country (in %)

25Evaluation of Study Programmes and Study Conditions
The graduates who would retrospectively choose a different faculty/polytechnic usually list thefollowing reasons for such a decision: it is hard to find employment (lack of perspective) (33.9%),low quality of study programmes and poor study conditions (25.1%), I would choose to studysomething else (14.3%), lack of internships (5.9%), whereas 4.8% would go abroad.
Figure 10: Reasons for choosing a different faculty/polytechnic (in %)
The graduates, who would, from current perspective, choose a different study programme gavesimilar answers. However, the answer it is hard to find employment (lack of perspective) occursmuch more frequently (41.5% of answers). This answer is followed by low quality of studyprogrammes and poor study conditions (23.2%). Lack of internships was listed as a reason by10.9% of this subgroup of graduates (which is significantly higher when compared with thereasons for choosing a different faculty). 2.8% of respondents stated that higher educationdiploma is not valued enough.
Figure 11: Reasons for choosing a different study programme (in %)
When the graduates�’ answers are compared with regard to cohort, it shows that graduates ofthe 2007 cohort who would retrospectively enrol in another faculty, more often state that it ishard to find employment (lack of perspective), whereas they less often mention the low qualityof study programmes and poor study conditions in comparison with their younger colleagues(Figure 12). Interestingly, among respondents who would choose the same faculty but a

26 Evaluation of Study Programmes and Study Conditions
different study programme, the situation is opposite: the 2007 cohort much more oftenmentioned that it is hard to find employment (lack of perspective), and less often the low qualityof study programmes and poor study conditions (Figure 13).
Figure 12: Reasons for choosing a different faculty/polytechnic by graduate cohort (in %)
Figure 13: Reasons for choosing a different study programme by graduate cohort (in %)
The results presented in this chapter show that graduates are mostly satisfied with the studyprogrammes they completed and that a majority of them would not change their original
27Evaluation of Study Programmes and Study Conditions
decision to attend the faculty and study programme they graduated from. Still, it should bepointed out that the graduates�’ responses were influenced not only by the experience ofstudying, but that their frame of reference when assessing their own educational institutionswas significantly broader: they took into account the perceived quality of other HEIs, situation atthe labour market, and opportunity costs of studying (which are not necessarily high at themacro level bearing in mind the high unemployment rate and the economic crisis that affectedall three countries13). Therefore, the good assessment given by graduates should be interpretedin the context of other responses that graduates gave by responding to questions that directlyrelate to study conditions. Graduates of all HEIs that participated in the CONGRAD survey agreethat internships, facts and practical knowledge and the linking of practical and theoreticalknowledge are the elements that were lacking the most during their studies. Graduates namelyhad the opportunity to compare their knowledge and skills with the demands of different jobsthey had (or tried to get). This is especially true for the 2007 cohort, since they reflected on theknowledge acquired during studies in the light of experiences they gained in the meantime.Therefore, their assessment should be interpreted with this in mind. The role of highereducation in all three countries is certainly not limited only to the direct preparation for concretejobs at the labour market. Also, no indications exist that any of the three analysed educationsystems demonstrate the inclination to limit the function of higher education in this way. Still,data show that 70.2% of respondents gave marks 1 or 2 to the presence of internships in theirstudy programme, which supports the claim that there is a clear need for study programmes tofocus more on the application of acquired theoretical knowledge.
As it was already explained, the intention behind the selection of cohorts of graduates within theCONGRAD survey was also to partially evaluate the effects of the higher education reforms interms of the intended quality improvement of study programme and study conditions. Theanalysed dimensions of study programmes in most cases show that the reform of highereducation systems had a positive effect: graduates who studied according to the new system ofstudies gave better marks to almost all study conditions measured by the CONGRADquestionnaire. Dimensions such as facts and practical knowledge, use of contemporary teachingmethods, internship(s) within study programme, offer and quality of student exchangeprogrammes were all assessed better by the generation that studied according to the new andreformed Bologna system of studies. It can be concluded that higher education institutions areon the right path in many aspects, and that the introduced changes had positive effects on theorganisational segments or the segments relating to the teaching and assessment methods. Withregard to the aspects graduates mostly complain about, such as the lack of facts and practicalknowledge and internships and work placement, a small improvement was noted, which may beseen as a guideline for potential further reforms in the field of higher education in the region.
Results of the CONGRAD survey provide information on jobs and careers of graduates whoacquired their degrees in different fields of study, thus providing a good information basis forthe increase of professional relevance of study programmes and their contents. It should bepointed out that remarks pertaining to the lack of practical knowledge in study programmes aresystemic and are present in the results of most graduate surveys around the world. This showsthat higher education in its core function aims to provide a broad intellectual basis and preparestudents for highly professional occupations. However, concrete training for work on specificjobs and within specific workplaces is usually left to the employers and their systems of inservice training. Graduates faced with concrete work tasks directly after academic reality usuallyfeel underprepared for their specific work roles. They usually feel that they have a lack ofpractical knowledge and skills that are required within a concrete workplace. Therefore, it isquite common that the first phase of employment is marked by intensive in job learning, which
13 Opportunity costs of studying at micro and meso levels in this context were not taken into account.

28 Evaluation of Study Programmes and Study Conditions
in the case of certain professions can last even for years. Consequently, it is understandable thatgraduates almost always assess that higher education did not provide them with enoughknowledge to perform concrete work tasks. This fact should be taken into consideration whenthe results of study programme evaluation are interpreted.
On the other hand, the association between fields of study and professional fields varies incountries of different higher education traditions. The link between fields of study and potentialprofessional and occupational fields and the range of jobs the students have access to in theregion is rather strong, and it follows the professional/vocational tradition of higher educationtypical for continental European countries. Graduate surveys like CONGRAD therefore givehigher education institutions in the region the opportunity to find out more about concreterequirements of occupations in different branches of economy in which graduates findemployment after completing their studies. This crucial information should enable HEIs in theregion to improve the organisation and relevance of internships and study programmes.

29Career Patterns of Graduate Professionals
5 Career Patterns of Graduate ProfessionalsOne of the aims of the CONGRAD survey was to monitor the careers of professionals with highereducation degrees and to describe the process of transition from higher education to workwithin the social and cultural contexts of Western Balkan countries. Graduate survey results (e.g.Allen, Pavlin & Van der Velden (eds.) 2011) generally confirm that the first ten career years ofprofessionals with higher education degrees more or less follow the same pattern, whichconsists of three phases: (1) initial transition phase to the labour market in which the graduate isfocused on job search and developing strategies that enable him/her to become integrated inthe professional community and position himself/herself in the labour market, (2) phase two inwhich concrete professional expertise is obtained; during this phase specific career patternsstart to emerge, and (3) phase three in which young professionals take more responsibility forthe job they perform owing to their improved professional skills. Comparative Europeangraduate surveys such as REFLEX confirm that the initial phase usually ends 1 2 years aftergraduation. At that time, the second phase starts and usually lasts until the fifth year aftergraduation. The third phase usually ends 10 years after graduation. According to the results ofthe CONGRAD survey, career paths of graduates in the Western Balkans region mostly follow thispattern, even though deviations from this previously identified pattern occur due to: (a) delayedcareer start and/or (b) non linear career path with alternating periods of employment andunemployment. These deviations can be explained by the conditions in which youngprofessionals start their careers in Serbia, Bosnia and Herzegovina, and Montenegro: politicaland economic instability of (post)transition societies certainly affect the (in)ability of youngprofessionals to smoothly develop their careers. For a large number of graduates from thesecountries, the career is postponed because they enrol in further studies; take care of familymembers (they become inactive in terms of work status), or cannot find a job even though theyare actively searching for it (they remain unemployed and without any work experience). Basedon the CONGRAD survey results, the career patterns of young professionals can be grouped inthe following four categories:
1. Career without unemployment periods2. Career with periods of unemployment3. Unemployed without work experience, but actively searching for work4. Inactive (no job, no active search for work)
For graduates of CONGRAD universities in Serbia, Bosnia and Herzegovina, and Montenegro, andpolytechnics in Serbia, the following career patterns can be identified five years after graduation(2007 cohort) and one year after graduation (2012 cohort) respectively14:
14 Only categories with at least 30 respondents are included.
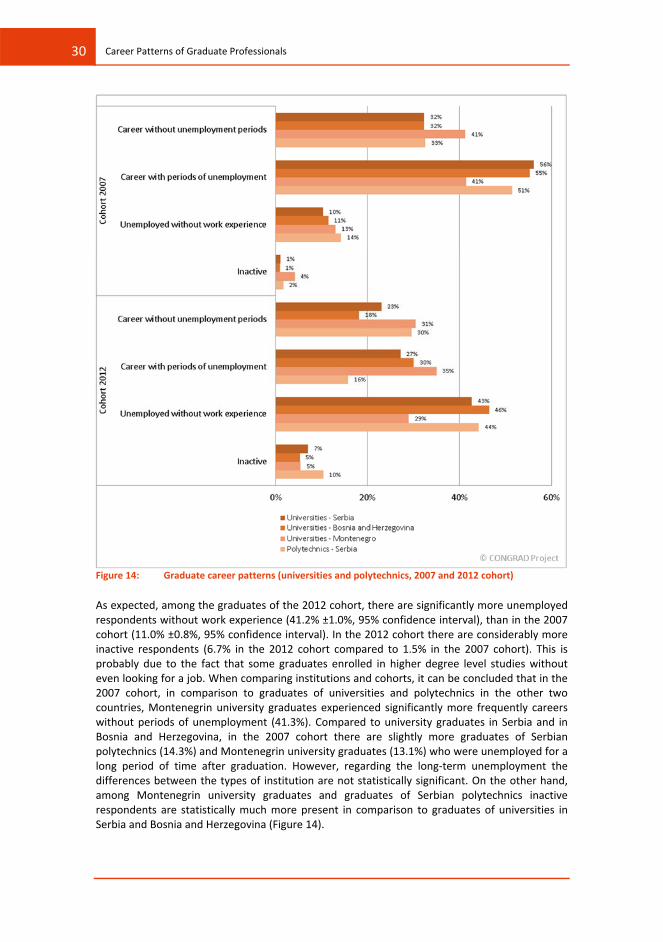
30 Career Patterns of Graduate Professionals
Figure 14: Graduate career patterns (universities and polytechnics, 2007 and 2012 cohort)
As expected, among the graduates of the 2012 cohort, there are significantly more unemployedrespondents without work experience (41.2% ±1.0%, 95% confidence interval), than in the 2007cohort (11.0% ±0.8%, 95% confidence interval). In the 2012 cohort there are considerably moreinactive respondents (6.7% in the 2012 cohort compared to 1.5% in the 2007 cohort). This isprobably due to the fact that some graduates enrolled in higher degree level studies withouteven looking for a job. When comparing institutions and cohorts, it can be concluded that in the2007 cohort, in comparison to graduates of universities and polytechnics in the other twocountries, Montenegrin university graduates experienced significantly more frequently careerswithout periods of unemployment (41.3%). Compared to university graduates in Serbia and inBosnia and Herzegovina, in the 2007 cohort there are slightly more graduates of Serbianpolytechnics (14.3%) and Montenegrin university graduates (13.1%) who were unemployed for along period of time after graduation. However, regarding the long term unemployment thedifferences between the types of institution are not statistically significant. On the other hand,among Montenegrin university graduates and graduates of Serbian polytechnics inactiverespondents are statistically much more present in comparison to graduates of universities inSerbia and Bosnia and Herzegovina (Figure 14).

31Career Patterns of Graduate Professionals
In the 2012 cohort there are significantly more Montenegrin university graduates (30.5%) andgraduates of Serbian polytechnics (29.6%) who experienced careers without periods ofunemployment in comparison to graduates of universities in Serbia and Bosnia and Herzegovina.The average for all institutions amounts to 23.8%. Statistically significant differences exist alsobetween Serbian university graduates and graduates of universities in Bosnia and Herzegovina.Cases of respondents who were still unemployed at the time of the survey are most commonamong graduates of universities in Bosnia and Herzegovina (46.4%), whereas they are leastcommon among Montenegrin university graduates (29.0%). The average for all CONGRADinstitutions amounts to 41.2%. Statistically significant differences occur only betweenMontenegrin university graduates in comparison with other institutions.
With regard to the system of studies according to which the graduates completed their studies(pre Bologna/old system of studies or Bologna system of studies), differences in career patternsoccurring between pre Bologna and Bologna graduates are due to the period of time aftergraduation (and being actually available for the labour market), and not due to differencesbetween the two systems of studies.
Among the graduates who completed first cycle studies according to the Bologna system ofstudies, there are twice as many graduates with no work experience (46.7%) compared tograduates who graduated according to the old system of studies (21.9%). This may be caused bythe fact that graduates who completed their studies according to the new Bologna system ofstudies are younger on average, which means that at the time of the survey, they were mostlyonly looking for their first job. In addition, among graduates who completed first cycle studiesaccording to the Bologna system of studies there is a considerably larger share of inactivegraduates (9.9%, compared to 1.9% according to the old system of studies; Figure 15). Most ofthe inactive graduates are unemployed because they decided to enrol in higher degree levelstudies. This can be perceived as consequence of changing conditions in the labour marketcompared to year 2007, i.e. before the financial crisis, when most of the graduates of the 2007cohort who completed their studies according to the old system of studies started to search forjobs. For graduates who obtained their first cycle degree in the Bologna system of studies,difficulties in finding employment affected the graduates�’ decision to enrol in higher degree levelstudies in order to increase their work relevant qualifications.

32 Career Patterns of Graduate Professionals
Figure 15: Graduate career patterns by system of studies First cycle degree (universities andpolytechnics , 2007 and 2012 cohort combined, in %)
Similar to the graduates with first cycle degrees, a nearly identical career pattern can beidentified for graduates who completed second cycle studies according to different systems ofstudy (pre Bologna and Bologna).15 Among graduates who completed second cycle studiesaccording to the Bologna system of studies the share of unemployed graduates without workexperience (29.3%) is more than twice as high as among graduates who completed second cyclestudies according to the old system of studies (specialist and magister studies) (12.2%) (Figure16).
Figure 16: Graduates�’ career patterns by system of studies �– Second cycle degree (universities andpolytechnics, 2007 and 2012 cohort combined, in %)
15 Due to small sample size, career patterns of PhD level graduates are not included in the analysis.

33Career Patterns of Graduate Professionals
Taking into account fields of study, in the 2007 cohort the number of university graduates whoexperienced careers without periods of unemployment is highest among graduates whocompleted their studies in the fields of computing (59.1%) and teacher training and educationscience (44.1%). On the other hand, only 20.0% of graduates who completed their studies in thefield of health and 22.9% of graduates in agriculture, forestry and fishery experienced no periodsof unemployment. The share of graduates who five years after graduation were still unemployedand did not have work experience is particularly pronounced among graduates who completedstudy programmes in the fields of health (20.6%) and life sciences (23.8%) (Figure 17).
Figure 17: Graduate career patterns by field of study (universities, 2007 cohort, in %)
On the other hand, in the 2012 cohort the share of university graduates, whose career startedsuccessfully without an unemployment period is highest among the graduates who completedtheir studies in computing (48%) and mathematics (46.4%). At the same time, only 13.6% ofgraduates who completed their studies in the fields of health and agriculture, forestry andfishery experienced no unemployment periods in this early career stage. Most respondents whowere unemployed at the time of the survey and did not have any work experience are graduatesof life sciences (63.7%) and health (57.5%). The average for graduates of all disciplines is 41.2%(Figure 18).

34 Career Patterns of Graduate Professionals
Figure 18: Graduate career patterns by field of study (universities, 2012 cohort, in %)
Usually graduates experience a relatively unstable period in the labour market during the firstfew years after graduation. Sometimes they change employers and jobs that cannot beconsidered significant for their professional careers several times16. Within the group ofgraduates of universities and polytechnics in the 2007 cohort, graduates who continued orstarted their careers without unemployment periods had an average of 2.06 employers. Theychanged employers less often than graduates who experienced unemployment periods, who hadan average of 2.30 employers (Figure 19).
16 The first significant job is defined as a job lasting or contracted for more than six months.

35Career Patterns of Graduate Professionals
Figure 19: Average number of employers by graduate career pattern (universities and polytechnics,2007 and 2012 cohort, in %)
Among the graduates of the 2007 cohort who had no work experience five years aftergraduation the average duration of unemployment and active job search amounts to 21.31months (±2.01, 95% confidence interval) for all types of institutions. This indicates that therespective graduates had significant periods of inactivity in addition to their active job search.Some of the reasons for inactivity are the continuation of studies and taking care of children andfamily members (Figure 20). Graduates without any work experience of Serbian polytechnics anduniversities in Bosnia and Herzegovina on average spent more time unemployed in comparisonto graduates with no work experience of the universities in Serbia and Montenegro.

36 Career Patterns of Graduate Professionals
Figure 20: Average duration of unemployment period(s) and active job search in months by graduatecareer pattern (universities and polytechnics, 2007 and 2012 cohort combined)
When analysing the responses of graduates of the 2007 cohort, who have been unemployed fora longer period of time, according to fields of study, it shows that the shortest duration ofunemployment period was reported by graduates who completed study programmes inmanufacturing (8.4 months) and journalism and information (9.5 months). Graduates of physicalsciences (45.2 months) and humanities (33.2 months) reported the longest unemploymentperiods.
The findings on graduates�’ career patterns of graduates from CONGRAD universities andpolytechnics do not imply a general problem of long term unemployment of young professionalsin the 2007 cohort. Among the respondents of this cohort, the share of unemployed graduateswithout any work experience amounts to 11% (one in ten university graduates). Long termunemployment is present to a certain extent among graduates of all fields of study, but not to asubstantial extent. Therefore, this might be considered as a problem specific for graduates ofcertain fields of study, e.g. life sciences (biology and ecology), health, sports studies; and to alesser extent among graduates of physical sciences, law and arts.
Regarding the respondents of the 2012 cohort, graduates who experienced careers withoutperiods of unemployment (23.8%) had an average of 1.40 employers. They changed employersless frequently than graduates who experienced periods of unemployment (28.3%), who had1.50 employers on average (Figure 19). The average duration of unemployment and active jobsearch in the period after graduation among graduates with no work experience lasted 9.7months on average (41.2% of the 2012 cohort). Bearing in mind that at the time of the survey0.5 to 1.5 years passed since the respondents completed their studies this represents almost theentire period after graduation (Figure 20). The longest average duration of unemploymentwithout any work experience between 0.5 and 1.5 years after graduation was reported byuniversity graduates in Bosnia and Herzegovina (10.1 months), while the shortest averageduration was reported by Montenegrin university graduates (7.1 months). Statistically significantdifferences in the duration of unemployment without any work experience exist only forMontenegrin university graduates in comparison with graduates Serbian universities and

37Career Patterns of Graduate Professionals
polytechnics, and university graduates in Bosnia and Herzegovina. With regard to fields of study,in the 2012 cohort the period of unemployment and active job search is shortest amonggraduates who completed study programmes in the field of arts (7.97 months). On the otherhand, this period is longest among graduates in the fields of physical sciences (10.9 months) andagriculture, forestry and fishery (10.5 months). The average duration for all fields of studyamounts to 9.7 months.
In the following part of this report, selected findings related to the three key phases of transitionfrom graduation to early professional career are presented. Firstly, right after graduation, manygraduates experience a transition phase, which implies working in parallel to studies or activelysearching for a job searching while continuing studies. Secondly, the survey provides informationon the graduates�’ first significant job. The first significant job is defined as job that the graduatescontinued or started right after completing studies, lasting or contracted for more than sixmonths. Thirdly, the survey aimed at obtaining information on the current work status ofgraduates, i.e. the job the graduates had at the time of the survey (March to July 2013), i.e.depending on the cohort one year and five years after graduation.

38 Situation right after Graduation
6 Situation right after GraduationFigure 21 shows the graduates�’ employment status right after completing their studies atCONGRAD universities and polytechnics for both cohorts included in the survey.
Figure 21: Situation right after graduation (universities and polytechnics, 2007 and 2012 cohortcombined, in %)
The analysis of both cohorts shows that almost half of the graduates of CONGRAD universitiesand polytechnics were employed/self employed, or they were employed/self employed andcontinued studies or other trainings right after graduation (48.7% ±0.82%, 95% confidenceinterval). The share of graduates who continued to work on their jobs/continued to be selfemployed or found new jobs/became self employed was highest among Montenegrin universitygraduates (53.1% ±1.12%, 95% confidence interval). The share of graduates who continued tostudy after graduation is also highest among Montenegrin university graduates, amounting to22.3% (± 0.94%, 95% confidence interval). With regard to the graduates who continued to studyafter graduation without looking for a job, there are statistically significant differences betweenthe three countries, whereas there are no differences between Serbian universities and Serbianpolytechnics. With regard to the graduates who continued to study after graduation and whowere searching for employment at the same time there is a higher share of Serbian universitygraduates compared to other types of institution.
The largest share of university graduates who were employed, i.e. who continued to work ontheir jobs/are self employed in the same position as during studies or found new jobs/becameself employed right after graduation, can be identified for the fields of computing (68.5%) andmathematics (66.7%). In comparison to graduates of other fields of study, graduates of lifesciences (24.4%) and environmental protection (32.7%) continued to work in their old jobs orfound new jobs right after graduation substantially less frequently. As illustrated in the previousanalysis of career patterns, due to facing lower chances for employment graduates whocompleted study programmes in the fields of arts (25.5%), life sciences (36.1%) andenvironmental protection (23.8%) most frequently decided to continue studying (Figure 22).

39Situation right after Graduation
Figure 22: Situation right after graduation by fields of study (universities, 2007 and 2012 cohortcombined, in %)
As Figure 23 illustrates, more than a third of the graduates of CONGRAD universities andpolytechnics continued to work on jobs/were self employed in the same positions as duringstudies (36.8%) right after graduation. This type of transition from higher education to the worldof work is especially pronounced among Serbian polytechnics graduates (53.8%) and amongMontenegrin university graduates (46.4%). Between Serbian polytechnics graduates andMontenegrin university graduates there are no statistically relevant differences, whereasdifferences between graduates of universities in Serbia and universities Bosnia and Herzegovinaare statistically significant.

40 Situation right after Graduation
Figure 23: Graduates continuing the same job as before graduation or starting a new job right aftergraduation (universities and polytechnics, 2007 and 2012 cohort combined, in %)
The largest share of graduates who continued to work in the same position as before graduationcompleted their studies in the field journalism and information (61.8%) and teacher training andeducation science (55.3%).

41Situation right after Graduation
Figure 24: Graduates continuing the same job as before graduation or starting a new job right aftergraduation by fields of study (universities, 2007 and 2012 cohort combined, in %)
As much as 69.0% of graduates of CONGRAD universities and polytechnics who were employedor self employed right after graduation worked in jobs that were to a high extent related to theirfield of study (values 4 and 5 on the 5 point Likert scale). There are no statistically significantdifferences between graduates of universities in Serbia, Bosnia and Herzegovina, andMontenegro, whereas substantial differences exist between graduates of polytechnics anduniversity graduates. Only 47.5% of polytechnics graduates worked on jobs that were to a highextent related to their field of study (Figure 25).

42 Situation right after Graduation
Figure 25: Extent to which the job right after graduation was related to the field of study (5 pointscale, universities and polytechnics, 2007 and 2012 cohort combined, in %)
Graduates who completed their studies in veterinary (84.6%), medical sciences (81.5%) and arts(80.7%) reported most frequently that their jobs right after graduation were to a high extent(values 4 and 5 on the 5 point Likert scale) related to their field of study (Figure 26).

43Situation right after Graduation
Figure 26: Extent to which the job right after graduation was related to the field of study by field ofstudy (5 point scale, universities, 2007 and 2012 cohort, in %)
With regard to the extent to which the job right after graduation was related to the field ofstudy, ANOVA analysis (F = 4.686, p=0.000) and post hoc Tukey test show that there arestatistically significant differences between certain fields of study in the 2007 cohort. Statisticallyrelevant differences exist between the fields of arts (4.86 ±0.16, 95% confidence interval), law(4.38 ±0.18, 95% confidence interval) and architecture and building (4.30 ±0.14, 95% confidenceinterval) and the following fields: humanities (3.86 ±0.14, 95% confidence interval), business andadministration (3.82 ±0.12, 95% confidence interval), engineering (3.78 ±0.16, 95% confidenceinterval) and agriculture, forestry and fishery (3.83 ±0.25, 95% confidence interval) (Table 8).
The situation is similar in the 2012 cohort (F=7.449, p=0.000). Compared to other fields of studythe (self )employment of graduates in the field of informatics and computing (4.21 ±0.16, 95%

44 Situation right after Graduation
confidence interval)17 is to the greatest extent related to the study programme they completed,whereas the least relation between (self )employment right after graduation and the formerstudy programme is observed for graduates in social sciences (3.46 ±0.18, 95% confidenceinterval)18 and business, management and administration (3.46 ±0.1, 95% confidence interval)19(Table 8).
Table 8: Extent to which the job right after graduation was related to the field of study by field ofstudy (5 point scale, universities, 2007 and 2012 cohort)
6.1 Differences between Systems of StudiesPatterns of transition to the labour market right after graduation are significantly differentbetween graduates who completed first cycle studies according to the old system of studies andgraduates who completed first cycle studies according to the reformed Bologna system ofstudies. One of the most important objectives of the higher education reforms inspired by theBologna Process was the reorganisation of first cycle studies in order to enable graduates toachieve equal or even better recognition in the labour market compared to graduates who
17 Statistically significant difference exists in comparison with humanities and social and behavioural sciences, engineeringand agriculture, forestry and fishery.18 Statistically significant difference exists in comparison with teacher training and education science, humanities, law,physical sciences, computing, and health.19 Statistically significant difference exists in comparison with teacher training and education science, humanities, law,physical sciences, computing, engineering, and architecture and building.
MeanStd.
deviationStd. error Mean
Std.deviation
Std. error
2007 4,15 1,46 0,08 2007 3,78 1,37 0,082012 4,02 1,53 0,09 2012 3,74 1,42 0,07Prosek 4,09 1,49 0,06 Prosek 3,76 1,40 0,052007 4,86 0,44 0,08 2007 3,86 1,36 0,132012 3,87 1,47 0,20 2012 3,98 1,43 0,18Prosek 4,22 1,30 0,14 Prosek 3,91 1,39 0,112007 4,10 1,45 0,09 2007 4,30 1,13 0,082012 3,89 1,54 0,09 2012 3,92 1,38 0,09Prosek 3,98 1,51 0,06 Prosek 4,12 1,27 0,062007 3,86 1,35 0,07 2007 3,83 1,52 0,132012 3,46 1,50 0,09 2012 3,52 1,66 0,17Prosek 3,68 1,43 0,06 Prosek 3,70 1,58 0,112007 4,07 1,40 0,18 2007 4,54 1,04 0,202012 3,98 1,52 0,19 2012 4,42 1,02 0,21Prosek 4,02 1,46 0,13 Prosek 4,48 1,02 0,142007 3,82 1,28 0,06 2007 4,43 1,10 0,092012 3,46 1,42 0,05 2012 4,29 1,30 0,11Prosek 3,61 1,38 0,04 Prosek 4,36 1,19 0,072007 4,38 1,14 0,09 2007 3,95 1,25 0,272012 4,16 1,40 0,11 2012 4,47 0,98 0,16Prosek 4,27 1,28 0,07 Prosek 4,28 1,11 0,142007 3,95 1,46 0,22 2007 4,33 1,32 0,442012 3,97 1,57 0,29 2012 3,75 1,57 0,26Prosek 3,96 1,49 0,17 Prosek 3,87 1,53 0,232007 3,93 1,56 0,20 20072012 4,07 1,37 0,14 2012 3,71 1,50 0,57Prosek 4,01 1,45 0,12 Prosek 3,71 1,50 0,572007 3,80 1,47 0,25 2007 3,87 1,58 0,332012 4,33 1,34 0,23 2012 3,88 1,62 0,22Prosek 4,06 1,42 0,17 Prosek 3,87 1,60 0,182007 4,17 1,15 0,08 2007 4,03 1,33 0,022012 4,21 1,30 0,08 2012 3,81 1,47 0,03Prosek 4,19 1,23 0,06 Prosek 3,91 1,41 0,02
Teacher training andeducation science
Engineering
Arts Manufacturing
HumanitiesArchitecture andbuilding
Social and behaviouralscience
Agriculture, forestry andfishery
Journalism andinformation
Veterinary
Business andadministration
Health
LawPersonal services (hotel,catering, securityservices, transport)
Life sciencesEnvironmentalprotection
Physical sciences Security services
Mathematics Other
ComputingCONGRADuniversitiesand polytechnics
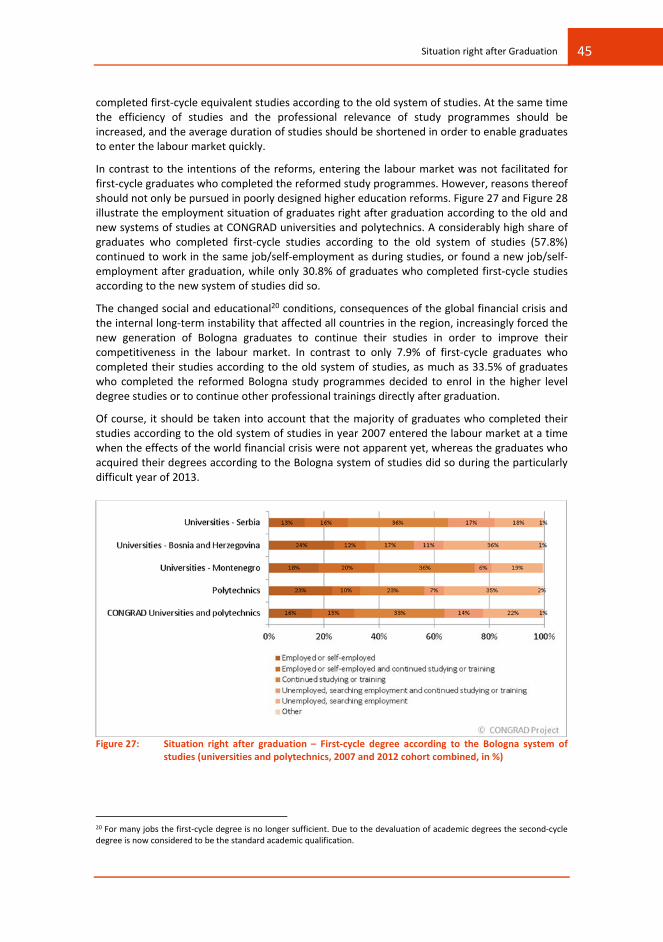
45Situation right after Graduation
completed first cycle equivalent studies according to the old system of studies. At the same timethe efficiency of studies and the professional relevance of study programmes should beincreased, and the average duration of studies should be shortened in order to enable graduatesto enter the labour market quickly.
In contrast to the intentions of the reforms, entering the labour market was not facilitated forfirst cycle graduates who completed the reformed study programmes. However, reasons thereofshould not only be pursued in poorly designed higher education reforms. Figure 27 and Figure 28illustrate the employment situation of graduates right after graduation according to the old andnew systems of studies at CONGRAD universities and polytechnics. A considerably high share ofgraduates who completed first cycle studies according to the old system of studies (57.8%)continued to work in the same job/self employment as during studies, or found a new job/selfemployment after graduation, while only 30.8% of graduates who completed first cycle studiesaccording to the new system of studies did so.
The changed social and educational20 conditions, consequences of the global financial crisis andthe internal long term instability that affected all countries in the region, increasingly forced thenew generation of Bologna graduates to continue their studies in order to improve theircompetitiveness in the labour market. In contrast to only 7.9% of first cycle graduates whocompleted their studies according to the old system of studies, as much as 33.5% of graduateswho completed the reformed Bologna study programmes decided to enrol in the higher leveldegree studies or to continue other professional trainings directly after graduation.
Of course, it should be taken into account that the majority of graduates who completed theirstudies according to the old system of studies in year 2007 entered the labour market at a timewhen the effects of the world financial crisis were not apparent yet, whereas the graduates whoacquired their degrees according to the Bologna system of studies did so during the particularlydifficult year of 2013.
Figure 27: Situation right after graduation �– First cycle degree according to the Bologna system ofstudies (universities and polytechnics, 2007 and 2012 cohort combined, in %)
20 For many jobs the first cycle degree is no longer sufficient. Due to the devaluation of academic degrees the second cycledegree is now considered to be the standard academic qualification.

46 Situation right after Graduation
Figure 28: Situation right after graduation �– First cycle degree according to old system of studies(universities and polytechnics, 2007 and 2012 cohort combined, in %)
When second cycle graduates of CONGRAD universities who completed their studies eitheraccording to the old system of studies or according to the Bologna system of studies areanalysed in combination, it shows that more than half of them continued to work in the job/selfemployment they had prior to graduation or found a job/became self employed right aftergraduation (54.4%).21 The largest share of graduates who continued a job/self employment theyhad prior to graduation or found a new job/became self employed right after graduation can beidentified in the group of Montenegrin university graduates (60.4%). A third of the second cyclegraduates were unemployed right after graduation (30.0%). The situation among Montenegrinuniversity graduates is slightly different (25.7%) and also among the respondents fromuniversities of Bosnia and Herzegovina (37.5%) (Figure 29).
Figure 29: Situation right after graduation �– Second cycle degree according to old and Bolognasystems of studies (universities and polytechnics, 2007 and 2012 cohort combined in %)
21 Due to the small sample size PhD graduates were not included in the analysis.

47First Significant Job
7 First Significant JobIn the graduate survey questionnaire, special attention was paid to the characteristics of the firstsignificant job that graduates of CONGRAD universities and polytechnics found after graduation.The first significant job is defined as the first job after graduation lasting or contracted for longerthan six months. This definition is common in surveys that examine the transition periodbetween studies and employment, because it enables the differentiation between the conceptsof first significant employment and short term temporary jobs (which do not last longer than sixmonths), which graduates often find immediately after graduation, but cannot be considered asrelevant for their future careers. This means that the first employment lasting longer than sixmonths represents the first step in the career of young professionals. Finding the first significantemployment and the duration of the search for such a job are the most important indicators formeasuring the success of study programmes and their adaptation to existing social andeconomic conditions.
Within the period of five years after graduation, the majority of graduates of CONGRADuniversities and polytechnics of the 2007 cohort (74.9%) have succeeded to find (or continue) afirst significant job or self employment, i.e. a job lasting more than six months (Figure 30). It isinteresting to note that the share of graduates of CONGRAD universities and polytechnics in the2007 cohort who were self employed is almost negligible (1.9%, n=91). On the other hand, asmuch as 12.5% of graduates of the 2007 cohort did not acquire any work experience within fiveyears after graduation. 12.6% acquired certain professional experience that could not bedescribed as significant at the time the survey took place, i.e. it did not last or was notcontracted for more than 6 months.
Figure 30: Graduates�’ success in finding first significant job (universities and polytechnics, cohort2007, in %)
Within the 2012 cohort, for graduates who were surveyed in the period 0.5 to 1.5 years aftergraduation, the situation is substantially different. Within this sub sample, almost one half of thegraduates (48.1%) from the moment of graduation until completing the questionnaire did nothave any work experience (Figure 31). More than a third of the graduates of the 2012 cohort(39.2%) became (self )employed or continued to work on a job (self employment) they had priorto graduation. Out of all of respondents of this cohort, 20.7% succeeded in finding newsignificant employment or self employment after graduation, whereas 18.5% of them continuedto work in a job or self employment they had before graduation. More than a tenth of thegraduates of the 2012 cohort (12.7%) acquired work experience that could not be characterisedas significant at the time of the survey, i.e. the respective job did not last or was not contractedfor more than 6 months.

48 First Significant Job
Figure 31: Graduates�’ success in finding first significant job (universities and polytechnics, 2012cohort)
Based on the described differences between the two cohorts of graduates, it can be stated thatfinding the first significant employment or self employment is a challenging and sometimes longlasting process in the countries of the region. With the deepening of the social and economiccrisis in all economic systems of the countries in the region it became even more difficult. Inmany cases, finding the first significant job is postponed due to the prolongation of studies,which is particularly pronounced in the 2012 cohort of graduates who completed reformedBologna study programmes.22 However, the fact that the majority of graduates succeeded tofind employment lasting longer than six months in the period of five years after graduation isencouraging. It is also important to note that between the two cohorts the difference in thenumber of those who were employed during studies and continued to work in the respective jobafter graduation is substantially smaller than expected: In the 2012 cohort, 17.3% of graduateswere in such a situation, whereas this was the case for 21.5% of graduates in the 20017 cohort.Of course, a certain decrease can be noted in the share of graduates who were studying andworking during their course of studies. This is clearly associated with establishing the newBologna system of studies, which makes studying and working in parallel more difficult.
Figure 32 and Figure 33 illustrate the success of graduates who completed their studies atdifferent CONGRAD universities and polytechnics in 2007 or 2012 in finding a first significantemployment. Analysis of the 2007 cohort shows that among CONGRAD universities andpolytechnics significant differences exist only between Montenegrin universities and otherCONGRAD universities and polytechnics. In comparison to other institutions, the share ofgraduates who remain unemployed within the first five years after graduation (17.3%) and ofthose who continued to work in a job they had prior to graduation (29.2%) is much higher forMontenegrin universities. Montenegrin graduates less frequently find new employment lastinglonger than six months (43.2%) and new employment that lasting up to six months (8.1%) (Figure32).
22 As indicated in the previous chapter, 33.5% of graduates who completed first cycle studies according to the Bolognasystem of studies continue to studying or participate in other additional training programmes.

49First Significant Job
Figure 32: Graduates�’ success in finding first significant job by type of institution/country (2007cohort, in %)
With regard to the 2012 cohort, the most pronounced deviations from the CONGRAD averagecan be noted for Montenegrin universities and Serbian polytechnics (Figure 33). The percentageof Montenegrin graduates who were never employed (34.7%) is substantially lower than theaverage percentage. On the other hand, among graduates of polytechnics in Serbia, theunemployment rate is higher (54.6%) than the average. The situation is similar also in the case ofemployment lasting longer than six months. In comparison to the CONGRAD average, a highershare of Montenegrin graduates found a first significant employment (30.3%), whereas on theother hand graduates of Serbian polytechnics had great difficulties to accomplish this task(9.3%).
Figure 33: Graduates�’ success in finding first significant job by type of institution/country (2012cohort, in %)
Taking into account both cohorts, slightly more than a half of CONGRAD university graduates(51.1%) found a first significant job or self employment (or continued to work in a job they hadprior to graduation), i.e. a job lasting or contracted for more than six months in the period after

50 First Significant Job
graduation (Figure 34). Compared to the CONGRAD average university graduates who completedstudy programmes in the fields of informatics and computing (69.8%), mathematics (63.7%) andveterinary (58.5%) were substantially more successful in finding a first significant job, whilegraduates in the fields of life sciences (29.4%) and environmental protection (39.6%) succeededto do so to a significantly lower extent.
As much as 36.0% of university graduates of both cohorts acquired no work experience at allduring the entire period after graduation. Graduates of the following fields of study aredominant among the unemployed graduates: life sciences (59.9%), arts (46.8%) and medicalsciences (45.6%), whereas mathematics (20.6%) and informatics and computing (22.2%) aresignificantly below the CONGRAD average.
Figure 34: Graduates�’ success in finding first significant job by field of study (universities, 2007 and2012 cohort combined, in %)

51First Significant Job
7.1 Strategies for Finding the First Significant JobGraduates of CONGRAD universities and polytechnics who found employment lasting longerthan six months after studying or continued to work at the job they had before graduationlasting longer than six months (both cohorts) were asked how they found their job (n=6,855)23.Answers of respondents demonstrate (Figure 35) that in the regional context of societies andlabour market conditions in Serbia, Bosnia and Herzegovina, and Montenegro, relying on socialnetworks of relatives and friends in finding employment still provides the best results (32.8%±1,1%, 95% confidence interval). This strategy for finding the first significant job was mostcommon among graduates in Serbia, where university graduates found their first employmentthrough personal contacts in 36.0% of cases (±1.4%, 95% confidence interval), and graduates ofpolytechnics in 39.2% of cases (±6.4%, 95% confidence interval). On the other hand only 23.5%(±2.4%, 95% confidence interval) of Montenegrin university graduates found their first significantjob through personal contacts, which is significantly less in comparison with graduates fromother HEIs in the region.
The second most successful job search strategy (entire sample) is reading ads in newspapers andwebsites, with 21.2% (±1.1%, 95% confidence interval) of respondents finding employment thisway. In comparison with other types of institution, this strategy provides the best results amonguniversity graduates in Bosnia and Herzegovina who found employment this way in 29.5% ofcases (± 2.5%, 95% confidence interval), and it is least effective among graduates of Serbianpolytechnics who found employment this way in only 14.9% of cases.
The third most effective strategy for finding the first employment is the job search viainstitutions specialised in counselling and providing support related to employment search(Employment Agencies in Montenegro and in Bosnia and Herzegovina or the NationalEmployment Service in Serbia) with 12.7% (±0.7%, 95% confidence interval) of respondents whofind employment through these institutions. In Montenegro, this is the most common way foruniversity graduates to find employment, with as much as 30.1% (±2.6%, 95% confidenceinterval) of graduates reporting that they found a job with support by the employment agency.Finding the first significant job through the National Employment Service is least frequent amongSerbian university graduates, with only 8.6% of graduates who found first significantemployment this way. Other job search strategies were reported by less than 8% of graduates(e.g. 7.0% through independent contact with employers; 6.2% with help from the highereducation institution, etc.).
23 Self employed graduates are not included in the analysis, because they did not respond to the questions related to jobsearch.

52 First Significant Job
Figure 35: Strategies used for finding first significant job by type of institution/country (2007 and2012 cohort combined, in %)
When analysing successful job search strategies according to field of study (Figure 36), it showsthat personal contacts are most important among graduates who completed their studies in thefollowing fields: architecture and construction; business, management and administration; andagriculture, forestry and fisheries. Reading advertisements, as a strategy to find employment ismost common among those who graduated in mathematics, while finding employment throughstate institutions offering support with job search employment is most frequent amonggraduates in the field of teacher training and education science.

53First Significant Job
Figure 36: Strategies used for finding first significant job by field of study (universities, 2007 and 2012cohort combined, in %)
7.2 Number of Contacted Employers and the Duration of Job SearchGraduates of CONGRAD universities and polytechnics who successfully found a first significantjob on average contacted 6.80 (±0.27, 95% confidence interval) employers before finding therespective job (Table 9). Graduates of the 2007 cohort contacted slightly more employers (7.60±0.02, 95% confidence interval) than graduates of the 2012 cohort, who contacted 6.52 (±0.02,95% confidence interval) employers on average before finding a first significant employment.
Among the graduates in Serbia, Bosnia and Herzegovina, and Montenegro, the average durationof searching for the first significant employment amounted to 5.17 months (±1.74, 95%confidence interval). There are no statistically significant differences between the two cohorts orbetween graduates who studied according to the old system of studies and the Bologna system(F=23.268, p=0.000), i.e. between Serbian universities (M=7.6 months ±0,37 months; 95%

54 First Significant Job
confidence interval), Montenegrin universities (M=4.88 months ±0,49, 95% confidence interval)and universities in Bosnia and Herzegovina (M=5.27 months ±0.53, 95% confidence interval)(Table 10).
On the other hand, when the duration of the search for first significant job is considered, thedifferences between the cohorts (F=48.050, p=0.000) and the systems of study (F=33.539,p=0.000) are quite substantial. Graduates of the 2007 cohort and graduates who completedtheir studies according to the old system of studies on average spent more time on searching fora job in comparison with the 2012 cohort (M=5.67 months for the 2007 cohort, M=4.65 monthsfor the 2012 cohort), and in comparison with graduates who completed their studies accordingto the Bologna system of studies (M=5.45 months for the old system of studies, M=4.52 monthsfor the Bologna system). When comparing CONGRAD universities and polytechnics, significantdifferences in the duration of the job search occur between Serbian universities (M=5.03 months±0.22 months; 95% confidence interval) and polytechnics (M=6.86 ±1.34 months; 95%confidence interval), whereas among other types of institutions and countries there are nostatistically significant differences.
Table 9: First significant job �– Average number of contacted employers by type ofinstitution/country (universities and polytechnics, 2007 and 2012 cohort combined)
Table 10: First significant job �– Average duration of job search by type of institution/country(universities and polytechnics, 2007 and 2012 cohort)
Differences regarding the average duration of job search are also apparent between disciplines.Statistically significant differences exists between the field of teacher training and educationscience and the fields of humanities; social sciences; business, management and administration;law; mathematics; informatics and computing; engineering; architecture and construction; andpersonal services. On the other hand, informatics and computing is statistically different fromthe following fields: teacher training and education science; social sciences; agriculture, forestryand fisheries; andmedical sciences (Table 11).
MeanStd.
deviationStd. error N
Universities Serbia 7,62 12,101 0,191 3.996Universities Bosnia and Herzegovina 5,27 7,578 0,268 799Universities Montenegro 4,88 7,665 0,249 950Polytechnics 5,67 8,907 0,655 185Total all CONGRAD institutions 6,80 10,939 0,142 5.930
MeanStd.
deviationStd. error N
Universities Serbia 5,03 7,207 0,114 3.996Universities Bosnia and Herzegovina 5,41 8,143 0,288 799Universities Montenegro 5,25 7,345 0,238 950Polytechnics 6,86 9,348 0,687 185Total all CONGRAD institutions 5,17 7,442 0,097 5.930

55First Significant Job
Table 11: First significant job �– Average duration of job search in months by field of study(universities, 2007 and 2012 cohort)
7.3 Type and Quality of the First Significant JobThe quality and type of graduates�’ first significant job or self employment is to a great extentdependent on the level of the professional and disciplinary specificity of the study programmethey completed. For this reason, in this part of the report, the analysis will focus on the type andquality of the graduates�’ first significant job with regard to type of institution, and in the case ofuniversity graduates also with regard to different fields of study.
7.3.1 Relation between Studies and First Significant Job
Graduates who succeeded in finding a first significant (self)employment were asked to assess theextent to which their first significant job was related to the contents of the study programmethey completed on a 5 point Likert scale (from 1 �“not at all�” to 5 �“to a very high extent�”).
As illustrated in Figure 37, for the majority of graduates of universities and polytechnics inSerbia, Bosnia and Herzegovina, and Montenegro (71.7% ±1.1%, 95% confidence interval), thefirst significant (self )employment was to a high extent related to their field of study (values 4and 5 on the 5 point scale). The share of graduates whose first significant (self)employment wasnot at all related to their field of study (value 1 on the 5 point scale) is only 9.0% (±1.2%, 95 %confidence interval). Graduates who obtained their degree in 2007 indicated more frequentlythan graduates of the 2012 cohort that their first significant job was to a high extent related totheir field of study (values 4 and 5 on the 5 point scale; 73.4% for the 2007 cohort, 70.1% for the2012 cohort).
MeanStd.
deviationStd. error N
Teacher training and education science 9,23 13,461 0,818 271Arts* 5,32 8,074 1,526 28Humanities 5,92 8,877 0,608 213Social and behavioural science 6,11 8,561 0,458 349Journalism and information 5,42 7,466 1,026 53Business and administration 5,87 7,291 0,325 504Law 5,20 5,706 0,417 187Life sciences 7,63 10,832 1,410 59Physical sciences 5,43 7,006 0,897 61Mathematics 2,73 2,453 0,427 33Computing 3,26 4,354 0,342 162Engineering 4,24 5,794 0,340 291Manufacturing 6,31 10,217 0,997 105Architecture and building 4,28 7,228 0,515 197Agriculture, forestry and fishery 7,34 9,482 0,832 130Veterinary* 4,25 5,275 0,997 28Health 6,64 6,897 0,484 203Personal services* 1,44 1,365 0,341 16Environmental protection* 3,31 5,313 1,474 13Other* 7,58 8,733 2,003 19CONGRADuniversities all fields of study 5,83 8,339 0,154 2.922*n < 30

56 First Significant Job
When comparing universities and polytechnics in different countries, it can be concluded thatthe relation between first significant job and the completed study programme is morepronounced among graduates of universities in Bosnia and Herzegovina and in Serbia, thanamong graduates of Montenegrin universities and Serbian polytechnics
In general, for more than a half of the graduates of CONGRAD universities and polytechnics, thefirst significant job was to a high extent related to the field of study. Only a rather small share ofgraduates stated that their first significant job was not at all related to the discipline theystudied (less than 10.0% in all countries). Only the graduates of Serbian polytechnics do notcomply with this trend. One in five of the polytechnics graduates worked in jobs they assessed asnot at all related to the study contents, and only 33.9% reported that their first significant jobwas to a great extent related to the study contents.
Figure 37: xtent to which the first significant job was related to the field of study by field of study (5point scale, universities, 2007 and 2012 cohort combined, in %)
Taking into account both cohorts statistically significant differences in the share of universitygraduates who indicated that their first significant (self )employment was to a high extentrelated to their field of study (values 4 and 5 on the 5 point scale)24 exist between the following
24 The average for graduates of all fields of study is 77.5% (values 4 and 5 on the 5 point scale).

57First Significant Job
disciplines: informatics and computing (81.0%)25 and medical sciences (88.7%)26; and the fieldsof: business, management and administration (61.8%)27 and social sciences (67.8%)28.
More than a half of the graduates of universities and polytechnics in Serbia, Bosnia andHerzegovina, and Montenegro (both cohorts) who were (self )employed longer than six monthsfound employment in the private sector (53.1% ±1.6%; 95% confidence interval), followed by thestate sector (42.5% ±1.6%; 95% confidence interval). For the private sector, the share ofemployed graduates who obtained their degree at universities (57.0% ±1.4%; 95% confidenceinterval) and polytechnics (65.7% ±6.1%; 95% confidence interval) was above average in Serbia.In the state sector, graduates who obtained their degree at Montenegrin universities (51.9%±1.6%; 95% confidence interval) and universities in Bosnia and Herzegovina (50.5% ±1.4%; 95%confidence interval) were employed more frequently than Serbian graduates (39.1% ±1.1%; 95%confidence interval). Employment in the NGO sector is generally very rare in all three countriesincluded in the CONGRAD survey. It is slightly more common among graduates in Bosnia andHerzegovina (see Figure 38), and among graduates in the following disciplines: journalism andinformation, social sciences and law (see Figure 39). In the private sector, the most frequentlyemployed are graduates of polytechnics and universities in Serbia, whereas employment in theprivate sector is less frequent in Bosnia and Herzegovina and Montenegro. This demonstrates ahigher level of development of the private sector in Serbia.
Figure 38: First significant job �– Sector (universities and polytechnics, 2007 and 2012 cohortcombined, in %)
In comparison with the CONGRAD average, the share of graduates who found employment inthe state sector is pronounced for the following fields of study: teacher training and educationscience (76.8%), medicine (71.3%), life sciences (69.4%), physics and chemistry (67.3%),mathematics (64.1%), humanities (58.5%), arts (50.0%), law (48.5%) and agriculture, forestry andfisheries (45.6%).
Graduates who found employment in the private sector, predominantly completed their studiesin the fields business, management and administration (72.0%), architecture, construction andtransport (72.0%), manufacturing and processing (71.0%), informatics and computing (68.5%),
25 There is a statistically significant difference in comparison with humanities, business, management and administration,engineering and agriculture, forestry and fisheries.26 There is a statistically significant difference in comparison with humanities, business, management and administration,engineering and agriculture, forestry and fisheries.27 There is a statistically significant difference in comparison with humanities, informatics and computing, veterinary, medicalsciences and personal services.28 There is a statistically significant difference in comparison with law, informatics and computing, veterinary and medicalsciences.

58 First Significant Job
veterinary (66.1%) and engineering (60.8%) (see Figure 39). Graduates who least frequentlyfound employment in the private sector are those who studied teacher training and educationscience (19.3%), life sciences (23.5%),medicine (26.3%) and physics and chemistry (31.3%). This isnot surprising since health and education are dominant in the public sector.
Figure 39: First significant job �– Sector by field of study (universities, 2007 and 2012 cohort combined,in %)
The largest number of graduates of CONGRAD universities and polytechnics in Serbia, Bosnia andHerzegovina and Montenegro found their first significant employment in the branch ofeducation (20.6%). Among them, the graduates of universities in Bosnia and Herzegovina are themost numerous in this branch (29.9%). A significant share of graduates found their firstsignificant job in the branch of information and communication29 (10.6%) and the branch ofprofessional, scientific, innovative and technical activities30 (9.3%). Other important branches forthe graduates�’ first significant employment are financial and insurance activities (7.1%), healthand social protection (6.9%), wholesale and retail trade and repair of motor vehicles andmotorcycles (5.9%), construction (5.8%), other service activities (5.7%) and public administrationand defence (5.4%). In all other branches of activities the share of graduates who found firstsignificant jobs (both cohorts) is lower than 5% (see Figure 40).
29 Graduates of Serbian universities (11.3%) and polytechnics (17.0%) are dominant in this category.30 Graduates of Serbian unviersities (10.9%) and polytechnics (10.4%) are dominant in this category.

59First Significant Job
When comparing universities in Serbia, Bosnia and Herzegovina, and Montenegro, andpolytechnics in Serbia, it shows that in the branches of information and communication andconstruction polytechnics graduates are employed to a higher extent than university graduates.In the branch of education though polytechnics graduates are employed much less, which couldbe expected due to their educational profiles.
Figure 40: First significant job �– Branches of economic activities (universities and polytechnics, 2007and 2012 cohorts combined, in %)

60 First Significant Job
Figure 41: First significant job �– Branches of economic activities by field of study (universities, 2007and 2012 cohort combined, in %)
The distribution of branches of activities according to fields of study falls well into the graduates�’professional profiles (Figure 41). This is supported by the earlier finding that most graduatessucceeded in finding employment that is to a high extent or to a very high extent related to theirfield of study.
In general, it can be concluded that a greater variety of branches in which graduates find jobscan be found within certain disciplines, such as social sciences, whereas graduates in the fields of

61First Significant Job
engineering and health find their first significant job in rather restricted areas or branches (seeFigure 8).
For example, medical professionals are employed predominantly in the branch of human healthand social work activities (81.6%), journalists in the branch of information and communication(62.0%), farmers and similar vocations in the branch of agriculture, forestry and fisheries (52.0%),architects in the branch of construction (55.0%). For other professional profiles the relation withcertain branches of activities is not as strong; e.g. lawyers, graduates of business, managementand administration (even though they can work in different sectors of business and economy),and graduates in the field of arts.
With regard to the jobs performed by graduates of CONGRAD universities and polytechnics inSerbia, Bosnia and Herzegovina, and Montenegro, most respondents indicated positions thatusually require a high level of professional qualifications. Most of them succeeded in findingemployment in positions that usually require higher education (see Figure 42). Most of thegraduates who found a first significant employment (n=6,064) were employed as engineer,technician or associate professional (38.2%), and professionals (27.2%), whereas 19.0% workedas clerical support workers in their first job. With regard to the CONGRAD average, positions asclerical support worker were most frequent among Montenegrin university graduates (30.7%).As expected, for the jobs as engineers, technicians or associate professionals, graduates ofSerbian polytechnics were hired most frequently, since polytechnics offer different kinds ofprofessional technical knowledge (56.9%). Graduates of Serbian universities (40.5%) were alsorather frequently employed in this field. For jobs of professionals, graduates of universities inBosnia and Herzegovina (29.9%) and Serbian university graduates (28.7%) were employedslightly more frequently compared to the average. Lower employment positions which usuallydo not require a higher education, i.e. occupational positions classified in the groups of serviceand sales workers, craft and related trade workers, plant and machine operators and assemblersor elementary occupations, are present only to a negligible extent. This confirms once more thestrong link between professional and disciplinary specificity of studies and subsequentemployment (see Figure 42).
Figure 42: First significant job �– Occupations (universities and polytechnics, 2007 and 2012 cohortcombined, in %)
As illustrated in Figure 43, there is a strong association between the field of study and thebranch of activities in which graduates started their first significant employment. As

62 First Significant Job
professionals, the graduates of the following fields of study were most frequently employed:medicine (76.6%), humanities (68.0%), teacher training and education sciences (64.8%),mathematics (64.3%), veterinary (63.8%), arts (62.8%), and journalism and information (40.7%).In the position of technician and associate professional, graduates of the following disciplineswere most frequently employed: engineering (82.5%), architecture and construction (80.8%),manufacturing and processing (74.5%), informatics and computing (68.2%), agriculture (59.9%),physics and chemistry (50.4%) and life sciences (48.1%). Clerical support workers were mostlygraduates of the following fields of study: social sciences (41.0%), law (39.5%), business,management and administration (37.6%) and journalism and information (26.7%).
Figure 43: First significant job �– Occupations by field of study (universities, 2007 and 2012 cohortcombined, in %)

63First Significant Job
7.4 Quality of the First Significant JobJob quality is a concept that can be measured in various ways. In the present report the qualityof jobs is assessed based on the following indicators: (1) security of employment measured bythe type of contract (type of contract and its duration); (2) wage level measured by the averagenet salary, and (3) extent to which acquired knowledge and skills are required in the firstsignificant job. These elements related to the quality of the first significant job are presentedseparately for graduates of CONGRAD universities and polytechnics in Serbia, Bosnia andHerzegovina and Montenegro.
7.4.1 Type of Contract in the First Significant Job
Figure 44 and Figure 45 provide information on the working contract graduates had in their firstsignificant job �– both regarding the duration of the contract (permanent contract or fixed termcontract) and the type of contract.
Usually, graduates of CONGRAD universities and polytechnics started their professional careerby signing a regular working contract (84.4% ±1.1%, 95% confidence interval). Slightly moregraduates started their career with a fixed term contract (50.2% ±1.1%, 95% confidence interval)than by signing a permanent contract (45.3%). A very small share of graduates was selfemployed (4.5%). In comparison with the CONGRAD average, permanent contracts are morefrequent among the graduates of Serbian universities (48.2% ±1.4%, 95% confidence interval)and Serbian polytechnics (62.2% ±6.1%, 95% confidence interval). Substantially lower is theshare of Montenegrin university graduates with a permanent working contract for the firstsignificant job (29.4% ±2.7%, 95% confidence interval). In comparison with the CONGRADaverage, fixed term contracts at the beginning of the career are more frequent amongMontenegrin university graduates (66.7% ±2.6%, 95% confidence interval), whereas they arebelow average among graduates of Serbian universities (47.0% ±1.3%, 95% confidence interval)and Serbian polytechnics (29.6% ±6.2%, 95% confidence interval) (see Figure 44).
Figure 44: First significant job �– Duration of the working contract (universities and polytechnics, 2007and 2012 cohort combined, in %)
For the entire sample, contracts for services and contracts for temporary jobs in the firstsignificant job are rare (10.2% in total). Still, it should be noted that these types of nonpermanent working contracts are not equally distributed across countries and institutions, eventhough the differences are quite small. Contracts for services are more frequent among

64 First Significant Job
Montenegrin university graduates (7.5%) in comparison with the CONGRAD average31, whereascontracts for temporary jobs are slightly more frequent among graduates of polytechnics(7.2%)32 (see Figure 45).
Figure 45: First significant job �– Type of contract (universities and polytechnics, 2007 and 2012 cohortcombined, in %)
Graduates of certain fields of study started their professional career with a certain type ofcontract. For example, in comparison with the CONGRAD average, fixed term contracts weremore frequently signed by graduates who completed their studies in life sciences (71.6%), law(65.7%), humanities (60.5%), journalism and information (56.9%), social sciences (56.1%),medicine (54.8%), physics and chemistry (53.3%), teacher training and education science (51.9%),manufacturing and processing (51.6%). Graduates who completed a study programme ininformatics and computing (62.5%), mathematics (54.0%), veterinary (54.1%), business,management and administration (51.5%), agriculture, forestry and fishery (48.2%), architectureand construction (47.7%), and manufacturing and processing (46.5%) signed most frequentlypermanent contracts (see Figure 46).
31 CONGRAD average for contracts for services is 5.5% (n=337).32 CONGRAD average for contracts for temporary jobs is 4.7% (n=290).

65First Significant Job
Figure 46: First significant job �– Duration of the contract by field of study (universities andpolytechnics, 2007 and 2012 cohort combined, in %)
7.4.2 Salary in the First Significant Job
Figure 47 and Table 12 provide information on the average monthly net salary graduates ofCONGRAD universities and polytechnics earned in their first significant job (n=5,672). Based onthe average net salary in EUR, it can be concluded that graduates of universities in Serbia, Bosniaand Herzegovina, and Montenegro have similar average net salaries amounting to 406.17 EUR(±12.1 EUR, 95% confidence interval) in Serbia, 406.73 EUR (±18 EUR, 95% confidence interval) inBosnia and Herzegovina, and 406.07 EUR (±25.5 EUR, 95% confidence interval) in Montenegro.As expected, graduates of polytechnics earned net salaries below average (346.16 EUR ±53.9EUR, 95% confidence interval) (see Table 12).

66 First Significant Job
Figure 47: First significant job �– Average net salary in EUR (universities and polytechnics, 2007 and2012 cohort combined)
Table 12: First significant job �– Average net salary in EUR (universities and polytechnics, 2007 and2012 cohort combined)
Figure 48 and Table 13 show the average monthly net salary of university graduates in Serbia,Bosnia and Herzegovina, and Montenegro according to the field of study (n=5,241). The highestsalaries in the first significant job were reported by respondents who obtained their degree inthe following fields of study: business, management and administration (409.76 EUR), physicsand chemistry (422.95 EUR), architecture and construction (430.18 EUR), life sciences (433.69EUR), medicine (490.96 EUR), engineering (501.32 EUR) and informatics and computing (553.16EUR). Salaries below the average level were earned by graduates in the following disciplines:mathematics (405.46 EUR), manufacturing and processing (397.89 EUR), social sciences (386.03EUR), environmental protection (382.63 EUR), arts (377.47 EUR), agriculture, forestry andfisheries (334.36 EUR), humanities (330.22 EUR), teacher training and education science (325.07EUR), personal services (321.86 EUR), journalism and information (298.53 EUR), law (287.60 EUR)and veterinary (278.80 EUR).
MeanStd.
deviationStd. error Median N
Universities Serbia 406 380 6 354 3.764Universities Bosnia and Herzegovina 407 256 9 383 753Universities Montenegro 406 406 13 350 972Polytechnics 346 372 28 292 183Total all CONGRAD institutions 404 370 5 354 5.672

67First Significant Job
Figure 48: First significant job �– Average net salary in EUR by field of study (universities, 2007 and2012 cohort combined)
68 First Significant Job
Table 13: First significant job �– Average net salary in EUR by field of study (universities, 2007 and2012 cohort)
The median salaries earned in the first significant job were, for all fields of study except forteacher training and education science, lower than the arithmetic mean of the graduates�’salaries. This implies that salaries some graduates earned were higher than the average, whichincreases the gap between the arithmetic mean and the median (see Table 13).
7.4.3 Utilisation of Acquired Knowledge and Skills in the First Significant Job
When analysing the extent to which knowledge and skills acquired during studies were requiredin the first significant job, it shows that more than a half of the graduates of CONGRADuniversities and polytechnics in Serbia, Bosnia and Herzegovina, and Montenegro (53.8%,n=6,151) were able to use the knowledge and skills they acquired during studies to a high extentin their first significant job (values 4 and 5 on the 5 point scale) (see Figure 49). This is mostcommon among graduates who completed study programmes in the field of veterinary, in whichno respondent awarded the lowest mark (value 1).
Taking into account both cohorts, there are statistically significant differences between fields ofstudy regarding the extent to which knowledge and skills acquired during studies are used in thefirst significant job. Graduates of the following disciplines stated more frequently than theaverage that the respective skills were required to a high extent (values 4 and 5 on the 5 point
MeanStd.
deviationStd. error Median N
Teacher training and education science 325 281 13 345 438Arts 377 340 39 300 77Humanities 330 294 14 310 450Social and behavioural science 386 307 12 342 605Journalism and information 299 214 23 300 89Business and administration 410 334 11 354 967Law 288 201 12 283 303Life sciences 434 341 39 364 76Physical sciences 423 328 29 381 131Mathematics 405 245 32 392 57Computing 553 340 19 496 319Engineering 501 458 19 408 578Manufacturing 398 247 21 372 137Architecture and building 430 299 16 354 353Agriculture, forestry and fishery 334 279 20 300 193Veterinary 279 214 28 266 57Health 491 638 38 443 278Personal services 322 208 36 346 34Environmental protection 383 236 42 341 32Security services* 102 102 1Other 566 1145 141 310 66CONGRADuniversities all fields of study 405 375 5 354 5.241*n < 30

69First Significant Job
scale) in the first significant job33: medical sciences (69.2%)34, education and education sciences(66.8%)35, humanities (65.4%)36 and informatics and computing (62.1%)37. In the following fieldsof study the share of those stating that skills acquired upon graduation were required in the jobto a high extent was below average: business, management and administration (45.8%)38, socialsciences (44.9%)39, and journalism and information (41.3%)40 (see Figure 49).
Figure 49: Extent to which knowledge and skills acquired during studies were required in firstsignificant job, by field of study (5 point scale, universities, 2007 and 2012 cohortscombined, in %)
33 Average is 54.4% (for values 4 and 5 on the 5 point scale).34 Statistically significant differences exist with regard to the following fields: social sciences, journalism and information,business, management and administration, law, production and manufacturing, engineering, architecture and constructionand agriculture, forestry and fisheries.35 Statistically significant differences exist with regard to the following fields: social sciences, journalism and information,business, management and administration, engineering and architecture and construction.36 Statistically significant differences exist with regard to the following fields: social sciences, journalism and information,business, management and administration and engineering.37 Statistically significant differences exist with regard to social sciences, journalism and information, business, managementand administration and engineering.38 Statistically significant differences exist with regard to education and educational sciences, arts, humanities, physics andchemistry, informatics and computing andmedical sciences.39 Statistically significant differences exist with regard to the following fields: education and educational sciences, arts,humanities, physics and chemistry, informatics and computing andmedical sciences.40 Statistically significant differences exist with regard to the following fields: education and education sciences, humanities,informatics and computing andmedical sciences.

70 First Significant Job
The utilisation of professional knowledge acquired during studies in the first significant job ishighest among respondents who were employed as professionals41, followed by those who wereemployed as engineers, technicians and associate professionals42, and managers (chiefexecutives), senior officials and legislators43, clerical support workers44 and those working incrafts and related trade.
41 Variance analysis shows that these respondents use the knowledge acquired during studies in their jobs more thanrespondents who were employed as: (a) managers (chief executives), senior officials and legislators, (b) engineers,technicians and associate professionals, (c) clerical support workers, (d) service and sales workers, (e) plant and machineoperators, and assemblers and (e) those working at elementary occupations.42 Variance analysis shows that these respondents use the knowledge acquired during studies in their job less thanrespondents who were employed as professionals, and more than respondents who were employed as: (a) managers (chiefexecutives), senior officials and legislators, (b) clerical support workers, (c) service and sales workers, (d) plant and machineoperators, and assemblers, and (e) those working at elementary occupations.43 Variance analysis shows that these respondents use the knowledge acquired during studies in their job less thanrespondents who were employed in the following positions: (a) professionals, and (b) engineers, technicians and associateprofessionals; on the other hand, they use this knowledge more than the respondents who worked as: (a) clerical supportworkers, (b) service and sales workers, (c) plant and machine operators, and assemblers, and (d) those working atelementary occupations.44 Statistical analysis shows that these respondents on the one hand use the knowledge acquired during studies in the workplace less than those respondents who were employed as: (a) professionals, (b) engineers, technicians and associateprofessionals, and (c) managers (chief executives), senior officials and legislators, and on the other hand they use thisknowledge more than respondents who were employed as: (a) service and sales workers, (b) plant and machine operators,and assemblers, and (c) those working at elementary occupations.

71Current Career and Work Status
8 Current Career and Work StatusAs explained in the introduction to the chapter on graduates�’ careers, one of the objectives ofthe CONGRAD project was to find out more about the graduates�’ transition from completingtheir studies to starting their professional careers. This was achieved by analysing the firstsignificant job after graduation. The first job lasting or contracted for more than six monthsrepresents the first career step, which is usually followed by a second phase of obtainingconcrete and job specific expertise. During this period professional career patterns begin todevelop. Comparative research shows that this second phase usually ends four to five years afterthe starting the first significant job (Allen & Van der Velden 2009, Teichler 2009). Therefore theCONGRAD graduate survey does not only monitor the first significant job or self employment,but also the work status and the job graduates had at the time of the survey (March to July2013), i.e. depending on the cohort one year and five years after graduation respectively. Theassumption is that graduates of the 2007 cohort who graduated five years prior the survey, aftera period of job search and shorter engagements or probation periods, at the time of the surveywere in the second career phase. Analysis of the current work status of graduates according tocohort shows that certain patterns exist (see Figure 50).
Figure 50: Current job and career status (universities and polytechnics, 2007 and 2012 cohorts)
Figure 50 shows the graduates�’ work and career status at the time of the survey. Most graduatesof the 2012 cohort had no work experience and were actively searching for their first job (43.4%±1.04%, 95% confidence interval) or were inactive, i.e. unemployed or not looking foremployment (8.4% ±0.6%, 95% confidence interval). A small share of graduates of the youngercohort (7.8% ±0.57%, 95% confidence interval) had been employed longer than six months aftergraduation, even though they were unemployed at the time of the survey. Among the graduateswho were employed at the time of the survey, only one in ten had changed the company or theinstitution they worked in (11.3% ±0.63%, 95% confidence interval), whereas others still workedin the same job, i.e. their first significant job.
Among the graduates of the 2007 cohort, the situation is substantially different. As expected, inthe second phase of their careers certain career mobility is already noticeable. A considerableshare of graduates made career progress within a certain company (job in the samecompany/institution, but in a different position) or they changed the company/institution. As thesurvey results show, almost four in five graduates who completed their studies five years prior tothe survey were either employed or self employed. 41.7% (±1.44%, 95% confidence interval) ofthose who had a job at the time of the survey had changed either their position in thecompany/institution or the company/institution they worked in. On the other hand 12.5%(±0.96%, 95% confidence interval) still had no work experience. The number of inactive, i.e. not

72 Current Career and Work Status
employed or self employed and not actively looking for a job, is negligible in this cohort. Also thenumber of self employed graduates is quite small and amounts to only 3.3% (±0.52%, 95%confidence interval).
Based on the previously presented results, it can be concluded that the analysis of the type andquality of jobs performed by graduates of different types of HEIs in Serbia, Bosnia andHerzegovina, and Montenegro should be restricted to graduates of the 2007 cohort. Most ofthem successfully finalised the job search process, acquired first work experiences, andcompleted the transition from higher education to the world of work. The graduates�’ jobs fiveyears after graduation are an important indicator of typical jobs and careers of graduates ofcertain fields of study. Bearing this in mind, the following analysis of the current employment orself employment shall be based exclusively on the responses by the graduates of the oldercohort. In accordance with the descriptive nature of this report, general results and statisticallysignificant differences between countries, types of institution, degree levels and fields of studyare illustrated.
8.1 Differences between Graduates according to Type of Institutionand Degree Level
The following results demonstrate the current work and career status of graduates five yearsafter graduation with regard to the type of institution they graduated from and the country inwhich the HEI is located (Figure 51). The type of institution and the country where the graduatescompleted their studies significantly influence their employment and career status ( 2
18, 4512 =8.78, p<0.01, V=0.08), but the effect is rather weak. Differences between certain types ofinstitution (for p<0.05) are statistically significant in some aspects of career mobility. Differencesbetween HEIs in terms of graduates who five years after graduation worked for the samecompany or organisation but in a different position are not statistically significant. On the otherhand, changes of company or institution the respondents worked in during the first five yearsafter graduation are significantly more frequent among Serbian university graduates incomparison with graduates of universities in Bosnia and Herzegovina. Self employment is mostfrequent among graduates of polytechnics, but statistically significant differences exist only withregard to graduates of universities in Bosnia and Herzegovina. The share of currentlyunemployed graduates, and graduates who had a first significant job but are currentlyunemployed and searching for a job, is highest among graduates of universities in Bosnia andHerzegovina, whereas it is lowest among Montenegrin university graduates. Statisticallysignificant differences of currently unemployed exist only between the graduates of universitiesin Bosnia and Herzegovina and Montenegrin university graduates. Long term unemployment, i.e.the share of graduates who were unemployed five years after graduation and had no workingexperience, even though they were looking for a job, is lowest among Serbian universitygraduates (11.6%), and highest among Montenegrin university graduates (15.6%). Differencesbetween these subgroups of graduates are small, but statistically significant (p<0.05). Generallyspeaking, at the level of the CONGRAD sample the total unemployment rate five years aftergraduation (current and long term unemployment combined), amounts to 21%. Taking intoaccount similar comparative studies in Europe (e.g. HEGESCO and REFLEX project; Allen & Vander Velden 2009)45 the unemployment rate among graduates in Serbia, Bosnia and Herzegovina,and Montenegro is among the highest in Europe.
45 It should be pointed out that the comparative graduate surveys within REFLEX and HEGESCO projects wereconducted before the start of the global financial and economic crisis, which in most countries resulted in

73Current Career and Work Status
Figure 51: Current job and career status five years after graduation (universities and polytechnics,2007 cohort, in %)
Between graduates of first cycle degrees (academic or professional studies) and graduates ofsecond cycle degrees (magister, specialist and master studies)46, there are no statisticallysignificant differences in terms of career and work status five years after graduation. Graduatesof both degree levels are distributed to a similar percentage between rather similarly across thecategories of employed, changed employers and companies, self employed, currentlyunemployed and long term unemployed. The only statistically significant differences occuramong graduates who changed their jobs but remained in the same company or organisation. Inthis category there are significantly more graduates who completed second cycle degrees thangraduates of first cycle degrees. This indicates that second cycle degrees may ensure careerprogress and promotion within the company to some extent, but generally speaking even higherlevel degrees do not prevent temporary or long term unemployment after graduation.
8.2 Differences in Current Work and Career Status Five Years afterGraduation with Regard to Fields of Study at Universities
The field of study in which CONGRAD university graduates obtained their degree significantlyaffects the employment situation after graduation. Due to differences between supply anddemand for experts of various professional profiles in Serbia, Bosnia and Herzegovina, andMontenegro the field of study proves to be one of the reasons for the difficulties in findingemployment. The field of study has a statistically significant and medium sized effect on thework and career status of university graduates five years after graduation ( 2
85,4088=453.5,p<0.01, V=0.15)47. Figure 52 illustrates the differences in graduate work and career status fiveyears after graduation with regard to field of study in which graduates of the 2007 cohortcompleted their studies. The data are ranked according to share of employed and self employedgraduates. The total employment level is highest (over 80%) among graduates who completed
the increase of unemployment and affected the careers of young professionals with higher educationdegrees.46 Due to the small sample size PhD graduates are not included in the analysis.47 Due to the small sample size graduates who completed their studies in the field of personal services arenot included in the analysis.

74 Current Career and Work Status
their studies the following fields: computer science, engineering and engineering trades48,mathematics and statistics, architecture and building (including studies of transport), andbusiness and administration. The highest proportion of long term unemployment aftergraduation (over 20%) is reported for graduates of life sciences (biology and environmentalscience),medical sciences, and graduates of other fields of study (dominated by sport studies).
Figure 52: Current job and career status five years after graduation by field of study (universities,2007 cohort, in %)
Self employment is pronounced (over 5%) only among lawyers, veterinarians, journalists andengineers (field of manufacturing and processing). Career stability during the first five years oftheir career, i.e. employment in the same position with the same employer, is especiallypronounced among graduates of teacher training and education science and graduates ofmathematics and statistics and physical sciences, who are predominantly employed in the statesector. Changing companies and institutions during the first five years after graduation is mostcommon (over 40% of graduates) among graduates who completed study programmes in the
48 According to ISCED engineering and engineering trades includes most study programmes of mechanical engineering andvehicle production as well as the field of energy, electronics and automation, and chemical engineering.

75Current Career and Work Status
fields of architecture and building, computing, business and administration, and journalism andinformation.
8.3 Where Do Graduates Find Employment Five Years afterGraduation
Five years after graduation, the graduates from CONGRAD universities are almost equallyemployed in the state and private sectors, whereas almost two thirds of graduates of Serbianpolytechnics work in the private sector. A statistically significant difference in comparison withall other groups of institutions exists in favour of employment in the state sector amonggraduates of universities in Bosnia and Herzegovina with regard to Serbian graduates(universities and polytechnics). In comparison with Montenegrin university graduates, there areno statistically significant differences (Figure 53). The respective differences may to a certainextent be explained by the different structures of the countries�’ economies and a somewhatgreater presence of employment opportunities in the private sector in Serbia. Having in mind thehigh share of graduates who completed study programmes intended for future teachers anddoctors in the CONGRAD sample the rather high representation of the state sector is also notsurprising.
Figure 53: Current job five years after graduation �– Sector (universities and polytechnics, 2007 cohort,in %)
As illustrated in Figure 54, graduates who just completed study programmes for teachers,medical professionals and lawyers are represented above the average level in the state sector.On the other hand, in the private sector veterinarians, managers and different engineers areemployed above the average level. Employment in the NGO sector is present to a significantextent only among graduates of journalism and information and social sciences.

76 Current Career and Work Status
Figure 54: Current job five years after graduation �– Sector by field of study (universities, 2007 cohort,in %)
Five years after graduation, the largest share of CONGRAD graduates work in the followingbranches: education (22.9% ±1.45%, 95% confidence interval), information and communication(9.9% ±0.52%, 95% confidence interval), human health and social work (8.7% ±0.98%, 95%confidence interval), finance and insurance (8.7% ±0.98%, 95% confidence interval), professional,scientific and technical activities (8.6% ±0.97%, 95% confidence interval), public administration(6% ±0.82%, 95% confidence interval), manufacturing (6% ±0.82%, 95% confidence interval),wholesale and retail trade (5.2% ±0.39%, 95% confidence interval) and construction (5% ±0.37%,95% confidence interval). Other branches of economic activities are represented with less than5%. This employment structure according to branches is a reflection of the economic structure inSerbia, Bosnia and Herzegovina and Montenegro. The work force in the public sector and in theservice industry is composed to a large extent of employees with higher education degrees.Substantial differences between countries or types of institutions with regard to theemployment structure of graduates in different activity branches occur only rarely. Incomparison with graduates in Serbia and Bosnia and Herzegovina, Montenegrin universitygraduates are significantly less represented in the manufacturing industry. On the other hand,Montenegrin graduates work more frequently in the branch of accommodation and food serviceactivities. The share of graduates who five years after graduation worked in the branch ofinformation and communication and in the branch of financial and insurance activities issignificantly lower among graduates in Bosnia and Herzegovina in comparison with othergraduates. At the same time compared to other countries, employment in education issubstantially higher in Bosnia and Herzegovina. Employment in public administration sector ispronounced among Montenegrin university graduates (see Figure 55).

77Current Career and Work Status
Figure 55: Current job five years after graduation �– Branches of economic activities (universities andpolytechnics, 2007 cohort, in %)
The analysis of the employment structure according to economic activity branches and fields ofstudy demonstrates the orientation towards certain professions in specific economic activitybranches, which usually employ graduates of particular professional profiles. Most fields of studyare dominated by one or two economic activity branches within which the majority of graduateswith certain professional profiles are employed. This shows the segmentation of the work forcewith higher education according to professions. Greater variety in terms of economic activitybranches in which graduates find employment exists only in the case of graduates of thefollowing disciplines: law, social sciences and business and administration (see Figure 56).

78 Current Career and Work Status
Figure 56: Current job five years after graduation �– Branches of economic activities by field of study(universities, 2007 cohort, in %)
When analysing the occupational categories of graduates five years after graduation (Figure 57),it can be concluded that more than 80% of university graduates in Serbia and Bosnia andHerzegovina and 70% of Montenegrin university graduates work in jobs belonging to higheroccupational categories according to the International Standard Classification of Occupations(ISCO 08): manager, senior official and legislator; professional; engineer, technician or associateprofessional. Statistically significant differences exist between university graduates andgraduates of polytechnics, who in accordance with the professional and vocational nature of

79Current Career and Work Status
their studies work less frequently as professionals, and more frequently as engineers, techniciansand associate professionals. In addition, polytechnics graduates in comparison with universitygraduates are represented more frequently in the lower occupational categories, whichgenerally do not require higher education, such as service and sales workers and elementaryoccupations. When comparing current job and first significant job it shows that five years aftergraduation the proportion of graduates in the position of manager (chief executive), seniorofficer and legislator which demonstrates progress in the work place among a certain number ofgraduates (14.8% ± 1.25%, 95% confidence interval in comparison with 7.5% on the first job) isalmost twice as high.
Having a position as clerical worker is significantly more frequent among Montenegrin universitygraduates, which is in accordance with the greater share of employment in the stateadministration sector among this group of graduates. On the other hand, five years aftergraduation only few university graduates worked in jobs not requiring academic qualifications,such as service and sales workers and elementary occupations. Polytechnics graduates worked insuch jobs somewhat more frequently. In total, these occupations are present among only 4.5%of graduates for all types of institutions (± 0.73%, 95% confidence interval). Five years aftergraduation, the percentage of graduates still worked in a first significant job not requiring highereducation qualifications, has been nearly halved. It can be concluded that respondents usuallydid not work in such first jobs for a longer period, but consider this to be a transitory solutionuntil they find an adequate job that requires higher education qualifications.
Figure 57: Current job five years after graduation �– Occupations (universities and polytechnics, 2007cohort, in %)
Five years after graduation, graduates of manufacturing and processing, business andadministration, and veterinary in comparison with graduates of other fields of study were moreoften employed in management positions. The category of professionals is dominated by doctorsand teachers, whereas occupations not requiring higher education (service and sales workers,elementary occupations and agricultural workers) are more frequent among school teachers,pedagogues, veterinarians and those who completed their studies in the field of services andsport studies (Figure 58).

80 Current Career and Work Status
Figure 58: Current job five years after graduation �– Occupations by field of study (universities, 2007cohort, in %)
8.4 Quality of Graduate Jobs Five Years after GraduationPrevious analysis showed that five years after graduation most graduates of universities andpolytechnics in Serbia, Bosnia and Herzegovina, and Montenegro were employed or selfemployed in economic activity branches that can be considered as adequate to the level andtype of qualifications they possess. There is a significant association between fields of study onthe one hand and occupations and economic activity branches on the other hand. Thisrelationship is strongly influenced by the concept of profession/vocation that study programmesare based on, and which significantly affects the job search and future careers of graduates.
The association between field of study and type of occupation of graduates five years aftergraduation does not necessarily mean that all graduate jobs are of good quality. The definition ofa good and high quality job is the subject of theoretical and methodological debate in differentscientific disciplines (see Green 2006). Most researchers agree that job quality is amultidimensional concept which cannot be measured by only one indicator. More appropriately,different indicators such as wage level, work organisation, work autonomy, job security, skillutilisation, type of contract, possibility to combine work with family obligations, etc. have to be

81Current Career and Work Status
acknowledged. In the following overview of results related to the current work situation ofgraduates, the job quality shall be presented with regard to four selected indicators:
Type of contract and work engagementWage level five years after graduationUtilisation of knowledge and skills acquired during studies in current jobOverall satisfaction with current work situation
8.4.1 Type of Contract and Work Engagement
Generally speaking for all CONGRAD institutions, about two thirds of employed graduates (65.7%±1.61%, 95% confidence interval) had permanent contracts five years after graduation. This typeof contract is significantly less frequent in first significant job (45.3% ±1.2%, 95% confidenceinterval). This difference confirms that five years after graduation the transition phase fromstudies to concrete professional careers is over for most graduates. Over time the percentagesof fixed term and/or temporary employment decrease. Fixed term contracts which imply jobinsecurity and a generally weaker job quality are most frequent among graduates of life sciences(55.5%), humanities (45.6%), and physics and chemistry (43.8%). Differences between types ofinstitution in this respect are statistically significant only between Montenegrin universitygraduates and other institutions in Serbia and Bosnia and Herzegovina: Among Montenegringraduates fixed term contracts were more frequent than among graduates from the other twocountries. This indicates a lower average quality of graduate employment with regard to theduration of the employment contract. Self employment and other types of contracts, such ascontracts for temporary jobs and services are very rare among the group of graduates whocompleted their studies five years prior to the survey. Only 2.8% (±0.56%, 95% confidenceinterval) of graduates are self employed five years after graduation. These are mostly lawgraduates who work as lawyers, and graduates from the field of sport studies. Differencesbetween countries, institutions and graduates of different fields of study can be explained in thebest possible way when the application of fixed term contract is analysed according certainbranches of economic activity. Figure 60 shows that fixed term contracts are most frequent inthe education branch. The fact that teachers work as temporary replacements explains the largenumber of fixed term contracts among graduates in the fields of humanities and natural sciencessince they mostly work as teachers. Fixed term contracts are also pronounced in the branch ofaccommodation and food service activities and in public administration, in which Montenegrinuniversity graduates are employed more often than graduates from other countries and types ofinstitution.

82 Current Career and Work Status
Figure 59: Current job five years after graduation �– Type of contract by field of study (universities,2007 cohort, in %)
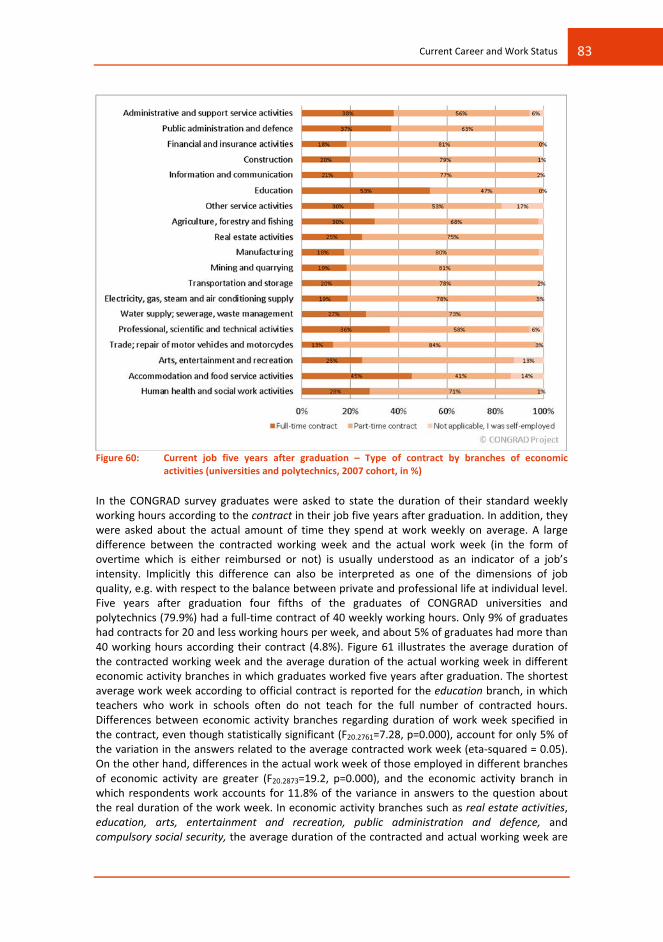
83Current Career and Work Status
Figure 60: Current job five years after graduation �– Type of contract by branches of economicactivities (universities and polytechnics, 2007 cohort, in %)
In the CONGRAD survey graduates were asked to state the duration of their standard weeklyworking hours according to the contract in their job five years after graduation. In addition, theywere asked about the actual amount of time they spend at work weekly on average. A largedifference between the contracted working week and the actual work week (in the form ofovertime which is either reimbursed or not) is usually understood as an indicator of a job�’sintensity. Implicitly this difference can also be interpreted as one of the dimensions of jobquality, e.g. with respect to the balance between private and professional life at individual level.Five years after graduation four fifths of the graduates of CONGRAD universities andpolytechnics (79.9%) had a full time contract of 40 weekly working hours. Only 9% of graduateshad contracts for 20 and less working hours per week, and about 5% of graduates had more than40 working hours according their contract (4.8%). Figure 61 illustrates the average duration ofthe contracted working week and the average duration of the actual working week in differenteconomic activity branches in which graduates worked five years after graduation. The shortestaverage work week according to official contract is reported for the education branch, in whichteachers who work in schools often do not teach for the full number of contracted hours.Differences between economic activity branches regarding duration of work week specified inthe contract, even though statistically significant (F20.2761=7.28, p=0.000), account for only 5% ofthe variation in the answers related to the average contracted work week (eta squared = 0.05).On the other hand, differences in the actual work week of those employed in different branchesof economic activity are greater (F20.2873=19.2, p=0.000), and the economic activity branch inwhich respondents work accounts for 11.8% of the variance in answers to the question aboutthe real duration of the work week. In economic activity branches such as real estate activities,education, arts, entertainment and recreation, public administration and defence, andcompulsory social security, the average duration of the contracted and actual working week are

84 Current Career and Work Status
almost equal. In almost every other economic activity branch the average actual working week islonger than the contracted one. The largest discrepancies can be identified in the field ofaccommodation and food service activities and construction, which demonstrates the frequencyof overtime work in these branches of economy.
Figure 61: Current job five years after graduation �– Working hours by branches of economic activities(universities and polytechnics, 2007 cohort, in %)
8.4.2 Salaries Five Years after Graduation
With regard to the wage level of graduate jobs five years after graduation, an increase in thelevel of income is noticeable in comparison to the first significant job within the same group ofrespondents. (The arithmetic mean for salaries of CONGRAD graduates of the 2007 cohort intheir first significant job was 423 EUR49; the median was 380 EUR.) The average salary ofgraduates of CONGRAD universities and polytechnics five years after graduation amounts to 589
49 Differences with regard to the chapter on first significant employment are a consequence of different analyticalapproaches. Here, only the graduates of the 2007 cohort were taken into consideration, whereas in the chapter on firstsignificant job graduates of both cohorts who found a first significant job were included in the analysis.

85Current Career and Work Status
EUR; the median is 450 EUR. Statistically significant differences in the average salaries betweenuniversity graduates of different countries do not exist. As expected, the only statisticallysignificant difference is with regard to type of institution, i.e. between university graduates andgraduates of polytechnics. When analysing the average net salaries according to the universitygraduates�’ field of study the differences are considerably larger. These differences areparticularly striking when comparing different economic activity branches in which graduatesworked five years after graduation. Within these groups there are in certain cases large standarddeviations large standard deviations, and substantial differences between arithmetic means andmedians, which implies that there are a certain number of respondents with extremely highsalaries. Therefore the data in Figure 62 and Figure 63 are ranked according to medians, and notarithmetic means of net salaries. Five years after graduation, the graduates employed in thesectors of electricity, gas, steam and air conditioning supply, information and communication,mining and quarrying, construction, banking and insurance had the highest average net salaries.Engineers, technologists and graduates of business and administration are mostly employed inthe aforementioned branches. Graduates who work in education; administrative and supportservice activities; agriculture, forestry and fishing; and in arts, recreation and entertainment hadthe lowest level average salaries five years after graduation. These are branches in which mostlyteachers, professors, philologists, journalists, artists and veterinarians are employed.

86 Current Career and Work Status
Figure 62: Current job five years after graduation �– Net salary in EUR by branches of economicactivities (universities and polytechnics, 2007 cohort)

87Current Career and Work Status
Figure 63: Current job five years after graduation �– Net salary in EUR by field of study (universities,2007 cohort)
8.4.3 Utilisation of Knowledge and Skills Acquired During Studies and NecessaryQualifications
Utilisation of knowledge, abilities and skills in the job is considered as one of the basic indicatorsof a job�’s quality, and this dimension of quality is seen as particularly important for theassessment of the quality of jobs performed by those who work as professionals or engineers.Most graduates of CONGRAD universities and polytechnics who were employed five years aftergraduation worked in jobs requiring a higher education degree. The share of universitygraduates who worked in jobs not requiring higher education is rather small (about 5.0%),whereas the share is much higher in the case of polytechnics graduates. One in four respondentsof polytechnics reported that their jobs do not require higher education at all. In comparison touniversity graduates in Serbia and Bosnia and Herzegovina, the situation of Montenegrinuniversity graduates is significantly different. This is due to the fact that in the case ofMontenegro first cycle degrees usually do not provide direct access to the labour market (seeFigure 64).

88 Current Career and Work Status
Figure 64: Current job five years after graduation �– Required level of educational qualifications bytype of institution/country (universities and polytechnics, 2007 cohort, in %)
When analysing the extent to which knowledge and skills acquired during studies were used inthe current job (requiring higher education) by graduates who completed their studies five yearsprior to the survey, it can be concluded that 62.0% of graduates of CONGRAD universities dohave the opportunity to use the knowledge and skills they acquired during studies in their jobsto a high extent (values 4 and 5 on a 5 point scale).
The ANOVA analysis (ANOVA) (F19,2937=5.77, p=0.000) shows that among the graduates ofdifferent fields of study there are small but statistically significant differences regarding thedegree to which graduates were able to use the knowledge and skills they acquired duringstudies in their jobs. Five years after graduation graduates working in the branches of educationand health, e.g. graduate physicists, chemists, and medical professionals reported to use theirknowledge and skills to the highest extent; followed by graduates of humanities, i.e. teachersand pedagogues. Working in jobs that do not require the utilisation of knowledge and skillsacquired during studies to full extent was most frequent among graduate journalists.

89Current Career and Work Status
Figure 65: Current job five years after graduation �– Utilisation of knowledge and skills acquired duringstudies in jobs requiring higher education qualification by field of study (universities, 2007cohort, in %)
8.4.4 Job Satisfaction
Job satisfaction is usually understood as an aggregate indicator of job quality, and not as aconstituent element of quality. In most sources and surveys on the quality of jobs and jobconditions (see Green 2006) the dominant perception is that objective job characteristics such assalaries, work organisation, skill utilisation, exposure to risk at work and social environment inthe job are combined with personal values and aims of individuals to make the assessment of jobsatisfaction. This obviously does not mean that each element of job quality affects general jobsatisfaction equally. Also, each element cannot equally account for the variation in responses tothis question. CONGRAD graduates were asked to assess their general job satisfaction five yearsafter graduation on a 10 point Likert scale. In general, graduates who were working or selfemployed five years after graduation are satisfied with their jobs (M=7.25, SD=2.21 forgraduates of the 2007 cohort). Differences are not statistically significant with regard to type ofinstitution. However, they are significant with regard to the branch of economic activity theywork in. These differences are small, and a small part of the variation in job satisfaction isexplained by the activity branch the graduates are working in (F10,3110=5.56, p=0.000, etasquare=0.035). Figure 66 shows the average job satisfaction among university graduatesaccording to different economic activity branches. Graduates who worked in the branches watersupply, sewerage, waste management and remediation activities; electricity, gas, steam and airconditioning supply; education; and real estate activities are most satisfied with their current

90 Current Career and Work Status
jobs five years after graduation. Graduates who worked in wholesale and retail trade and inadministrative and support service activities are least satisfied.
Figure 66: urrent job five years after graduation �– Average job satisfaction by branchers of economicactivities (universities and polytechnics, 2007 cohort)

91Job Requirements and Acquired Competences
9 Job Requirements and Acquired CompetencesOne of the objectives of the CONGRAD graduate survey was to conduct a comparative analysis50of the level of competences that the graduates acquired upon graduation and the graduates�’assessment of the competence level required in their job at the time of the survey. Competencesin this context are defined knowledge, abilities and skills that a person possesses. In theframework of this report the analysis is restricted to generic competences. Generic competences,unlike subject specific competences (specific for a certain academic/professional field), arecharacterised by a higher degree of generalisation and applicability in different work contexts.This implies that generic competences are relevant in the employment context regardless of thetype of job that a person performs.
It has to be emphasized that the respondents were asked to assess their competences bythemselves in the survey questionnaire. Their actual competence level was not tested ormeasured. The analysis of the subjective competence assessment respectively does not aim tomeasure the objective level of competences the respondents possess. The marks awarded byrespondents are analysed in a comparative perspective, taking into account differences in theself assessment of competences between different groups of respondents.
In addition, it should be pointed out that the assessment of the competence level on the onehand largely depends on individual factors such as self confidence and specific qualities ofdifferent persons�’ sets of values, and on the other hand on the social context, i.e. the referenceframework that individuals (unconsciously) apply when performing any kind of evaluation. Theauthors of this report are aware of the limitations of the chosen methodology and in the analysisof data, and ensured that the respondents�’ answers were analysed exclusively in a comparativeperspective. Most of all, this means that the self assessment of the difference between theacquired competence level and the level of competences required in a job can be considered tobe reliable since it is based on the personal comparison of each person, i.e. the same individualmeasurement schemes and reference frameworks. The perceived deficit or surplus of certaincompetences with regard to job requirements represents crucial information that may influencethe development of study programme curricula so as to increase the relevance of highereducation studies and to prepare future graduates for challenges expected in the workplace inthe best possible way.
In the survey, graduates assessed the level of competences they acquired at the time ofgraduation and the level of competences required in their current job. The respondents assessedthe following competences:
1. Command of your field of study or discipline2. Knowledge of other fields or disciplines3. Ability of analytical thinking4. Ability to recognise and close own knowledge gaps5. Ability to negotiate6. Ability to adapt to changing conditions7. Ability to take initiative8. Ability to make your meaning clear to others9. Ability to mobilize the capacities of others (leadership)10. Ability to work in team11. Ability to present products, ideas or reports to an audience12. Ability to write reports, memos or documents
50 For the assessment of knowledge, skills and attitudes, relevant items were presented in a 5 point Likert scale from 1 �“notat all�” (lack of a certain competence) to 5 �“to a very high extent�” (sufficiency of a certain competence).
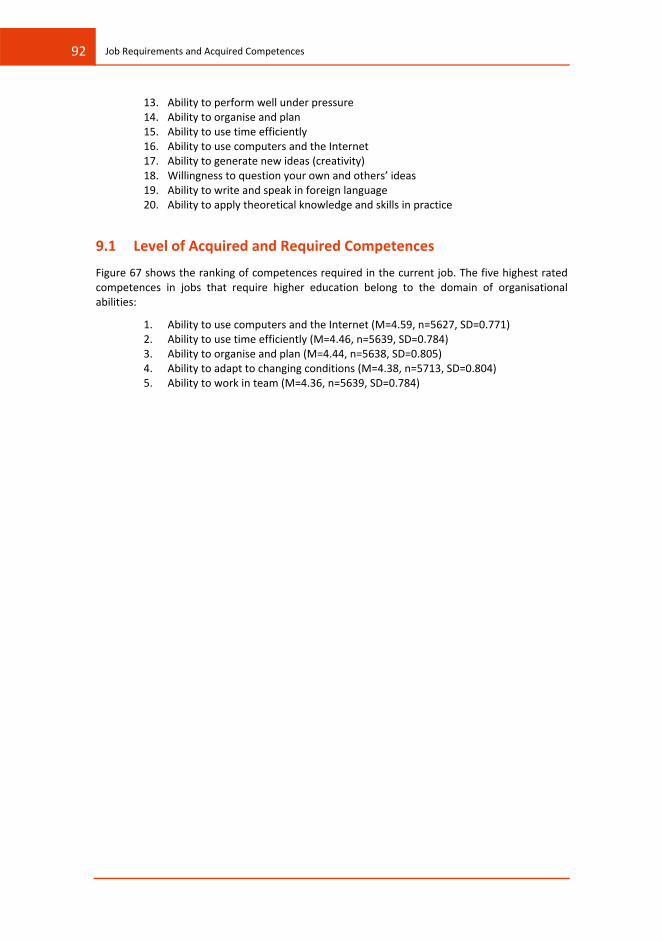
92 Job Requirements and Acquired Competences
13. Ability to perform well under pressure14. Ability to organise and plan15. Ability to use time efficiently16. Ability to use computers and the Internet17. Ability to generate new ideas (creativity)18. Willingness to question your own and others�’ ideas19. Ability to write and speak in foreign language20. Ability to apply theoretical knowledge and skills in practice
9.1 Level of Acquired and Required CompetencesFigure 67 shows the ranking of competences required in the current job. The five highest ratedcompetences in jobs that require higher education belong to the domain of organisationalabilities:
1. Ability to use computers and the Internet (M=4.59, n=5627, SD=0.771)2. Ability to use time efficiently (M=4.46, n=5639, SD=0.784)3. Ability to organise and plan (M=4.44, n=5638, SD=0.805)4. Ability to adapt to changing conditions (M=4.38, n=5713, SD=0.804)5. Ability to work in team (M=4.36, n=5639, SD=0.784)
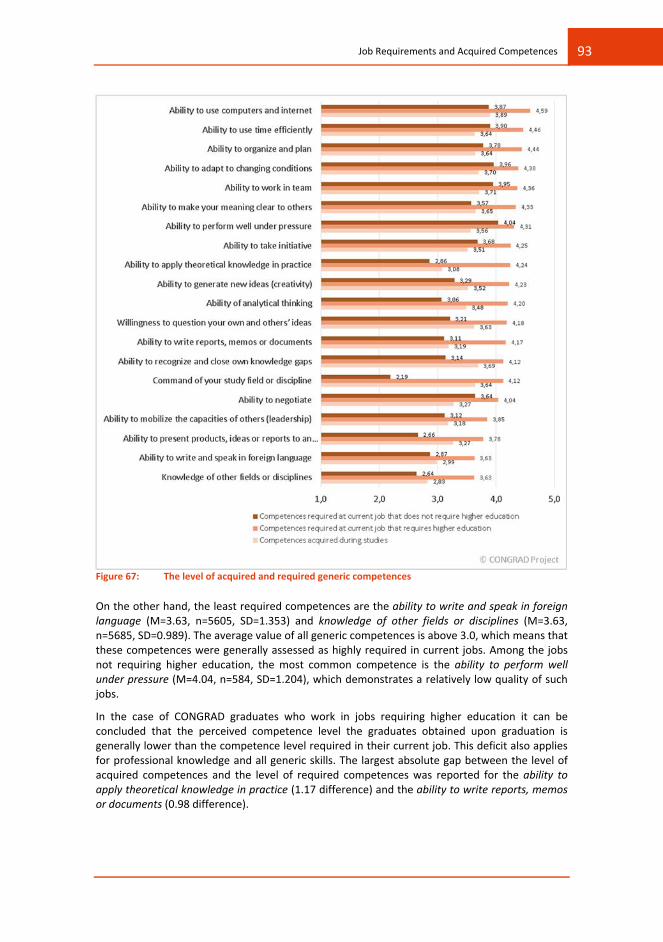
93Job Requirements and Acquired Competences
Figure 67: The level of acquired and required generic competences
On the other hand, the least required competences are the ability to write and speak in foreignlanguage (M=3.63, n=5605, SD=1.353) and knowledge of other fields or disciplines (M=3.63,n=5685, SD=0.989). The average value of all generic competences is above 3.0, which means thatthese competences were generally assessed as highly required in current jobs. Among the jobsnot requiring higher education, the most common competence is the ability to perform wellunder pressure (M=4.04, n=584, SD=1.204), which demonstrates a relatively low quality of suchjobs.
In the case of CONGRAD graduates who work in jobs requiring higher education it can beconcluded that the perceived competence level the graduates obtained upon graduation isgenerally lower than the competence level required in their current job. This deficit also appliesfor professional knowledge and all generic skills. The largest absolute gap between the level ofacquired competences and the level of required competences was reported for the ability toapply theoretical knowledge in practice (1.17 difference) and the ability to write reports, memosor documents (0.98 difference).

94 Job Requirements and Acquired Competences
9.2 Job Requirements in Different Economic Activity BranchesWhen analysing the required competences in jobs that require higher education degrees thatgraduates had at the time of the survey51, differences can be observed with regard to theeconomic activity branches in which the respondents worked. There are statistically significantdifferences between different economic activity branches for all competences assessed byrespondents, but in most cases these are small differences that account for the low percentageof common variance in answers (eta squared). Economic activities mostly differ with regard towork requirements in the domain of ability to present products, ideas or reports to an audienceand command of study field (Table 14).
Table 14: Variance in the level of required generic competences by economic activity branches
A more detailed analysis of the level of requirement related to different generic competences indifferent branches of economy provides insight into the average level of required competencesin different economic activity branches. Table 15 shows economic branches in which the averagelevel of requirements for certain competences differs for at least one standard deviation in bothdirections from the total average for all activity branches (see shaded cells in the table). Aparticularly high level of professional knowledge is expected from graduates employed inagriculture, forestry and fishing, community activities, scientific research, education and health.Employees in the fields of administration, trade and arts, entertainment and recreation arefacing requirements for professional knowledge that are below average.
Only the jobs that, according to respondents, require higher education were included in the analysis.
F Eta Eta square
Command of your study field or discipline* 26,345 0,297 8,8%
Knowledge of other fields or disciplines* 1,949 0,085 0,7%
Ability of analytical thinking* 6,084 0,149 2,2%
Ability to recognize and close own knowledge gaps* 3,422 0,113 1,3%
Ability to negotiate* 5,374 0,14 2,0%
Ability to adapt to changing conditions 1,884 0,083 0,7%
Ability to take initiative* 3,352 0,111 1,2%
Ability to make yourmeaning clear to others* 2,446 0,095 0,9%
Ability to mobilize the capacities of others (leadership)* 6,168 0,15 2,3%
Ability to work in team* 4,516 0,128 1,6%
Ability to present products, ideas or reports to an audience* 26,914 0,303 9,2%
Ability to write reports, memos or documents* 7,558 0,166 2,8%
Ability to performwell under pressure* 10,235 0,193 3,7%
Ability to organize and plan* 5,763 0,146 2,1%
Ability to use time efficiently* 3,744 0,118 1,4%
Ability to use computers and internet* 15,958 0,238 5,7%
Ability to generate new ideas (creativity)* 14,269 0,226 5,1%
Willingness to question your own and others�’ ideas* 6,408 0,154 2,4%
Ability to write and speak in foreign language* 13,877 0,223 5,0%
Ability to apply theoretical knowledge in practice* 10,329 0,193 3,7%

95Job Requirements and Acquired Competences
Requirements for generic competences in the field of accommodation and food service activitiesand in real estate activities are generally above the average requirements with regard to samegeneric competences. Job requirements in terms of generic knowledge, abilities and skills aregenerally lower among employees with higher education in public administration andadministrative and support service activities with regard to the requirements in other activitybranches. Among required competences in which the differences between branches are mostpronounced, such as the ability to present products, ideas or reports to an audience, the highestlevel of demand can be noted among the employees in the sector of education and the sector ofarts, entertainment and recreation. This ability is required below the average level amonggraduates employed in the sector of human health and social work activities and administrativeand support service activities.

96 Job Requirements and Acquired Competences
Table 15: Competence requirements by economic activity branches
Commandofyourstudyfieldordiscipline
Knowledgeofotherfieldsordisciplines
Abilityofanalyticalthinking
Abilitytorecognizeandcloseownknowledgegaps
Abilitytonegotiate
Abilitytoadapttochangingconditions
Abilitytotakeinitiative
Abilitytomakeyourmeaningcleartoothers
Abilitytomobilizethecapacitiesofothers(leadership)
Abilitytoworkinteam
Abilitytopresentproducts,ideasorreportstoanaudience
Abilitytowritereports,memosordocuments
Abilitytoperformwellunderpressure
Abilitytoorganizeandplan
Abilitytousetimeefficiently
Abilitytousecomputersandinternet
Abilitytogeneratenewideas(creativity)
Willingnesstoquestionyourownandothers�’ideas
Abilitytowriteandspeakinforeignlanguage
Abilitytoapplytheoreticalknowledgeinpractice
Agriculture,forestryandfishing
4,269
3,656
3,954
4,038
4,015
4,364
4,279
4,311
3,962
4,383
3,644
4,059
4,265
4,378
4,394
4,353
4,098
4,076
3,323
4,338
Miningandqu
arrying
3,848
3,690
4,071
4,048
4,000
4,429
4,273
4,302
3,857
4,304
3,523
4,209
4,386
4,381
4,395
4,442
4,073
4,073
3,225
3,977
Manufacturin
g3,904
3,716
4,303
4,104
4,136
4,450
4,370
4,373
4,210
4,458
3,610
4,236
4,519
4,568
4,498
4,645
4,243
4,244
3,862
4,212
Electricity
,gas,steam
andaircon
ditio
ning
supp
ly4,094
3,519
4,174
4,070
3,955
4,303
4,170
4,291
3,843
4,447
3,455
4,174
4,305
4,314
4,359
4,744
4,059
4,123
3,619
4,110
Water
supp
ly;sew
erage;waste
managmen
tand
remed
iatio
nactiv
ities
4,314
3,549
4,080
4,060
4,000
4,280
4,140
4,204
3,830
4,571
3,592
4,347
4,043
4,449
4,367
4,633
4,082
4,122
3,245
4,163
Constructio
n4,156
3,572
4,116
4,139
4,014
4,400
4,240
4,282
4,032
4,542
3,386
4,091
4,520
4,478
4,480
4,739
4,074
4,125
3,546
4,204
Who
lesaleandretailtrade;repairof
motor
vehicles
and
motorcycles
3,392
3,567
4,114
4,035
4,346
4,438
4,288
4,347
3,936
4,278
3,642
4,216
4,456
4,552
4,517
4,657
4,075
4,056
3,755
3,847
Transportin
gandstorage
3,888
3,682
4,083
4,000
4,180
4,495
4,357
4,369
4,090
4,478
3,535
4,345
4,522
4,578
4,500
4,711
4,183
4,221
3,649
4,043
Accommod
ationandfood
serviceactiv
ities
3,915
3,682
4,044
4,106
4,511
4,596
4,565
4,468
4,298
4,583
3,761
4,178
4,545
4,644
4,705
4,444
4,489
4,333
4,326
4,196
Inform
ationandcommun
ication
3,938
3,572
4,358
4,174
3,888
4,383
4,235
4,251
3,705
4,461
3,561
3,874
4,381
4,249
4,371
4,821
4,294
4,221
3,971
4,092
Financialand
insuranceactiv
ities
3,951
3,548
4,321
4,093
4,155
4,377
4,261
4,333
3,738
4,326
3,621
4,371
4,534
4,509
4,563
4,765
4,062
4,034
3,766
4,169
Realestate
activ
ities
3,818
4,091
4,636
4,364
4,727
4,636
4,545
4,636
4,182
4,091
3,909
4,182
4,727
4,818
4,818
4,545
4,455
4,455
4,182
4,182
Profession
al,scien
tificandtechnicalactivities
4,272
3,647
4,373
4,261
3,809
4,355
4,170
4,305
3,625
4,354
3,774
4,214
4,345
4,378
4,426
4,753
4,340
4,298
4,089
4,349
Administrativeandsupp
ortservice
activ
ities
3,500
3,564
3,829
3,840
3,983
4,221
3,988
4,070
3,560
4,128
3,264
4,301
4,202
4,331
4,312
4,610
3,814
3,800
3,333
3,836
Publicadministrationandde
fence;compu
lsorysocial
security
3,912
3,557
4,129
3,943
3,964
4,258
4,012
4,287
3,669
4,281
3,532
4,548
4,339
4,348
4,317
4,693
3,961
3,964
3,322
4,054
Education
4,489
3,719
4,209
4,174
4,031
4,364
4,281
4,429
3,887
4,249
4,409
4,115
4,021
4,551
4,557
4,400
4,496
4,328
3,442
4,456
Human
health
andsocialworkactiv
ities
4,429
3,466
4,140
4,194
4,047
4,449
4,209
4,316
3,874
4,521
3,390
4,035
4,393
4,314
4,402
4,281
3,869
3,997
3,085
4,413
Arts,entertainmen
tand
recreatio
n3,671
3,595
3,988
4,025
4,099
4,259
4,259
4,215
3,925
4,259
4,075
3,728
4,305
4,395
4,370
4,275
4,350
4,163
3,575
4,160
Other
services
activ
ities
3,812
3,673
4,028
3,967
4,344
4,456
4,411
4,380
4,028
4,367
3,805
4,126
4,380
4,534
4,546
4,580
4,324
4,232
3,761
4,142
Averageforallbranches
(M)
3,977
3,635
4,155
4,086
4,116
4,395
4,266
4,325
3,908
4,373
3,657
4,176
4,378
4,462
4,468
4,584
4,176
4,151
3,636
4,155
Std.De
viation
0,286
0,128
0,177
0,115
0,219
0,106
0,143
0,112
0,196
0,137
0,257
0,177
0,168
0,136
0,128
0,166
0,195
0,149
0,337
0,161
M+STD
DEV
4,263
3,763
4,333
4,201
4,335
4,502
4,409
4,437
4,104
4,510
3,914
4,353
4,547
4,598
4,596
4,750
4,370
4,300
3,972
4,316
MSTDD
EV3,691
3,507
3,978
3,971
3,897
4,289
4,123
4,213
3,712
4,235
3,400
3,999
4,210
4,325
4,340
4,418
3,981
4,002
3,299
3,994

97Job Requirements and Acquired Competences
9.3 Competence GapFigure 68 and Table 14 illustrate the assessment of the level of acquired competences at thetime of graduation and the evaluation of the level of competences required in the graduates�’jobs at the time of the survey. Still, for a more detailed understanding of competences on bothlevels, an analytical variable has been created which uses a scale to compare competencesacquired upon graduation and the competences required in the current job. Theoretical valueson such a scale measuring the competence gap are denoted as integers in a continuous seriesfrom 4 to 4. The scale demonstrates the assessment of the degree of congruence betweencompetences required in the job and the competences acquired during studies on a scale from4 (extreme average lack of competences) to 4 (extreme average competence surplus). The value0 represents the ideal average congruence between the acquired competences andcompetences required in the job. Values between 1 and 0 (or 0 and 1) represent a relativelysmall average deficit (or surplus) of competences. Values between 1 and 1.99 (or 0 and 1.99)represent amoderate average deficit (or surplus) of competences, whereas the values between2 and 2.99 (or 2 and 2.99) and the values between 3 and 4 (or 3 and 4) represent a high andextremely high deficit (or surplus) of competences.
Consequently, respondents with negative values on this analytic scale believe that during studiesthey acquired a level of competences, which is lower than the required competence level in theircurrent job. On the other hand, cases with positive values believe that higher education enabledthem to acquire a level of competences higher than expected in their job.
As illustrated in Figure 68, slightly more than a third of graduates (34.3%) consider the levels ofcompetences acquired during studies and required in a job to be corresponding. On average,slightly more than a half of the graduates included in the CONGRAD survey report some kind ofcompetence deficit, with the majority (around 30%) reporting a small or high or extremely highdeficit of competences in one of the surveyed fields (high competence deficit is reported by 8%of graduates, whereas 2.3% of respondents on average assess that they have an extremely highdeficit of all competences combined).

98 Job Requirements and Acquired Competences
Figure 68: Competence gap with regard to job requirements
The highest deficits can be observed for the following competences (values 3 and 4 combined):(1) ability to apply theoretical knowledge in practice; (2) ability to write reports, memos ordocuments; 3) ability to write and speak in foreign language. A surplus of competences withregard to job requirements is rare. Competences with the highest surplus with regard to jobrequirements (values 3 and 4 combined) are (1) ability to present products, ideas and reports toan audience, and (2) ability to write and speak in foreign language. It is interesting to note thatthe ability to write and speak in a foreign language is extremely polarised and appears as acompetence with both the highest surplus and the highest deficit with regard to othercompetences.
For the purpose of improving study programmes�’ curricula in certain fields of study it is useful toexplore which competences the graduates who work in jobs that require higher educationconsider to be lacking.

99Job Requirements and Acquired Competences
Table 16 shows the average values regarding the gap between the competences acquired duringstudies and competences required in the current job. In accordance with the previouslydescribed scale, values smaller than 1 demonstrate a moderate average lack of certaincompetences and the value of 0 represents the ideal average congruence between competencesin the two aforementioned levels. Values between 1 and 0 represent a relatively small averagelack of competences. The overview includes graduates of both cohorts who are employed at thetime of the survey.
As for the command of study field or discipline, unlike most graduates who have a relativelysmall average competence gap, graduate lawyers assess that they have an moderate deficit ofcompetences. In terms of knowledge of other fields or disciplines, a moderate deficit is presentamong the employed graduates of journalism and information and agriculture, forestry andfishery. With competences such as the ability of analytical thinking, leadership, creativity andlearning ability, ability to recognize and close own gaps in knowledge, and ability to negotiate,only a small lack of competences was noted in all graduate groups. A moderate deficit ofcompetences to take initiative is present among employed journalists, biologists and ecologists.Graduates in the field of life sciences express a moderate lack of ability to work in team withregard to their jobs.

100 Job Requirements and Acquired Competences
Table 16: Average deficit of competences among graduates of different fields of study at universities
Commandofyourstudyfieldordiscipline
Knowledgeofotherfieldsordisciplines
Abilityofanalyticalthinking
Abilitytorecognizeandcloseownknowledgegaps
Abilitytonegotiate
Abilitytoadapttochangingconditions
Abilitytotakeinitiative
Abilitytomakeyourmeaningcleartoothers
Abilitytomobilizethecapacitiesofothers(leadership)
Abilitytoworkinteam
Abilitytopresentproducts,ideasorreportstoanaudience
Abilitytowritereports,memosordocuments
Abilitytoperformwellunderpressure
Abilitytoorganizeandplan
Abilitytousetimeefficiently
Abilitytousecomputersandinternet
Abilitytogeneratenewideas(creativity)
Willingnesstoquestionyourownandothers�’ideas
Abilitytowriteandspeakinforeignlanguage
Abilitytoapplytheoreticalknowledgeinpractice
Archite
ctureandbu
ilding
0,539
0,907
0,615
0,413
0,983
0,686
0,739
0,689
0,794
0,583
0,437
1,128
0,719
0,768
0,784
0,911
0,686
0,624
0,934
1,252
Life
sciences
0,338
0,962
0,907
0,577
0,975
0,805
1,025
1,053
0,908
1,147
1,066
1,640
0,882
1,107
0,961
1,027
1,039
0,960
1,200
1,592
Busine
ssandadministration
0,320
0,672
0,656
0,343
0,729
0,605
0,594
0,596
0,424
0,486
0,287
0,883
0,793
0,662
0,753
0,691
0,568
0,481
0,666
0,982
Socialandbe
haviou
ralscien
ce0,240
0,684
0,585
0,343
0,779
0,664
0,668
0,610
0,568
0,620
0,363
1,005
0,786
0,786
0,763
0,781
0,578
0,371
0,450
1,034
Physicalsciences
0,466
0,667
0,457
0,250
0,538
0,500
0,513
0,574
0,570
0,470
0,705
0,929
0,500
0,708
0,685
0,522
0,690
0,553
0,310
0,867
Humanities
0,318
0,861
0,548
0,290
0,738
0,716
0,682
0,593
0,755
0,733
0,708
0,549
0,538
0,876
0,910
0,818
0,834
0,506
0,271
0,925
Compu
ting
0,609
0,524
0,566
0,383
0,724
0,522
0,628
0,750
0,625
0,608
0,575
0,694
0,527
0,674
0,783
0,385
0,603
0,484
0,723
0,830
Mathe
matics
0,431
0,603
0,431
0,140
0,845
0,603
0,596
0,707
0,684
0,737
1,250
1,333
0,719
0,857
0,947
0,375
0,554
0,386
0,737
1,018
Health
0,713
0,877
0,703
0,522
0,788
0,811
0,768
0,716
0,725
0,850
0,619
1,216
0,893
0,761
0,884
0,843
0,698
0,584
0,385
1,150
Journalismandinform
ation
0,388
1,038
0,838
0,550
0,963
0,864
1,136
0,775
0,802
0,925
0,842
1,218
1,211
1,197
1,231
1,303
1,247
0,922
1,117
1,000
Teache
rtraininganded
ucationscience
0,570
0,762
0,692
0,519
0,741
0,703
0,701
0,724
0,771
0,718
0,743
0,820
0,698
0,911
0,911
0,834
0,893
0,628
0,500
0,974
Other
0,339
0,397
0,534
0,333
0,586
0,603
0,607
0,596
0,632
0,483
0,455
0,527
0,673
0,836
0,870
0,370
0,655
0,527
0,444
0,623
Agriculture,forestryandfishe
ry0,667
1,080
0,849
0,612
0,958
0,714
0,802
0,782
0,891
0,760
1,095
1,415
0,976
1,073
0,952
1,190
1,108
0,834
0,975
1,323
Law
1,031
0,974
0,970
0,606
0,981
0,802
0,771
0,833
0,592
0,968
0,953
2,030
1,268
1,146
1,129
1,341
1,067
0,864
0,554
1,692
Manufacturin
g0,361
0,801
0,600
0,321
0,900
0,681
0,879
0,807
0,809
0,671
0,885
1,142
1,085
1,007
0,964
0,877
0,986
0,852
1,138
1,234
Engine
ering
0,341
0,798
0,500
0,354
0,844
0,633
0,723
0,719
0,702
0,678
0,671
0,989
0,682
0,763
0,875
0,624
0,782
0,657
0,940
1,241
Arts
0,338
0,238
0,371
0,238
0,563
0,476
0,475
0,177
0,222
0,323
0,311
0,131
0,355
0,733
0,770
0,271
0,532
0,220
0,016
0,672
Veterin
ary
0,788
0,692
0,765
0,360
0,979
0,577
0,577
0,596
0,588
0,692
0,451
1,373
0,808
1,170
0,843
0,769
0,692
0,725
0,520
1,415
Totalfor
alldisciplines
0,459
0,758
0,631
0,397
0,802
0,663
0,694
0,679
0,644
0,660
0,585
1,002
0,761
0,813
0,850
0,768
0,737
0,576
0,645
1,094

101Job Requirements and Acquired Competences
A moderate lack of the ability to present products, ideas or reports to an audience is presentamong graduate biologists, mathematicians and graduates of the field of agriculture, forestryand fishery. The moderate deficit of the ability to write reports, memos or documents is presentin almost all groups of graduates, and graduates employed as lawyers even perceived a very highaverage deficit of competences in this field. A moderate deficit in the ability to perform wellunder pressure is perceived by employed journalists, lawyers and engineers, including thoseemployed in the field of manufacturing and processing. Regarding the ability to organise andplan, efficiently manage time, use computers and the Internet and creativity, a moderate deficitof competences is present among graduates in the fields of journalism and information, law, lifesciences and in the field of agriculture, forestry and fisheries. The moderate average deficit ofthe ability to write and speak in foreign language was perceived among graduate journalists,biologists and ecologists and those working in manufacturing and processing. A moderate deficitof the ability to apply theoretical knowledge in practice was perceived in almost all groups ofgraduates in the fields of education, arts, humanities, business and administration, physicalsciences and computing.
If the answers of respondents who graduated according to the old system of studies arecompared with answers of graduates who completed their studies according to the Bolognasystem of studies, relatively small improvements of the study programme reforms can beperceived. These improvements relate to the decrease of the lack of competences between theacquired competences during studies and required competences in the current job. Figure 69shows the differences between graduates who studied according to the old and the Bolognasystem of studies. For all 20 competences taken into consideration, employed graduates whowork in jobs requiring higher education and who studied according to the new Bologna systemof studies report smaller average perceived competence gaps in comparison with graduates whocompleted their studies according to the old system of studies. Based on the t test (p < 0.05)statistically significant decreases of the average deficit of competences (marked with an asteriskin Figure 69) can be noted for all listed competences. On the other hand, the strength of theeffect is different between the two systems of studies (eta value from 0.085 to 0.222). Ingeneral, the perceived competence gap on average is rather small and medium strong withregard to only few competences. At the same time, the largest effect is observed for the abilityto use computers and the internet, where the variance accounted for by different systems ofstudies amount to 4.9%. When comparing the two systems of studies, the highest decrease ofthe average competence deficit is observed for the ability to use computers and the internet andfor the ability to present products, ideas or reports to an audience. In different institutions, thedecrease of deficit in certain types of generic competences in case of some abilities is notstatistically significant, which shows the varying character of the study programme reform thattook place in the region52. Variations between types of institution are too high to allow forgeneral conclusions on the general success of study programme reform in the spirit of theBologna Process. Also, the strength of the system of studies effect on the average perceiveddeficit of generic competences varies. Therefore, it is necessary to further analyse these findingsat the institutional level with regard to particular universities and study programmes.
52More detailed demonstration is part of the institutional reports within the CONGRAD project

102 Job Requirements and Acquired Competences
Figure 69: Differences in the deficit of generic competences by system of studies
103Instead of a Conclusion
10 Instead of a ConclusionThe previous chapters presented the key findings of the CONGRAD survey which examined theinitial phases of graduate career development, as well as their transition from studies toemployment and their early professional careers. The report provides an overview for thebroader public interested in higher education in the Western Balkans and serves as incentive forfurther development of HEIs in the region.
In a nutshell, the results of the CONGRAD survey confirm the existence of a strong professionalfocus within higher education in Serbia, Bosnia and Herzegovina and Montenegro. In thetradition of higher education in continental Europe that the countries included in the CONGRADsurvey belong to, expectations from higher education are not only focused on the personaldevelopment of individuals, but also on the need to train them for a certain profession or to atleast provide a broad spectrum of professionally applicable knowledge, abilities and skills. Theprofessional orientation of higher education cannot be considered wrong in itself, since itdefinitely contributes to the quality of the professional labour force and the development of thesociety and the economy. Still, problems may be caused when transitional struggles in thesociety and the economy do not provide young highly educated professionals with theopportunitie to find adequate professional employment and work. Therefore, it comes as nosurprise that the results demonstrate on the one hand a generally difficult employment situationof graduates in the countries included in the survey, and on the other hand a vast utilisation ofthe acquired knowledge, abilities and skills among graduates who succeded in becomingemployed or self employed. Higher education institutions and the quality of their studyprogrammes therefore can only partially be held accountable for the problem of(un)employment and employability, particularly in the context of underdeveloped economies inthe participating countries and in the context of the financial and economic crisis present duringthe time of the survey. Nevertheless, this should not discourage HEIs from continuing to work onthe improvement of the professional relevance of their study programmes most of all throughthe development of internship and placement programmes, by introducing practically applicablecontents in teaching, by enabling working and studying in parallel, etc. Graduate surveys proveto be a valuable instrument for providing an evaluation review of the success of reforms withinstudy programmes, faculties or universities. As confirmed by the CONGRAD survey reformsaiming at the introduction of the Bologna system of studies resulted in certain improvements.Having in mind the specificities, dynamics and the focus of reforms implemented locally incertain faculties and polytechnics, it is in this specific context that the CONGRAD survey and theobtained data can achieve their true evaluation, interpretation and implementation potential.
This report is to be understood as the beginning of systemic research of the relation betweenhigher education and the world of work in Serbia, Bosnia and Herzegovina, and Montenegro,which provides an insight into the situation at the time of the survey, but without theopportunity to follow long term trends. The report aims at introducing this topic to theprofessional and scientific community in the region and hopes to motivate HEIs in the region toconduct similar graduate surveys in the future. Finally it should be stressed that decision makingprocesses on reforms of study programmes and higher education policies are considered to bemore responsible and more successful in the long run if they are based on empirical research,and not on anecdotal evidence and preconceptions of individuals.

104 References
11 References
Allen, J, Pavlin, S. & Van der Velden, R. (Eds.) (2011). Competencies and early labour marketcareers of higher education graduates. Ljubljana: University of Ljubljana
Green, F. (2006). Demanding work. Paradox of job quality in the affluent economy. Princeton:Princeton University Press
Teichler, U. (2009). Higher education and the world of work: Conceptual frameworks,comparative perspectives and empirical findings. Rotterdam: Sense Publishers
105Abbreviations
12 Abbreviations
HEI �– Higher education institution
ISCO �– International Standard Classification of Occupations
ISCED �– International Standard Classification of Education

106 Annex 1: Classification of Occupations
13 Annex 1: Classification of Occupations
Classification of occupations based on the International Standard Classification of Occupations �– ISCO 08
1 MANAGERS (EXECUTIVES), SENIOR OFFICIALS AND LEGISLATORS
11 Chief executives, senior officials and members of executive and legislative bodies
111 Executive and legislative officers
112 Managing directors and chief executives
12 Administrative and commercial managers
121 Business services and administration managers
122 Sales, marketing and development managers
13 Production and specialized services managers
131 Production managers in agriculture, forestry and fisheries
132 Manufacturing, mining, construction and distribution managers
133 Information and communications technology service managers
14 Hospitality, retail and other services managers
141 Hotel and restaurant managers
142 Retail and wholesale trade managers
143 Other services managers
2 PROFESSIONALS AND ARTISTS
21 Science and engineering professionals
211 Physical and earth science professionals
212 Mathematicians, actuaries and statisticians
213 Life science professionals
214 Engineering professionals (excluding electrotechnology)
215 Electrotechnology engineers
216 Architects, planners, surveyors and designers
22 Health professionals
221 Medical doctors
222 Nursing and midwifery professionals
223 Traditional and complementary medicine professionals
225 Veterinarians
226 Other health professionals
23 Teaching professionals
231 University and higher education teachers
232 Applied studies and vocational education teachers
233 General secondary education and arts teachers
234 Primary school and early childhood teachers
235 Other teaching professionals
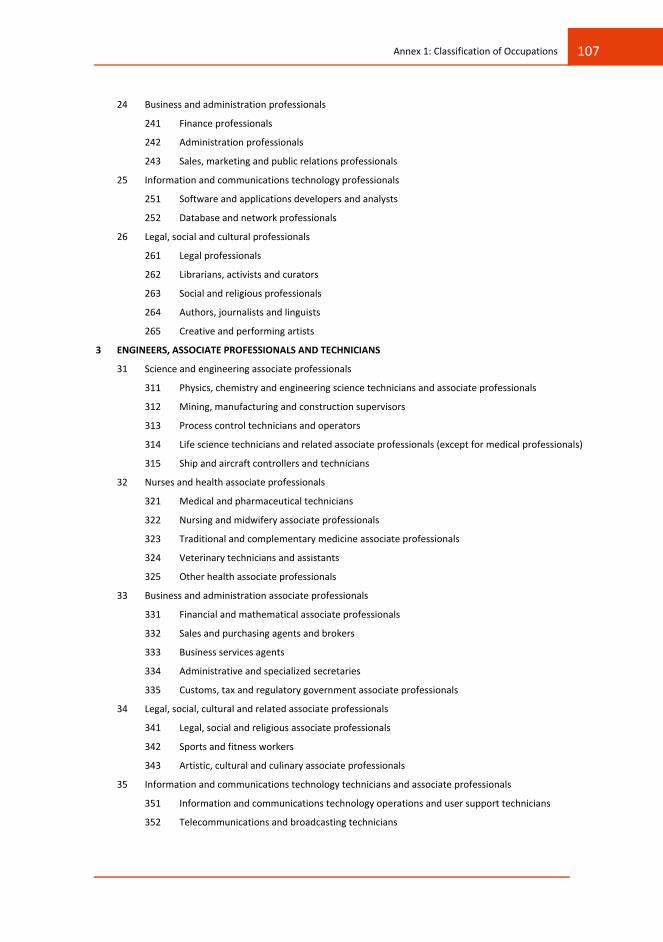
107Annex 1: Classification of Occupations
24 Business and administration professionals
241 Finance professionals
242 Administration professionals
243 Sales, marketing and public relations professionals
25 Information and communications technology professionals
251 Software and applications developers and analysts
252 Database and network professionals
26 Legal, social and cultural professionals
261 Legal professionals
262 Librarians, activists and curators
263 Social and religious professionals
264 Authors, journalists and linguists
265 Creative and performing artists
3 ENGINEERS, ASSOCIATE PROFESSIONALS AND TECHNICIANS
31 Science and engineering associate professionals
311 Physics, chemistry and engineering science technicians and associate professionals
312 Mining, manufacturing and construction supervisors
313 Process control technicians and operators
314 Life science technicians and related associate professionals (except for medical professionals)
315 Ship and aircraft controllers and technicians
32 Nurses and health associate professionals
321 Medical and pharmaceutical technicians
322 Nursing and midwifery associate professionals
323 Traditional and complementary medicine associate professionals
324 Veterinary technicians and assistants
325 Other health associate professionals
33 Business and administration associate professionals
331 Financial and mathematical associate professionals
332 Sales and purchasing agents and brokers
333 Business services agents
334 Administrative and specialized secretaries
335 Customs, tax and regulatory government associate professionals
34 Legal, social, cultural and related associate professionals
341 Legal, social and religious associate professionals
342 Sports and fitness workers
343 Artistic, cultural and culinary associate professionals
35 Information and communications technology technicians and associate professionals
351 Information and communications technology operations and user support technicians
352 Telecommunications and broadcasting technicians

108 Annex 1: Classification of Occupations
4 CLERICAL SUPPORT WORKERS
41 General and keyboard clerks
411 General office clerks
412 Secretaries (general)
413 Keyboard operators
42 Customer services clerks
421 Tellers, money collectors and related clerks
422 Client information workers
43 Numerical and material recording clerks
431 Bookkeeping, financial, statistical and numerical clerks
432 Production, storage and transport clerks
44 Other clerical support workers
5 SERVICE AND SALES WORKERS
51 Personal service workers
512 Cooks
511 Travel attendants, conductors, stewards and guides
513 Waiters and bartenders
514 Hairdressers, beauticians and related workers
515 Building and housekeeping supervisors
516 Other personal services workers
52 Sales workers
521 Street and market salespersons
522 Shop salespersons
523 Cashiers and ticket clerks
524 Other sales workers
53 Personal care workers
531 Child care workers and teachers' aides
532 Personal care workers in health services
54 Protective services workers
541 Protective services workers
6 SKILLED AGRICULTURAL, FORESTRY AND FISHERY WORKERS
61 Market oriented skilled agricultural workers
611 Market gardeners and crop growers
612 Market animal producers
613 Mixed crop and animal producers
62 Market oriented skilled forestry, fishery and hunting workers
621 Forestry and related workers
622 Fishery workers, hunters and trappers
63 Subsistence farmers, fishers, hunters and gatherers

109Annex 1: Classification of Occupations
631 Subsistence crop farmers
632 Subsistence livestock farmers
633 Subsistence mixed crop and livestock farmers
634 Subsistence fishers, hunters, trappers and gatherers
7 CRAFT AND RELATED TRADES WORKERS
71 Building and related trades workers, excluding electricians
711 Building frame and related trades workers
712 Building finishers and related trades workers
713 Painters, building structure cleaners and related trades workers
72 Metal, machinery and related trades workers
721 Sheet and structural metal workers, moulders and welders, and related workers
722 Blacksmiths, toolmakers and related trades workers
723 Machinery mechanics and repairers
73 Handicraft and printing workers
731 Handicraft workers
732 Printing trades workers
74 Electrical and electronic trades workers
741 Electrical equipment installers and repairers
742 Electronics and telecommunications installers and repairers
75 Food processing, wood working, garment and other craft and related trades workers
751 Food processing and related trades workers
752 Wood treaters, cabinet makers and related trades workers
753 Garment and related trades workers
754 Other craft and related workers
8 PLANT AND MACHINE OPERATORS AND ASSEMBLERS
81 Stationary plant and machine operators
811 Mining and mineral processing plant operators
812 Metal processing and finishing plant operators
813 Chemical and photographic products plant and machine operators
814 Rubber, plastic and paper products machine operators
815 Textile, fur and leather products machine operators
816 Food and related products machine operators
817 Wood processing and papermaking plant operators
818 Other stationary plant and machine operators
82 Assemblers
821 Assemblers
83 Drivers and mobile plant operators
831 Locomotive engine drivers and related workers
832 Car, van and motorcycle drivers

110 Annex 1: Classification of Occupations
833 Heavy truck and bus drivers
834 Mobile plant operators
835 Ships' deck crews and related workers
9 ELEMENTARY OCCUPATIONS
91 Cleaners and helpers
911 Domestic, hotel and office cleaners and helpers
912 Vehicle, window, laundry and other hand cleaning workers
92 Agricultural, forestry and fishery labourers
921 Agricultural, forestry and fishery labourers
93 Labourers in mining, construction, manufacturing and transport
931 Mining and construction labourers
932 Manufacturing labourers
933 Transport and storage labourers
94 Food preparation assistants
941 Food preparation assistants
95 Street and related sales and service workers
951 Street and related sales and service workers
952 Street vendors (excluding food)
96 Refuse workers and other elementary workers
961 Refuse workers
962 Other elementary workers
99 Occupations that cannot be sorted
999 Occupations that cannot be sorted
0 ARMED FORCES OCCUPATIONS
01 Commissioned armed forces officers
011 Commissioned armed forces officers
02 Non commissioned armed forces officers
021 Non commissioned armed forces officers
03 Armed forces occupations, other ranks
031 Armed forces occupations, other ranks

111Annex 2: Classification of Economic Activities
14 Annex 2: Classification of Economic Activities
Classification of economic activities based on NACE Rev. 2
1 AGRICULTURE, FORESTRY AND FISHING
01 Crop and animal production, hunting and related service activities
02 Forestry and logging
03 Fishing and aquaculture
2 MINING
05 Mining of coal
06 Extraction of crude petroleum and natural gas
07 Mining of metal ores
08 Other mining
09 Mining support service activities
3 MANUFACTURING
10 Manufacture of food products
11 Manufacture of beverages
12 Manufacture of tobacco products
13 Manufacture of textiles
14 Manufacture of wearing apparel
15 Manufacture of leather and related products
16 Manufacture of wood and products of wood and cork, except furniture;manufacture of articles of straw and plaiting materials
17 Manufacture of paper and paper products
18 Printing and reproduction of recorded media
19 Manufacture of coke and refined petroleum products
20 Manufacture of chemicals and chemical products
21 Manufacture of basic pharmaceutical products and pharmaceutical preparations
22 Manufacture of rubber and plastic products
23 Manufacture of other non metallic mineral products
24 Manufacture of basic materials
25 Manufacture of fabricated metal products, except machinery and equipment
26 Manufacture of computer, electronic and optical products
27 Manufacture of electrical equipment
28 Manufacture of machinery and equipment n.e.c.
29 Manufacture of motor vehicles, trailers and semi trailers
30 Manufacture of other transport equipment
31 Manufacture of furniture
32 Other manufacturing

112 Annex 2: Classification of Economic Activities
33 Repair and installation of machinery and equipment
4 ELECTRICITY, GAS, STEAM AND AIR CONDITIONING SUPPLY
35 Electricity, gas, steam and air conditioning supply
5 WATER SUPPLY; SEWERAGE, WASTE MANAGEMENT AND REMEDIATION ACTIVITIES
36 Water collection, treatment and supply
37 Sewerage
38 Waste collection, treatment and disposal activities; materials recovery
39 Remediation activities and other waste management services
6 CONSTRUCTION
41 Construction of buildings
42 Civil engineering
43 Specialised construction activities
7 WHOLESALE AND RETAIL TRADE; REPAIR OF MOTOR VEHICLES AND MOTORCYCLES
45 Wholesale and retail trade and repair of motor vehicles and motorcycles
46 Wholesale trade, except of motor vehicles and motorcycles
47 Retail trade, except of motor vehicles and motorcycles
8 TRANSPORTATION AND STORAGE
49 Land transport and transport via pipelines
50 Water transport
51 Air transport
52 Warehousing and support activities for transportation
53 Postal and courier activities
9 ACCOMMODATION AND FOOD SERVICE ACTIVITIES
55 Accommodation
56 Food and beverage service activities
10 INFORMATION AND COMMUNICATION
58 Publishing activities
59 Motion picture, video and television programme production, sound recordingand music publishing activities
60 Programming and broadcasting activities
61 Telecommunications
62 Computer programming, consultancy and related activities
63 Information and service activities
11 FINANCIAL AND INSURANCE ACTIVITIES
64 Financial service activities, except insurance and pension funding
65 Insurance, reinsurance and pension funding, except compulsory social security
66 Activities auxiliary to financial services and insurance activities
12 REAL ESTATE ACTIVITIES
68 Real estate activities
13 PROFESSIONAL, SCIENTIFIC AND TECHNICAL ACTIVITIES

113Annex 2: Classification of Economic Activities
69 Legal and accounting activities
70 Activities of head offices; management consultancy activities
71 Architectural and engineering activities; technical testing and analysis
72 Scientific research and development
73 Advertising and market research
74 Other professional, scientific and technical activities
75 Veterinary activities
14 ADMINISTRATIVE AND SUPPORT SERVICE ACTIVITIES
77 Rental and leasing activities
78 Employment activities
79 Travel agency, tour operator and other reservation services and related activities
80 Security and investigation activities
81 Services to buildings and landscape activities
82 Office administrative, office support and other business support activities
15 PUBLIC ADMINISTRATION AND DEFENCE; COMPULSORY SOCIAL SECURITY
84 Public administration and defence; compulsory social security
16 EDUCATION
85 Education
17 HUMAN HEALTH AND SOCIAL WORK ACTIVITIES
86 Human health activities
87 Residential care activities
88 Social work activities without accommodation
18 ARTS, ENTERTAINMENT AND RECREATION
90 Creative, arts and entertainment activities
91 Libraries, archives, museums and other cultural activities
92 Gambling and betting activities
93 Sports activities and amusement and recreation activities
19 OTHER SERVICE ACTIVITIES
94 Activities of membership organisations
95 Repair of computers and personal and household goods
96 Other personal service activities
20 ACTIVITIES OF HOUSEHOLDS AS EMPLOYERS; UNDIFFERENTIATED GOODSAND SERVICES PRODUCING ACTIVITIES OF HOUSEHOLDS FOR OWN USE
97 Activities of households as employers of domestic personnel
98 Undifferentiated goods and services producing activities of private households for own use
21 ACTIVITIES OF EXTRATERRITORIAL ORGANISATIONS AND BODIES
99 ACTIVITIES OF EXTRATERRITORIAL ORGANISATIONS AND BODIES

114 Annex 3: International Standard Classification of Education (ISCED)
15 Annex 3: International Standard Classification of Education(ISCED)
Classification of fields of study based on the International Standard Classification of Education �– ISCED
1 Education
14 Teacher training and education science
140 Teacher training and education science (broad programmes)
141 Teaching and training
142 Education sciences
143 Training for pre school teachers
144 Training for teachers at basic levels
145 Training for teachers with subject specialization
146 Training for teachers of vocational subjects
147 Teachers Adult Education
2 Humanities and Arts
21 Arts
210 Arts (broad programmes)
211 Fine arts
212 Music and performing
213 Audio visual techniques and media production
214 Designs (Graphic Design, Industrial Design, Fashion, Textile)
215 Craft skills
22 Humanities
220 Humanities (broad programmes)
221 Religion
222 Languages and Philological Sciences
223 Mother tongue
224 History, philosophy and related subjects
225 History and archaeology
226 Philosophy and ethics
227 History and Art
227 Theology
3 Social sciences, Business and Law
31 Social and behavioral science
310 Social and behavioral science (broad programmes)
311 Psychology
312 Sociology and cultural studies
313 Political science and civics

115Annex 3: International Standard Classification of Education (ISCED)
314 Economics
315 Social Work
316 International Relations, European Studies, Area Studies
317 Anthropology
318 Development Studies
32 Journalism and information
321 Journalism and reporting
322 Library, information, archive
34 Business and administration
340 Business and administration (broad programmes)
341 Wholesale and retail sale
342 Marketing and Sales Management
343 Finance, banking insurance
344 Accounting and taxation
345 Management and administration
346 Secretarial and office work
347 Working life
38 Law
380 Law
4 Science, Mathematics, and Computing
42 Life science
421 Biology and biochemistry
422 Environmental science
44 Physical science
440 Physical science (broad programmes)
441 Physics Nuclear and High Energy Physics, Astronomy, Astrophysics
442 Chemistry
443 Earth science
46 Mathematics and statistics
461 Mathematics
462 Statistics
48 Computing
481 Computer science
428 Computer use
5 Engineering, Manufacturing and Construction
52 Engineering and engineering trades
520 Engineering and engineering trades (broad programmes)
521 Mechanics and metal work
522 Electricity and energy
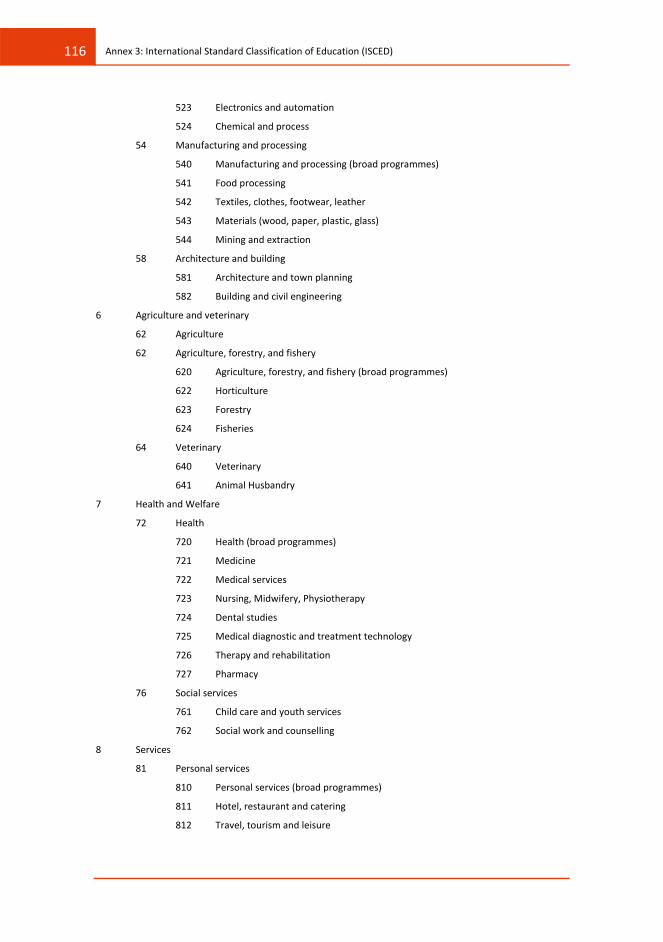
116 Annex 3: International Standard Classification of Education (ISCED)
523 Electronics and automation
524 Chemical and process
54 Manufacturing and processing
540 Manufacturing and processing (broad programmes)
541 Food processing
542 Textiles, clothes, footwear, leather
543 Materials (wood, paper, plastic, glass)
544 Mining and extraction
58 Architecture and building
581 Architecture and town planning
582 Building and civil engineering
6 Agriculture and veterinary
62 Agriculture
62 Agriculture, forestry, and fishery
620 Agriculture, forestry, and fishery (broad programmes)
622 Horticulture
623 Forestry
624 Fisheries
64 Veterinary
640 Veterinary
641 Animal Husbandry
7 Health and Welfare
72 Health
720 Health (broad programmes)
721 Medicine
722 Medical services
723 Nursing, Midwifery, Physiotherapy
724 Dental studies
725 Medical diagnostic and treatment technology
726 Therapy and rehabilitation
727 Pharmacy
76 Social services
761 Child care and youth services
762 Social work and counselling
8 Services
81 Personal services
810 Personal services (broad programmes)
811 Hotel, restaurant and catering
812 Travel, tourism and leisure

117Annex 3: International Standard Classification of Education (ISCED)
813 Sports
814 Domestic services
815 Hair and beauty services
84 Transport services
840 Transport services
85 Environmental protection
850 Environmental protection (broad programmes)
851 Environmental protection technology
852 Natural environments and wild life
853 Community sanitation services
86 Security services (broad programmes)
861 Protection of persons and property
862 Occupational health and safety
863 Military and defence


