December 2012 National Foreign Trade Council , Inc. 1625 K Street, NW, Suite 200 Washington, DC 20006-1604 Phone: (202) 887-0278 Fax: (202) 452-8160 Advancing Global Commerce for Nearly A Century www.nftc.org ConnecƟng the Dots: National Foreign Trade Council, Inc. The Global Economy and Supply Chain Management (2nd edition)
Transcript
December 2012
National Foreign Trade Council , Inc.
1625 K Street, NW, Suite 200 Washington, DC 20006-1604
Phone: (202) 887-0278 Fax: (202) 452-8160
Advancing Global Commerce for Nearly A Century www.nftc.org
Connec ng the Dots:
National Foreign Trade Council, Inc.
The Global Economy and Supply Chain Management (2nd edition)
National Foreign Trade
Council
Connecting the Dots:The Global Economy and Supply Chain Management (2nd edition)
December 2012
About the NFTC
Advancing Global Commerce for Nearly A Century: ‐ The National Foreign Trade Council (www.nftc.org) is a
leading business organization advocating an open, rules‐based global trading system. Founded in 1914 by a
broad‐based group of American companies, the NFTC now serves hundreds of member companies through its
Glossary Of Terms ........................................................................................................................................ 9
Analysis Of Results By Region .................................................................................................................. 11
North Africa ................................................................................................................................................ 11
Argentina .................................................................................................................................................... 29
Australia ...................................................................................................................................................... 31
Austria ......................................................................................................................................................... 32
Brazil ........................................................................................................................................................... 41
Chad ............................................................................................................................................................ 49
China ........................................................................................................................................................... 51
Costa Rica ................................................................................................................................................... 53
El Salvador .................................................................................................................................................. 61
Estonia ........................................................................................................................................................ 62
Finland ........................................................................................................................................................ 64
France .......................................................................................................................................................... 65
India ............................................................................................................................................................ 74
Indonesia ..................................................................................................................................................... 75
Japan ........................................................................................................................................................... 79
Jordan .......................................................................................................................................................... 80
Kenya .......................................................................................................................................................... 82
Kyrgyzstan .................................................................................................................................................. 84
Malaysia ...................................................................................................................................................... 93
Mali ............................................................................................................................................................. 94
Moldova ...................................................................................................................................................... 97
New Zealand ............................................................................................................................................. 101
Panama ...................................................................................................................................................... 106
Peru ........................................................................................................................................................... 108
Portugal ..................................................................................................................................................... 111
Romania .................................................................................................................................................... 112
Russia ........................................................................................................................................................ 113
South Africa .............................................................................................................................................. 119
Sri Lanka ................................................................................................................................................... 121
Sweden ...................................................................................................................................................... 124
Tanzania .................................................................................................................................................... 128
Trinidad and Tobago ................................................................................................................................. 130
United Kingdom ........................................................................................................................................ 135
United States of America .......................................................................................................................... 136
A world of increasing economic integration and interdependence has enabled corporations to locate different parts of their production process in different parts of the world. This development, known as corporate supply chain management and value chain management, defines a current trend in the global economy.1 Although such a strategy has long existed, advances in technology and decreases in the time and cost of transportation and communication have accelerated the process of implementing this strategy. The implications this trend has for corporations and governments alike are enormous. For example, what processes in the supply chain should be outsourced and to which country (distribution in Latvia, or marketing in Spain) and for what reasons exactly? On the government end, questions abound as to what policies can attract investment or promote development in human capital to attract production. For corporations, globalization has come to mean breaking the supply chain into pieces and carefully assessing the profitability, viability and sustainability of each part in the process of making a decision on where to locate them. In addition, considerations over where factors along the value chain should be located are important. Therefore, a study that simply outlines tariff rates and value-added taxes may not capture everything a corporation is looking for when deciding where to invest, but a study that has a broader scope may provide useful information to companies. Facing ever-increasing global competition, corporations must understand the consequences of investment overseas and accurately gauge the costs associated with it. In order to plug into the global supply and value chain effectively, corporations must work (or not work) in tandem with governments that either promote or dissuade such investment. Often, they must weigh alternatives when some government policies promote investment and others discourage it. They must also take into account the cost of connecting to the global economy in terms of factors such as shipping costs, time to clear customs, port of entry fees, corruption, time associated with enforcing contracts, cost of licensing and documentation and so on. This study seeks to capture some of these factors through an analytical model that considers six different factors that reflect such considerations in light of supply and value chain management. In order to provide a comparison, a number of successful trading nations are identified as benchmarks. Their scores are provided to help assess how other countries are performing in relation to successful traders. However, specific scores for each of the six sections are also provided, which enables the reader to disaggregate a country’s overall score and examine in
1 A supply chain describes the movement of a good from a supplier to a customer and is comprised of three parts, supply (raw material provision to manufacturing), manufacturing (conversion of raw materials into a product) and distribution (actual process of delivering final good to consumer). A value chain describes the “value-adding” processes that make the final good’s value exceed the work put into it, thus creating a profit margin. For a further definition of a supply chain see: Definition of “Supply Chain”. Deardorff’s Glossary of International Economics. University of Michigan. For a definition of a value chain see: Definition of “Value Chain”. Managerial Accounting. Chapter 12: Segment Reporting, Profitability Analysis, and Decentralization. McGraw-Hill Ryerson 2001.
6
greater detail the specific factors that might be of particular interest. The methodology created for this study involved the creation of a set of questions that pertain to the following six indices. The questions deal with a wide array of topics; however, the indices themselves are correlated with certain factors along the supply and value chain and with the business environment within a country. Some of the data used in this study came from public sources.
1. National Policies for Openness in Trade and Markets (12 questions): Openness means a government’s willingness to let foreign companies participate directly in a national economy. Governments demonstrate openness not only through low tariffs but also through a series of other administrative and regulatory policies that can either promote or interfere with the flow of goods and services. 2. Best Practices for International Trade (9 questions): Governments can facilitate cross-border trade by minimizing chokepoints in import and export processes, particularly the time and cost associated with getting goods, people or services into and out of countries. 3. Infrastructures for a Global Economy (15 questions): Infrastructure in an era of global commerce means more than traditional elements like roads and airports. This section is divided into three broad components: physical infrastructure, utilities and IT/communication infrastructure. 4. Financial Services for Cross-Border Commerce (14 questions): Multinational firms report that fiscal policies matter significantly in country-site selection. The costs associated with opening and operating a business within a country affect the competitiveness of a country in attracting global capital. This section focuses on start-up costs, business taxes and the time required for businesses to meet these fiscal requirements. 5. Human Capital (17 questions): Human capital attracts investment. Governments play a direct role in workforce development through spending on education and training. A workforce with a high level of education provides an advantage to a country. This section focuses on overall education spending, enrollment, literacy, the cost associated with hiring and training programs. Also included were proxy questions relating to the availability of health care. 6. Effective Legal and Enforcement Systems (18 questions): This section deals with matters such as regulations on contracting, property registration and associated costs. It also deals with corruption levels in a country and the related problems associated with having to deal with such an environment.
7
To put these scores in context, we created “benchmarks” against which to compare performance. We based these benchmarks on performance in OECD countries, in the top five trading economies (U.S., UK, Germany, Japan and China), and in what we call “Exemplars,” five countries that have made globalization work for them as an engine of growth (Singapore, Switzerland, Finland, the Netherlands and Ireland). Comparing a national score to the benchmarks tells how well a country performs in the global economy. The goal of the study was to provide a jumping off point for evaluation and research into investing in a country. The study was firmly grounded in the data we determined to be useful and insightful in evaluating the market environment in a given country. With the exception of certain indices and surveys from the World Bank, this data was primarily quantitative. The ultimate evaluations were entirely based on the data we collected and did not take into account the qualitative historical, cultural or geographic context within which a country’s economic performance should be viewed. That context no doubt provides valuable insight into the composition and nature of the current economy of a country, but the size, methodology and purpose of this study made including such considerations impossible. Whatever the limitations of the study may be, we hope this data will be useful for both companies and nations in determining how best to develop opportunities in the global supply chain.
8
METHODOLOGY2
Credible third party data were sought to provide detailed metrics with which to measure each of the six sections. In general, we preferred to use multinational institutions’ data when possible. However, in some cases benchmark data was gathered directly from national statistical agencies. The following are the core sources for the data:
World Bank o Development Indicators o Financial Indicators (IFC, private sector) o Doing Business o IFC Enterprise Survey o Knowledge for Development
OECD o STAN Bilateral Trade Database o Factbook
World Trade Organization o Country trade profiles
United Nations o UNCTAD/WTO International Trade Center
Transparency International
International Exhibition Logistics Associates
Others o Nationmaster o CIA World Factbook, o Government agencies/ministries, and academic studies
The metrics are meant to be comparative and relate to variation in policy (and variation in outcomes that can be affected by policy) and not – to the extent that it can be avoided – variation in GDP, population, territory size or other outside factors. Some specific questions have been divided by these factors in order to drop out these differences and focus on the differences, which are relevant to government policy action (or inaction). For each question, the data used is from the latest available year.
2 The text of this section is taken from the March 2008 CSIS study.
9
GLOSSARY OF TERMS
Effective Exchange Rate: The effective exchange rate represents the relative value of a home country’s currency compared to the other major currencies being traded. A higher effective exchange rate means that the home country’s currency will usually be worth more than an imported currency, and a lower effective exchange rate means that the home currency will usually be worth less than the imported currency. The effective exchange rate also represents the approximate relative price a consumer will pay for an imported good.3 FCL: Full Cargo Load FDI: Foreign Direct Investment GDP: Gross Domestic Product GNI: Gross National Income KWh: Kilowatt-hour Price Deflator: An economic metric that accounts for inflation by converting output measured at current prices into constant-dollar GDP. The GDP deflator shows how much a change in the base year’s GDP relies upon changes in the price level. Also known as the “GDP implicit price deflator.”4
1Investopedia. “Effective Exchange Rate.” Forbes. July 31st, 2008. http://www.investopedia.com/terms/n/neer.asp 4 Investopedia. “GDP Price Deflator.” Forbes. July 31st, 2008. http://www.investopedia.com/terms/g/gdppricedeflator.asp
10
ACKNOWLEDGEMENTS
The methodology used in this study was first developed by the Center for Strategic International Studies (CSIS) with the generous support of Dell, which released a report on a limited number of countries in March 2008 titled, “Governments and Global Supply Chains: Measuring Performance in a Networked World.” CSIS has given NFTC permission to use the methodology to analyze a much larger number of countries. We are grateful to Jim Lewis and his colleagues at CSIS for their cooperation in this effort. The research and data collection of this study was performed largely by a group of dedicated NFTC interns working throughout 2012, namely: Austin Metoyer Steve Rice Nick Sramek Christoph Krallmann
11
ANALYSIS OF RESULTS BY REGION
North Africa (Morocco, Egypt, Algeria, and Tunisia) The African region is characterized by typically high scores in Best Practices but low scores for Infrastructure. The region’s overall score has decreased in recent years, which can be attributed to several factors including the global financial crisis. Overall, the region has continued to improve in the Best Practices category as well as in National Policies. The countries in North Africa are seeking to open their markets and liberalize their trade regimes in an attempt to attract Foreign Direct Investment (FDI). However, continued inadequacies in infrastructure, such as roads and railways and lack of investments into ICT infrastructure, will prove to outweigh considerations over a liberalized trade regime, potentially harming the region’s attractiveness as a hub for foreign investment.
12
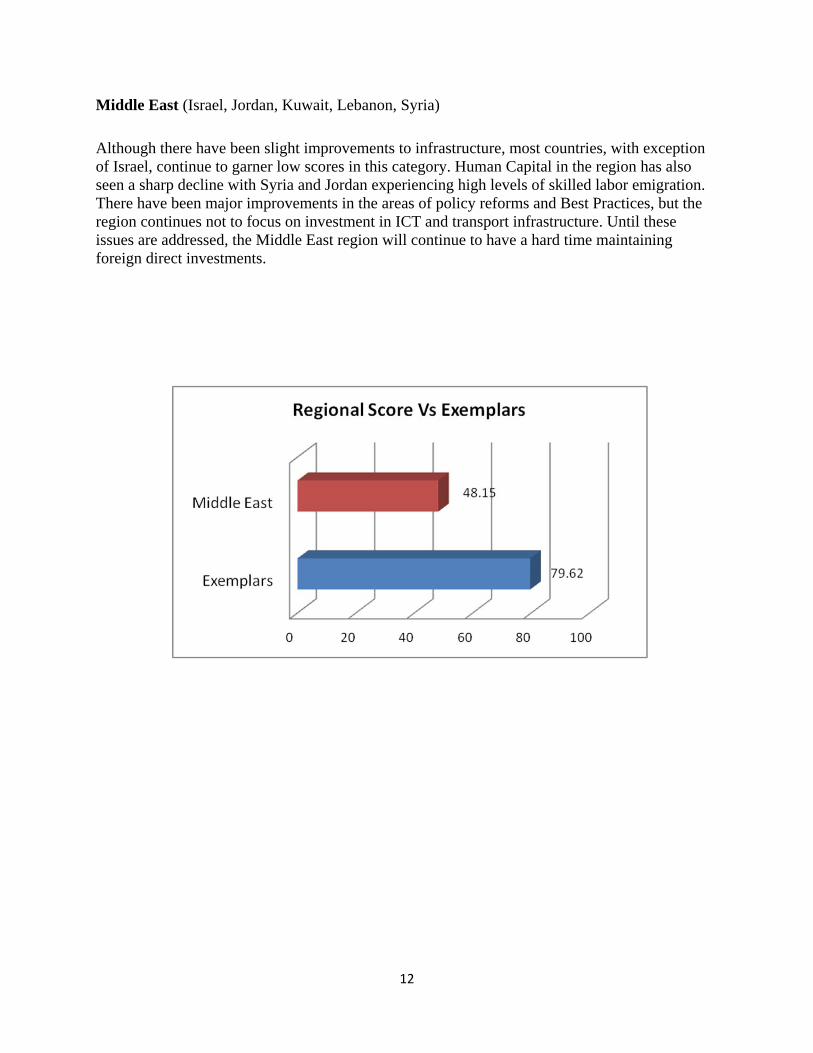
Middle East (Israel, Jordan, Kuwait, Lebanon, Syria) Although there have been slight improvements to infrastructure, most countries, with exception of Israel, continue to garner low scores in this category. Human Capital in the region has also seen a sharp decline with Syria and Jordan experiencing high levels of skilled labor emigration. There have been major improvements in the areas of policy reforms and Best Practices, but the region continues not to focus on investment in ICT and transport infrastructure. Until these issues are addressed, the Middle East region will continue to have a hard time maintaining foreign direct investments.
13
South Asia (Bangladesh, India, Pakistan, Sri Lanka) All four nations shared a continued need to develop adequate ICT and transportation infrastructure. With all four of them scoring in the mid-20s in Infrastructure, the South Asian countries haven’t seen explosive growth in broadband connectivity and reliable access to computers. As foreign investors look to the region for new opportunities, this lack of infrastructure investment make it hard for e-commerce growth. The region did show strong signs in areas of Best Practices and growing improvement in Human Capital and Legal Enforcement.
14
Eastern Europe (Albania, Armenia, Azerbaijan, Belarus, Bosnia, Bulgaria, Croatia, Czech Republic, Estonia, Hungary, Latvia, Lithuania, Macedonia, Moldova, Poland, Romania, Russia, Slovakia, Slovenia, Ukraine) With varying scores ranging from the low 20s to the high 70s, like many of the other areas the Eastern European region has seen a drop in its overall scores. The region still faces the similar challenges it faced four years ago. The region’s collective history as former Soviet republics or satellites still plagues the region as a whole as many countries try to improve their ICT and transportation infrastructure. While many countries have made gains, only a handful (Slovenia, Slovakia, Poland and Estonia in particular) ha seen significant progress. The region still has a strong demand for consumer products as median incomes and wages increase.
15
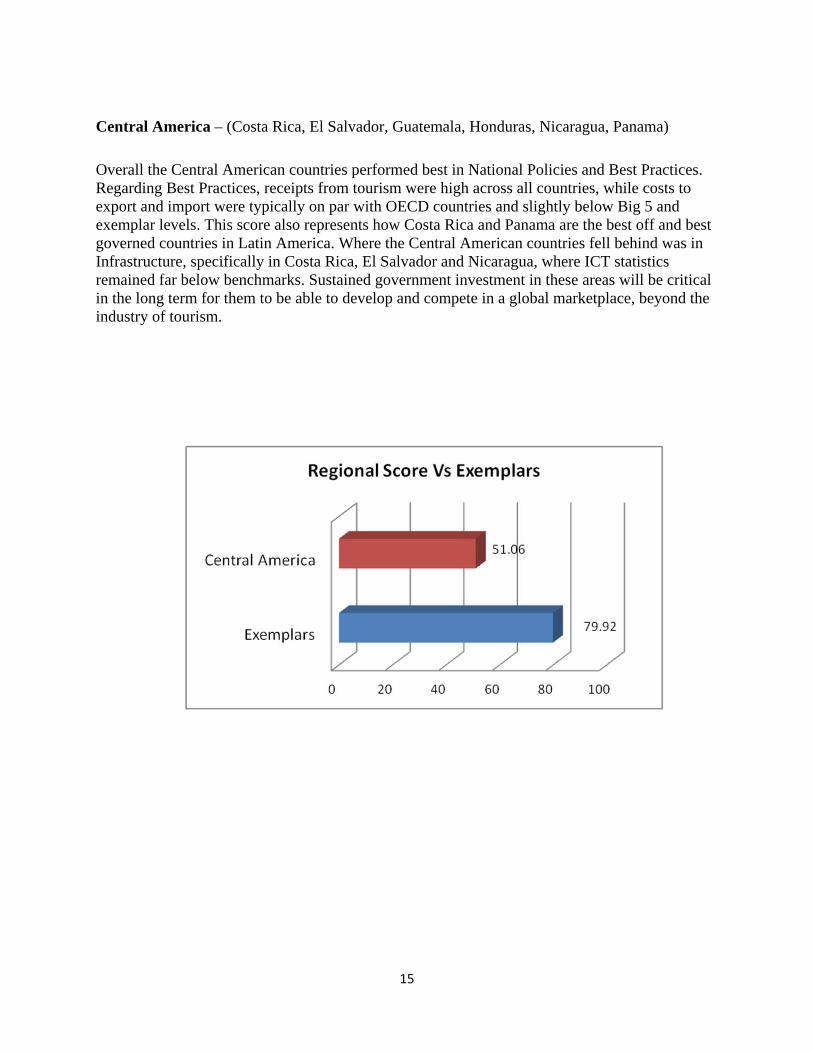
Central America – (Costa Rica, El Salvador, Guatemala, Honduras, Nicaragua, Panama) Overall the Central American countries performed best in National Policies and Best Practices. Regarding Best Practices, receipts from tourism were high across all countries, while costs to export and import were typically on par with OECD countries and slightly below Big 5 and exemplar levels. This score also represents how Costa Rica and Panama are the best off and best governed countries in Latin America. Where the Central American countries fell behind was in Infrastructure, specifically in Costa Rica, El Salvador and Nicaragua, where ICT statistics remained far below benchmarks. Sustained government investment in these areas will be critical in the long term for them to be able to develop and compete in a global marketplace, beyond the industry of tourism.
16
Central Asia – (Kazakhstan, Kyrgyzstan, Mongolia, Tajikistan, Uzbekistan) All countries except for Mongolia are former members of the Soviet Union and reflect this quality through inadequate infrastructure and a somewhat closed attitude toward international trade. There was growth through exports of commodities; however, continued progress in the region will rely on developing the private sector and diversifying away from natural resources. This progress can only be realized through enhanced transparency, governance and institutional quality. Efforts to restore the health of the banking systems in Kazakhstan, Tajikistan and Kyrgyzstan will be important to spur private investment and restore credit markets.
17
South America – (Argentina, Bolivia, Brazil, Chile, Colombia, Ecuador, Paraguay, Peru, Uruguay) South America had varying levels of success in this report. The scores ranged from Chile’s impressive 60.7 to Venezuela’s 39.94. Generally speaking, South America faces many of the same challenges that Central America faces. The continent trades a good deal, and scored well in National Policies, Best Practices, and Financial Services, but is severely lacking in government efficiency and services. Lack of both transportation and technology infrastructure, in addition to serious delays in basic legal functions (contract enforcement, registration of property) continue to pose serious obstacles to the long-term economic wellbeing of these countries.
18
Africa – (Benin, Batswana, Burkina Faso, Burundi, Cameroon, Cape Verde, Chad, Ethiopia, Ghana, Guinea, Cote d’Ivoire, Lesotho, Madagascar, Malawi, Mali, Mauritius, Niger, Rwanda, Senegal, South Africa, Swaziland, Tanzania, Uganda, Zambia) Africa’s scores range from highs in the 60s to lows in the 20s, with a mean of 40.47. Certain countries consistently fall in the top quartile as well as the bottom Botswana and Mauritius consistently outperform their peers in most categories, while Sudan, Guinea and Burundi often fall in the bottom quartile. Infrastructure continues to be an issue for most of these countries, attaining an average score of 17.4 for the region, compared to 85 for the exemplars. This is due to a continued lag in railroad development and broadband and computer access. Development of the region will rely on further investment in infrastructure as well as the Financial Services indicator, which range widely from lows in the teens to highs in the 70s. African countries did best in National Policies and Legal Enforcement, with averages in the 50s, which reflects relatively robust patent protection and the relatively low cost of starting a business.
19
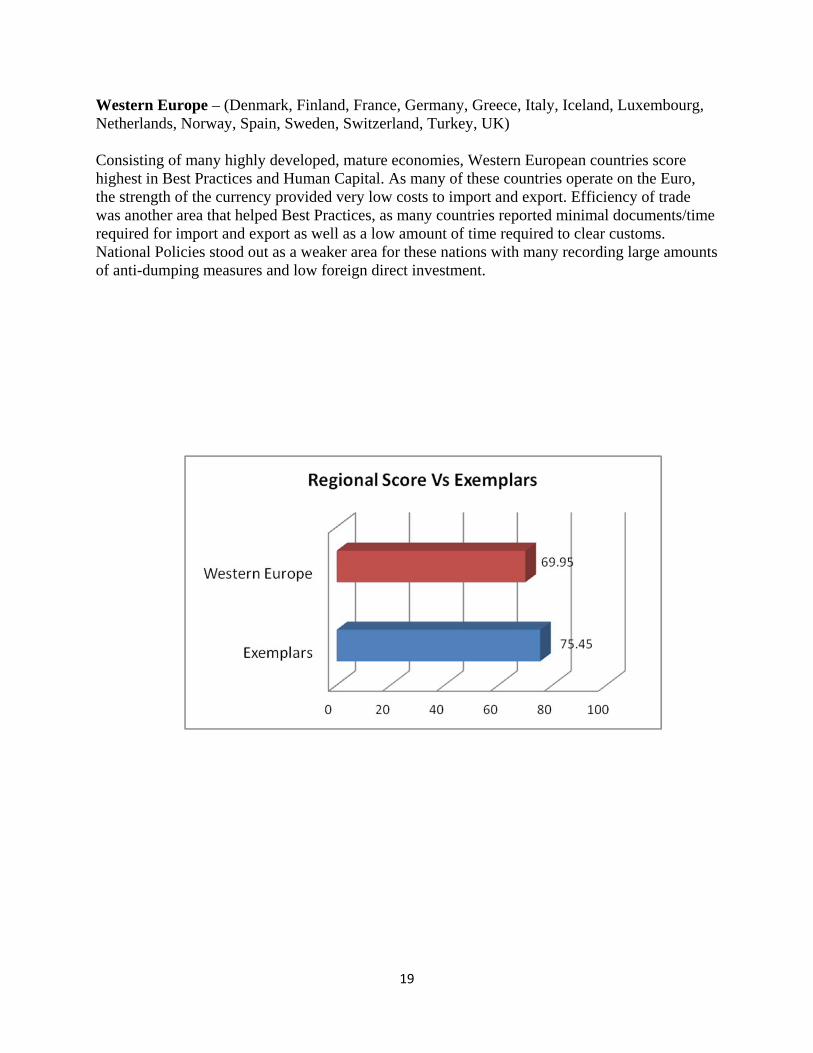
Western Europe – (Denmark, Finland, France, Germany, Greece, Italy, Iceland, Luxembourg, Netherlands, Norway, Spain, Sweden, Switzerland, Turkey, UK)
Consisting of many highly developed, mature economies, Western European countries score highest in Best Practices and Human Capital. As many of these countries operate on the Euro, the strength of the currency provided very low costs to import and export. Efficiency of trade was another area that helped Best Practices, as many countries reported minimal documents/time required for import and export as well as a low amount of time required to clear customs. National Policies stood out as a weaker area for these nations with many recording large amounts of anti-dumping measures and low foreign direct investment.
20
Eastern Asia - (Malaysia, Philippines, Singapore, Thailand, Cambodia, China, Japan, Indonesia) Adhering to the East Asian model of development, these countries score notably well in the area of National Policies. However, just like in our 2008 study, these Asian countries had been noticeably lacking in Infrastructure. Several of the lesser-developed Asian nations have started to focus improvement on Human Capitol and National Policies. Liberalization of trade regimes within countries has occurred in a possible attempt to attract more FDI. The nations in this region have disparities in their respective stages of development; however, Japan has reached upper development in all fields, and Cambodia is still especially underdeveloped in areas of Legal Systems and Infrastructure. Overall, the trend is heavily focusing on increased industrialization and export of labor-intensive goods.
21
Aggregate Score Rankings and Index
The global aggregate mean score was 51.93 and the median score was 50.03. Singapore had the highest score with 83.01 and Angola had the lowest with 26.75. Compared to our 2008 study, Singapore still holds the highest score but has decreased by about 2.5 points and Angola still records the lowest score, which is about three points below what they received in 2008. The mean has decreased by four and the median by about 4.3. Therefore, an individual country score decrease of zero to just less than four points can be taken with somewhat of a discount as the entire scale has shifted downward. The ranking and comparison of countries’ aggregate scores to one another has limitations. Most countries had different sets of available data. Some countries, particularly those that participated in the World Bank Enterprise Surveys, had more data available than others. This means some scores paint a more complete picture of a country than others and that countries are being judged on slightly different criteria. The comparison of countries’ aggregate scores should be undertaken with these considerations in mind.
Table 1: Countries by Ranking
1 Singapore 83.01
2 Netherlands 80.47
3 Luxemburg 79.18
4 Denmark 78.9
5 Finland 77.65
6 Canada 76.94
7 New Zealand 76.28
8 USA 75.35
9 Ireland 75.33
10 Sweden 75.08
11 United Kingdom 74.55
12 Norway 74.38
13 Belgium 74.17
14 Switzerland 73.7
15 Australia 72.78
16 Germany 69.94
17 Estonia 69.23
18 France 68.72
19 Iceland 67.49
20 Austria 67.38
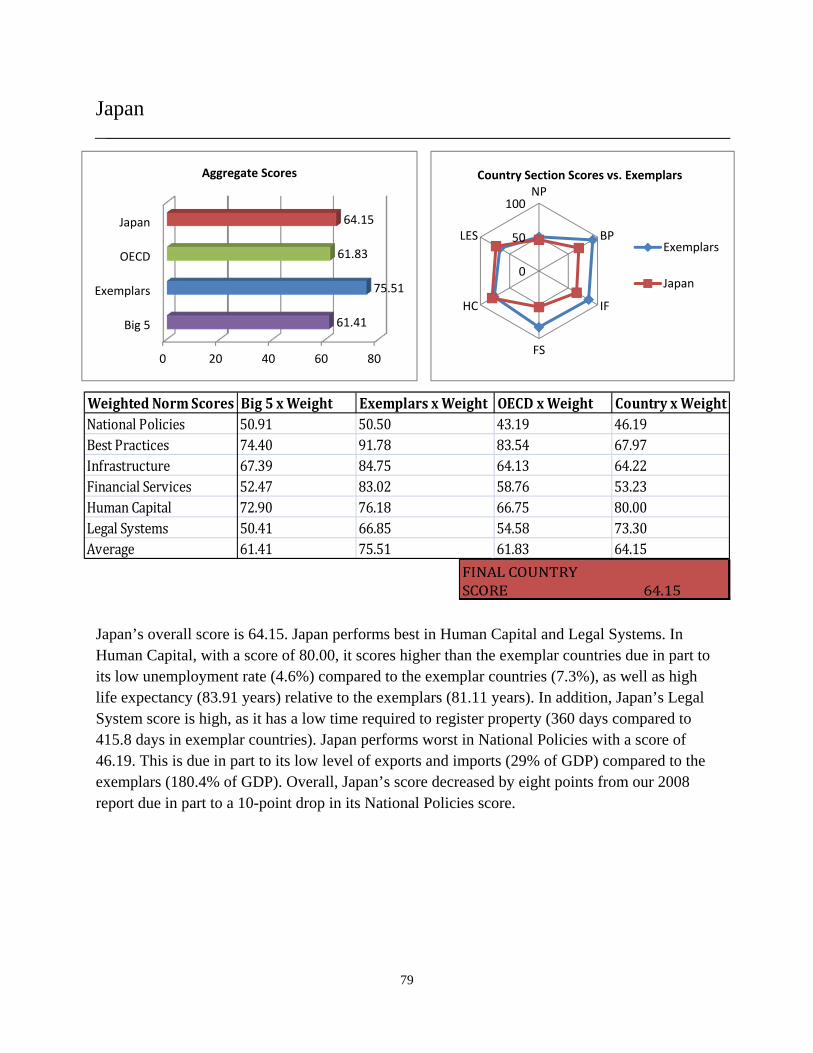
21 Japan 64.15
22 Mauritius 63.9
23 Israel 63.29
24 Czech 63.2
25 Portugal 63.02
26 Spain 63.01
27 Slovenia 63
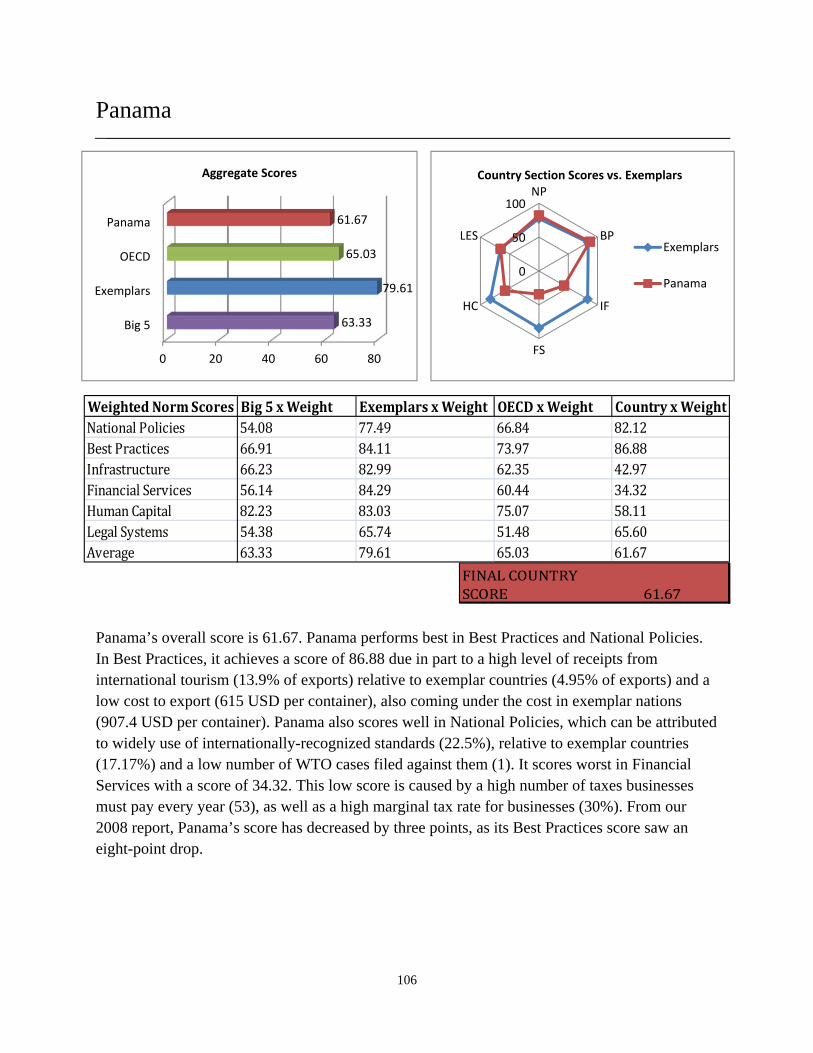
28 Panama 61.66
29 Malaysia 61.38
30 Chile 60.91
31 Lithuania 60.8
32 Bulgaria 58.76
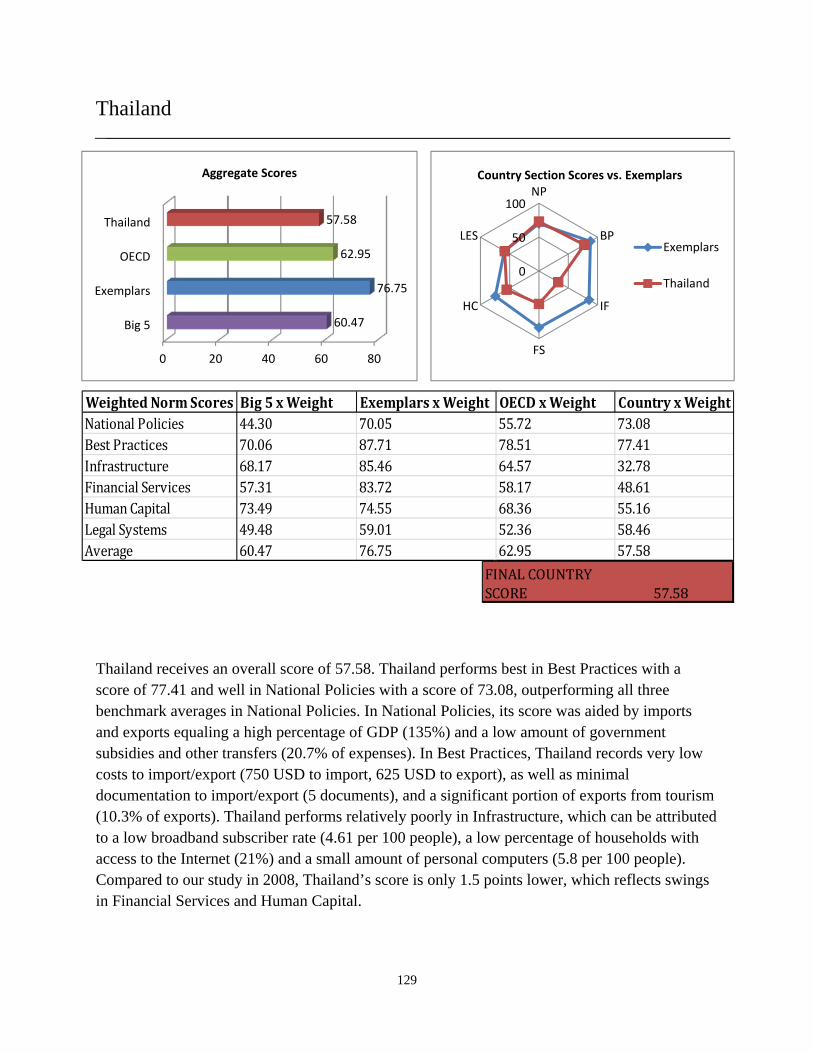
33 Thailand 57.58
34 Italy 57.5
35 Slovakia 57.03
36 Latvia 57
22
37 Peru 56.37
38 Hungary 55.13
39 Turkey 55.13
40 Costa Rica 55.05
41 Mongolia 54.39
42 Jamaica 54.34
43 Poland 54.28
44 Vietnam 54.03
45 Greece 53.76
46 Romania 53.55
47 Colombia 53.14
48 Tunisia 53.08
49 Macedonia 52.96
50 Armenia 52.16
51 Trinidad & Tobago 51.77
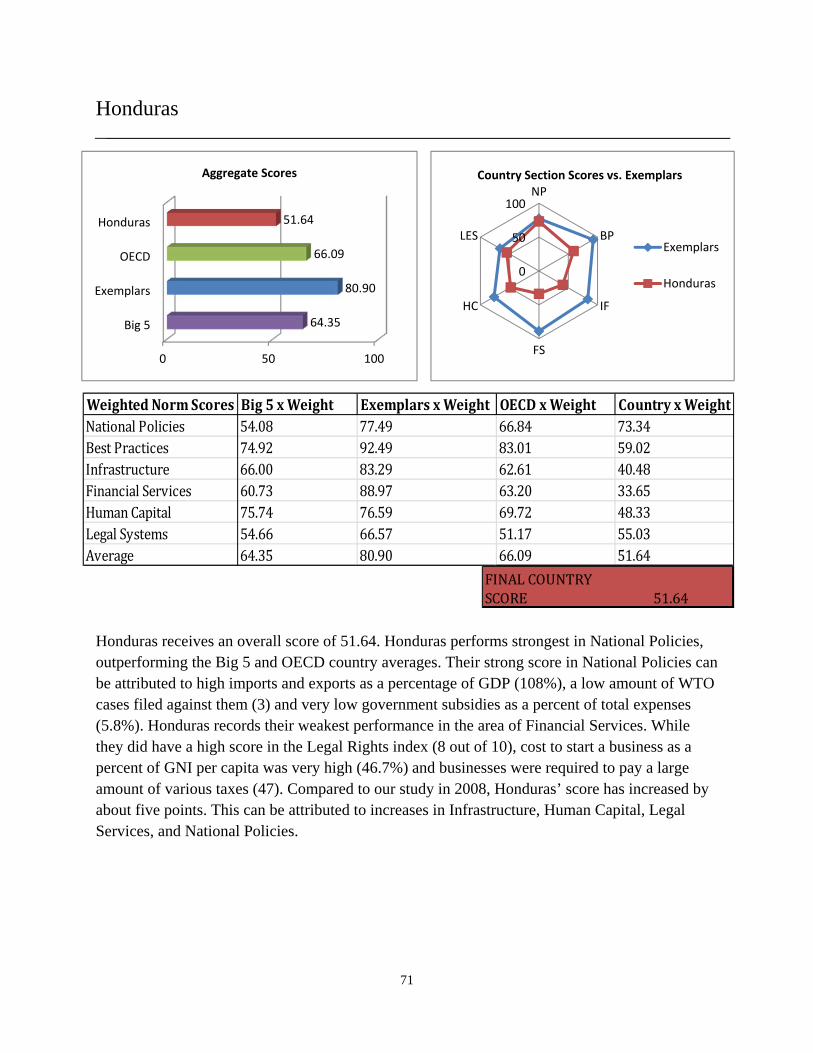
52 Honduras 51.64
53 Moldova 51.11
54 China 51.04
55 Cape Verde 50.85
56 Morocco 50.7
57 Croatia 50.4
58 Belarus 50.12
59 Uruguay 50.03
60 Mexico 49.76
61 Botswana 49.69
62 South Africa 49.46
63 Argentina 49.45
64 Ukraine 49.06
65 Jordan 48.68
66 Kyrgyzstan 47.67
67 Bosnia 47.42
68 Kuwait 47.34
69 Russia 47.34
70 Nicaragua 47.02
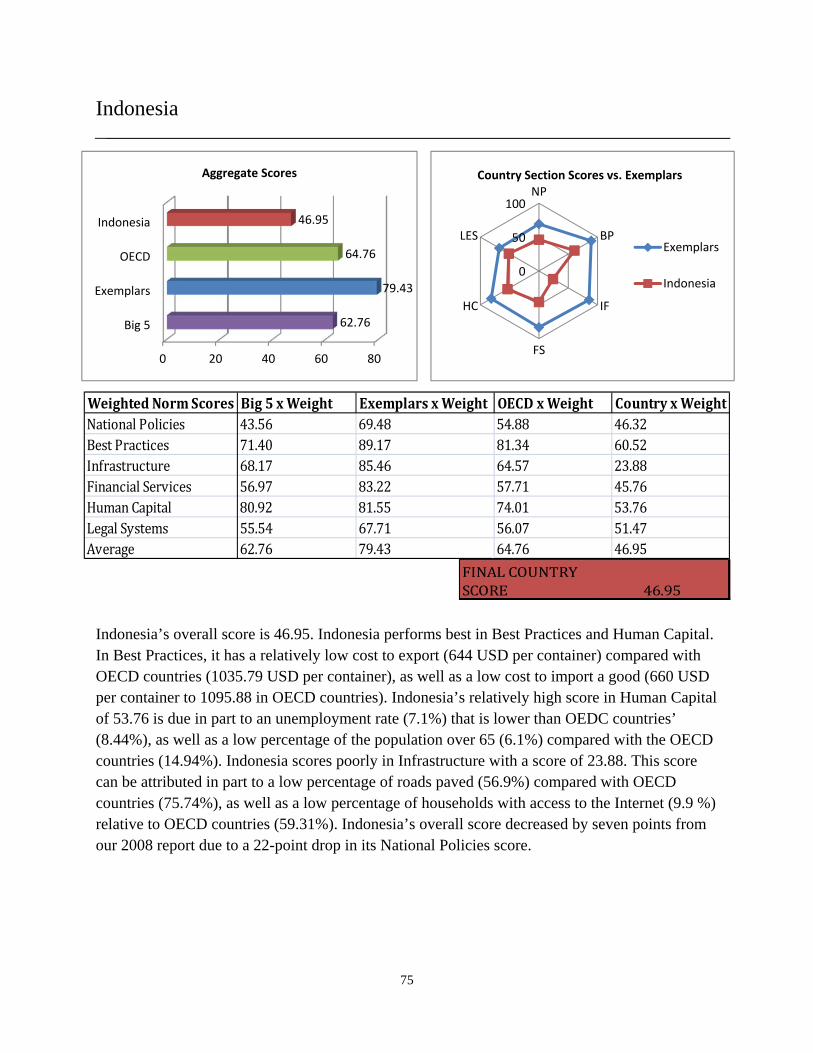
71 Indonesia 46.95
72 Albania 46.92
73 Lesotho 46.57
74 Egypt 46.12
75 Guatemala 46.09
76 Brazil 45.59
77 Dominican Republic 45.54
78 El Salvador 44.93
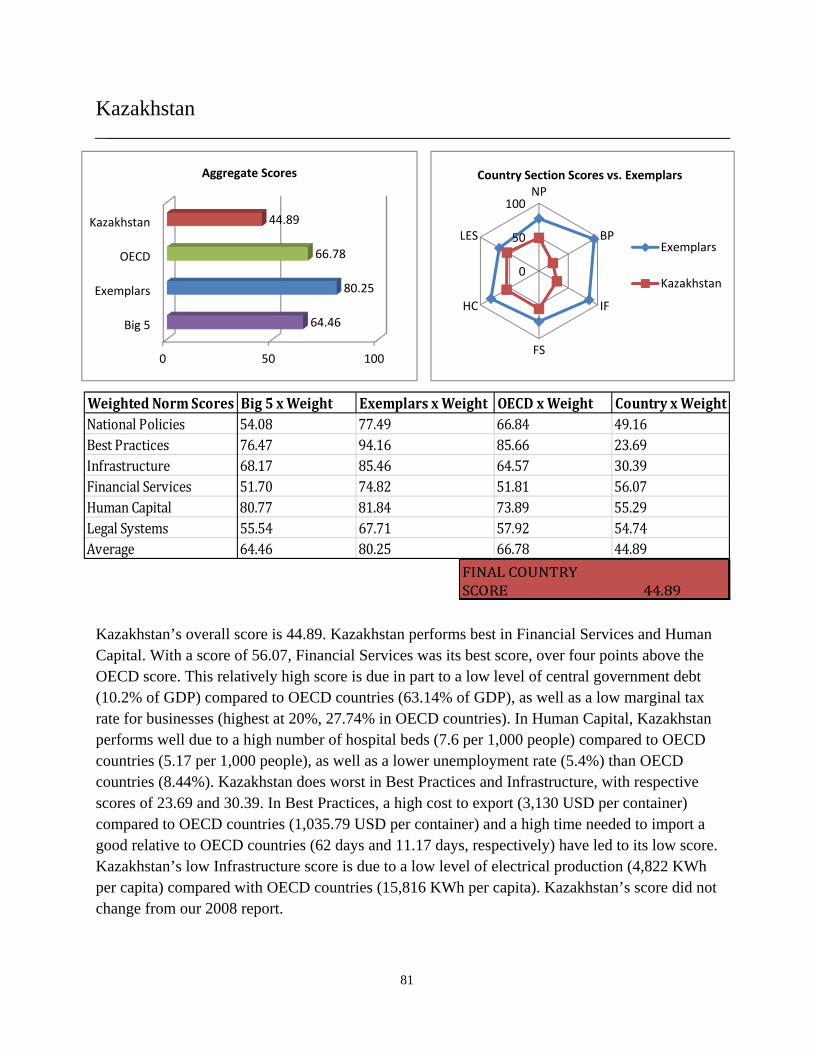
79 Kazakhstan 44.89
80 Lebanon 44.57
81 Ghana 44.17
82 Philippines 43.86
83 Kenya 43.65
84 Sri Lanka 43.39
85 Bolivia 43.34
86 Senegal 43.32
87 Swaziland 42.84
88 Uganda 42.73
89 Azerbaijan 42.02
90 Paraguay 41.73
91 Tanzania 41.7
92 Ecuador 41.17
93 Cambodia 40.22
94 Madagascar 39.87
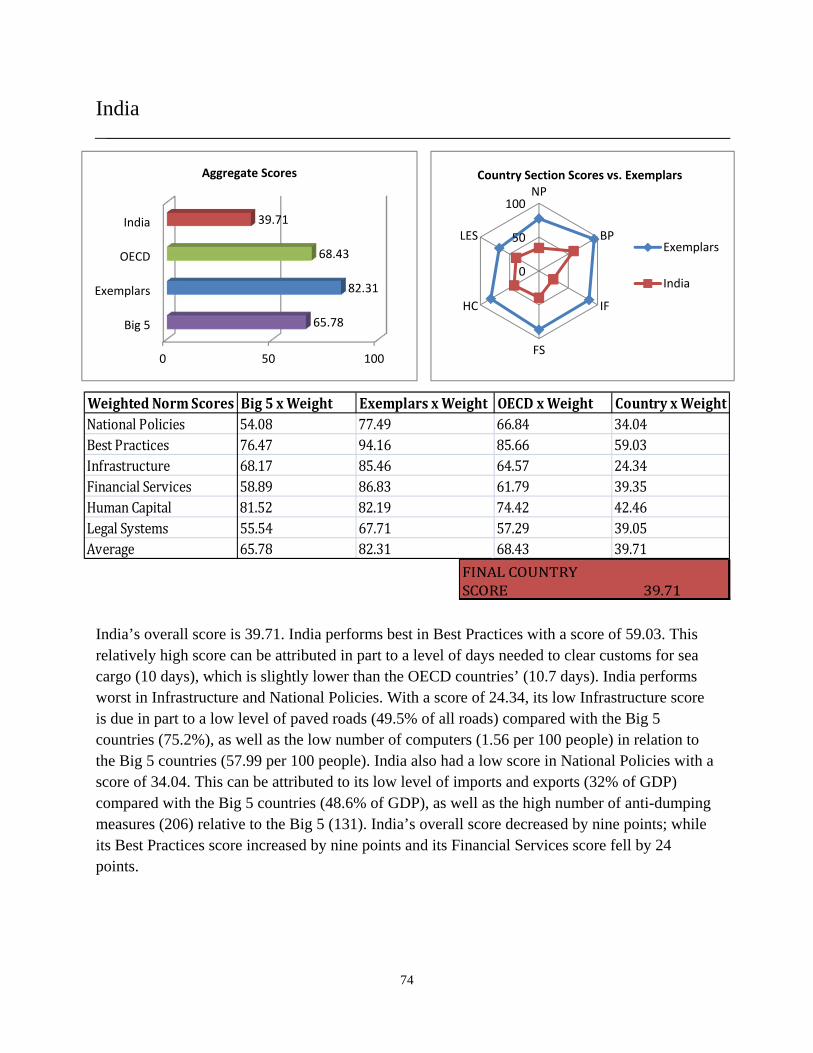
95 India 39.71
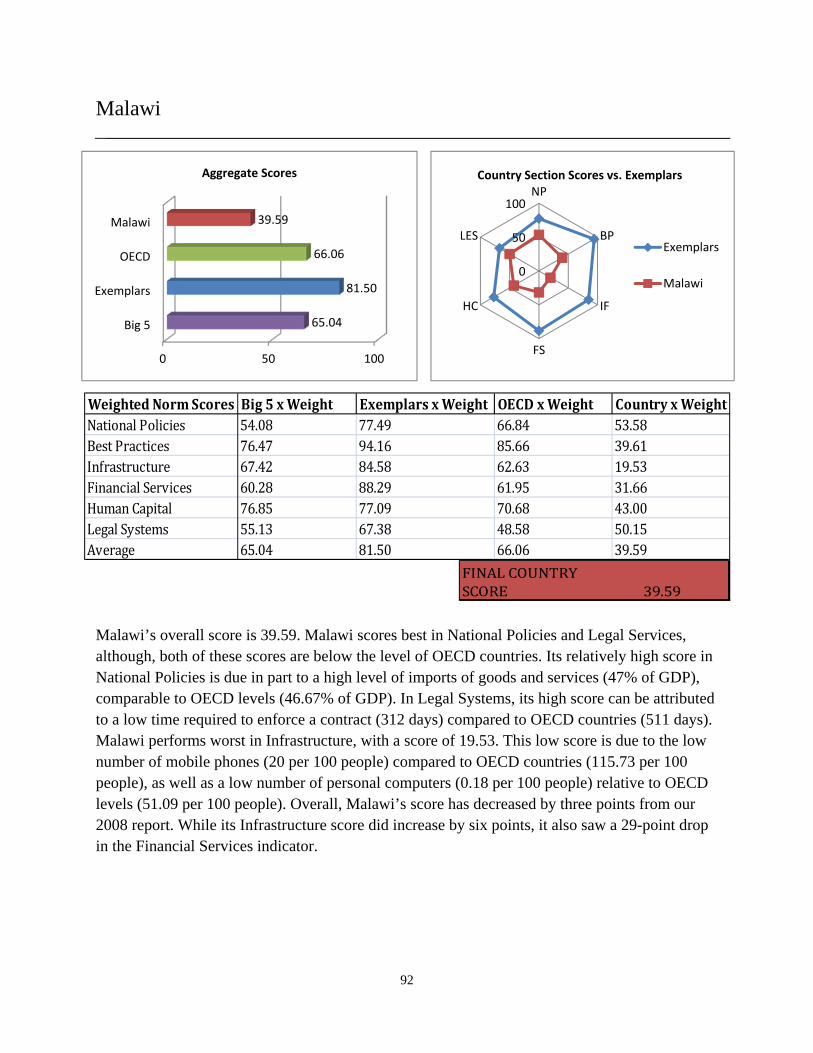
96 Malawi 39.58
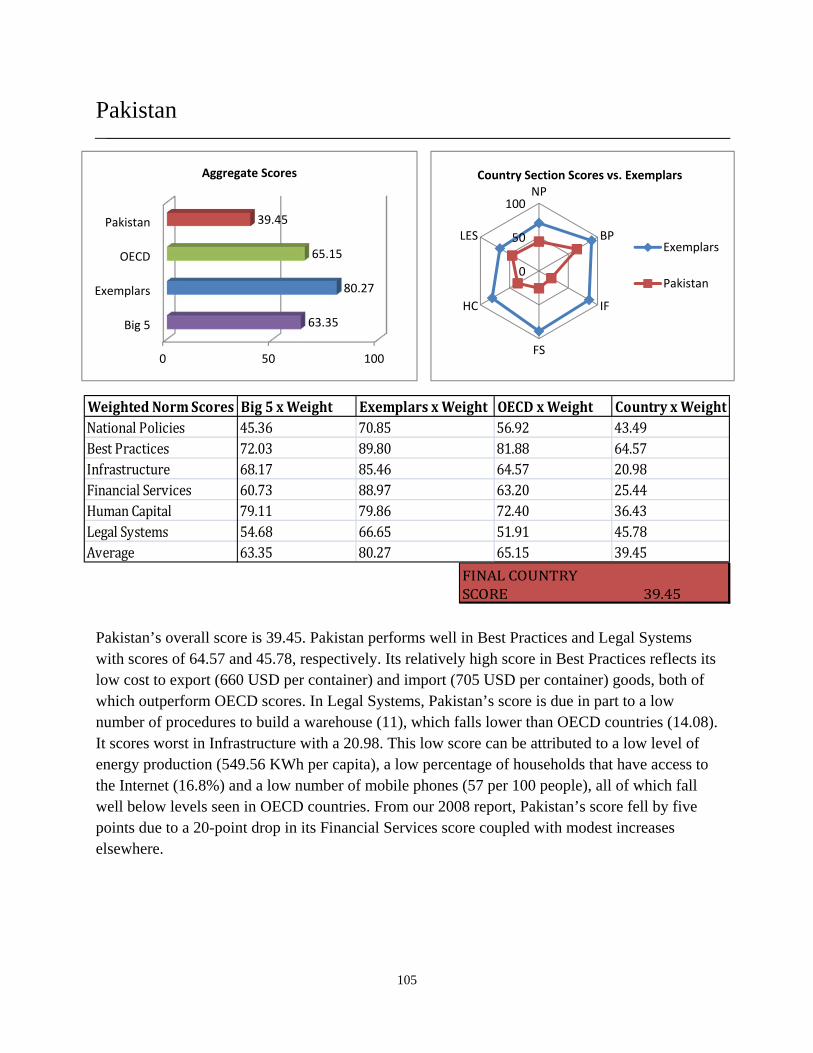
97 Pakistan 39.45
98 Ivory Coast 39.04
99 Burkina Faso 38.87
100 Bangladesh 37.6
101 Cameroon 37.31
102 Syria 36.86
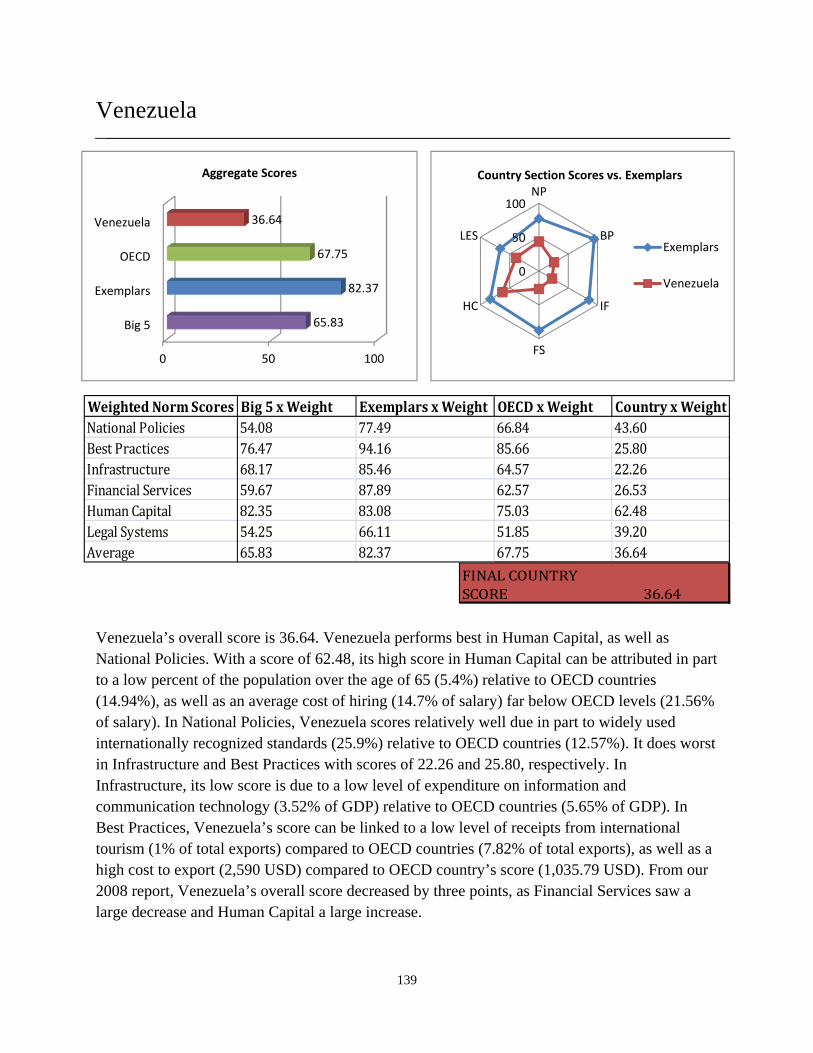
103 Venezuela 36.72
104 Benin 36.5
105 Mali 35.65
106 Tajikistan 35.48
23
107 Niger 35.24
108 Zambia 35.19
109 Ethiopia 34.85
110 Algeria 34.38
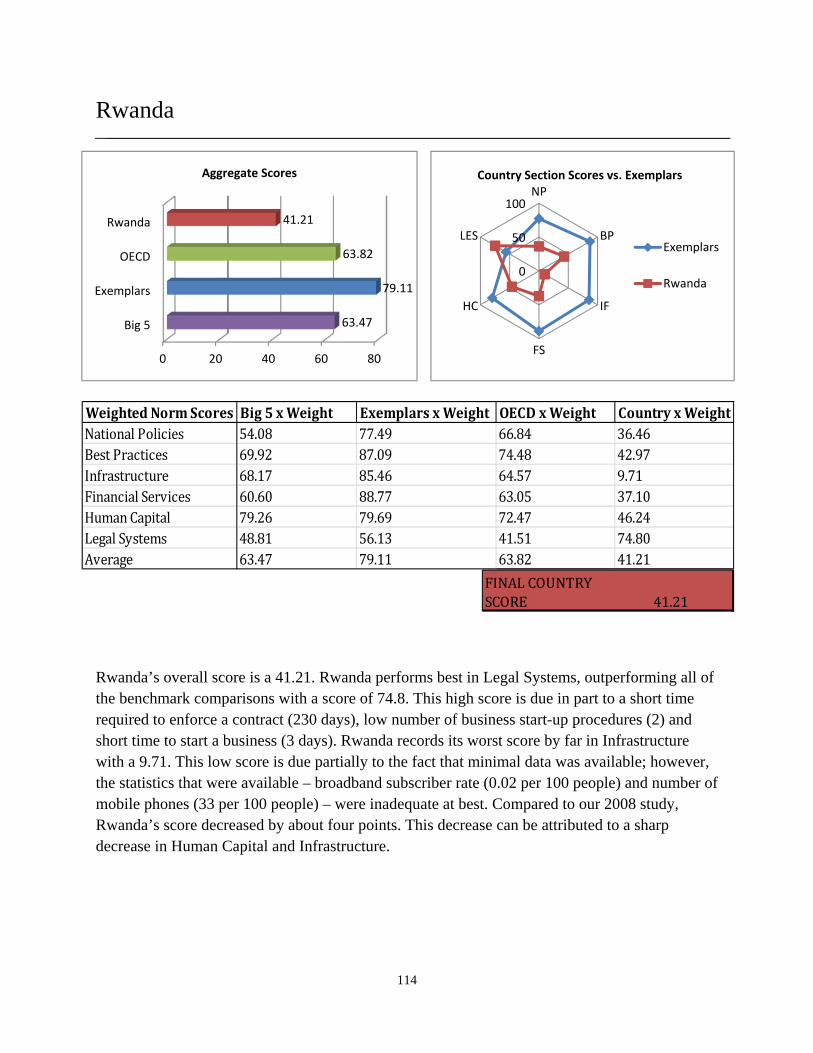
111 Rwanda 33.9
112 Chad 32.78
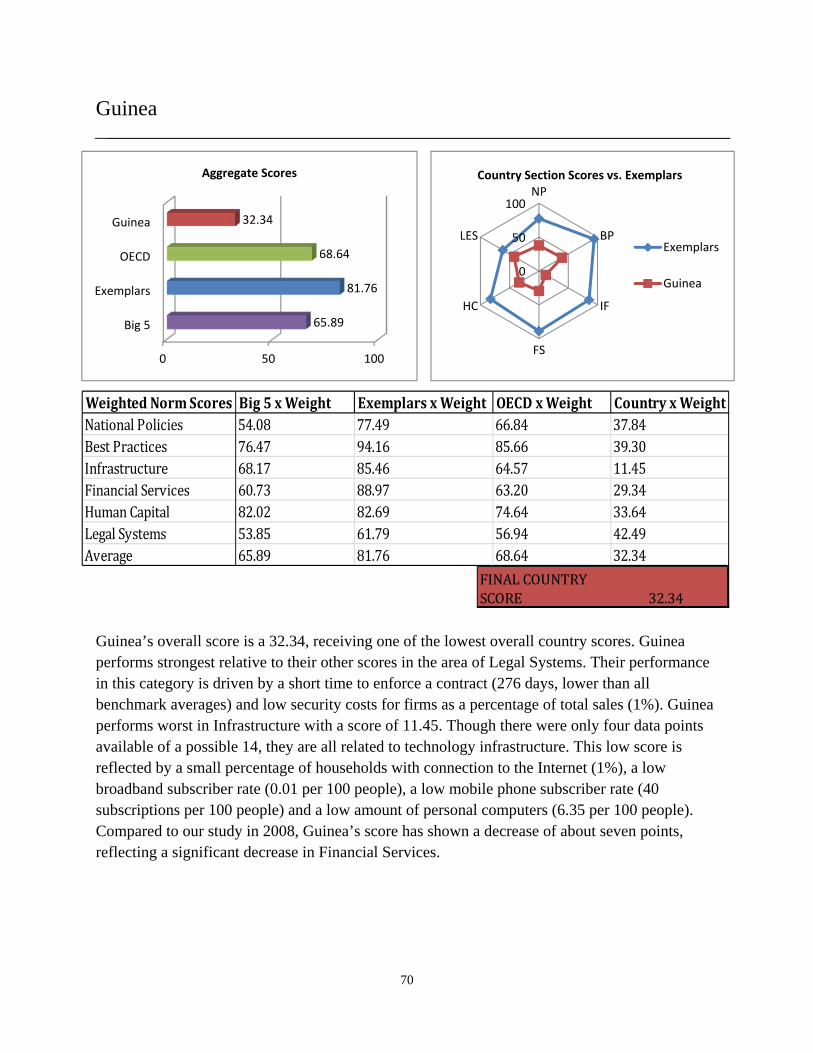
113 Guinea 32.3
114 Burundi 31.29
115 Uzbekistan 30.4
116 Sudan 28.41
117 Angola 26.75
24
Table 2: Alphabetical Country List
Albania 46.92
Algeria 34.38
Angola 26.75
Argentina 49.45
Armenia 52.16
Australia 72.78
Austria 67.38
Azerbaijan 42.02
Bangladesh 37.6
Belarus 50.12
Belgium 74.17
Benin 36.5
Bolivia 43.34
Bosnia 47.42
Botswana 49.69
Brazil 45.59
Bulgaria 58.76
Burkina Faso 38.87
Burundi 31.29
Cambodia 40.22
Cameroon 37.31
Canada 76.94
Cape Verde 50.85
Chad 32.78
Chile 60.91
China 51.04
Colombia 53.14
Costa Rica 55.05
Croatia 50.4
Czech 63.2
Denmark 78.9
Dominican Republic 45.54
Ecuador 41.17
Egypt 46.12
El Salvador 44.93
Estonia 69.23
Ethiopia 34.85
Finland 77.65
France 68.72
Germany 69.94
Ghana 44.17
Greece 53.76
Guatemala 46.09
Guinea 32.3
Honduras 51.64
Hungary 55.13
Iceland 67.49
India 39.71
Indonesia 46.95
Ireland 75.33
Israel 63.29
Italy 57.5
Ivory Coast 39.04
Jamaica 54.34
Japan 64.15
Jordan 48.68
Kazakhstan 44.89
Kenya 43.65
Kuwait 47.34
Kyrgyzstan 47.67
Latvia 57
Lebanon 44.57
Lesotho 46.57
Lithuania 60.8
Luxemburg 79.18
Macedonia 52.96
25
Madagascar 39.87
Malawi 39.58
Malaysia 61.38
Mali 35.65
Mauritius 63.9
Mexico 49.76
Moldova 51.11
Mongolia 54.39
Morocco 50.7
Netherlands 80.47
New Zealand 76.28
Nicaragua 47.02
Niger 35.24
Norway 74.38
Pakistan 39.45
Panama 61.66
Paraguay 41.73
Peru 56.37
Philippines 43.86
Poland 54.28
Portugal 63.02
Romania 53.55
Russia 47.34
Rwanda 33.9
Senegal 43.32
Singapore 83.01
Slovenia 63
Slovakia 57.03
South Africa 49.46
Spain 63.01
Sri Lanka 43.39
Sudan 28.41
Swaziland 42.84
Sweden 75.08
Switzerland 73.7
Syria 36.86
Tajikistan 35.48
Tanzania 41.7
Thailand 57.58
Trinidad and Tobago 51.77
Tunisia 53.08
Turkey 55.13
Uganda 42.73
Ukraine 49.06
United Kingdom 74.55
Uruguay 50.03
USA 75.35
Uzbekistan 30.4
Venezuela 36.72
Vietnam 54.03
Zambia 35.19
26
0
50
100NP
BP
IF
FS
HC
LES
Country Section Scores vs. Exemplars
Exemplars
Albania
0 50 100
Big 5
Exemplars
OECD
Albania
64.26
80.67
66.05
47.59
Aggregate Scores
Albania
Albania’s overall score is 47.59. This score is mostly due to its good performance in National Policies and Legal Systems. Albania’s performance in National Policies is roughly equivalent to the exemplars nation average and significantly higher than the Big 5 and OECD. The southeast European country has very high imports of goods and services (equivalent to 52% of GDP), as well as high levels of foreign direct investment (9.4% of GDP). Moreover, it scores better than the OECD and Big 5 in Legal Systems due to relatively short time requirements for contract enforcement (390 days) and a small number of procedures to start a business (5). Albania did very poorly in Infrastructure, Human Capital and Financial Services. In Human Capital, Albania has a high literacy score (95.9%) and life expectancy (75.59 years), but low secondary school enrollment (89%), infant mortality (14.12%) and net emigration (-3.33 immigrant per 1,000 people). Additionally, the Albanian unemployment rate is high (35.5%) with 44% of those employed working in agriculture. Compared to its results in our last report, Albania has seen improvement in areas such as National Policies. However, its overall score remained virtually unchanged.
Algeria’s overall score is 34.38. The African country performs best relative to other countries in Legal Services, falling 12 points shy of the OECD score. This relatively high score is pushed up by similar security costs for businesses as a percent of sales, as well as similar levels of corruption to OECD countries. Algeria scores significantly lower than the exemplars and OECD countries in Financial Services, as well as Infrastructure, bringing their total score down. In the Financial Services sector, the cost of business start-up procedures as a percent of gross national income per capita (12.1%) is much higher than in OECD countries (5.06%). In addition, the total tax payable by businesses (72% of gross profits) exceeded that of the OECD countries (53.34%). The low Infrastructure scores also bring down their overall score, especially in the information technology industry. Access to the Internet and to computers remains low; the broadband subscriber rate per one hundred people (2.54) was far lower than that of the OECD countries (25.42), as well as the exemplars (29.97). Since our 2008 report, however, Algeria’s score increased by nearly six points.
Angola’s overall score is 26.75. It performs best in Human Capital with a score of 40.54. Leading its strongest score was a very low hiring cost as a percentage of average salary (8%). Angola performs worst in Infrastructure and Financial Services. In Infrastructure, the low percentage of paved roads (10.4%) falls far behind levels seen in OECD countries (75.74%), as well as exemplars (91.37%). Like many countries in the region, broadband and personal computer access continues to lag (0.1 and 0.6 per one hundred people, respectively) compared to OECD countries (25.42 and 51.09, respectively). Like many other African nations, Angola’s Financial Sector also continually lags behind. The cost of starting a business is well over 100% of GNI per capita (118.9%), vastly greater than the cost in OECD countries (5.06%) and the exemplar countries (1.94%). Additionally, the higher marginal tax rate for businesses (53.2%) further constrains the Financial Services sector. Since our 2008 report, Angola’s overall score decreased by over two points. This decrease can be attributed to a decrease in the area of Human Capital.
Argentina’s overall score is 49.45. Argentina excels in certain areas, most notably National Policies and Human Capital. For the former, Argentina had far fewer WTO infractions on average (6) than the OECD countries (29.4) or the exemplar countries (18.2); similarly, fewer anti-dumping measures were taken against them (96) than the OECD countries (115.53). However, this success was off balanced by relatively low FDI (1.9% of GDP, compared to 12.59% for the OECD’s). Argentina also excelled in the Human Capital measurement. This can be attributed to the low unemployment rate (7.2%, compared to 8.44% for the OECD countries and 7.3% among the exemplars) and comparable adult literacy rates. Argentina’s Infrastructure score is markedly low, less than half of that of the OECD countries. Among other things, this can be attributed to lower broadband and computer access (9.56 and 9.04 per 100 people) and lower level of information and technology expenditure (4.83% of GDP) compared to the OECD countries (5.65%) and the exemplars (6.27%). Since our 2008 report, Argentina’s overall score increased by four points.
Armenia’s overall score is 52.17. It performs best in National Policies and Legal Systems. In National Policies and imports of goods and services as a percentage of GDP (45%) is almost equal to that of OECD countries (46.67%). Armenia’s score in Legal Systems of a 73.11 surpassed even that of the exemplars. This can be attributed in part to the relatively short time required to register a property (7 days), compared with OECD countries (31.2 days), and the time required to start a business (8 days), compared with OECD countries (12). However, Armenia’s infrastructure lags far behind development seen in other sectors; while they boast a large percentage of paved roads (93.6%, compared to 75.74% in OECD countries), the broadband availability (2.75 per 100 people) still falls far behind levels seen in OECD countries (25.42 per 100 people) and the exemplar countries (29.97 per 100 people). Compared to our 2008 report, Armenia’s score fell by two points.
Australia’s overall score is 72.78. Australia performed best in Best Practices and Legal Systems. It has very high international tourism receipts (14.2% of total exports) compared to other exemplars (4.95%), bringing the Best Practices score up. Australia also scored high in Legal Systems due to a very low time required to start a business (2 days) compared with exemplar countries (12 days) and a low time required to settle a dispute in court (1 year) compared to OECD countries (1.7 years). Australia performs worst in Infrastructure; due to the fact that it had a low percentage of paved roads (43.5%) compared with exemplar countries (91.37%), as well as a lower number of mobile phones (101 per 100 people) compared to the exemplar countries (128.6 per 100 people). Compared to our 2008 report, Australia’s score decreased by four points.
Austria’s overall score is 67.96. Austria performs best in Best Practices and Human Capital. It takes little time for air cargo to clear customs (2 days) compared to OECD countries, as well as low time needed to import a good (5 days) compared to OECD countries (11.17). In the Human Capital measurement, Austria boasts a high number of hospital beds (7.71 per 1,000 people) in relation to exemplar countries (4.82). Austria did poorly in National Policies due in part to a high level of government subsidies and other transfers (70.6% of expense). Compared to our 2008 report, Austria’s overall score fell by nearly nine points.
Azerbaijan’s overall score is 42.02. It performs best in Legal Systems and Human Capital. In Legal Systems, Azerbaijan had a high score due in part to a low time required to start a business (8 days) compared with the OECD countries (12 days), as well as a low time required to register property (11 days) compared to the OECD countries (31.2 days), as well as the exemplars (16 days). Moreover, Azerbaijan has a relatively high score in Human Capital, falling nine points shy of the OECD countries. It has a comparatively low unemployment rate (5%) compared with OECD countries (8.44%). Azerbaijan does poorly in Infrastructure and Best Practices. The low score in Infrastructure is due to Azerbaijan’s low level of electrical production per capita (2,084.05 kWh per capita) compared with OECD countries (15,816 kWh per capita). Azerbaijan also has a low Best Practices score of 29.76 due to a high number of days needed to export goods (38 days) compared with OECD countries (10.9 days) and exemplars (6.8 days). Overall, its score decreased by over two points compared with our 2008 report.
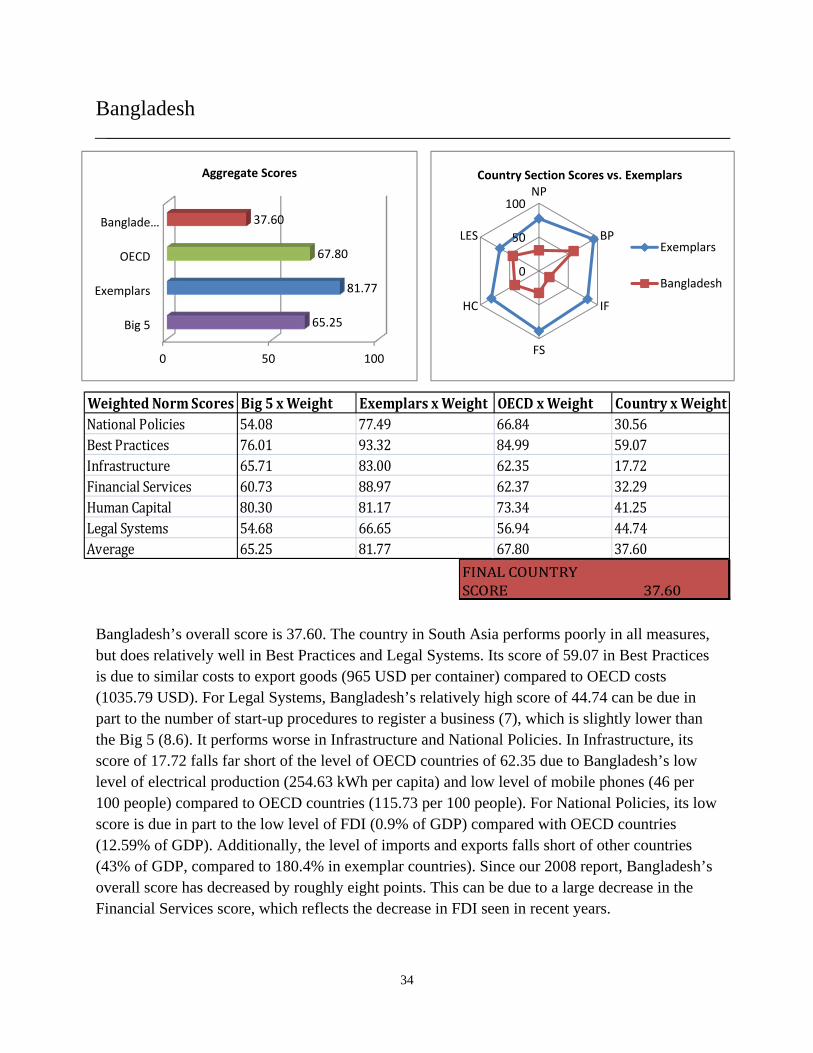
Bangladesh’s overall score is 37.60. The country in South Asia performs poorly in all measures, but does relatively well in Best Practices and Legal Systems. Its score of 59.07 in Best Practices is due to similar costs to export goods (965 USD per container) compared to OECD costs (1035.79 USD). For Legal Systems, Bangladesh’s relatively high score of 44.74 can be due in part to the number of start-up procedures to register a business (7), which is slightly lower than the Big 5 (8.6). It performs worse in Infrastructure and National Policies. In Infrastructure, its score of 17.72 falls far short of the level of OECD countries of 62.35 due to Bangladesh’s low level of electrical production (254.63 kWh per capita) and low level of mobile phones (46 per 100 people) compared to OECD countries (115.73 per 100 people). For National Policies, its low score is due in part to the low level of FDI (0.9% of GDP) compared with OECD countries (12.59% of GDP). Additionally, the level of imports and exports falls short of other countries (43% of GDP, compared to 180.4% in exemplar countries). Since our 2008 report, Bangladesh’s overall score has decreased by roughly eight points. This can be due to a large decrease in the Financial Services score, which reflects the decrease in FDI seen in recent years.
Belarus’ overall score is 50.13. Belarus performs best in Legal Systems and Human Capital. Its score of 71.78 in Legal Systems puts them well above even the exemplar’s score of 55.36. This is due in part to low time needed for enforcing a contract (275 days) compared with OECD countries (511 days), as well as low time required to start a business (5 days) compared to OECD countries (12 days). Belarus’ Infrastructure score received a ranking of 19.80. This is due in part to a low number of personal computers (0.8 per 100 people), which falls far short of the levels of OECD countries (51.09 per 100 people) and exemplars (79.97 per 100 people). In addition, Belarus scored low in Best Practices, as its time required to export goods (15 days) is much higher than that of OECD countries (10.9 days). Compared to our 2008 report, Belarus’ score has decreased by roughly two points, as their Infrastructure has fallen by 10 points.
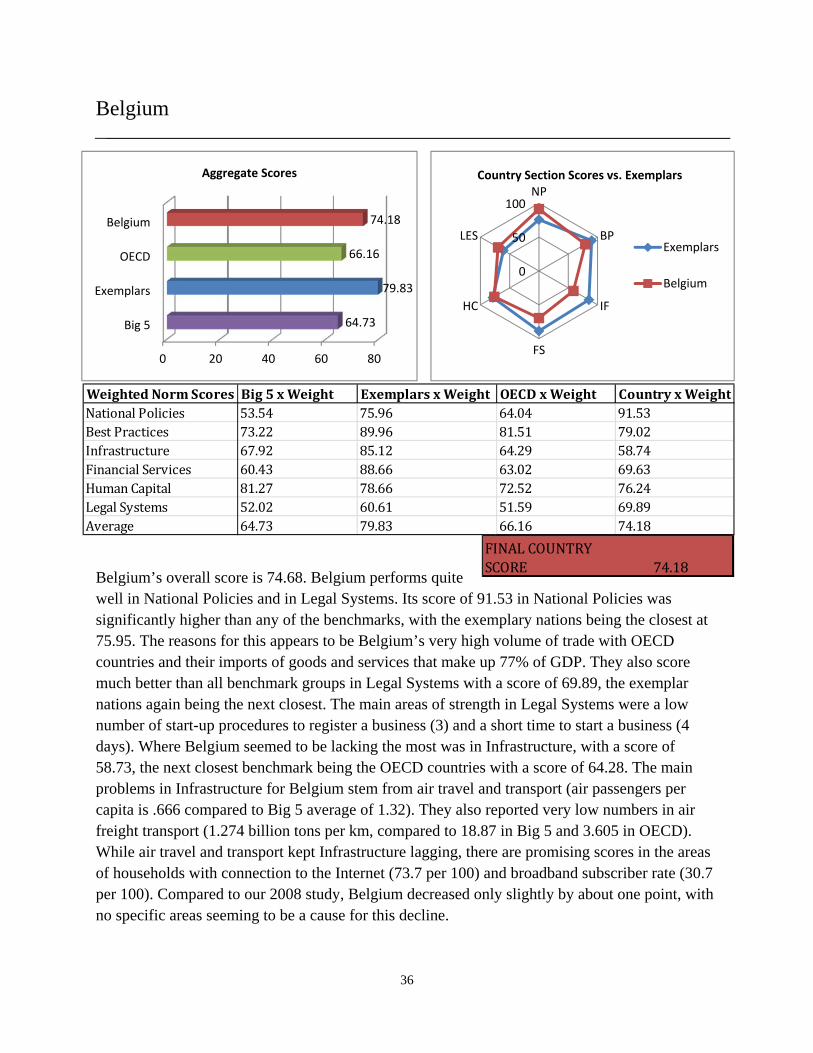
Belgium’s overall score is 74.68. Belgium performs quite well in National Policies and in Legal Systems. Its score of 91.53 in National Policies was significantly higher than any of the benchmarks, with the exemplary nations being the closest at 75.95. The reasons for this appears to be Belgium’s very high volume of trade with OECD countries and their imports of goods and services that make up 77% of GDP. They also score much better than all benchmark groups in Legal Systems with a score of 69.89, the exemplar nations again being the next closest. The main areas of strength in Legal Systems were a low number of start-up procedures to register a business (3) and a short time to start a business (4 days). Where Belgium seemed to be lacking the most was in Infrastructure, with a score of 58.73, the next closest benchmark being the OECD countries with a score of 64.28. The main problems in Infrastructure for Belgium stem from air travel and transport (air passengers per capita is .666 compared to Big 5 average of 1.32). They also reported very low numbers in air freight transport (1.274 billion tons per km, compared to 18.87 in Big 5 and 3.605 in OECD). While air travel and transport kept Infrastructure lagging, there are promising scores in the areas of households with connection to the Internet (73.7 per 100) and broadband subscriber rate (30.7 per 100). Compared to our 2008 study, Belgium decreased only slightly by about one point, with no specific areas seeming to be a cause for this decline.
Benin’s overall score is 36.5. Benin performs best in Best Practices with 55.78, which relative to the benchmark countries was still very low. Receipts from international tourism as a percent of exports showed promise (9.1%); however, while cost to export was on par with OECD countries, cost to import was much higher than any of the benchmarks with documents required for import being very high as well. Closest to benchmark average was Legal Systems in which they score a 45.5, but a very low transparency rating, high time to build a warehouse, high time to enforce a contract, and high time to start a business stood in the way of a higher mark. Infrastructure is the worst performing area for Benin with a score of 17.62. Low broadband subscriber rates (.4 out of 100 people) and personal computer use (0.7 out of 100 people) show signs that technology infrastructure is nonexistent or in a state of neglect from government attention. Compared to their score in 2008, Benin’s score decreased by four points. This can be attributed to a large decrease in the Financial Sector score.
Bolivia’s overall score is 43.35. Bolivia performs best in Best Practices with a score of 66.17. It has a very short amount of time for goods to clear customs (4 days). Also, tourism as a percentage of total exports (5%) is slightly above that of the Big 5 and exemplar countries. Bolivia does poorly in Infrastructure and Financial Services. In Infrastructure, the percent of roads paved (7.9%) was far behind OECD countries (75.74%). In addition, the number of Internet servers (10 per one million people) was far below the OECD level (1,056 per million), and the number of personal computers (2.33 per 100 people) was behind that of OECD countries (51.09). In Financial Services, Bolivia received a low score on the legal rights index (1 out of 10), and the cost of starting a business (90.4% of Gross National Income per capita) was far above that of OECD countries (5.06%). Compared to 2008, Bolivia scored three points lower, which reflects a much lower score in Financial Services.
Bosnia and Herzegovina scores a 47.26 overall. The worst performing areas for Bosnia and Herzegovina were Infrastructure and Financial Services. Inefficient bureaucracies and spending, lack of infrastructure and large burdens in registration processes were major areas that held them back from a much better score. Burdens for business registration, in particular, allowed them to register only 0.0005 new businesses per capita, one-tenth the OECD average. Technological Infrastructure seems to be holding Bosnia and Herzegovina back as well. The broadband subscriber rate (8.3 per 100 people) was a little over three times lower than that of the OECD benchmark, and they record a low number of secure Internet serves per one million people (20). On a positive note, Bosnia and Herzegovina does very well in National Policies and performs adequately in Best Practices and Legal Systems. Internationally recognized standards are used by a large number of firms nationwide (30.1%), almost doubling the performance of the exemplar and OECD nations. Receipts from international tourism accounted for a solid percent of exports (10.1%). Compared to our 2008 study, Bosnia and Herzegovina scored almost nine points lower. This decrease may be attributed to a lack of policy development on the part of the government to facilitate a growing economy.
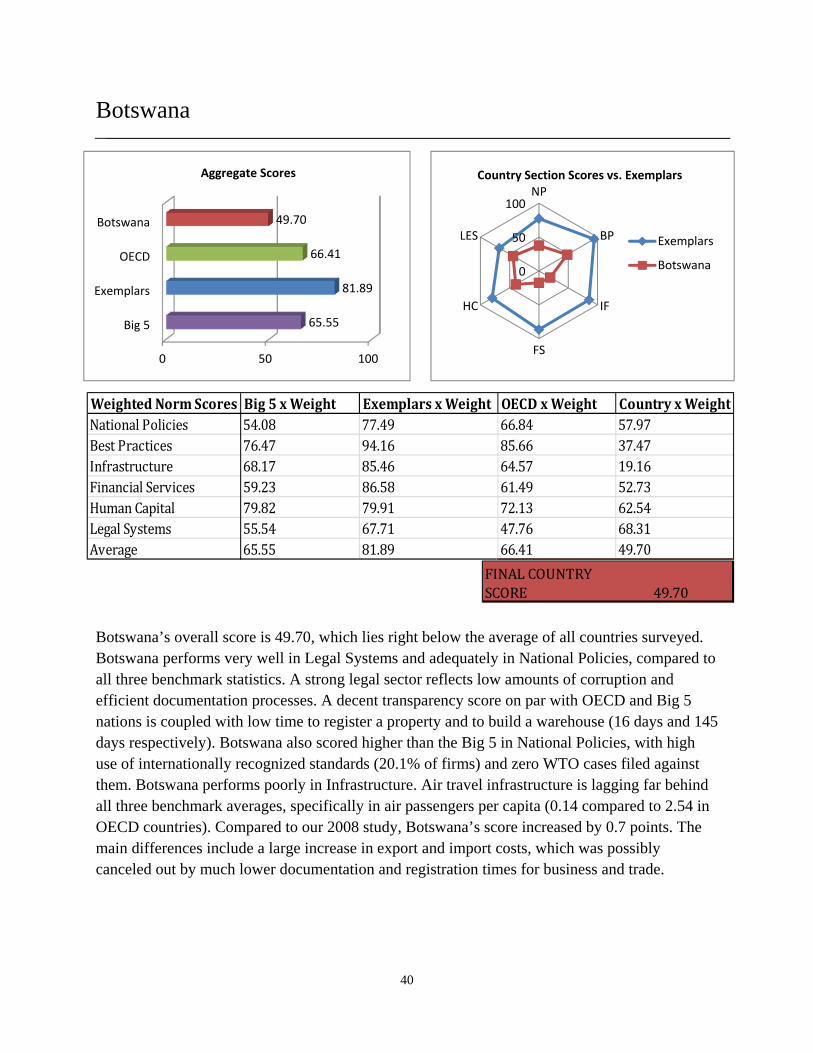
Botswana’s overall score is 49.70, which lies right below the average of all countries surveyed. Botswana performs very well in Legal Systems and adequately in National Policies, compared to all three benchmark statistics. A strong legal sector reflects low amounts of corruption and efficient documentation processes. A decent transparency score on par with OECD and Big 5 nations is coupled with low time to register a property and to build a warehouse (16 days and 145 days respectively). Botswana also scored higher than the Big 5 in National Policies, with high use of internationally recognized standards (20.1% of firms) and zero WTO cases filed against them. Botswana performs poorly in Infrastructure. Air travel infrastructure is lagging far behind all three benchmark averages, specifically in air passengers per capita (0.14 compared to 2.54 in OECD countries). Compared to our 2008 study, Botswana’s score increased by 0.7 points. The main differences include a large increase in export and import costs, which was possibly canceled out by much lower documentation and registration times for business and trade.
Brazil’s overall score is 45.59. Brazil performs best in the areas of National Policies and Financial Services. Regarding National Policies, Brazil recorded a high use of internationally recognized standards (25.7% of total firms), as well as a low amount of WTO cases filed against them (15). Additionally, compared to the Big 5 and OECD averages, they had a decently low number of anti-dumping measures (75 compared to exemplar average of 153). In the area of Financial Services, they showed promise with moderate to low central government debt (61% of GDP) and very low total number of tax payments to be made by businesses (9). The main area for improvement for Brazil is in Infrastructure, where they recorded their lowest score of 35.25. This performance was led mainly by the technology infrastructure, which recorded low scores in personal computer usage (10.5 out of 100 people) and broadband subscriber rate (6.81 per 100 people). Something of note, however, is that Brazil’s information and communication technology expenditure was exactly on par with that of the Big 5, OECD and exemplar nations, meaning that they have been taking important steps to improve the country’s ICT infrastructure over recent years. Compared to our 2008 study, Brazil scored two points lower, which reflects lower scores in National Policies and Financial Services.
Bulgaria’s overall score is 58.77. Bulgaria receives its best marks in National Policies and Legal Systems. In National Policies, Bulgaria’s patent protection was on par with the Big 5, OECD, and exemplar benchmarks (with a rating of 4.54 out of 10), and they also record good trade levels with imports and exports (118% of GDP). Their strong Legal Systems score is driven by ease of doing business. Time to enforce a contract (564 days), time to register a property (15 days) and time to start-up a business (18 days) were all much lower than benchmark comparisons. Along with these examples, business procedures in Bulgaria proved to be very efficient relative to some of their other policies. Bulgaria was lacking the most in Infrastructure where they scored a 39.81, compared to a 64.2 in OECD countries and an 85.05 in the exemplar countries. Coupled with lacking air passenger transport per capita, Bulgaria has some of the lowest data in air transport of freight (2 million tons/km compared to 18,873 million tons/km in the Big 5). Compared to our study from 2008, Bulgaria has shown an improvement of two points. This improvement appears to be the result of a strengthening of National Policies and Human Capital from four years ago.
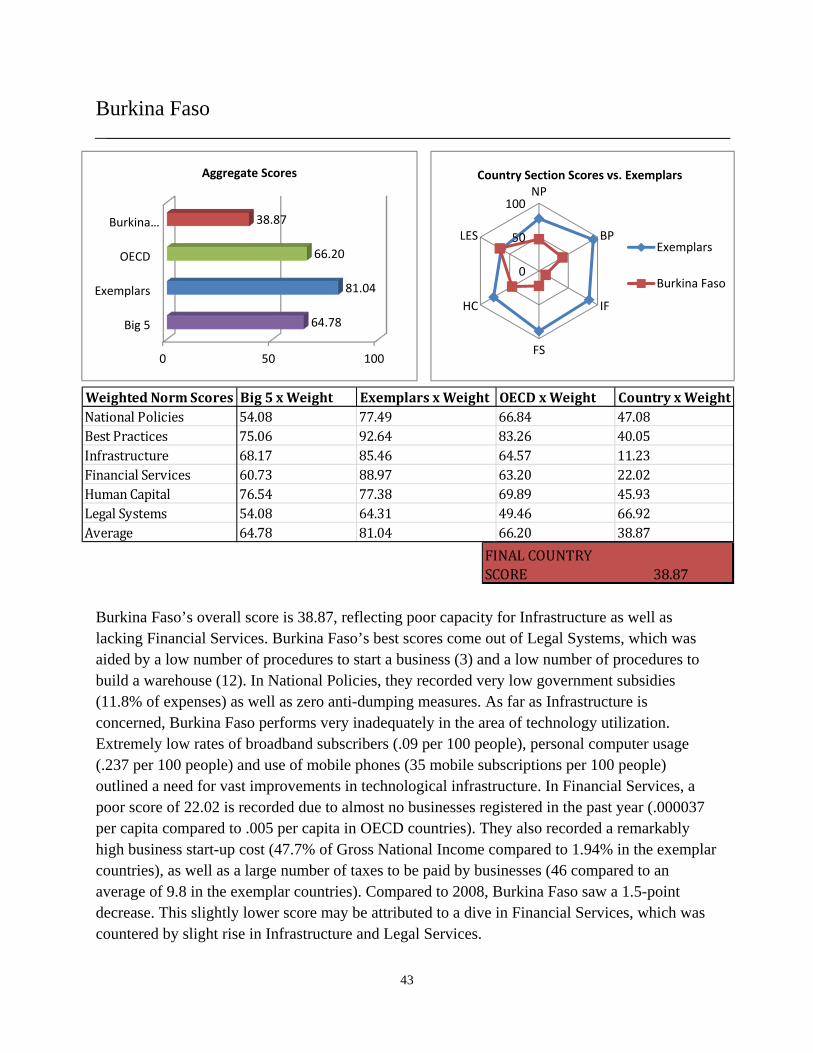
Burkina Faso’s overall score is 38.87, reflecting poor capacity for Infrastructure as well as lacking Financial Services. Burkina Faso’s best scores come out of Legal Systems, which was aided by a low number of procedures to start a business (3) and a low number of procedures to build a warehouse (12). In National Policies, they recorded very low government subsidies (11.8% of expenses) as well as zero anti-dumping measures. As far as Infrastructure is concerned, Burkina Faso performs very inadequately in the area of technology utilization. Extremely low rates of broadband subscribers (.09 per 100 people), personal computer usage (.237 per 100 people) and use of mobile phones (35 mobile subscriptions per 100 people) outlined a need for vast improvements in technological infrastructure. In Financial Services, a poor score of 22.02 is recorded due to almost no businesses registered in the past year (.000037 per capita compared to .005 per capita in OECD countries). They also recorded a remarkably high business start-up cost (47.7% of Gross National Income compared to 1.94% in the exemplar countries), as well as a large number of taxes to be paid by businesses (46 compared to an average of 9.8 in the exemplar countries). Compared to 2008, Burkina Faso saw a 1.5-point decrease. This slightly lower score may be attributed to a dive in Financial Services, which was countered by slight rise in Infrastructure and Legal Services.
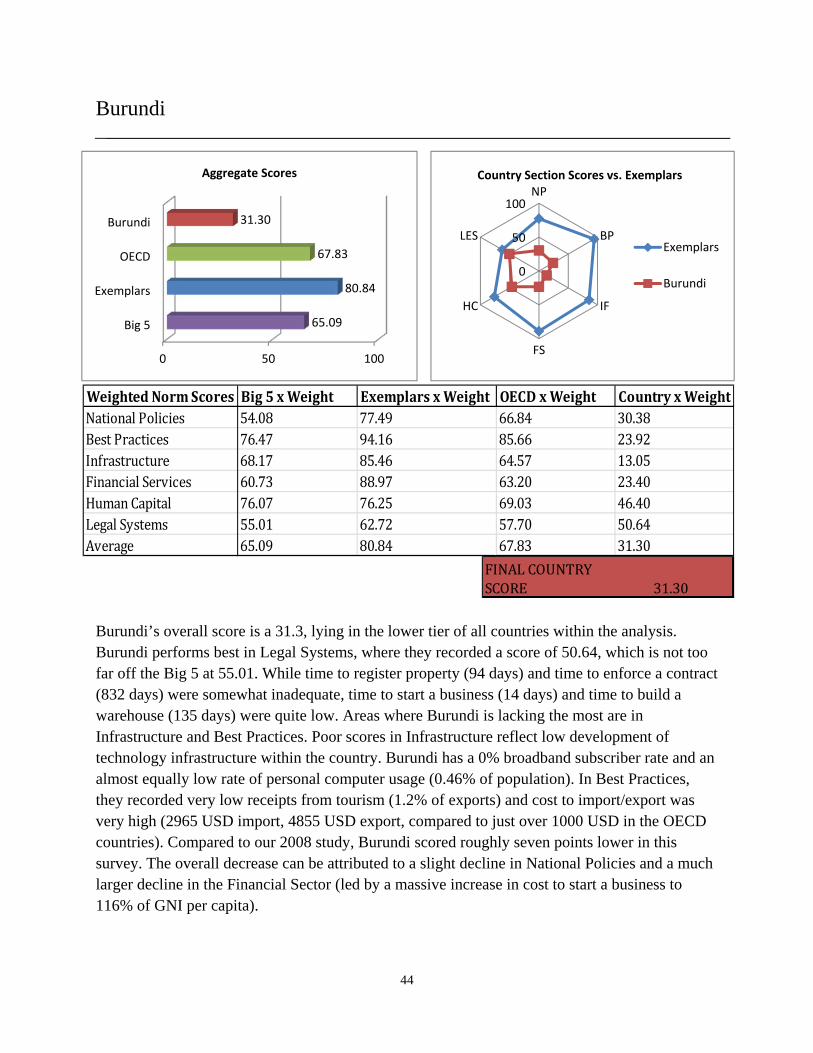
Burundi’s overall score is a 31.3, lying in the lower tier of all countries within the analysis. Burundi performs best in Legal Systems, where they recorded a score of 50.64, which is not too far off the Big 5 at 55.01. While time to register property (94 days) and time to enforce a contract (832 days) were somewhat inadequate, time to start a business (14 days) and time to build a warehouse (135 days) were quite low. Areas where Burundi is lacking the most are in Infrastructure and Best Practices. Poor scores in Infrastructure reflect low development of technology infrastructure within the country. Burundi has a 0% broadband subscriber rate and an almost equally low rate of personal computer usage (0.46% of population). In Best Practices, they recorded very low receipts from tourism (1.2% of exports) and cost to import/export was very high (2965 USD import, 4855 USD export, compared to just over 1000 USD in the OECD countries). Compared to our 2008 study, Burundi scored roughly seven points lower in this survey. The overall decrease can be attributed to a slight decline in National Policies and a much larger decline in the Financial Sector (led by a massive increase in cost to start a business to 116% of GNI per capita).
Cambodia’s overall score is 40.22. Cambodia performs well in National Policies, outperforming the Big 5, and also did relatively well in Best Practices. In National Policies, Cambodia recorded strong imports and exports (114% of GDP), along with a decent amount of FDI (7% of GDP) and low government subsidies (18.6% of total expenses compared to 58% in OECD countries). In Best Practices, Cambodia recorded very high receipts from tourism (20.5% of exports) and they also have remarkably low costs to import and export (732 USD per container for exports, 872 USD for imports). Cambodia performs very poorly in Infrastructure, with a score of 12.17, and Financial Services, with a score of 29.84. Poor Infrastructure scores reflect low amounts of air travel and air transport of freight, as well as almost non-existent availability and use of technological infrastructure. As far as Financial Services, business start-up costs are very high (109.7% of Gross National Income per capita), and they also recorded a high number of taxes payable by businesses (39). Compared to our 2008 survey, Cambodia scored nine points lower. This significant decrease can possibly be attributed to much lower scores in Financial Services and Human Capital.
Cameroon’s overall score is 37.31. Cameroon performed relatively well in Legal Systems and National Policies. In Legal Systems, they outperform the benchmarks’ averages in start-up procedures (5) and time to start a business (15 days), as well as procedures for building a warehouse (11). As far as National Policies, Cameroon has relatively widely used internationally recognized standards for business (20.4% of firms compared to 12.57% in OECD countries) and zero WTO cases filed against them. The areas where Cameroon appears to have fallen behind are in Infrastructure and Financial Services. Air transport of passengers and freight was almost nonexistent and the total percentage of roads that are paved is very low (17%). Electrical production is very poor (292kWh per capita) and any form of technological infrastructure is barely evident (0.01% broadband subscriber rate and 0.9% personal computer usage). Compared to our 2008 study, Cameroon’s score has dropped by about four points. This decline can be attributed to a decline in Best Practices, possibly due to an increase in difficulties of import/export, as well as a decline in Financial Services.
Canada’s score of 76.94 gives them the seventh highest overall score in our survey. Regarding available information and data, Canada outperformed the exemplar, Big 5 and OECD nations. Canada performed best in Legal Systems and Financial Services. They recorded very short time required to start a business (5 days), as well as only one required business start-up procedure. Regarding Financial Services, they have low central government debt as a percent of GDP (51.3%), low long-term interest rates (2.2%) and low cost of business start-up procedures as a percent of GNI per capita (0.4%). Most of these statistics reflect their respectable number of newly registered businesses per capita in 2011 (0.005, which is on par with OECD at 0.0052 and above the exemplar countries at .002). While Canada performed very well, their worst area of performance was in National Policies, where they recorded a low level of FDI as a percent of GDP (1.4%) and somewhat high of government subsidies as a percent of total expense (68.8%). Compared to our 2008 study, Canada’s score decreased by about four points. This decrease could be attributed to lower scores in National Policies and Financial Services (even though Financial Services was one of their best performing areas).
Cape Verde’s overall score is 50.85, which falls just about at the average of all countries surveyed. Cape Verde performed best in National Policies and Legal Systems. Regarding National Policies, they have imports and exports as a percent of GDP (106%) well above the Big 5 and OECD countries. In Legal Systems, Cape Verde recorded a very low percentage of firms that are expected to give gifts in meetings with tax officials (1.1% compared to 19.1% in OECD countries). Cape Verde recorded strong scores in many categories; however, these were diminished somewhat by their performance in Infrastructure and Financial Services. They recorded very low air transport of freight (1 ton per km traveled), and also registered a low broadband subscriber rate (3.22 per 100 people) and low personal computer use (14.3 per 100 people). That being said, within its region these numbers were on the higher side, showing relative development in these areas. Compared to our 2008 study, Cape Verde’s score decreased by about six points overall. This decrease can be attributed to lower scores in Legal Systems, Infrastructure and Financial Services.
Chad recorded an overall score of 32.79. Chad’s low overall score was due to multiple factors. Its performance in National Policies is by far its strongest area. Chad has an impressive amount of firms that report using internationally recognized standards (43.3%) and also recorded more than adequate levels of FDI (10.3% of GDP). Chad’s score was lowered by Best Practices, as they recorded extremely high costs to import and export a container (8525 USD to import and 5902 USD to export), respectively seven and five times higher than costs in the OECD countries, and also very long times to import and export (75 days to export and 101 days to import). Chad also recorded an insufficient score in Financial Services with extremely high costs of business start-up procedure as a percent of GNI per capita (208.5%) and a very large amount of taxes required to be paid by businesses (54 compared to an average of 13.08 in OECD countries). Compared to our 2008 study, Chads score is a full 10 points lower. This large decrease can be attributed to steep drops in their National Policies, Best Practices, and Financial Services scores.
Chile’s overall score is 59.58. Chile performs best in the areas of Best Practices and Legal Systems. In Best Practices, Chile recorded a low number of days to clear customs by land and sea (5 days for land, 7 days for sea), and they also have lower costs to import and export a container than all of the comparison benchmark averages (795 USD to export and 795 USD to import). Regarding Legal Systems, Chile has a very short time to start a business (7 days) and very short time to register a property (6 days), as well as scoring better than the Big 5 and OECD countries on the Transparency International Corruption Index (7.2 out of 10). Where Chile lacks development is in Infrastructure. Attributing to an overall Infrastructure score of 33.13 is a low percentage of paved roads (22.5%), low usage of personal computers (14.13 out of every 100 people) and a low number of households with connection to the Internet (23.76 out of every 100 households). Compared to our 2008 study, Chile scored only one point lower, with many sectional scores remaining relatively similar.
China receives an overall score of 51.04. China performs poorly in the area of Infrastructure with a score of 33.77. This low score was brought on by a low broadband subscriber rate (9.44 per 100 people), low usage of mobile phones (64 subscriptions per 100 people) and relative to the population of the country almost no secure Internet servers (2 per one million people). China performs strongest in the area of Best Practices. This score was aided by some of the lowest costs to import and export seen throughout the entire survey (500 USD to export per container, 545 USD to import per container). Also of note was the area of National Policies, where they recorded almost double the FDI of the Big 5 average (3.1%). Compared to our 2008 study, China’s score decreased by about four points. This decrease can possibly be attributed to lower scores in Legal Systems and National Policies. However, since 2008, many of their Infrastructure scores have at least doubled.
Colombia recorded an overall score of 51.40. Areas where Colombia scored particularly well were in Financial Services and Legal Systems. In Financial Services, they recorded a low number of taxes on business (9), a low amount of non-performing bank loans (2.9% of total bank loans) and a small increase in USD price deflator (11.1%). The Legal Systems score was strengthened by a short time to build a warehouse (46 days), along with a low number of procedures to build one (8). As with many of the other South American economies, Colombia was lacking in Infrastructure with both technology and transportation, with a score of 22.25. International flights (0.0038 per capita), as well as total air passengers (0.326 per capita), kept transportation statistics down, and the broadband subscriber rate (5.6 per 100 people) and personal computer use (11.5 per 100 people) kept technology scores low. Compared to our 2008 study, Colombia scored exactly two points higher. This slight increase could be attributed to a decently large increase in Financial Services.
Costa Rica’s overall score is 55.05. Costa Rica records its highest marks in National Policies led by low government subsidies as a percent of total expense (20.9%), along with low anti-dumping measures (2) and WTO cases filed against it (2). As with most other Central American nations, Costa Rica’s lowest scores are in Infrastructure, with a score of 27.84. This score is weighed down especially by Costa Rica’s performance in technology infrastructure, with a low broadband subscriber rate (6.19 per 100 people), low personal computer use (21.8 per 100 people) and low electrical production (1,993 kWh per capita). Compared to its scores in 2008, Costa Rica lost only about one point, with scores remaining relatively similar besides a small rise in its National Policies score and a slight decrease in its Best Practices score.
54
0
50
100NP
BP
IF
FS
HC
LES
Country Section Scores vs. Exemplars
Exemplars
Ivory Coast
0 50 100
Big 5
Exemplars
OECD
Ivory Coast
64.99
80.17
67.07
37.47
Aggregate Scores
Côte d’Ivoire
Côte d’Ivoire’s overall score is 37.47. Côte d’Ivoire performs best in Legal Systems, with a score of 70.90 that far outperforms even the exemplars. This high score can be attributed to high reported scores in time needed to start a business (5 days), significantly lower than the OECD countries (12 days), as well as low time required to register property (1 day, compared to 31.2 days among OECD countries). This high score is brought down by low scores in every other indicator, especially in Infrastructure and Financial Services. Côte d’Ivoire’s Infrastructure score of 12.88 is due in part to the low percentage of roads paved (7.9%) compared with OECD countries (75.74%), as well as a low level of electrical production (298.61 KWh per capita) compared to the OECD countries (15,816 KWh per capita). Côte d’Ivoire’s Financial Services score is low in part due to the high number of different taxes businesses need to pay (62 each year) compared to OECD countries (13.08 each year). Compared to our study in 2008, Côte d’Ivoire’s score has dropped by four points, attributable to a significant drop in the area of Financial Services.
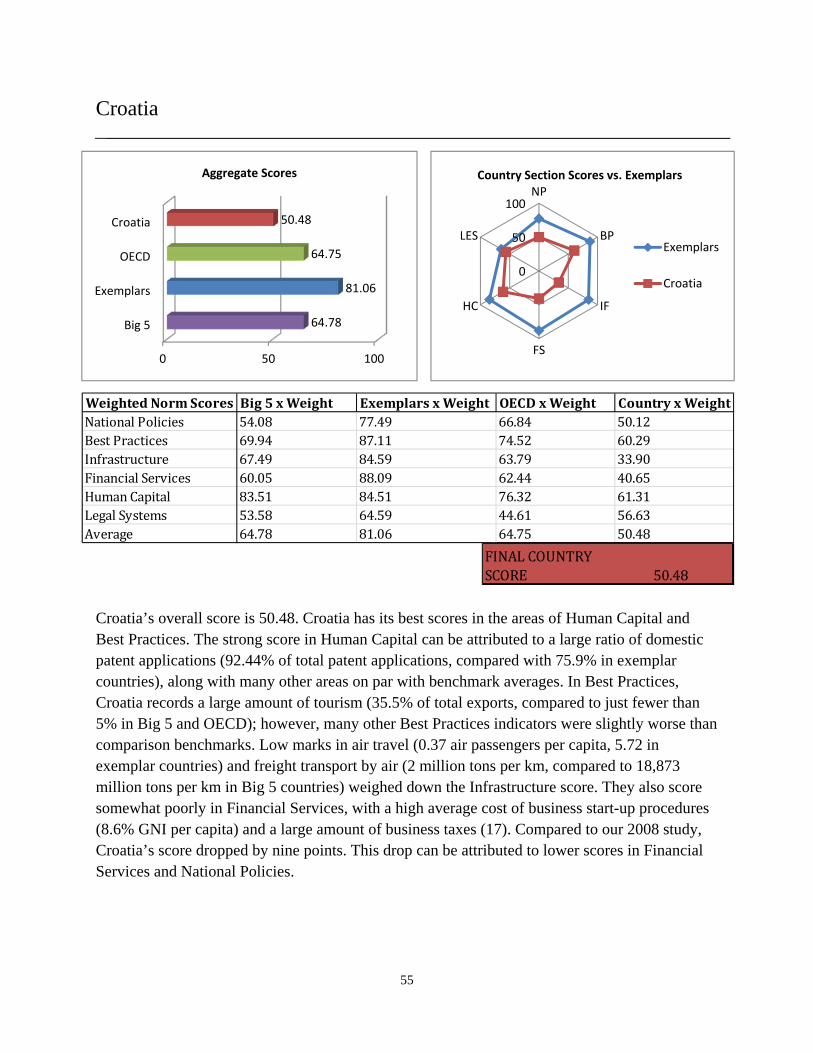
Croatia’s overall score is 50.48. Croatia has its best scores in the areas of Human Capital and Best Practices. The strong score in Human Capital can be attributed to a large ratio of domestic patent applications (92.44% of total patent applications, compared with 75.9% in exemplar countries), along with many other areas on par with benchmark averages. In Best Practices, Croatia records a large amount of tourism (35.5% of total exports, compared to just fewer than 5% in Big 5 and OECD); however, many other Best Practices indicators were slightly worse than comparison benchmarks. Low marks in air travel (0.37 air passengers per capita, 5.72 in exemplar countries) and freight transport by air (2 million tons per km, compared to 18,873 million tons per km in Big 5 countries) weighed down the Infrastructure score. They also score somewhat poorly in Financial Services, with a high average cost of business start-up procedures (8.6% GNI per capita) and a large amount of business taxes (17). Compared to our 2008 study, Croatia’s score dropped by nine points. This drop can be attributed to lower scores in Financial Services and National Policies.
The Czech Republic’s overall score is 63.24. Czech Republic performs best in National Policies and Human Capital. In National Policies, it has high imports and exports (154% of GDP), as well as imports of goods and services (75% of GDP). In the area of Human Capital, it recorded the same percentage of immigrants with a graduate education as the Big 5 (25.2%), a small percentage of the workforce employed in agriculture (3%) and a large ratio of domestic patent applications (88.39% of total applications). The Czech Republic performs poorly in Infrastructure, recording a score of 47.46. Despite a larger share than any of the benchmark comparisons on information and communication technology expenditure (7.59% of GDP), they still have a low amount of personal computer usage (24 per 100 people) and a low broadband subscriber rate (14.46 per 100 people). That being said, they did have a large amount of Internet servers (387 per one million people) and high percentage of households connected to the Internet (54.18%). Compared to our study from 2008, Czech Republic’s score dropped by only one point, which can be attributed to a lower Infrastructure score.
Denmark’s overall score is 78.92, which is the fifth highest score recorded amongst all nations surveyed. Reasons for this high score are strengths in Best Practices and Legal Systems. Denmark’s good performance in Best Practices relies on very low barriers to trade. They record very low costs to import and export (744 USD to export and import a container), as well as few documents required for trade (4 to export and 3 to import) and few days required to trade (5 days to export and import). A good score in Legal Systems was driven by a high score on the Transparency International Corruption Index (9.4 out of 10), as well as minimal requirements for a business start-up. Denmark’s worst performing area was in Infrastructure due specifically to low scores in transportation infrastructure, while its tech infrastructure scores were rather strong. Compared to our 2008 report, its score did decrease by six points due mainly to an eight-point drop in Best Practices.
The Dominican Republic’s overall score is 45.54. The Dominican Republic performs best in Best Practices with a 74.55, which was higher than the scores of the Big 5 and the OECD countries. This strong score was led mainly by a large amount of international receipts from tourism (36% of exports compared to 4.95% in exemplar countries), as well as a low amount of time required to import and export goods (10 and 8 days, respectively). The weakest performance of the Dominican Republic came in Infrastructure, scoring a 25.4. Technological infrastructure was lacking in all areas, with a very low broadband subscriber rate (3.63 per 100 people) and number of personal computers (2.97 per 100 people). Extent of business Internet use was also low (3.5 out of 7, indexed score). Compared to our 2008 study, the Dominican Republic scored seven points lower due mainly to lower scores in Financial Services and National Policies.
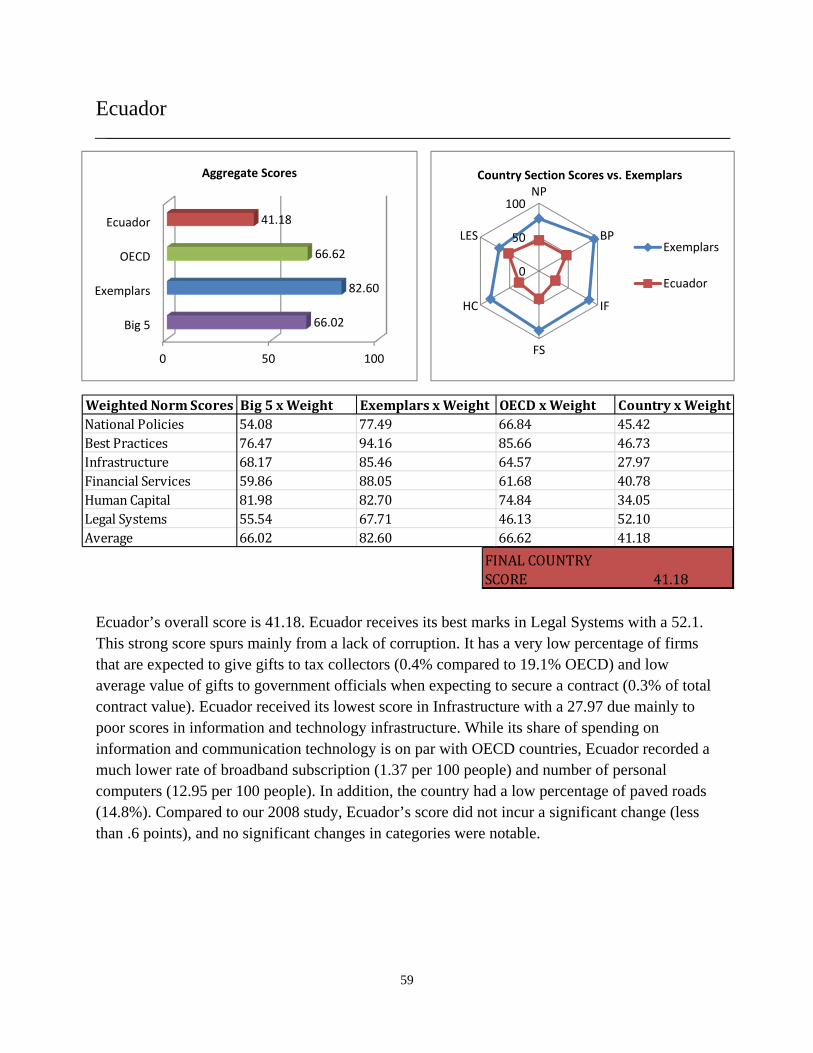
Ecuador’s overall score is 41.18. Ecuador receives its best marks in Legal Systems with a 52.1. This strong score spurs mainly from a lack of corruption. It has a very low percentage of firms that are expected to give gifts to tax collectors (0.4% compared to 19.1% OECD) and low average value of gifts to government officials when expecting to secure a contract (0.3% of total contract value). Ecuador received its lowest score in Infrastructure with a 27.97 due mainly to poor scores in information and technology infrastructure. While its share of spending on information and communication technology is on par with OECD countries, Ecuador recorded a much lower rate of broadband subscription (1.37 per 100 people) and number of personal computers (12.95 per 100 people). In addition, the country had a low percentage of paved roads (14.8%). Compared to our 2008 study, Ecuador’s score did not incur a significant change (less than .6 points), and no significant changes in categories were notable.
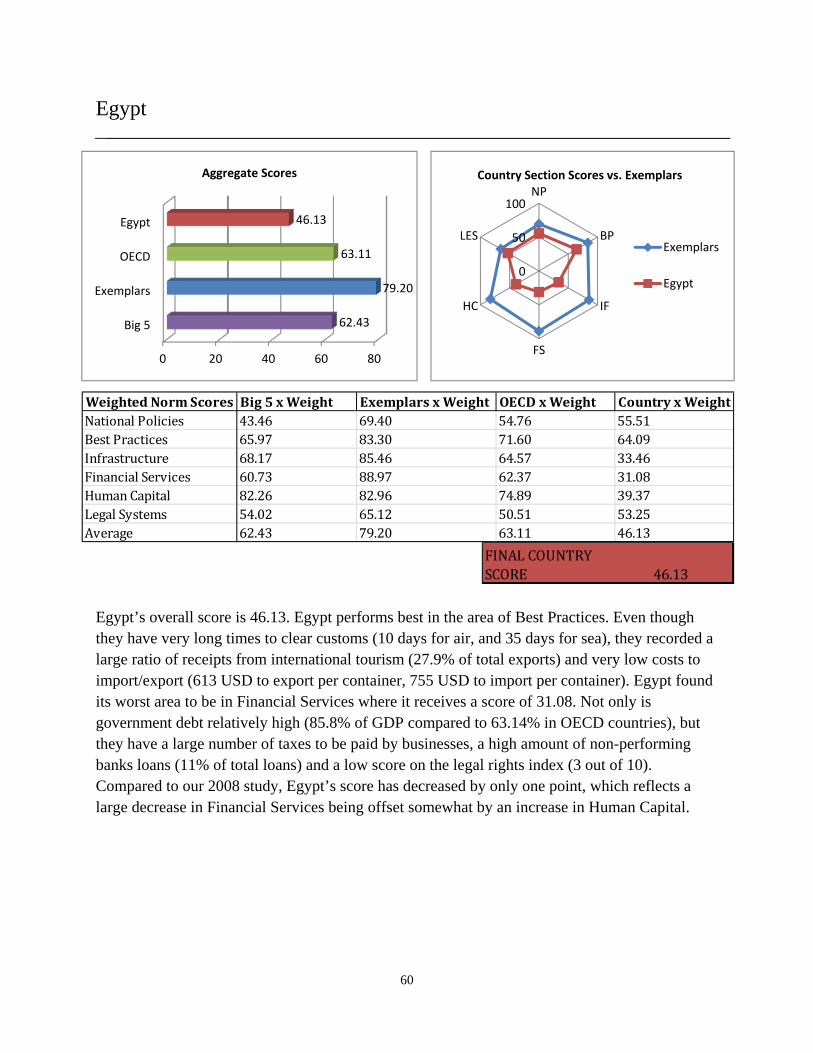
Egypt’s overall score is 46.13. Egypt performs best in the area of Best Practices. Even though they have very long times to clear customs (10 days for air, and 35 days for sea), they recorded a large ratio of receipts from international tourism (27.9% of total exports) and very low costs to import/export (613 USD to export per container, 755 USD to import per container). Egypt found its worst area to be in Financial Services where it receives a score of 31.08. Not only is government debt relatively high (85.8% of GDP compared to 63.14% in OECD countries), but they have a large number of taxes to be paid by businesses, a high amount of non-performing banks loans (11% of total loans) and a low score on the legal rights index (3 out of 10). Compared to our 2008 study, Egypt’s score has decreased by only one point, which reflects a large decrease in Financial Services being offset somewhat by an increase in Human Capital.
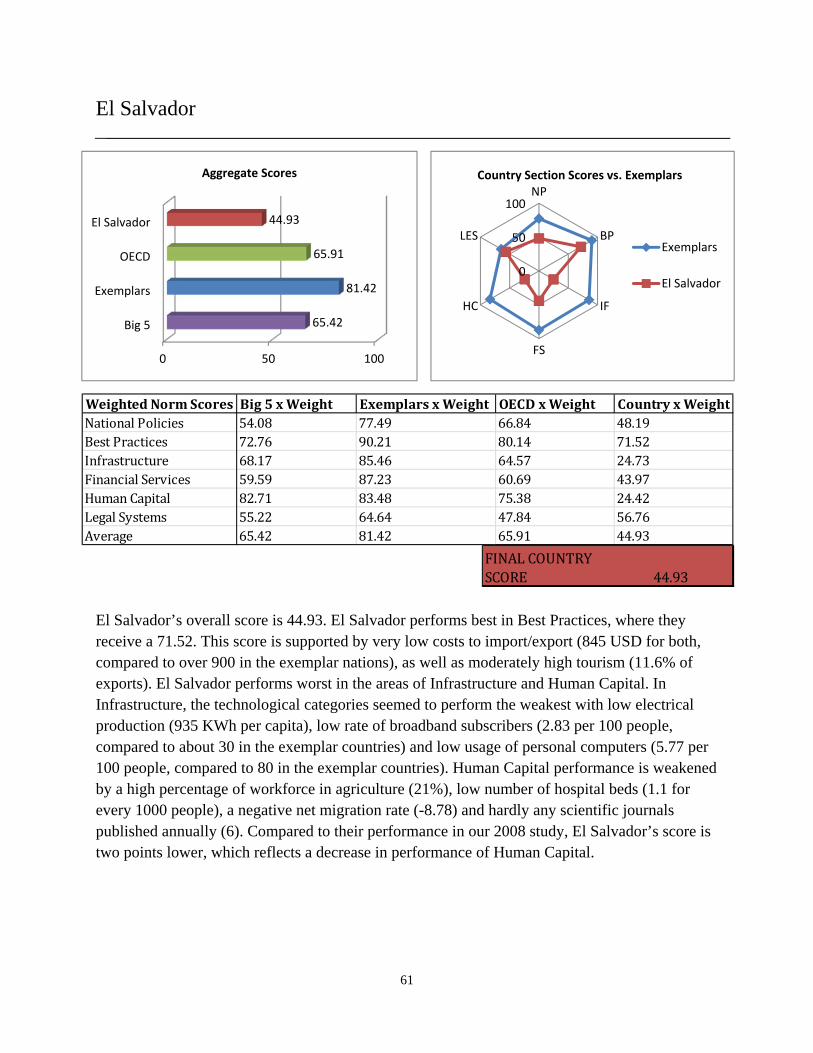
El Salvador’s overall score is 44.93. El Salvador performs best in Best Practices, where they receive a 71.52. This score is supported by very low costs to import/export (845 USD for both, compared to over 900 in the exemplar nations), as well as moderately high tourism (11.6% of exports). El Salvador performs worst in the areas of Infrastructure and Human Capital. In Infrastructure, the technological categories seemed to perform the weakest with low electrical production (935 KWh per capita), low rate of broadband subscribers (2.83 per 100 people, compared to about 30 in the exemplar countries) and low usage of personal computers (5.77 per 100 people, compared to 80 in the exemplar countries). Human Capital performance is weakened by a high percentage of workforce in agriculture (21%), low number of hospital beds (1.1 for every 1000 people), a negative net migration rate (-8.78) and hardly any scientific journals published annually (6). Compared to their performance in our 2008 study, El Salvador’s score is two points lower, which reflects a decrease in performance of Human Capital.
Estonia receives an overall score of 69.87. Estonia performs strongest in Best Practices where they have recorded a score of 91.84, beating the exemplars by over 11 points. This very strong score can be attributed to incredibly low barriers to import/export, document requirement (three to export, four to import), days to import/export (five to export, five to import) and costs to import/export per container (725 USD for both) were all much lower than any of the benchmark averages. Estonia’s lowest scores came in Human Capital. They recorded meager statistics in things like growth in labor productivity (0.6%), high unemployment (12.1%), poor net migration rate (-3.33) and a meager number of scientific and technical journals published over the past year (518). Compared to our study in 2008, Estonia’s score decreased by about five points. The reason for this is a decrease in Best Practices and Financial Services.
Ethiopia’s overall score is 34.85. Ethiopia performs strongest in the area of Legal Systems with a score of 60.64. This score is driven by a low amount of time required to start a business (9 days), as well as a low number of procedures to start a business (5) and a low percentage of firms expected to give gifts in meetings with tax officials (11.8%). Ethiopia records its worst score in Infrastructure with 12.03. This low score comes from hardly any transportation infrastructure through air and a very low percentage of paved roads (13.5%). Ethiopia also reports very low electricity production (49.49 KWh per capita, compared to 15,816 KWh per capita in OECD countries) and extremely low prevalence of personal computers (0.67 computers per 100 people). Compared to our 2008 study, Ethiopia’s score has dropped nine points. This can be attributed to a very large drop in Financial Services; all other scores remained relatively consistent.
Finland’s overall score is 77.66. Finland performed best in Legal Systems, a score which was led by a very high score on the Transparency International Corruption Index (9.4 out of 10), as well as very low barriers for business registration (3 start-up procedures, 14 days) and contract enforcement (375 days). Finland found its worst score to be in the area of National Policies, where low imports of goods and services as a percent of GDP (39%), low volume of trade conducted with OECD countries (92.7 billion compared to 320 billion amongst OECD countries) and a very high amount of government subsidies (71.4% of total expense) brought down its overall section score. Compared to our 2008 study, Finland scored one point higher with no particular section to credit for the increase.
France’s overall score is 68.73, outperforming the Big 5 and OECD countries. France performs best in Best Practices. Their strong score in this area reflects very low amount of documents required for import/export (2), somewhat high receipts from international tourism (8.6% of exports) and a short amount of time to clear customs (4 days for air, 10 days for sea). France’s weakest performing areas were in National Policies, where they receive a score of 58.61 and Financial Services with a score of 58.75. In National Policies they recorded very low FDI (1.3% of GDP) and low imports of goods and services as a percent of GDP (28%). Regarding Financial Services, France records high business taxes (65.7% of gross profits) and a decently large amount of central government debt (83.5% of GDP). Compared to our 2008 study, France’s score decreased by seven points. This decrease can be attributed to slightly lower scores in National Policies, Infrastructure and Financial Services.
Germany’s overall score is 69.95, slightly outperforming the OECD and Big 5 averages. Germany performs best in Human Capital and Best Practices. In the area of Human Capital, the high score was led mainly by low employment in agriculture (2% of total labor force), low unemployment (6%) and a large number of scientific and technical journals published annually (45,003, compared to 7,258 in exemplar countries and 18,005 in OECD countries). Regarding Best Practices, Germany records very low barriers to trade with a short amount of time to import/export (7 days for both), minimal documents required to import/export (5 and 4 respectively) and costs to import/export one container (937 USD and 872 USD respectively) on par with the Big 5, which recorded the lowest cost in these areas. Germany performs poorly in Financial Services, where they recorded low annual business registration per capita (0.00072 new businesses per capita). Compared to our 2008 study, Germany’s score decreased by about six points, mainly due to a drop in Best Practices and Financial Services.
Ghana’s overall score is 44.18. Ghana performs best in Best Practices with the amount of documents required to import/export being on par with the benchmark averages (5 to import and 6 to export). Ghana also performed somewhat well in Legal Systems. This strong performance, relative to their other scores, is due to a low number of business start-up procedures (7) and a decently short time to start a business (12 days). Ghana performs poorly in Infrastructure with a score of 11.51. While there was little data available, Ghana records a very low broadband subscriber rate (0.21 per 100 people), as well as very low personal computer use (1.1 computers for every 100 people). Ghana also has a small total number of its roads paved (12.6%). Compared to our 2008 study, Ghana’s score decreased by about three points due in large part to a big decrease in the area of Financial Services.
Greece’s overall score is 53.77. Greece performs strongest in Best Practices with a score of 78.08, outperforming the OECD and Big 5 benchmarks. They record low requirements for customs clearance (2 days for air cargo, 7 days for sea), minimal documents for import/export (6 and 5 respectively) and have a large portion of exports as receipts from international tourism (20.9%). Greece performs worst in National Policies, as it records low use of internationally recognized standards (11.7% of firms) and low levels of FDI (0.1% of GDP). Greece also performs poorly in Infrastructure, where air transport statistics were on par with those of OECD and Big 5 benchmarks; however, personal computer use (8.91 PCs per 100 people), percentage of households with access to the Internet (44.6%) and extent of business Internet use (indexed score of 3.2 out of 7) keep the overall section score low. Compared to our 2008 study, Greece’s score declined by about three points mainly attributable to a decrease in Financial Services.
Guatemala’s overall score is 46.1. Guatemala performs strong in Best Practices and Legal Systems. In Best Practices, Guatemala records a good percentage of exports, as receipts from international tourism (12.7%) and costs to import/export were slightly higher than that of OECD countries (1302 USD to import and 1127 USD to import). Regarding Legal Systems, they had adequately low time to register a property (23 days), as well as a low percentage of firms required to give gifts in meetings with tax officials (3.9% of firms compared to 19.1% OECD). Like other Central American countries, Guatemala performs inadequately in Infrastructure. Reason for this low score has much to do with technological infrastructure, where they record a low percentage of households with Internet access (10.5%) and very low prevalence of personal computers (1.87 per 100 people). Compared to our 2008 study, Guatemala’s score has decreased by about two points, with the most significant decrease being in the area of Financial Services.
Guinea’s overall score is a 32.34, receiving one of the lowest overall country scores. Guinea performs strongest relative to their other scores in the area of Legal Systems. Their performance in this category is driven by a short time to enforce a contract (276 days, lower than all benchmark averages) and low security costs for firms as a percentage of total sales (1%). Guinea performs worst in Infrastructure with a score of 11.45. Though there were only four data points available of a possible 14, they are all related to technology infrastructure. This low score is reflected by a small percentage of households with connection to the Internet (1%), a low broadband subscriber rate (0.01 per 100 people), a low mobile phone subscriber rate (40 subscriptions per 100 people) and a low amount of personal computers (6.35 per 100 people). Compared to our study in 2008, Guinea’s score has shown a decrease of about seven points, reflecting a significant decrease in Financial Services.
Honduras receives an overall score of 51.64. Honduras performs strongest in National Policies, outperforming the Big 5 and OECD country averages. Their strong score in National Policies can be attributed to high imports and exports as a percentage of GDP (108%), a low amount of WTO cases filed against them (3) and very low government subsidies as a percent of total expenses (5.8%). Honduras records their weakest performance in the area of Financial Services. While they did have a high score in the Legal Rights index (8 out of 10), cost to start a business as a percent of GNI per capita was very high (46.7%) and businesses were required to pay a large amount of various taxes (47). Compared to our study in 2008, Honduras’ score has increased by about five points. This can be attributed to increases in Infrastructure, Human Capital, Legal Services, and National Policies.
72
0
50
100NP
BP
IF
FS
HC
LES
Country Section Scores vs. Exemplars
Exemplars
Hungary
0 50 100
Big 5
Exemplars
OECD
Hungary
65.29
80.77
66.64
55.13
Aggregate Scores
Hungary
Hungary’s overall score is 55.13. Hungary performs best in Legal Systems and Best Practices. In Legal Systems, there is only little time required to start a business in Hungary (4 days) in comparison with OECD countries (12 days), and the number of startup procedures to register a business (4) falls below that of OECD countries as well (5.32). Hungary also scores well in Best Practices with a score of 67.00, which is due in part to a cost to export goods (1,015 USD per container) that is on par with OECD countries’ level (1035.79 USD per container). Hungary does poorly in National Policies with a score of 34.28. This is reflected in the high number of WTO cases filed against them (66) compared to OECD countries (29.4), as well as the high number of anti-dumping measures (140 compared with 115 in OECD countries). Compared to our 2008 report, Hungary’s overall score decreased by 11 points, which is mainly due to a 40-point drop in its National Policies score.
Iceland’s overall score is 67.50. Iceland performs well in Legal Systems and Human Capital. With a score of 90.12, Iceland’s high Legal Systems rating is due in part to a low time required to register property (4 days) compared to exemplar countries (16 days), as well as a low time required to start a business (5 days, compared to 11.2 among exemplar countries). In Human Capital, Iceland achieved a high score of 74.94 due in part to a high level of expenditure on public education (7.5% of GDP) compared to exemplar countries (5.2% of GDP), as well as a high number of technicians in R&D (1,739 per one million people) in relation to exemplar countries (1,336 per one million people). Iceland scores lowest in National Policies with a score of 48.18. This can be due to its relatively low level of imports of goods and services (46% of GDP) compared to exemplars (83.4% of GDP), as well as a low level of FDI (2% of GDP) relative to exemplar countries’ (7.34% of GDP). Compared to our 2008 report, Iceland’s overall score decreased by six points. This can be explained by an 18-point drop in its National Policies score.
India’s overall score is 39.71. India performs best in Best Practices with a score of 59.03. This relatively high score can be attributed in part to a level of days needed to clear customs for sea cargo (10 days), which is slightly lower than the OECD countries’ (10.7 days). India performs worst in Infrastructure and National Policies. With a score of 24.34, its low Infrastructure score is due in part to a low level of paved roads (49.5% of all roads) compared with the Big 5 countries (75.2%), as well as the low number of computers (1.56 per 100 people) in relation to the Big 5 countries (57.99 per 100 people). India also had a low score in National Policies with a score of 34.04. This can be attributed to its low level of imports and exports (32% of GDP) compared with the Big 5 countries (48.6% of GDP), as well as the high number of anti-dumping measures (206) relative to the Big 5 (131). India’s overall score decreased by nine points; while its Best Practices score increased by nine points and its Financial Services score fell by 24 points.
Indonesia’s overall score is 46.95. Indonesia performs best in Best Practices and Human Capital. In Best Practices, it has a relatively low cost to export (644 USD per container) compared with OECD countries (1035.79 USD per container), as well as a low cost to import a good (660 USD per container to 1095.88 in OECD countries). Indonesia’s relatively high score in Human Capital of 53.76 is due in part to an unemployment rate (7.1%) that is lower than OEDC countries’ (8.44%), as well as a low percentage of the population over 65 (6.1%) compared with the OECD countries (14.94%). Indonesia scores poorly in Infrastructure with a score of 23.88. This score can be attributed in part to a low percentage of roads paved (56.9%) compared with OECD countries (75.74%), as well as a low percentage of households with access to the Internet (9.9 %) relative to OECD countries (59.31%). Indonesia’s overall score decreased by seven points from our 2008 report due to a 22-point drop in its National Policies score.
Ireland’s overall score is 75.34. Ireland performs best in National Policies and Legal Systems, but performs on par with the exemplar scores in all of the indicators. In National Policies, Ireland outperformed the exemplars with a score of 90.04 due in part to a high level of Foreign Direct Investment (13.1% of GDP) compared to the exemplars (7.34%), as well as a level of imports and exports slightly higher than the exemplar countries (183% versus 180.4%). In Legal Systems, Ireland does well due in part to the low time needed to settle a dispute in court (3 months) compared to the OECD countries (1.7 years). While it does well in all aspects, the lowest score of Ireland was a 64.33 in Infrastructure. This is due in part to the low number of personal computers (49.42 per 100 people) versus the exemplar countries (79.97 per 100 people). Compared to our 2008 score, Ireland’s score increased by four points; a 43-point gain in National Policies was mostly offset by losses in other categories, such as a 13-point drop in Human Capital.
Italy’s overall score is 57.51. Italy performs best in Best Practices and Human Capital. In Best Practices, Italy scored an 82.01 due in part to a low time needed to clear customs for air cargo (2 days) and sea cargo (4 days) compared to the exemplar countries (4.25 days and 8.5 days, respectively). Italy’s high Human Capital score of 77.76 can be attributed to high life expectancy (81.86 years) and a high adult literacy rate (99%), both slightly above the exemplar’s scores. It has its lowest scores in National Policies and Financial Services. Italy’s National Policies score of 40.53 is due in part to its low level of imports and exports (58% of GDP, compared to 180.4% among exemplar countries), as well as low level of Foreign Direct Investment (0.5% of GDP) compared to the exemplars (7.34%). In Financial Services, Italy performs poorly due to a high level of government debt (118.4% of GNI per capita), far greater than that among exemplars (60.54%) or OECD countries (63.14%). Compared to our 2008 report, Italy’s score decreased by less than two points due to a decrease in Financial Services.
Jamaica’s overall score is 46.02. Jamaica performs best in Legal Systems and Best Practices. Its score of 67.01 in Legal Systems outperforms even the exemplars due to a low time required to start a business (7 days) compared to OECD countries (12 days). In Best Practices, Jamaica fares well due in part to a high number of receipts from international tourism (52.3% of total exports) compared to OECD countries (7.82% of total exports). Jamaica fared poorly in Infrastructure and Human Capital. In Infrastructure, with a score of 24.66, it has a low level of broadband subscriptions (4.32 per 100 people) compared to OECD countries (25.42 per 100 people) and a low level of electrical production (2,047.74 KWh per capita) compared to the OECD countries’ level (15,816 KWh per capita). Jamaica’s Human Capital score is also low due in part to the high percentage of the workforce employed in agriculture (20% of total workforce) compared to OECD countries (5.35%). From our 2008 report, Jamaica’s score decreased by 10 points due to a 25-point drop in its score in National Policies.
Japan’s overall score is 64.15. Japan performs best in Human Capital and Legal Systems. In Human Capital, with a score of 80.00, it scores higher than the exemplar countries due in part to its low unemployment rate (4.6%) compared to the exemplar countries (7.3%), as well as high life expectancy (83.91 years) relative to the exemplars (81.11 years). In addition, Japan’s Legal System score is high, as it has a low time required to register property (360 days compared to 415.8 days in exemplar countries). Japan performs worst in National Policies with a score of 46.19. This is due in part to its low level of exports and imports (29% of GDP) compared to the exemplars (180.4% of GDP). Overall, Japan’s score decreased by eight points from our 2008 report due in part to a 10-point drop in its National Policies score.
Jordan’s overall score is 55.71. Jordan performs best in the areas of National Policies, Best Practices and Legal Systems with scores of 70.16, 68.21 and 63.43, respectively. In Best Practices, their score was aided by a low cost to export (825 USD per container) and a high amount of tourism (33% of total exports). In Legal Systems, they record moderately short time to start a business (12 days) and build a warehouse (70 days), as well as a low percentage of firms expected to give gifts in meeting with tax officials (0.9% of firms, compared to 19.1% in OECD countries). Jordan receives its worst score in Infrastructure with a 24.58. This low score is due primarily to low amounts of air transport of freight (210 million tons per km, compared to 18,873 million tons per km in the Big 5 economies) and minimal amounts of Internet servers (25 per one million people, compared to 1056.26 per one million people in OECD countries). Compared to our 2008 study, Jordan’s score has decreased by about four points. This drop reflects a decrease in Infrastructure and Human Capital.
81
0
50
100NP
BP
IF
FS
HC
LES
Country Section Scores vs. Exemplars
Exemplars
Kazakhstan
0 50 100
Big 5
Exemplars
OECD
Kazakhstan
64.46
80.25
66.78
44.89
Aggregate Scores
Kazakhstan
Kazakhstan’s overall score is 44.89. Kazakhstan performs best in Financial Services and Human Capital. With a score of 56.07, Financial Services was its best score, over four points above the OECD score. This relatively high score is due in part to a low level of central government debt (10.2% of GDP) compared to OECD countries (63.14% of GDP), as well as a low marginal tax rate for businesses (highest at 20%, 27.74% in OECD countries). In Human Capital, Kazakhstan performs well due to a high number of hospital beds (7.6 per 1,000 people) compared to OECD countries (5.17 per 1,000 people), as well as a lower unemployment rate (5.4%) than OECD countries (8.44%). Kazakhstan does worst in Best Practices and Infrastructure, with respective scores of 23.69 and 30.39. In Best Practices, a high cost to export (3,130 USD per container) compared to OECD countries (1,035.79 USD per container) and a high time needed to import a good relative to OECD countries (62 days and 11.17 days, respectively) have led to its low score. Kazakhstan’s low Infrastructure score is due to a low level of electrical production (4,822 KWh per capita) compared with OECD countries (15,816 KWh per capita). Kazakhstan’s score did not change from our 2008 report.
Kenya’s overall score is 37.03. Kenya performs best in Best Practices and Legal Systems, although, both of these are below the benchmark scores. Its relatively high score in Best Practices is due in part to a high level of receipts from international tourism (18.2% of total exports) compared to the OECD score (7.82% of total exports). In Legal Systems, Kenya’s score is due in part to a low time required to enforce a contract (11 days) compared to OECD levels (511 days). These relatively high scores were brought down by low scores in Infrastructure and Financial Services. Kenya’s low Infrastructure score can be traced to a low percentage of paved roads (14.3%) compared with OECD countries (75.74%), as well as a low number of mobile phones (62 per 100 people) relative to OECD countries (115.73 per 100 people). In Financial Services, its low score is due in part to a large number of different taxes businesses need to pay each year (41) compared to OECD countries (13.08). From our 2008 report, Kenya’s overall score decreased by eight points, as the National Policies indicator dropped by 15 points.
Kuwait’s overall score is 47.35. Kuwait performs best in Human Capital with a score of 57.72, although, this score still falls below benchmark levels. This relatively high score is due to a low reported unemployment rate (2.2%) compared to OECD countries (8.44%), as well as a low percentage of the population over 65 (2%) relative to OECD levels (14.94%). Most of Kuwait’s score fell in the 40s with their lowest score being in Infrastructure at 39.60. This low score is due in part to a low number of personal computers (23.64 per 100 people) relative to OECD countries (51.09 per 100 people), as well as a low broadband subscriber rate (1.68 per 100 people) far below the OECD level (25.42 per 100 people). Overall, Kuwait’s score decreased by 15 points from our 2008 report, as it saw a 25-point drop in its Human Capital score, 27-point drop in Financial Services and modest increases in the other categories.
Kyrgyzstan’s overall score is 47.67. Kyrgyzstan performs best in National Policies and Legal Systems with both scores above the level of exemplars. With a score of 96.13, its score in National Policies is one of the highest due in part to a high level of imports of goods and services (89% of GDP) compared to the exemplar countries (83.4% of GDP), as well as a low level of government subsidies (41.6% of expenses) relative to the exemplars (54.46% of expenses). In Legal Systems, Kyrgyzstan scores well, as its time required for enforcing a contract (260 days) falls far under the level among exemplar countries (415.8 days). Kyrgyzstan performs poorly in Infrastructure and Financial Services. With a score of 13.19, its low Infrastructure score can be attributed in part to the low number of personal computers (1.94 per 100 people) compared to OECD levels (51.09 per 100). In Financial Services, high marks in the number of different taxes businesses must pay every year (52) fall well above the OECD level (13.08), contributing to its low score in this indicator. From our 2008 report, Kyrgyzstan’s score rose by four points due to a 40-point swing in the National Policies indicator.
Latvia’s overall score is 57. A developing Baltic economy, Latvia’s score is strengthened by its high score in Best Practices. This score is reflected by the low cost in exporting a container (only 600 USD in comparison to OECD’s 1035.79 USD and exemplars’ 907.40 USD) and the low cost in importing a container (801 USD compared to OECD’s 1095.88 USD). Latvia, like some of its Baltic neighbors and other Eastern European countries, lacks an adequate system of infrastructure. The underdeveloped infrastructure is due to the extremely low percentage of paved roads (only 20.9 % compared to exemplar 91.37%), the low annual air transport freight (only 23 millions of tons per km compared to exemplar’s 2278.6) and the meager amount of electrical production per capita (only 2487.27 kWh compared to exemplar’s 8828.4 kWh). Though Latvia may have improved in several fields, it still lacks the desperately needed infrastructure in order to catch up to the Big 5, exemplars and the OECD countries.
86
0
50
100NP
BP
IF
FS
HC
LES
Country Section Scores vs. Exemplars
Exemplars
Lebanon
0 50 100
Big 5
Exemplars
OECD
Lebanon
65.10
81.51
66.75
44.57
Aggregate Scores
Lebanon
Lebanon’s overall score is 44.57. Lebanon performs best in National Policies and Best Practices. In National Policies, its score of 75.83 falls just short of the exemplar countries due in part to a high level of Foreign Direct Investment (11% of GDP) compared to exemplar countries (7.34 % of GDP). In Best Practices, Lebanon fares well as its receipts from international tourism (38.5% of total exports) are well above the level of OECD countries (7.82% of total exports). Its lowest scores are in Infrastructure and Human Capital. In Infrastructure, Lebanon scores low due in part to a low number of mobile phones (68 per 100 people) compared to OECD countries (115.73 per 100 people), as well as a low level of electrical production (3,257.86 KWh per capita) relative to OECD levels (15,816 KWh per capita). Its Human Capital score is also low, as Lebanon has a high infant mortality rate (15.32 per 1,000 births) relative to OECD countries (5.28 per 1,000 births) and a low adult literacy rate (87.4%) relative to OECD countries (98.43%). Compared to our 2008 report, Lebanon’s score decreased by 10 points, as its Best Practices and Infrastructure scores both fell by roughly 10 points.
Lesotho’s overall score is 46.57. Lesotho performs best relative to the benchmarks in National Policies as well as Legal Systems. In National Policies, Lesotho’s high score can be attributed to its high level of imports of goods and services (114% of GDP) relative to exemplar countries (83.4% of GDP), as well as its low level of government subsidies (14.3% of expenses, compared to the exemplar’s 54.46%). In Legal Systems, it fares well in part to its low percentage of firms that expect to give gifts in meetings with tax inspectors (9.2%) compared to OECD countries (19.1%). Lesotho scores poorly in Infrastructure and Human Capital. In Infrastructure, its low score is due in part to a low number of personal computers (45 per 100 people) relative to OECD countries (51.09 per 100 people). For Human Capital, Lesotho performs poorly, as its infant mortality rate (53.44 per 1,000 births) falls far above OECD levels (5.28 per 1,000 births) and its average life expectancy (51.86 years) is short of that seen in OECD countries (79.3 years). Overall, Lesotho’s score has increased by 3.5 points from our 2008 report due to a large jump of 27 points in the National Policies indicator.
Lithuania’s overall score is a 60.81. Lithuania scores highest in the areas of National Policies and Legal Systems. In Legal Systems, Lithuania records a moderately low number of procedures to enforce a contract (30), somewhat short time required to enforce said contract (275 days) and remarkably low time to register a property (3 days, compared to 24.8 in Big 5 nations). Regarding National Policies, they record a high level of imports and exports (138% of GDP) and a moderately high amount of imports of goods and services (70% of GDP). Lithuania’s lowest score is in the category of Infrastructure, with a small amount of paved roads (29.4%) for how developed they are in other areas and low use of personal computers (24.19 per 100 people, compared to 51 in OECD countries). Compared to our 2008 study, Lithuania’s score decreased by about seven points. The drop in score reflects decreases in the areas of Financial Services and Human Capital.
89
0
50
100NP
BP
IF
FS
HC
LES
Country Section Scores vs. Exemplars
Exemplars
Luxembourg
0 20 40 60 80
Big 5
Exemplars
OECD
Luxembo…
61.60
74.37
61.46
79.18
Aggregate Scores
Luxembourg
Luxembourg’s overall score is 79.18. Luxembourg scores above exemplar levels in every indicator except for two, but performs exceptionally in National Policies and Human Capital. Its National Policies score of 84.56 can be attributed in part to a high level of imports and exports (299% of GDP) compared to exemplar countries (180.4% of GDP), as well as a high level of Foreign Direct Investment (389.8% of GDP) relative to OECD countries (12.59% of GDP). However, this very high number must be used with caution due to Luxembourg’s role in financial intermediation. Its Human Capital score is also high due in part to a high adult literacy rate (100%) compared with exemplar countries (98.14%) and a low unemployment rate (5.9%, compared to the exemplar’s level of 7.3%). Luxembourg performs worst in Best Practices. It also performs relatively bad in Infrastructure, two points under the exemplar level due to a relatively low number of personal computers (67.25 per 100 people) relative to the exemplars (79.97 per 100 people). From our 2008 report, Luxembourg’s score decreased by six points due to a seven-point decrease in Human Capital, as well as a nine-point decrease in Infrastructure.
Macedonia’s overall score is 52.97. Macedonia performs best in National Policies and Legal Systems. In National Policies, it scores above OECD countries with a 71.79 due in part to a low amount of government subsidies and transfers (49.1% of expenses) compared with OECD countries (57.84% of expenses). In Legal Systems, Macedonia’s high score is reflected in its low time required to enforce a contract (370 days) compared to OECD countries (511 days), as well as a low percentage of firms that expect to give gifts to tax officials relative to OECD countries (8.1% compared to 19.1%). Macedonia performs poorly in Infrastructure and Human Capital, with scores of 30.63 and 33.41, respectively. In Infrastructure, the poor score can be attributed to a low percentage of roads that are paved (57.6%) compared to OECD countries (75.74%). In Human Capital, its low score is due in part to a high infant mortality rate (8.32 per 1,000 births) relative to OECD countries (5.28 per 1,000 births). Overall, Macedonia’s score has decreased by less than half a point with large swings in its National Policies score and Financial Services score.
Madagascar’s overall score is 39.88. Madagascar performs best in Legal Systems with a score of 61.04, far outpacing the OECD countries. This relatively high score can be attributed to a low number of start-up procedures required to register a business (3) compared to OECD countries (5.32), as well as a low time required to start a business (8 days) relative to OECD countries (12 days). Madagascar performs poorly in Infrastructure and Financial Services with scores of 12.40 and 23.44, respectively. Its low score in Infrastructure can be attributed to a low number of mobile phones (37 per 100 people) compared to OECD countries (115.73 per 100 people). In Financial Services, the low score is due in part to the high number of taxes a business must pay every year (23) compared to OECD countries (13.08). Overall, Madagascar’s score has decreased by 4.5 points from our 2008 report due to a 13-point drop in its Best Practices score.
Malawi’s overall score is 39.59. Malawi scores best in National Policies and Legal Services, although, both of these scores are below the level of OECD countries. Its relatively high score in National Policies is due in part to a high level of imports of goods and services (47% of GDP), comparable to OECD levels (46.67% of GDP). In Legal Systems, its high score can be attributed to a low time required to enforce a contract (312 days) compared to OECD countries (511 days). Malawi performs worst in Infrastructure, with a score of 19.53. This low score is due to the low number of mobile phones (20 per 100 people) compared to OECD countries (115.73 per 100 people), as well as a low number of personal computers (0.18 per 100 people) relative to OECD levels (51.09 per 100 people). Overall, Malawi’s score has decreased by three points from our 2008 report. While its Infrastructure score did increase by six points, it also saw a 29-point drop in the Financial Services indicator.
Malaysia’s overall score is 61.38. Malaysia performs best in National Policies and Best Practices, outperforming the OECD score in the former. In National Policies, a high level of imports and exports (117% of GDP) compared to OECD countries (96.58% of GDP), as well as a low percent of government subsidies (41.7% of expenses) relative to OECD countries (57.84% of expenses), have given it a high score. In Best Practices, its high score is due in part to a low cost to export (450 USD per container) relative to OECD countries (1,035.79 USD per container). Malaysia scores worst in Infrastructure with a score of 42.30. This low score is due in part to a low number of secure Internet servers (54 per one million people) relative to OECD levels (1,056.26 per one million people). From our 2008 report, Malaysia’s overall score has decreased by four points due to decreases in National Policies, Best Practices and Financial Services.
Mali’s overall score is 35.65. Mali performs best in Legal Systems and Best Practices. Legal Systems is its highest score at 60.48 due in part to a low number of start-up procedures to register a business (4) relative to OECD countries (5.32). In Best Practices, a high level of international tourism (13.6% of total exports) compared to OECD countries (7.82% of total exports) helped boost its score. Mali performs worst in Infrastructure and Human Capital with respective scores of 19.54 and 22.65. In Infrastructure, a low percentage of paved roads (24.6%) compared to OECD countries (75.74%), along with a low number of personal computers (48 per 100 people) relative to OECD countries (115.73 per 100 people), brought its score down. For Human Capital, Mali’s low score can be attributed in part to a high unemployment rate (30%) relative to OECD countries (8.44%), as well as a low adult literacy rate (46.4%, compared to 98.38% amongst OECD countries). From our 2008 report, Mali’s score has decreased by five points caused by a 40-point drop in Financial Services that was offset by small increases in other areas.
Mauritius’ overall score is 63.91. Mauritius performs well in Best Practices and Financial Services, outperforming OECD scores in both measures. In Best Practices, its high score is due in part to a high level of tourism (32% of total exports) relative to OECD countries (7.82% of total exports). In Financial Services, its high score can be attributed to a low level of government debt (37.8% of GDP) compared to OECD levels (63.14% of GDP), as well as a low level of non-performing bank loans (2.8%) relative to OECD countries (4.96%). Mauritius’ worst score is in Infrastructure, at 37.50. This is due in part to a low number of personal computers (17.59 per 100 people) compared to OECD countries (51.09 per 100 people). From our 2008 report, Mauritius has seen an increase of almost seven points due to increases in National Policies and Legal Systems.
Mexico’s overall score is 49.76. Mexico has scored relatively strong in Best Practices and Legal Systems. Mexico’s Best Practices are highlighted by the low number of documents required for import (4), thus expediting the import process. The country’s high score in Legal Systems is facilitated by the possibility to quickly start a business (9 days, compared to exemplar 11 days) and the low amount of time required to build a warehouse (only 81 days). Mexico had performed the worst in Infrastructure due to the low percentage of paved roads (35.3%) and a low broadband subscriber rate (only 9.98 out of 100 people). These low scores highlight problems Mexico may have developing its transportation and communication infrastructure. In comparison to our 2008 study, Mexico has seen a decrease of 2.85 points with a possible cause being deterioration of its Infrastructure.
Moldova records an overall score of 51.11. They perform strongest in National Policies with a score of 72.73. This strong score is backed by a high level of trade (imports and exports equal 118% of GDP) compared to the OECD and Big 5 nations. Moldova performs poorly in the area of Infrastructure, where they record a score of 26.6. Moldova’s low score in Infrastructure stems primarily from low air transport of freight (one million tons per km), low air travel (0.127 air passengers per capita) and a low number of personal computers (2.85 per 100 people). Compared to our study in 2008, Moldova’s score decreased by about four points. This decrease could possibly be attributed to lower scores in Financial Services and Human Capital.
Mongolia receives an overall score of 54.39. Mongolia performs best in National Policies with a score of 92.99. This strong score in National Policies comes from high levels of trade (imports and exports 117% of GDP), large amounts of FDI (23.5% of GDP) and lower government subsidies than the OECD and exemplar nations (42% of total expense). Mongolia records a very poor score in Infrastructure with an 18.98. This low score is due in part to inadequate statistics in transportation infrastructure. Mongolia records low amounts of railways (0.001 km/sq kilometer of land area), low international flights per capita (0.0027 international flights per capita) and small amounts of freight transport by air (3 million tons per km). Compared to our study in 2008, Mongolia’s has decreased by just over three points. This decrease can be attributable to a much lower Human Capital score since the last study.
Morocco’s overall score is 50.70. Morocco performs best in Best Practices and Legal Systems. Their score in Best Practices reflects high levels of tourism (27.1% of total exports) and low costs to import/export (950 USD to import 577 USD to export). In Legal Systems, they record an adequately low amount of business start-up procedures (6), time needed to start a business (12 days compared to 19 days in the Big 5) and time needed to build a warehouse (97 days, compared to 150 days in OECD countries). Morocco receives its worst scores in Infrastructure and Human Capital. A low score in Infrastructure was brought on by low stats in business Internet use (indexed score of 2.8 out of 7), in the number of personal computers (2.45 per 100 people) and a low broadband subscriber rate (1.56 per 100 people); even though their ICT expenditure was double that of the benchmark averages. Inadequate marks in Human Capital came from low enrollment in secondary school (56% of gross enrollment), a negative net migration rate (-3.67 per 1000 people) and high infant mortality (26.49 per 1000 births). Compared to our 2008 study, Morocco’s score has decreased by about three points. This can be attributed mainly to lower scores in Financial Services and Human Capital.
The Netherlands receives an overall score of an 80.48. The Netherlands performs best in Best Practices with a score of 89.97. This very high score is aided by a low amount of days needed to clear customs (3 days for air cargo, 5 days for sea cargo), minimal documents required for import/export (5 for import, 4 for export) and very few days required to import/export goods (6 days for both). The Netherlands performs worst in Infrastructure with a score of 74.76. While this was their worst score, they still outperformed the OECD and Big 5 nation averages. The only area where it lacked significantly from the exemplar nations was in the amount of personal computers (68.23 per 100 people). Compared to our 2008 study, the Netherlands’ score showed a decrease of less than one point. This drop was due, if anything, to slight decreases in the areas of National Policies and Infrastructure.
New Zealand’s overall score is 76.28, scoring in the top tier of all countries surveyed. New Zealand records its best score in the area of Legal Systems with a score of 92.27. This extremely high score is bolstered by incredibly efficient procedural requirements with things such as starting a business (1 procedure, 1 day), enforcing a contract (30 procedures, 216 days) and building a warehouse (6 procedures, 64 days). They also receive a very high score on the Transparency International Corruption Index (9.5 out of 10). New Zealand performs worst in the area of National Policies with a score of 51.95. Low scoring in this area is due mainly to negative amounts of FDI (-0.6% of GDP). Compared to our 2008 study, New Zealand scores about two points lower. This drop in score is possibly attributable to lower scoring in the area of National Policies.
Nicaragua’s overall score is 47.02. Nicaragua performs best in National Policies with a score of 77.69, scoring higher than all three benchmark averages. This strong performance in National Policies is due in part to high levels of trade (imports and exports 111% of GDP), adequate levels of FDI (7.8% of GDP) and decently low amounts of government subsidies (37.1% of total expenses). Nicaragua receives its lowest marks by far in Infrastructure and Financial Services. In Infrastructure, poor scores can be directly attributed to under development of technology infrastructure. Regarding Financial Services, low scores are due to an extremely high business start-up cost (107.9% GNI per capita), a large amount of business taxes (42 separate taxes, 66.8% of gross profits) and a low score on the Legal Rights Index (3 out of 10). Compared to our 2008 study, Nicaragua scores two points lower, mainly due to a much lower score in Financial Services.
Niger’s overall score is 35.24. While Niger scores very low in all categories, it receives its highest marks in National Policies with a score of 58.12. This relatively high score comes from large amounts of FDI (17.1% of GDP) and low government subsidies (9.3% of total expenses). Niger receives its lowest scores in Infrastructure and Financial Services. Infrastructure was plagued by more than inadequate levels of technology infrastructure; a low broadband subscriber rate (0.02 per 100 people) and a low number of personal computers (0.071 per 100 people). In Financial Services they registered an extremely high cost to start a business (114% of GNI per capita) and a large number of business taxes (41). Compared to our study in 2008, Niger’s score is seven points lower. This drop in score is due to a large drop in Financial Services.
Norway receives an overall score of 74.39. Norway performs strongest in Best Practices, with a score of 90.75, and Legal Systems, with a score of 87.68. They record very low impediments to trade in all regards with low costs to import/export (729 USD to import, 830 USD to import), minimal documents required to import/export (4 for each) and short amount of time to import/export (7 days for each). Regarding Legal Systems, they record minimal time to start a business (7 days), enforce a contract (280 days) and register a property (3 days, compared to 31 in OECD). Norway performs poorly in National Policies, earning a score of 43.8. The reason for this lower score comes from a low volume of trade with OECD countries (total volume 180.657bn USD, compared to OECD average of 320.237bn USD), levels of FDI below exemplar and OECD averages (2.8% of GDP), moderately high government subsidies (67.7% of total expenses) and moderately high average tariff levels (7% total value of goods cleared through customs). Compared to our 2008 study, Norway’s score has gone down by about four points. This lower score may be attributable to lower scores in Infrastructure and National Policies.
105
0
50
100NP
BP
IF
FS
HC
LES
Country Section Scores vs. Exemplars
Exemplars
Pakistan
0 50 100
Big 5
Exemplars
OECD
Pakistan
63.35
80.27
65.15
39.45
Aggregate Scores
Pakistan
Pakistan’s overall score is 39.45. Pakistan performs well in Best Practices and Legal Systems with scores of 64.57 and 45.78, respectively. Its relatively high score in Best Practices reflects its low cost to export (660 USD per container) and import (705 USD per container) goods, both of which outperform OECD scores. In Legal Systems, Pakistan’s score is due in part to a low number of procedures to build a warehouse (11), which falls lower than OECD countries (14.08). It scores worst in Infrastructure with a 20.98. This low score can be attributed to a low level of energy production (549.56 KWh per capita), a low percentage of households that have access to the Internet (16.8%) and a low number of mobile phones (57 per 100 people), all of which fall well below levels seen in OECD countries. From our 2008 report, Pakistan’s score fell by five points due to a 20-point drop in its Financial Services score coupled with modest increases elsewhere.
Panama’s overall score is 61.67. Panama performs best in Best Practices and National Policies. In Best Practices, it achieves a score of 86.88 due in part to a high level of receipts from international tourism (13.9% of exports) relative to exemplar countries (4.95% of exports) and a low cost to export (615 USD per container), also coming under the cost in exemplar nations (907.4 USD per container). Panama also scores well in National Policies, which can be attributed to widely use of internationally-recognized standards (22.5%), relative to exemplar countries (17.17%) and a low number of WTO cases filed against them (1). It scores worst in Financial Services with a score of 34.32. This low score is caused by a high number of taxes businesses must pay every year (53), as well as a high marginal tax rate for businesses (30%). From our 2008 report, Panama’s score has decreased by three points, as its Best Practices score saw an eight-point drop.
Paraguay’s overall score is 41.73. Paraguay scores best in Legal Systems and Human Capital, with respective scores of 55.08 and 54.86. Both scores, however, fall below OECD levels. In Legal Systems, its relatively high score can be attributed to a low time requirement to build a warehouse (137 days) relative to OECD countries (150.94 days) and a low number of procedures to build a warehouse (12), also beating OECD countries (14.08). In Human Capital, Paraguay’s score is due in part to a low unemployment rate (6.6%) relative to OECD countries (8.44%), as well as a low hiring cost (16.5% of salary). It performs worst in Infrastructure with a score of 17.47. This low score is due in part to a low number of personal computers (7.79 per 100 people) and a low broadband subscriber rate (0.44 per 100 people), both of which fall well below OECD levels. From our 2008 report, Paraguay’s score has decreased by eight points due to decreases in National Policies and Infrastructure.
Peru’s overall score is 56.37. Peru performs well in National Policies and Best Practices with scores of 69.88 and 68.32, respectively. In National Policies, it performs well due in part to a low number of anti-dumping measures (21) and a low number of government subsidies (47.7% of expenses). In Best Practices, Peru attains a relatively high score as its cost to import goods (880 USD per container) and export goods (860 per container) come in well below the cost in OECD countries (1,095.88 USD and 1,035.79 USD, respectively). Its lowest score is in Infrastructure, with a score of 24.80. This low score can be attributed in part to a low level of information and communication technology expenditure (3.42% of GDP) relative to OECD countries (5.65% of GDP) and its low level of energy production (1,215.95 KWH per hour), far below levels seen in OECD countries. Overall, Peru’s score increased by three points from our 2008 report due to increases in every category, led by a nine-point jump in its Infrastructure score.
The Philippines’ overall score is 43.86. The Philippines performs best in National Policies and Best Practices, with respective scores of 60.68 and 58.85. In National Policies, it does well due in part to a low level of government subsidies (19.8% of expenses) relative to OECD countries (57.84% of expenses). In Best Practices, its relatively high score can be attributed to a cost to export goods (630 USD per container) and import goods (730 USD per container) well below levels in OECD countries (1,035.79 USD to export, 1,095.88 to import). The Philippines fare worst in Infrastructure and Financial Services. In Infrastructure, its score of 26.95 is due to a low level of electrical production (663.96 KWh per capita) and a low number of personal computers (7.23 per 100 people), both of which fall far below levels seen in OECD countries. In Financial Services, the Philippines perform poorly as businesses must pay many taxes (47) relative to OECD countries (13.08). From our 2008 report, the Philippines’ score decreased by six points due to small decreases in many different areas.
Poland’s overall score is 54.21. Poland performs well in National Policies and Best Practices. In National Policies, Poland records relatively wide use of internationally recognized standards in business (17.3% of firms) and good levels of patent protection (score of 4.2 out of 5 on the Park IPR index). Regarding Best Practices, they record a moderately low cost to import/export (1000 USD to import, 1050 USD to export), as well as an amount of documents to import/export in line with OECD nations (5). Poland performs poorly in Financial Services with a score of 38.87. Guiding this low score was a moderately high long-term interest rate (6.07) and a large percentage of non-performing bank loans (8.4%). Compared to our study in 2008, Poland’s overall score has decreased by two points. The only noticeable reason for this decrease comes from a drop in the Financial Services category.
Portugal’s overall score is a 64.38. Portugal performs very well in Best Practices with a score of 84.91. This strong score comes from moderately low time for customs clearance (5 days for air and 10 days for sea), a high portion of exports coming from tourism (18%) and very low costs to export with moderately low costs to import (899 USD to import, and 685 USD to export). Portugal’s lowest score comes in the area of Infrastructure. This lower score is driven mainly by low air transport of freight (375 million tons per km) and number of secure Internet servers (224 per one million people) relative to that of the benchmark nations. Compared to our study in 2008, Portugal performs almost exactly the same (0.52 points lower). An increase in the area of Best Practices was offset by a decrease in Infrastructure.
Romania receives an overall score of 53.56. Romania’s best scores come in National Policies and Legal Systems. In National Policies, they scored well due to widely used internationally recognized standards in business (26.13% of firms) and a fair level of patent protection (score of 4.17 out of 5). Regarding Legal Systems, they record adequately easy registration processes in the mid-range of benchmarks averages. Romania received its worst score in Infrastructure coming from, amongst other things, poor scores in air transport. They record less than five percent of the number of air passengers per capita as the OECD countries (0.186 per capita) and extremely low air transport of freight (5 million tons per km, compared to 18,873 million tons per km in Big 5 nations). Compared to our previous study in 2008, Romania’s score decreased by about five points. This decrease can be attributed to significantly lower scores in Financial Services and Best Practices.
Russia receives an overall score of a 47.35. Russia performs best in Financial Services and Human Capital with scores of 59.02 and 58.35, respectively. In Financial Services, Russia scores relatively well due to low central government debt (9.4% of GDP) and low costs to start a business (2% of GNI per capita). Regarding Human Capital, they record moderately low unemployment (6.6%), a large number of hospital beds per capita (9.66 per 1000 people) and a substantial number of scientific/technical journals published annually (14,016). Russia performs worst in Best Practices with a score of 33.8. This low score is due in part to very long time to import/export (36 days for both) and the very high costs associated with it (1,800 USD to import, 1,850 USD to export). Compared to our study in 2008, Russia’s score has decreased by less than a point with no single category showing significant change.
Rwanda’s overall score is a 41.21. Rwanda performs best in Legal Systems, outperforming all of the benchmark comparisons with a score of 74.8. This high score is due in part to a short time required to enforce a contract (230 days), low number of business start-up procedures (2) and short time to start a business (3 days). Rwanda records its worst score by far in Infrastructure with a 9.71. This low score is due partially to the fact that minimal data was available; however, the statistics that were available – broadband subscriber rate (0.02 per 100 people) and number of mobile phones (33 per 100 people) – were inadequate at best. Compared to our 2008 study, Rwanda’s score decreased by about four points. This decrease can be attributed to a sharp decrease in Human Capital and Infrastructure.
115
0
50
100NP
BP
IF
FS
HC
LES
Country Section Scores vs. Exemplars
Exemplars
Senegal
0 20 40 60 80
Big 5
Exemplars
OECD
Senegal
64.31
79.55
66.11
42.27
Aggregate Scores
Senegal
Senegal’s overall score is 42.27. Senegal performs best in Best Practices and Legal Systems with scores of 68.28 and 59.09, respectively. Its high Best Practices score is due in part to a high level of international tourism (15.2% of total exports) relative to OECD countries (7.82% of total exports). Senegal scores well in Legal Systems due in part to the low number of start-up procedures to register a business (3) compared to OECD countries (5.32), as well as a short amount of time required to start a business (5 days) relative to OECD levels (12 days). Senegal performs worst in Financial Services with a score of 18.52. This low score is due in part to a high percentage of non-performing bank loans (20.2%) relative to OECD levels (4.96%). Moreover, businesses must pay a high number of taxes each year (59), which is far above that of OECD countries (13.08). From our 2008 report, Senegal’s score decreased by two points with large increases in Best Practices and Infrastructure, offset by decreases in Financial Services and Human Capital.
Singapore’s overall score is 83.02. Singapore performs well in all measures, with its highest scores in National Policies and Legal Systems. With a score of 102.48, its high National Policies score is due to a high level of imports and exports (394% of GDP), high level of FDI (18.5% of GDP) and very low levels of government subsidies (0.3% of expenses), all of which far outpace the scores of other exemplar countries. In Legal Systems, Singapore scores well due in part to a low time required to register property (5 days) compared to exemplar countries (16 days), as well as a high mark on the Transparency International Corruption Index (9.2 out of 10). Singapore scores low relative to its other scores in Infrastructure with a 68.85. This score can be attributed in part to a lower broadband subscriber rate (24.99 per 100 people) than other exemplar countries (29.97). From our 2008 report, Singapore’s score decreased by two points due in part to a 10-point drop in its Financial Services score.
Slovakia’s overall score is 57.03. Slovakia performs well in National Policies and Human Capital. In National Policies, with a score of 73.83, it scored well due in part to a high level of imports and exports (163% of GDP) relative to OECD countries (96.58% of GDP). Slovakia scores high in Human Capital as well, which can be attributed in part to a high adult literacy rate (99.6%) relative to OECD countries (98.36%), as well as a low percentage of the population that is over 65 (12.8%) compared to OECD countries (14.94%). Slovakia scores lowest in Best Practices, with a score of 48.62. This relatively low score is due in part to a low level of tourism (3.3% of total exports) compared to OECD countries (7.82% of total exports), as well as a high number of days it takes to import a good (17 days) relative to OECD countries (11.17 days). From our 2008 report, Slovakia’s score has decreased by five points due to decreases in Legal Systems, Human Capital and Financial Services.
Slovenia’s overall score is 63.00. Slovenia performs best in Human Capital and Best Practices. Its relatively high Human Capital score can be attributed to a low percentage of the workforce employed in agriculture (3%) compared to OECD countries (5.35%), as well as a high adult literacy rate comparable to the OECD countries (99.7% and 98.38%, respectively). In Best Practices, its score is raised through a high level of international tourism (9% of total exports) compared to OECD countries (7.82% of total exports). Slovenia scores poorly in Financial Services with a 48.69. This score is due in part to a high number of taxes a business must pay every year (22) relative to the OECD countries’ score (13.08). From our 2008 report, Slovenia’s score has increased by less than one point due to a substantial increase in its Best Practices score.
South Africa’s overall score is 49.47. South Africa performs best in Legal Systems and Financial Services; although, both of these scores fell below scores attained by OECD countries. In Legal Systems, its relatively high score can be attributed in part to a low time required to register a property (23 days) relative to OECD countries (31.2 days). In Financial Services, South Africa’s score was relatively high due in part to a low number of different taxes a business must pay (9) relative to OECD levels (13.08). South Africa scores lowest in Human Capital and Infrastructure. In Human Capital, its low score is due to a high infant mortality rate (42.67 per 1,000 births) compared to OECD countries (5.28 per 1,000 births), as well as a low average life expectancy (49.41 years) relative to OECD countries (79.30 years). In Infrastructure, South Africa scores low, as its number of personal computers (8.45 per 100 people) and number of Internet subscribers (1.49 per 100 people) are both well below OECD levels. From our 2008 report, South Africa’s score has decreased by seven points, reflected in substantial decreases in National Policies, Best Practices and Human Capital.
Spain’s overall score is 63.01. Spain performs best in Best Practices with a score of 84.05, outpacing the exemplar’s score of 79.57. This high score in Best Practices can be attributed to a low number of custom clearance days needed for both air and sea cargo (3 days and 5 days, respectively) compared to exemplar countries (4.25 and 8.5 days, respectively). While all of its other scores were comparable, Spain scores worst in Infrastructure and National Policies. Its Infrastructure score of 52.72 is due in part to a relatively low number of personal computers (39.3 per 100 people), as well as a low number of secure Internet servers (284 per one million people). Spain’s relatively low score in National Policies can be attributed to a low level of imports and exports (55% of GDP) and a low level of imports of goods and services (28% of GDP), both below OECD levels. From our 2008 report, Spain’s score has decreased by five points, which is due in part to a 10-point drop in its Infrastructure score.
Sri Lanka’s overall score is 43.39. Sri Lanka performs best in Best Practices and Legal Services. In Best Practices, it attains a score of 68.44 due in part to a relatively low cost to export and import goods (715 and 745 USD per container) compared to OECD countries (1,035.79 and 1,095.88 per container). In Legal Services, Sri Lanka scores high partly because of a low number of start-up procedures to register a business (4) relative to OECD countries (5.32). Its lowest scores are in Infrastructure and Financial Services with scores of 25.58 and 33.52, respectively. In Infrastructure, Sri Lanka’s low score is due in part to a low level of energy production (155.03 KWh per capita) relative to OECD countries (12,816 KWh per capita), as well as a low number of personal computers (3.73 per 100 people) relative to OECD countries (51.09 per 100 people). In Financial Services, its low score can be attributed to a high level of central government debt (85% of GDP), as well as a high number of different taxes businesses must pay each year (71). Overall, Sri Lanka’s score has decreased nine points from our 2008 report due to a 35-point drop in its National Policies score coupled with a modest increase in Legal Systems.
Sudan’s overall score is 28.41. Sudan performs best in Legal Systems and Best Practices with respective scores of 45.62 and 34.98; however, these top scores fall below all three benchmark comparisons. In Legal Systems, Sudan scores relatively high due in part to a low time requirement to register property (9 days), which is substantially less than the time required by OECD countries (31.2 days). In Best Practices, its score was raised by the time required to export goods (12 days) being only slightly behind OECD levels (10.9 days). Sudan scores poorly in the other categories with an especially low score of 7.99 in Infrastructure. This score can be attributed to a low level of electrical production (155.03 KWh per capita), low number of mobile phones (41 per 100 people) and a low number of personal computers (10.71 per 100 people), all of which fall well below levels seen in OECD countries. Overall, Sudan’s score decreased by 17 points from our 2008 report due in part to 40-point drop in its Financial Services score.
Swaziland’s overall score is 42.86. Swaziland performs best in National Policies and Legal Systems. In National Polices, it scores a 68.92, two points higher than OECD countries. This score is due in part to a high level of imports and exports (123% of GDP) relative to OECD countries (96.58% of GDP), as well as a high level of use of internationally recognized standards (22.08% of businesses) compared to OECD levels (12.57% of businesses). In Legal Systems, Swaziland has a high score due to a low time required to register property (21 days) relative to OECD levels (31.2 days). Its lowest score was in Infrastructure with a score of 14.78. This score can be attributed to a low number of personal computers (3.69 per 100 people), low level of broadband subscribers (0.15 per 100 people) and a low number of secure Internet servers (15 per one million people). These technology infrastructure scores fall well below OECD levels. From our 2008 report, Swaziland’s score dropped by less than one point – this is due to a large decrease in its Financial Services score and an increase in its Legal Systems score.
Sweden’s overall score is 75.08, on par with the score of exemplar countries. Sweden performs especially well in Best Practices and Legal Systems. Its score of 92.93 in Best Practices is due in part to a low cost to export and import goods (697 and 735 USD per container, respectively) and a low number of days it takes to import a good (6 days), all well above levels seen in exemplar countries. In Legal Systems, Sweden’s high score can be attributed to a high score in the Transparency Corruption Index (9.4 out of 10) relative to exemplar countries (8.76 out of 10), as well as a low number of start-up procedures to register a business (3) compared to exemplar countries (4.2). Overall, however, Sweden’s score decreased by six points from our 2008 report due in part to a 10-point decrease in its National Policies score.
Switzerland’s overall score is 73.70. Switzerland performs best in Infrastructure and Human Capital with scores of 82.67 and 82.71, respectively. Its high score in Infrastructure is due in part to a high percentage of paved roads (100%), a high percentage of households that have access to the Internet (77%) and a high number of personal computers (96.23 per 100 people), all of which outperform levels in exemplar countries. In Human Capital, Switzerland scores high, as it has a low unemployment rate (3.1%) and a low percent of the workforce that is employed in agriculture (3%). It scores lowest in National Policies with a score of 56.80. This relatively low score can be attributed to a low level of imports and exports (96% of GDP) relative to exemplar countries (180.4% of GDP) and a low level of Foreign Direct Investment (4.10% of GDP), compared with exemplar countries (7.34% of GDP). From our 2008 report, Switzerland’s overall score decreased by eight points due to substantial drops in Financial Services and National Policies.
Syria’s overall score is 36.86. Syria performs well in Best Practices with a score of 70.51. Some statistics that aided this score were length of customs clearance on par with benchmarks (4 days for air cargo, 10 days for sea cargo) and a high amount of receipts from international tourism (equivalent to 32.2% of exports). Syria performs very poorly in Human Capital with a score of -8.27. This negative score is mainly due to a negative net migration rate (-27.8 per 1000 people), but it also reflects a high infant mortality rate (15.12 per 1000 births) and a high percentage of the workforce in agriculture (15%). Compared to our study in 2008, Syria’s score has decreased by five points. This decrease can be attributed to a large drop in their Human Capital rating; however, all other areas have remained steady or shown an increase.
Tajikistan’s overall score is 35.49. Tajikistan performs best in National Policies and Legal Systems. In National Policies, Tajikistan outperforms the Big 5 and OECD in imports of goods and services as a percentage of GDP (61%) and also records somewhat widely used internationally recognized standards (16.7% of firms). Regarding Legal Systems, firms in Tajikistan have slightly lower security costs as a percentage of sales than the OECD countries (1.3%), as well as lower losses due to vandalism and theft as a percent of total sales (0.3%). Tajikistan performs worst in the area of Financial Services with a score of 14.44. This low score reflects their high cost of business start-up procedures (33.3% of GNI per capita) and a very low score on the Legal Rights Index (2 out of 10). Compared to our study in 2008, Tajikistan’s score has decreased by 12 points, a decrease that can be attributable to a severe drop in Financial Services and Legal Systems.
Tanzania’s overall score is 41.71. Tanzania performs best in Best Practices, where they record a score of 60.86. Its strong score in Best Practices reflects a high amount of receipts from international tourism (20% of exports) and they also record, relative to other scores in the category, moderately low documentation required for import/export (6). Tanzania performs poorly in Infrastructure, as they have a very low percentage of paved roads (6.7%). Infrastructure scores are also weighed down by an extremely low broadband subscriber rate (0.01 per 100 people) and a very low number of personal computers (0.74 per 100 people). Compared to our study in 2008, Tanzania scores almost exactly the same (0.02 points higher), any difference attributable to a four-point increase in Infrastructure.
Thailand receives an overall score of 57.58. Thailand performs best in Best Practices with a score of 77.41 and well in National Policies with a score of 73.08, outperforming all three benchmark averages in National Policies. In National Policies, its score was aided by imports and exports equaling a high percentage of GDP (135%) and a low amount of government subsidies and other transfers (20.7% of expenses). In Best Practices, Thailand records very low costs to import/export (750 USD to import, 625 USD to export), as well as minimal documentation to import/export (5 documents), and a significant portion of exports from tourism (10.3% of exports). Thailand performs relatively poorly in Infrastructure, which can be attributed to a low broadband subscriber rate (4.61 per 100 people), a low percentage of households with access to the Internet (21%) and a small amount of personal computers (5.8 per 100 people). Compared to our study in 2008, Thailand’s score is only 1.5 points lower, which reflects swings in Financial Services and Human Capital.
Trinidad and Tobago’s overall score is 51.77. Trinidad and Tobago performs best in National Policies with a score of 64.17. Leading statistics within that area of National Policies for this country were FDI (2.7% of GDP) and imports and exports (collectively 103% of GDP). Trinidad and Tobago performs worst in Infrastructure due in part to lack of personal computers (7.9 per 100 people) and low annual air transport of freight (13 million tons per km). Compared to our study in 2008, Trinidad and Tobago’s score decreased by about six points due mainly to a large decrease in Financial Services and National Policies; although, they were still the country’s best performing categories.
Tunisia’s overall score is 53.08. Tunisia performs best in the areas of Legal Systems and Best Practices. In Legal Systems, they record a short time to resolve insolvency (1.3 years, compared to 1.7 years in OECD countries), as well as a short time required to build a warehouse (88 days, compared to 150.94 in OECD countries). Regarding Best Practices, Tunisia’s solid score of a 72.64 can be attributed in part to a sizeable amount of receipts from international tourism (equivalent to 15.6% of exports), as well as low costs to import/export a container (858 USD to import, 773 USD to export). Tunisia performs poorly in Infrastructure with low international flights per capita (0.0041 flights per capita) and a very low air transport of freight compared to the benchmark averages (21 million tons per km). Compared to our 2008 study, Tunisia scores about five points lower due in part to decreases in National Policies and Financial Services.
Turkey receives an overall score of 54.08. While most of Turkey’s scores were very similar, they perform best in Best Practices. This score comes from above average levels of tourism (15.9% of exports, compared to 7.82% OECD) and low costs to import/export (1,063 USD to import, 990 USD to export) compared with OECD countries. The other outlier amongst Turkey’s scores was Infrastructure, where they perform poorly with a score of 34.99. This lower score was due in part to a low number of personal computers (5.2 per 100 people), a low percentage of households that have access to the Internet (39.8% of households) and a poor extent of business Internet use (3.8 out of 7). Compared to our study in 2008, Turkey’s score has decreased by three points. This can be attributed to lower scores in Legal Systems and National Policies.
133
0
50
100NP
BP
IF
FS
HC
LES
Country Section Scores vs. Exemplars
Exemplars
Uganda
0 20 40 60 80
Big 5
Exemplars
OECD
Uganda
63.66
79.90
65.38
42.73
Aggregate Scores
Uganda
Uganda’s overall score is 42.73. Uganda performs best in National Policies and Human Capital. In National Policies, with a score of 52.39, it scores relatively well due to widely used internationally-recognized standards (15.5%) relative to OECD countries (12.57%), as well as a low level of government subsidies (44.7% of expenses) compared to OECD countries (57.84% of expenses). In Human Capital, Uganda attains a relatively high score due in part to a low reported unemployment rate (4.2%), as well as a low average hiring cost (10% of salary). Its only remarkably low score is in Infrastructure with a 14.38. This score is due to a low amount of paved roads (12.5%), a low number of mobile phones (38 per 100 people) and a low number of personal computers (0.87 per 100 people). From our 2008 report, Uganda’s overall score has decreased by less than one point due to a large decrease in its Financial Services score coupled with modest increases in the other indicators.
Ukraine’s overall score is 49.06. Ukraine performs best in National Policies and Human Capital with respective scores of 76.68 and 56.73. In National Policies, its high score is due in part to a low level of anti-dumping measures (19) relative to OECD countries (115.23), as well as a high level of imports and exports (103% of GDP) compared to OECD countries (96.58% of GDP). In Human Capital, Ukraine’s high score can be attributed to a high number of hospital beds (8.38 per 100 people) and a high adult literacy rate (99.8%), both of which fall well above OECD levels. It fares worst in Financial Services with a score of 29.50. This relatively low score is due to the large number of taxes businesses must pay every year (135), far above OECD levels (13.08), as well as a high percentage of non-performing bank loans (15.4%). From our 2008 report, Ukraine’s score has decreased by 15 points due to large drops in its Best Practices and Financial Services indicators.
The United Kingdom’s overall score is 74.56. Its highest score is in Best Practices, where it is higher than the Big 5 and roughly on par with the exemplars. The United Kingdom has short time periods for customs clearance for air cargo (5 days) and imports (6 days) and a small number of documents required for exports (4). It scored on par with the Big 5 and the OECD in Human Capital due to high expenditure on public education as a percentage of GDP (5.5%), high adult literacy rate (99%) and high life expectancy (80 years). The country also scored higher than both the Big 5 and OECD in Legal Systems due to the low number of procedures to build a warehouse (9). Although the UK has scored consistently high in all areas on par with all benchmarks, its aggregate score has seen a decrease from four years earlier by 8.89 points due to the possibility that the United Kingdom’s financial policies may have implemented much stricter financial regulations, made evident by its lower score in Financial Services.
The United States receives an overall score of 75.35, recording its best scores in Human Capital and Best Practices with respective scores of 85.33 and 86.37. In Human Capital, the United States records a large percentage of immigrants with a graduate education, low employment in agriculture (2% of labor force) and a very large number of scientific and technical journal articles published annually (208,601). Regarding Best Practices, the United States records adequate scores and overall low trade restrictions. They record decently short time to import/export (5 and 6 days respectively) and documents to import/export that are right in line with or lower than the other Big 5 nations (4 to import, 5 to export). The lowest score for the United States comes in National Policies with a score of 54.53. This low score comes from low levels of trade (imports and exports equal 29% of GDP), a lot of WTO cases (63) and anti-dumping measures (253) and high levels of government subsidies (63.6% of expenses). Compared to our study in 2008, the United States scores about four points lower. This decrease is due mainly to lower scores in Infrastructure and Legal Systems.
Uruguay’s final score is 50.03. The score is a median of all the aggregate scores of countries that have been compiled. Uruguay received its highest score in Legal Systems due to their very high score on the Transparency International Corruption Index (7 out of 10 in comparison to its prominent South American neighbors Brazil 3.8 out of 10, Venezuela 1.9 out of 10, and Argentina 3 out of 10), low number of terrorist incidence in the years 2000-2006 (3 incidences) and a low number of days needed to start a business (7 days in comparison due exemplar’s 11.2 days). The lowest score the country attained was in the field of infrastructure, a common problem of many Latin American countries. What contributed to the low score was the low number of secure Internet servers per one million people (only 70 in comparison in to exemplar’s 1630.2) and the low electrical production per capita (only 2638.36 KWh per capita in comparison to OECD’s per capita production of 15,816 KWh per capita). Though relatively good in some areas, Uruguay has yet to develop adequate infrastructure. Compared to our 2008 study, Uruguay’s score decreased by five points mainly due to much lower marks in National Policies.
Uzbekistan’s overall score is 30.41. Uzbekistan scores the highest in Human Capital due to the high adult literacy rate (99.3%) and its high enrollment ratio for secondary schools (106%). Uzbekistan has low scores in Financial Services and Infrastructure. The score in Financial Services is low as a result of the high cost of business start-up procedures (6.4% of Gross Domestic Income) and its poor legal rights index (2 out of 10), which compares unfavorably to the scores that OECD and Big 5 countries attain. The country’s score in Infrastructure is low as a result of low annual air transport freight (166 millions of tons per km), low electrical production per capita (1767.74 kWh) and the small number of personal computers (3.13 per 100 people). Compared to our 2008 report, Uzbekistan’s score dropped about 14 points, which could be attributed to inadequate infrastructure that is lacking compared to that of the benchmark economies.
139
0
50
100NP
BP
IF
FS
HC
LES
Country Section Scores vs. Exemplars
Exemplars
Venezuela
0 50 100
Big 5
Exemplars
OECD
Venezuela
65.83
82.37
67.75
36.64
Aggregate Scores
Venezuela
Venezuela’s overall score is 36.64. Venezuela performs best in Human Capital, as well as National Policies. With a score of 62.48, its high score in Human Capital can be attributed in part to a low percent of the population over the age of 65 (5.4%) relative to OECD countries (14.94%), as well as an average cost of hiring (14.7% of salary) far below OECD levels (21.56% of salary). In National Policies, Venezuela scores relatively well due in part to widely used internationally recognized standards (25.9%) relative to OECD countries (12.57%). It does worst in Infrastructure and Best Practices with scores of 22.26 and 25.80, respectively. In Infrastructure, its low score is due to a low level of expenditure on information and communication technology (3.52% of GDP) relative to OECD countries (5.65% of GDP). In Best Practices, Venezuela’s score can be linked to a low level of receipts from international tourism (1% of total exports) compared to OECD countries (7.82% of total exports), as well as a high cost to export (2,590 USD) compared to OECD country’s score (1,035.79 USD). From our 2008 report, Venezuela’s overall score decreased by three points, as Financial Services saw a large decrease and Human Capital a large increase.
Vietnam receives an overall score of 52.26. Vietnam outperforms all benchmark comparisons in National Policies with a score of 81.54. This high score is driven mainly by a large amount of trade (imports and exports 166% of GDP), high levels of imports of goods and services (88% of GDP) and a fairly wide use of internationally recognized standards (16.7% of firms). Vietnam performs poorly in the areas of Infrastructure and Financial Services. In Infrastructure, they record a low number of international flights per capita (0.0011 per capita), low air transport of freight (428 million tons per km) and minimal electrical power production (957 KWh per capita). Regarding Financial Services, they have a relatively high cost to start a business (10.6 % GNI per capita), a large number of taxes businesses must pay (32) and a very long time required to pay business taxes (average of 941 hours). Compared to our 2008 study, Vietnam’s score has increased by four points. This increase in score can be attributed to a much higher score in National Policies and Human Capital.
Zambia records an overall score of a 36.51. Zambia sees its best scores in the areas of National Policies and Legal Systems. Its score in National Policies comes mainly from a moderately high number of firms using internationally recognized standards (17.1% of firms) and low amounts of government subsidies (15.3% of total expenses, compared to 57.8% in OECD countries). The relatively strong score in Legal Systems is driven by legal procedures scores that are for the most part on par with the benchmark nations, as well as a low percent of firms that expect to have to give gifts in meetings with tax officials (4.9% compared to 19.1% in OECD countries). Zambia performs very poorly in Infrastructure with a score of 7.27. This low score comes from an extremely low amount of international flights (0.0003 per capita, compared to 0.06 in exemplar countries), as well as an almost non-existent broadband subscriber rate (0.08 per 100 people). Compared to our study in 2008, Zambia’s score has gone down by one point with no specific area to blame.
National Foreign Trade Council , Inc. 1625 K Street, NW, Suite 200 Washington, DC 20006-1604