Connecticut Higher Education Trust Program Advisor Plan Financial Statements as of June 30, 2011, and for the Period from September 30, 2010 to June 30, 2011, and Independent Auditors’ Report
Transcript
Connecticut Higher Education Trust Program Advisor Plan Financial Statements as of June 30, 2011, and for the Period from September 30, 2010 to June 30, 2011, and Independent Auditors’ Report
CONNECTICUT HIGHER EDUCATION TRUST PROGRAM ADVISOR PLAN
TABLE OF CONTENTS
Page
INDEPENDENT AUDITORS’ REPORT 1
FINANCIAL STATEMENTS AS OF JUNE 30, 2011, AND FOR THE PERIOD FROM SEPTEMBER 30, 2010 TO JUNE 30, 2011: Statement of Assets and Liabilities and Schedule of Investments 4–7 Statement of Operations and Changes in Net Assets 8–11 Financial Highlights 12–13 Notes to Financial Statements 14–20
INDEPENDENT AUDITORS’ REPORT
To the Board of Trustees Connecticut Higher Education Trust Advisor PlanHartford, Connecticut We have audited the accompanying statements of assets and liabilities of the Connecticut Higher Education Trust Program Advisor Plan (the “Plan”), including the schedule of investments, as of June 30, 2011, and the related statements of operations and of changes in net assets, and the financial highlights, for the period from September 30, 2010 to June 30, 2011, which collectively comprise the Plan’s financial statements as listed in the table of contents. These financial statements are the responsibility of the Plan’s management. Our responsibility is to express an opinion on the respective financial statements based on our audit.
We conducted our audit in accordance with auditing standards generally accepted in the United States of America. Those standards require that we plan and perform the audit to obtain reasonable assurance about whether the financial statements are free of material misstatement. An audit includes consideration of internal control over financial reporting as a basis for designing audit procedures that are appropriate in the circumstances, but not for the purpose of expressing an opinion on the effectiveness of the Plan’s internal control over financial reporting. Accordingly, we express no such opinion. An audit also includes examining, on a test basis, evidence supporting the amounts and disclosures in the respective financial statements, assessing the accounting principles used and significant estimates made by management, as well as evaluating the overall financial statement presentation. We believe that our audit provides a reasonable basis for our opinion.
In our opinion, the financial statements and financial highlights referred to above present fairly, in all material respects, the financial position of the Plan as of June 30, 2011, the results of its operations and changes in its net assets, and financial highlights for the period from September 30, 2010 to June 30, 2011, in conformity with accounting principles generally accepted in the United States of America.
September 12, 2011
THIS PAGE INTENTIONALLY LEFT BLANK
- 4 -
CONNECTICUT HIGHER EDUCATION TRUST PROGRAM ADVISOR PLAN
STATEMENTS OF ASSETS AND LIABILITIES AND SCHEDULE OF INVESTMENTSAS OF JUNE 30, 2011
CHET Advisor CHET Advisor CHET Advisor CHET Advisor CHET AdvisorAge-Based Age-Based Age-Based Age-Based Age-Based
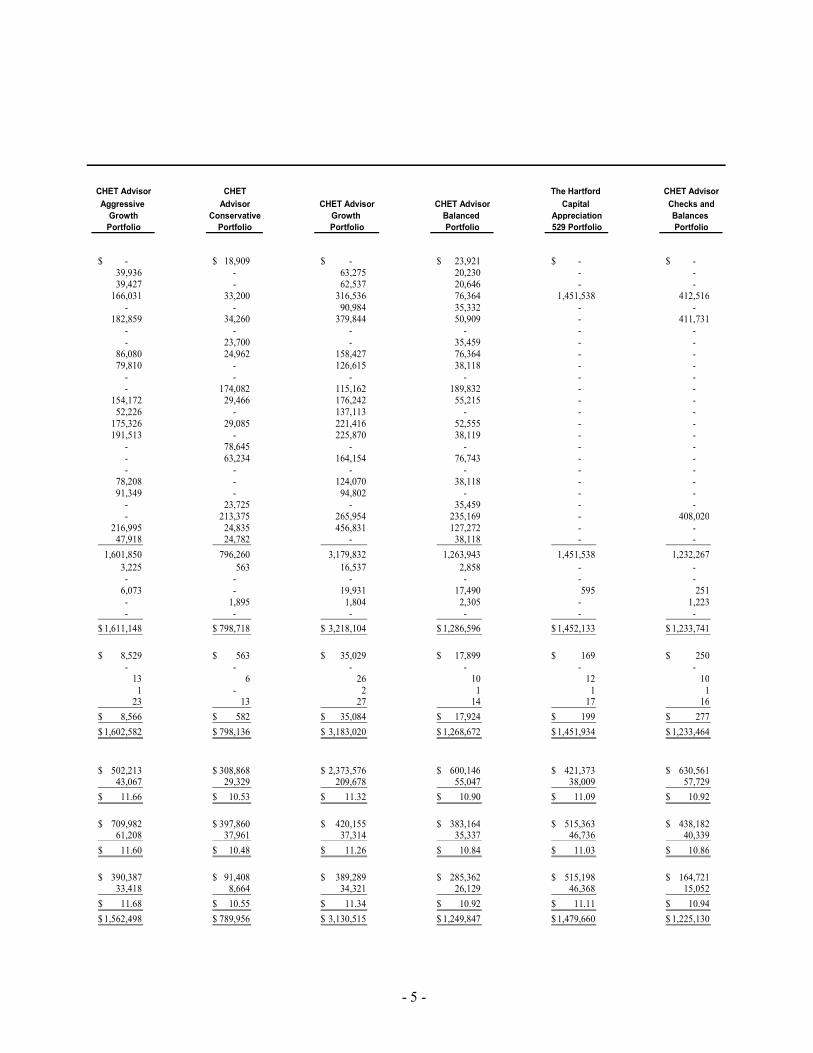
Portfolio 0-8 Portfolio 9-13 Portfolio 14-15 Portfolio 16-17 Portfolio 18+ASSETS: Investments in underlying funds, at fair value * Powershares Emerging Markets Sovereign Debt - $ 130,493$ 57,837$ 45,972$ 31,885$ SPDR Dow Jones International Real Estate ETF 138,423 142,905 49,304 - - SPDR Dow Jones REIT ETF 136,796 140,792 48,818 - - The Hartford Capital Appreciation Fund, Class Y 688,548 543,702 178,207 78,100 - The Hartford Corporate Opportunities Fund, Class Y 197,914 202,366 81,563 - 107,397 The Hartford Dividend and Growth Fund, Class Y 826,258 678,505 118,578 80,747 - The Hartford Equity Income Fund, Class Y - 203,683 - - - The Hartford Floating Rate Fund, Class Y - - 81,866 56,438 32,248 The Hartford Fundamental Growth Fund, Class Y 344,943 303,315 178,502 58,622 30,816 The Hartford Global Research Fund, Class Y 275,163 204,069 88,923 - - The Hartford Growth Opportunities Fund, Class Y - - - - - The Hartford Inflation Plus Fund, Class Y 250,507 590,121 437,368 413,686 113,855 The Hartford International Opportunities Fund, Class Y 383,372 436,334 128,695 69,401 30,254 The Hartford International Small Company Fund, Class Y 298,168 204,231 - - - The Hartford MidCap Fund, Class Y 481,638 472,736 122,244 68,644 - The Hartford MidCap Value Fund, Class Y 491,326 - 88,531 - - The Hartford Money Market Fund, Class Y - - - 187,283 493,354 The Hartford Short Duration Fund, Class Y 357,076 405,411 176,980 150,583 - The Hartford Small Company Fund, Class Y - - - - - The Hartford Small/Mid Cap Equity Fund, Class Y 269,883 216,908 88,611 - - The Hartford SmallCap Growth Fund, Class Y 206,218 - - - - The Hartford Strategic Income Fund, Class Y - - 81,951 56,497 78,624 The Hartford Total Return Bond Fund, Class Y 578,519 1,047,141 542,330 508,123 128,562 The Hartford Value Fund, Class Y 993,723 868,029 295,994 58,622 47,383 The Hartford Value Opportunities Fund, Class Y - - 88,464 58,794 - Total investments 6,918,475 6,790,741 2,934,766 1,891,512 1,094,378 Cash 1,745 2,926 5,234 414 - Receivables for investment securities sold - - - 4,750 1,167 Receivables from the sale of units to account owners 33,355 22,723 250 63 22,653 Dividends receivable 4,571 8,003 4,977 4,762 2,000 Other assets - - - - - Total assets 6,958,146$ 6,824,393$ 2,945,227$ 1,901,501$ 1,120,198$ LIABILITIES: Payable for investment securities purchased 33,211$ 25,589$ 5,484$ 476$ 21,634$ Payable from units redeemed from account owners - - - 4,750 2,422 Accrued plan manager fees 56 55 24 16 9 Accrued administration fees 4 4 2 1 1 Accrued distribution fees 54 73 33 29 14 Total liabilities 33,325$ 25,721$ 5,543$ 5,272$ 24,080$ NET ASSETS 6,924,821$ 6,798,672$ 2,939,684$ 1,896,229$ 1,096,118$ Net assets consists of: Class A Net assets 4,594,025$ 4,697,509$ 1,614,554$ 897,400$ 599,025$ Units outstanding 405,621 424,189 148,192 85,170 58,380 Net asset value 11.33$ 11.07$ 10.89$ 10.54$ 10.26$ Class C Net assets 844,703$ 1,534,532$ 820,701$ 818,908$ 377,991$ Units outstanding 74,993 139,345 75,734 78,185 37,042 Net asset value 11.26$ 11.01$ 10.84$ 10.47$ 10.20$ Class E Net assets 1,486,093$ 566,631$ 504,429$ 179,921$ 119,102$ Units outstanding 130,998 51,084 46,184 17,048 11,589 Net asset value 11.34$ 11.09$ 10.92$ 10.55$ 10.28$ * Identified Cost 6,857,563$ 6,738,793$ 2,911,135$ 1,880,309$ 1,093,209$ See notes to financial statements.
- 5 -
CHET Advisor CHET The Hartford CHET AdvisorAggressive Advisor CHET Advisor CHET Advisor Capital Checks and
CONNECTICUT HIGHER EDUCATION TRUST PROGRAM ADVISOR PLAN
STATEMENTS OF ASSETS AND LIABILITIES AND SCHEDULE OF INVESTMENTS (CONTINUED)AS OF JUNE 30, 2011
TheHartford TheHartford TheHartford TheHartford TheHartfordDividendand Fundamental Global Growth Inflation
Growth Growth Research Opportunities Plus529Portfolio 529Portfolio 529Portfolio 529Portfolio 529Portfolio
ASSETS: Investments in underlying funds, at fair value * Powershares Emerging Markets Sovereign Debt - $ - $ - $ - $ - $ SPDR Dow Jones International Real Estate ETF - - - - - SPDR Dow Jones REIT ETF - - - - - The Hartford Capital Appreciation Fund, Class Y - - - - - The Hartford Corporate Opportunities Fund, Class Y - - - - - The Hartford Dividend and Growth Fund, Class Y 1,055,083 - - - - The Hartford Equity Income Fund, Class Y - - - - - The Hartford Floating Rate Fund, Class Y - - - - - The Hartford Fundamental Growth Fund, Class Y 193,771 - - - The Hartford Global Research Fund, Class Y - - 312,714 - - The Hartford Growth Opportunities Fund, Class Y - - - 344,129 - The Hartford Inflation Plus Fund, Class Y - - - - 672,039 The Hartford International Opportunities Fund, Class Y - - - - - The Hartford International Small Company Fund, Class Y - - - - - The Hartford MidCap Fund, Class Y - - - - - The Hartford MidCap Value Fund, Class Y - - - - - The Hartford Money Market Fund, Class Y - - - - - The Hartford Short Duration Fund, Class Y - - - - - The Hartford Small Company Fund, Class Y - - - - - The Hartford Small/Mid Cap Equity Fund, Class Y - - - - - The Hartford SmallCap Growth Fund, Class Y - - - - - The Hartford Strategic Income Fund, Class Y - - - - - The Hartford Total Return Bond Fund, Class Y - - - - - The Hartford Value Fund, Class Y - - - - - The Hartford Value Opportunities Fund, Class Y - - - - -
Total investments 1,055,083 193,771 312,714 344,129 672,039 Cash - - - - - Receivables for investment securities sold - - - - - Receivables from the sale of units to account owners 474 46 75 68 129 Dividends receivable - - - - 3,859 Other assets - - - - -
Total assets 1,055,557$ 193,817$ 312,789$ 344,197$ 676,027$
LIABILITIES: Payable for investment securities purchased 72$ 45$ 72$ 68$ 50$ Payable from units redeemed from account owners - - - - - Accrued plan manager fees 9 2 3 3 6 Accrued administration fees 1 - - - - Accrued distribution fees 12 2 3 3 10
Total liabilities 94$ 49$ 78$ 74$ 66$
NET ASSETS 1,055,463$ 193,768$ 312,711$ 344,123$ 675,961$
Net assets consists of: Class A Net assets 522,470$ 124,076$ 97,726$ 235,168$ 304,637$ Units outstanding 45,272 11,079 8,531 19,554 29,313
Net asset value 11.54$ 11.20$ 11.46$ 12.03$ 10.39$
Class C Net assets 304,996$ 30,410$ 75,212$ 52,195$ 274,849$ Units outstanding 26,586 2,731 6,604 4,363 26,595
Net asset value 11.47$ 11.14$ 11.39$ 11.96$ 10.33$
Class E Net assets 227,997$ 39,282$ 139,773$ 56,760$ 96,475$ Units outstanding 19,733 3,501 12,182 4,710 9,266
Net asset value 11.55$ 11.22$ 11.47$ 12.05$ 10.41$
* Identified Cost 1,032,518$ 188,346$ 295,306$ 330,985$ 662,720$ See notes to financial statements.
- 7 -
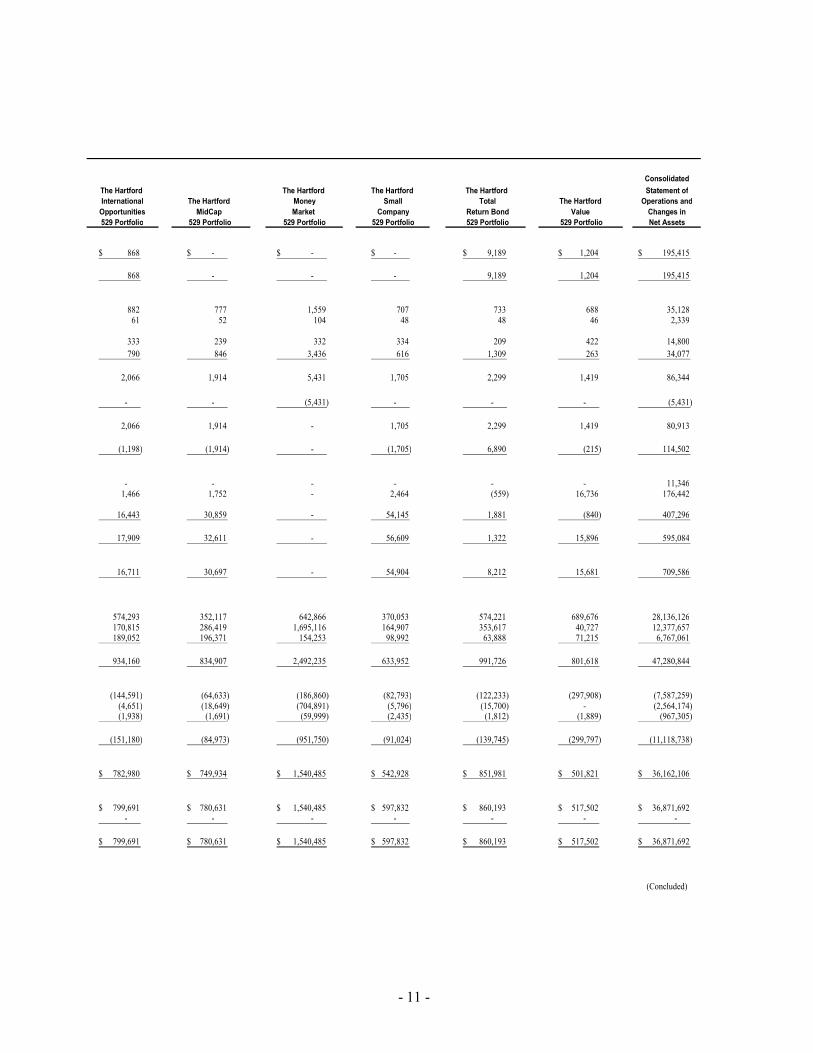
TheHartford TheHartford TheHartford TheHartford ConsolidatedInternational TheHartford Money Small Total TheHartford StatementofOpportunities MidCap Market Company ReturnBond Value Assetsand529Portfolio 529Portfolio 529Portfolio 529Portfolio 529Portfolio 529Portfolio Liabilities
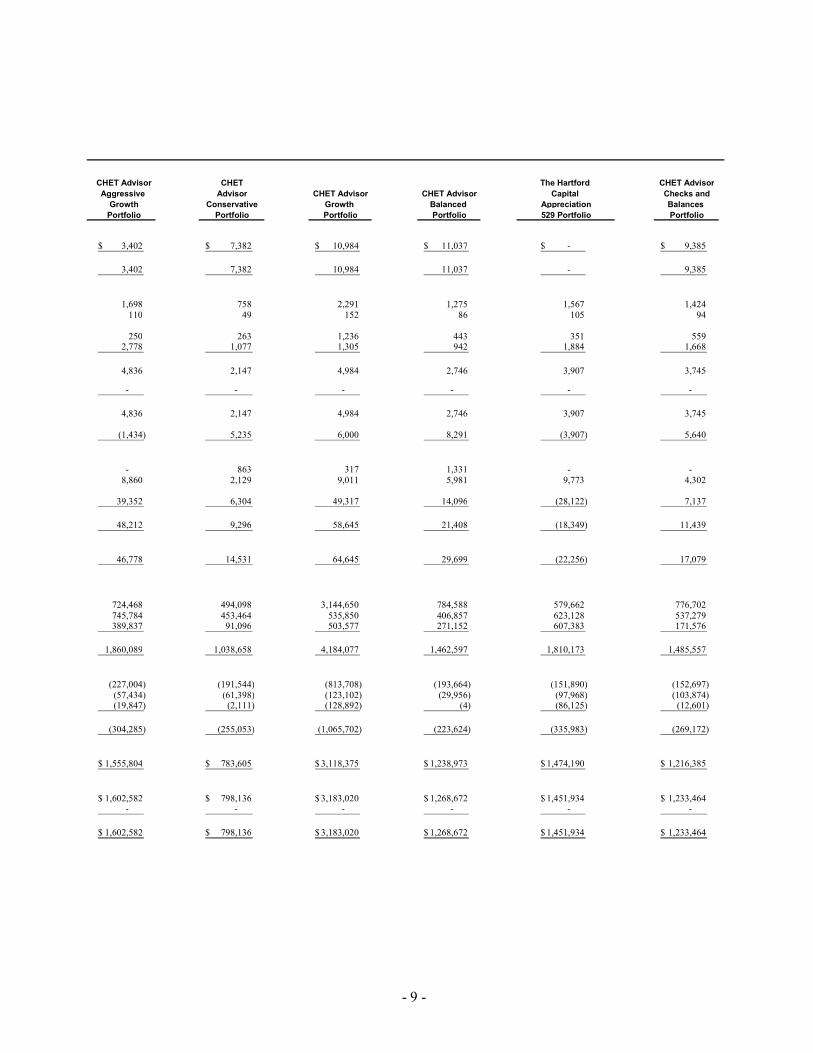
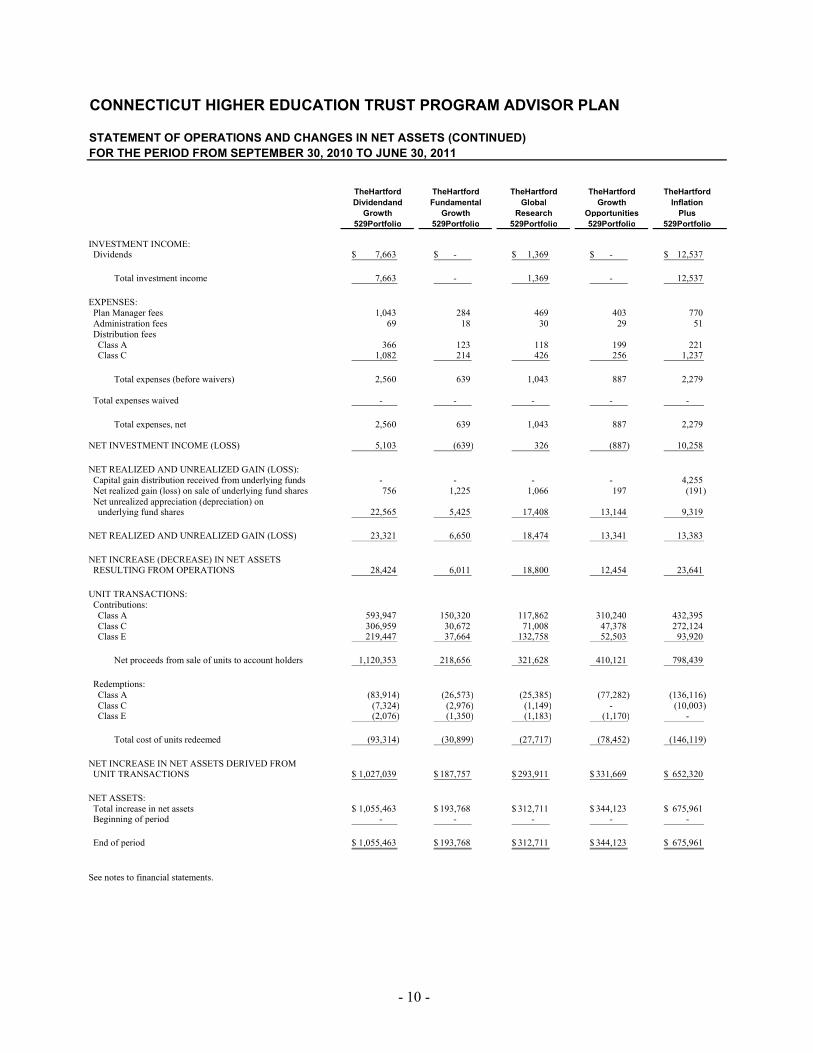
Total investment income 29,397 42,154 21,866 18,981 7,997
EXPENSES: Plan Manager fees 6,281 6,041 2,537 1,904 1,037 Administration fees 419 403 168 127 70 Distribution fees Class A 3,399 3,243 1,190 616 354 Class C 2,169 5,392 1,848 3,138 1,401
Total expenses (before waivers) 12,268 15,079 5,743 5,785 2,862
Total expenses waived - - - - -
Total expenses, net 12,268 15,079 5,743 5,785 2,862
NET INVESTMENT INCOME (LOSS) 17,129 27,075 16,123 13,196 5,135
NET REALIZED AND UNREALIZED GAIN (LOSS): Capital gain distribution received from underlying funds 676 1,057 1,189 1,214 444 Net realized gain (loss) on sale of underlying fund shares 47,330 38,843 17,565 5,093 2,643 Net unrealized appreciation (depreciation) on underlying fund shares 60,912 51,948 23,631 11,203 1,169
NET REALIZED AND UNREALIZED GAIN (LOSS) 108,918 91,848 42,385 17,510 4,256
NET INCREASE (DECREASE) IN NET ASSETS RESULTING FROM OPERATIONS 126,047 118,923 58,508 30,706 9,391
UNIT TRANSACTIONS: Contributions: Class A 5,802,135 5,869,306 2,248,797 1,556,113 1,347,617 Class C 1,139,280 2,132,372 1,026,686 885,188 452,027 Class E 1,884,555 644,014 564,488 199,538 129,782
Net proceeds from sale of units to account holders 8,825,970 8,645,692 3,839,971 2,640,839 1,929,426
Redemptions: Class A (1,279,288) (1,238,247) (669,055) (670,142) (751,732) Class C (307,160) (635,041) (217,399) (81,636) (78,067) Class E (440,748) (92,655) (72,341) (23,538) (12,900)
Total cost of units redeemed (2,027,196) (1,965,943) (958,795) (775,316) (842,699)
NET INCREASE IN NET ASSETS DERIVED FROM UNIT TRANSACTIONS 6,798,774$ 6,679,749$ 2,881,176$ 1,865,523$ 1,086,727$
NET ASSETS: Total increase in net assets 6,924,821$ 6,798,672$ 2,939,684$ 1,896,229$ 1,096,118$ Beginning of period - - - - -
End of period 6,924,821$ 6,798,672$ 2,939,684$ 1,896,229$ 1,096,118$
See notes to financial statements.
- 9 -
CHET Advisor CHET The Hartford CHET AdvisorAggressive Advisor CHET Advisor CHET Advisor Capital Checks and
EXPENSES: Plan Manager fees 1,043 284 469 403 770 Administration fees 69 18 30 29 51 Distribution fees Class A 366 123 118 199 221 Class C 1,082 214 426 256 1,237
Total expenses (before waivers) 2,560 639 1,043 887 2,279
Total expenses waived - - - - -
Total expenses, net 2,560 639 1,043 887 2,279
NET INVESTMENT INCOME (LOSS) 5,103 (639) 326 (887) 10,258
NET REALIZED AND UNREALIZED GAIN (LOSS): Capital gain distribution received from underlying funds - - - - 4,255 Net realized gain (loss) on sale of underlying fund shares 756 1,225 1,066 197 (191) Net unrealized appreciation (depreciation) on underlying fund shares 22,565 5,425 17,408 13,144 9,319
NET REALIZED AND UNREALIZED GAIN (LOSS) 23,321 6,650 18,474 13,341 13,383
NET INCREASE (DECREASE) IN NET ASSETS RESULTING FROM OPERATIONS 28,424 6,011 18,800 12,454 23,641
UNIT TRANSACTIONS: Contributions: Class A 593,947 150,320 117,862 310,240 432,395 Class C 306,959 30,672 71,008 47,378 272,124 Class E 219,447 37,664 132,758 52,503 93,920
Net proceeds from sale of units to account holders 1,120,353 218,656 321,628 410,121 798,439
Redemptions: Class A (83,914) (26,573) (25,385) (77,282) (136,116) Class C (7,324) (2,976) (1,149) - (10,003) Class E (2,076) (1,350) (1,183) (1,170) -
Total cost of units redeemed (93,314) (30,899) (27,717) (78,452) (146,119)
NET INCREASE IN NET ASSETS DERIVED FROM UNIT TRANSACTIONS 1,027,039$ 187,757$ 293,911$ 331,669$ 652,320$
NET ASSETS: Total increase in net assets 1,055,463$ 193,768$ 312,711$ 344,123$ 675,961$ Beginning of period - - - - - End of period 1,055,463$ 193,768$ 312,711$ 344,123$ 675,961$
See notes to financial statements.
- 11 -
ConsolidatedThe Hartford The Hartford The Hartford The Hartford Statement ofInternational The Hartford Money Small Total The Hartford Operations and
Opportunities MidCap Market Company Return Bond Value Changes in529 Portfolio 529 Portfolio 529 Portfolio 529 Portfolio 529 Portfolio 529 Portfolio Net Assets
CONNECTICUT HIGHER EDUCATION TRUST PROGRAM ADVISOR PLAN
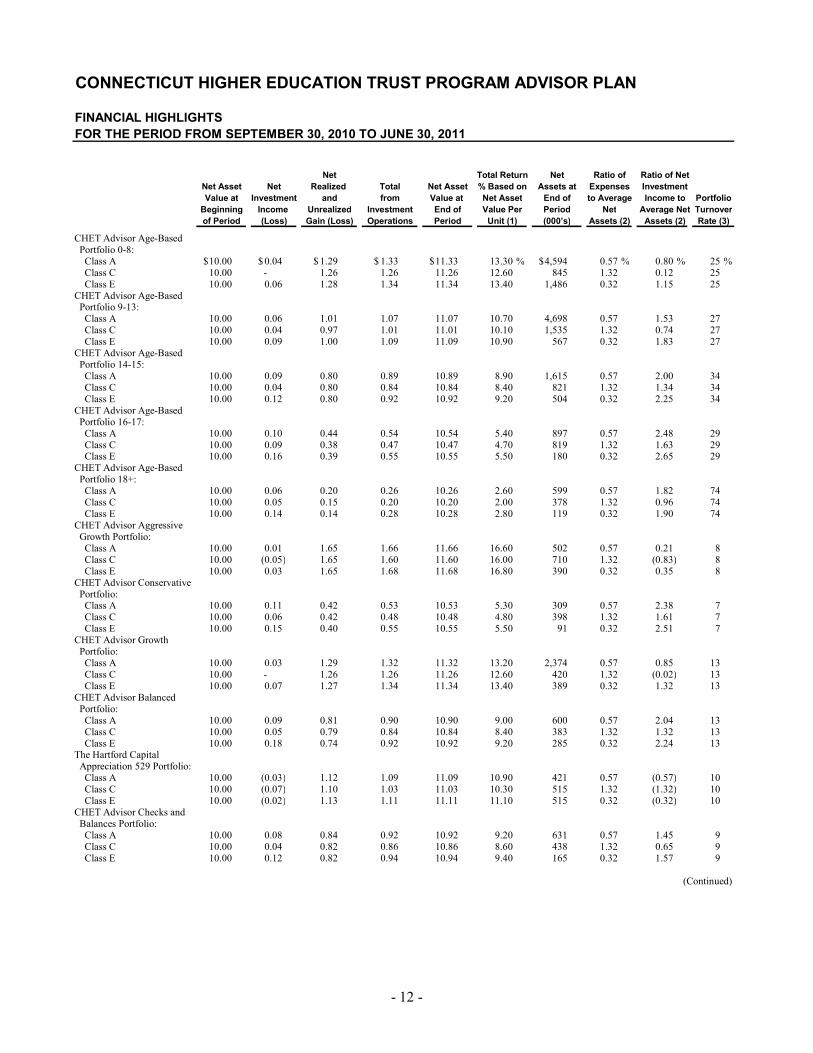
FINANCIAL HIGHLIGHTSFOR THE PERIOD FROM SEPTEMBER 30, 2010 TO JUNE 30, 2011
Net Total Return Net Ratio of Ratio of NetNet Asset Net Realized Total Net Asset % Based on Assets at Expenses InvestmentValue at Investment and from Value at Net Asset End of to Average Income to Portfolio
Beginning Income Unrealized Investment End of Value Per Period Net Average Net Turnoverof Period (Loss) Gain (Loss) Operations Period Unit (1) (000’s) Assets (2) Assets (2) Rate (3)
CHET Advisor Age-Based Portfolio 0-8: Class A 10.00$ 0.04$ 1.29$ 1.33$ 11.33$ 13.30 % 4,594$ 0.57 % 0.80 % 25 % Class C 10.00 - 1.26 1.26 11.26 12.60 845 1.32 0.12 25 Class E 10.00 0.06 1.28 1.34 11.34 13.40 1,486 0.32 1.15 25 CHET Advisor Age-Based Portfolio 9-13: Class A 10.00 0.06 1.01 1.07 11.07 10.70 4,698 0.57 1.53 27 Class C 10.00 0.04 0.97 1.01 11.01 10.10 1,535 1.32 0.74 27 Class E 10.00 0.09 1.00 1.09 11.09 10.90 567 0.32 1.83 27 CHET Advisor Age-Based Portfolio 14-15: Class A 10.00 0.09 0.80 0.89 10.89 8.90 1,615 0.57 2.00 34 Class C 10.00 0.04 0.80 0.84 10.84 8.40 821 1.32 1.34 34 Class E 10.00 0.12 0.80 0.92 10.92 9.20 504 0.32 2.25 34 CHET Advisor Age-Based Portfolio 16-17: Class A 10.00 0.10 0.44 0.54 10.54 5.40 897 0.57 2.48 29 Class C 10.00 0.09 0.38 0.47 10.47 4.70 819 1.32 1.63 29 Class E 10.00 0.16 0.39 0.55 10.55 5.50 180 0.32 2.65 29 CHET Advisor Age-Based Portfolio 18+: Class A 10.00 0.06 0.20 0.26 10.26 2.60 599 0.57 1.82 74 Class C 10.00 0.05 0.15 0.20 10.20 2.00 378 1.32 0.96 74 Class E 10.00 0.14 0.14 0.28 10.28 2.80 119 0.32 1.90 74 CHET Advisor Aggressive Growth Portfolio: Class A 10.00 0.01 1.65 1.66 11.66 16.60 502 0.57 0.21 8 Class C 10.00 (0.05) 1.65 1.60 11.60 16.00 710 1.32 (0.83) 8 Class E 10.00 0.03 1.65 1.68 11.68 16.80 390 0.32 0.35 8 CHET Advisor Conservative Portfolio: Class A 10.00 0.11 0.42 0.53 10.53 5.30 309 0.57 2.38 7 Class C 10.00 0.06 0.42 0.48 10.48 4.80 398 1.32 1.61 7 Class E 10.00 0.15 0.40 0.55 10.55 5.50 91 0.32 2.51 7 CHET Advisor Growth Portfolio: Class A 10.00 0.03 1.29 1.32 11.32 13.20 2,374 0.57 0.85 13 Class C 10.00 - 1.26 1.26 11.26 12.60 420 1.32 (0.02) 13 Class E 10.00 0.07 1.27 1.34 11.34 13.40 389 0.32 1.32 13 CHET Advisor Balanced Portfolio: Class A 10.00 0.09 0.81 0.90 10.90 9.00 600 0.57 2.04 13 Class C 10.00 0.05 0.79 0.84 10.84 8.40 383 1.32 1.32 13 Class E 10.00 0.18 0.74 0.92 10.92 9.20 285 0.32 2.24 13 The Hartford Capital Appreciation 529 Portfolio: Class A 10.00 (0.03) 1.12 1.09 11.09 10.90 421 0.57 (0.57) 10 Class C 10.00 (0.07) 1.10 1.03 11.03 10.30 515 1.32 (1.32) 10 Class E 10.00 (0.02) 1.13 1.11 11.11 11.10 515 0.32 (0.32) 10 CHET Advisor Checks and Balances Portfolio: Class A 10.00 0.08 0.84 0.92 10.92 9.20 631 0.57 1.45 9 Class C 10.00 0.04 0.82 0.86 10.86 8.60 438 1.32 0.65 9 Class E 10.00 0.12 0.82 0.94 10.94 9.40 165 0.32 1.57 9
(Continued)
- 13 -
Net Total Return Net Ratio of Ratio of NetNet Asset Net Realized Total Net Asset % Based on Assets at Expenses InvestmentValue at Investment and from Value at Net Asset End of to Average Income to Portfolio
Beginning Income Unrealized Investment End of Value Per Period Net Average Net Turnoverof Period (Loss) Gain (Loss) Operations Period Unit (1) (000’s) Assets (2) Assets (2) Rate (3)
The Hartford Dividend and Growth 529 Portfolio: Class A 10.00$ 0.08$ 1.46$ 1.54$ 11.54$ 15.40 % 522$ 0.57 % 1.75 % 1 % Class C 10.00 0.05 1.42 1.47 11.47 14.70 305 1.32 0.89 1 Class E 10.00 0.11 1.44 1.55 11.55 15.50 228 0.32 1.69 1 The Hartford Fundamental Growth 529 Portfolio: Class A 10.00 (0.03) 1.23 1.20 11.20 12.00 124 0.57 (0.57) 8 Class C 10.00 (0.14) 1.28 1.14 11.14 11.40 30 1.32 (1.32) 8 Class E 10.00 (0.03) 1.25 1.22 11.22 12.20 39 0.32 (0.32) 8 The Hartford Global Research 529 Portfolio: Class A 10.00 0.02 1.44 1.46 11.46 14.60 98 0.57 0.24 5 Class C 10.00 (0.01) 1.40 1.39 11.39 13.90 75 1.32 (0.11) 5 Class E 10.00 0.03 1.44 1.47 11.47 14.70 140 0.32 0.38 5 The Hartford Growth Opportunities 529 Portfolio: Class A 10.00 (0.03) 2.06 2.03 12.03 20.30 235 0.57 (0.57) 1 Class C 10.00 (0.10) 2.06 1.96 11.96 19.60 52 1.32 (1.32) 1 Class E 10.00 (0.03) 2.08 2.05 12.05 20.50 57 0.32 (0.32) 1 The Hartford Inflation Plus 529 Portfolio: Class A 10.00 0.19 0.20 0.39 10.39 3.90 305 0.57 4.76 2 Class C 10.00 0.22 0.11 0.33 10.33 3.30 275 1.32 3.54 2 Class E 10.00 0.24 0.17 0.41 10.41 4.10 96 0.32 3.73 2 The Hartford International Opportunities 529 Portfolio: Class A 10.00 (0.02) 1.03 1.01 11.01 10.10 436 0.57 (0.36) 6 Class C 10.00 (0.06) 1.00 0.94 10.94 9.40 171 1.32 (0.93) 6 Class E 10.00 - 1.02 1.02 11.02 10.20 193 0.32 0.03 6 The Hartford MidCap 529 Portfolio: Class A 10.00 (0.03) 2.04 2.01 12.01 20.10 298 0.57 (0.57) 3 Class C 10.00 (0.06) 2.01 1.95 11.95 19.50 276 1.32 (1.32) 3 Class E 10.00 (0.02) 2.05 2.03 12.03 20.30 207 0.32 (0.32) 3 The Hartford Money Market 529 Portfolio: Class A 10.00 - - - 10.00 - 456 - (4) - 54 Class C 10.00 - - - 10.00 - 990 - (4) - 54 Class E 10.00 - - - 10.00 - 94 - (4) - 54 The Hartford Small Company 529 Portfolio: Class A 10.00 (0.04) 3.04 3.00 13.00 30.00 319 0.57 (0.57) 4 Class C 10.00 (0.08) 3.00 2.92 12.92 29.20 173 1.32 (1.32) 4 Class E 10.00 (0.02) 3.04 3.02 13.02 30.20 107 0.32 (0.32) 4 The Hartford Total Return Bond 529 Portfolio: Class A 10.00 0.08 0.06 0.14 10.14 1.40 454 0.57 3.22 11 Class C 10.00 0.13 (0.05) 0.08 10.08 0.80 343 1.32 2.43 11 Class E 10.00 0.22 (0.06) 0.16 10.16 1.60 63 0.32 3.44 11 The Hartford Value 529 Portfolio: Class A 10.00 (0.02) 1.60 1.58 11.58 15.80 399 0.57 (0.24) 56 Class C 10.00 (0.01) 1.52 1.51 11.51 15.10 44 1.32 (0.11) 56 Class E 10.00 0.05 1.55 1.60 11.60 16.00 74 0.32 0.63 56 (1) Periods less than one year are not annualized for total returns.(2) Periods less than one year are annualized for ratio of expenses to average net assets and ratios of net investment income to average net assets.(3) Portfolio turnover rate is calculated on the basis of the fund as a whole without distinguishing between the class of shares issued.(4) As of June 30, 2011, the CHET Advisor Plan Manager is waiving the Plan Manager, Administration, and Distrubution fees. If these waived fees were included, the ratio of expenses to average net assets would be as follows: 0.57% (Class A), 1.32% (Class C), and 0.32% (Class E).See notes to financial statements. (Concluded)
- 14 -
CONNECTICUT HIGHER EDUCATION TRUST PROGRAM ADVISOR PLAN
NOTES TO FINANCIAL STATEMENTS AS OF JUNE 30, 2011, AND FOR THE PERIOD FROM SEPTEMBER 30, 2010 TO JUNE 30, 2011
Note 1 – Organization
The Connecticut Higher Education Trust (CHET) Program (the “Program”) was formed on July 1, 1997, by Connecticut law, to help people save for the costs of education after high school. The Program is administered by the Treasurer of the State of Connecticut, as trustee (the “Trustee”) of the Connecticut Higher Education Trust (the “Trust”). The Trustee has the authority to enter into contracts for program management services, adopt regulations for the administration of the Program, and establish investment policies for the Program. The Program consists of two components – CHET Direct Plan, which is offered directly by the state, and an advisor plan which began on September 30, 2010 (“CHET Advisor Plan”), for which Hartford Life Insurance Company (“Hartford Life”) and the Trustee have entered into a management agreement under which Hartford Life serves as program manager. The Hartford Financial Services Group, Inc. (“The Hartford”), Hartford Life’s parent company, has provided insurance and other financial management services for its clients since 1810. The Program is intended to meet the requirements of the qualified tuition program under Section 529 of the Internal Revenue Code and was established pursuant to the Connecticut General Statutes Section 3-22f to 3-22o. Investment options and allocations, as adopted by the Trustee, are described in the current Disclosure Booklet for the Program. These financial statements are intended for use in connection with an Account opened in the CHET Advisor Plan only, and are not intended to include information relevant to the CHET Direct Plan, which is described in a separate report, and offers investment options different from those offered under the CHET Advisor Plan. For more information on the CHET Direct Plan, you may call 1-888-799-2438 or go to www.aboutchet.com. Class A units are sold with a front-end sales charge of up to 5.50%, with the exception of the following portfolios that have a maximum front-end sales charge rate of:
Portfolio Rate CHET Advisor Age-Based Portfolio 16-17 3.00% CHET Advisor Age-Based Portfolio 18+ 3.00 The Hartford Conservative 529 Portfolio 3.00 The Hartford Inflation Plus 529 Portfolio 3.00 The Hartford Total Return Bond 529 Portfolio 3.00 The Hartford Money Market 529 Portfolio -
Class C units are sold with a contingent deferred sales charge of up to 1% on shares redeemed within twelve months of purchase, with the exception of the Hartford Money Market 529 Portfolio, which has no contingent deferred sales charge. Class E units are sold without sales charges to certain eligible investors. All classes of units have identical redemption, dividend, liquidation, and other rights and the same terms and conditions, with the exceptions that each class may have different expenses, which may affect performance. The portfolios operate in the manner of a “Fund of Funds,” investing the majority of their assets in Class Y shares of underlying mutual funds sponsored by The Hartford as well as certain exchange-traded funds (ETFs). Collectively, the underlying mutual funds and ETFs are called the “Underlying Funds.”
The accounting policies of the underlying mutual funds are outlined in the shareholder reports for such funds, available (1) without charge, upon request, by calling 888-843-7824 and (2) on the Securities and Exchange Commission’s (SEC) website at http://www.sec.gov. The reports may be reviewed and copied at the SEC’s Public Reference Room in Washington, DC. Information on the operation of the Public Reference Room may be obtained by calling 1-800-SEC-0330. The Underlying Funds are not covered by this report. Hartford Life has entered into an agreement with Upromise Investment Advisors, LLC, to provide certain administrative services for the CHET Advisor Plan. Hartford Investment Financial Services, LLC, provides investment management services to the Trust. State Street Bank and Trust Company acts as custodian for assets of the Trust.
Note 2 – Significant Accounting Policies The following is a summary of significant accounting policies of the CHET Advisor Plan in the preparation of its financial statements, which are in accordance with the accounting principles generally accepted in the United States (“U.S. GAAP”). The preparation of financial statements in accordance with U.S. GAAP may require management to make estimates and assumptions that affect the reported amounts of assets and liabilities and the reported amounts of increases and decreases in net assets from operations during the reporting period. Actual results could differ from those estimates. a) Determination of Net Asset Value (NAV) – The NAV of each class of the portfolio's units is based on
the value of all underlying investment holdings, determined as of the close of regular trading (normally 4:00 p.m. Eastern Time) (the "NYSE Close") on each day that the New York Stock Exchange (the "Exchange") is open ("Valuation Date"). Information that becomes known to the portfolio after the NAV has been calculated on a particular day will not generally be used to retroactively adjust the NAV determined earlier that day.
b) Investment Valuation – Investments in open-end mutual funds are valued at the respective NAV of
each underlying mutual fund as determined as of the NYSE Close on the Valuation Date.
The portfolios generally use market prices in valuing the ETFs. If market prices are not readily available or are deemed unreliable, the portfolio will use the fair value of the security.
U.S. GAAP defines fair value as the price that a portfolio would receive to sell an asset or pay to transfer a liability in an orderly transaction between market participants. The fair value measurement standards establish and require disclosure of a fair value hierarchy, separately for each major category of assets and liabilities. Various inputs are used in determining the fair value of the portfolio’s investments. These inputs are summarized into three broad hierarchy levels. This hierarchy is based on whether the valuation inputs are observable or unobservable. These levels are:
• Level 1 – Quoted prices in active markets for identical securities. Level 1 may include
exchange-traded instruments such as domestic equities, some foreign equities, options, futures, mutual funds, exchange-traded funds, rights, and warrants.
CONNECTICUT HIGHER EDUCATION TRUST PROGRAM ADVISOR PLAN
NOTES TO FINANCIAL STATEMENTS (CONTINUED) AS OF JUNE 30, 2011, AND FOR THE PERIOD FROM SEPTEMBER 30, 2010 TO JUNE 30, 2011
• Level 2 – Observable inputs other than Level 1 prices, such as quoted prices for similar securities; quoted prices in markets that are not active; or other inputs that are observable or can be corroborated by observable market data. Level 2 may include debt securities that are traded less frequently than exchange-traded instruments and which are valued using third-party pricing services; foreign equities, whose value is determined using a multi-factor regression model with inputs that are observable in the market; and short-term securities, which are valued at amortized cost.
• Level 3 – Significant unobservable inputs that are supported by limited or no market activity.
Level 3 may include financial instruments whose values are determined using broker quotes or require significant management judgment or estimation. These unobservable valuation inputs may include estimates for current yields, maturity/duration, prepayment speed, and broker quotes for comparable securities along with other assumptions relating to credit quality, collateral value, complexity of the security structure, general market conditions, and liquidity. This category may include securities where trading has been halted or there are certain restrictions on trading. While these securities are priced using unobservable inputs, the valuation of these securities reflects the best available data and management believes the prices are a reasonable representation of exit price.
Valuation levels are not necessarily an indication of the risk associated with investing in such securities. Individual securities within any of the above-mentioned asset classes may be assigned a different hierarchical level than those presented above, as individual circumstances dictate.
For purposes of reporting transfers between different hierarchy levels, both transfers in and out of each level, as applicable, are shown as if they occurred at the beginning of the period. For the period ended June 30, 2011, all investments in the CHET Advisor Plan were valued as Level 1 securities.
c) Security Transactions and Investment Income – Security transactions are recorded as of the trade date (the date the order to buy or sell is executed) for financial reporting purposes. Realized gains and losses are determined on the basis of identified cost. Income and realized and unrealized capital gains and losses of each class are allocated daily based on the relative net assets of each class of units of the Portfolio. Income and capital gain distributions from Underlying Funds are recorded on the ex-dividend date.
d) Units – Contributions by a participant are evidenced through the issuance of units in the particular portfolio according to the investment elections made by the participant. Contributions and withdrawals are subject to terms and limitations defined in the participation agreement between the participant and the CHET Advisor Plan. Contributions are invested in units of the assigned portfolio on the same day as the credit of the contribution to the participant’s account. Withdrawals are based on the unit value calculated for such portfolio on the day that the withdrawal request is accepted. The earnings portion of non-qualified withdrawals, in addition to applicable federal and state income tax, may be subject to a 10% non-qualified withdrawal penalty to be withheld from the amount withdrawn.
- 17 -
e) Cash – Certain portfolios have cash as shown on the Statement of Assets and Liabilities. The cash is due to unsettled trades of ETFs.
f) Receivables – Receivables for investment securities sold and receivable from the sale of units to account owners of the CHET Advisor Plan at the balance sheet date represent the contributions of the participant and the sales of the portfolio that have not settled as of the reporting date, respectively.
g) Payables – Payables for investment securities purchased and payables from units redeemed from account owners of the CHET Advisor Plan at the balance sheet date represent the redemptions of the participant and the purchases of the portfolio that have not settled as of the reporting date, respectively.
Note 3 – Principal Risks
Market Risks – A portfolio is exposed to the risks of the Underlying Funds in direct proportion to the amount of assets the portfolio allocates to each Underlying Fund. The market values of Underlying Funds may decline due to general market conditions, which are not specifically related to a particular company, such as real or perceived adverse economic conditions, changes in the general outlook for corporate earnings, changes in interest or currency rates, or adverse investor sentiment generally. The market value of equity securities may also decline due to factors, which affect a particular industry or industries, such as labor shortages or increased production costs and competitive conditions within an industry.
Note 4 – Federal and State Income Taxes
No provision for federal income tax has been made. The program is designed to constitute a qualified tuition program under Section 529 of the Internal Revenue Code and does not expect to have any unrelated business income subject to tax.
Note 5 – Expenses Allocable expenses incurred by the CHET Advisor Plan are allocated to each portfolio and allocated to classes within the portfolio in proportion to the average daily net assets of the portfolio and each class, except where otherwise noted.
a) Plan Manager Fee – Hartford Life manages the CHET Advisor Plan under the direction of the Trustee, pursuant to a management agreement it has entered into with the Trustee. A fee of 0.30%, is charged to pay Hartford Life to perform many aspects of offering and administrating the CHET Advisor Plan. This fee is accrued and deducted daily as a percentage of average daily net assets in the portfolios and paid monthly. In addition, Hartford Life is paid investment management fees from the Hartford underlying funds.
- 18 -
CONNECTICUT HIGHER EDUCATION TRUST PROGRAM ADVISOR PLAN
NOTES TO FINANCIAL STATEMENTS (CONTINUED) AS OF JUNE 30, 2011, AND FOR THE PERIOD FROM SEPTEMBER 30, 2010 TO JUNE 30, 2011
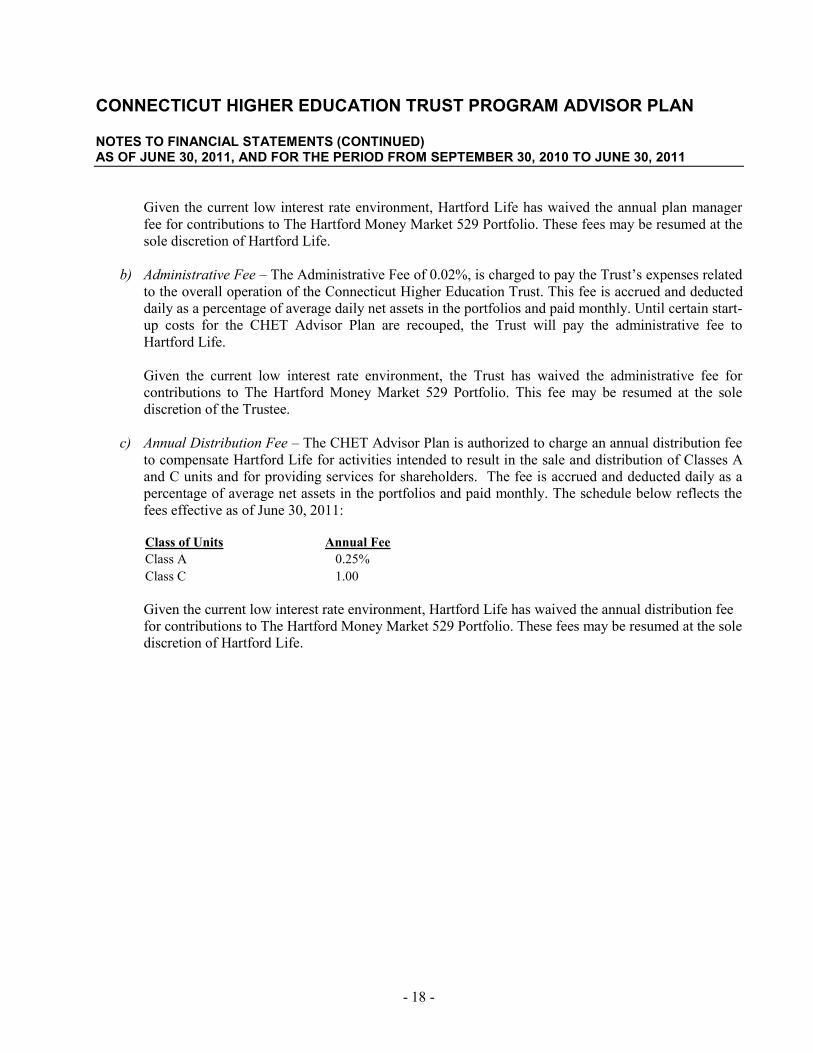
Given the current low interest rate environment, Hartford Life has waived the annual plan manager fee for contributions to The Hartford Money Market 529 Portfolio. These fees may be resumed at the sole discretion of Hartford Life.
b) Administrative Fee – The Administrative Fee of 0.02%, is charged to pay the Trust’s expenses related to the overall operation of the Connecticut Higher Education Trust. This fee is accrued and deducted daily as a percentage of average daily net assets in the portfolios and paid monthly. Until certain start-up costs for the CHET Advisor Plan are recouped, the Trust will pay the administrative fee to Hartford Life. Given the current low interest rate environment, the Trust has waived the administrative fee for contributions to The Hartford Money Market 529 Portfolio. This fee may be resumed at the sole discretion of the Trustee.
c) Annual Distribution Fee – The CHET Advisor Plan is authorized to charge an annual distribution fee to compensate Hartford Life for activities intended to result in the sale and distribution of Classes A and C units and for providing services for shareholders. The fee is accrued and deducted daily as a percentage of average net assets in the portfolios and paid monthly. The schedule below reflects the fees effective as of June 30, 2011:
Class of Units Annual Fee Class A 0.25% Class C 1.00 Given the current low interest rate environment, Hartford Life has waived the annual distribution fee for contributions to The Hartford Money Market 529 Portfolio. These fees may be resumed at the sole discretion of Hartford Life.
- 19 -
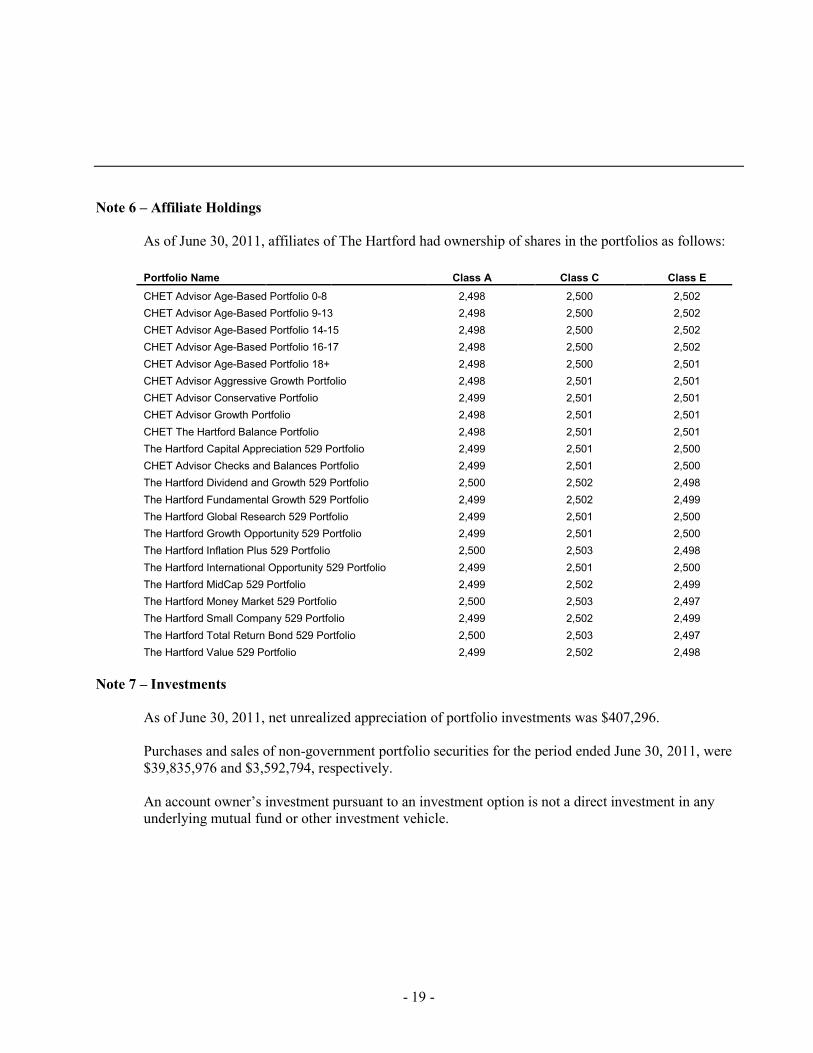
Note 6 – Affiliate Holdings As of June 30, 2011, affiliates of The Hartford had ownership of shares in the portfolios as follows: Portfolio Name Class A Class C Class E CHET Advisor Age-Based Portfolio 0-8 2,498 2,500 2,502 CHET Advisor Age-Based Portfolio 9-13 2,498 2,500 2,502 CHET Advisor Age-Based Portfolio 14-15 2,498 2,500 2,502 CHET Advisor Age-Based Portfolio 16-17 2,498 2,500 2,502 CHET Advisor Age-Based Portfolio 18+ 2,498 2,500 2,501 CHET Advisor Aggressive Growth Portfolio 2,498 2,501 2,501 CHET Advisor Conservative Portfolio 2,499 2,501 2,501 CHET Advisor Growth Portfolio 2,498 2,501 2,501 CHET The Hartford Balance Portfolio 2,498 2,501 2,501 The Hartford Capital Appreciation 529 Portfolio 2,499 2,501 2,500 CHET Advisor Checks and Balances Portfolio 2,499 2,501 2,500 The Hartford Dividend and Growth 529 Portfolio 2,500 2,502 2,498 The Hartford Fundamental Growth 529 Portfolio 2,499 2,502 2,499 The Hartford Global Research 529 Portfolio 2,499 2,501 2,500 The Hartford Growth Opportunity 529 Portfolio 2,499 2,501 2,500 The Hartford Inflation Plus 529 Portfolio 2,500 2,503 2,498 The Hartford International Opportunity 529 Portfolio 2,499 2,501 2,500 The Hartford MidCap 529 Portfolio 2,499 2,502 2,499 The Hartford Money Market 529 Portfolio 2,500 2,503 2,497 The Hartford Small Company 529 Portfolio 2,499 2,502 2,499 The Hartford Total Return Bond 529 Portfolio 2,500 2,503 2,497 The Hartford Value 529 Portfolio 2,499 2,502 2,498
Note 7 – Investments
As of June 30, 2011, net unrealized appreciation of portfolio investments was $407,296.
Purchases and sales of non-government portfolio securities for the period ended June 30, 2011, were $39,835,976 and $3,592,794, respectively. An account owner’s investment pursuant to an investment option is not a direct investment in any underlying mutual fund or other investment vehicle.
- 20 -
CONNECTICUT HIGHER EDUCATION TRUST PROGRAM ADVISOR PLAN
NOTES TO FINANCIAL STATEMENTS (CONTINUED) AS OF JUNE 30, 2011, AND FOR THE PERIOD FROM SEPTEMBER 30, 2010 TO JUNE 30, 2011
As of June 30, 2011, the Program’s investments consist of the following: Shares Cost Market Value
CHET Advisor Plan: Powershares Emerging Markets Sovereign Debt 11,407 303,872 309,017 SPDR Dow Jones International Real Estate ETF 11,245 440,857 454,073 SPDR Dow Jones REIT ETF 6,742 431,144 449,016 The Hartford Capital Appreciation Fund, Class Y 105,786 4,009,785 3,944,742 The Hartford Corporate Opportunities Fund, Class Y 71,988 716,424 715,556 The Hartford Dividend and Growth Fund, Class Y 189,329 3,759,751 3,818,774 The Hartford Equity Income Fund, Class Y 14,988 200,421 203,683 The Hartford Floating Rate Fund, Class Y 25,956 231,432 229,711 The Hartford Fundamental Growth Fund, Class Y 122,233 1,452,861 1,455,802 The Hartford Global Research Fund, Class Y 107,284 1,093,120 1,125,412 The Hartford Growth Opportunities Fund, Class Y 11,591 330,985 344,129 The Hartford Inflation Plus Fund, Class Y 252,059 2,914,213 2,956,652 The Hartford International Opportunities Fund, Class Y 140,962 2,218,762 2,262,432 The Hartford International Small Company Fund, Class Y 49,730 674,961 691,738 The Hartford MidCap Fund, Class Y 93,368 2,334,294 2,404,225 The Hartford MidCap Value Fund, Class Y 81,205 1,023,530 1,035,359 The Hartford Money Market Fund, Class Y 2,299,767 2,299,767 2,299,767 The Hartford Short Duration Fund, Class Y 141,398 1,394,576 1,394,181 The Hartford Small Company Fund, Class Y 25,183 543,699 597,844 The Hartford Small/Mid Cap Equity Fund, Class Y 72,067 793,383 815,798 The Hartford SmallCap Growth Fund, Class Y 10,884 369,784 392,369 The Hartford Strategic Income Fund, Class Y 30,060 276,287 276,256 The Hartford Total Return Bond Fund, Class Y 447,207 4,774,318 4,785,112 The Hartford Value Fund, Class Y 303,126 3,576,764 3,607,194 The Hartford Value Opportunities Fund, Class Y 18,073 254,632 258,076
$36,419,622 $36,826,918
Note 8 – Subsequent Events
As of the date of the report there were no subsequent events identified related to the CHET Advisor Plan which could have a material impact on the CHET Advisor Plan's financial statements.