Connecting Single Tree Growth Models to Forest Inventory Data for Forest Management, and Policy and Decision Making by Valerie LeMay 1 , Ian Moss 1 , and Hailemariam Temesgen 2 Statistical Issues in Forest Management Workshop, Quebec City, May 2-4, 2011 Affiliations: 1 Department of Forest Resources Management, University of British Columbia, Vancouver, BC, Canada; 2 College of Forestry, Oregon State University, Corvallis, OR, USA. Corresponding Author: [email protected]LeMay, Moss, Temesgen
Transcript
Connecting Single Tree Growth Models to Forest Inventory Data for
Forest Management, and Policy and Decision Making
by Valerie LeMay1, Ian Moss1, and Hailemariam Temesgen2
Statistical Issues in Forest Management Workshop, Quebec City, May 2-4, 2011
Affiliations: 1Department of Forest Resources Management, University of British Columbia, Vancouver, BC, Canada; 2College of Forestry, Oregon State University,
Forecasting Forest Inventory Under Management Scenarios
We need to forecast (i.e., grow) the forests under different management scenarios to assess policies, choose among management activities, etc.
Management scenarios: Cutting/regeneration of subsets of stands by species, tree location, and tree size (and other attributes) to achieve objectives
Complex stands: High variation in composition (species and tree size) and spatial locations, can be natural or created via management
LeMay, Moss, Temesgen 2
Why Connect Single Tree Models to Forest Inventory?
Complex Forests exist naturally: can be more than 300 trees species per ha
Changes in management regimes: “Continuous cover forestry”: retained trees
Complex spatial patterns for multiple objectives
Changes in information needs: Species and size information for market analysis
of timber supply
Specialty product information
Long-term carbon sequestration under different management regimes
LeMay, Moss, Temesgen 3
Single-tree growth models are needed to forecast
complex stands & for product information needs
The Process
Forest Inventory
Stand-Level Management
Tree-Level
Growth Model
Future Forest Connection?
4 LeMay, Moss, Temesgen
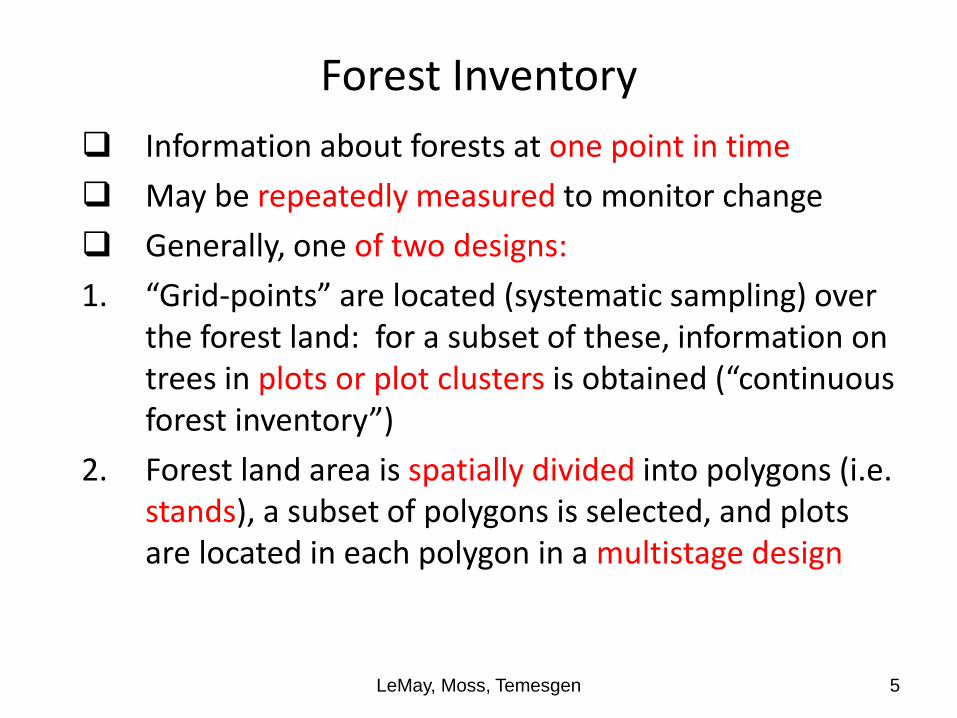
Forest Inventory
Information about forests at one point in time
May be repeatedly measured to monitor change
Generally, one of two designs:
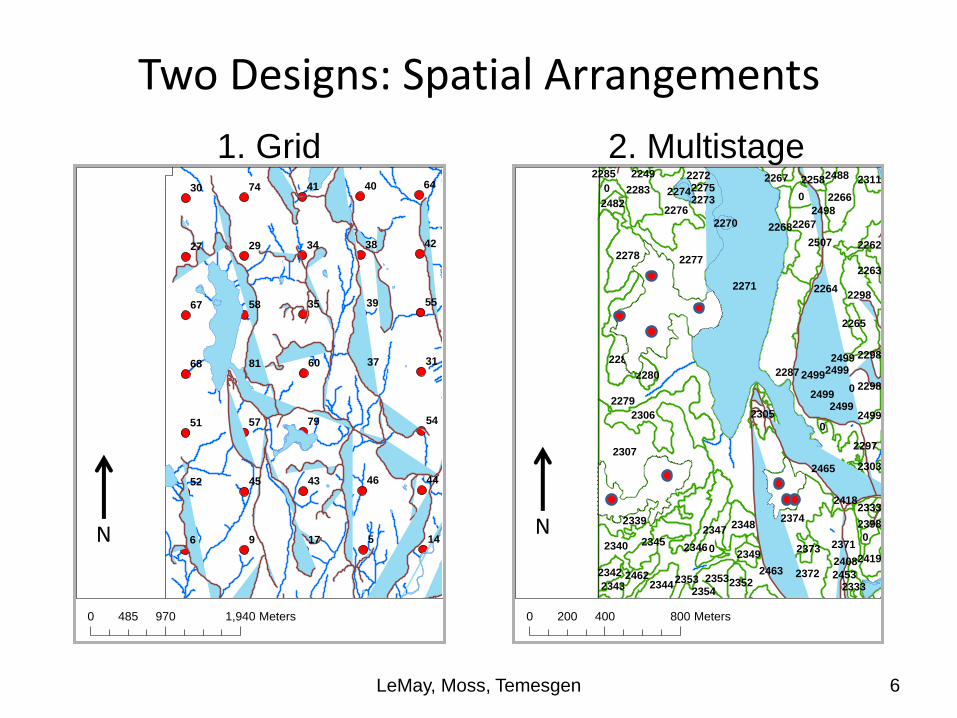
1. “Grid-points” are located (systematic sampling) over the forest land: for a subset of these, information on trees in plots or plot clusters is obtained (“continuous forest inventory”)
2. Forest land area is spatially divided into polygons (i.e. stands), a subset of polygons is selected, and plots are located in each polygon in a multistage design
LeMay, Moss, Temesgen 5
Two Designs: Spatial Arrangements
6 9 517 14
52
51
68
67
27
30 74
29
58
81
57
45 43
79
60
35
34
41 40
38
39
37
46 44
54
31
55
42
64
±
0 970 1,940485 Meters
2271
2279
0
2264
2287
2281
2307
2277
2308
2306
2371
2374
2276
2298
2465
2463
2283
2267
2340
0
2278
2372
22660
2304
23480
2344
02346
2297
2282
2419
2345
2268
23392347
2305
2353
2262
2272
2263
2273
24622352
2267
2342
2258
2343
2311
0
2349
2280
2482
2265
2354
2408
2333
2498
2373
2453
2274
2270
2488
2507
2333
2353
2275
2499
2499
2499
2249
2303
2298
2398
2499
2499
2418
2285
2499 2298
±
0 400 800200 Meters
LeMay, Moss, Temesgen 6
N
1. Grid 2. Multistage
N
Forest Inventory Using a Multistage Design Forest land is spatially divided into stands using remotely
sensed data
All stands have a list of attributes: species composition, structure (i.e., trees per ha, size diversity, age diversity), and site productivity
A multistage unequal probability sampling design is used (with model-based estimates at the tree-level):
Primary units are stands (unequal sized)
Secondary units are plots
All trees in plots are measured for DBH and species, and a subset may be measured for other variables (i.e, tertiary units, selected for height measurement)
Therefore, a sample of stands have ground-based measures of every tree in all plots
LeMay, Moss, Temesgen 7
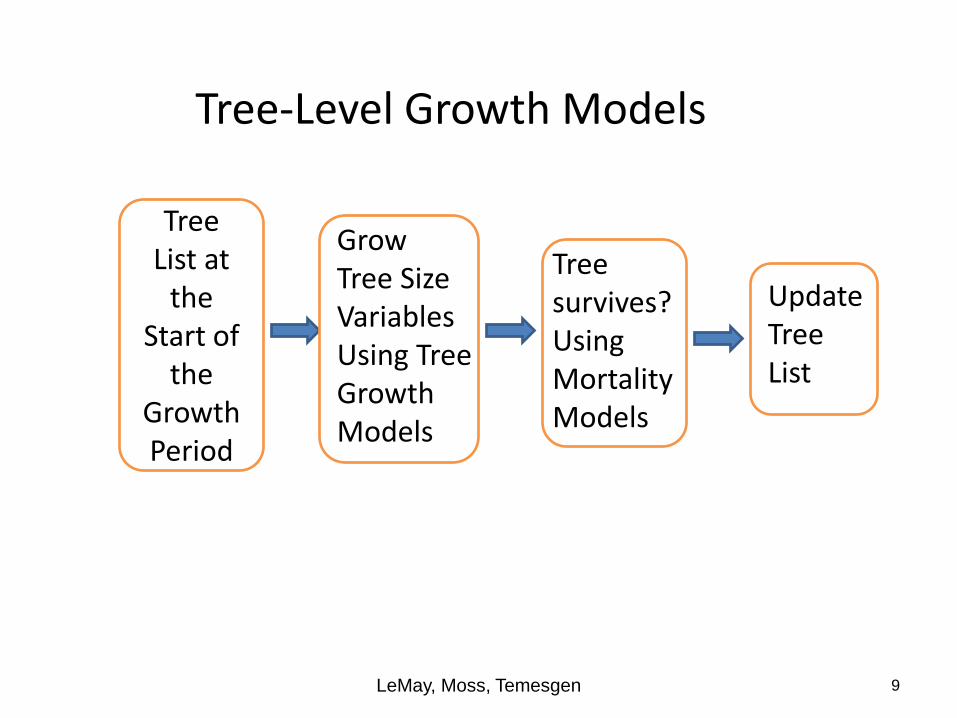
Tree-Level Growth Models
Begin with a list of trees (tree-list) for a plot or stand: species, diameter at 1.3 m above ground (DBH), height, and stems per ha each tree represents
Grow each tree by increasing the size variables (DBH and height) using a system of growth equations
Determine whether the tree will survive to the next period using probability of mortality models
Growth and mortality depends upon: i) the time-step; ii) site productivity and other stand and tree attributes; iii) any management activities (e.g., planting, cutting, pruning, thinning, fertilizing), and iv) natural disturbances (e.g., insect activities, etc.)
The tree-list is updated at the end of the growth period
LeMay, Moss, Temesgen 8
Tree-Level Growth Models
LeMay, Moss, Temesgen 9
Tree List at
the Start of
the Growth Period
Grow Tree Size Variables Using Tree Growth Models
Tree survives? Using Mortality Models
Update Tree List
Connecting Single Tree Growth Models to Forest Inventory
We need a tree-list to forecast growth
Not all stands are ground sampled (or not all “grid-points”)
We need to impute the tree-list (Y) for non-sampled stands (or for non-sampled grid-points) using available auxilliary information (X) from remotely sensed data
LeMay, Moss, Temesgen 10
Tree-Lists are Doubly-Multivariate
LeMay, Moss, Temesgen 11
Stand Plot Tree Species DBH Height Trees per ha
1 1 1 F 20.0 21 50
1 1 2 F 22.3 23.1 50
1 1 3 C 24.5 19.5 50
1 1 4 C 27.0 23.4 50
1 1 5 B 19.0 20.7 50
1 2 6 S 25.0 25.7 50
1 2 7 F 30.0 31.3 50
1 2 8 F 35.0 36 50
1 2 9 B 20.3 22 50
1 2 10 S 35.0 30.1 50
1 3 11 H 20.3 19.5 50
1 3 12 F 25.0 24.8 50
1 3 13 F 23.0 22.5 50
1 3 14 S 19.0 18.5 50
1 3 15 F 15.0 14 50
Tree-List: 2 plots each 0.01 ha
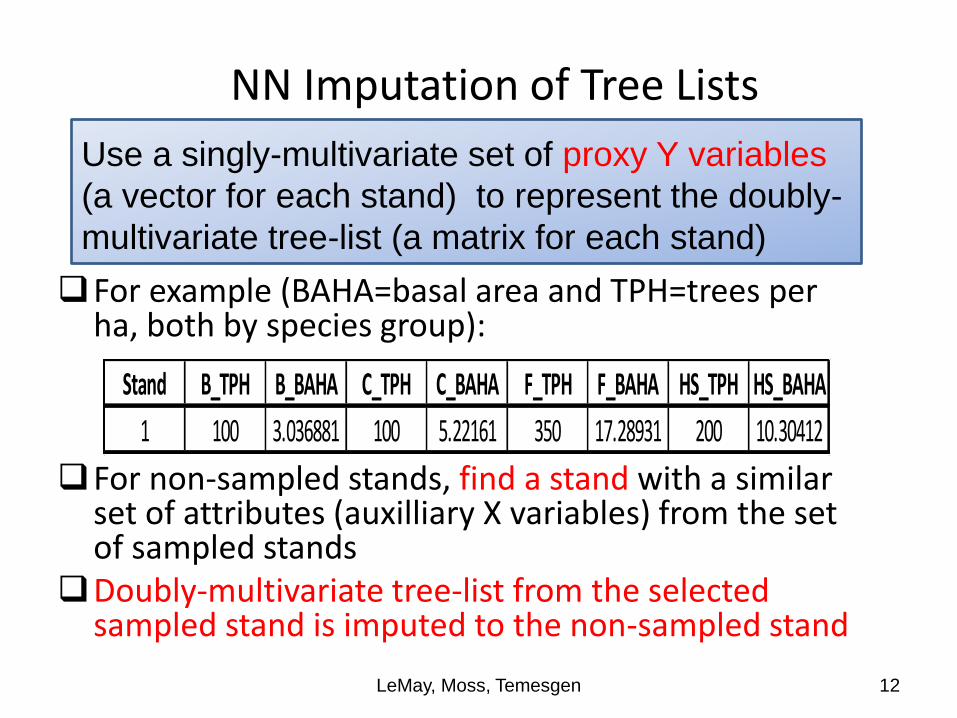
NN Imputation of Tree Lists
For example (BAHA=basal area and TPH=trees per ha, both by species group):
For non-sampled stands, find a stand with a similar set of attributes (auxilliary X variables) from the set of sampled stands
Doubly-multivariate tree-list from the selected sampled stand is imputed to the non-sampled stand
LeMay, Moss, Temesgen 12
Stand B_TPH B_BAHA C_TPH C_BAHA F_TPH F_BAHA HS_TPH HS_BAHA
Use a singly-multivariate set of proxy Y variables
(a vector for each stand) to represent the doubly-
multivariate tree-list (a matrix for each stand)
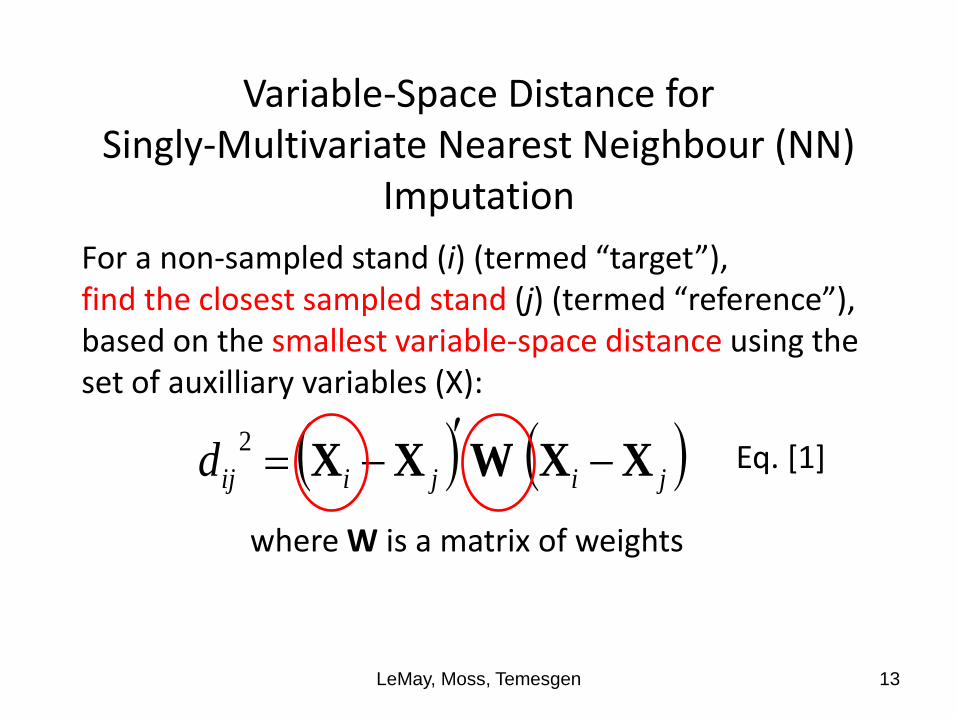
Variable-Space Distance for Singly-Multivariate Nearest Neighbour (NN)
Imputation
LeMay, Moss, Temesgen 13
jijiijd XXWXX
2
where W is a matrix of weights
For a non-sampled stand (i) (termed “target”), find the closest sampled stand (j) (termed “reference”), based on the smallest variable-space distance using the set of auxilliary variables (X):
– weights maximize the correlations between aX and bY (linear combinations, where a and b are matrices of weights);
– there are many linear combinations (the smaller of q Y-variables or p X-variables).
2. Redundancy Analysis: As with CCA, but the weights maximize variance explained (Y by aX and X by bY)
3. Correspondence Analysis: As with CCA, but there can be nonlinear relationships (e.g, Ohmann & Gregory).
LeMay, Moss, Temesgen 14
Options for W (continued)
3. Select weights to maximize (or minimize) the criterion used to assess imputation accuracy. (e.g., Tomppo & Halme for a single Y-variable)
4. Fit a system of equations using seemingly unrelated regressions to predict Y variables from X -- find bX that minimizes sum of squared error, where b is a vector --
system, and change the distance metric to:
LeMay, Moss, Temesgen 15
jijiijd YYYY
ˆˆ2
. variablesX auxilliary theand tscoefficien
equations of system fitted theusing estimated isˆ Where i Y
Eq. [2]
(e.g., Daigle, Rivest, et al. for single Y-variable)
What Auxilliary X Variables for Imputing Tree-Lists?
Need to be easily obtained using low-cost remotely sensed data or as map (GIS layers)
Must be available on every stand
Need to be related to the tree-list
LeMay, Moss, Temesgen 16
Remotely Sensed Data as Auxilliary Variables for Forest Inventory Imputation
Now: interpreted digital photographs and higher resolution satellite imagery (e.g., SPOT), ditigital terrain maps, ecological classification
Future?: Airborne Laser Scanning (ALS also called LiDAR) data is becoming less expensive
Often supplemented by map layers (GIS), such as elevation, Ecological Zones, etc.
LeMay, Moss, Temesgen 17
Choosing the Singly-Multivariate Proxy Y Variables
For very complex stands with many species and a wide variety of tree sizes, it is difficult to select a suitable set of a few proxy Y variables to obtain accurate imputed tree-lists for non-sampled stands
LeMay, Moss, Temesgen 18
Mostly Fir Mostly Pine
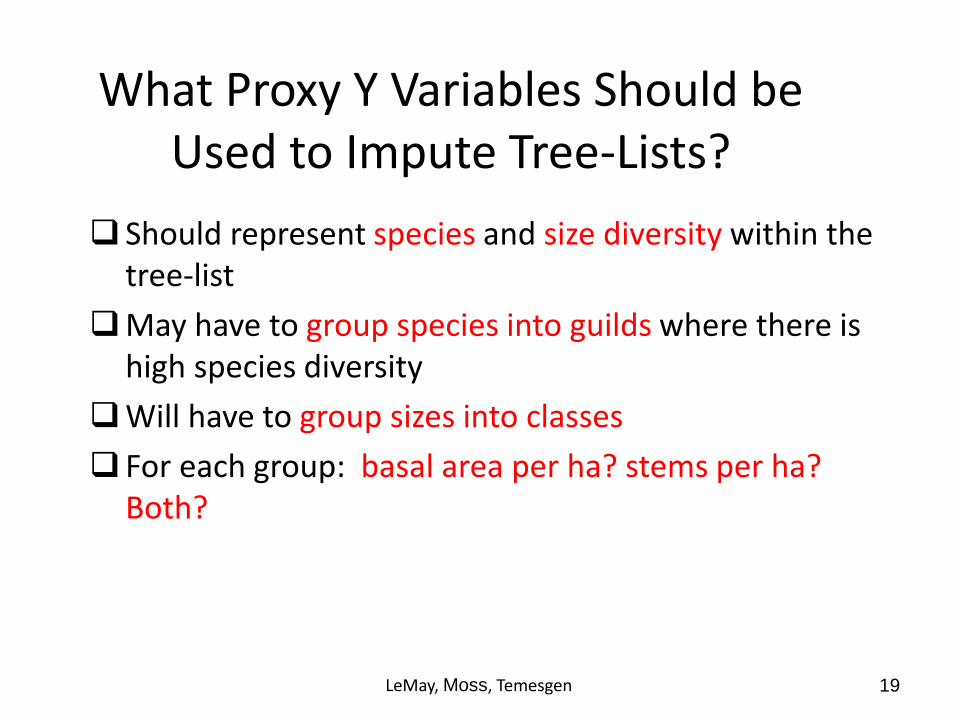
What Proxy Y Variables Should be Used to Impute Tree-Lists?
Should represent species and size diversity within the tree-list
May have to group species into guilds where there is high species diversity
Will have to group sizes into classes
For each group: basal area per ha? stems per ha? Both?
19 LeMay, Moss, Temesgen
Distance Measure for Tree-Lists
For tree-lists:
Have used Eq. [1] with CCA weights with a few proxy Y variables
Using Eq. [2] using predicted proxy Y variables would allow for a larger number of proxy Y variables better representing a tree-list in complex stands
20 LeMay, Moss, Temesgen
Eq. 2 Will lead to better imputations of tree-lists?
Criteria to Assess Tree-List Imputation Accuracy in Simulation Tests
Commonly used criteria for imputation accuracy:
1. Bias -- average differences between actual and imputed
2. Root mean squared error
3. Variance estimates for single Y variables
LeMay, Moss, Temesgen 21
Not very useful for doubly-multivariate tree-lists?
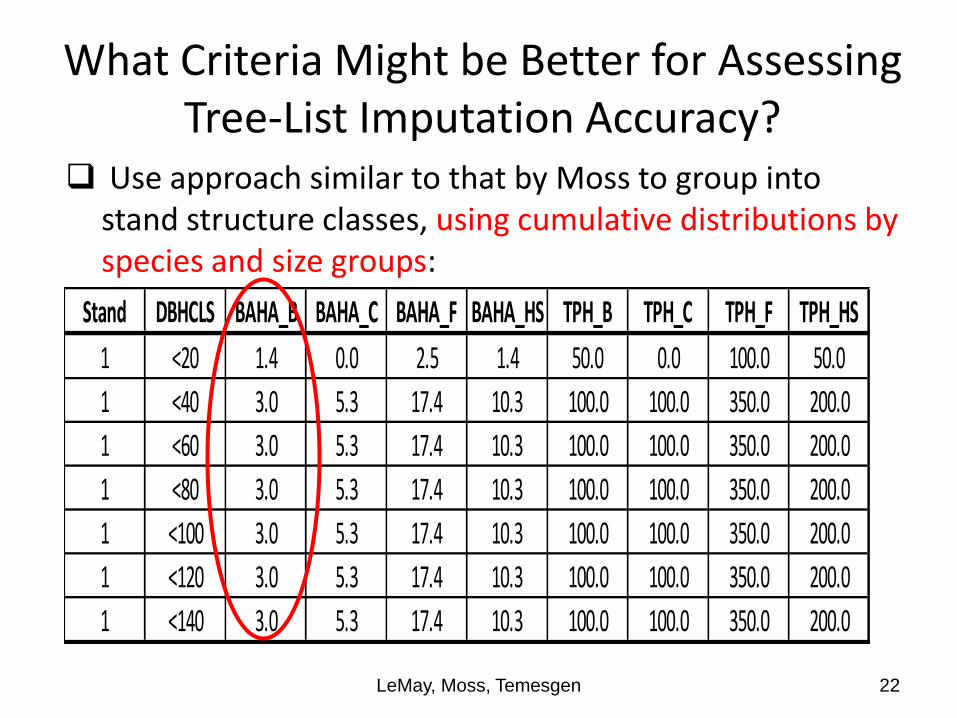
What Criteria Might be Better for Assessing Tree-List Imputation Accuracy?
Use approach similar to that by Moss to group into stand structure classes, using cumulative distributions by species and size groups:
LeMay, Moss, Temesgen 22
Stand DBHCLS BAHA_B BAHA_C BAHA_F BAHA_HS TPH_B TPH_C TPH_F TPH_HS
1 <20 1.4 0.0 2.5 1.4 50.0 0.0 100.0 50.0
1 <40 3.0 5.3 17.4 10.3 100.0 100.0 350.0 200.0
1 <60 3.0 5.3 17.4 10.3 100.0 100.0 350.0 200.0
1 <80 3.0 5.3 17.4 10.3 100.0 100.0 350.0 200.0
1 <100 3.0 5.3 17.4 10.3 100.0 100.0 350.0 200.0
1 <120 3.0 5.3 17.4 10.3 100.0 100.0 350.0 200.0
1 <140 3.0 5.3 17.4 10.3 100.0 100.0 350.0 200.0
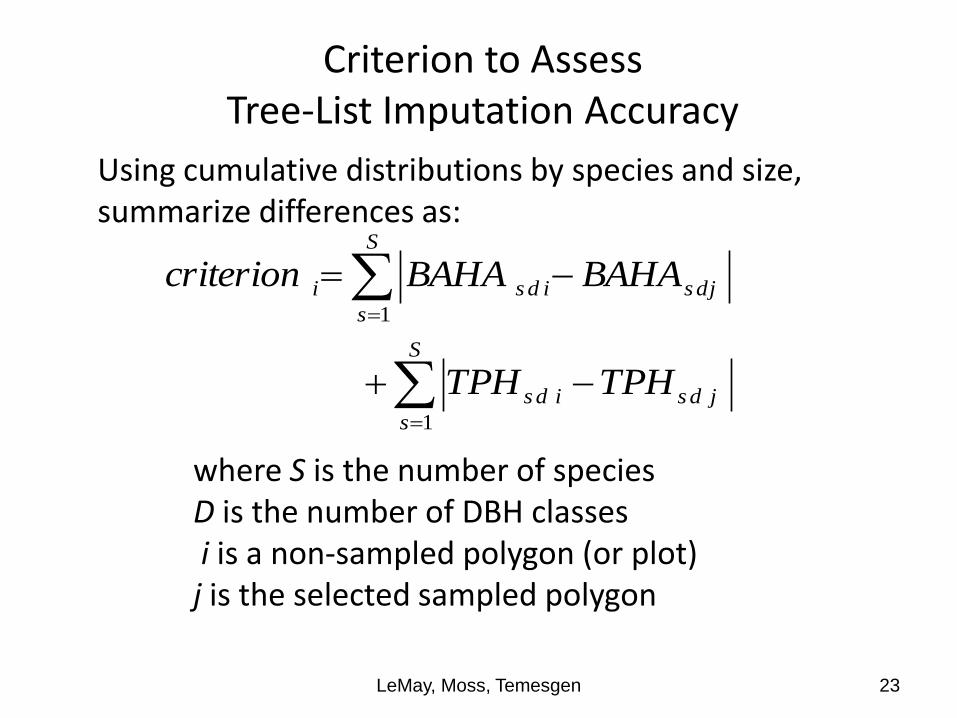
Criterion to Assess Tree-List Imputation Accuracy
LeMay, Moss, Temesgen 23
S
s
jdsids
S
s
djsidsi
TPHTPH
BAHABAHAcriterion
1
1
where S is the number of species D is the number of DBH classes i is a non-sampled polygon (or plot) j is the selected sampled polygon
Using cumulative distributions by species and size, summarize differences as:
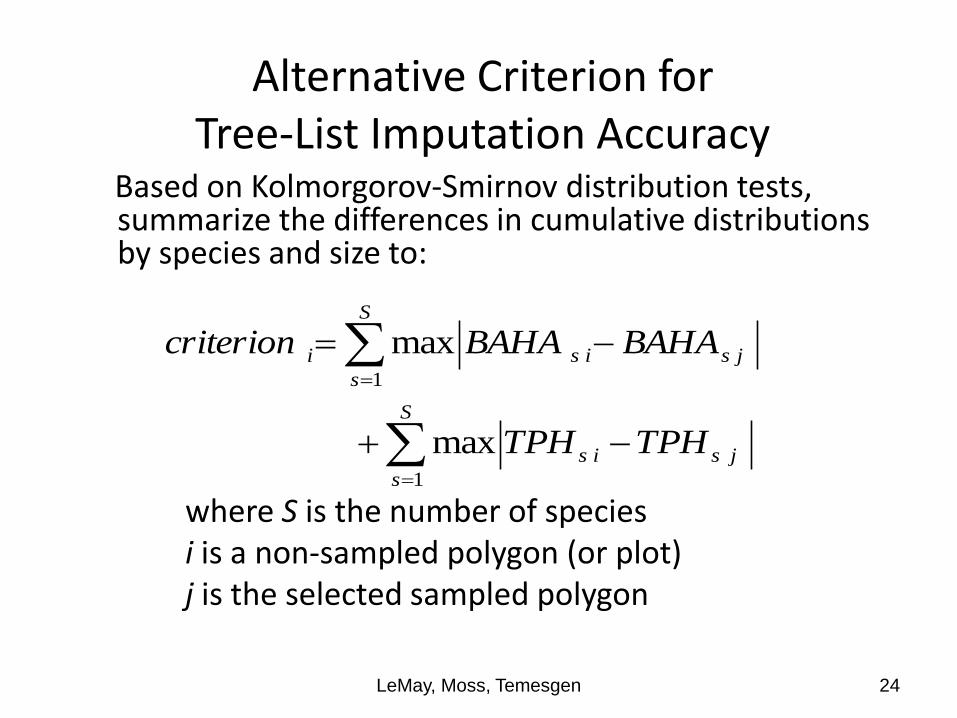
Alternative Criterion for Tree-List Imputation Accuracy
Based on Kolmorgorov-Smirnov distribution tests, summarize the differences in cumulative distributions by species and size to:
LeMay, Moss, Temesgen 24
S
s
jsis
S
s
jsisi
TPHTPH
BAHABAHAcriterion
1
1
max
max
where S is the number of species i is a non-sampled polygon (or plot) j is the selected sampled polygon
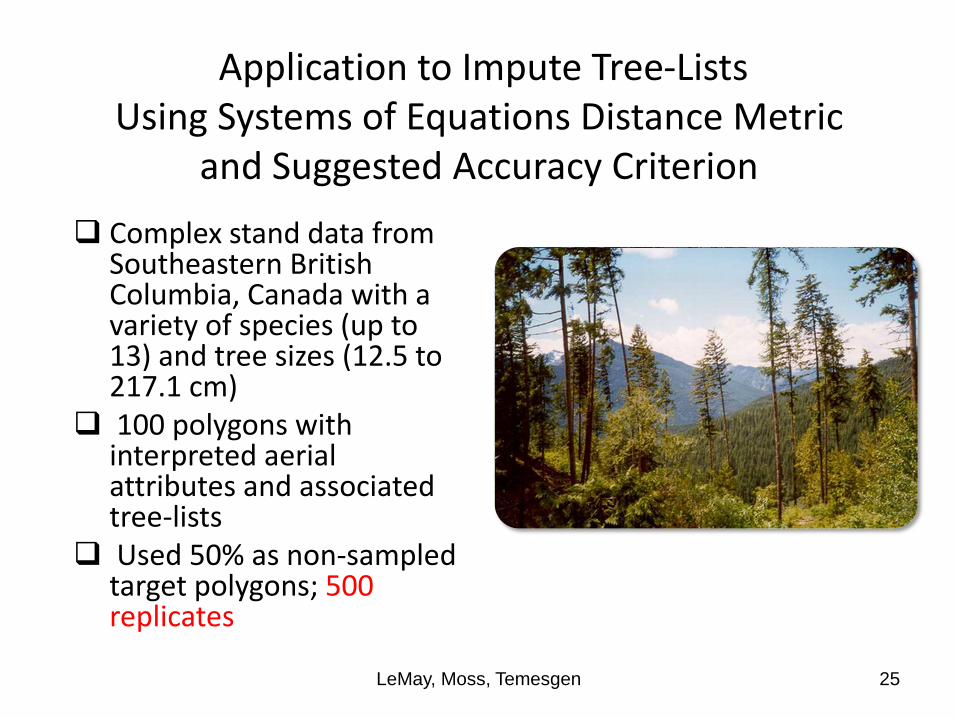
Application to Impute Tree-Lists Using Systems of Equations Distance Metric
and Suggested Accuracy Criterion
Complex stand data from Southeastern British Columbia, Canada with a variety of species (up to 13) and tree sizes (12.5 to 217.1 cm)
100 polygons with interpreted aerial attributes and associated tree-lists
Used 50% as non-sampled target polygons; 500 replicates
LeMay, Moss, Temesgen 25
Application to Impute Tree-Lists: Two Approaches
26 LeMay, Moss, Temesgen
CCA-Eq. 1 (MSN): CCA for weights using a limited set of proxy Y variables to represent the tree-list and Eq. 1
Y-Predict-Eq. 2: System of equations to estimate proxy Y variables and Eq. 2 (new method)
Both using: BAHA and TPH for each of 8 species or species groups
= 16 proxy Y variables Site index, average height, crown closure %, and %
species composition (5 species) = 8 X variables
Application to Impute Tree-Lists: Comparison of Two Approaches
27 LeMay, Moss, Temesgen
Frequency of “matched” stands for each “target” stand (i.e., commonly the same match?)
Summary of correlations between estimated and actual proxy Y-variables for target stands over all 500 replications
Accuracy of tree-lists, using both accuracy criteria
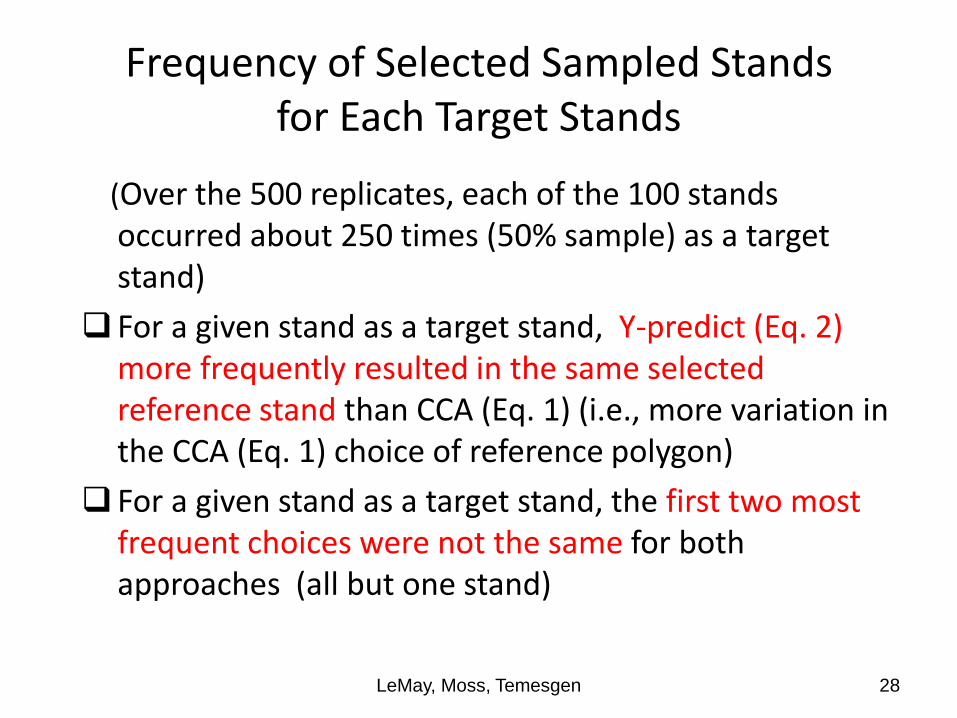
Frequency of Selected Sampled Stands for Each Target Stands
(Over the 500 replicates, each of the 100 stands occurred about 250 times (50% sample) as a target stand)
For a given stand as a target stand, Y-predict (Eq. 2) more frequently resulted in the same selected reference stand than CCA (Eq. 1) (i.e., more variation in the CCA (Eq. 1) choice of reference polygon)
For a given stand as a target stand, the first two most frequent choices were not the same for both approaches (all but one stand)
LeMay, Moss, Temesgen 28
Accuracy of Proxy Y Variables: Means of Correlations
LeMay, Moss, Temesgen 29
CCA (Eq 1) Y-predict (Eq. 2)
Basal area per ha
hardwoods 0.31 0.27
true firs 0.48 0.77
cedar 0.09 0.43
Douglas fir 0.43 0.49
hemlock 0.03 0.73
larches -0.06 0.22
pines 0.00 0.63
spruces -0.05 0.52
Trees per ha
hardwoods 0.31 0.23
true firs 0.52 0.80
cedar 0.13 0.50
Douglas fir 0.32 0.62
hemlock 0.08 0.51
larches -0.03 0.26
pines 0.06 0.79
spruces 0.03 0.45
Accuracy of Tree-Lists Using Cumulative Distributions
Two criteria using cumulative distributions for each target as noted: 1) sums over all DBH classes and species; or 2) maximum difference by DBH class, summed over all species.
Calculated these two criteria for each target stand against the most commonly selected match
Calculated the difference between CCA (Eq. 1) and Y-predict (Eq. 2) methods for each criterion and target stand: positive difference means CCA (Eq. 1) gives poorer results
Summarized the differences over all 100 target polygons using percentiles
For both criteria: 90% of stands had positive differences indicating that CCA (Eq. 1) gave poorer results
LeMay, Moss, Temesgen 30
Conclusions
Forest management regimes are changing along with demands for new products
Tree-level growth model provide the mechanism needed to forecast future forests
Tree-lists are needed, and these must be imputed as they are not available for each stand
Tree-lists are doubly-multivariate, making imputation difficult: proxy Y variables are used
To better represent tree lists, a large number of proxy variables are needed
LeMay, Moss, Temesgen 31
Conclusions
In the “y-predict” distance measure, Y proxy variables are predicted using a system of equations to take advance of cross-equation correlations
This method is: 1) easier to conduct, since the system of equations can be fitted separately, easier to understand, and 2) more flexible, in that a mixture of linear and nonlinear equations can be used in the system of equations along with different sets of X auxilliary variables
These advantages are particularly useful for tree lists where a large number of Y proxy variables is needed
LeMay, Moss, Temesgen 32
Conclusions
Proposed accuracy criteria based on cumulative distributions of basal area per ha and stems per ha by DBH for each species or species group should better reflect the tree-list accuracy
In the application, the y-predict distance measure clearly gave better results, including using the proposed accuracy criteria
LeMay, Moss, Temesgen 33
Acknowledgements
We would like to thank the conference organizers and sponsors for this workshop, and the government of British Columbia for the tree-list data and for funding to conduct research on tree-lists in the past.