Connecting the dots: navigating pollution, health, climate and fiscal solutions Grzegorz Peszko, Lead Economist. Environment and Natural Resources Global Practice. The World Bank WHO Global Conference Air Pollution and Health, Geneva, October 2018
Transcript
Connecting the dots: navigating pollution, health, climate and fiscal solutions
Grzegorz Peszko, Lead Economist. Environment and Natural Resources Global Practice. The World Bank WHO Global Conference Air Pollution and Health, Geneva, October 2018
The problem
Our understanding of global welfare cost of air pollution is improving… it is big
Study Domain Year I$ (PPP) US$ % of GDP Larsen (2014) AAP 2012 in 2012 prices 1.7 2.5% World Bank and IHME (2016) AAP 2013 in 2011 prices 3.6 3.5% OECD (2016) AAP 2015 in 2010 prices 3.4 6.0% Lancet Commission (2017) AAP & HAP 2015 in 2015 prices 3.8 5.1%* Larsen (2017) for the World Bank AAP 2015 in 2015 prices 5.5 3.3 4.5% World Bank 2018 AAP 2016 in 2016 prices 5.7 3.3 4.4%
$ trillion per year
Note: AAP=ambient air pollution. HAP=household air pollution from the use of solid fuels. I$= international dollars at purchasing power parity (PPP) exchange rates. US$= US dollars at market exchange rates. * Gross national income.
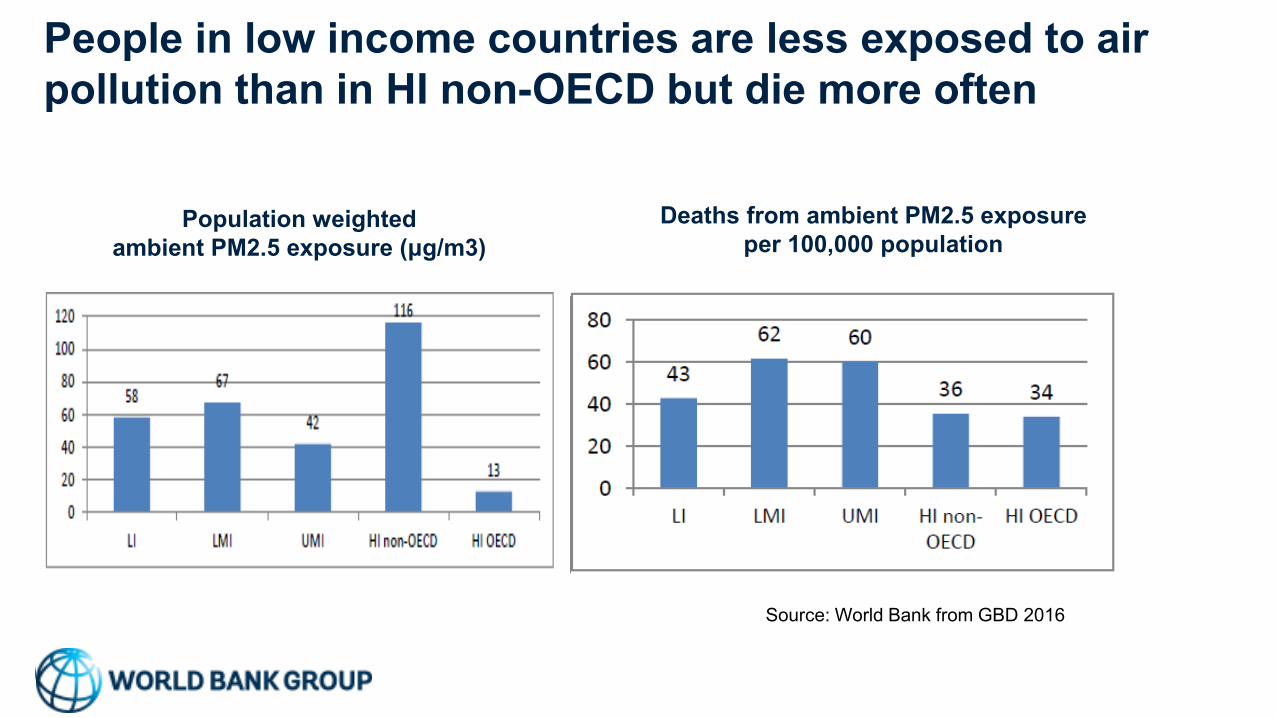
Population weighted ambient PM2.5 exposure (μg/m3)
Source: World Bank from GBD 2016
Deaths from ambient PM2.5 exposure per 100,000 population
People in low income countries are less exposed to air pollution than in HI non-OECD but die more often
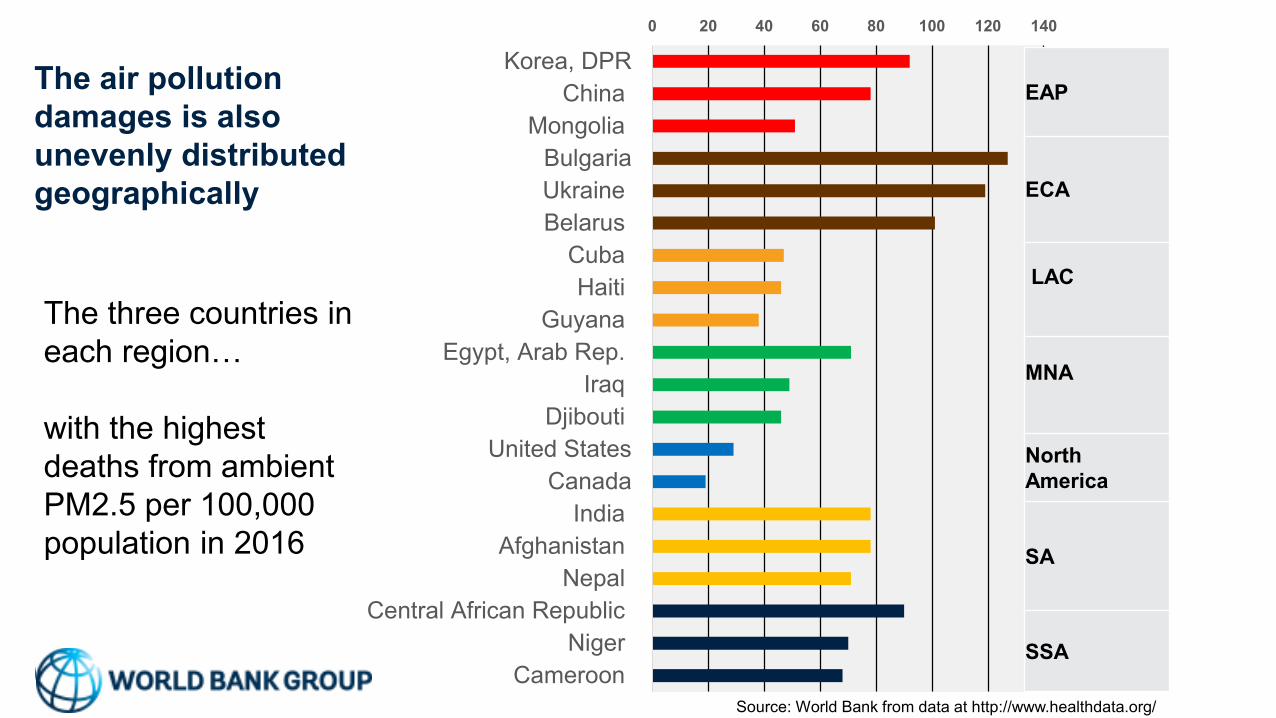
The air pollution damages is also unevenly distributed geographically
Source: World Bank from data at http://www.healthdata.org/
0 20 40 60 80 100 120 140
Korea, DPRChina
MongoliaBulgariaUkraineBelarus
CubaHaiti
GuyanaEgypt, Arab Rep.
IraqDjibouti
United StatesCanada
IndiaAfghanistan
NepalCentral African Republic
NigerCameroon
EAP
ECA
LAC
MNA
North America
SA
SSA
The three countries in each region… with the highest deaths from ambient PM2.5 per 100,000 population in 2016
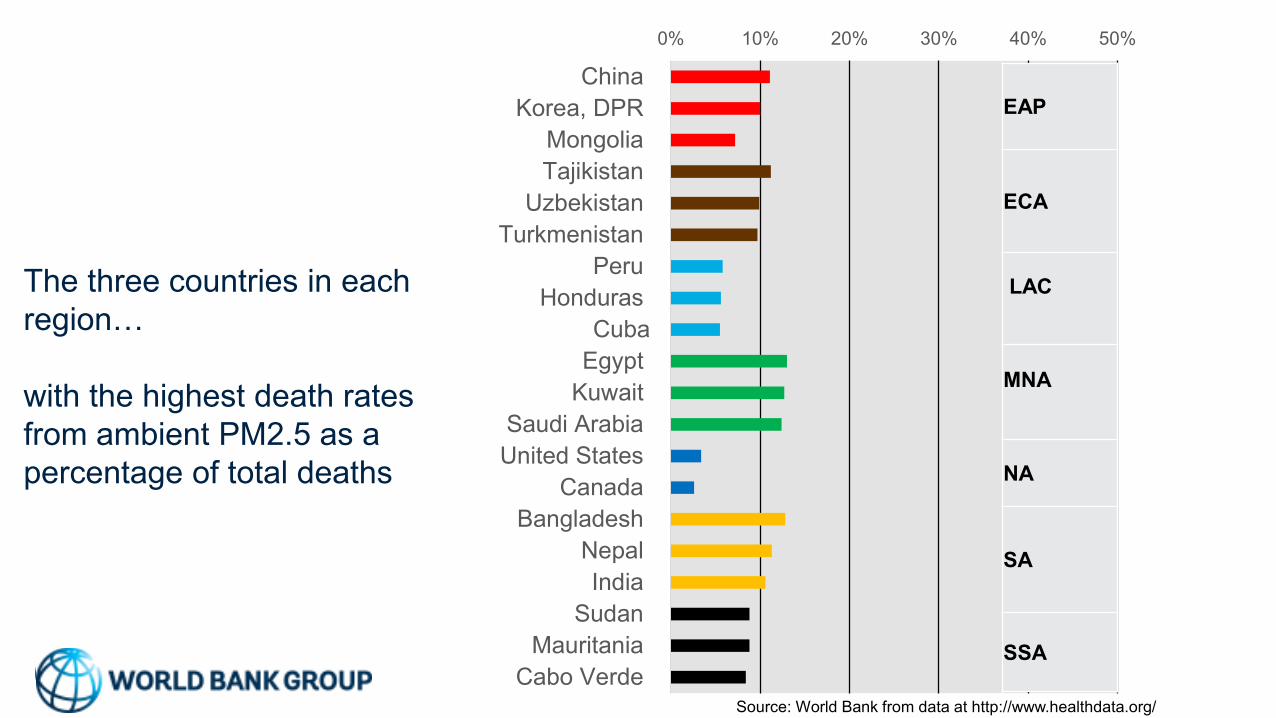
The three countries in each region… with the highest death rates from ambient PM2.5 as a percentage of total deaths
Source: World Bank from data at http://www.healthdata.org/
0% 10% 20% 30% 40% 50%
ChinaKorea, DPR
MongoliaTajikistan
UzbekistanTurkmenistan
PeruHonduras
CubaEgypt
KuwaitSaudi ArabiaUnited States
CanadaBangladesh
NepalIndia
SudanMauritania
Cabo Verde
EAP
ECA
LAC
MNA
NA
SA
SSA
The three countries in each region… with the highest welfare cost of ambient PM2.5 as a percentage of GDP
Source: World Bank from data at http://www.healthdata.org/
0% 10% 20% 30% 40% 50%
ChinaMongoliaMyanmarBulgariaUkraineHungary
CubaTrinidad and Tobago
BarbadosEgypt
IraqTunisia
United StatesCanada
IndiaPakistan
NepalCameroon
Central African RepublicChad
EAP
ECA
LAC
MNA
NA
SA
SSA
The solutions
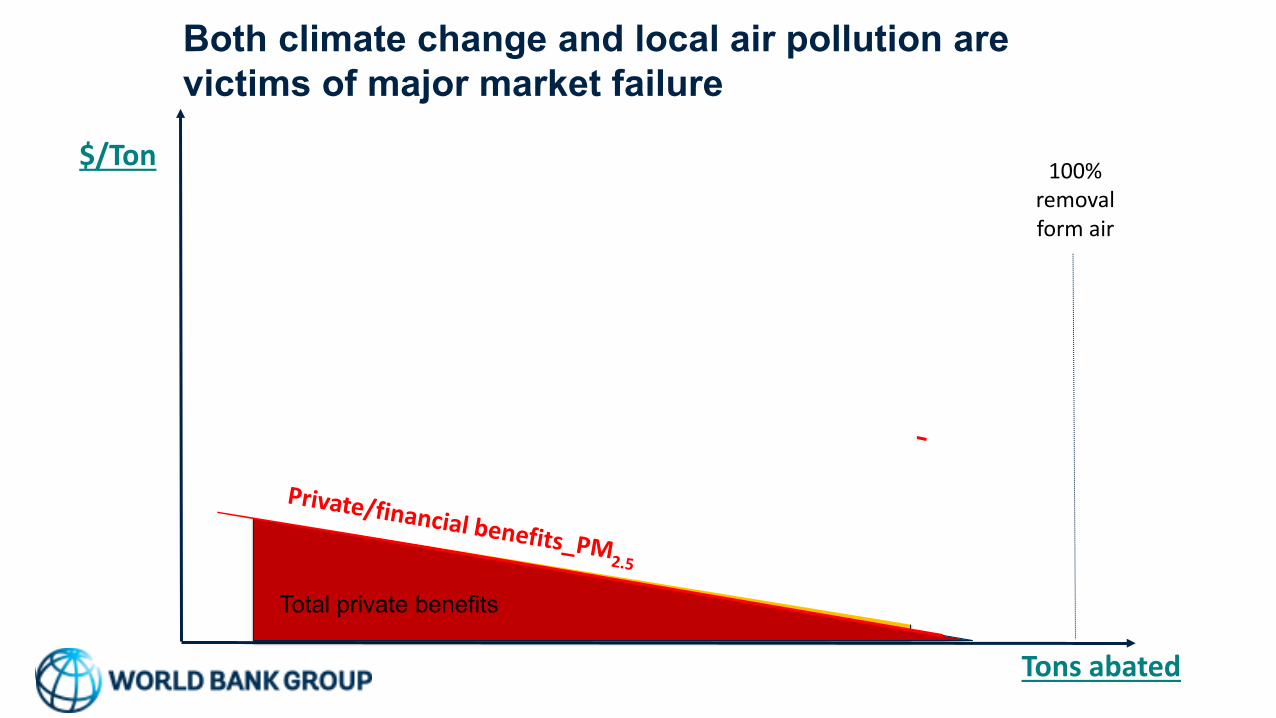
100% removal form air
Tons abated
$/Ton
Total private benefits
Total global external benefits (transboundary acid rain or CC)
Total local/national external benefits (air pollution)
Both climate change and local air pollution are victims of major market failure
100% removal form air
Tons abated
$/Ton
Total private benefits
Total global external benefits (transboundary acid rain or CC)
Total local/national external benefits (air pollution)
Both climate change and local air pollution are victims of major market failure
Solutions requires global and local collective action
Medium cost measures: effective for AP, not always for climate • Retrofitting existing
assets, installing end-of pipe technologies: FGDs, EPS, catalytic converters, etc.
High capital measures: high AP&CC synergy • Early retirement of old
fossil fuel dependent assets and replacement by new assets (e.g. EV, RES, heat pumps, electrification and gasification, new cookstoves, etc)
Systemic, structural and behavioral changes • New physical and
institutional infrastructure to support increasing returns to scale for non-fossil fuel energy and transport systems; penetration of new social norms and habits
Capital intensive, systemic changes will deliver both local and global benefits
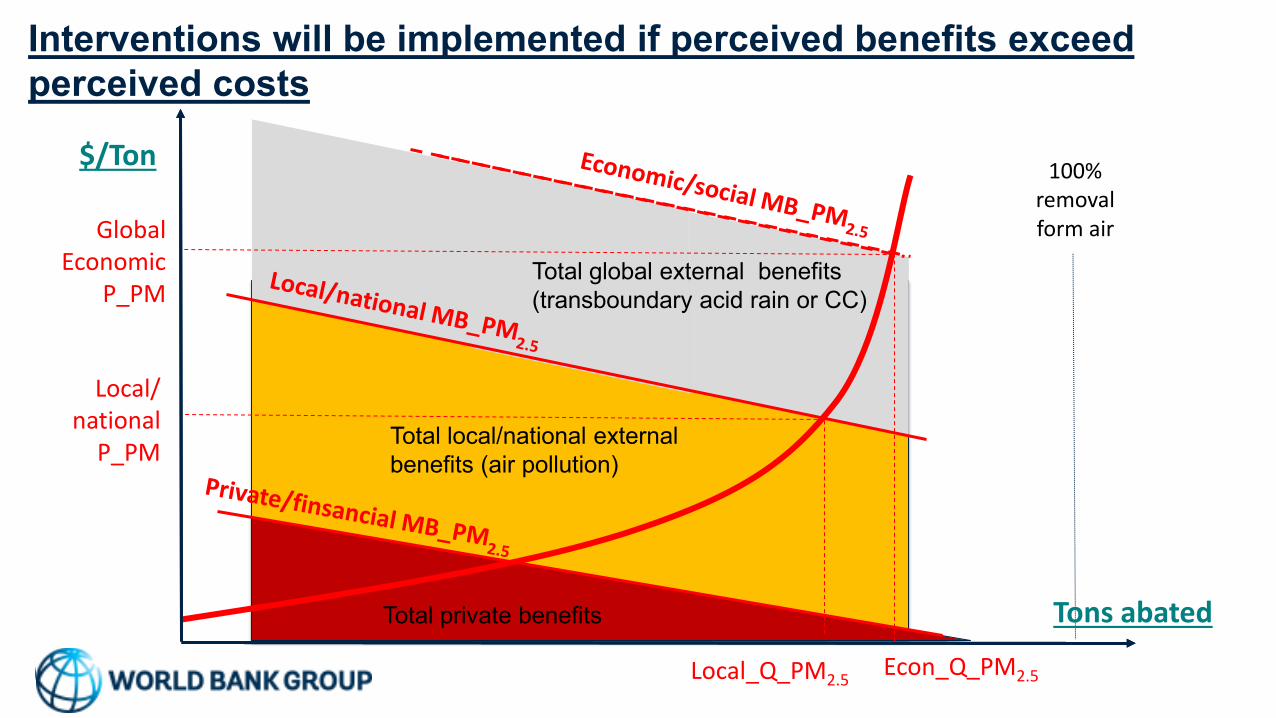
100% removal form air
Tons abated
$/Ton
Interventions will be implemented if perceived benefits exceed perceived costs
Econ_Q_PM2.5
Local/ national
P_PM
Global Economic
P_PM
Local_Q_PM2.5
100% removal form air
Total global external benefits (transboundary acid rain or CC)
Total local/national external benefits (air pollution)
Total private benefits
Marginal costs and benefits of abating different pollutants differ
MB_CO2
Q_CO2 Q_PM
P_CO2
P_PM
100% removal form air
Things get complicated with multiple pollutants…
MB_CO2
Q_CO2 Q_NOx Q_SO2 Q_PM
P_CO2
P_NOx
P_SO2
P_PM
100% removal form air
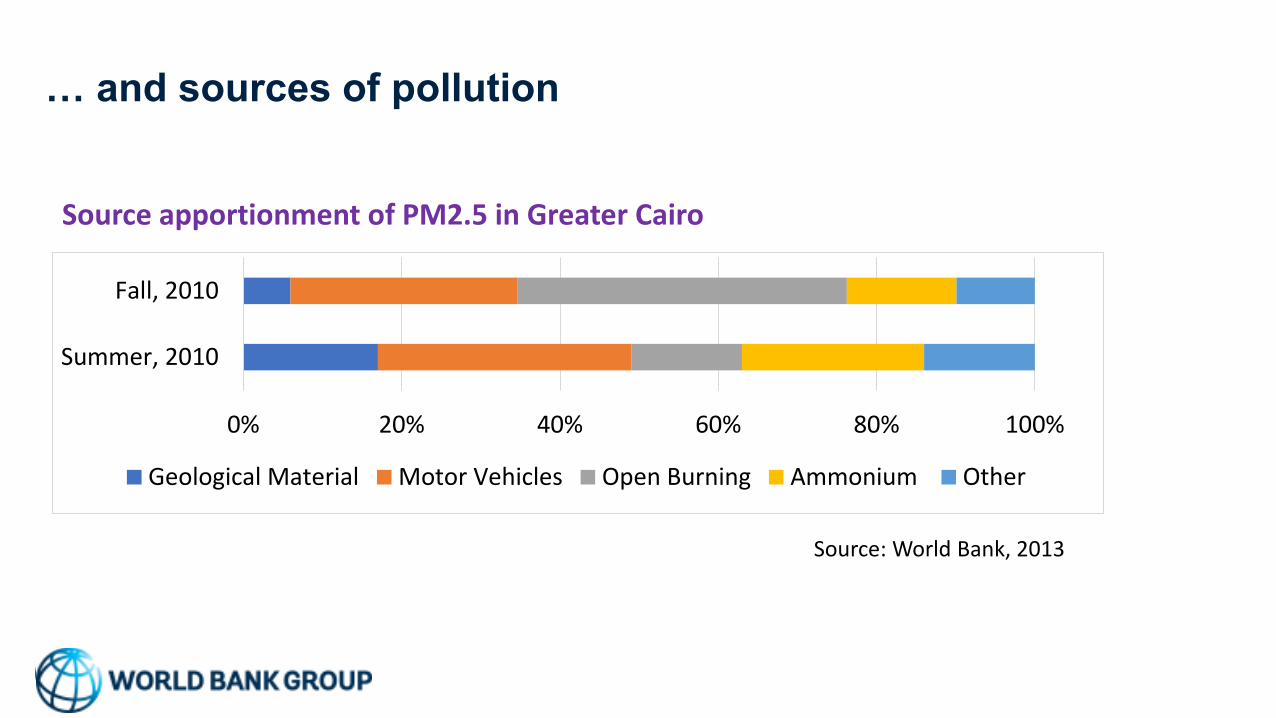
… and sources of pollution
0% 20% 40% 60% 80% 100%
Summer, 2010
Fall, 2010
Geological Material Motor Vehicles Open Burning Ammonium Other
Source apportionment of PM2.5 in Greater Cairo
Source: World Bank, 2013
But interventions needs to be prioritized (unless you have unlimited resources), e.g. by decreasing net benefits of reducing damages
. Source: Peru: World Bank Country Environmental Analysis.(2006)
B/C
ratio
0.00
0.50
1.00
1.50
2.00
2.50
3.00
3.50
4.00
4.50
0 50 100 150 200 250 300 350 400 450 500
Total value of benefits (CED reduction)
I&M program
Low sulfur diesel fuel
CNG
Industrial pollution control
Retrofit particulate
control
PERU: Benefit-Cost Analysis of Local Pollution Reduction Interventions for Lima-Callao
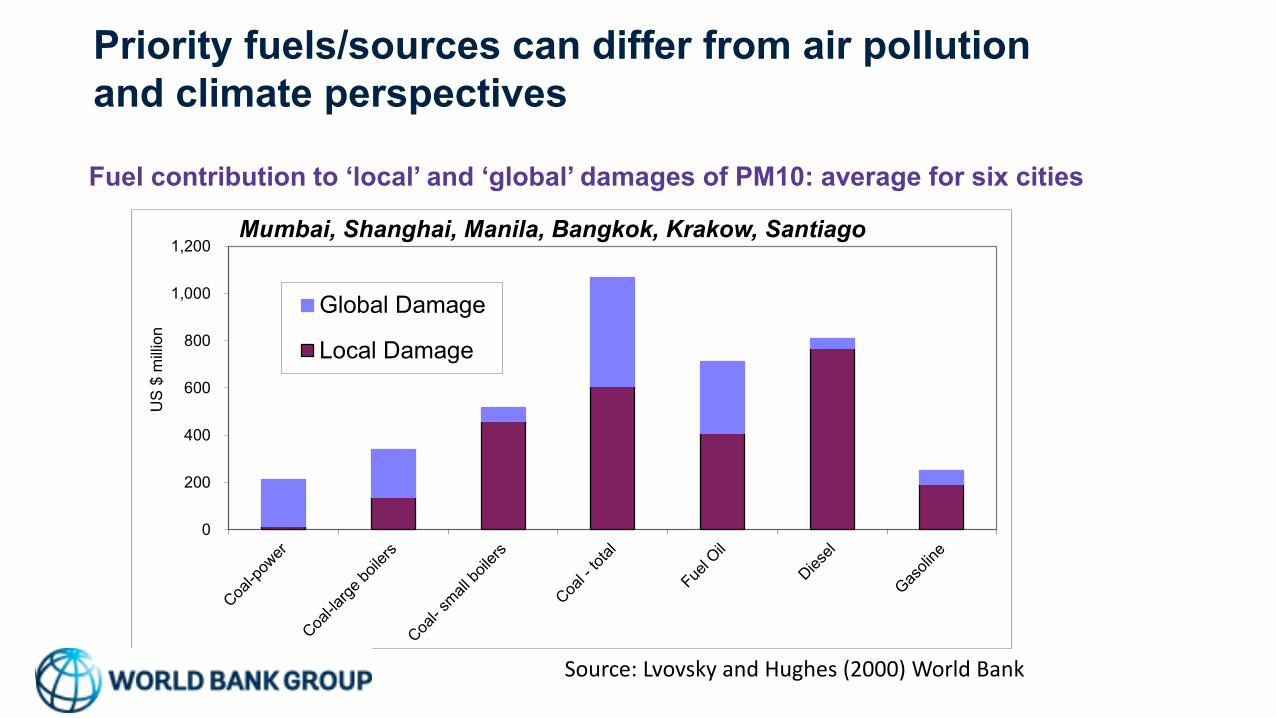
Priority fuels/sources can differ from air pollution and climate perspectives
Source: Lvovsky and Hughes (2000) World Bank
Fuel contribution to ‘local’ and ‘global’ damages of PM10: average for six cities
0
200
400
600
800
1,000
1,200
US
$ m
illion
Global Damage
Local Damage
Mumbai, Shanghai, Manila, Bangkok, Krakow, Santiago
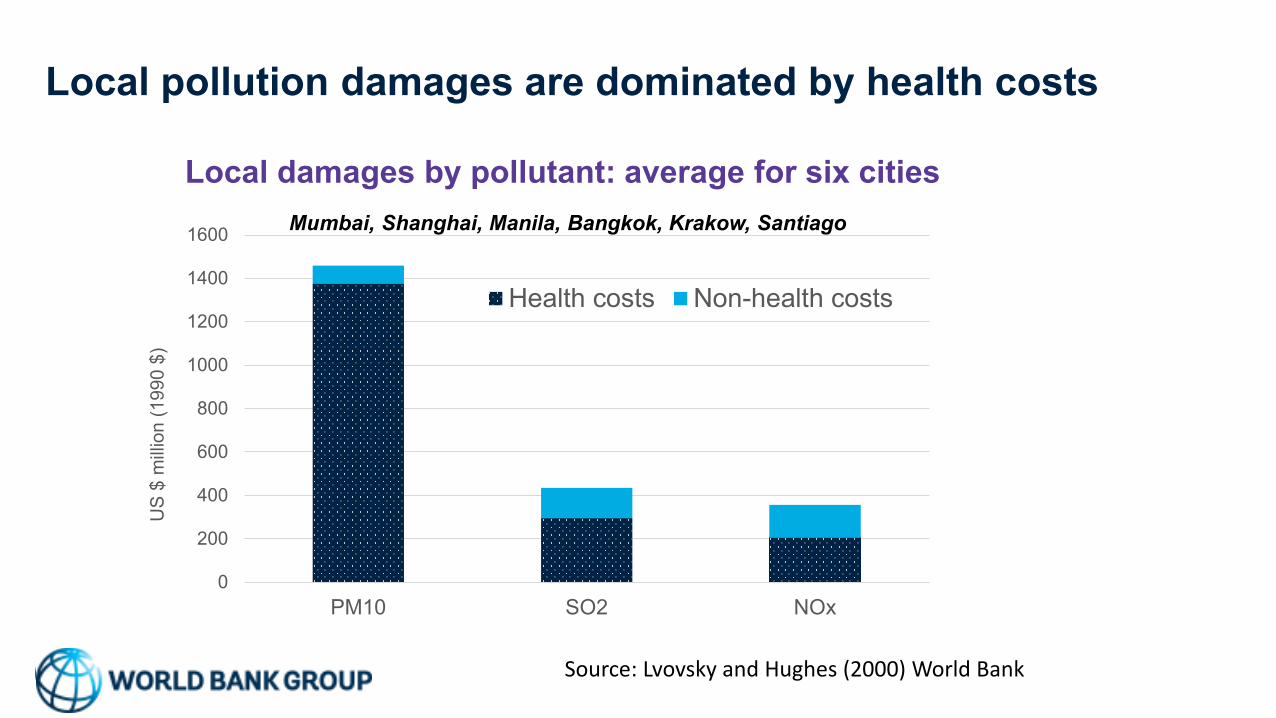
Local pollution damages are dominated by health costs
Source: Lvovsky and Hughes (2000) World Bank
Local damages by pollutant: average for six cities
0
200
400
600
800
1000
1200
1400
1600
PM10 SO2 NOx
US
$ m
illio
n (1
990
$)
Health costs Non-health costs
Mumbai, Shanghai, Manila, Bangkok, Krakow, Santiago
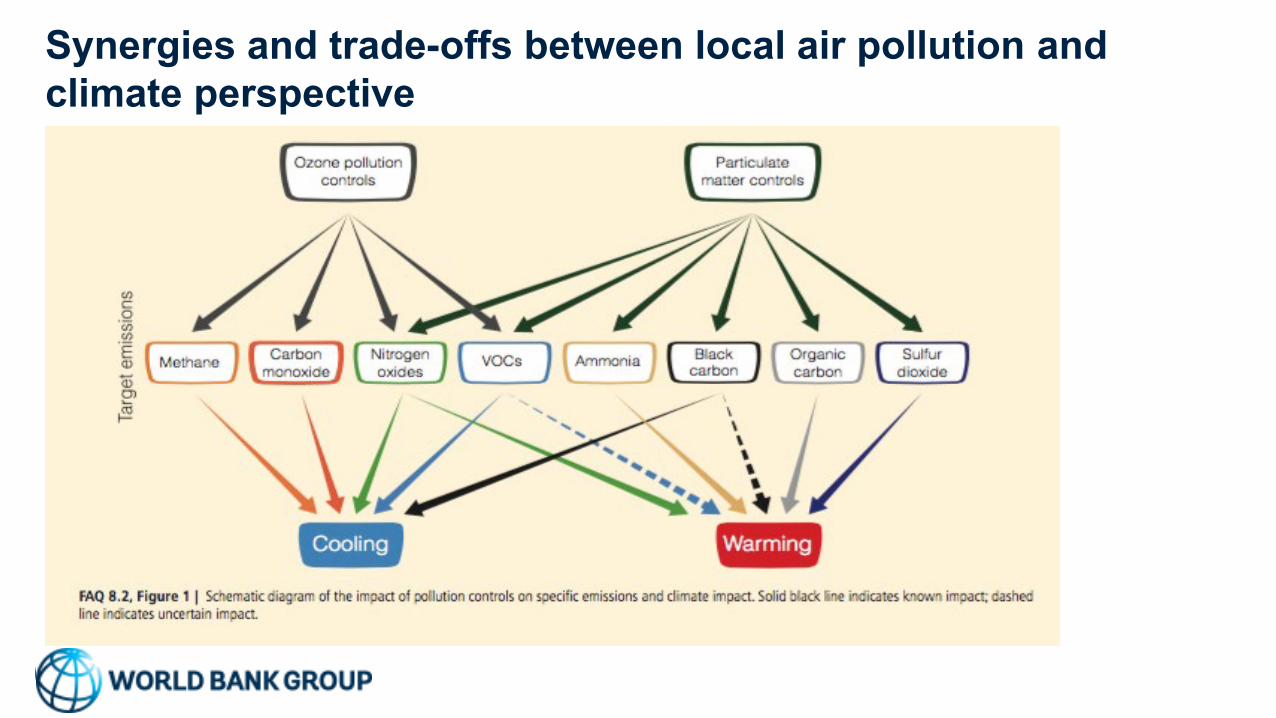
Synergies and trade-offs between local air pollution and climate perspective
Synergies and trade-offs between interventions driven by AP and CC agendas
Source: World Bank (forthcoming)
Outcomes of policy interventions Local air pollution
Climate change
Fuel and modal switch (wind, solar power + electric transport
Most energy and resource efficiency Behavioral, lifestyle changes (e.g. plant-based diet) Waste management (incl. open burning, methane) Organic, low-cattle agriculture (methane, ammonia) Nature based solutions Relocation of pollution source Increased recycling of waste Coal to biomass switch
Oil/gas to biofuels switch
Most technology-based end-of-pipe solutions, e.g.: Flue gas desulphurization Some NOx abatement technologies Switch from diesel to petrol engines Particulate filters for diesel Three-way catalysts for petrol cars
Environmental costs rarely rarely covered by energy taxes on fuels
Source: OECD 2018
Effective tax rates on carbon emissions from energy use on each fuel in 2015
…and are underpriced mainly in stationary uses
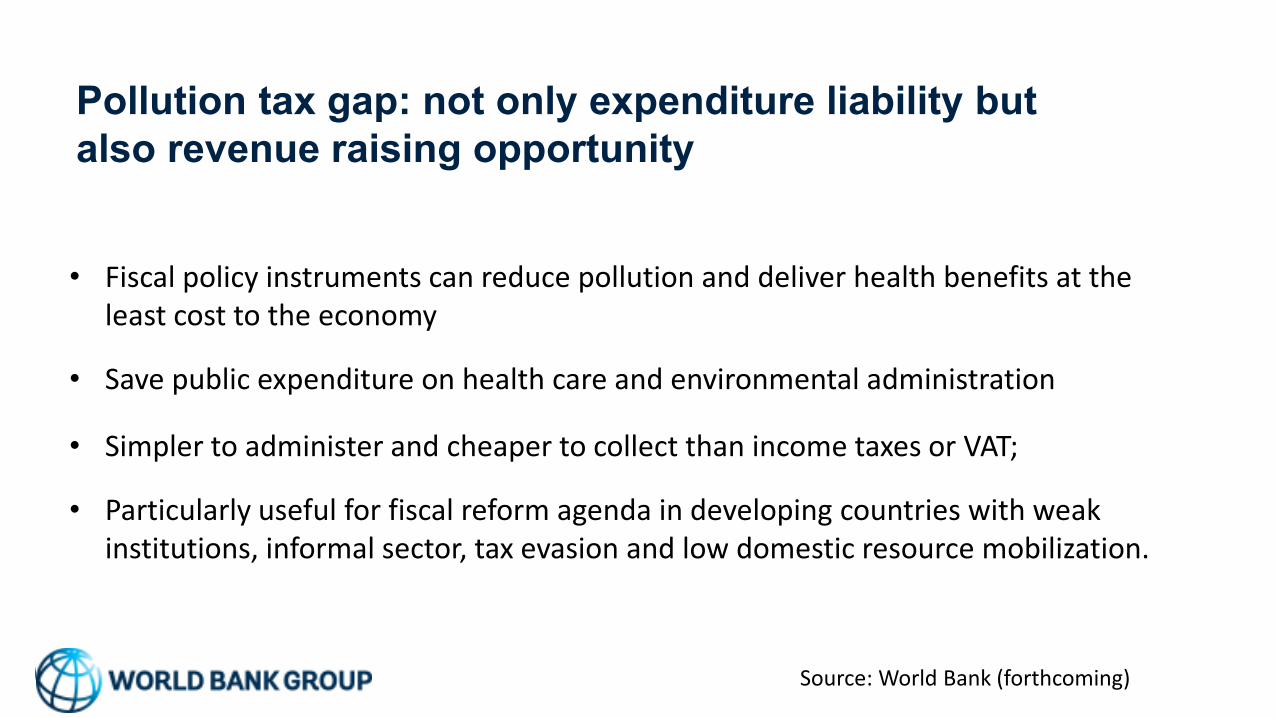
Pollution tax gap: not only expenditure liability but also revenue raising opportunity
Source: World Bank (forthcoming)
• Fiscal policy instruments can reduce pollution and deliver health benefits at the
least cost to the economy
• Save public expenditure on health care and environmental administration
• Simpler to administer and cheaper to collect than income taxes or VAT;
• Particularly useful for fiscal reform agenda in developing countries with weak institutions, informal sector, tax evasion and low domestic resource mobilization.
The takeaways
Some takeaways • Priorities for policy interventions can differ if led by local health or global impacts;
• Policies need to build on synergies and manage tradeoffs between short-term and long-term air pollution and climate agendas;
• Forthcoming World Bank report draws on international experience and literature to provide practical guidelines on how to identify: • Overlaps and disparities between local and global damages across fuels, sources,
technologies and locations; • Cost effective strategies to address priority air pollution issues, while minimizing long-
term lock-in of carbon intensive technologies and infrastructure; • Environmental tax reform; an integral part of modern fiscal systems, especially in
developing countries.
The WB 2018 report
Updated estimate of the global, regional and national cost of PM2.5 ambient air pollution in 2016 using the GBD 2016 estimates of mortality and morbidity from ambient PM2.5. For AAP 25% higher in real terms than the joint estimate of AAP and HAP for 2013 in World Bank and IHME (2016).
The reasons for the higher cost estimate: • Higher estimate of global ambient PM2.5
exposure (due to: • improved methodology and
availability of data and • actual worsening of global ambient
PM2.5 air quality from 2013 to 2016);
• Changes in health risk functions,
• Inclusion of a rough estimate of the cost of morbidity.