Page 1
UBC TEAM Test Report No: TEAM 2012-007
Timber Engineering and Applied Mechanics (TEAM) Laboratory
#1901 - 2424 Main Mall, Vancouver, B.C. Canada V6T 1Z4; Tel: (604) 822-8137 Fax: (604) 822-9159
Connection Design for Post and Beam Construction
Performance of Bolted Connection in Western Hemlock
by
Chao (Tom) Zhang
Huijun Yan
George Lee
Yuan Li
Frank Lam
Wood Science Department
Faculty of Forestry
University of British Columbia
Vancouver, B. C., Canada
Reporting Date
03/31/13
Updated Date
03/31/14
Report Prepared for
Forestry Innovation Investment Ltd.
Vancouver, British Columbia
Canada
Page 2
UBC TEAM Test Report No: TEAM-2012-007 03/30/13 Page 2 of 20
EXECUTIVE SUMMARY
Connection design provisions in Canadian Code on Engineering Design in Wood has
recently been modified to consider 4 failure modes in bolted connection design loaded
axially in the parallel to grain direction. The aim for the change is to provide more
realistic failure mode identification while achieving more efficient and economic designs.
There is little information on the performance of connection design with the new
provisions in terms of structural reliability and there is no information on the robustness
of the new design provision to identify failure mode.
This study aims to establish procedures that can evaluate the structural reliability of some
bolted connections in post and beam construction. Three connection configurations made
with 130 x130 mm No.1 and No.2 Western Hemlock were evaluated in tension parallel to
grain. Steel-Wood-Steel (SWS) and Wood-Steel-Wood (WSW) connections with 12.7
mm diameter bolts and 12.7 mm thick steel plates were considered with 2 rows of two
bolts (SWS and WSW) and 1 row of 2 bolts (SWS). The test data established the failure
mode and the capacity of the connection. Structural reliability analysis were conducted
to evaluate the performance of these connections based on snow load conditions in
Vancouver, The results indicate that the Canadian design provisions for such connections
was very conservative and failure mode was not properly identified in some cases.
There is a need to conduct further study to allow proper recognition of the performance
of bolted connections in Western Hemlock.
Reported by: Reviewed by:
____________________ _________________
George Lee Chao (Tom) Zhang
Wood Engineering Scientist Research Engineer
____________________ _________________ ________________________
Huijun Yan Yuan Li Frank C. F. Lam, Ph.D., P. Eng.
Research Engineer GRA Professor
Page 3
UBC TEAM Test Report No: TEAM-2012-007 03/30/13 Page 3 of 20
Table of Content
EXECUTIVE SUMMARY ................................................................................................ 2
TABLE OF CONTENT ...................................................................................................... 3
LIST OF TABLES .............................................................................................................. 4
LIST OF FIGURES ............................................................................................................ 4
1. INTRODUCTION ....................................................................................................... 5
2. MATERIAL AND METHODS ................................................................................... 5
2.1 Materials ................................................................................................................... 5
2.2 Test Procedure .......................................................................................................... 7
3. TEST RESULTS ......................................................................................................... 9
4. RELIABILIY ANALYSIS ........................................................................................ 17
4.1. Concept .................................................................................................................. 17
4.2. Evaluation of the Reliability .................................................................................. 19
5. REFERENCES .......................................................................................................... 20
Page 4
UBC TEAM Test Report No: TEAM-2012-007 03/30/13 Page 4 of 20
List of Tables
Table 1. Summary results of the tension capacity ........................................................................... 9
Table 2. Detail results of the tension capacity for WSW-2R1 group ............................................ 10
Table 3. Detail results of the tension capacity for SWS-2R2 group .............................................. 11
Table 4. Detail results of the tension capacity for SWS-1R2 group .............................................. 12
Table 5. The distributions and parameters used for the data fit..................................................... 16
Table 6. Code predicted connection capacity and failure mode .................................................... 19
Table 7. Summary results of the values ..................................................................................... 20
List of Figures
Figure 1. Schematics of the test configurations for WSW 2R1 group ........................................... 6
Figure 2. Schematics of the test configurations for SWS 2R2 group ............................................. 7
Figure 3. Schematics of the test configurations for SWS 1R2 group ............................................. 7
Figure 4. Data fitting for WSW-2R1group with grade No.1+No.2 .............................................. 15
Figure 5. Data fitting for SWS-2R2 group with grade No.1+No.2 .............................................. 15
Figure 6. Data fitting for SWS-2R1group with grade No.1+No.2 ............................................... 16
Page 5
UBC TEAM Test Report No: TEAM-2012-007 03/30/13 Page 5 of 20
1. INTRODUCTION
UBC has been involved in studying the behaviour of heavy timber connections for many
years. The scope of work ranged from studying the behaviour of screw, tube and bolted
connections under monotonic and reverse cyclic loading. Also we studied reinforcement
techniques for bolted connections to achieve improved performance.
This study is a new project in support of the wood first initiative intended to develop and
extend knowledge from the past so that we can quantify the performance of heavy timber
connections in terms of structural reliability. This information is needed to support
changes in the Canadian deign code Engineering Design in Wood (CAN3-O86.1). The
connection design provisions in CAN3-O86.1 were recently modified to consider 4
distant failure modes in the design of bolted connection loaded in tension in the parallel
to grain direction. The code also specifies minimum distances for row spacing, fastener
spacing in a row, loaded end distance, unloaded edge distance as a function of bolt
diameter (d) as 3d, 4d, maximum of (5d or 50 mm), and maximum of (1.5d or half of row
spacing), respectively.
The identified failure modes were row shear, group tear out, net tension, and bolt yielding.
In general these changes were positive allowing the designers to specify more economical
and rational solution compared to before. Furthermore a designer can in theory detail
bolted connections to achieve a certain failure mode for example to achieve ductile
behaviour by bolt yielding. To be able to control the failure mode is an important
concept in timber engineering especially in the provision of lateral resistance against
earthquake forces. In the case of BC, the ability to provide economical and safe design
solutions is also critical for the success of government wood first and midrise initiatives,
There is however little information on the performance of connection design with the
new provisions in terms of structural reliability and there is limited information on the
robustness of the new design provision to identify failure mode. The objective of this
study is to develop a database focusing on BC Western Hemlock (Tsuga heterophylla) on
a few connection configurations and evaluate the performance of the connection in terms
of structural reliability to ascertain the robustness of the new CAN3-O86.1 design
provisions.
2. MATERIAL AND METHODS
2.1 Materials As there are many available species and wood products and test configurations, the
potential evaluation matrix is orders of magnitude beyond the resource available for the
scope of the current project. Here three test configurations were chosen and studied in
detail. 130 mm x 130 mm No. 1 and No.2 (mostly No. 2) Western Hemlock members
Page 6
UBC TEAM Test Report No: TEAM-2012-007 03/30/13 Page 6 of 20
were chosen. The material were air dried to average moisture connect of ~13.5%. Steel-
Wood-Steel (SWS) and Wood-Steel-Wood (WSW) connections with 12.7 mm diameter
bolts and 12.7 mm thick steel plates were considered. In the case of the SWS connection,
2 rows of two bolts with 2 steel plates (2R2) and 1 row of two bolts with 2 steel plates
(1R2) were considered. In the case of WSW connection 2 rows of two bolts with 1 steel
plate (2R1) were tested. In all cases 5d was chosen as the row spacing, fastener spacing in
a row, and loaded end distance. The edge distance was chosen as 2.7d. Even though the
spacing was larger than the minimum distances specified in the code they were deemed
reasonable for the cross section of the member studied. Figures 1 to 3 show the
schematics of the test configurations.
CNC machine was used to predrill the holes for the bolts with a diameter of 12.7 mm and
precision of ±0.1mm. The specimens were conditioned at 20oC and 65% relative
humidity climate chamber after the holes were drilled to prevent the specimens from
cracking. The steel plates were also predrilled with a diameter of 13.5 mm and precision
of ±0.1mm.
Figure 1. Schematics of the test configurations for WSW 2R1 group
Page 7
UBC TEAM Test Report No: TEAM-2012-007 03/30/13 Page 7 of 20
Figure 2. Schematics of the test configurations for SWS 2R2 group
Figure 3. Schematics of the test configurations for SWS 1R2 group
2.2 Test Procedure The specimens were tested on the MTS Universal test machine in the UBC Timber
Engineering and Applied Mechanics Laboratory. The machine was displacement
controlled at a test rate of 1.4 mm/min for the connection tests to reach the peak loads in
Page 8
UBC TEAM Test Report No: TEAM-2012-007 03/30/13 Page 8 of 20
approximately 10 minutes, not less than 5 and not more than 20 minutes according to
ASTM D5652-95 Standard Test Methods for Bolted Connection in Wood and Wood-
Based Products. Two linear voltage displacement transducers were installed on two sides
of the connection only at the bottom end of the specimen to monitor the displacement
between the wood member and the steel connectors. A view the test assembly is
presented in Photo 1. The specimens were loaded until failure to obtain the peak load.
Photo 1. Test specimens being loaded
Page 9
UBC TEAM Test Report No: TEAM-2012-007 03/30/13 Page 9 of 20
3. TEST RESULTS
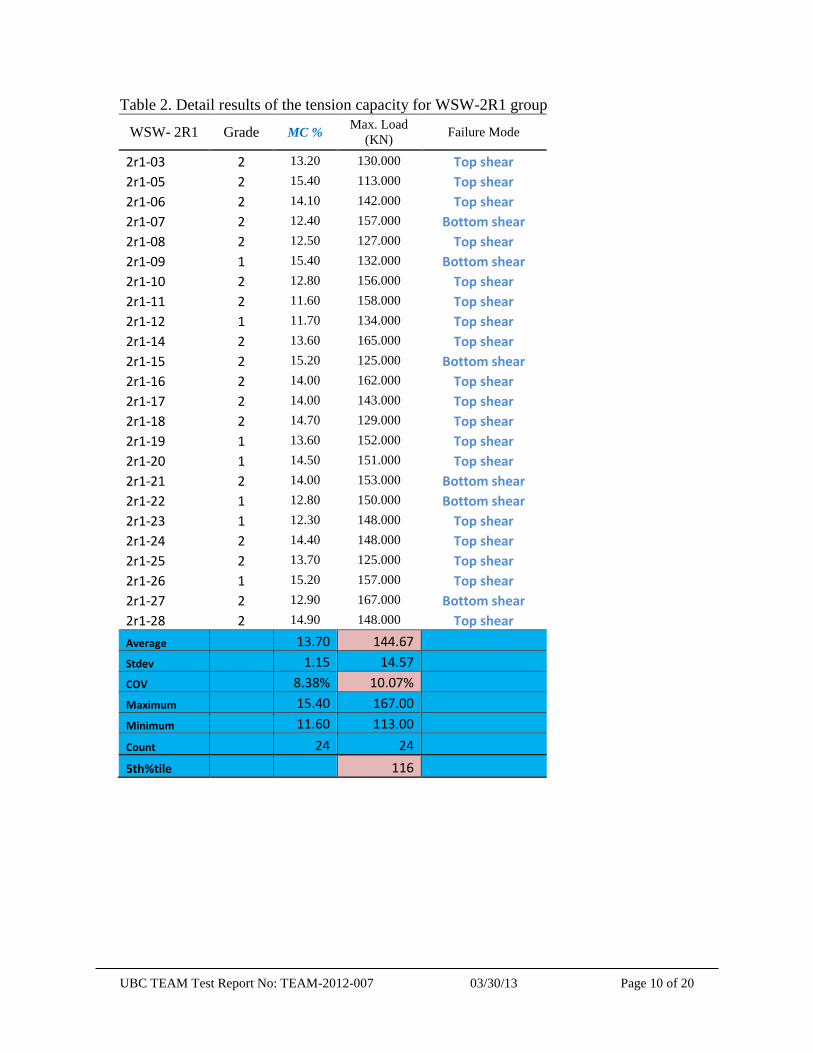
Table 1 presents the summary results of the tension capacity of each group. Detailed test
results are shown in Tables 2 to 4. In all but one case row shear failure was observed.
The case that did not fail in row shear was a wood slope of grain type failure which
occurred in SWS 1R2 with a capacity of 61 kN. It should be noted that it was not the
lowest in the group. Photos 2 to 3 show the failure modes.
Table 1. Summary results of the tension capacity
Group WSW 2R1 SWS 2R2 SWS 1R2
Moisture Capacity Moisture Capacity Moisture Capacity
Content (kN) Content (kN) Content (kN)
(%)
(%)
(%)
Average 13.70 144.67 13.40 169.23 14.10 76.05
Stdev 1.15 14.57 1.14 28.36 0.70 16.69
COV 8.4% 10.1% 8.5% 16.8% 5.0% 22.0%
Maximum 15.4 167 16.8 242 15.3 122
Minimum 11.6 113 11.8 130 12.7 58
Count 24 24 22 22 22 22
5th%tile
116.00
130.75
58.15 * XRY: X - number of rows; Y –number of steel plate.
Page 10
UBC TEAM Test Report No: TEAM-2012-007 03/30/13 Page 10 of 20
Table 2. Detail results of the tension capacity for WSW-2R1 group
WSW- 2R1 Grade MC % Max. Load
(KN) Failure Mode
2r1-03 2 13.20 130.000 Top shear
2r1-05 2 15.40 113.000 Top shear
2r1-06 2 14.10 142.000 Top shear
2r1-07 2 12.40 157.000 Bottom shear
2r1-08 2 12.50 127.000 Top shear
2r1-09 1 15.40 132.000 Bottom shear
2r1-10 2 12.80 156.000 Top shear
2r1-11 2 11.60 158.000 Top shear
2r1-12 1 11.70 134.000 Top shear
2r1-14 2 13.60 165.000 Top shear
2r1-15 2 15.20 125.000 Bottom shear
2r1-16 2 14.00 162.000 Top shear
2r1-17 2 14.00 143.000 Top shear
2r1-18 2 14.70 129.000 Top shear
2r1-19 1 13.60 152.000 Top shear
2r1-20 1 14.50 151.000 Top shear
2r1-21 2 14.00 153.000 Bottom shear
2r1-22 1 12.80 150.000 Bottom shear
2r1-23 1 12.30 148.000 Top shear
2r1-24 2 14.40 148.000 Top shear
2r1-25 2 13.70 125.000 Top shear
2r1-26 1 15.20 157.000 Top shear
2r1-27 2 12.90 167.000 Bottom shear
2r1-28 2 14.90 148.000 Top shear
Average 13.70 144.67
Stdev 1.15 14.57
COV 8.38% 10.07%
Maximum 15.40 167.00
Minimum 11.60 113.00
Count 24 24
5th%tile 116
Page 11
UBC TEAM Test Report No: TEAM-2012-007 03/30/13 Page 11 of 20
Table 3. Detail results of the tension capacity for SWS-2R2 group
WSW- 2R1 Grade MC % Max. Load
(KN) Failure Mode
2r2-03 2 12.80 183.000 Bottom shear
2r2-04 2 11.80 140.000 Top shear
2r2-05 2 13.70 166.000 B &T shear
2r2-07 2 13.30 140.000 B &T shear
2r2-08 2 14.30 171.000 Top shear
2r2-09 1 14.80 162.000 Top shear
2r2-10 2 13.20 160.000 Bottom shear
2r2-11 2 14.00 147.000 Bottom shear
2r2-12 1 13.60 153.000 Top shear
2r2-14 2 14.00 162.000 Top shear
2r2-15 1 12.60 171.000 B &T shear
2r2-17 2 12.70 154.000 B &T shear
2r2-18 2 12.10 185.000 Bottom shear
2r2-19 2 13.20 242.000 Bottom shear
2r2-20 2 16.80 130.000 Bottom shear
2r2-21 2 14.50 135.000 Top shear
2r2-22 2 14.10 199.000 Top shear
2r2-23 2 13.60 171.000 Top shear
2r2-24 2 12.00 166.000 B &T shear
2r2-25 2 12.10 196.000 Top shear
2r2-27 2 12.80 159.000 Bottom shear
2r2-28 2 12.70 231.000 Top shear
Average 13.40 169.23
Stdev 1.14 28.36
COV 8.50% 16.76%
Maximum 16.80 242.00
Minimum 11.80 130.00
Count 22 22
5th%tile 130.75
Page 12
UBC TEAM Test Report No: TEAM-2012-007 03/30/13 Page 12 of 20
Table 4. Detail results of the tension capacity for SWS-1R2 group
SWS-1R2 Grade MC % SG
Max. Load
(KN) Failure Mode
1r2-01 1 12.70 67.0 Bottom shear
1r2-02 2 14.40
94.0 Top shear
1r2-03 2 13.20
68.0 Top shear
1r2-04 1 14.60
64.0 Bottom shear
1r2-05 1 13.80
71.0 Bottom shear
1r2-06 2 13.40
98.0 Top shear
1r2-07 2 13.50
73.0 Bottom shear
1r2-08 1 13.40
88.0 Bottom shear
1r2-09 2 14.80
62.0 Top shear
1r2-10 2 14.00
90.0 Top shear
1r2-11 1 14.00
68.0 Top shear
1r2-12 2 13.00
61.0 Woo SOG
1r2-14 2 14.50
87.0 Top shear
1r2-15 2 14.50
101.0 Bottom shear
1r2-16 1 14.10
59.0 Top shear
1r2-17 1 14.50
75.0 Top shear
1r2-18 1 15.30
64.0 Bottom shear
1r2-20 1 14.80
70.0 B &T shear
1r2-22 1 14.90
72.0 Top shear
1r2-23 2 14.80
58.0 Top shear
1r2-26 1 14.60
122.0 Top shear
1r2-28 1 13.50 61.0 Bottom shear
Average 14.10 76.05
Stdev 0.70 16.69
COV 4.99% 21.95%
Maximum 15.30 122.00
Minimum 12.70 58.00
Count 22 22
5th%tile 58.15
Page 13
UBC TEAM Test Report No: TEAM-2012-007 03/30/13 Page 13 of 20
Photo 2. Failure modes in 2R2 group
Page 14
UBC TEAM Test Report No: TEAM-2012-007 03/30/13 Page 14 of 20
Photo 3. Failure modes in 2R1 and 1R2 groups
Page 15
UBC TEAM Test Report No: TEAM-2012-007 03/30/13 Page 15 of 20
In the three cases, probability distributions were fitted to the test data the resulting
cumulative distributions were plotted in Figures 4 to 6. The distributions and their
parameters deemed to provide the most reasonable fit to the data is shown in Tables 5.
Figure 4. Data fitting for WSW-2R1group with grade No.1+No.2
Figure 5. Data fitting for SWS-2R2 group with grade No.1+No.2
0.000
0.100
0.200
0.300
0.400
0.500
0.600
0.700
0.800
0.900
1.000
0 50 100 150 200 250 300
Cu
mu
lati
ve
Pro
bab
ilit
y
Max. Load (KN)
WSW-2R1
Test Data
2-P Weibull
3-P Weibull
0.000
0.100
0.200
0.300
0.400
0.500
0.600
0.700
0.800
0.900
1.000
0 50 100 150 200 250 300
Cu
mu
lati
ve
Pro
bab
ilit
y
Max. Load (KN)
SWS-2R2
Test Data Lognormal
Page 16
UBC TEAM Test Report No: TEAM-2012-007 03/30/13 Page 16 of 20
Figure 6. Data fitting for SWS-2R1group with grade No.1+No.2
Table 5. The distributions and parameters used for the data fit
WSW 2R1 SWS 2R2 SWS 1R2
2-P Weibull 3-P Weibull Lognormal Lognormal
Scale 150.9493 137.1187 - -
Shape 12.3708 11.1972 - -
Location - 13.7754 - -
Average - - 169.2273 76.04545
COV - - 0.1676 0.2195
0.000
0.100
0.200
0.300
0.400
0.500
0.600
0.700
0.800
0.900
1.000
0 50 100 150 200 250 300
Cu
mu
lati
ve
Pro
bab
ilit
y
Max. Load (KN)
SWS-1R2
Test Data Lognormal
Page 17
UBC TEAM Test Report No: TEAM-2012-007 03/30/13 Page 17 of 20
4. RELIABILIY ANALYSIS
4.1. Concept The reliability of a structural component can be defined as the probability that it will
achieve a predetermined level of performance in service. The probabilistic nature of the
problem arises from the fact that randomness exists in many intervening variables that
could influence the behaviour of the structural component of interest. In the case of
bolted connection such random variables could include the parameters that influence the
strength properties of the connection and the parameters that influence the load demands.
The uncertainties associated with these parameters need to be quantified and described in
statistical terms to allow the evaluation of the reliability of the structural component.
A performance function, G, for a given design condition is given as:
G(X) = G(X1, X2, X3,.., XN) = Capacity – Demand (1)
Where the vector X = X1, X2, X3,…, XN contains N random variables that are associated
with the problem. If G>0, the capacity is greater than the demand and the design
situation is safe. If G<0, the capacity is less than the demand and the design situation
fails. If G=0, a limit state exists. For a given situation, the objective is to establish the
probability of failure associated with the random variable vector X.
Following the First order or Second Order Reliability Methods (FORM/SORM), a
reliability index, , can be calculated for a given G. The probability of failure, Pf, can
then be estimated from with some basic assumptions and using the standard normal
probability distribution function as:
Pf = (-) (2)
Detailed discussions of the approach to reliability based design of wood structures can be
found in Foschi et al. (1989).
Page 18
UBC TEAM Test Report No: TEAM-2012-007 03/30/13 Page 18 of 20
In the Canadian limit state design code CSA 086-09 Engineering design in wood, a
design equation takes on the following form:
D E(Dn) + Q E(Qn) = Ro (3)
Where D =1.25 and Q =1.5 are load factors associated with dead and live loads,
respectively; E(Dn) and E(Qn) are effect of nominal dead and live loads on the structural
component of interest, respectively; Ro is the design resistance of the structural
component of interest under testing condition term of loading of say 15 minutes (clauses
10.4.4.3 to 10.4.4.6 in CAN3O86.1). In wood failure modes the design provisions in the
Canadian code is set to correspond with a standard load term of 3 months. To convert
back to the case of test duration of say 15 minutes a factor of 1.25 should be applied to
increase the design value. For bolt yielding failure mode there is no need to make
adjustment except for wood embedment strength calculation. is the performance factor
of the design set at a prescribed target performance level or probability of failure for the
various mode of failure.
Since there four design provisions for bolted connection in tension parallel to grain
corresponding to the failure modes of row shear, group tear out, net tension, and bolt
yielding (clauses 10.4.4.3 to 10.4.4.6 in CAN3O86.1), equation 3 should also have four
corresponding versions.
Although the design values in equation 3 appear as deterministic values, in real life, the
effect of loads and the resistance of the structural component are both random. A
performance function can therefore be written as:
G = R – (E(D) + E(Q)) (4)
Where R is the random resistance of the structural component of interest, E(D) and E(Q)
are effect of random dead and live loads on the structural component of interest,
respectively. The performance function can be linked with the design equation and
rewritten as:
G = R – Ro (d γ+ q)
𝛼𝐷𝛾+ 𝛼𝑄 (5)
Where:
Page 19
UBC TEAM Test Report No: TEAM-2012-007 03/30/13 Page 19 of 20
= Dn / Qn is the nominal dead load to nominal live load ratio typically set as 0.25 for
timber structures;
d = D / Dn is the dead load to nominal dead load ratio;
q = Q / Qn is the live load to nominal live load ratio.
Thus R, d, and q are the random variables in the problem. Given the statistical
information of these variables, the failure function can be studied with respect to different
values to establish the vs relationship for the design. So for a target level, the
associated level can be established so that consistent design and safety level can be
established for different structural components.
Now the statistical parameters for the random variables associated with the loads d and q
have previously been established and reported by Foschi et al. (1989). For the random
resistance R, its statistical parameters need to be established from the test data base
Tables 5. In this study we used these statistical parameters to study the performance of
three configurations of bolted Western Hemlock wood connection considering the effect
of snow and dead loads on the structural components.
4.2. Evaluation of the Reliability Reliability analyses were performed under dead and snow load conditions for Vancouver
following the procedures outlined by Foschi et al. (1989). The statistical distributions
and parameters for the dead and snow load for Vancouver were described in detail by
Foschi et al. (1989) where the snow loads are considered on a 30-year return period.
Table 6 shows the code predicted connection capacity and failure mode compared to the
test results. The Canadian CANO86.1 design provisions for such connections were very
conservative and failure mode was not properly identified in some cases.
Table 6. Code predicted connection capacity and failure mode
Group 1R2 2R2 2R1
Predicted connection strength (kN) 29.72 52.83 34.86
Predicted mode of failure RS GT RS
5th
% strength in test (kN) 58.15 130.75 116.00
Mode of failure in test RS RS RS
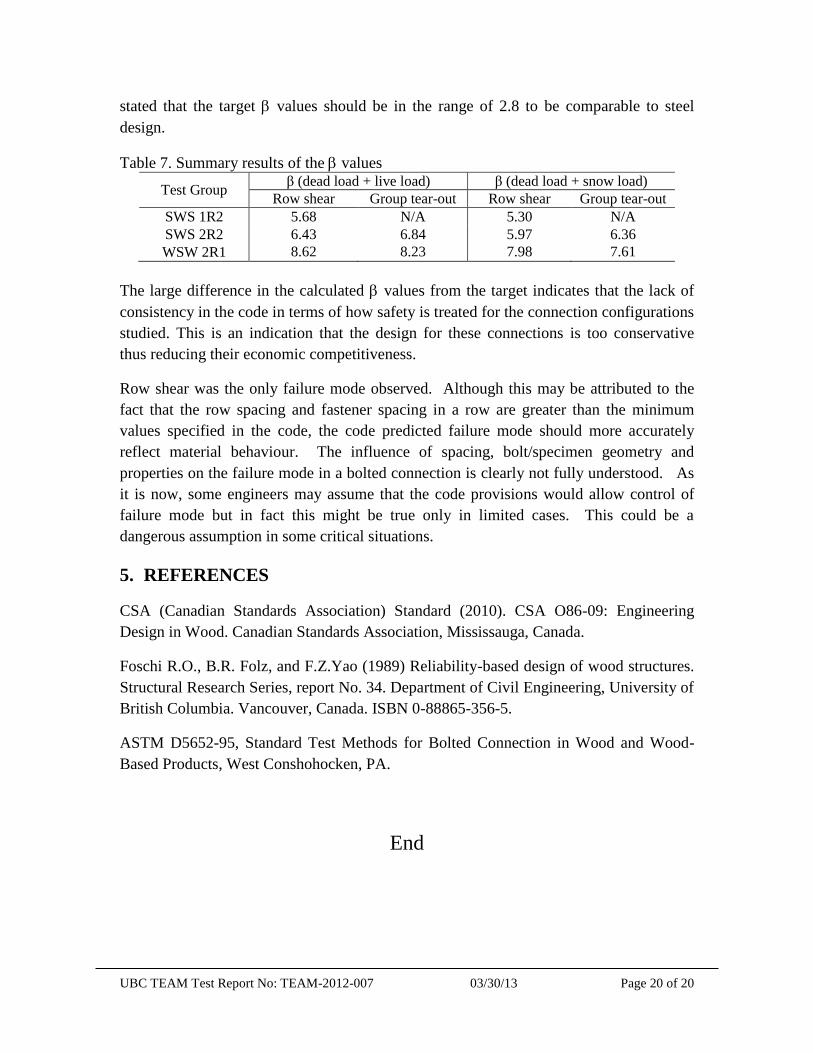
Table 7 shows the summary results of the values for the various cases of bolted
connections for each design provision. Considering the governing failure mode from the
design provisions in the Canadian Code, i.e. RS, GT and GT for 1R2, 2R2 and 2R1,
respectively, the associated values are in the range of 5.30-8.62. Foschi et al. (1989)
Page 20
UBC TEAM Test Report No: TEAM-2012-007 03/30/13 Page 20 of 20
stated that the target values should be in the range of 2.8 to be comparable to steel
design.
Table 7. Summary results of the values
Test Group β (dead load + live load) β (dead load + snow load)
Row shear Group tear-out Row shear Group tear-out
SWS 1R2 5.68 N/A 5.30 N/A
SWS 2R2 6.43 6.84 5.97 6.36
WSW 2R1 8.62 8.23 7.98 7.61
The large difference in the calculated values from the target indicates that the lack of
consistency in the code in terms of how safety is treated for the connection configurations
studied. This is an indication that the design for these connections is too conservative
thus reducing their economic competitiveness.
Row shear was the only failure mode observed. Although this may be attributed to the
fact that the row spacing and fastener spacing in a row are greater than the minimum
values specified in the code, the code predicted failure mode should more accurately
reflect material behaviour. The influence of spacing, bolt/specimen geometry and
properties on the failure mode in a bolted connection is clearly not fully understood. As
it is now, some engineers may assume that the code provisions would allow control of
failure mode but in fact this might be true only in limited cases. This could be a
dangerous assumption in some critical situations.
5. REFERENCES
CSA (Canadian Standards Association) Standard (2010). CSA O86-09: Engineering
Design in Wood. Canadian Standards Association, Mississauga, Canada.
Foschi R.O., B.R. Folz, and F.Z.Yao (1989) Reliability-based design of wood structures.
Structural Research Series, report No. 34. Department of Civil Engineering, University of
British Columbia. Vancouver, Canada. ISBN 0-88865-356-5.
ASTM D5652-95, Standard Test Methods for Bolted Connection in Wood and Wood-
Based Products, West Conshohocken, PA.
End