The mammalian neocortex consists of discrete, but interconnected, functional areas that collectively encode features of the environment, form associations between stimuli and drive behavior by trans-forming sensory input into motor output. Individual areas contain microcircuits that are organized vertically in columns and horizon-tally in layers of distinct cell types. In the rodent somatosensory cortex, for example, barrel-related columns of cells tend to respond to stimulation of the same whisker1,2 and are involved in sensory perception3. In contrast, cortical association areas such as the prefron-tal cortex regulate cognitive functions and are not known to contain clear maps of sensory space4.
Canonical circuits have been proposed as organizational features that are shared across sensory cortices5–7. In a canonical circuit model based largely on cat V1, information flows from thalamus→layer 4 (L4)→L2/3→L5/6. Mapping connectivity of the mouse barrel cor-tex largely supports the canonical circuit8,9. However, the canonical circuit represents a simplified overview of prominent cortical con-nections and many aspects of cortical circuit organization remain unknown. What is the spatial organization of transcolumnar con-nectivity in cortex? What are the cellular sources of long-range input to sensory cortex? What are the developmental mechanisms that give rise to layer-specific connectivity? To what extent does the canonical circuit in sensory cortices apply to association areas?
Previous pioneering studies generated maps of local and long-range inputs to specific cortical layers, but technical limitations leave the maps incomplete. Although in vivo dye fills allow for correlation of morphology with receptive field properties10, synaptic connections cannot always be inferred from where dendrites and axons overlap11. Electrophysiological methods including paired recordings8, gluta-mate uncaging9,12,13 and channelrhodopsin-assisted circuit map-ping (CRACM)14,15 have enabled quantification of connectivity rates and synapse strengths between defined cell types. However, paired recordings and glutamate uncaging are limited to mapping local
connections in a brain slice and CRACM can only be used to map one class of inputs at a time.
Modified rabies virus (RV) can be used to trace brain-wide mono-synaptic inputs to genetically defined cell types16,17. Here we used RV trans-synaptic tracing to generate layer-specific input maps to L2/3, L5 and L6 pyramidal neurons in barrel cortex. By comprehensively mapping local, inhibitory, and long-range inputs, we constructed whole-brain input maps that would not be possible with alterna-tive methodologies. We performed laminar analyses of inputs from barrel cortex and from other cortical regions in the sensorimotor network. To explore the developmental programs regulating layer spe-cific cortical inputs, we coupled Cre-dependent tracing to cell type– specific knockout of the obligatory NMDA receptor subunit GluN1. Finally, we generated the first whole-brain input map to mPFC L5. Comparisons of mPFC and barrel cortex revealed differences in layer-specific microcircuit organization and in the relative contributions of inhibitory and long-range inputs to L5 neurons in each area.
RESULTSExperimental strategyWe used RV tracing to probe the organization of inputs to excitatory neurons in L2/3, L5 and L6 of mouse barrel cortex. We injected two helper adeno-associated viruses (AAVs) that express target proteins in a Cre-dependent manner into mice in which the Cre recombinase is expressed in pyramidal neurons in specific layers (Supplementary Fig. 1a)18. The first AAV (CAG-FLEx-TVA66T-mCherry) expressed a mutant receptor (TVA66T) for EnvA, a coat protein for an avian virus, fused with mCherry. The second AAV (CAG-FLEx-G) expressed RV glycoprotein (G) necessary for the trans-synaptic transport of RV. We injected EnvA-pseudotyped RV 2 weeks later in which G was replaced with coding sequence of GFP (RVdG hereafter). Because there is no cognate receptor for EnvA in the mouse brain, RVdG only infects TVA-expressing cells. G expression from the second AAV complements the
1Howard Hughes Medical Institute and Department of Biology, Stanford University, Stanford, California, USA. 2Neurosciences Program, Stanford University, Stanford, California, USA. 3These authors contributed equally to this work. Correspondence should be addressed to L.L. ([email protected]).
Received 8 June; accepted 9 September; published online 12 October 2015; doi:10.1038/nn.4131
Connectivity of mouse somatosensory and prefrontal cortex examined with trans-synaptic tracingLaura A DeNardo1,3, Dominic S Berns1–3, Katherine DeLoach1 & Liqun Luo1,2
Information processing in neocortical circuits requires integrating inputs over a wide range of spatial scales, from local microcircuits to long-range cortical and subcortical connections. We used rabies virus–based trans-synaptic tracing to analyze the laminar distribution of local and long-range inputs to pyramidal neurons in the mouse barrel cortex and medial prefrontal cortex (mPFC). In barrel cortex, we found substantial inputs from layer 3 (L3) to L6, prevalent translaminar inhibitory inputs, and long-range inputs to L2/3 or L5/6 preferentially from L2/3 or L5/6 of input cortical areas, respectively. These layer-specific input patterns were largely independent of NMDA receptor function in the recipient neurons. mPFC L5 received proportionally more long-range inputs and more local inhibitory inputs than barrel cortex L5. Our results provide new insight into the organization and development of neocortical networks and identify important differences in the circuit organization in sensory and association cortices.
RVdG, allowing retrograde monosynaptic tracing from Cre-expressing cells (Fig. 1a).
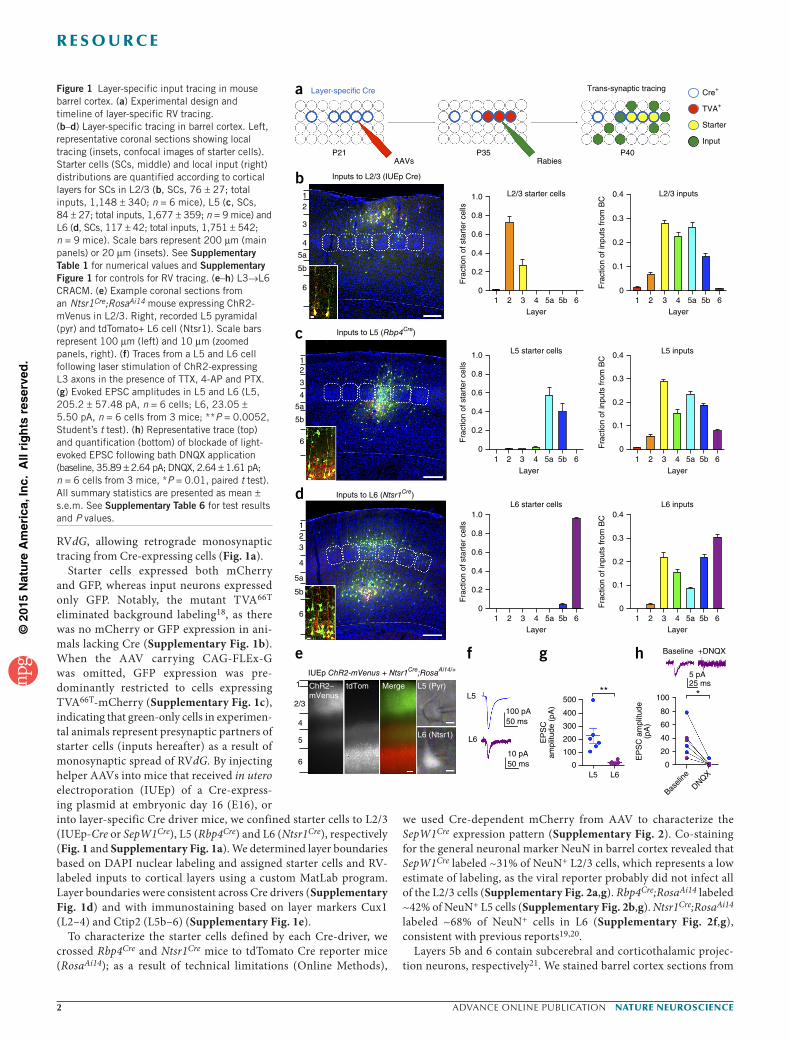
Starter cells expressed both mCherry and GFP, whereas input neurons expressed only GFP. Notably, the mutant TVA66T eliminated background labeling18, as there was no mCherry or GFP expression in ani-mals lacking Cre (Supplementary Fig. 1b). When the AAV carrying CAG-FLEx-G was omitted, GFP expression was pre-dominantly restricted to cells expressing TVA66T-mCherry (Supplementary Fig. 1c), indicating that green-only cells in experimen-tal animals represent presynaptic partners of starter cells (inputs hereafter) as a result of monosynaptic spread of RVdG. By injecting helper AAVs into mice that received in utero electroporation (IUEp) of a Cre-express-ing plasmid at embryonic day 16 (E16), or into layer-specific Cre driver mice, we confined starter cells to L2/3 (IUEp-Cre or SepW1Cre), L5 (Rbp4Cre) and L6 (Ntsr1Cre), respectively (Fig. 1 and Supplementary Fig. 1a). We determined layer boundaries based on DAPI nuclear labeling and assigned starter cells and RV-labeled inputs to cortical layers using a custom MatLab program. Layer boundaries were consistent across Cre drivers (Supplementary Fig. 1d) and with immunostaining based on layer markers Cux1 (L2–4) and Ctip2 (L5b–6) (Supplementary Fig. 1e).
To characterize the starter cells defined by each Cre-driver, we crossed Rbp4Cre and Ntsr1Cre mice to tdTomato Cre reporter mice (RosaAi14); as a result of technical limitations (Online Methods),
we used Cre-dependent mCherry from AAV to characterize the SepW1Cre expression pattern (Supplementary Fig. 2). Co-staining for the general neuronal marker NeuN in barrel cortex revealed that SepW1Cre labeled ~31% of NeuN+ L2/3 cells, which represents a low estimate of labeling, as the viral reporter probably did not infect all of the L2/3 cells (Supplementary Fig. 2a,g). Rbp4Cre;RosaAi14 labeled ~42% of NeuN+ L5 cells (Supplementary Fig. 2b,g). Ntsr1Cre;RosaAi14 labeled ~68% of NeuN+ cells in L6 (Supplementary Fig. 2f,g), consistent with previous reports19,20.
Layers 5b and 6 contain subcerebral and corticothalamic projec-tion neurons, respectively21. We stained barrel cortex sections from
c
12
3
45a
5b
6 Fra
ctio
n of
sta
rter
cel
lsLayer
1.0
0.8
0.6
0.2
01 2 3 4 5a 5b 6
0.4
L5 starter cells L5 inputs
Layer
Fra
ctio
n of
inpu
ts fr
om B
C
0.2
01 2 3 4 5a 5b 6
0.4
0.3
0.1
Inputs to L5 (Rbp4Cre)
d
Fra
ctio
n of
sta
rter
cel
ls
Layer
1.0
0.8
0.6
0.2
01 2 3 4 5a 5b 6
0.4
L6 starter cells L6 inputs
Layer
Fra
ctio
n of
inpu
ts fr
om B
C
0.2
01 2 3 4 5a 5b 6
0.4
0.3
0.1
Inputs to L6 (Ntsr1Cre)
123
4
5a
5b
6
b Inputs to L2/3 (IUEp Cre)
12
3
4
5a
5b
6
L2/3 starter cells L2/3 inputs
Fra
ctio
n of
sta
rter
cel
ls
Layer Layer
Fra
ctio
n of
inpu
ts fr
om B
C1.0
0.8
0.6
0.2
0.2
0 01 2 3 4 5a 5b 6 1 2 3 4 5a 5b 6
0.4
0.4
0.3
0.1
Baseline +DNQXe f g hIUEp ChR2-mVenus + Ntsr1Cre;RosaAi14/+
ChR2–mVenus
tdTom Merge L5 (Pyr)
L6 (Ntsr1)
5 pA25 ms
L5
L5
L6
L6
100 pA50 ms
10 pA50 ms
EP
SC
ampl
itude
(pA
)
EP
SC
am
plitu
de(p
A)
500** *
400
300
200
100
100
0 0
80
60
40
20
Baseli
ne
1
2/3
4
5
6
DNQX
Layer-specific Cre Trans-synaptic tracinga
P21 P35 P40AAVs Rabies
Cre+
TVA+
Starter
Input
Figure 1 Layer-specific input tracing in mouse barrel cortex. (a) Experimental design and timeline of layer-specific RV tracing. (b–d) Layer-specific tracing in barrel cortex. Left, representative coronal sections showing local tracing (insets, confocal images of starter cells). Starter cells (SCs, middle) and local input (right) distributions are quantified according to cortical layers for SCs in L2/3 (b, SCs, 76 ± 27; total inputs, 1,148 ± 340; n = 6 mice), L5 (c, SCs, 84 ± 27; total inputs, 1,677 ± 359; n = 9 mice) and L6 (d, SCs, 117 ± 42; total inputs, 1,751 ± 542; n = 9 mice). Scale bars represent 200 µm (main panels) or 20 µm (insets). See Supplementary Table 1 for numerical values and Supplementary Figure 1 for controls for RV tracing. (e–h) L3→L6 CRACM. (e) Example coronal sections from an Ntsr1Cre;RosaAi14 mouse expressing ChR2-mVenus in L2/3. Right, recorded L5 pyramidal (pyr) and tdTomato+ L6 cell (Ntsr1). Scale bars represent 100 µm (left) and 10 µm (zoomed panels, right). (f) Traces from a L5 and L6 cell following laser stimulation of ChR2-expressing L3 axons in the presence of TTX, 4-AP and PTX. (g) Evoked EPSC amplitudes in L5 and L6 (L5, 205.2 ± 57.48 pA, n = 6 cells; L6, 23.05 ± 5.50 pA, n = 6 cells from 3 mice; **P = 0.0052, Student’s t test). (h) Representative trace (top) and quantification (bottom) of blockade of light-evoked EPSC following bath DNQX application (baseline, 35.89 ± 2.64 pA; DNQX, 2.64 ± 1.61 pA; n = 6 cells from 3 mice, *P = 0.01, paired t test). All summary statistics are presented as mean ± s.e.m. See Supplementary Table 6 for test results and P values.
Rbp4Cre;RosaAi14 mice for Ctip2, a marker for subcerebral projec-tion neurons (SCPNs). ~50% of tdTomato+ cells in L5b expressed Ctip2 (Supplementary Fig. 2c,g), consistent with a previous report that Rbp4Cre labels both SCPNs and inter-telencephalic projection neurons22. Previous work reported that corticothalamic projection neurons in somatosensory and visual cortex L6 are almost exclusively labeled in the Ntsr1Cre line20,23. For simplicity, we used their respective layers to refer to the Cre driver names hereafter, keeping in mind that each Cre driver labeled only a subset of cells in that layer.
A prominent L3→L6 connection in barrel cortexWe mapped mouse barrel cortex so that we could compare RV trac-ing with other methods that have been used to describe this circuitry. In addition to describing layer-specific circuits in quantitative detail, trans-synaptic tracing might uncover new or understudied connections that were disrupted in brain slices used in previous mapping studies.
We traced from layer-restricted starter cells and mapped the layer identity of labeled inputs throughout all of barrel cortex. We define these inputs (located above, below or in a barrel visualized in L4 with DAPI staining) as local inputs hereafter. In all cases, starter cells had pyramidal morphology with apical dendrites extending toward the pia and were restricted to the layer of interest (Fig. 1b–d and Supplementary Table 1). For each brain, we calculated the number of inputs in each layer as a fraction of the total inputs in barrel cortex. Starter cells in each layer received characteristic sets of inputs (Supplementary Table 2). L2/3 starter cells produced by IUEp-Cre received the largest fractions of input from L3, L4 and L5a, L5 starter cells from L3, L5a and L5b, and L6 starter cells from L6, L5b, L3 and L4 (Fig. 1b–d and Supplementary Table 1). Consistent with previous work, starter cells received dense inputs from other cells in the starter cell layer8. Our data support the canonical pathways, including dense L4→L2/3 and L2/3→L5 connections, similar to previous reports8,9. We also observed a robust input from L3→L6 in barrel cortex that was not reported in a previous paired recording study and was observed as a weak connection using glutamate uncaging8,9.
To validate that the L3→L6 synaptic connections are functional, we performed a CRACM experiment in which we used IUEp at E16 to express channelrhodopsin-2 fused with the fluorescent protein mVenus (ChR2-mVenus) in L2/3 of Ntsr1Cre;RosaAi14 mice. We prepared acute slices 1 month later and performed whole-cell patch recordings from labeled L6 cells while stimulating axons from L2/3 with a blue laser. To isolate monosynaptic excitatory postsynaptic currents (EPSCs), we voltage clamped the cells at −60 mV in the presence of tetrodotoxin (TTX), 4-aminopyridine (4-AP) and picrotoxin. In the same slices, we also recorded from L5 pyramidal cells to compare the strength of L2/3→L6 synapses to that of L2/3→L5 synapses, which are part of the canonical pathway.
In slices with robust ChR2-mVenus expression (Fig. 1e), 6 of 13 recorded L6 cells responded to laser stimulation with a short-latency EPSC, whereas, in the same slices, 6 of 6 recorded L5 cells responded. The amplitudes of the L2/3→L6 ESPCs were ten-fold smaller than L2/3→L5 EPSCs (Fig. 1f,g). L2/3→L5 and L2/3→L6 EPSCs were blocked by the AMPA-type glutamate receptor antagonist 6,7- dinitroquinoxaline-2,3-dione (DNQX), indicating they were mediated by glutamate receptors (Fig. 1h). Given that we observed few L2→L6 inputs with RV tracing (Fig. 1d), most of the functional connec-tions that we observed were likely L3→L6. Together, the RV tracing and CRACM results indicate that L3→L6 synapses are numerous, but weak. Axons from L2/3 neurons were visible in L5 (Fig. 1e), suggesting that they form synapses onto distal dendrites of L6 neurons and might be subject to substantial dendritic filtering. These results
highlight the utility of RV tracing in identifying connections that are not easily detectable by electrophysiological methods.
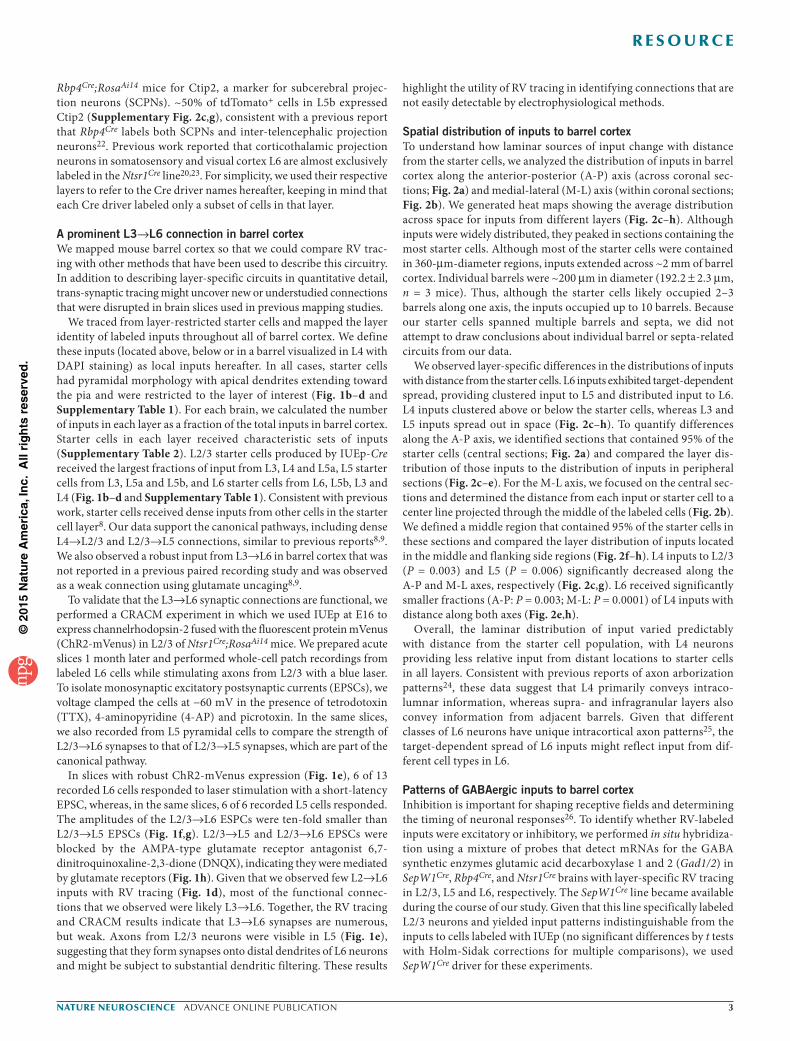
Spatial distribution of inputs to barrel cortexTo understand how laminar sources of input change with distance from the starter cells, we analyzed the distribution of inputs in barrel cortex along the anterior-posterior (A-P) axis (across coronal sec-tions; Fig. 2a) and medial-lateral (M-L) axis (within coronal sections; Fig. 2b). We generated heat maps showing the average distribution across space for inputs from different layers (Fig. 2c–h). Although inputs were widely distributed, they peaked in sections containing the most starter cells. Although most of the starter cells were contained in 360-µm-diameter regions, inputs extended across ~2 mm of barrel cortex. Individual barrels were ~200 µm in diameter (192.2 ± 2.3 µm, n = 3 mice). Thus, although the starter cells likely occupied 2–3 barrels along one axis, the inputs occupied up to 10 barrels. Because our starter cells spanned multiple barrels and septa, we did not attempt to draw conclusions about individual barrel or septa-related circuits from our data.
We observed layer-specific differences in the distributions of inputs with distance from the starter cells. L6 inputs exhibited target-dependent spread, providing clustered input to L5 and distributed input to L6. L4 inputs clustered above or below the starter cells, whereas L3 and L5 inputs spread out in space (Fig. 2c–h). To quantify differences along the A-P axis, we identified sections that contained 95% of the starter cells (central sections; Fig. 2a) and compared the layer dis-tribution of those inputs to the distribution of inputs in peripheral sections (Fig. 2c–e). For the M-L axis, we focused on the central sec-tions and determined the distance from each input or starter cell to a center line projected through the middle of the labeled cells (Fig. 2b). We defined a middle region that contained 95% of the starter cells in these sections and compared the layer distribution of inputs located in the middle and flanking side regions (Fig. 2f–h). L4 inputs to L2/3 (P = 0.003) and L5 (P = 0.006) significantly decreased along the A-P and M-L axes, respectively (Fig. 2c,g). L6 received significantly smaller fractions (A-P: P = 0.003; M-L: P = 0.0001) of L4 inputs with distance along both axes (Fig. 2e,h).
Overall, the laminar distribution of input varied predictably with distance from the starter cell population, with L4 neurons providing less relative input from distant locations to starter cells in all layers. Consistent with previous reports of axon arborization patterns24, these data suggest that L4 primarily conveys intraco-lumnar information, whereas supra- and infragranular layers also convey information from adjacent barrels. Given that different classes of L6 neurons have unique intracortical axon patterns25, the target-dependent spread of L6 inputs might reflect input from dif-ferent cell types in L6.
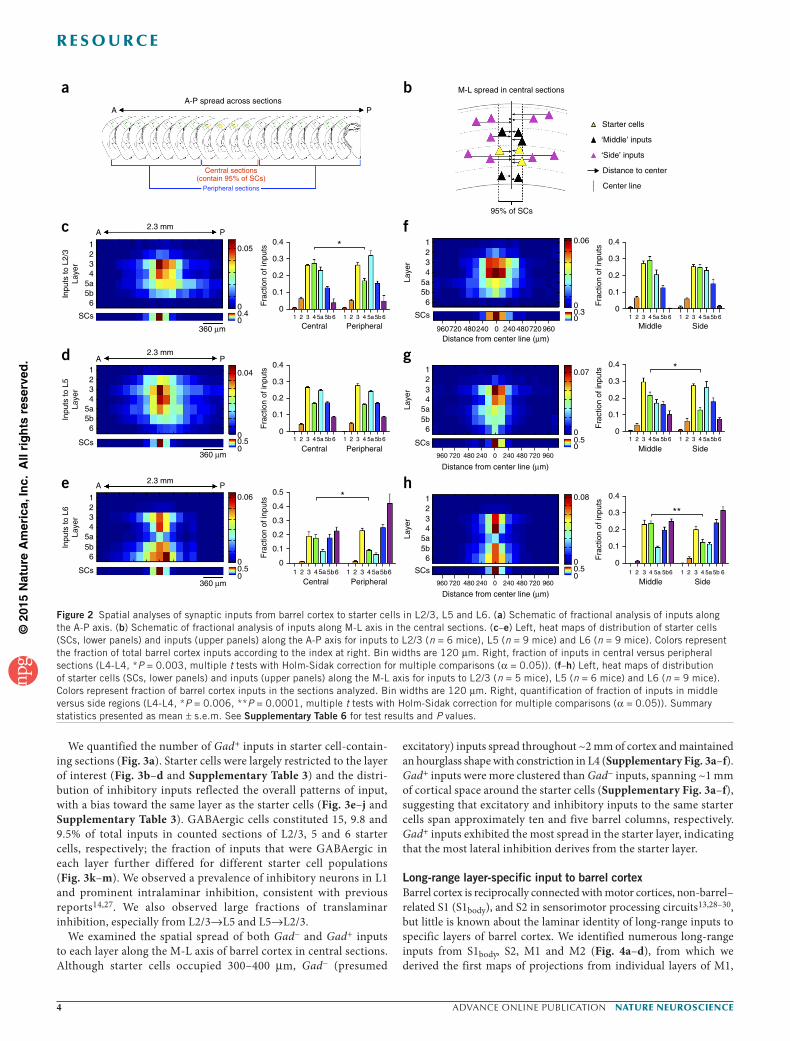
Patterns of GABAergic inputs to barrel cortexInhibition is important for shaping receptive fields and determining the timing of neuronal responses26. To identify whether RV-labeled inputs were excitatory or inhibitory, we performed in situ hybridiza-tion using a mixture of probes that detect mRNAs for the GABA synthetic enzymes glutamic acid decarboxylase 1 and 2 (Gad1/2) in SepW1Cre, Rbp4Cre, and Ntsr1Cre brains with layer-specific RV tracing in L2/3, L5 and L6, respectively. The SepW1Cre line became available during the course of our study. Given that this line specifically labeled L2/3 neurons and yielded input patterns indistinguishable from the inputs to cells labeled with IUEp (no significant differences by t tests with Holm-Sidak corrections for multiple comparisons), we used SepW1Cre driver for these experiments.
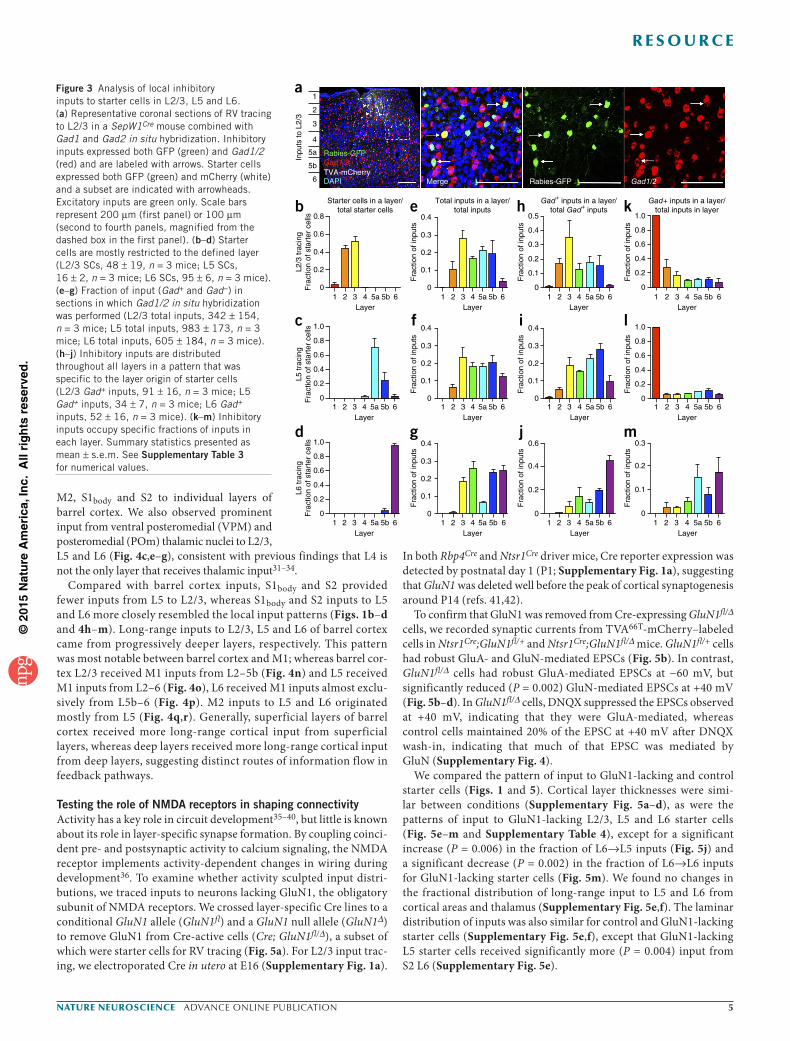
We quantified the number of Gad+ inputs in starter cell-contain-ing sections (Fig. 3a). Starter cells were largely restricted to the layer of interest (Fig. 3b–d and Supplementary Table 3) and the distri-bution of inhibitory inputs reflected the overall patterns of input, with a bias toward the same layer as the starter cells (Fig. 3e–j and Supplementary Table 3). GABAergic cells constituted 15, 9.8 and 9.5% of total inputs in counted sections of L2/3, 5 and 6 starter cells, respectively; the fraction of inputs that were GABAergic in each layer further differed for different starter cell populations (Fig. 3k–m). We observed a prevalence of inhibitory neurons in L1 and prominent intralaminar inhibition, consistent with previous reports14,27. We also observed large fractions of translaminar inhibition, especially from L2/3→L5 and L5→L2/3.
We examined the spatial spread of both Gad− and Gad+ inputs to each layer along the M-L axis of barrel cortex in central sections. Although starter cells occupied 300–400 µm, Gad− (presumed
excitatory) inputs spread throughout ~2 mm of cortex and maintained an hourglass shape with constriction in L4 (Supplementary Fig. 3a–f). Gad+ inputs were more clustered than Gad− inputs, spanning ~1 mm of cortical space around the starter cells (Supplementary Fig. 3a–f), suggesting that excitatory and inhibitory inputs to the same starter cells span approximately ten and five barrel columns, respectively. Gad+ inputs exhibited the most spread in the starter layer, indicating that the most lateral inhibition derives from the starter layer.
Long-range layer-specific input to barrel cortexBarrel cortex is reciprocally connected with motor cortices, non-barrel–related S1 (S1body), and S2 in sensorimotor processing circuits13,28–30, but little is known about the laminar identity of long-range inputs to specific layers of barrel cortex. We identified numerous long-range inputs from S1body, S2, M1 and M2 (Fig. 4a–d), from which we derived the first maps of projections from individual layers of M1,
A-P spread across sectionsM-L spread in central sections
Figure 2 Spatial analyses of synaptic inputs from barrel cortex to starter cells in L2/3, L5 and L6. (a) Schematic of fractional analysis of inputs along the A-P axis. (b) Schematic of fractional analysis of inputs along M-L axis in the central sections. (c–e) Left, heat maps of distribution of starter cells (SCs, lower panels) and inputs (upper panels) along the A-P axis for inputs to L2/3 (n = 6 mice), L5 (n = 9 mice) and L6 (n = 9 mice). Colors represent the fraction of total barrel cortex inputs according to the index at right. Bin widths are 120 µm. Right, fraction of inputs in central versus peripheral sections (L4-L4, *P = 0.003, multiple t tests with Holm-Sidak correction for multiple comparisons (α = 0.05)). (f–h) Left, heat maps of distribution of starter cells (SCs, lower panels) and inputs (upper panels) along the M-L axis for inputs to L2/3 (n = 5 mice), L5 (n = 6 mice) and L6 (n = 9 mice). Colors represent fraction of barrel cortex inputs in the sections analyzed. Bin widths are 120 µm. Right, quantification of fraction of inputs in middle versus side regions (L4-L4, *P = 0.006, **P = 0.0001, multiple t tests with Holm-Sidak correction for multiple comparisons (α = 0.05)). Summary statistics presented as mean ± s.e.m. See Supplementary Table 6 for test results and P values.
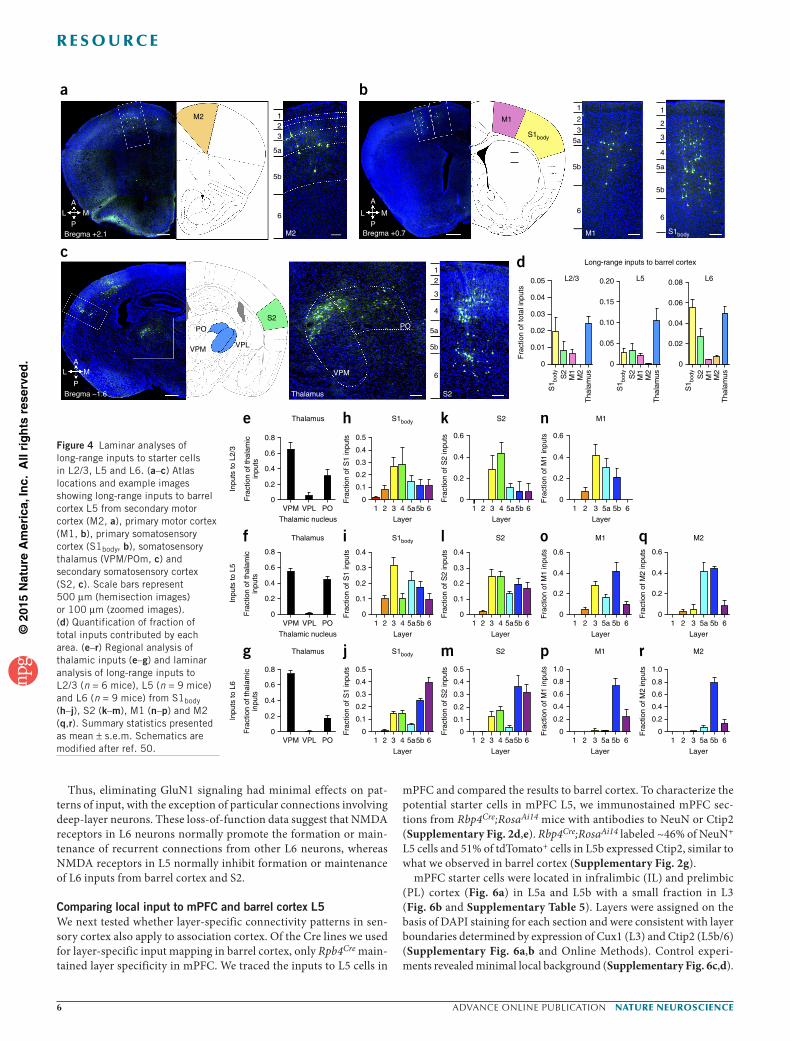
M2, S1body and S2 to individual layers of barrel cortex. We also observed prominent input from ventral posteromedial (VPM) and posteromedial (POm) thalamic nuclei to L2/3, L5 and L6 (Fig. 4c,e–g), consistent with previous findings that L4 is not the only layer that receives thalamic input31–34.
Compared with barrel cortex inputs, S1body and S2 provided fewer inputs from L5 to L2/3, whereas S1body and S2 inputs to L5 and L6 more closely resembled the local input patterns (Figs. 1b–d and 4h–m). Long-range inputs to L2/3, L5 and L6 of barrel cortex came from progressively deeper layers, respectively. This pattern was most notable between barrel cortex and M1; whereas barrel cor-tex L2/3 received M1 inputs from L2–5b (Fig. 4n) and L5 received M1 inputs from L2–6 (Fig. 4o), L6 received M1 inputs almost exclu-sively from L5b–6 (Fig. 4p). M2 inputs to L5 and L6 originated mostly from L5 (Fig. 4q,r). Generally, superficial layers of barrel cortex received more long-range cortical input from superficial layers, whereas deep layers received more long-range cortical input from deep layers, suggesting distinct routes of information flow in feedback pathways.
Testing the role of NMDA receptors in shaping connectivityActivity has a key role in circuit development35–40, but little is known about its role in layer-specific synapse formation. By coupling coinci-dent pre- and postsynaptic activity to calcium signaling, the NMDA receptor implements activity-dependent changes in wiring during development36. To examine whether activity sculpted input distri-butions, we traced inputs to neurons lacking GluN1, the obligatory subunit of NMDA receptors. We crossed layer-specific Cre lines to a conditional GluN1 allele (GluN1fl) and a GluN1 null allele (GluN1∆) to remove GluN1 from Cre-active cells (Cre; GluN1fl/∆), a subset of which were starter cells for RV tracing (Fig. 5a). For L2/3 input trac-ing, we electroporated Cre in utero at E16 (Supplementary Fig. 1a).
In both Rbp4Cre and Ntsr1Cre driver mice, Cre reporter expression was detected by postnatal day 1 (P1; Supplementary Fig. 1a), suggesting that GluN1 was deleted well before the peak of cortical synaptogenesis around P14 (refs. 41,42).
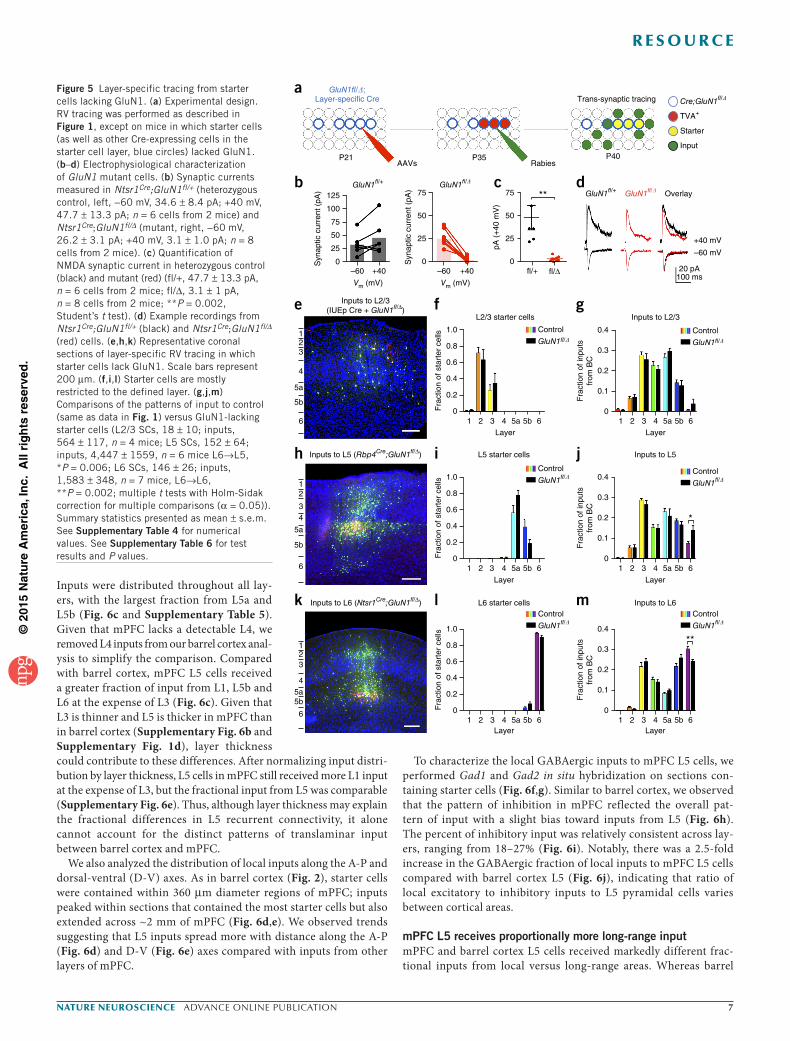
To confirm that GluN1 was removed from Cre-expressing GluN1fl/∆ cells, we recorded synaptic currents from TVA66T-mCherry–labeled cells in Ntsr1Cre;GluN1fl/+ and Ntsr1Cre;GluN1fl/∆ mice. GluN1fl/+ cells had robust GluA- and GluN-mediated EPSCs (Fig. 5b). In contrast, GluN1fl/∆ cells had robust GluA-mediated EPSCs at −60 mV, but significantly reduced (P = 0.002) GluN-mediated EPSCs at +40 mV (Fig. 5b–d). In GluN1fl/∆ cells, DNQX suppressed the EPSCs observed at +40 mV, indicating that they were GluA-mediated, whereas control cells maintained 20% of the EPSC at +40 mV after DNQX wash-in, indicating that much of that EPSC was mediated by GluN (Supplementary Fig. 4).
We compared the pattern of input to GluN1-lacking and control starter cells (Figs. 1 and 5). Cortical layer thicknesses were simi-lar between conditions (Supplementary Fig. 5a–d), as were the patterns of input to GluN1-lacking L2/3, L5 and L6 starter cells (Fig. 5e–m and Supplementary Table 4), except for a significant increase (P = 0.006) in the fraction of L6→L5 inputs (Fig. 5j) and a significant decrease (P = 0.002) in the fraction of L6→L6 inputs for GluN1-lacking starter cells (Fig. 5m). We found no changes in the fractional distribution of long-range input to L5 and L6 from cortical areas and thalamus (Supplementary Fig. 5e,f). The laminar distribution of inputs was also similar for control and GluN1-lacking starter cells (Supplementary Fig. 5e,f), except that GluN1-lacking L5 starter cells received significantly more (P = 0.004) input from S2 L6 (Supplementary Fig. 5e).
a1
2
3
4
5a
5b
6
Rabies-GFPGad1/2
DAPITVA-mCherry
Inpu
ts to
L2/
3
Merge Rabies-GFP Gad1/2
Starter cells in a layer/total starter cellsb
0.8
0.6
0.4
0.2
0
Layer
Layer
Layer
L2/3
trac
ing
Fra
ctio
n of
sta
rter
cel
lsL5
trac
ing
Fra
ctio
n of
sta
rter
cel
lsL6
trac
ing
Fra
ctio
n of
sta
rter
cel
ls21 3 4 5a 5b 6
0.8
1.0
0.6
0.4
0.2
021 3 4 5a 5b 6
c
0.8
1.0
0.6
0.4
0.2
021 3 4 5a 5b 6
dF
ract
ion
of in
puts
Fra
ctio
n of
inpu
tsF
ract
ion
of in
puts
0.3
0.4e
0.2
0.1
0
Layer
Layer
Layer
21 3 4 5a 5b 6
0.3
0.4f
0.2
0.1
021 3 4 5a 5b 6
0.3
0.4g
0.2
0.1
021 3 4 5a 5b 6
Total inputs in a layer/total inputs
Layer
Layer
Layer
0.6
0.4
j
0.2
021 3 4 5a 5b 6
0.3
0.4i
0.2
0.1
021 3 4 5a 5b 6
0.3
0.4
0.5h
0.2
0.1
021 3 4 5a 5b 6
Fra
ctio
n of
inpu
tsF
ract
ion
of in
puts
Fra
ctio
n of
inpu
ts
Gad+ inputs in a layer/total Gad+ inputs
0.8
1.0
0.6
0.4
0.2
021 3 4 5a 5b 6
Layer
Layer
Layer
0.3m
0.2
0.1
021 3 4 5a 5b 6
k
0.8
1.0
0.6
0.4
0.2
021 3 4 5a 5b 6
l
Fra
ctio
n of
inpu
tsF
ract
ion
of in
puts
Fra
ctio
n of
inpu
ts
Gad+ inputs in a layer/total inputs in layer
Figure 3 Analysis of local inhibitory inputs to starter cells in L2/3, L5 and L6. (a) Representative coronal sections of RV tracing to L2/3 in a SepW1Cre mouse combined with Gad1 and Gad2 in situ hybridization. Inhibitory inputs expressed both GFP (green) and Gad1/2 (red) and are labeled with arrows. Starter cells expressed both GFP (green) and mCherry (white) and a subset are indicated with arrowheads. Excitatory inputs are green only. Scale bars represent 200 µm (first panel) or 100 µm (second to fourth panels, magnified from the dashed box in the first panel). (b–d) Starter cells are mostly restricted to the defined layer (L2/3 SCs, 48 ± 19, n = 3 mice; L5 SCs, 16 ± 2, n = 3 mice; L6 SCs, 95 ± 6, n = 3 mice). (e–g) Fraction of input (Gad+ and Gad−) in sections in which Gad1/2 in situ hybridization was performed (L2/3 total inputs, 342 ± 154, n = 3 mice; L5 total inputs, 983 ± 173, n = 3 mice; L6 total inputs, 605 ± 184, n = 3 mice). (h–j) Inhibitory inputs are distributed throughout all layers in a pattern that was specific to the layer origin of starter cells (L2/3 Gad+ inputs, 91 ± 16, n = 3 mice; L5 Gad+ inputs, 34 ± 7, n = 3 mice; L6 Gad+ inputs, 52 ± 16, n = 3 mice). (k–m) Inhibitory inputs occupy specific fractions of inputs in each layer. Summary statistics presented as mean ± s.e.m. See Supplementary Table 3 for numerical values.
Thus, eliminating GluN1 signaling had minimal effects on pat-terns of input, with the exception of particular connections involving deep-layer neurons. These loss-of-function data suggest that NMDA receptors in L6 neurons normally promote the formation or main-tenance of recurrent connections from other L6 neurons, whereas NMDA receptors in L5 normally inhibit formation or maintenance of L6 inputs from barrel cortex and S2.
Comparing local input to mPFC and barrel cortex L5We next tested whether layer-specific connectivity patterns in sen-sory cortex also apply to association cortex. Of the Cre lines we used for layer-specific input mapping in barrel cortex, only Rpb4Cre main-tained layer specificity in mPFC. We traced the inputs to L5 cells in
mPFC and compared the results to barrel cortex. To characterize the potential starter cells in mPFC L5, we immunostained mPFC sec-tions from Rbp4Cre;RosaAi14 mice with antibodies to NeuN or Ctip2 (Supplementary Fig. 2d,e). Rbp4Cre;RosaAi14 labeled ~46% of NeuN+ L5 cells and 51% of tdTomato+ cells in L5b expressed Ctip2, similar to what we observed in barrel cortex (Supplementary Fig. 2g).
mPFC starter cells were located in infralimbic (IL) and prelimbic (PL) cortex (Fig. 6a) in L5a and L5b with a small fraction in L3 (Fig. 6b and Supplementary Table 5). Layers were assigned on the basis of DAPI staining for each section and were consistent with layer boundaries determined by expression of Cux1 (L3) and Ctip2 (L5b/6) (Supplementary Fig. 6a,b and Online Methods). Control experi-ments revealed minimal local background (Supplementary Fig. 6c,d).
Figure 4 Laminar analyses of long-range inputs to starter cells in L2/3, L5 and L6. (a–c) Atlas locations and example images showing long-range inputs to barrel cortex L5 from secondary motor cortex (M2, a), primary motor cortex (M1, b), primary somatosensory cortex (S1body, b), somatosensory thalamus (VPM/POm, c) and secondary somatosensory cortex (S2, c). Scale bars represent 500 µm (hemisection images) or 100 µm (zoomed images). (d) Quantification of fraction of total inputs contributed by each area. (e–r) Regional analysis of thalamic inputs (e–g) and laminar analysis of long-range inputs to L2/3 (n = 6 mice), L5 (n = 9 mice) and L6 (n = 9 mice) from S1body (h–j), S2 (k–m), M1 (n–p) and M2 (q,r). Summary statistics presented as mean ± s.e.m. Schematics are modified after ref. 50.
Inputs were distributed throughout all lay-ers, with the largest fraction from L5a and L5b (Fig. 6c and Supplementary Table 5). Given that mPFC lacks a detectable L4, we removed L4 inputs from our barrel cortex anal-ysis to simplify the comparison. Compared with barrel cortex, mPFC L5 cells received a greater fraction of input from L1, L5b and L6 at the expense of L3 (Fig. 6c). Given that L3 is thinner and L5 is thicker in mPFC than in barrel cortex (Supplementary Fig. 6b and Supplementary Fig. 1d), layer thickness could contribute to these differences. After normalizing input distri-bution by layer thickness, L5 cells in mPFC still received more L1 input at the expense of L3, but the fractional input from L5 was comparable (Supplementary Fig. 6e). Thus, although layer thickness may explain the fractional differences in L5 recurrent connectivity, it alone cannot account for the distinct patterns of translaminar input between barrel cortex and mPFC.
We also analyzed the distribution of local inputs along the A-P and dorsal-ventral (D-V) axes. As in barrel cortex (Fig. 2), starter cells were contained within 360 µm diameter regions of mPFC; inputs peaked within sections that contained the most starter cells but also extended across ~2 mm of mPFC (Fig. 6d,e). We observed trends suggesting that L5 inputs spread more with distance along the A-P (Fig. 6d) and D-V (Fig. 6e) axes compared with inputs from other layers of mPFC.
To characterize the local GABAergic inputs to mPFC L5 cells, we performed Gad1 and Gad2 in situ hybridization on sections con-taining starter cells (Fig. 6f,g). Similar to barrel cortex, we observed that the pattern of inhibition in mPFC reflected the overall pat-tern of input with a slight bias toward inputs from L5 (Fig. 6h). The percent of inhibitory input was relatively consistent across lay-ers, ranging from 18–27% (Fig. 6i). Notably, there was a 2.5-fold increase in the GABAergic fraction of local inputs to mPFC L5 cells compared with barrel cortex L5 (Fig. 6j), indicating that ratio of local excitatory to inhibitory inputs to L5 pyramidal cells varies between cortical areas.
mPFC L5 receives proportionally more long-range inputmPFC and barrel cortex L5 cells received markedly different frac-tional inputs from local versus long-range areas. Whereas barrel
a
P21AAVs
P35 P40Input
Starter
TVA+
Cre;GluN1fl/Trans-synaptic tracing
Rabies
GluN1fl/;Layer-specific Cre
bOverlay
+40 mV
–60 mV
20 pA100 ms
GluN1fl/GluN1fl/+d
125
100
75
50
25
0
Vm (mV)
–60 +40
Syn
aptic
cur
rent
(pA
)
GluN1fl/+
75
50
25
0
Vm (mV)
–60 +40
Syn
aptic
cur
rent
(pA
)
GluN1fl/
75
50
**
25
0
pA (
+40
mV
)
c
fl/∆fl/+
Inputs to L6 (Ntsr1Cre;GluN1fl/∆) l mk
123
45a5b
6
Fra
ctio
n of
sta
rter
cel
ls 1.0
0.8
0.6
0.4
0.2
0
Layer
L6 starter cells
1 2 3 4 5a 5b 6
Fra
ctio
n of
inpu
tsfr
om B
C
0.4
0.3
0.2
0.1
0
Inputs to L6
Layer1 2 3 4 5a 5b 6
**
Control
GluN1fl/Control
GluN1fl/
Inputs to L5 (Rbp4Cre;GluN1fl/∆)h i j
12
34
5a
5b
6
Fra
ctio
n of
sta
rter
cel
ls 1.0
0.8
0.6
0.4
0.2
0
Layer
L5 starter cells
1 2 3 4 5a 5b 6F
ract
ion
of in
puts
from
BC
0.4
0.3
0.2
0.1
0
Inputs to L5
Layer
1 2 3 4 5a 5b 6
*
Control
GluN1fl/Control
GluN1fl/
Inputs to L2/3(IUEp Cre + GluN1fl/∆)
1
Fra
ctio
n of
sta
rter
cel
ls
e f g1.0
0.8
0.6
0.4
0.2
0
Fra
ctio
n of
inpu
tsfr
om B
C
0.4
0.3
0.2
0.1
0
L2/3 starter cells Inputs to L2/3
23
4
5a
5b
6Layer
1 2 3 4 5a 5b 6
Layer
1 2 3 4 5a 5b 6
Control
GluN1fl/Control
GluN1fl/
Figure 5 Layer-specific tracing from starter cells lacking GluN1. (a) Experimental design. RV tracing was performed as described in Figure 1, except on mice in which starter cells (as well as other Cre-expressing cells in the starter cell layer, blue circles) lacked GluN1. (b–d) Electrophysiological characterization of GluN1 mutant cells. (b) Synaptic currents measured in Ntsr1Cre;GluN1fl/+ (heterozygous control, left, −60 mV, 34.6 ± 8.4 pA; +40 mV, 47.7 ± 13.3 pA; n = 6 cells from 2 mice) and Ntsr1Cre;GluN1fl/∆ (mutant, right, −60 mV, 26.2 ± 3.1 pA; +40 mV, 3.1 ± 1.0 pA; n = 8 cells from 2 mice). (c) Quantification of NMDA synaptic current in heterozygous control (black) and mutant (red) (fl/+, 47.7 ± 13.3 pA, n = 6 cells from 2 mice; fl/∆, 3.1 ± 1 pA, n = 8 cells from 2 mice; **P = 0.002, Student’s t test). (d) Example recordings from Ntsr1Cre;GluN1fl/+ (black) and Ntsr1Cre;GluN1fl/∆ (red) cells. (e,h,k) Representative coronal sections of layer-specific RV tracing in which starter cells lack GluN1. Scale bars represent 200 µm. (f,i,l) Starter cells are mostly restricted to the defined layer. (g,j,m) Comparisons of the patterns of input to control (same as data in Fig. 1) versus GluN1-lacking starter cells (L2/3 SCs, 18 ± 10; inputs, 564 ± 117, n = 4 mice; L5 SCs, 152 ± 64; inputs, 4,447 ± 1559, n = 6 mice L6→L5, *P = 0.006; L6 SCs, 146 ± 26; inputs, 1,583 ± 348, n = 7 mice, L6→L6, **P = 0.002; multiple t tests with Holm-Sidak correction for multiple comparisons (α = 0.05)). Summary statistics presented as mean ± s.e.m. See Supplementary Table 4 for numerical values. See Supplementary Table 6 for test results and P values.
cortex L5 cells received, on average, 79% of their total inputs from other cells in ipsilateral barrel cortex, mPFC L5 cells only received 21% of their inputs from other ipsilateral mPFC cells (Fig. 6k). This could be because barrel cortex is approximately twice the volume of mPFC (barrel cortex per hemisphere = 4.1 ± 0.4 mm3, n = 5 mice; mPFC per hemisphere = 1.9 ± 0.02 mm3, n = 4 mice). However, most of the inputs in barrel cortex and mPFC were located within 1 mm of the starter cells (Figs. 2d,g and 6d,e), suggesting the volumes con-taining local inputs in each area were similar. Alternatively, the local connection probability could vary by region.
To determine whether the spread of inputs to L5 starter cells dif-fers between barrel cortex and mPFC, we plotted the local fraction of total inputs along the A-P (Fig. 6l) and D-V (Fig. 6m; M-L for barrel cortex) axes for each area. We did not observe differences in the frac-tion of local inputs at sites distant (360–1,080 µm) from starter cells, suggesting that mPFC and barrel cortex starter cells receive local
inputs from similar volumes of cortical space. However, we observed significantly smaller fractions (A-P 240 µm: P = 0.0009; A-P 360 µm: P = 0.0005; D-V 120 µm: P = 0.004; D-V 240 µm: P = 0.0007) of inputs to mPFC L5 at sites close to the starter cells along both axes (Fig. 6l,m). This was not a result of a reduced number of potential inputs, as the density of neurons in mPFC and barrel cortex was similar (Fig. 6n). Thus, the decreased fraction of local input to mPFC compared to barrel cortex is not a result of differences in cortical size or available inputs, but instead may reflect distinct local connection probabilities between the two areas.
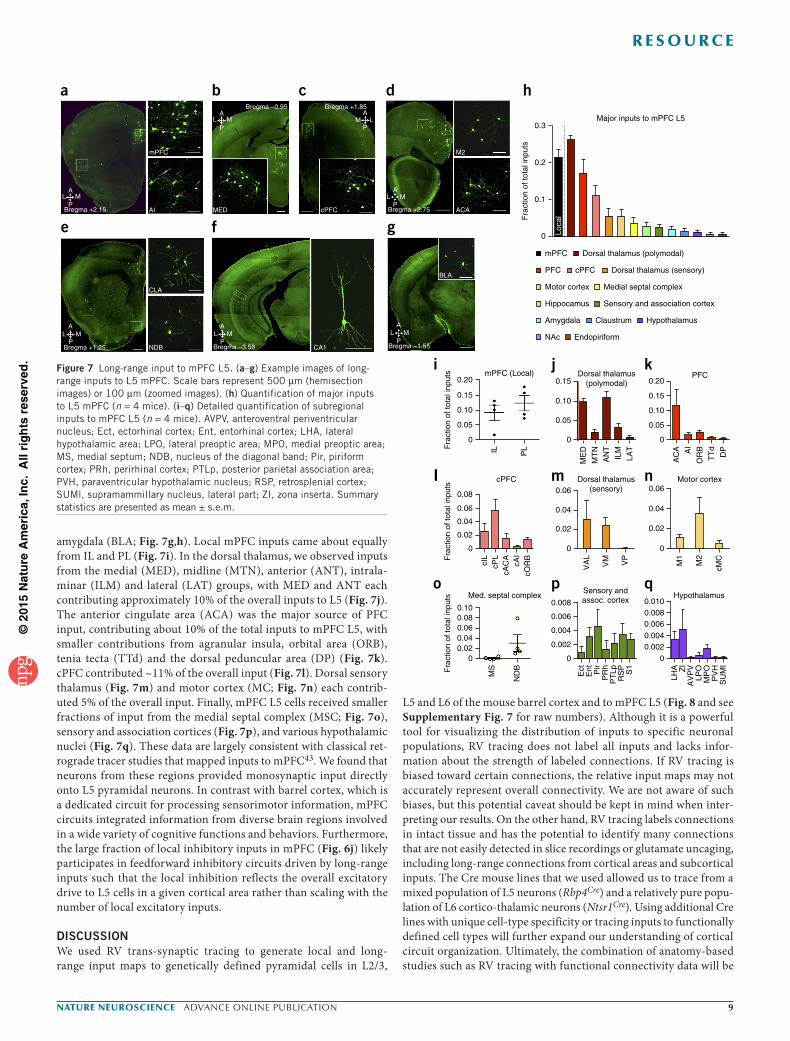
Major long-range inputs to L5 mPFC neurons originated from other prefrontal areas, including agranular insula (AI; Fig. 7a), dor-sal polymodal thalamic nuclei (~26%; Fig. 7b), contralateral mPFC (cPFC, ~11%; Fig. 7c) and motor areas (~5%; Fig. 7d), with more minor inputs from claustrum (CLA; Fig. 7e), CA1 cells through-out the D-V axis of the hippocampus (Fig. 7f), and the basolateral
a
d
g h
f
e2.3 mm
A P D V
0.4
0.5
0.3
0.2
0.1
0
A-P spread across sections D-V spread in central sections
b1.0
0.8
0.6
0.4
0.2
0.4
0.3
0.2
0.1
0
Layer
Laye
r
Fra
ctio
n of
Inpu
ts
MiddleDistance from center line (µm)
Dist. from densestSCs (µm)
1 0.1 0.09
00.50
21 3 5a 5b 6Layer
210
3 5a 5b 6
mPFCBC
*
**#
##
c
Fra
ctio
n of
sta
rter
cel
ls
0.8
0.6
0.4
0.2
0
Layer21 3 5a 5b 6
Fra
ctio
n of
sta
rter
cel
ls 0.6Gad+ inputs in a layer/
total Gad+ inputs
Gad
+ fr
actio
n of
loca
l inp
uts
0.4
0.2
0
Layer21 3 5a 5b 6
Fra
ctio
n of
inpu
ts
i j0.5
Gad+ inputs in alayer/ total inputs in
layer
0.2
0.4
0.3
0.1
0
0.2
0.4 *0.3
0.1
0
0
120,000
mPFC BC
mPFC BC
Loca
l fra
ctio
n of
tota
l inp
uts
k
0.2
0.4
*
0.8
1.0
0.6
0mPFC BC
Loca
l fra
ctio
n of
tota
l inp
uts
l
0.2 ***
0.1
0
0.3
0
mPFC
A-P spread
BC
Layer21 3 5a 5b 6
Fra
ctio
n of
inpu
ts
Fra
ctio
n of
loca
l inp
uts
6 5b 5a 3 2 1
Rabies-GFPTVA-mCherryDAPI
Rabies-GFPGad1/2
DAPI
PFC
TVA-mCherry
mPFC Merge Rabies-GFP Gad1/2
mPFC
23
5a5b
6
1 2 3 5a 5b 6 1 2 3 5a 5b 6
360 µm
SCs
Laye
r
123
5a5b
6
960720 480240 9607204802400
SCs
Side
0.4
0.3
0.2
0.1
0Fra
ctio
n of
Inpu
ts
Central
1 2 3 5a 5b 6 1 2 3 5a 5b 6
Peripheral
00.350
120
240
360
480
600
720
840
960
1,08
0
Dist. from centerline (µm)
Loca
l fra
ctio
n of
tota
l inp
uts
Neu
N+ c
ells
per
mm
3
m n
0.2
*
**
0.1
0
0.3
0.4
0
mPFC
D-V spread
BC
120
240
360
480
600
720
840
960
1,08
0
100,000
80,000
60,000
40,000
20,000
Figure 6 Local input to mPFC L5. (a) Low (left) and high (right) magnification example images of tracing from L5 mPFC neurons. Scale bar represents 200 µm. (b) Fraction of starter cells by layer. (c) Fraction of local inputs by layer (colored; SCs, 114 ± 33; total inputs, 2,641 ± 664; n = 4 mice; L1-L1, *P = 3.03 × 10⁻⁷; L3-L3, **P = 2.53 × 10⁻⁶; L5b-L5b, #P = 0.0002; L6-L6, ##P = 0.002; multiple t tests with Holm-Sidak correction for multiple comparisons (α = 0.05)) in comparison with barrel cortex (BC, gray, n = 8 mice). (d,e) Left, heat maps of distribution of starter cells (SCs, lower panel) and inputs (upper panel) in each layer along the (d) A-P or (e) D-V axis. Colors represent fraction of total mPFC cells according to the index at right. Bin widths are 120 µm. Right, fraction of mPFC inputs in central versus peripheral sections (d; n = 4 mice) or in middle versus side regions (e; n = 4 mice). (f) Tracing from L5 starter cells with Gad1 and Gad2 in situ hybridization. Arrows indicate Gad+ inputs. Scale bar represents 100 µm. (g) Fraction of starter cells by layer (n = 3 mice). (h) Fraction of total Gad+ cells by layer (n = 3 mice). (i) Gad+ fraction of total inputs in each layer (n = 3 mice). (j) Comparison of Gad+ fraction of local inputs to L5 mPFC versus L5 BC (mPFC, 0.24 ± 0.04, n = 3 mice; BC, 0.09 ± 0.008, n = 3 mice; *P = 0.03, Student’s t test). (k) Comparison of the local fraction of total inputs to mPFC and BC L5 (mPFC, 0.21 ± 0.02, n = 4 mice; BC, 0.79 ± 0.6, n = 8 mice; *P = 5.14 × 10⁻⁵, Student’s t test). (l) Spread of local inputs along the A-P axis in mPFC (n = 4 mice) or BC (n = 8 mice), presented as fraction of total inputs (240 µm, *P = 0.0009; 360 µm, **P = 0.0005; multiple t tests with Holm-Sidak correction for multiple comparisons (α = 0.05)). (m) Spread of local inputs along the D-V axis in mPFC (n = 4 mice) or BC (n = 8 mice), presented as fraction of total inputs (120 µm, *P = 0.004; 240 µm, **P = 0.0007; multiple t tests with Holm-Sidak correction for multiple comparisons (α = 0.05)). (n) Quantification of cell density based on NeuN staining (mPFC, 97,633 ± 9,010 cells per mm3, n = 5 sections from 2 mice; BC, 102,760 ± 4,876 cells per mm3, n = 8 sections from 3 mice; P = 0.59, Student’s t test). Summary statistics presented as mean ± s.e.m. See Supplementary Table 5 for numerical values. See Supplementary Table 6 for test results and P values.
amygdala (BLA; Fig. 7g,h). Local mPFC inputs came about equally from IL and PL (Fig. 7i). In the dorsal thalamus, we observed inputs from the medial (MED), midline (MTN), anterior (ANT), intrala-minar (ILM) and lateral (LAT) groups, with MED and ANT each contributing approximately 10% of the overall inputs to L5 (Fig. 7j). The anterior cingulate area (ACA) was the major source of PFC input, contributing about 10% of the total inputs to mPFC L5, with smaller contributions from agranular insula, orbital area (ORB), tenia tecta (TTd) and the dorsal peduncular area (DP) (Fig. 7k). cPFC contributed ~11% of the overall input (Fig. 7l). Dorsal sensory thalamus (Fig. 7m) and motor cortex (MC; Fig. 7n) each contrib-uted 5% of the overall input. Finally, mPFC L5 cells received smaller fractions of input from the medial septal complex (MSC; Fig. 7o), sensory and association cortices (Fig. 7p), and various hypothalamic nuclei (Fig. 7q). These data are largely consistent with classical ret-rograde tracer studies that mapped inputs to mPFC43. We found that neurons from these regions provided monosynaptic input directly onto L5 pyramidal neurons. In contrast with barrel cortex, which is a dedicated circuit for processing sensorimotor information, mPFC circuits integrated information from diverse brain regions involved in a wide variety of cognitive functions and behaviors. Furthermore, the large fraction of local inhibitory inputs in mPFC (Fig. 6j) likely participates in feedforward inhibitory circuits driven by long-range inputs such that the local inhibition reflects the overall excitatory drive to L5 cells in a given cortical area rather than scaling with the number of local excitatory inputs.
DISCUSSIONWe used RV trans-synaptic tracing to generate local and long-range input maps to genetically defined pyramidal cells in L2/3,
L5 and L6 of the mouse barrel cortex and to mPFC L5 (Fig. 8 and see Supplementary Fig. 7 for raw numbers). Although it is a powerful tool for visualizing the distribution of inputs to specific neuronal populations, RV tracing does not label all inputs and lacks infor-mation about the strength of labeled connections. If RV tracing is biased toward certain connections, the relative input maps may not accurately represent overall connectivity. We are not aware of such biases, but this potential caveat should be kept in mind when inter-preting our results. On the other hand, RV tracing labels connections in intact tissue and has the potential to identify many connections that are not easily detected in slice recordings or glutamate uncaging, including long-range connections from cortical areas and subcortical inputs. The Cre mouse lines that we used allowed us to trace from a mixed population of L5 neurons (Rbp4Cre) and a relatively pure popu-lation of L6 cortico-thalamic neurons (Ntsr1Cre). Using additional Cre lines with unique cell-type specificity or tracing inputs to functionally defined cell types will further expand our understanding of cortical circuit organization. Ultimately, the combination of anatomy-based studies such as RV tracing with functional connectivity data will be
AM L
P
Bregma +1.85
cPFC
c
AL M
P
AL M
P
Bregma +2.15
Bregma +1.25
AI
CLA
NDB
mPFC
a
e
AL M
P
AL M
P
Bregma –3.58
Bregma –0.95
MED
CA1
b
f
M2
ACA
AL M
P
BLA
AL M
PBregma –1.55
Bregma +2.75
d
g
cPFC
Fra
ctio
n of
tota
l inp
uts
Fra
ctio
n of
tota
l inp
uts
Fra
ctio
n of
tota
l inp
uts
0.20Dorsal thalamus
(polymodal)
Dorsal thalamus(sensory)
Motor cortex
0.15
0.10
0.05
0
i j kPFC
ILcI
L
PL
ME
D
MT
NA
NT
ILM
LAT
AC
A AI
0.15
0.10
0.05
0
0.20
0.15
0.10
0.05
0
OR
B
TT
d
DP
I m n
qpo
0.08
0.06
0.04
0.02
0
cPL
cAC
AcA
IcO
RB
VA
L
0.06
0.04
0.02
0
Med. septal complexSensory andassoc. cortex
Hypothalamus
0.100.008 0.010
0.0080.006
0.0040.002
0
0.006
0.004
0.002
0
Ect
Ent Pir
PR
hP
TLp
RS
P S1
LHA ZI
AV
PV
LPO
MP
OP
VH
SU
MI
0.080.060.040.02
0
MS
mPFC (Local)
ND
B
0.06
0.04
0.02
0
VM VP
M1
M2
cMC
h
Major inputs to mPFC L5
Fra
ctio
n of
tota
l inp
uts
0.3
0.2
0.1
0
mPFC Dorsal thalamus (polymodal)
PFC cPFC Dorsal thalamus (sensory)
Motor cortex Medial septal complex
Hippocamus Sensory and association cortex
NAc Endopiriform
Amygdala Claustrum Hypothalamus
Loca
l
Figure 7 Long-range input to mPFC L5. (a–g) Example images of long-range inputs to L5 mPFC. Scale bars represent 500 µm (hemisection images) or 100 µm (zoomed images). (h) Quantification of major inputs to L5 mPFC (n = 4 mice). (i–q) Detailed quantification of subregional inputs to mPFC L5 (n = 4 mice). AVPV, anteroventral periventricular nucleus; Ect, ectorhinal cortex; Ent, entorhinal cortex; LHA, lateral hypothalamic area; LPO, lateral preoptic area; MPO, medial preoptic area; MS, medial septum; NDB, nucleus of the diagonal band; Pir, piriform cortex; PRh, perirhinal cortex; PTLp, posterior parietal association area; PVH, paraventricular hypothalamic nucleus; RSP, retrosplenial cortex; SUMl, supramammillary nucleus, lateral part; ZI, zona inserta. Summary statistics are presented as mean ± s.e.m.
required to more completely understand the contributions of different connections to cortical information processing.
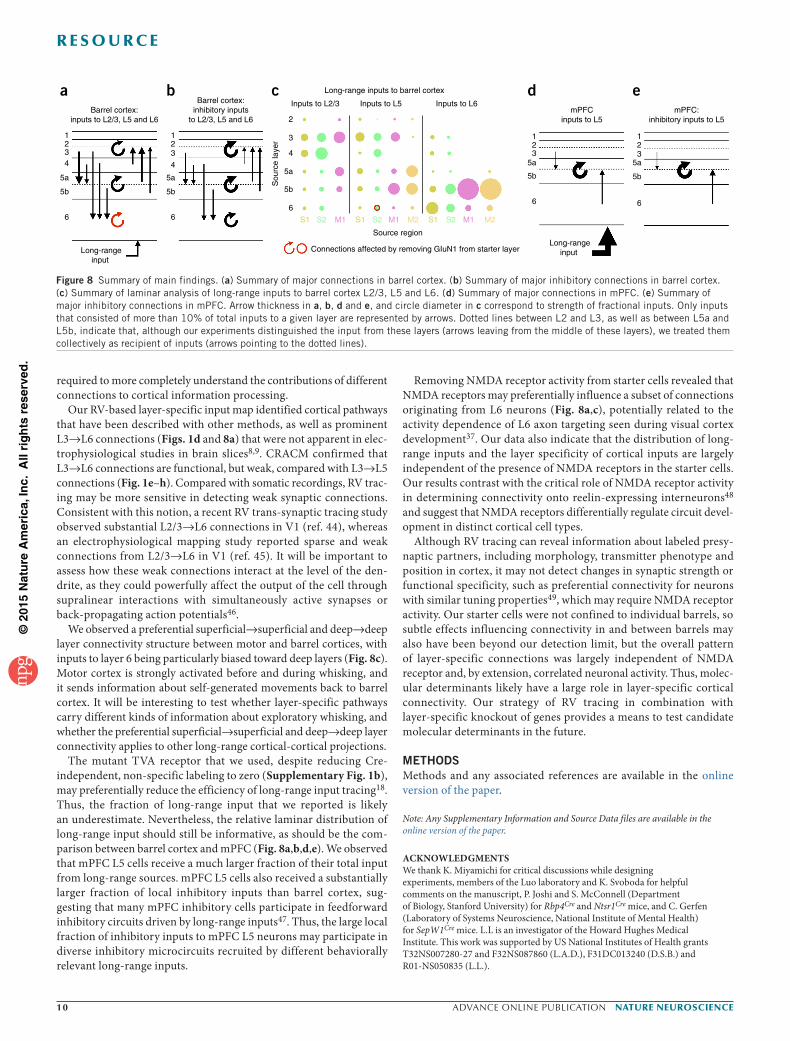
Our RV-based layer-specific input map identified cortical pathways that have been described with other methods, as well as prominent L3→L6 connections (Figs. 1d and 8a) that were not apparent in elec-trophysiological studies in brain slices8,9. CRACM confirmed that L3→L6 connections are functional, but weak, compared with L3→L5 connections (Fig. 1e–h). Compared with somatic recordings, RV trac-ing may be more sensitive in detecting weak synaptic connections. Consistent with this notion, a recent RV trans-synaptic tracing study observed substantial L2/3→L6 connections in V1 (ref. 44), whereas an electrophysiological mapping study reported sparse and weak connections from L2/3→L6 in V1 (ref. 45). It will be important to assess how these weak connections interact at the level of the den-drite, as they could powerfully affect the output of the cell through supralinear interactions with simultaneously active synapses or back-propagating action potentials46.
We observed a preferential superficial→superficial and deep→deep layer connectivity structure between motor and barrel cortices, with inputs to layer 6 being particularly biased toward deep layers (Fig. 8c). Motor cortex is strongly activated before and during whisking, and it sends information about self-generated movements back to barrel cortex. It will be interesting to test whether layer-specific pathways carry different kinds of information about exploratory whisking, and whether the preferential superficial→superficial and deep→deep layer connectivity applies to other long-range cortical-cortical projections.
The mutant TVA receptor that we used, despite reducing Cre- independent, non-specific labeling to zero (Supplementary Fig. 1b), may preferentially reduce the efficiency of long-range input tracing18. Thus, the fraction of long-range input that we reported is likely an underestimate. Nevertheless, the relative laminar distribution of long-range input should still be informative, as should be the com-parison between barrel cortex and mPFC (Fig. 8a,b,d,e). We observed that mPFC L5 cells receive a much larger fraction of their total input from long-range sources. mPFC L5 cells also received a substantially larger fraction of local inhibitory inputs than barrel cortex, sug-gesting that many mPFC inhibitory cells participate in feedforward inhibitory circuits driven by long-range inputs47. Thus, the large local fraction of inhibitory inputs to mPFC L5 neurons may participate in diverse inhibitory microcircuits recruited by different behaviorally relevant long-range inputs.
Removing NMDA receptor activity from starter cells revealed that NMDA receptors may preferentially influence a subset of connections originating from L6 neurons (Fig. 8a,c), potentially related to the activity dependence of L6 axon targeting seen during visual cortex development37. Our data also indicate that the distribution of long-range inputs and the layer specificity of cortical inputs are largely independent of the presence of NMDA receptors in the starter cells. Our results contrast with the critical role of NMDA receptor activity in determining connectivity onto reelin-expressing interneurons48 and suggest that NMDA receptors differentially regulate circuit devel-opment in distinct cortical cell types.
Although RV tracing can reveal information about labeled presy-naptic partners, including morphology, transmitter phenotype and position in cortex, it may not detect changes in synaptic strength or functional specificity, such as preferential connectivity for neurons with similar tuning properties49, which may require NMDA receptor activity. Our starter cells were not confined to individual barrels, so subtle effects influencing connectivity in and between barrels may also have been beyond our detection limit, but the overall pattern of layer-specific connections was largely independent of NMDA receptor and, by extension, correlated neuronal activity. Thus, molec-ular determinants likely have a large role in layer-specific cortical connectivity. Our strategy of RV tracing in combination with layer-specific knockout of genes provides a means to test candidate molecular determinants in the future.
METhODSMethods and any associated references are available in the online version of the paper.
Note: Any Supplementary Information and Source Data files are available in the online version of the paper.
AcknowledgmenTSWe thank K. Miyamichi for critical discussions while designing experiments, members of the Luo laboratory and K. Svoboda for helpful comments on the manuscript, P. Joshi and S. McConnell (Department of Biology, Stanford University) for Rbp4Cre and Ntsr1Cre mice, and C. Gerfen (Laboratory of Systems Neuroscience, National Institute of Mental Health) for SepW1Cre mice. L.L is an investigator of the Howard Hughes Medical Institute. This work was supported by US National Institutes of Health grants T32NS007280-27 and F32NS087860 (L.A.D.), F31DC013240 (D.S.B.) and R01-NS050835 (L.L.).
aBarrel cortex:
inputs to L2/3, L5 and L6
Long-rangeinput
1234
5a
5b
6
bBarrel cortex:
inhibitory inputsto L2/3, L5 and L6
123
4
5a
5b
6
c
Connections affected by removing GIuN1 from starter layer
Source region
Sou
rce
laye
r
Long-range inputs to barrel cortex
Inputs to L2/3 Inputs to L5 Inputs to L6
3
4
5a
5b
2
6
S1 S1S1S2 S2S2M1 M1 M1M2 M2
Long-rangeinput
123
5a
5b
6
dmPFC
inputs to L5
123
5a
5b
6
emPFC:
inhibitory inputs to L5
Figure 8 Summary of main findings. (a) Summary of major connections in barrel cortex. (b) Summary of major inhibitory connections in barrel cortex. (c) Summary of laminar analysis of long-range inputs to barrel cortex L2/3, L5 and L6. (d) Summary of major connections in mPFC. (e) Summary of major inhibitory connections in mPFC. Arrow thickness in a, b, d and e, and circle diameter in c correspond to strength of fractional inputs. Only inputs that consisted of more than 10% of total inputs to a given layer are represented by arrows. Dotted lines between L2 and L3, as well as between L5a and L5b, indicate that, although our experiments distinguished the input from these layers (arrows leaving from the middle of these layers), we treated them collectively as recipient of inputs (arrows pointing to the dotted lines).
AUTHoR conTRIBUTIonSL.A.D., D.S.B. and L.L. designed the experiments. L.A.D. and D.S.B. performed and analyzed layer-specific trans-synaptic tracing experiments. L.A.D. performed slice recording and CRACM experiments. K.D. performed and analyzed in situ hybridization experiments. L.A.D., D.S.B. and L.L wrote the manuscript.
comPeTIng FInAncIAl InTeReSTSThe authors declare no competing financial interests.
Reprints and permissions information is available online at http://www.nature.com/reprints/index.html.
1. Woolsey, T.A. & Van der Loos, H. The structural organization of layer IV in the somatosensory region (SI) of mouse cerebral cortex. The description of a cortical field composed of discrete cytoarchitectonic units. Brain Res. 17, 205–242 (1970).
2. Simons, D.J. Response properties of vibrissa units in rat SI somatosensory neocortex. J. Neurophysiol. 41, 798–820 (1978).
3. Guo, Z.V. et al. Flow of cortical activity underlying a tactile decision in mice. Neuron 81, 179–194 (2014).
4. Fuster, J.M. The prefrontal cortex: Anatomy, Physiology, and Neuropsychology of the Frontal Lobe (Academic Press, Philadelphia, 2008).
5. Douglas, R.J.M., Martin, K.A.C. & Whitteridge, D. A canonical microcircuit for the neocortex. Neural Comput. 1, 480–488 (1989).
6. Thomson, A.M. & Lamy, C. Functional maps of neocortical local circuitry. Front Neurosci 1, 19–42 (2007).
7. Douglas, R.J. & Martin, K.A. Neuronal circuits of the neocortex. Annu. Rev. Neurosci. 27, 419–451 (2004).
8. Lefort, S., Tomm, C., Floyd Sarria, J.C. & Petersen, C.C. The excitatory neuronal network of the C2 barrel column in mouse primary somatosensory cortex. Neuron 61, 301–316 (2009).
9. Hooks, B.M. et al. Laminar analysis of excitatory local circuits in vibrissal motor and sensory cortical areas. PLoS Biol. 9, e1000572 (2011).
10. Gilbert, C.D. & Wiesel, T.N. Morphology and intracortical projections of functionally characterised neurones in the cat visual cortex. Nature 280, 120–125 (1979).
11. Brown, S.P. & Hestrin, S. Intracortical circuits of pyramidal neurons reflect their long-range axonal targets. Nature 457, 1133–1136 (2009).
12. Callaway, E.M. & Katz, L.C. Photostimulation using caged glutamate reveals functional circuitry in living brain slices. Proc. Natl. Acad. Sci. USA 90, 7661–7665 (1993).
13. Hooks, B.M. et al. Organization of cortical and thalamic input to pyramidal neurons in mouse motor cortex. J. Neurosci. 33, 748–760 (2013).
14. Kätzel, D., Zemelman, B.V., Buetfering, C., Wolfel, M. & Miesenbock, G. The columnar and laminar organization of inhibitory connections to neocortical excitatory cells. Nat. Neurosci. 14, 100–107 (2011).
15. Petreanu, L., Huber, D., Sobczyk, A. & Svoboda, K. Channelrhodopsin-2–assisted circuit mapping of long-range callosal projections. Nat. Neurosci. 10, 663–668 (2007).
16. Wickersham, I.R. et al. Monosynaptic restriction of trans-synaptic tracing from single, genetically targeted neurons. Neuron 53, 639–647 (2007).
17. Callaway, E.M. & Luo, L. Monosynaptic circuit tracing with glycoprotein-deleted rabies viruses. J. Neurosci. 35, 8979–8985 (2015).
18. Miyamichi, K. et al. Dissecting local circuits: parvalbumin interneurons underlie broad feedback control of olfactory bulb output. Neuron 80, 1232–1245 (2013).
19. Olsen, S.R., Bortone, D.S., Adesnik, H. & Scanziani, M. Gain control by layer six in cortical circuits of vision. Nature 483, 47–52 (2012).
20. Kim, J., Matney, C.J., Blankenship, A., Hestrin, S. & Brown, S.P. Layer 6 corticothalamic neurons activate a cortical output layer, layer 5a. J. Neurosci. 34, 9656–9664 (2014).
21. Greig, L.C., Woodworth, M.B., Galazo, M.J., Padmanabhan, H. & Macklis, J.D. Molecular logic of neocortical projection neuron specification, development and diversity. Nat. Rev. Neurosci. 14, 755–769 (2013).
22. Gerfen, C.R., Paletzki, R. & Heintz, N. GENSAT BAC cre-recombinase driver lines to study the functional organization of cerebral cortical and basal ganglia circuits. Neuron 80, 1368–1383 (2013).
24. Feldmeyer, D. Excitatory neuronal connectivity in the barrel cortex. Front Neuroanat. 6, 24 (2012).
25. Zhang, Z.W. & Deschenes, M. Intracortical axonal projections of lamina VI cells of the primary somatosensory cortex in the rat: a single-cell labeling study. J. Neurosci. 17, 6365–6379 (1997).
26. Isaacson, J.S. & Scanziani, M. How inhibition shapes cortical activity. Neuron 72, 231–243 (2011).
27. Li, J. & Schwark, H.D. Distribution and proportions of GABA-immunoreactive neurons in cat primary somatosensory cortex. J. Comp. Neurol. 343, 353–361 (1994).
28. Welker, E., Hoogland, P.V. & Van der Loos, H. Organization of feedback and feedforward projections of the barrel cortex: a PHA-L study in the mouse. Exp. Brain Res. 73, 411–435 (1988).
29. Porter, L.L. & White, E.L. Afferent and efferent pathways of the vibrissal region of primary motor cortex in the mouse. J. Comp. Neurol. 214, 279–289 (1983).
30. Mao, T. et al. Long-range neuronal circuits underlying the interaction between sensory and motor cortex. Neuron 72, 111–123 (2011).
31. Constantinople, C.M. & Bruno, R.M. Deep cortical layers are activated directly by thalamus. Science 340, 1591–1594 (2013).
32. Wimmer, V.C., Bruno, R.M., de Kock, C.P., Kuner, T. & Sakmann, B. Dimensions of a projection column and architecture of VPM and POm axons in rat vibrissal cortex. Cereb. Cortex 20, 2265–2276 (2010).
33. Beierlein, M. & Connors, B.W. Short-term dynamics of thalamocortical and intracortical synapses onto layer 6 neurons in neocortex. J. Neurophysiol. 88, 1924–1932 (2002).
34. Viaene, A.N., Petrof, I. & Sherman, S.M. Synaptic properties of thalamic input to layers 2/3 and 4 of primary somatosensory and auditory cortices. J. Neurophysiol. 105, 279–292 (2011).
35. Katz, L.C. & Shatz, C.J. Synaptic activity and the construction of cortical circuits. Science 274, 1133–1138 (1996).
36. Bi, G. & Poo, M. Synaptic modification by correlated activity: Hebb’s postulate revisited. Annu. Rev. Neurosci. 24, 139–166 (2001).
37. Dantzker, J.L. & Callaway, E.M. The development of local, layer-specific visual cortical axons in the absence of extrinsic influences and intrinsic activity. J. Neurosci. 18, 4145–4154 (1998).
38. Datwani, A., Iwasato, T., Itohara, S. & Erzurumlu, R.S. NMDA receptor–dependent pattern transfer from afferents to postsynaptic cells and dendritic differentiation in the barrel cortex. Mol. Cell. Neurosci. 21, 477–492 (2002).
39. Espinosa, J.S., Wheeler, D.G., Tsien, R.W. & Luo, L. Uncoupling dendrite growth and patterning: single-cell knockout analysis of NMDA receptor 2B. Neuron 62, 205–217 (2009).
40. Iwasato, T. et al. Cortex-restricted disruption of NMDAR1 impairs neuronal patterns in the barrel cortex. Nature 406, 726–731 (2000).
41. De Felipe, J., Marco, P., Fairen, A. & Jones, E.G. Inhibitory synaptogenesis in mouse somatosensory cortex. Cereb. Cortex 7, 619–634 (1997).
42. White, E.L., Weinfeld, L. & Lev, D.L. A survey of morphogenesis during the early postnatal period in PMBSF barrels of mouse SmI cortex with emphasis on barrel D4. Somatosens. Mot. Res. 14, 34–55 (1997).
43. Hoover, W.B. & Vertes, R.P. Anatomical analysis of afferent projections to the medial prefrontal cortex in the rat. Brain Struct. Funct. 212, 149–179 (2007).
44. Vélez-Fort, M. et al. The stimulus selectivity and connectivity of layer six principal cells reveals cortical microcircuits underlying visual processing. Neuron 83, 1431–1443 (2014).
45. Zarrinpar, A. & Callaway, E.M. Local connections to specific types of layer 6 neurons in the rat visual cortex. J. Neurophysiol. 95, 1751–1761 (2006).
46. London, M. & Hausser, M. Dendritic computation. Annu. Rev. Neurosci. 28, 503–532 (2005).
47. Dilgen, J., Tejeda, H.A. & O’Donnell, P. Amygdala inputs drive feedforward inhibition in the medial prefrontal cortex. J. Neurophysiol. 110, 221–229 (2013).
48. De Marco García, N.V., Priya, R., Tuncdemir, S.N., Fishell, G. & Karayannis, T. Sensory inputs control the integration of neurogliaform interneurons into cortical circuits. Nat. Neurosci. 18, 393–401 (2015).
49. Ko, H. et al. Functional specificity of local synaptic connections in neocortical networks. Nature 473, 87–91 (2011).
50. Paxinos, G. & Franklin, K.B.J. The Mouse Brain in Stereotaxic Coordinates, Second Edition (Academic Press, 2001).
ONLINE METhODSmice. All animal procedures followed animal care guidelines approved by Stanford University’s Administrative Panel on Laboratory Animal Care (APLAC). Both male and female mice from mixed CD1 and C57/Bl6 backgrounds were used. Mice were group housed. SepW1Cre mice22 were obtained from the US National Institutes of Health, Rbp4Cre and Ntsr1Cre mice51 were obtained from the Mutant Mouse Regional Resource Center, GluN1fl/fl mice52 and Cre-dependent tdTomato reporter RosaAi14 mice53 were obtained from the Jackson Laboratories. To characterize Cre drivers, Rbp4Creand Ntsr1Cre were crossed to RosaAi14 mice (Supplementary Fig. 2). While SepW1Cre allowed us to generate L2/3-restricted starter cells at P21 (Fig. 3), crossing SepW1Cre to RosaAi14 mice resulted in tdTo-mato labeling throughout the entire brain (data not shown), suggesting that SepW1Cre is active in most cells early in development and becomes layer restricted with age. Thus, to characterize L2/3 cells defined by SepW1Cre, we injected large volumes of AAV (CAG-FLEx-TVA66T-mCherry) into barrel cortex at P25 and analyzed the expression pattern at P40. The GluN1∆ allele was generated by cross-ing GluN1fl/fl to a germline Cre (hprtCre). To study the effect of GluN1 knockout in L2/3, we crossed GluN1fl/fl to GluN1∆/+ mice and performed in utero elec-troporation of a Cre-expressing plasmid at E16. To study the effects of GluN1 knockout in L5 and L6, we generated Rbp4Cre;GluN1∆/+ and Ntsr1Cre;GluN1∆/+ mice, respectively, and crossed them to GluN1fl/fl mice. GluN1fl/+ mice were combined with GluN1+/+ mice in the control group for all analyses.
dnA constructs. DNAs encoding Cre-2A-BFP-3x Myc were subcloned in frame into the pCAG vector. Briefly, pCAG was digested with BsrG1 and EcoR1 and Cre and 2A-BFP-3x myc fragments were subcloned in simultaneously using an InFusion kit (Clontech).
In utero electroporation. Timed-pregnant mice (E16) were anaesthetized with 3% isoflurane (vol/vol) and given preoperative injection of Buprenex at 0.05–0.1 mg per kg. The abdomen was swabbed with iodine. A small vertical incision was made in the skin and abdominal wall and embryos were gently exposed. Each embryo was injected with 1–2 µl of DNA solution and 0.01% Fast Green (vol/vol) using a pressure-controlled glass pipette. After each injection, the embryos were moistened with phosphate-buffered saline (PBS) and voltage steps via tweez-ertrodes (BTX, 5 mm round, platinum, BTX electroporator) were applied at a 45° angle with respect to the interaural line to target barrel cortex. Voltage was 36 V for five 50-ms pulses at 1 Hz as described previously54. The embryos were returned to the abdomen, which was sutured, followed by suturing of the skin. The procedure typically lasted 20 min.
Viral procedures. AAV vectors containing CAG-FLEx-G (2 × 10¹¹ genomic copies (GC) per ml) and CAG-FLEx-TVA66T-mCherry (1012 GC per ml) were described previously18 and produced by the University of North Carolina viral vector core. EnvA-pseduotyped RVdG (1010 IU per ml) was produced in-house based on established procedures55. For trans-synaptic labeling, 0.1 µl of 1:1 mix-ture of AAV2 or AAV8 CAG-FLEx-G and AAV2 CAG-FLEx-TVA66T-mCherry was injected into the brain at P21 by using a stereotactic apparatus (KOPF). During surgery, animals were anesthetized with 65 mg per kg ketamine and 13 mg per kg xylazine (Lloid Laboratories). For barrel cortex injections, the pipette was placed 0.25 mm posterior and 3.1 mm lateral from the bregma and 0.25 or 0.4 mm from the brain surface to target L2/3 or L5, respectively, or 0.7 mm posterior and 3.5 mm lateral from bregma and 0.85 mm from the brain surface for L6. For mPFC injections, the needle was placed 1.8 mm anterior, 0.3 mm lateral, and 2.5 mm deep from bregma. After recovery, animals were housed in regular 12-h dark/light cycle with food and water ad libitum. 2 weeks later, 0.5 µl of EnvA-pseudotyped RVdG was injected into the same brain location under anesthesia. After recovery, animals were housed in a biosafety room for 5 d to allow RVdG infection, trans-synaptic spread, and expression of sufficient amount of GFP to label presynaptic cells.
Histology. Animals were perfused transcardially with PBS followed by 4% paraformaldehyde (PFA, vol/vol). Brains were dissected, post-fixed in 4% PFA for 12–24 h, and placed in 30% sucrose (vol/vol) for 24–48 h. They were then embedded in Optimum Cutting Temperature (OCT, Tissue Tek) and stored at −80 °C until sectioning. 60-µm floating sections were collected into PBS. For Cre line characterization and layer analysis, sections were incubated in 0.3% PBST
(vol/vol) and 10% donkey serum (vol/vol) for 1 h and then stained with mouse anti-NeuN (Millipore MAB377, 1:1,000), rat anti-Ctip2 (Abcam ab18465, 1:200) or rabbit anti-Cux1 (Santa Cruz SC-13024, 1:500) for 1–4 nights at 4 °C in 0.3% PBST and 5% donkey serum. All sections washed 3 × 10 min in PBS and also stained with NeuroTrace Blue (1:1,000) in 0.3% PBST for 2 h, followed by DAPI (1:10,000 of 5 mg ml−1, Sigma-Aldrich) in PBS for 10–15 min, and then washed once more with PBS before mounting onto Superfrost Plus slides and coverslip-ping with Fluorogel (Electron Microscopy Sciences). The sections were imaged at 5× using a Leica Ariol Slide Scanner microscope with an SL200 slide loader, and scanner images were processed with custom software56.
In situ hybridization. Gad1 and Gad2 in situ hybrization probes were prepared and hybridized in SepW1Cre (L2/3), Rbp4Cre (L5) and Ntsr1Cre (L6) trans-synaptic tracing brains as previously described56. Five to seven starter cell containing sections were analyzed per brain. Images were collected on a Zeiss 780 confocal microscope.
electrophysiology. At P28, the brain was removed and placed in ice-cold carbogenated slicing artificial cerebrospinal fluid (ACSF) that contains (in mM) 83 NaCl, 2.5 KCl, 1 NaH2PO4, 26.2 NaHCO3, 22 glucose, 72 sucrose, 0.5 CaCl2, and 3.3 MgSO4. We cut 300-µm coronal sections on a Leica vibratome. Slices were allowed to recover at 31 °C for 40 min and then at 23–25 °C for 30 min to 6 h. Slices were then placed in carbogenated recording ACSF (119 NaCl, 2.5 KCl, 26 NaHCO3, 1 NaH2PO4, 1.5 MgSO4, 2.5 CaCl2, and 11 glucose, all in mM) that contained 50 µM picrotoxin (Sigma). For CRACM experiments, TTX (Tocris, 1 µM) and 4-AP (Sigma, 100 µM) were also included in the record-ing solution. Signals were recorded with a 5×gain, low-pass filtered at 2 kHz, digitized at 10 kHz (Molecular Devices Multiclamp 700B), and analyzed with pClamp 10 (Molecular Devices). Whole-cell recordings were made using 3–5 MΩ pipettes filled with an internal solution that contained (in mM) 123 cesium gluconate, 8 NaCl, 1 CaCl2, 10 EGTA, 10 HEPES, and 10 glucose, pH 7.3 with CsOH, 280–290 mOsm. Series resistance (Rs) and input resistance (Rin) were monitored throughout the experiment by measuring the capacitive transient and steady-state deñection, respectively, in response to a −5-mV test pulse. Responses were evoked by stimulating the white matter with a platinum two-contact clus-ter electrode (FHC) 100–200 µm lateral to the recording site, or for CRACM experiments, by photostimulating ChR2+ axon terminals with an optical fiber coupled to a diode-pumped solid-state 473 laser positioned ~300 µm from the recording site. Cells were clamped at −60 mV to measure GluA (AMPA-receptor)- mediated excitatory postsynaptic currents (EPSC) and then at +40 mV to measure a compound EPSC that was quantified at 50 ms after stimulus onset, at which point the GluA-mediated currents had largely decayed. Analysis was based on the average of ten sweeps. mCherry- and tdTomato-positive L6 cells were visually identified based on red fluorescence (Olympus BX51WI).
data analysis. Regions were identified based on DAPI and NeuroTrace signal with reference to an atlas50. Barrel cortex was identified based on the presence of L4 barrels visible with nuclear stains. S1body was adjacent to barrel cortex and had a thick L4, but lacked barrel structures. Similarly, S2 was identified adjacent and ventral to S1body based on the reference atlas. M1 and M2 were identified based on their location as defined by the reference atlas, and characterized by the disap-pearance of L4 and expansion of L5. M2 was flanked by the cingulate area on the medial side, and M1 was flanked by S1body on the lateral side57. Finally, thalamic nuclei were defined based on the reference atlas with aid from nuclear stains. Dorsal polymodal thalamus groups were defined based on the Allen Reference Atlas (Allen Institute for Brain Science, http://mouse.brain-map.org/).
Data was analyzed using custom MatLab software (code available from the authors on request). All GFP-labeled cells were clicked by the user. Section order was maintained during tissue processing and imaging, so each cell had coordi-nates specifying the anterior-posterior position within the brain, and the precise location within that section. For each section, the pial surface of the region of interest was outlined, and the lower boundary of each layer was identified based on differences in the density of DAPI staining. The distance-to-pia for every cell was calculated based on its coordinates, and layer identity was assigned by com-paring this distance to the defined layer boundaries. To boost confidence in our layer-assignments, we stained BC and mPFC sections for neuronal markers for L2/3/4 (Cux1) and 5b/6 (Ctip2) and calculated layer boundaries based on marker
expression patterns. In both areas, DAPI-based layer assignments were consistent with neuronal marker-based assignments (Supplementary Figs. 1b and 6a).
To generate A-P heat maps, inputs were combined into 120-µm bins, and divided by the total cells in barrel cortex. Distributions were aligned between animals on the bin with the most starter cells. The M-L analysis was limited to the sections that contained 95% of the starter cells. The median center of mass for inputs in each layer was calculated within each section, and the center line was projected through the centers of mass. Distance-to-center was meas-ured for every cell as the minimum distance to the center line, and given a sign to indicate medial or lateral direction from center. Distances were combined across sections within each animal. Middle cells were defined as those with distances-to-center within the range containing 95% of the starter cells. Side cells were those with distances-to-center outside this range. To generate the M-L heat maps, cells were combined into 120 µm bins centered on the center line, and combined across sections within each animal. Cell counts for each bin were divided by the total number of cells in the sections analyzed, and fractions for each bin were averaged across animals. A-P and M-L heat maps both show the average fraction of cells per bin across all animals. D-V heat maps for mPFC were generated identically to the M-L heat maps. Statistics and graphing were performed using Prism software (GraphPad). Data was analyzed blind to geno-type. Brains with inefficient tracing (<100 inputs), or major tissue damage were excluded from analysis.
Statistical analyses. A supplementary methods checklist is available summarizing statistical tests and results. Data randomization was not applicable to our study,
and no statistical methods were used to predetermine sample sizes but our sample sizes are similar to those reported in previous publications18. Data distributions were assumed to be normal but were not formally tested. When performing multiple t tests, statistical significance was determined using the Holm-Sidak method, with alpha = 5%. Each row was analyzed individually, without assuming a consistent s.d. All t tests were two-sided. For a complete list of statistical tests and P values, see Supplementary Table 6.
A Supplementary methods checklist is available.
51. Gong, S. et al. Targeting Cre recombinase to specific neuron populations with bacterial artificial chromosome constructs. J. Neurosci. 27, 9817–9823 (2007).
52. Tsien, J.Z., Huerta, P.T. & Tonegawa, S. The essential role of hippocampal CA1 NMDA receptor–dependent synaptic plasticity in spatial memory. Cell 87, 1327–1338 (1996).
53. Madisen, L. et al. A robust and high-throughput Cre reporting and characterization system for the whole mouse brain. Nat. Neurosci. 13, 133–140 (2010).
54. Navarro-Quiroga, I., Chittajallu, R., Gallo, V. & Haydar, T.F. Long-term, selective gene expression in developing and adult hippocampal pyramidal neurons using focal in utero electroporation. J. Neurosci. 27, 5007–5011 (2007).
55. Osakada, F. & Callaway, E.M. Design and generation of recombinant rabies virus vectors. Nat. Protoc. 8, 1583–1601 (2013).
56. Weissbourd, B. et al. Presynaptic partners of dorsal raphe serotonergic and GABAergic neurons. Neuron 83, 645–662 (2014).
57. Brecht, M. et al. Organization of rat vibrissa motor cortex and adjacent areas according to cytoarchitectonics, microstimulation, and intracellular stimulation of identified cells. J. Comp. Neurol. 479, 360–373 (2004).