131 30 th International AVL Conference “Engine & Environment”, June 7 th - 8 th , 2018, Graz, Austria MOTOR & UMWELT 2018 ENGINE & ENVIRONMENT 2018 T. Kumar Prasad C. Nandagopalan, Mahindra & Mahindra Ltd CONNECTIVITY – TRANSFORMING THE DRIVE EXPERIENCE
Transcript
13130th International AVL Conference “Engine & Environment”, June 7th - 8th, 2018, Graz, Austria
MOTOR & UMWELT 2018
ENGINE & ENVIRONMENT 2018
T. Kumar Prasad
C. Nandagopalan, Mahindra & Mahindra Ltd
CONNECTIVITY – TRANSFORMING THE DRIVE EXPERIENCE
132 30th International AVL Conference “Engine & Environment”, June 7th - 8th, 2018, Graz, Austria
ABSTRACTIn the past few decades, fuel improvement and emission reduction technologies were primarily focused on technological upgradation of internal combustion engine based powertrains. Futuristic technological upgrades on powertrains looks challenging in terms of cost and complexity. Alternate avenues need to be looked at for improving the overall drive efficiency and the experience. With increasing bandwidth and availability of internet, connected cars are becoming more reality. Connecting the car with rest of the ecosystem opens plethora of opportunities to the automotive manufacturers for driving synergy and reducing energy wastage in holistic manner. In this paper, a case study is being presented wherein a connected car technology named Ecosense has revolutionalised the way of driving leading to significant improvement in fuel economy and reduction in overall emissions.
INTRODUCTIONTechnologies for improving fuel efficiency has evolved rapidly and has almost reached a saturation state at least in terms of affordability. This mandates innovative approaches for improving fuel economy of vehicles and reducing environmental hazards. Despite offering state of the art technologies towards improvement of fuel economy, to a major extent, the actual realization depends on how the vehicle is driven. Studies by Petroleum Conservation and Research Association (PCRA), India indicate fuel can be conserved in the range of 20~30% by
adapting better driving. Customer surveys indicate drivers are not aware and do not reflect on their driving style and impact on fuel economy. Also for a driver, it is very difficult to comprehend and improve his/her driving skills unless scope for improvement is clearly identified and systematic feedbacks are provided. This provided us an opportunity to continuously monitor the driving behavior and visually present the driving pattern by connecting to the user to make him/her understand the driving style and its relationship with fuel economy.
Ecosense is a “first of its kind” technology, developed in-house which encourages to drive the vehicle in an eco-friendly way. Ecosense evaluates the driving style by monitoring key parameters
like speed, gear selection, acceleration, idling, aggressive braking and clutch override and presents an ecoscore to the user. The ecoscore (average and instantaneous) displayed on the infotainment screen of the vehicle signifies how well the vehicle is being driven. Also, the scores of key driving parameters like speed, gear selection, acceleration and idling are graphically presented to the user to better understand his/her driving style. The user is provided with a trip specific drive profile & ecoscore. Every trip is recorded and presented with drive summaries of start/end location, ecoscore, fuel economy, trip duration, trip distance, top speed and average speed. Ecosense system receives inputs on various vehicle parameters through CAN bus, process them through in-built algorithms and displays information intuitively to the user.
The drive summary is transferred to smart phone and presented using a mobile application. The drive summary is also transferred from the mobile to the website server via mobile data services. This enables driver to understand the scope for improvement and accordingly he/she can change the driving style to improve fuel economy and reduce emissions.
Ecosense also connects users and cars through mobile app which is utile, informative and fun to experience. The relevant information from the vehicle is uploaded through mobile phone to the cloud. To make things intuitive and interesting to use, the Ecosense information is complemented with a monthly-ranking activity which is shared amongst user fraternity. This paves way for more participation and instant success. Also from the cloud, users can access the data through a secured login and view live trip information, monthly trip details, recent trip summary, trip history, specific drive recommendations and audio-visual manuals to understand better driving.
The novel system architecture (patent applied for) comprises of Infotainment system connected with other electronic control units through Controller Area Network (CAN). The Infotainment system receives various vehicle parameters through CAN, analyses and presents the ecoscore on the infotainment display. The trip information is also communicated to mobile application through Bluetooth. The mobile application facilitates the Ecosense data to server and social media sharing. The uploaded data on server is always accessible to the user through internet. The major advantage
13330th International AVL Conference “Engine & Environment”, June 7th - 8th, 2018, Graz, Austria
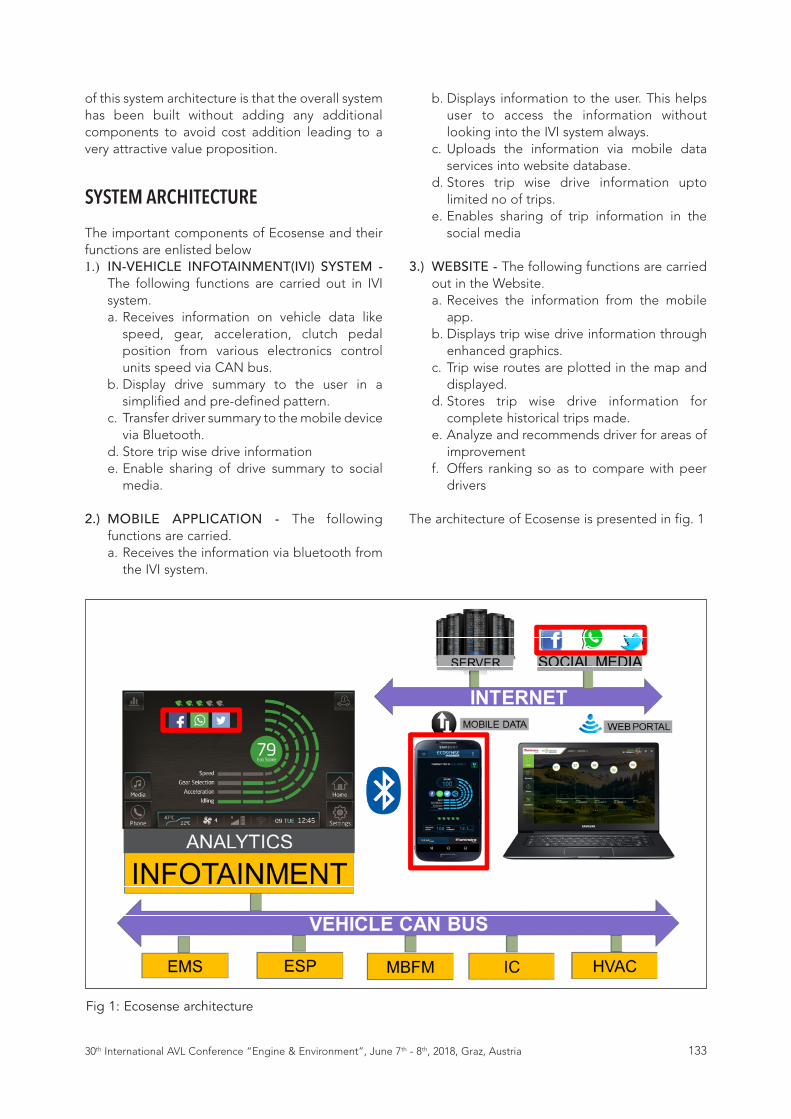
of this system architecture is that the overall system has been built without adding any additional components to avoid cost addition leading to a very attractive value proposition.
SYSTEM ARCHITECTUREThe important components of Ecosense and their functions are enlisted below1.) IN-VEHICLE INFOTAINMENT(IVI) SYSTEM -
The following functions are carried out in IVI system. a. Receives information on vehicle data like
speed, gear, acceleration, clutch pedal position from various electronics control units speed via CAN bus.
b. Display drive summary to the user in a simplified and pre-defined pattern.
c. Transfer driver summary to the mobile device via Bluetooth.
d. Store trip wise drive information e. Enable sharing of drive summary to social
media.
2.) MOBILE APPLICATION - The following functions are carried. a. Receives the information via bluetooth from
the IVI system.
b. Displays information to the user. This helps user to access the information without looking into the IVI system always.
c. Uploads the information via mobile data services into website database.
d. Stores trip wise drive information upto limited no of trips.
e. Enables sharing of trip information in the social media
3.) WEBSITE - The following functions are carried out in the Website. a. Receives the information from the mobile
app. b. Displays trip wise drive information through
enhanced graphics. c. Trip wise routes are plotted in the map and
displayed.d. Stores trip wise drive information for
complete historical trips made. e. Analyze and recommends driver for areas of
improvementf. Offers ranking so as to compare with peer
drivers
The architecture of Ecosense is presented in fig. 1
Fig 1: Ecosense architectureClick to edit Master title style
134 30th International AVL Conference “Engine & Environment”, June 7th - 8th, 2018, Graz, Austria
KEY DRIVING PARAMETERS There are numerous factors which influences the realization of maximum fuel economy when the vehicle is driven in a real world scenario. Some of the important factors are vehicle design/weight, engine configuration, vehicle age, aerodynamics, tire pressure, atmospheric pressure, ambient temperature etc. Besides these factors, the driving profile is one of the most important factors which has huge impact on the fuel economy. The driving pattern has the potential to extract maximum on-road fuel economy and significantly reduce emissions [1]. The key driving parameters monitored are Speed, Acceleration, Gear Selection, Idling, Clutch Override, and Braking The Ecosense algorithm evaluates the drive profile of a user on these six key parameters. The system calculates a score in a range of 0 to 100 for each of these six key driving parameters and displayed to the user on a scale of ten bars to the user. The weighted average of these six drive violations is converted on a scale of 0 to 100 and referred to as Ecoscore. Both Ecoscore and drive violation score dynamically changes depending on how the vehicle is driven. The proportion of decrement in the score is dependent on the intensity and duration of drive violation occurrence. The score improves if the user doesn’t commit any drive violation during drive. Hence, the user can relate & improve his driving skills by the score awarded to each drive violation as well as ecoscore and in turn achieve better fuel economy.
ECOSCORE CALCULATION Ecoscore is an integral number calculated for a particular trip ranging from a scale 0 to 100. Better the driving habit of the user, higher will be the ecoscore. Ecoscore starts will 100 and it varies depending on the violations committed during the trip. Ecoscore is the weighted average of the 6 drive violations discussed above. It reduces proportionally depending on the drive violation which has a higher impact on fuel economy. However, if the driver doesn’t commit any drive violation, then the score tends to improve. Hence, the ecoscore is dynamic reflection of how the vehicle is being driven and encourages the user to drive better. The ecoscore is calculated on trip to trip basis, hence the user can easily relate to his driving behavior under given circumstances.
DRIVE TEST RESULTS:
The vehicles are driven by different drivers for the same distance with the same start and end location. In this composite test, the vehicles are driven partially at city and highways. The traffic conditions are medium and the gear utilization pattern mostly lies in middle and higher gears. The results indicate that the improvements in fuel economy are approximately 30% higher compared to the vehicle without Ecosense.
Page 3 of 8
c. Trip wise routes are plotted in the map and displayed.
d. Stores trip wise drive information for complete historical trips made.
e. Analyze and recommends driver for areas of improvement
f. Offers ranking so as to compare with peer drivers
The architecture of Ecosense is presented in fig. 1
Fig 1: Ecosense architecture
KEY DRIVING PARAMETERS
There are numerous factors which influences the realization
of maximum fuel economy when the vehicle is driven in a
real world scenario. Some of the important factors are
temperature etc. Besides these factors, the driving profile is
one of the most important factors which has huge impact on
the fuel economy. The driving pattern has the potential to
extract maximum on-road fuel economy and significantly
reduce emissions [1].
The key driving parameters monitored are Speed,
Acceleration, Gear Selection, Idling, Clutch Override, and
Braking The Ecosense algorithm evaluates the drive profile
of a user on these six key parameters. The system calculates
a score in a range of 0 to 100 for each of these six key
driving parameters and displayed to the user on a scale of
ten bars to the user. The weighted average of these six drive
violations is converted on a scale of 0 to 100 and referred
to as Ecoscore. Both Ecoscore and drive violation score
dynamically changes depending on how the vehicle is
driven. The proportion of decrement in the score is
dependent on the intensity and duration of drive violation
occurrence. The score improves if the user doesn’t commit
any drive violation during drive. Hence, the user can relate
& improve his driving skills by the score awarded to each
drive violation as well as ecoscore and in turn achieve better
fuel economy.
ECOSCORE CALCULATION
Ecoscore is an integral number calculated for a particular
trip ranging from a scale 0 to 100. Better the driving habit
of the user, higher will be the ecoscore. Ecoscore starts will
100 and it varies depending on the violations committed
during the trip. Ecoscore is the weighted average of the 6
drive violations discussed above. It reduces proportionally
depending on the drive violation which has a higher impact
on fuel economy. However, if the driver doesn’t commit
any drive violation, then the score tends to improve. Hence,
the ecoscore is dynamic reflection of how the vehicle is
being driven and encourages the user to drive better. The
ecoscore is calculated on trip to trip basis, hence the user
can easily relate to his driving behavior under given
circumstances.
Drive Test Results:
The vehicles are driven by different drivers for the same
distance with the same start and end location. In this
composite test, the vehicles are driven partially at city and
highways. The traffic conditions are medium and the gear
Ecoscore = Total violation duration
Total trip duration x 100 100 -
Page 4 of 8
utilization pattern mostly lies in middle and higher gears.
The results indicate that the improvements in fuel economy
are approximately 30% higher compared to the vehicle
without Ecosense.
Cost savings and CO2 reduction:
The following is the fuel and cost savings benefit that
Ecosense offers to the customer and society. These
calculations are based on certain presumptions and
boundaries.
Total fuel cost savings per year:
Total CO2 reduction per year:
IN-VEHICLE INFOTAINMENT SYSTEM:
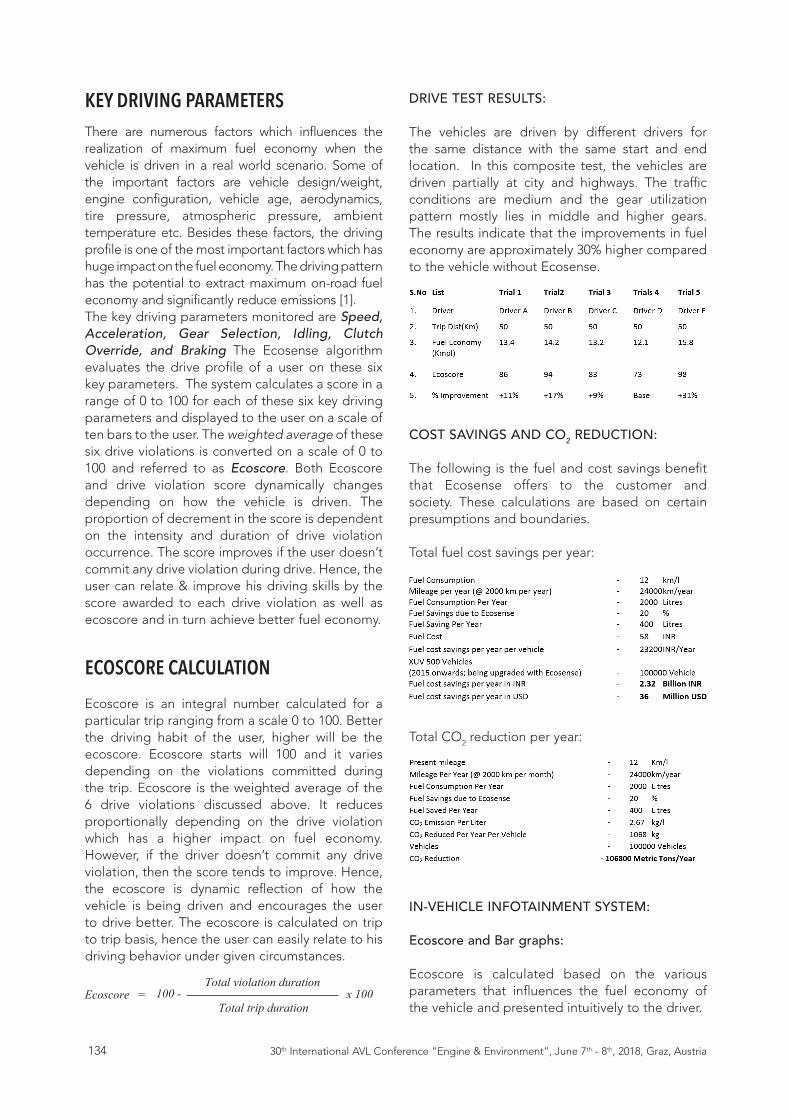
Ecoscore and Bar graphs:
Ecoscore is calculated based on the various parameters that
influences the fuel economy of the vehicle and presented
intuitively to the driver.
The bar graphs placed adjacent to ecoscore reflect the
driver’s driving patterns and helps to measure those
parameters. The ecoscore and bar graph represents driving
behaviour of the driver for the given trip cumulatively.
Fig 2: Ecosense Home Screen
Leaf Rating Leaf rating is awarded to drivers based on the score they
acquire during the trip. Higher score awards more no of
leaves. Leaf signifies the driver’s commitment towards the
environment and his contribution towards preserving it.
Ecosense also provides user options to enable/disable
certain functions and generate new trips manually.
a.) Reset Trip – This option helps the driver create a
new trip to ascertain the ecoscore and the other
parameters for a particular route.
b.) Location Tracking - The driver can enable or
disable location tracking feature if he/she doesn’t
want to monitor the location. The driver can still be
able view his drive behavior and ecoscore of the
trip.
c.) SYNC Ecosense – This option helps the driver to
enable or disable the data being sent to mobile app
Page 4 of 8
utilization pattern mostly lies in middle and higher gears.
The results indicate that the improvements in fuel economy
are approximately 30% higher compared to the vehicle
without Ecosense.
Cost savings and CO2 reduction:
The following is the fuel and cost savings benefit that
Ecosense offers to the customer and society. These
calculations are based on certain presumptions and
boundaries.
Total fuel cost savings per year:
Total CO2 reduction per year:
IN-VEHICLE INFOTAINMENT SYSTEM:
Ecoscore and Bar graphs:
Ecoscore is calculated based on the various parameters that
influences the fuel economy of the vehicle and presented
intuitively to the driver.
The bar graphs placed adjacent to ecoscore reflect the
driver’s driving patterns and helps to measure those
parameters. The ecoscore and bar graph represents driving
behaviour of the driver for the given trip cumulatively.
Fig 2: Ecosense Home Screen
Leaf Rating Leaf rating is awarded to drivers based on the score they
acquire during the trip. Higher score awards more no of
leaves. Leaf signifies the driver’s commitment towards the
environment and his contribution towards preserving it.
Ecosense also provides user options to enable/disable
certain functions and generate new trips manually.
a.) Reset Trip – This option helps the driver create a
new trip to ascertain the ecoscore and the other
parameters for a particular route.
b.) Location Tracking - The driver can enable or
disable location tracking feature if he/she doesn’t
want to monitor the location. The driver can still be
able view his drive behavior and ecoscore of the
trip.
c.) SYNC Ecosense – This option helps the driver to
enable or disable the data being sent to mobile app Page 4 of 8
utilization pattern mostly lies in middle and higher gears.
The results indicate that the improvements in fuel economy
are approximately 30% higher compared to the vehicle
without Ecosense.
Cost savings and CO2 reduction:
The following is the fuel and cost savings benefit that
Ecosense offers to the customer and society. These
calculations are based on certain presumptions and
boundaries.
Total fuel cost savings per year:
Total CO2 reduction per year:
IN-VEHICLE INFOTAINMENT SYSTEM:
Ecoscore and Bar graphs:
Ecoscore is calculated based on the various parameters that
influences the fuel economy of the vehicle and presented
intuitively to the driver.
The bar graphs placed adjacent to ecoscore reflect the
driver’s driving patterns and helps to measure those
parameters. The ecoscore and bar graph represents driving
behaviour of the driver for the given trip cumulatively.
Fig 2: Ecosense Home Screen
Leaf Rating Leaf rating is awarded to drivers based on the score they
acquire during the trip. Higher score awards more no of
leaves. Leaf signifies the driver’s commitment towards the
environment and his contribution towards preserving it.
Ecosense also provides user options to enable/disable
certain functions and generate new trips manually.
a.) Reset Trip – This option helps the driver create a
new trip to ascertain the ecoscore and the other
parameters for a particular route.
b.) Location Tracking - The driver can enable or
disable location tracking feature if he/she doesn’t
want to monitor the location. The driver can still be
able view his drive behavior and ecoscore of the
trip.
c.) SYNC Ecosense – This option helps the driver to
enable or disable the data being sent to mobile app
COST SAVINGS AND CO2 REDUCTION:
The following is the fuel and cost savings benefit that Ecosense offers to the customer and society. These calculations are based on certain presumptions and boundaries.
Total fuel cost savings per year:
Total CO2 reduction per year:
IN-VEHICLE INFOTAINMENT SYSTEM:
Ecoscore and Bar graphs:
Ecoscore is calculated based on the various parameters that influences the fuel economy of the vehicle and presented intuitively to the driver.
13530th International AVL Conference “Engine & Environment”, June 7th - 8th, 2018, Graz, Austria
The bar graphs placed adjacent to ecoscore reflect the driver’s driving patterns and helps to measure those parameters. The ecoscore and bar graph represents driving behaviour of the driver for the given trip cumulatively.
Leaf Rating
Leaf rating is awarded to drivers based on the score they acquire during the trip. Higher score awards more no of leaves. Leaf signifies the driver’s commitment towards the environment and his contribution towards preserving it.
Ecosense also provides user options to enable/disable certain functions and generate new trips manually.
a.) Reset Trip – This option helps the driver create a new trip to ascertain the ecoscore and the other parameters for a particular route.
b.) Location Tracking - The driver can enable or disable location tracking feature if he/she doesn’t want to monitor the location. The driver can still be able view his drive behavior and ecoscore of the trip.
c.) SYNC Ecosense – This option helps the driver to enable or disable the data being sent to mobile app via bluetooth. Though data communication
Fig 2: Ecosense Home Screen
Click to edit Master title style
is discontinued, the driver will be able to use other phone features of IVI system.
MOBILE APPLICATION: Phone connectivity for car functions have become inherent features since the advent of mobile applications for smart phone devices. Ecosense mobile application is developed so that the user can view the information with ease through his mobile phone and upload into website database. The communication between the mobile application and infotainment system is established through Bluetooth 2.0. The following sequence of steps are followed to initiate the communication session
1. Bluetooth in Infotainment system and mobile device shall be switched on. The Bluetooth profile in the mobile device shall be in discoverable mode which lasts for 120 seconds.
2. Mobile device addition request is initiated from infotainment system by the user. Infotainment system scans for the visible devices. Once the user opts for the specific mobile device to pair, the Hands-Free Profile (HFP) of Bluetooth gets connected.
3. Optional Bluetooth profile like Phone Book Access Profile (PBAP) and Message Access
136 30th International AVL Conference “Engine & Environment”, June 7th - 8th, 2018, Graz, Austria
Profile (MAP) are triggered from infotainment system to mobile device. These profiles are intended to access the phone contacts and text message available in the mobile device.
4. Advanced Audio Distribution Profile (A2DP) connection between mobile device and infotainment system for Bluetooth audio streaming is established.
5. Mobile app connection request gets automatically initiated from the mobile device through Serial Port Profile (SPP) of Bluetooth. This profile enables the communication of Ecosense information between mobile device and infotainment system. The polling status which is communicated at a periodicity of 12 seconds facilitates the communication channel in active mode.
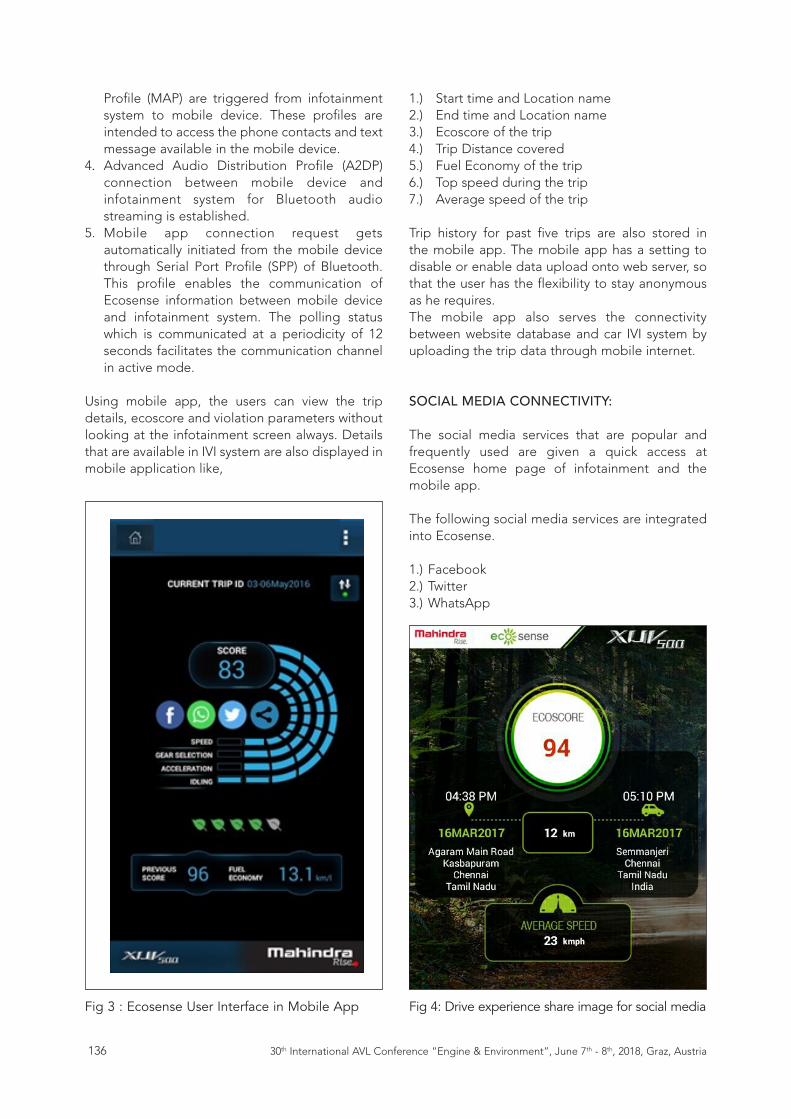
Using mobile app, the users can view the trip details, ecoscore and violation parameters without looking at the infotainment screen always. Details that are available in IVI system are also displayed in mobile application like,
1.) Start time and Location name2.) End time and Location name3.) Ecoscore of the trip4.) Trip Distance covered5.) Fuel Economy of the trip6.) Top speed during the trip7.) Average speed of the trip
Trip history for past five trips are also stored in the mobile app. The mobile app has a setting to disable or enable data upload onto web server, so that the user has the flexibility to stay anonymous as he requires. The mobile app also serves the connectivity between website database and car IVI system by uploading the trip data through mobile internet.
SOCIAL MEDIA CONNECTIVITY:
The social media services that are popular and frequently used are given a quick access at Ecosense home page of infotainment and the mobile app.
The following social media services are integrated into Ecosense.
1.) Facebook2.) Twitter3.) WhatsApp
The social media buttons are provided in
Click to edit Master title style4Fig 3 : Ecosense User Interface in Mobile App Fig 4: Drive experience share image for social media
13730th International AVL Conference “Engine & Environment”, June 7th - 8th, 2018, Graz, Austria
Infotainment system, Mobile application and Website. Hence the user can share his drive experience with convenience. Ecoscore and trip details are shared into social media by pressing the corresponding social media button in infotainment screen or mobile application. This helps the user for peer comparison of ecoscore and encourages driver to earn better score by better driving
Ecosense utilizes “Internet of Things” to connect car to the external world in a frugal manner and creates a pool of users who transform themselves to follow better driving style.
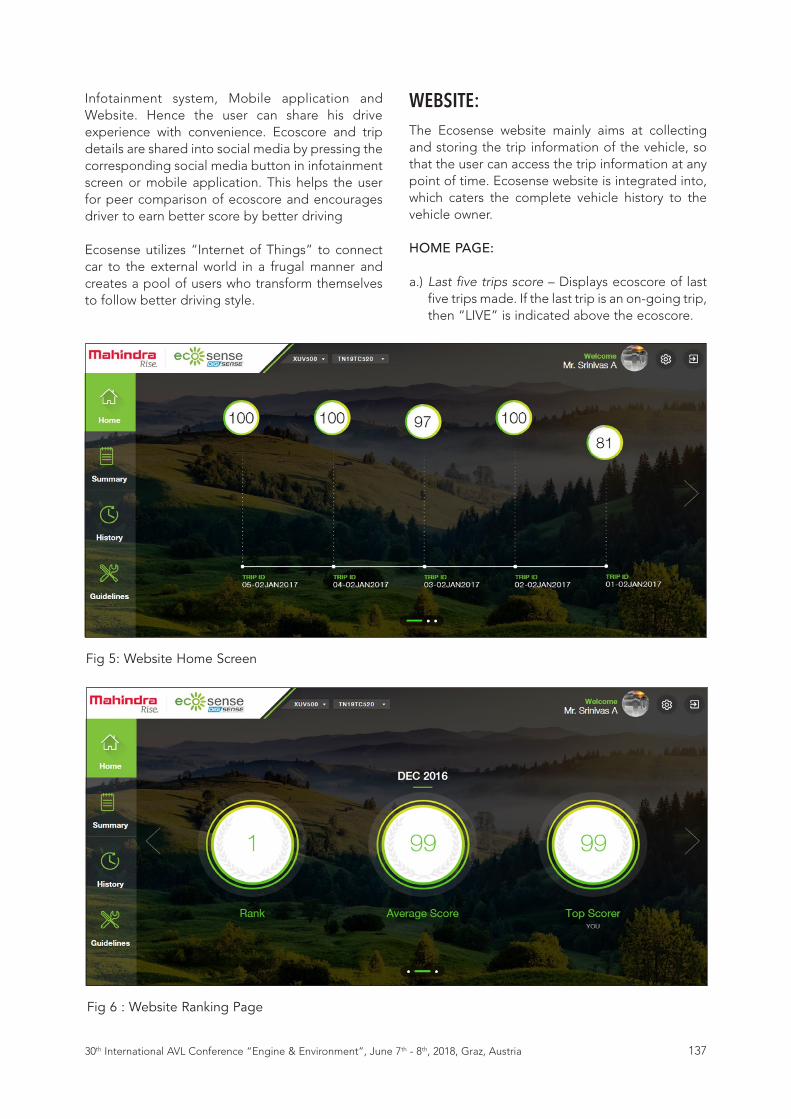
Fig 5: Website Home ScreenClick to edit Master title style
5
Fig 6 : Website Ranking PageClick to edit Master title style
WEBSITE: The Ecosense website mainly aims at collecting and storing the trip information of the vehicle, so that the user can access the trip information at any point of time. Ecosense website is integrated into, which caters the complete vehicle history to the vehicle owner.
HOME PAGE:
a.) Last five trips score – Displays ecoscore of last five trips made. If the last trip is an on-going trip, then “LIVE” is indicated above the ecoscore.
138 30th International AVL Conference “Engine & Environment”, June 7th - 8th, 2018, Graz, Austria
b.) Publishing rank amongst peers – Ranks are published on monthly basis and the user should have covered minimum 1000 kilometers as an eligibility criterion. Competitions are planned to motivate the users to switch better driving habits.
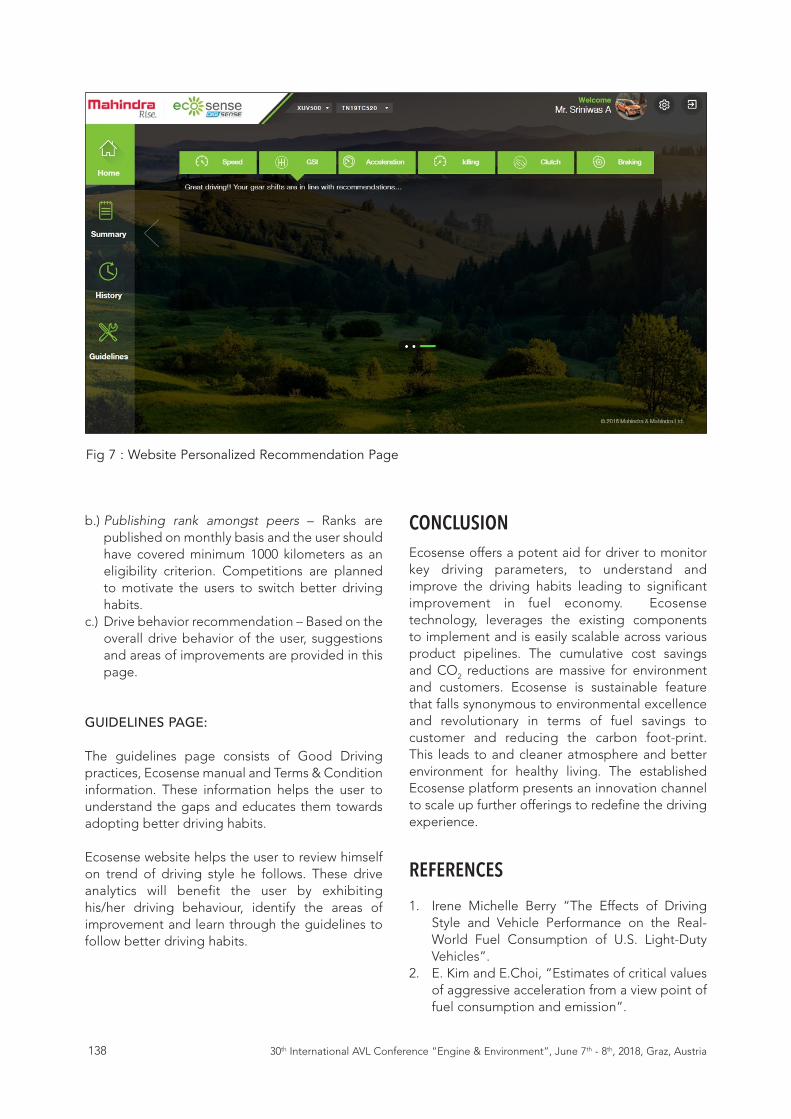
c.) Drive behavior recommendation – Based on the overall drive behavior of the user, suggestions and areas of improvements are provided in this page.
GUIDELINES PAGE:
The guidelines page consists of Good Driving practices, Ecosense manual and Terms & Condition information. These information helps the user to understand the gaps and educates them towards adopting better driving habits.
Ecosense website helps the user to review himself on trend of driving style he follows. These drive analytics will benefit the user by exhibiting his/her driving behaviour, identify the areas of improvement and learn through the guidelines to follow better driving habits.
CONCLUSIONEcosense offers a potent aid for driver to monitor key driving parameters, to understand and improve the driving habits leading to significant improvement in fuel economy. Ecosense technology, leverages the existing components to implement and is easily scalable across various product pipelines. The cumulative cost savings and CO2 reductions are massive for environment and customers. Ecosense is sustainable feature that falls synonymous to environmental excellence and revolutionary in terms of fuel savings to customer and reducing the carbon foot-print. This leads to and cleaner atmosphere and better environment for healthy living. The established Ecosense platform presents an innovation channel to scale up further offerings to redefine the driving experience.
REFERENCES1. Irene Michelle Berry “The Effects of Driving
Style and Vehicle Performance on the Real-World Fuel Consumption of U.S. Light-Duty Vehicles”.
2. E. Kim and E.Choi, “Estimates of critical values of aggressive acceleration from a view point of fuel consumption and emission”.
Fig 7 : Website Personalized Recommendation PageClick to edit Master title style
13930th International AVL Conference “Engine & Environment”, June 7th - 8th, 2018, Graz, Austria
3. Jeremy S. Neubauer and Eric Wood, “Accounting for the Variation of Driver Aggression in the Simulation of Conventional and Advanced Vehicles”.
4. ES720.1 Drive Recorder User’s Guide, ETAS GmbH
5. Beckx C., L. Int Panis, I. De Vlieger & G. Wets, “Influence of gear-changing behaviour on fuel use and vehicular exhaust emissions”, Proc. 8th Highway and Urban Environment Symp. – In Highway and Urban Environment, Springer, Netherlands, p 45-51, 2007.
6. Richard Barney Carlson, Henning Lohse-Busch, Michael Duoba and Neeraj Shidore, “Drive Cycle Fuel Consumption Variability of Plug-In Hybrid Electric Vehicles Due to Aggressive Driving”.
7. Sam Kodsi, Jeffrey Muttart, “Modeling Passenger Vehicle Acceleration Profiles from Naturalistic Observations and Driver Testing at Two-way-stop Controlled Intersections”.
8. Guido Lenaers, “Real Life CO2 Emission and Consumption of Four Car Powertrain Technologies Related to Driving Behaviour and Road Type”.
9. Edward K Nam and Robert Giannelli, United States Environmental Protection Agency, “Fuel consumption modelling of conventional and advanced vehicles in the physical emission rate estimator”.
10. A.Srinivas, C.Nandagopalan, T. Kumar Prasad, C P Bharath, Paul C. Isac, 10th Stuttgart International Symposium, “Challenges of Integrating Micro Hybrid Technology in an Existing Diesel Vehicle”
11. Nandagopalan Chidambaram, Sridhar Prasad Chandrasekar, VM Maheshwar, Prabaharan Palanivelu, Aravapalli Sriniwas Green Drive – A holistic approach towards fuel efficient driving, Symposium on International Automotive Technology 2017.
140 30th International AVL Conference “Engine & Environment”, June 7th - 8th, 2018, Graz, Austria