Page 1
LGM Ireland Ltd. – Energy Services Ltd. Baxter Healthcare - Energy Survey Report
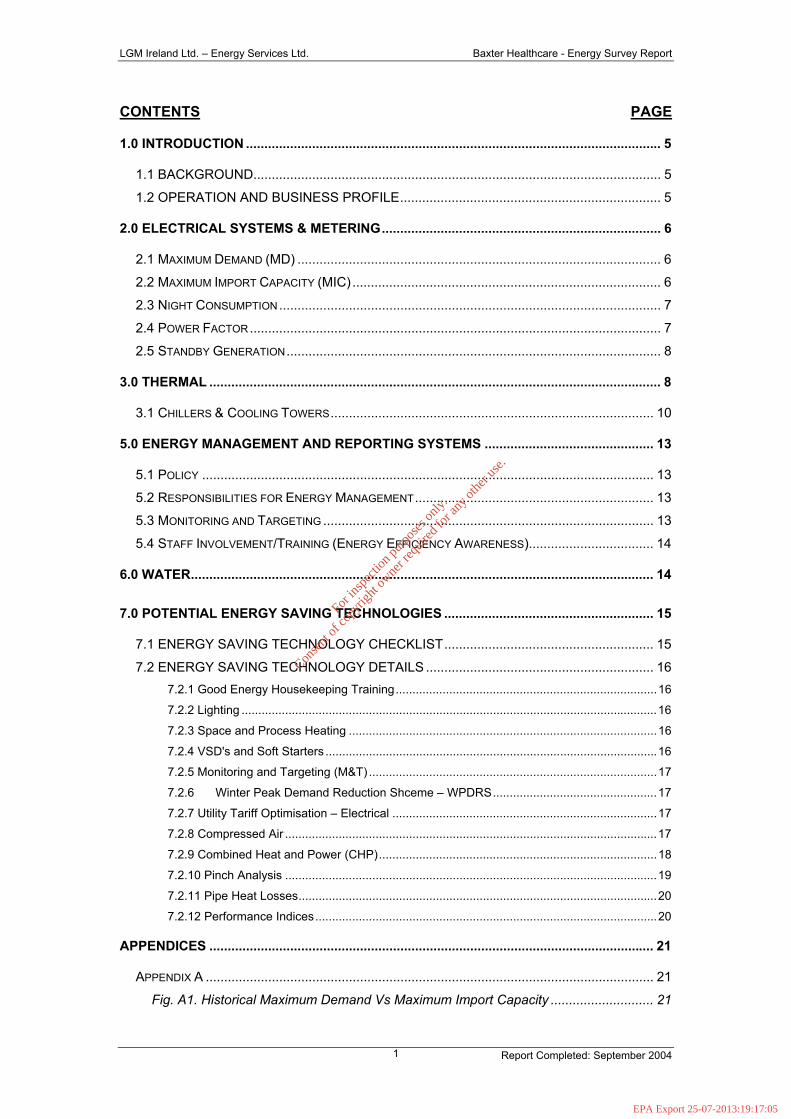
CONTENTS PAGE
1.0 INTRODUCTION ................................................................................................................. 5
1.1 BACKGROUND............................................................................................................... 5 1.2 OPERATION AND BUSINESS PROFILE....................................................................... 5
2.0 ELECTRICAL SYSTEMS & METERING............................................................................ 6
2.1 MAXIMUM DEMAND (MD) ................................................................................................... 6 2.2 MAXIMUM IMPORT CAPACITY (MIC) .................................................................................... 6 2.3 NIGHT CONSUMPTION........................................................................................................ 7 2.4 POWER FACTOR................................................................................................................ 7 2.5 STANDBY GENERATION...................................................................................................... 8
3.0 THERMAL ........................................................................................................................... 8
3.1 CHILLERS & COOLING TOWERS........................................................................................ 10
5.0 ENERGY MANAGEMENT AND REPORTING SYSTEMS .............................................. 13
5.1 POLICY ........................................................................................................................... 13 5.2 RESPONSIBILITIES FOR ENERGY MANAGEMENT................................................................. 13 5.3 MONITORING AND TARGETING .......................................................................................... 13 5.4 STAFF INVOLVEMENT/TRAINING (ENERGY EFFICIENCY AWARENESS).................................. 14
6.0 WATER.............................................................................................................................. 14
7.0 POTENTIAL ENERGY SAVING TECHNOLOGIES ......................................................... 15
7.1 ENERGY SAVING TECHNOLOGY CHECKLIST......................................................... 15 7.2 ENERGY SAVING TECHNOLOGY DETAILS .............................................................. 16
7.2.1 Good Energy Housekeeping Training..............................................................................16 7.2.2 Lighting ............................................................................................................................16 7.2.3 Space and Process Heating ............................................................................................16 7.2.4 VSD's and Soft Starters ...................................................................................................16 7.2.5 Monitoring and Targeting (M&T) ......................................................................................17 7.2.6 Winter Peak Demand Reduction Shceme – WPDRS.................................................17 7.2.7 Utility Tariff Optimisation – Electrical ...............................................................................17 7.2.8 Compressed Air ...............................................................................................................17 7.2.9 Combined Heat and Power (CHP)...................................................................................18 7.2.10 Pinch Analysis ...............................................................................................................19 7.2.11 Pipe Heat Losses...........................................................................................................20 7.2.12 Performance Indices......................................................................................................20
APPENDICES ......................................................................................................................... 21
APPENDIX A .......................................................................................................................... 21 Fig. A1. Historical Maximum Demand Vs Maximum Import Capacity ............................ 21
Report Completed: September 2004 1
For
insp
ectio
n pur
pose
s only
.
Conse
nt of
copy
right
owne
r req
uired
for a
ny ot
her u
se.
EPA Export 25-07-2013:19:17:05
Page 2
LGM Ireland Ltd. – Energy Services Ltd. Baxter Healthcare - Energy Survey Report
Fig. A2. Historical Electricity Consumption ..................................................................... 21 Fig. A3. Historical Heavy Fuel Oil Consumption............................................................. 21 Fig. A4. Historical Water Consumption........................................................................... 21
APPENDIX B .......................................................................................................................... 21 Fig. B1.Electricity Demand for Compressor No.4........................................................... 21 Fig. B2. Electricity Demand for Compressor No. 6 (VSD Controlled) ............................ 21 Fig. B3. Electricity Demand for Chillier No.2................................................................... 21
APPENDIX C .......................................................................................................................... 21 Fig. C.1. Energy Efficiency Utilisation............................................................................. 21
APPENDIX D .......................................................................................................................... 21 Compressed Air Audit Synopsis ..................................................................................... 21
Report Completed: September 2004 2
For
insp
ectio
n pur
pose
s only
.
Conse
nt of
copy
right
owne
r req
uired
for a
ny ot
her u
se.
EPA Export 25-07-2013:19:17:05
Page 3
LGM Ireland Ltd. – Energy Services Ltd. Baxter Healthcare - Energy Survey Report
SUMMARY OF ENERGY SAVING MEASURES
Energy Survey Summary Customer Reference: Baxter Healthcare Our Reference: ES/LGM/Baxter/ScopingSurvey Survey Date: 9th & 10th September 2004
Personnel Brian Scannell and Paul Ryan (Energy Services Ltd.) carried out the scoping survey on behalf
of LGM Ireland Ltd. Ger Murnane and Ciaran Geraghty attended on behalf of Baxter. Customer Details Address: Baxter Healthcare SA, Moneen Road, Castlebar,
Co.Mayo.
Telephone: 094-22244
Fax: 094-22956
E-Mail: [email protected]
Contact: Ciaran Geraghty
Total CO2 Emissions: 39,341 tonnes per annum
Main Electrical Consumption Details Existing Tariff: Energia Medium Voltage
Annual Consumption: 25,926,634 kWh
Average Unit Price: 6.78c/kWh
Night Usage: 36%
Maximum Demand: 4452 kW (4686kVA)
Load Factor: 66.6%
Current Annual Spend: Euro € 1,757,288
Maximum Import Capacity: 4500 kVA
Electrical CO2 Emissions: 20,113 tonnes per annum
Main Thermal Consumption Details Supply Heavy Fuel Oil
Annual Consumption 6,152,985 litres (70,267,088 kWh)
Current Annual Spend: Euro € 1,283,663
Average Unit Cost 1.83 cent/kWh
Average Thermal Demand: 8,021 kW
Estimated MD at 0.8 LF: 10,026 kW
Electrical : Thermal Consumption Ratio 1:2.7
Report Completed: September 2004 3
For
insp
ectio
n pur
pose
s only
.
Conse
nt of
copy
right
owne
r req
uired
for a
ny ot
her u
se.
EPA Export 25-07-2013:19:17:05
Page 4
LGM Ireland Ltd. – Energy Services Ltd. Baxter Healthcare - Energy Survey Report
Thermal CO2 Emissions: 19,227 tonnes per annum
Report Completed: September 2004 4
For
insp
ectio
n pur
pose
s only
.
Conse
nt of
copy
right
owne
r req
uired
for a
ny ot
her u
se.
EPA Export 25-07-2013:19:17:05
Page 5
LGM Ireland Ltd. – Energy Services Ltd. Baxter Healthcare - Energy Survey Report
1.0 INTRODUCTION Energy Services Ltd. (on behalf of LGM Ireland) conducted an energy survey
of the Baxter plant in Castlebar, to broadly quantify energy usage, and provide
direction as to in which areas the major opportunities for energy savings might
exist. The survey was driven primarily by Baxters requirements for their IPC
licence outlined by the EPA.
1.1 BACKGROUND
Baxter Healthcare is a subsidiary of Baxter Inc. which is the leading
healthcare company in the world. Baxter Inc. employs 35,000 people
worldwide, has sales in excess of US$6b and its shares are quoted on the
New York stock exchange. Baxter is a leader in medical products and has
developed leading technologies including intravenous solutions, artificial
kidneys, continuous ambulatory peritoneal dialysis and blood substitutes.
1.2 OPERATION AND BUSINESS PROFILE
Baxter established its Ireland Manufacturing Operation in 1972 and now
employs approx. 1000 people at the state of the art manufacturing plant in
Castlebar, Co. Mayo. The Castlebar plant produces a range of medical
solutions for Continuous Ambulatory Peritoneal Dialysis (CAPD) and for drug
administration purposes. The products are exported to global markets
including Europe, US and Japan.
Report Completed: September 2004 5
For
insp
ectio
n pur
pose
s only
.
Conse
nt of
copy
right
owne
r req
uired
for a
ny ot
her u
se.
EPA Export 25-07-2013:19:17:05
Page 6
LGM Ireland Ltd. – Energy Services Ltd. Baxter Healthcare - Energy Survey Report
2.0 ELECTRICAL SYSTEMS & METERING The plant is metered at 10kV medium voltage and is currently supplied by
Energia. Annual electricity consumption at the site is in the region of 25.9GWh
which equates to an annual spend of some € 1,757,288. The Maximum
Demand (MD) recorded in July 2004 last was 4,452kW (4,686kVA). Night
consumption represents 36% of the total load. The monthly electricity
consumption profile can be seen in Fig.2 Appendix A. A noticeable increase
occurs during the summer months which is most likely the result of increased
cooling requirements.
2.1 Maximum Demand (MD) Fig.1 in Appendix A shows the monthly electricity demand in kVA over the
past 12 months. The highest demand recorded during this period was
4,452kW (4,686kVA) which occurred at 11.00hrs on 7th July. The MD should
not exceed the Maximum Import Capacity level or penalties will be incurred.
2.2 Maximum Import Capacity (MIC) Demand customers who are charged on Tariff Schedule DTS-D (i.e. Baxter)
have a contracted MIC value established in their connection agreement. An
MIC value is important because it generally represents the extent to which the
transmission network has been designed to serve the customers and places
an upper limit on the total demand that a customer can place on the network.
It therefore should be high enough to meet the customers needs.
Since Transmission Use of System (TUoS) charges and Distribution Use of
System (DUoS) are based on each customers MIC value, an MIC value in
excess of a customers needs will result in that customer incurring higher
capacity charges than necessary. Conversely if the MIC is set too low and a
customer exceeds the agreed MIC then unauthorized usage charges will be
applied in order to reflect that the network has not been designed to meet
these levels and to discourage use above the MIC.
Report Completed: September 2004 6
For
insp
ectio
n pur
pose
s only
.
Conse
nt of
copy
right
owne
r req
uired
for a
ny ot
her u
se.
EPA Export 25-07-2013:19:17:05
Page 7
LGM Ireland Ltd. – Energy Services Ltd. Baxter Healthcare - Energy Survey Report
The current MIC level of 4,500kVA has been marginally exceeded in recent
months (See Fig.1 Appendix A) and as such unnecessary penalty charges
have been incurred. In order to avoid these penalties Baxter could apply to
increase the current MIC level. However a more energy efficient and cost
effective method would be to monitor and control the electricity demand more
closely and ensure that the MIC level is not breached in the future. A Demand
Manager can be easily installed to control random or sequenced non-
essential loads. The unit can be preset to automatically shed non-essential
loads during the periods of peak demand, thereby ensuring that no penalties
are incurred.
2.3 Night Consumption Night Consumption costs on the current Energia tariff (and the previous ESB
PES tariff) are substantially less than day unit costs. A totally flat consumption
profile would obtain 37.5 % night consumption (normally one would expect the
night load to be less than this). The quantity of night units consumed on the
Castlebar site over the past 12 months was around 36%.
However there could be scope for switching off some electrical equipment
which is not in use during the night-time period (11pm-8am). Further
investigation is required to determine what loads (if any) remain on
unnecessarily during the night. 2.4 Power Factor Low Power Factor (PF) surcharges, sometimes referred to as reactive or
wattless charges are applied to kilo-Volt-Amperes-Reactive-hours (kVARh) in
excess of one third of kilo-Watt-hours (kWh) in the billing period. Baxter has
installed power factor correction equipment at various locations throughout
the site to compensate for the reactive power produced in the plant. Baxter
are not incurring any power factor penalties at present.
Report Completed: September 2004 7
For
insp
ectio
n pur
pose
s only
.
Conse
nt of
copy
right
owne
r req
uired
for a
ny ot
her u
se.
EPA Export 25-07-2013:19:17:05
Page 8
LGM Ireland Ltd. – Energy Services Ltd. Baxter Healthcare - Energy Survey Report
2.5 Standby Generation There is one 500kVA electricity generator on site which is used in the event of
a failure in mains electricity supply to the plant. The unit ensures a continuous
supply of electricity to the EPOMAX production facility in the event of an
outage to ensure product in the EPOMAX area does not become
contaminated. The generator is synchronised with the grid but is currently not
used for any peak shaving / lopping or winter demand reduction schemes.
Peak shaving, and other demand reduction measures such as ‘Powersave’ or
the Winter Peak Demand Reduction Scheme (WPDRS) could be quite
lucrative and the potential merits further investigation.
3.0 THERMAL Heavy Fuel Oil is currently used as the fuel for the steam boilers. Annual
consumption of almost 6,152,985 litres (equates to 70,267,088 kWh) costs
Baxter in the region of € 1.28 million per annum. There is currently no natural
gas supply to the site; however this may change in the near future. By
converting from heavy fuel oil to natural gas Baxter could reduce the plants
CO2 emissions by over 5,000 tonnes annually.
Average thermal demand at the plant amounts to 8,021kW. Taking a load
factor of 80%, this equates to a max thermal demand of 10,026kW. As the
electrical maximum demand is 4,452kW, it appears from initial observations
that the Baxter plant would be an ideal candidate for Combined Heat and
Power (CHP).
The boiler room was noticeably quite warm during the survey as a number of
valves and flanges are uninsulated. It is worth noting that an uninsulated valve
is the equivalent of 1m of unlagged pipework. The details of each of the four
boilers can be seen in the tables below:
Report Completed: September 2004 8
For
insp
ectio
n pur
pose
s only
.
Conse
nt of
copy
right
owne
r req
uired
for a
ny ot
her u
se.
EPA Export 25-07-2013:19:17:05
Page 9
LGM Ireland Ltd. – Energy Services Ltd. Baxter Healthcare - Energy Survey Report
Boiler No.2
Make B & E Boilers Ltd.
HYD Pressure 247 PSI
Working Pressure 150 PSI
Serial No. 2748
Model European
Burner Hamworthy
Boiler No.3
Make Babcock Robey Ltd
Design Pressure 160 PSI
Working Pressure 150 PSI
Serial No. 32026
Model Lincoln
Burner Hamworthy
Boiler No.4
Make Sernior Thermal Ltd
Design Pressure 160 PSI
Working Pressure 150 PSI
Serial No. C 60003
Model Steampacket
Burner Hamworthy
Boiler No.6
Make Wellman-Robey
Design Pressure 9 BAR
Heat Output 12540 kW
Burner Hamworthy
Boiler No.4 is the lead boiler and satisfies the 70% of the thermal demand of
the site. However maintaining the plant heat requirements is critical to
production. As such the three smaller boilers are maintained on hot standby
Report Completed: September 2004 9
For
insp
ectio
n pur
pose
s only
.
Conse
nt of
copy
right
owne
r req
uired
for a
ny ot
her u
se.
EPA Export 25-07-2013:19:17:05
Page 10
LGM Ireland Ltd. – Energy Services Ltd. Baxter Healthcare - Energy Survey Report
so that in the event of a problem occurring with the lead boiler, the smaller
units can continue to supply the plant with adequate heat to ensure that
production is not affected.
Figure 3 in Appendix A indicates the monthly oil consumption over the past
eighteen months. Some seasonal variations can be seen with a slight
reduction in consumption over the months June to August.
Flue gas temperature on the day was measured in excess of 200°C.
It is estimated that up to 50,000 litres of hot water (~85°C) goes to drain on a
daily basis. Significant savings can be made by recovering these high grade
heat source. Further investigation is required here but it should be possible to
recover much of this heat.
3.1 Chillers & Cooling Towers A number of chillers and cooling towers are used around the plant to provide
cooling and to remove heat from the plant. During the survey Energy Services
installed a portable power monitor on Chiller No.2 located in Transformer
Room No.5 (It is worth noting at this point that the room was noticed to be
very warm on the day as room ventilation appears to be inadequate). The
electrical demand profile of the chiller can be seen in Fig.3 Appendix B.
Controls and set-points for each of the cooling towers and chillers should be
checked to ensure that unnecessary cooling/chilling does not occur. Potential
for VSD’s on the cooling tower fans and pumps should also be investigated.
Report Completed: September 2004 10
For
insp
ectio
n pur
pose
s only
.
Conse
nt of
copy
right
owne
r req
uired
for a
ny ot
her u
se.
EPA Export 25-07-2013:19:17:05
Page 11
LGM Ireland Ltd. – Energy Services Ltd. Baxter Healthcare - Energy Survey Report
4.0 COMPRESSD AIR There are four Atlas CopCo, oil free, water cooled air compressors on site,
details of each are listed below:
Manufacturer Model kW FAD (l/s)
No.1 Atlas CopCo ZR37 37kW 91
No.3 Atlas CopCo Data Unavailable on the Day
No.4 Atlas CopCo ZR 160 160 485
No.6 Atlas CopCo ZR 160 VSD 160 434
On the day of the survey compressor No.4 was operating as the lead
compressor. Energy Services installed portable power monitoring equipment
on the unit over a 24 hr period (Appendix B, Fig.1). As can be seen from the
graph this unit remained on full load throughout the recording period.
Compressor No.3 was also operating on full load during the survey.
Compressor No.6 with the Variable Speed Drive (VSD) ramped up and down
depending on the demand for air. The electrical demand of this unit was also
monitored by Energy Services (See Fig.2 Appendix B).
The installed Primary air receiver capacity at the Baxter plant is currently
7760litres which is inadequate based on the free air delivery (FAD) of the
compressors which could be causing unnecessarily frequent cycling of the air
compressors. Minimum primary air receiver capacity should be in the region
of 10,000 litres.
A large quantity of heat is being generated within the compressor room by the
compressors themselves. At present this heat is drawn outside by means of
extract fans in the roof. Further investigation is required to establish the
potential for heat recovery within the room. In addition the dryers are air
cooled which further adds to the rooms temperature. For every 4°C drop in
ambient air temperature the efficiency of the compressors can be improved by
1%.
Report Completed: September 2004 11
For
insp
ectio
n pur
pose
s only
.
Conse
nt of
copy
right
owne
r req
uired
for a
ny ot
her u
se.
EPA Export 25-07-2013:19:17:05
Page 12
LGM Ireland Ltd. – Energy Services Ltd. Baxter Healthcare - Energy Survey Report
Air pressure is being generated at approx 7.9bar. However it is believed that
max pressure required in the building is in fact below this level. The higher
generating pressure could be due to the misconception that large quantities of
air are required in the building and by generating at a higher pressure more
air is stored in the receiver and associated pipework in the event of a high
sudden demand.
While this may assist during periods of high air demand, a more energy
efficient solution would be to conduct a pipe adequacy analysis or
alternatively increase the receiver capacity. Over 7% improvement in
efficiency can be obtained by reducing generating pressure by just 1 bar
which equates to annual savings in the region of € 20,000.
Baxter recently undertook a compressed air audit which identified a number of
areas where potential exist for energy cost savings. The table below outlines
the findings of the audit:
Measure Potential
Annual Savings
Anticipated
Capital Costs
Simple
Payback
Air Dryers € 6.5 k € 40 k 6 yrs
Sequence Controller € 18k € 27k 1.5 yr
Air Receiver Capacity € 10k € 13k 1.2 yrs
A synopsis of the audit can be seen in Appendix D.
Report Completed: September 2004 12
For
insp
ectio
n pur
pose
s only
.
Conse
nt of
copy
right
owne
r req
uired
for a
ny ot
her u
se.
EPA Export 25-07-2013:19:17:05
Page 13
LGM Ireland Ltd. – Energy Services Ltd. Baxter Healthcare - Energy Survey Report
5.0 ENERGY MANAGEMENT AND REPORTING SYSTEMS
5.1 Policy There is a good awareness of energy production and energy costs on site at
management level. Specific energy programs have been in place for several
years.
5.2 Responsibilities for Energy Management Energy Management responsibilities are well defined on site. The Energy
Manager is responsible for the overall data collection, handling and collation
of the data, and for managing and controlling energy as a resource. The
Energy Manager is also responsible for the investigation, sourcing and
monitoring of energy related projects.
5.3 Monitoring and Targeting The existing M & T system at Baxter is used in conjunction with a Trend
Building Management System (BMS). There are several areas throughout the
site that would benefit from inclusion within the monitoring system. The
system in place is capable of extension to cater for additional electricity loads
and other energy streams including oil, steam and water.
An extension of the system, to include other energy streams will give Baxter a
much improved insight into the total site energy usage. Normalised
Performance Indexes could be established to correlate energy usage per unit
of product and flag exceptions to predicted trends for investigation. In turn,
this should identify, through appropriate reports and benchmarks,
opportunities to make energy cost and resource reductions.
Report Completed: September 2004 13
For
insp
ectio
n pur
pose
s only
.
Conse
nt of
copy
right
owne
r req
uired
for a
ny ot
her u
se.
EPA Export 25-07-2013:19:17:05
Page 14
LGM Ireland Ltd. – Energy Services Ltd. Baxter Healthcare - Energy Survey Report
5.4 Staff Involvement/Training (Energy Efficiency Awareness) There is awareness at Baxter that a number of small low cost energy savings
can quickly amount to significant total savings. Further staff training would
enhance efforts to reduce on-site energy consumption.
Baxter should initiate an in house “good energy house keeping“ policy for all
staff. The idea behind such a policy would be to raise the consciousness of
the staff. A small contribution from staff towards energy awareness can
contribute greatly to the overall efficiency in general. The details of the policy
can be agreed depending on Baxters requirements but should involve all the
staff in the campaign.
This low cost measure will result in reduced energy costs and therefore better
overall efficiency. This policy will also refer to any future works or
refurbishment’s carried out. The policy would specify that any works
undertaken would use energy efficient technologies as much as possible.
6.0 WATER Baxter currently draws water from the county councils main supply. Over the
past twelve months the plant has used some 142 million gallons at an annual
cost of € 284,703.
Baxter should investigate the potential for sourcing water locally by means of
an on site well. Further investigation is requirted to determine the quality and
quantity of water available in order to justify same.
Report Completed: September 2004 14
For
insp
ectio
n pur
pose
s only
.
Conse
nt of
copy
right
owne
r req
uired
for a
ny ot
her u
se.
EPA Export 25-07-2013:19:17:05
Page 15
LGM Ireland Ltd. – Energy Services Ltd. Baxter Healthcare - Energy Survey Report
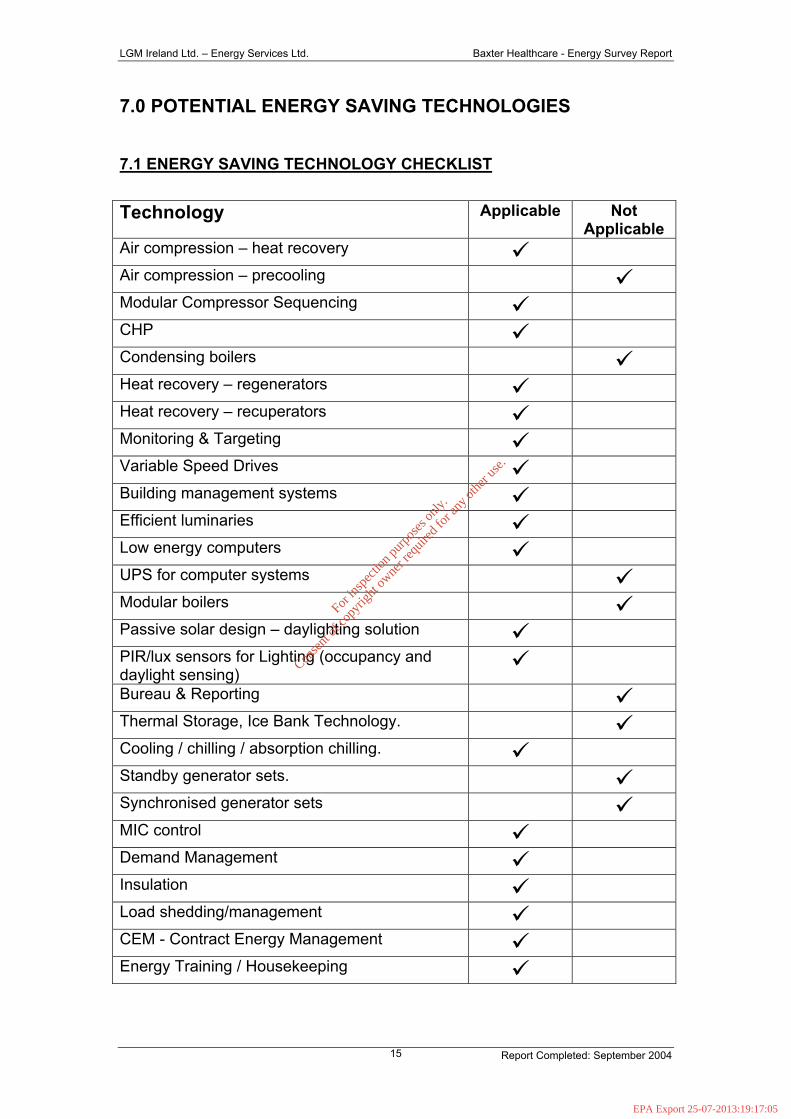
7.0 POTENTIAL ENERGY SAVING TECHNOLOGIES
7.1 ENERGY SAVING TECHNOLOGY CHECKLIST Technology Applicable Not
Applicable Air compression – heat recovery
Air compression – precooling Modular Compressor Sequencing
CHP
Condensing boilers Heat recovery – regenerators
Heat recovery – recuperators
Monitoring & Targeting
Variable Speed Drives
Building management systems
Efficient luminaries
Low energy computers
UPS for computer systems Modular boilers Passive solar design – daylighting solution
PIR/lux sensors for Lighting (occupancy and daylight sensing)
Bureau & Reporting Thermal Storage, Ice Bank Technology. Cooling / chilling / absorption chilling.
Standby generator sets. Synchronised generator sets MIC control
Demand Management
Insulation
Load shedding/management
CEM - Contract Energy Management
Energy Training / Housekeeping
Report Completed: September 2004 15
For
insp
ectio
n pur
pose
s only
.
Conse
nt of
copy
right
owne
r req
uired
for a
ny ot
her u
se.
EPA Export 25-07-2013:19:17:05
Page 16
LGM Ireland Ltd. – Energy Services Ltd. Baxter Healthcare - Energy Survey Report
7.2 ENERGY SAVING TECHNOLOGY DETAILS
7.2.1 Good Energy Housekeeping Training General staff at the Baxter plant may benefit from further energy awareness
and efficiency training particularly regarding the benefits to be achieved with
switching off lights, machinery (which have a short start-up time) when not in
use. There are a number of electrically charged forklift trucks on site.
Timeclocks should be installed on the chargers to ensure that charging takes
place outside the day-time tariff period (8am-11pm) where possible, or indeed
outside the WPDRS period if the scheme is implemented on site.
7.2.2 Lighting It was noticed during the scoping survey that many areas were fully
illuminated during the day, despite the noticeable lack of occupants. A
detailed lighting survey should be undertaken to establish the lighting level
requirements throughout the plant and identify areas that would be suitable
for automated lighting controls, using a combination of time-clock control,
occupancy linking, and daylight sensing controls. Some of these technologies
have already been successfully installed in certain areas of the plant. The
survey would also identify areas where energy efficient fittings could be used.
7.2.3 Space and Process Heating
Heat recovery from the flue gas, air compressors and the 85°C waste hot
water should be given serious consideration as large quantities of potentially
useful heat is currently being lost. Due to the proximity of the boilers to the
location of the hot water (going to drain) there may be scope to preheat either
the boiler feedwater or combustion air.
7.2.4 VSD's and Soft Starters A number of VSD’s have been installed on the larger motors in the Baxter
plant, however there is scope for the installation of more units, perhaps on the
vacuum pumps or cooling tower pumps..
Report Completed: September 2004 16
For
insp
ectio
n pur
pose
s only
.
Conse
nt of
copy
right
owne
r req
uired
for a
ny ot
her u
se.
EPA Export 25-07-2013:19:17:05
Page 17
LGM Ireland Ltd. – Energy Services Ltd. Baxter Healthcare - Energy Survey Report
7.2.5 Monitoring and Targeting (M&T) The correct use of a dedicated Monitoring and Targeting system results in
significantly improved cost control and energy management. The system at
Baxter does not appear to be used to its full potential however. The location
of the PC is a contributing factor to this issue. The ideal location for the PC
would be in the office of a person with the responsibility of evaluating the
information gathered by the system.
7.2.6 Winter Peak Demand Reduction Scheme – WPDRS The Winter Peak Demand Reduction Scheme has been developed by
ESBNG and approved by the CER. It is designed to encourage Customers to
reduce their electricity consumption, or increase exports between 17:00 and
19:00 on Business Days between 1st November 2004 and 25th March 2005.
This can be achieved by switching plant off at this time or in Baxters case,
through the use of on-site generation or demand management controller.
By running the 500kVA generator (which is synchronised with the electricity
grid) during the time periods identified above annual savings in the region of
€20,000 could be achieved. Obviously there would be fuel and maintenance
costs associated with running the unit, however the scheme would still prove
to be quite lucrative. Baxter should investigate this immediately as the closing
date for applications for the scheme is the 6th October next.
7.2.7 Utility Tariff Optimisation – Electrical As already mentioned the MIC level has been exceeded by the maximum
demand in recent billing periods unnecessary penalty capacity charges are
being incurred. These penalties could be avoided by implementing demand
management options including peak lopping / shaving.
7.2.8 Compressed Air Air receiver capacities should be investigated as undersized capacity can
contribute to energy losses in that compressors are mar be forced to cycle
repeatedly between on and off-load. In compressed air units 90% of the
electrical energy is converted to heat. Heat recovery is already in place from
Report Completed: September 2004 17
For
insp
ectio
n pur
pose
s only
.
Conse
nt of
copy
right
owne
r req
uired
for a
ny ot
her u
se.
EPA Export 25-07-2013:19:17:05
Page 18
LGM Ireland Ltd. – Energy Services Ltd. Baxter Healthcare - Energy Survey Report
the air compressors to pre-heat steam boiler feedwater, however the
pipework is uninsulated and as such losses are being incurred.
Specific Compressed Air Related Actions
1. Carry out leak tests on air piping system with air-consuming equipment
turned off, using Free Air Delivery (FAD) volumes of sets.
2. Pipe adequacy sizing investigation – 3” pipe is recommended for flow
rates up to 500 scfm. Also investigate moisture/scaling in pipe internals.
Incorrectly-sized distribution piping, and internal pipe build-ups increases
friction losses and energy wastage, whilst decreasing deliverable air
pressures and volumes.
3. Investigate receiver sizes (min. of 900 litres per 100 l/s FAD is
recommended).
4. Investigate additional receivers at points of high demand. This will reduce
the operational burden at centralised air compression plant.
5. Investigate using alternatives for the main compressed air loads. Baxter
presently pay an average of 68cents per generated kWh of compressed
air (10 times the AUP of electricity, compressors are 10% efficient as an
energy conversion plant). If we factor in a further 30 % air-leak losses and
distribution inefficiency losses we can see that the cost of compressed air
energy delivered to the process is almost than 90 cent per kWh. This is an
expensive form of energy by any standards. 6. Investigate the use of ring main distribution piping with solenoid valve
isolation of areas not in use. 7. Is there really a need for compression to 7.9 bar as some equipment may
use compressed air at lower pressures? 7.2.9 Combined Heat and Power (CHP) The Baxter operation and electrical/thermal consumption ratio (1:2.7)
presents good opportunity for the employment of Combined Heat and Power
(CHP) as an efficient means of generating electricity and steam on site.
Report Completed: September 2004 18
For
insp
ectio
n pur
pose
s only
.
Conse
nt of
copy
right
owne
r req
uired
for a
ny ot
her u
se.
EPA Export 25-07-2013:19:17:05
Page 19
LGM Ireland Ltd. – Energy Services Ltd. Baxter Healthcare - Energy Survey Report
CHP is now deemed ‘renewable’ and therefore would assist in the reduction
of greenhouse gas emissions on site. In addition the use of CHP would result
in Baxter possibly being in a position to sell on emissions permits as a
tradeable commodity under the terms of the EU Emissions Trading Directive.
Other benefits include:
Generation of high efficiency, low cost electrical & thermal energy on site
Reduction of performance Indexes per kg product
Reliable on site power not subject to grid variations/outages.
7.2.10 Pinch Analysis This method of analysing thermal energy flows in a process provides a simple
technique for setting energy targets. It allows the engineer to identify the most
beneficial matches between heat exchangers and process streams and to
assess, at minimal cost, the economic effect of changing process operating
conditions.
By representing the heat available in hot process streams as a hot composite
curve and the heat required by the cold process streams as a cold composite
curve, Baxter can make use of a convenient tool for seeing at what
temperature heat is required and how much energy is necessary overall.
Specifying an allowable temperature difference between the hot and cold
streams fixes the separation between the curves. The pinch divides the
process into two regions:
• A high temperature region, or heat sink which requires the input of energy
• A low temperature region or heat source which requires cooling to remove
an excess of energy.
Once the basic concept of pinch analysis has been understood it is possible
to address all aspects of the process design, determine the optimum process
conditions and select the most suitable utility supply systems.
Report Completed: September 2004 19
For
insp
ectio
n pur
pose
s only
.
Conse
nt of
copy
right
owne
r req
uired
for a
ny ot
her u
se.
EPA Export 25-07-2013:19:17:05
Page 20
LGM Ireland Ltd. – Energy Services Ltd. Baxter Healthcare - Energy Survey Report
7.2.11 Pipe Heat Losses Insulation on valves etc. should be checked and improved where necessary.
Pipe systems with uninsulated flanges could have twice the heat losses of a
fully insulated system. A comprehensive steam leak test should be
undertaken on all distribution pipework.
7.2.12 Performance Indices Simple performance indices are for initial energy assessments. Baxter have
historically been monitoring the plants total energy consumption and
comparing it to the quantity of product produced. Fig.1 in Appendix C
indicates the yearly improvement which have been achieved on site over the
past 14 years. Baxter continuously monitor the energy performance indices
and continue to strive to reduce the amount of energy consumed compared to
product manufactured.
Report Completed: September 2004 20
For
insp
ectio
n pur
pose
s only
.
Conse
nt of
copy
right
owne
r req
uired
for a
ny ot
her u
se.
EPA Export 25-07-2013:19:17:05
Page 21
LGM Ireland Ltd. – Energy Services Ltd. Baxter Healthcare - Energy Survey Report
Report Completed: September 2004 21
APPENDICES Appendix A Fig. A1. Historical Maximum Demand Vs Maximum Import Capacity Fig. A2. Historical Electricity Consumption Fig. A3. Historical Heavy Fuel Oil Consumption Fig. A4. Historical Water Consumption Appendix B Fig. B1.Electricity Demand for Compressor No.4 Fig. B2. Electricity Demand for Compressor No. 6 (VSD Controlled) Fig. B3. Electricity Demand for Chillier No.2
Appendix C Fig. C.1. Energy Efficiency Utilisation
Appendix D Compressed Air Audit Synopsis
For
insp
ectio
n pur
pose
s only
.
Conse
nt of
copy
right
owne
r req
uired
for a
ny ot
her u
se.
EPA Export 25-07-2013:19:17:05