Shadd Cabalatungan Honors Thesis 1 THE CONSEQUENCES OF ALCOHOL CONSUMPTION FOR DRINKING AND NON-DRINKING STUDENTS Shadd Cabalatungan A thesis submitted in partial fulfillment of the requirements for the Bachelor of Arts with Department Honors in Sociology at University of California – Davis With guidance from faculty advisor: Dr. Bill McCarthy
Transcript
Shadd%Cabalatungan% Honors%Thesis% 1%%
THE CONSEQUENCES OF ALCOHOL CONSUMPTION FOR DRINKING AND NON-DRINKING STUDENTS
Shadd Cabalatungan
A thesis submitted in partial fulfillment of the requirements for the
Bachelor of Arts with Department Honors in Sociology at
THE CONSEQUENCES OF ALCOHOL CONSUMPTION FOR DRINKING AND NON – DRINKING STUDENTS Shadd Cabalatungan, Bill McCarthy, Sociology Department, University of California - Davis One Shields Avenue Davis, CA 95616
Many college students experience negative effects of alcohol consumption; however, most research examines these consequences for students who drink. There are relatively few studies that consider the consequences of others’ drinking for students who abstain from alcohol consumption. In this study, I investigate whether other students’ alcohol consumption negatively influences the academic and social lives of non-drinking college students. I examine the “second hand effects” of alcohol with a scale measure of the negative consequences of drinking. This scale includes the following problems: study or sleep disruption, verbal abuse, property damage, and sexual assault. I examine associations between this scale and three outcomes: grades, dissatisfaction with school, and anxiety about grades. Method: The variables measured in the study were drawn from a nationally representative sample of students, Wechsler’s Harvard College Alcohol Study 2001 (n = 10, 904 from119 universities). Multiple regression models were used to assess relationships between the negative consequences of others’ drinking and outcome variables, independent of important controls (e.g., age, gender, and race). As well, comparisons were used to assess whether these relationships differed for abstainers relative to drinkers. Results: Students who drink alcohol (n = 8,453) and those who abstain (n = 2,286) do not experience equally the negative consequences of their peers’ alcohol consumption; instead, the relationship between experiencing second hand effects of alcohol consumption and lower academic record and greater dissatisfaction with life at school are more pronounced for students who abstain. Conclusion: The consequences of college drinking are not limited to individual college drinkers, but may extend to their non-drinking peers. Indeed, college students who abstain from alcohol appear to suffer more from their peers’ drinking, compared to students who drink. College alcohol programs should extend their focus from drinkers to abstainers and develop intervention strategies that will promote health and well-being for both groups.
Shadd%Cabalatungan% Honors%Thesis% 5%%
Introduction
On college campuses across America, alcohol related culture is entwined in school
customs, social norms, and the academic institution itself. Although the majority of college
undergraduates are below the legal drinking age, alcohol continues to be widely used on most
college campuses today. The consequences of heavy or “binge” drinking pose serious risk for
drinkers, but also for those in the immediate environment (Wechsler et al. 1994). Heavy drinking
has been associated with physical or sexual assault, criminal violations, and unsafe sexual
activity (Wechsler et al. 1994). Heavy alcohol use has also been linked to adverse health
consequences including vehicle accidents, injuries, and accidental deaths. In research on college
students, heavy drinkers have been found to have lower academic grades, miss class, and to fall
behind in school work most often. According to the National Institute on Alcohol Abuse and
Alcoholism, about four out of five college students drink alcohol (NIAAA 2004a). Half of all
college students who consume alcohol, drink heavily.
The majority of existing research on college drinking has focused on the consequences
for the student who actively consumes alcohol; yet, virtually all college students experience the
effects of college drinking – whether they drink or not. Although heavy drinkers invite negative
consequences for themselves, many of the problems involve others. These secondary
consequences include vehicle injuries, verbal disputes, and property damage (Wechsler et. al.
1994). Existing research has shown that families of alcoholics are negatively affected by the
drinker and may become victims of violent assault (Leonard 1993). Carnegie Foundation (1990)
found that alcohol abuse is also related to campus crime.
This study seeks to examine the “second hand effects” of alcohol for two distinct
categories of college students: students who abstain from alcohol consumption and those who
actively drink. These second hand effects may include: having a serious argument, experiencing
Shadd%Cabalatungan% Honors%Thesis% 6%%study or sleep disruption, and/or sexual assault (refer to methodology section for more detail). I
examine associations between these secondary consequences of college drinking with multiple
regression models of three outcome variables: grades, overall satisfaction with life at school, and
anxiety about grades. I examine the consequences of peers’ drinking independent of
demographic and background controls (e.g., age, race, gender, parents’ drinking). The variables
measured in this study were drawn from a nationally representative sample of students,
Wechsler’s Harvard College Alcohol Study (CAS) 2001 (n = 10, 904 & 119 universities).
My study is important because it examines the relationship between secondary drinking
effects and a student’s college experience. I contribute to existing literature by drawing
comparisons between students who abstain from alcohol to those who actively drink in regards to
their social and academic trajectories while in college. Previous research has highlighted a
positive relationship between student drinking level and the experience of secondary drinking
effects (Wechsler et al. 1995). Also, students attending colleges or universities with higher
incidences of heavy drinking are more likely to experience these second hand effects. However,
current research has not shown how non-drinking students’ academic experiences are affected by
their peers’ drinking. My results show that students who drink alcohol and those who abstain do
not equally experience the negative consequences of their peers’ alcohol consumption; instead,
the relationship between experiencing second hand effects of alcohol consumption and lower
academic grades and greater dissatisfaction with life at school is more pronounced for students
who abstain.
The secondary effects of heavy drinking can transform the college environment from a
jovial academic setting to one where the quality of life is degraded and academic scholarship is
weakened. My research is beneficial to college alcohol programs and suggests that they should
Shadd%Cabalatungan% Honors%Thesis% 7%%modify interventions strategies to promote health and well–being for both groups on college
campuses.
Below I define my research question and hypothesis. I provide a concise review of
current material relating to the structure of post–secondary education highlighting the role of
alcohol across college campuses. I examine how colleges systematically accommodate the
“party” scene that influences the prevalence of alcohol consumption on campus. I then
summarize existing research regarding a student’s academic achievement and satisfaction at a
college or university.
The methodology section of my thesis describes in more detail the 2001 College Alcohol
Study. This section describes the variables used in the study, how the survey was administered,
to who the survey was administered, and the processing of data. The methodology section
includes the types of regression models used in this study. My findings are presented in the
results section and are divided according to each outcome variable: grades, satisfaction with life
at school, and anxiety about grades. I conclude my thesis by discussing the implications of my
research.
Shadd%Cabalatungan% Honors%Thesis% 8%%
Research Questions
My study examines the negative consequences of peers’ drinking behavior for the academic and
social outcomes of college and university students. It also compares the consequences for two
distinct sub-groups: students who drink and those who abstain. The main questions of this study
are:
(1) How extensive are second-hand effects of drinking among college and university students?
(2) Are problems more pronounced for students from a particular subgroup? Are they worse for
males compared with females? Do students belonging to a racial minority group suffer to a
greater extent from their peers’ drinking behavior in comparison to Caucasian students? Do
abstainers suffer more relative to drinkers?
(3) Does exposure to the second-hand effects of drinking have similar consequences for grades,
anxiety about grades, and satisfaction for all university students or do these differ for abstainers
or drinkers?
Shadd%Cabalatungan% Honors%Thesis% 9%%
Literature Review
The Structure of Higher Education
An extensive literature documents the prevalence of alcohol and its related consequences
in U.S. universities and colleges. Wechsler and colleagues (1994) found that about two in five
students (44%) attending 4–year colleges drink alcohol at a high level and that binge drinking
was widely accepted. Moreover, many students begin drinking heavily while attending college:
Wechsler et al. (1994) found that approximately, one out of four students who did not drink
heavily in high school started drinking to excess in college (also see Turrisi et al. 2006). For
many students, drinking is a social norm and an integral part of higher education (Chauvin
2012).
Understanding college drinking requires an examination of the “experimental core of
college life” – the time between college entry and exit (Burawoy 2009) and a consideration of
alcohol’s role as part of the structure of the university. Universities are complex organizations;
Clark Kerr, former chancellor of the University of California–Berkeley described post–World
War II American Universities as “multiversities” that attempt to satisfy a broad range of
constituencies that include local taxpayers, the institutional budget, state laws, and the U.S.
government (Carr and Kefalas 2009). According to Hamilton and Armstrong (2013), four year
residential colleges have long depended financially on the patronage of upper and middle class,
pre - dominantly white families. The influence of this group has increased in recent years
because of the state’s declining financial support for post-secondary education. As a result,
tuition now accounts for the biggest share of revenues (Brint 2012) and many public universities
have increased the proportions of students who either generate more tuition dollars or who
require the least financial aid and thus cost the university the least (Armstrong and Hamilton
2013). This type of selective admission favors the portion of affluent, white students who require
Shadd%Cabalatungan% Honors%Thesis% 10%%less financial support than their minority counterparts (Armstrong and Hamilton 2013). As a
result, institutions are forced to provide the social experiences desired by this constituency.
The Party Scene
Colleges have implicit “pathways,” that students fall into depending on a variety of
factors such as ethnicity and socio–economic status (Armstrong and Hamilton 2013). One
pathway, the “party pathway,” centers on alcohol consumption and is more popular among
students who are socially-oriented and affluent. Students in this group are not seeking social
mobility through college, in comparison to their minority counterparts. The majority of these
students have enough cultural, social, and economic capital from their parents to secure a stable
career following graduation (Armstrong and Hamilton 2013). These students enroll in large state
schools for social aspects of college, such as athletics or partying events rather than for academic
reasons (Armstrong and Hamilton 2013).
Universities and colleges indirectly support alcohol consumption and the “party scene,”
by catering to the organizations where these are most common, most notably, Greek
organizations (Cashin et al. 1996). Cashin and colleagues (1996) found that 46% of 4–year post-
secondary institutions have fraternity and/or sorority systems. According to Armstrong and
Hamilton (2013), there is an institutionalized partnership between Greek chapters and many
post-secondary schools as many Greek organizations donate to the university, mostly by way of
wealthy alumni or philanthropic events. In addition, many large state universities allow pre–
dominantly white Greek chapters to own valuable property on and near campus, which affords
these organizations a measure of power unlike any other student organization (Armstrong and
Hamilton 2013). Greek housing is generally owned by the national organization or local chapter
Shadd%Cabalatungan% Honors%Thesis% 11%%and not by the university. This limits Greek organizations vulnerability to legal sanctions for
hosting large parties or being cited for underage drinking (Armstrong and Hamilton 2013).
University resources allow Greek society to dominate the social life on campus. As a
result, most college students are encompassed within an atmosphere centered upon drinking and
partying (Cashin et al. 1996). Even if students were willing to socialize without alcohol,
universities offer few opportunities. For example, students who are below the drinking age have
few options for dancing other than fraternity parties. Many university-sponsored events also
reduce coed interaction, because they are often viewed as “uncool” (Armstrong and Hamilton
2013). In an ethnographic study of college women, Armstrong and Hamilton (2013) observed
how students who were non–Greek affiliated often struggled in forming and maintaining social
relationships in their first year in college. The difficulty in forming relationships was pronounced
for students who refused to consume alcohol or attend parties and social ties were sometimes
severed when one person actively engaged in the party scene while the other abstained.
Consequences for the Drinker
Research on college alcohol consumption has found that heavy drinkers are at an
increased risk for drinking-related problems such as criminal violations, injuries, and engaging in
unplanned sexual activity (Wechsler et al. 1994). Presley and colleagues (1993) found that heavy
drinkers missed more classes and had poorer grades. Excessive drinking may also have long-
term health consequences such as liver failure or cirrhosis, and increases the odds of an alcohol
overdose (Eigen 1991).
Shadd%Cabalatungan% Honors%Thesis% 12%%
Overview of Second Hand Effects
Excessive drinking in college may also have negative effects for others. Individuals that
are affected from second hand effects of alcohol may include administrators, families,
neighborhood residents, and students (Leonard 1993). Colleges with higher reports of alcohol
abuse have higher crime rates and the communities in which they are located often have higher
alcohol–related auto accidents and property damage (Carnegie Foundation 1990). Wechsler et al.
(2002) found that people who lived near college campuses were more likely to report lower
neighborhood quality as a result of second hand effects of alcohol from noise, vandalism, and
disturbances such as public urination.
Other students may be particularly vulnerable to second-hand effects of other’s drinking,
especially those who live on campus, and thus are in the institutionalized environment 24 hours a
day (Wechsler et al. 1994). Wechsler et al. (1994) found that 66% off respondents in the 1993
College Alcohol Study had experienced at least one of eight adverse consequence from other
students’ drinking (e.g., experienced an unwanted sexual advance) and that students who
belonged to a Greek organization were at a higher risk of experiencing secondary effects.
Students who consume alcohol on a regular basis also experienced more adverse consequences
of other students’ drinking, compared to both moderate drinkers and to abstainers. Additional
analyses that focused on the level of drinking at a school (low, mid, and high level) and found
that abstainers and moderate drinkers at high-drinking level schools were more likely than
students at lower-drinking level schools to experience problems as a result of the drinking
behavior of their peers. The odds of experiencing at least one of eight problems was 3.6 to 1
when students at high drinking level schools were compared to their counterpart at lower
drinking level schools (Wechsler et al. 1994).
Shadd%Cabalatungan% Honors%Thesis% 13%%This pattern is independent of gender, parental education, race, Greek affiliated, lived in alcohol
– free dormitory residence, and the respondents’ drinking experience in their last year of high
school (Wechsler et al. 1994).
Academic Achievement
Most research on drinking and college academic performance report that students with
higher GPAs reported consuming less alcohol than students who reported lower GPAs. Preseley
et al. (1994) found that respondents in the CORE survey, with a GPA of “A” drank an average of
3.3 alcohol drinks per week, students with a “B” drank 4.8 drinks, students with a “C” drank 6.1
drinks, and students with a “D” or “F” drank 9.0 drinks per week. Engs et al. (1996) came to a
similar conclusion in a study that used the Student Alcohol Questionnaire (SAQ): students who
had low GPAs were more likely to be heavy drinkers. This relationship was consistent for
students in each academic year.
Pascarella et al. (2007) found that students who consumed excessive alcohol at a higher
frequency also experienced a greater deficit in their academic performance. The negative
academic effects of binge drinking persisted in the presence of confounding influences such as
sex, race, family background, year in school, high school experiences, academic major, and place
of residence. Moreover, there was no easily identifiable group who were most at risk
academically from binge drinking: excessive alcohol consumption had negative academic
consequences for a broad spectrum of undergraduate students.
Two studies that use data from the College Alcohol Study (CAS) concluded that drinking
affects GPA both directly, through its effect on cognitive ability, and indirectly, through study
habits (Woalver 2002; Pascarella et al. 2007). Powell et al. (2004) also found an association
between alcohol use and study habits in their comparative study of first year and upper-level
students. They found that each additional drink an upper-class student consumed increased the
Shadd%Cabalatungan% Honors%Thesis% 14%%likelihood of missing a class by 9% and getting behind in school work by just over 5%.
Research by Rau and Durand (2000) underscores the difficulty in assessing the causal direction
of the relationship between drinking and academic performance. They found that students who
received higher grades also placed a high a high value on academic performances and consumed
little to no alcohol. In comparison, students who gave less priority to academics and who did not
believe in daily studying consumed more alcohol.
In a study that examined gender differences, Engs et al. (1996) found that males drank to
excess more than females did, and that they experienced more academic problems such as lower
GPA. However, Walover (2007) found that the impact of binge drinking on academics is
essentially the same for both genders. Although men and women consume different amounts of
alcohol, study differently, and have different average GPAs, they experienced similar decreases
in grades for excessive alcohol consumption.
Other studies, however, have not found evidence of an association between excessive
alcohol consumption and academic performance. Paschall and Freisthler (2003) conducted a
cross–sectional, single institutional study and concluded that heavy alcohol use and drinking
opportunities do not have an important effect on academic performance while in college.
Similarly, Wood et al.’s (1997) longitudinal study also found no association between problem
drinking and academic performance once control variables were introduced. Both studies
acknowledged that drinking alcohol may cause a student to miss class or perform poorly on an
exam, but they argued that these alcohol–related problems may not ultimately affect students’
grade point average. There are many possible reasons other than alcohol use for students to have
lower GPAs including the following: higher academic demands than high school; lack of interest
in a course; unwillingness to study; and personal factors (Paschall and Freisthler 2003). In other
Shadd%Cabalatungan% Honors%Thesis% 15%%words, other non–alcohol related factors may be more influential in determining students’
academic performance and GPA.
Overall, the body of evidence concerning the impact of excessive alcohol consumption or
“binge drinking,” on college academic performance is inconsistent. In part, this may be due to
differences in research design and analysis (Pascarella et al. 2007). Some studies are cross-
sectional, others longitudinal, and the studies vary in the extent to which they incorporated
control variables for confounding influences.
Overall Satisfaction in College
Most studies on college student satisfaction use satisfaction surveys (e.g., CIRP, SSI,
NSSE) to measure student perceptions of the college experience (Billups 2008). Research has
shown that a students' positive perception of academic programs and personal affiliations with
peers and faculty contribute to feelings of “student–centeredness” (Elliot 2003). Students who
feel accepted at their institution are more likely to stay in school and feel satisfied with their
overall experience.
Existing literature is fairly limited to explaining the relationship between college drinking
and a students’ satisfaction with life at school. Chauvin (2012) examined social motives to
college drinking and found that students actively participate in drinking to elevate their social
status and thus are more likely to be satisfied with life at their university. Alcohol may serve as a
gateway for student satisfaction while in college by promoting a higher social status. Cashin et
al. (1998) found that Greek affiliated students are more likely to be satisfied with life at school.
This may in part be due to the high social status for members of Greek organizations. These
organizations themselves are well–known for excessive alcohol consumption.
Shadd%Cabalatungan% Honors%Thesis% 16%%
Previous research indicates that a number of factors contribute to a student’s satisfaction
with college or university. For example, Elliot and Healy (2001) highlighted eleven dimensions
that relate to students’ satisfaction with life at school, including the quality of classroom
interactions, the rigor of the curriculum, social interactions between peers and faculty, and a
feeling of “fitting in,” within the college culture. Borden (1995) found that students who were
able to connect with a faculty member early in their first two years of college were more satisfied
and were more likely to complete their degree. Institutions with higher graduation rates also had
higher satisfaction ratings on survey questions that measured the relationship between students
and faculty. Pascarella (1980) found a positive correlation between the quality of interaction
between a student and faculty member, and the student’s commitment to their academics and
institution. The higher quality of the relationship with a professor decreases the possibilities for
student withdrawal from the university. Academic advising also plays an important role in
student success influencing their positive perception of college. Students who received
meaningful academic advising were able to make connections with their program of study and
eventual career goals (Noel 1978). Advising staff and faculty play an important role in student
satisfaction by serving as influential mentors, guiding students on academic challenges and
working toward their career aspirations (Lamport 1993).
Factors outside of the academic setting of the university also impact a student’s overall
satisfaction with life in college. The extent to which students are involved in personal and social
growth contributes to satisfaction (Billups 2008). Students who are actively engaged in social
interaction involving group activities share a more positive view of their university (Billups
2008). If students are able to identify with peers it bolsters the college experience. Armstrong
and Hamilton (2013) found a positive correlation between the number of close friends and
satisfaction with life at college: as the number and quality of relationships with friends increases,
Shadd%Cabalatungan% Honors%Thesis% 17%%the perception of college becomes more positive. In their ethnographic research on college
women, they found that the students who actively engaged in the party scene were “happier,”
than students who found other outlets. They observed that women who refused to attend parties
or drink alcohol had a smaller group of friends, were isolated from peers, and overall, were less
satisfied with life at school. In comparison, Cashin et al. (1998) found that members of Greek
organizations, where the extent of drinking is high, had a higher overall satisfaction with life at
school than those students who were not Greek affiliated. Finally, Peters (1988) found that
student experiences off-campus were just as important to student satisfaction as the educational
component of attending a college or university.
Academic and Social Outcomes of Peer Drinking Behavior
The studies reviewed above suggest that college drinking plays a specific role within
college environments, and that certain groups are more at risk for harmful drinking behavior than
others. However, to date, studies have not examined how other students’ alcohol consumption
negatively influences academic and social outcomes, and how these effects may be heightened
for non–drinking students. Although students who abstain from alcohol consumption are not
likely to be within a close proximity of alcohol, the structure of the institution or the influence of
peer networks may heighten these secondary consequences for this particular group.
Shadd%Cabalatungan% Honors%Thesis% 18%%
Hypotheses
(1) When exposed to second–hand effects of peers’ drinking behavior, college or university
students who abstain from drinking experience a greater decrease in their academic grades
compared to students who actively participate.
(2) Exposure to the second–hand effects of peers’ drinking behavior will diminish the
satisfaction of attending a university or college to a greater extent for students who abstain from
alcohol compared to those who drink.
(3) When exposed to second hand effects of peers’ drinking behavior, students who abstain from
alcohol consumption are more likely to have anxiety over their academic grades in comparison to
students who drink.
Shadd%Cabalatungan% Honors%Thesis% 19%%
Research Methodology
Overview
The data for this study are from the 2001 Harvard School of Public Health College
Alcohol Study. This study is the most recent in a series of large–scale, nationally representative
surveys of college drinking, educational experiences, and overall health. The studies were
conducted by Henry Wechsler, a researcher at Harvard University. In its entirety the College
Alcohol Study consists of four surveys from 1993, 1997, 1999, and 2001 and involve more than
50,000 students and 120 universities (Wechsler and Nelson 2008). The four surveys constitute a
broad cross–section of U.S. 4 year colleges and universities.
Selection of Universities/Colleges
The sampling frame for the 1993 study was drawn from the American Council on
Education’s list of four-year colleges (the 2014 list has more than 5,000 colleges or universities).
These institutions are accredited by one of the six regional bodies covering the United States
(Wechsler et al. 1994). One hundred and seventy nine colleges and universities were originally
selected for the sample; however, the sampling procedures for selecting universities and colleges
for the 1993 survey are not clear. In his first publication regarding the College Alcohol Study,
Wechsler and colleagues (1994) reported that the sample was selected using probability
proportionate to enrollment size, but it is unclear how the proportions were determined. Other
research describes the sample as being drawn with a nested sampling technique (Ward and
Gryczynski 2009). It is therefore, unclear how institutions were originally selected.
The original sample contained few women-only colleges and few colleges with less than
1000 students so 10 all–women colleges and 15 colleges with enrollments of less than 1000
students were added (Wechsler et al. 1994). Nine colleges were subsequently dropped from the
Shadd%Cabalatungan% Honors%Thesis% 20%%sample because the structure of the institution was deemed inappropriate for a comparison with
other schools. The dropped institutions included military schools, allied health schools, and
seminary schools. One hundred forty colleges and universities (72% response rate) of the
corrected sample size of 195 institutions agreed to participate (Wechsler et al. 1994).
Follow-up studies
The same sample of universities used in 1993 was used in the follow–up surveys (1997,
1999, and 2001); however, the total number of participating colleges varied from year to year. In
the 1993 survey 140 schools participated, while in 2001 only 119 participated (85% response
rate from 1993 sample). Several institutions were dropped from the original 140 selected
institutions because they did not provide the random sample of students in a timely manner or
did not have a high enough response rate to warrant remain in the study (Eisenberg and Wechsler
2003).
In the 1993 study, participating colleges were located in forty states and the District of
Columbia (Wechsler et al. 1994); in the 2001 survey, thirty-eight states as well as the District of
Columbia were represented (Chauvin 2012). Approximately two-thirds of the institutions in the
sample were public, while the remaining one-third were private (Wechsler et al. 1994). The
majority of schools were located in a suburban setting, while the remaining were in small towns
or rural settings (Wechsler et al. 1994). It is unclear whether the sampling frame of universities
and colleges was stratified based on public/private institutions or school location
(suburban/rural). Women only colleges made up less than five percent of the sample and
predominantly black institutions made up approximately four percent (Wechsler et al. 1994).
Shadd%Cabalatungan% Honors%Thesis% 21%%
Sampling of Students
The designers of the study provided specific guidelines to aid college and university
administrators in selecting a random sample of students. All full-time undergraduate students
were eligible for the study (i.e., from 1st year to graduating students). The guidelines called for a
random sampling of students using probability proportionate to the size of the college or
university sampled. A random sampling point was designated and students were selected based
on each university’s registry (Wechsler et al. 1994). For example, every xth student was selected
from the registry starting from the initial random sampling point. In the 1993 study the majority
of participating institutions—127—provided a sample of 215 students, whereas the remaining 13
institutions each provided 108 students. Twelve of the smaller sample schools are from the
oversample of colleges.
Mailing System
The researchers dropped students from the sample if they were on a leave of absence, had
withdrawn from school, or if the institution had provided an incorrect address. In the 1993
survey, 28, 709 students were mailed a 20 page self-report survey (Wechsler et al. 1994). The
survey was mailed to participants in early February with a June return deadline. Students
received a total of four mailings from the study: the initial questionnaire, a reminder postcard, a
second questionnaire, and a second reminder postcard. An unknown number of students may
have not had their questionnaires delivered. The study assured students that their participation
was voluntary and that their responses were confidential. It used several lottery-based financial
incentives to encourage the timely completion of the survey: a $1000 award for students who
returned the survey within one week, and one $500 award and ten $100 awards for students who
sent back the survey within the five month deadline (Wechsler et al. 1994).
Shadd%Cabalatungan% Honors%Thesis% 22%%
In the 1993 study, just over 60% of students (n=17, 592) returned a completed survey
(Wechsler et al. 1994). Of those who returned their surveys, approximately 88% sent it back
within two months; another 10% completed them by the end of the third month; and the
remaining 2% of students returned their surveys toward the end of the five-month deadline.
Student response rates varied by college from approximately 60% to 80% and only six colleges
had a response rate lower than 50% (Wechsler et al. 1994). In the 2001 study, 10, 904 students
completed the survey (Chauvin 2012).
Questionnaire Descriptive
The College Alcohol Study was designed similarly to an earlier large–scale
epidemiological study on drinking (Wechsler et al. 1994). It surveys students’ use of alcohol and
other types of drugs and their involvement in organizations, Greek life, and athletics. The survey
questions range from individual alcohol usage, students’ perception of drinking, to consequences
of peers’ drinking behavior (Wechsler et al. 1994). In the study, an alcoholic drink was defined
as 12 ounces (360 mL) of beer, four ounces (120 mL) of wine, 12 ounces of wine cooler, or a
shot (1.25 oz [37 mL]) of liquor straight or in a mixed drink (Wechsler et al. 1994).
2001 College Alcohol Study Sample Characteristics
This analysis presented below uses data from (10, 904) undergraduate students at 119
United States 4–year institutions. The sample includes more women (55%) than men (45%),
primarily because of the inclusion of all women colleges. The sample is predominantly white
(72%), an attribute that coincides with the United States Department of Education report that
about 80% of undergraduates at 4–year institutions are white or non- Hispanic. About 13% of the
sample reported that they were involved in Greek life and 15% of students described themselves
as college athletes. Approximately 43% of students reported living on campus in a dormitory,
fraternity/sorority, or apartment. Respondents reported that more fathers than mothers drank
Shadd%Cabalatungan% Honors%Thesis% 23%%moderately or more (29% versus 11% respectively). About two-thirds of respondents said that
their families generally approved of some (at least infrequent) alcohol use. Approximately 44%
of the students surveyed engaged in binge drinking (the same percentage as reported this in the
first national survey in 1993).
Measures
Dependent variables
The study examines three dimensions of academic life. The first, academic achievement,
is measured with a question that asked about the respondents’ overall, average grade for the
current year. There were seven possible responses: (1) = C or lower, (2) = C+ (3) = B-, (4) = B,
(5) = B+, (6) = A-, and (7) = A. The second dimension, the importance of academic work, is
measured with responses to a Likert-style question that asked students directly about the
“importance” of their school work. Responses to this item were recoded to create a dichotomous
measure (0= Not Important 1= Important) because the variable had a bimodal distribution with
few students choosing answers that fell in between the ends of the answer continuum. The final
dimension, satisfaction, is measured with another Likert-style question that asked about
“satisfaction with life at school.” This variable was also recoded into a dichotomous measure (0
= Dissatisfied, 1= Satisfied).
Independent variable
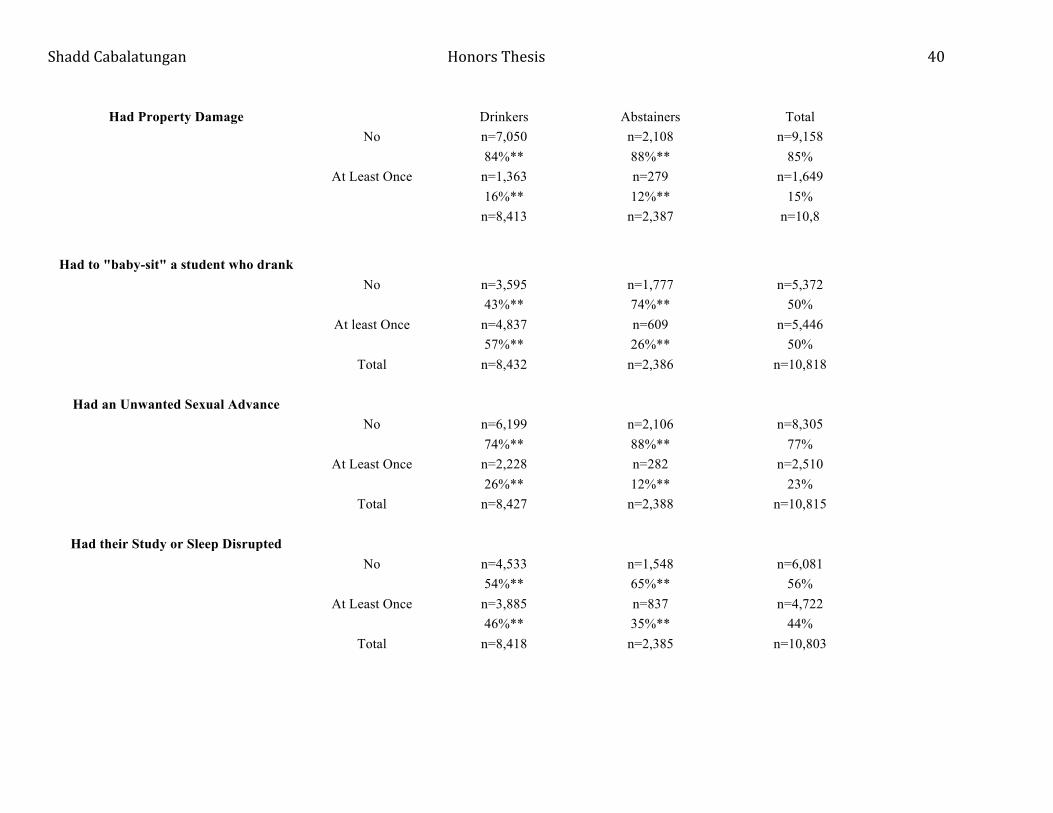
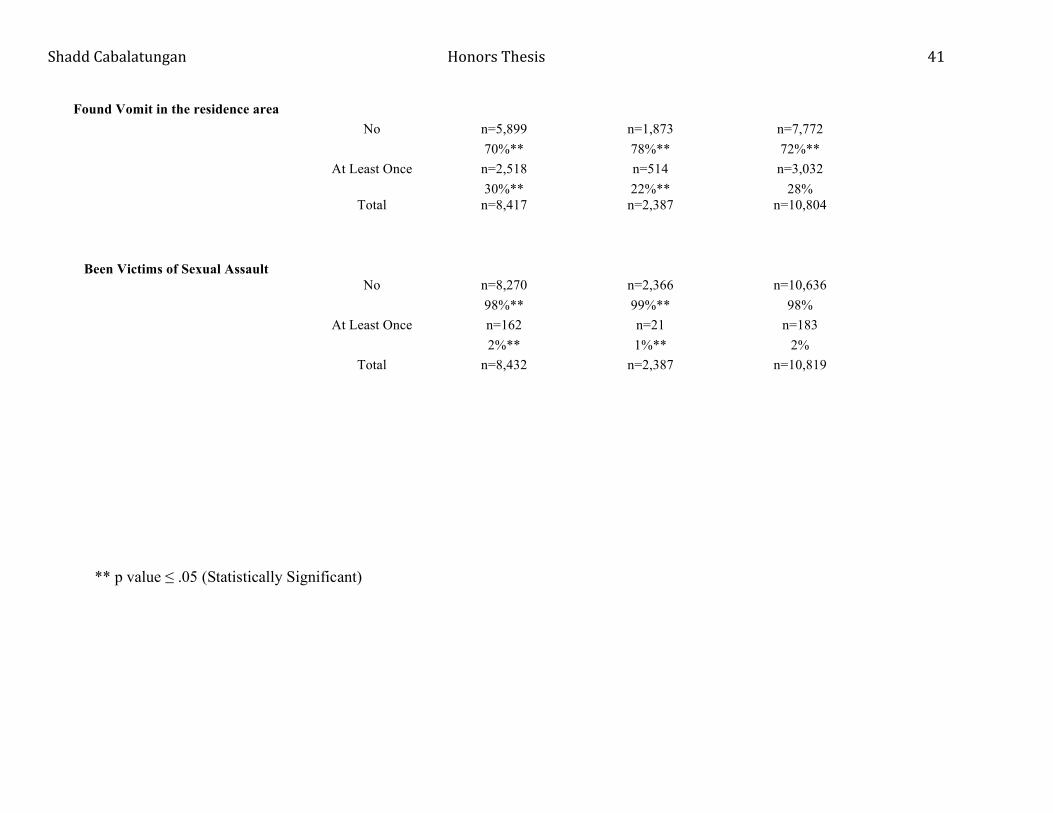
The key independent variable in this study, problems related to other students’ drinking,
is a scale based on responses to eight questions. Answers to these questions are strongly
correlated (alpha= .766) and thus can be used to create a scale. The questions asked students how
frequently since the beginning of the school year, they had experienced the following problems
“because of other students’ drinking”; been insulted or humiliated; had a serious argument or
quarrel; been pushed, hit, or assaulted; had your property damaged; had to “babysit” or take care
Shadd%Cabalatungan% Honors%Thesis% 24%%of another student who drank too much; had your study or sleep interrupted; experienced an
unwanted sexual advance; or had been a victim or sexual assault or date rape. There were four
response categories for each question: (1) = not at all, (2) = once, (3) = 2-3 times, (4) = four or
more times.
Control Variables
The following variables were included as controls: age; gender; race; religious affiliation;
year in school; member in Greek life (fraternity or sorority); and drinking behavior at the end of
high school and in college. Age is measured with nine responses: (0) = 17, (1) = 18, (2) = 19, (3)
= 20, (4) = 21, and (5) = 22 or over. Gender is a dichotomous variables (0 = male, 1 = female)
and race is measured by a set of dummy variables, with white as the comparison group (74%).
Religious affiliation was measured as a dichotomous variable (0 = religious, 1 = nonreligious).
Year in school is based on five responses: (1) = first year, (2) = second year, (3) = third year, (4)
= fourth year, and (5) = fifth year or beyond A dichotomous measure distinguishes student who
were members in a fraternity or a sorority from those who did not have this affiliation (0 = Yes, 1
= No). The variable, “drinking behavior in high school,” is based on responses to the following
question: “How often did you drink alcohol during a typical month during your last year in high
school?” Students selected one of seven possible answers: (1) = Never, (2) = 1 – 2 occasions, (3)