Consequences of ICAO’s aviation and climate change policy Paul Peeters (1) (2) (3) (1) NHTV Centre for Sustainable Tourism & Transport, Breda, NL (www.cstt.nl; [email protected]) (2) Faculty of Technology, Policy and Management, Delft University of Technology, Delft, The Netherlands (3) Environmental Sciences, Wageningen University, Wageningen, The Netherlands Changes in tourism Vakantiebeurs Utrecht, 11 th of January 2017
Transcript
Consequences of ICAO’s aviation and climate
change policy
Paul Peeters(1) (2) (3)(1)NHTV Centre for Sustainable Tourism & Transport, Breda, NL
(www.cstt.nl; [email protected])(2)Faculty of Technology, Policy and Management, Delft University of Technology, Delft, The Netherlands
(3)Environmental Sciences, Wageningen University, Wageningen, The Netherlands
Changes in tourismVakantiebeurs
Utrecht, 11th of January 2017
2
Options to Reduce Aviation’s CO2 Emissions
• Technology and Standards• Sustainable Alternative Fuels (SAF)• Global Market Based Measures (GMBM):
– Emission charges– Emissions trading– Offsetting
3
Options to Reduce Aviation’s CO2 Emissions
• Technology and Standards CO2 standard• Sustainable Alternative Fuels (SAF)• Global Market Based Measures (GMBM):
– Emission charges– Emissions trading– CORSIA
4
CORSIA (former GMBM)• Carbon Offsetting and Reduction Scheme for
International Aviation (CORSIA)• Airlines buy carbon offsets for every
additional ton of CO2 above 2020 emissions.• Three groups of countries based on global
national income (GNI) per capita and revenue ton kms (RTKs)
• Phased introduction: – 2021: rich or high level RTK– 2026: medium plus rich incl. low level RTK– never: LDC’s (Least developed Countries)
Zervas, E. (2010). Analysis of the CO2 emissions and of the other characteristics of the European market of new passenger cars. 1. Analysis of general data and analysis per country. Energy Policy, 38(10), 5413-5425.
Impr
ovin
g ef
ficie
ncy
9
The CO2 standard Metric Value
Reference Geometric Factor RGF:
The measured Specific Air Range (SAR):
Aircraft fuel efficiency and aviation total emissions
0
100
200
300
400
500
600
700
0.0
0.5
1.0
1.5
2.0
2.5
3.0
3.5
4.0
1940 1960 1980 2000 2020 2040 2060
Glo
bal a
viat
ion
emis
sion
s (M
ton/
yr)
Ener
gy In
tens
ity E
I(M
J/as
k)
Year of market introduction
Long haul aircraft fuel efficiency
IPCC values
Sigmoidal regression
Additional jet airliners
Global aviation emissions
11
And being an consultant at ICAO for an NGO…
• ICAO CAEP/10 – Working Group 3 CO2 Task Group3rd Meeting
• Madrid, SpainMonday 9th to Friday 13th September 2013
12
Albritton, D., et al. (1997). Global atmospheric effects of aviation. Report of the Proceedings of the symposium held on 15-19 April 1996 in Virginia beach Virginia, USA. WashingtonPenner, J. E., Lister, D. H., Griggs, D. J., Dokken, D. J., & McFarland, M. (1999). Aviation and the global atmosphere; a special report of IPCC working groups I and III. In. Cambridge: Cambridge University Press.
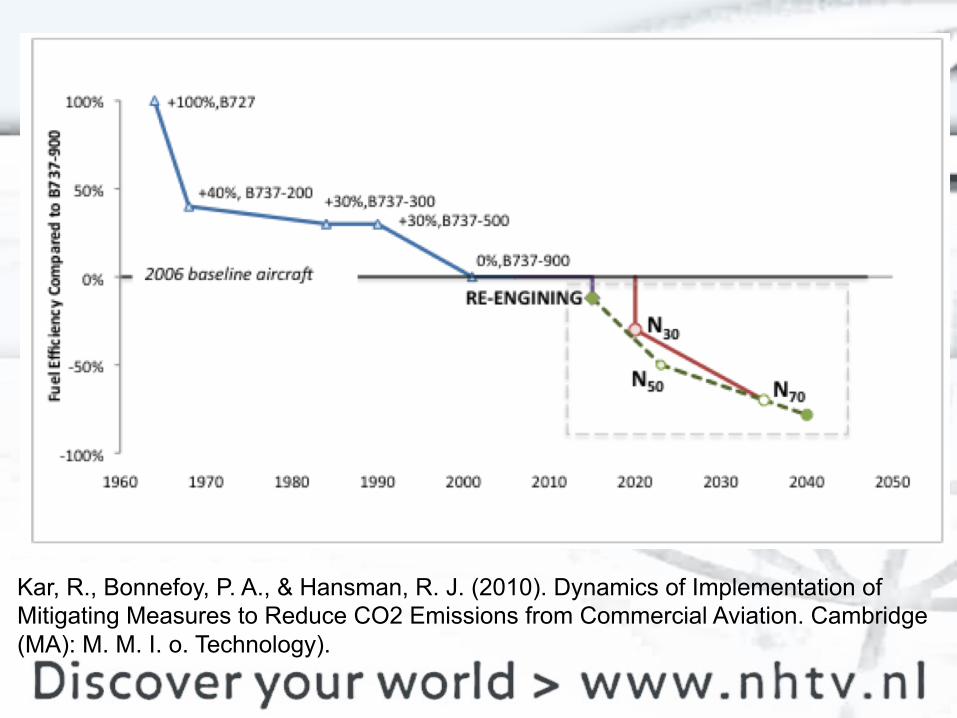
Kar, R., Bonnefoy, P. A., & Hansman, R. J. (2010). Dynamics of Implementation of Mitigating Measures to Reduce CO2 Emissions from Commercial Aviation. Cambridge (MA): M. M. I. o. Technology).
Babikian, R., Lukachko, S. P., & Waitz, I. A. (2002). The historical fuel efficiency characteristics of regional aircraft from technological, operational, and cost perspectives. Journal of Air Transport Management, 8, 389-400.
Lee, J. J., Lukachko, S. P., & Waitz, I. A. (2004). Aircraft and energy use. In C. J. Cleveland (Ed.), Encyclopedia of energy (Vol. 1, pp. 29-38). Amsterdam: Elsevier.
Rutherford and Zeinali (2009) – Efficiency Trends for Newly Delivered Aircraft.
MDG. (2012). MDG trends assessment: ICAO.
The MVdb BAU trend for MV normalised to 100t
0
0.2
0.4
0.6
0.8
1
1.2
1.4
1950 1960 1970 1980 1990 2000 2010 2020 2030
MV
norm
alis
ed fo
r 100
t
All MVdb plus >45t PA Sigm. log. 5 regression
20
0
20
40
60
80
100
120
140
1940 1960 1980 2000 2020 2040 2060
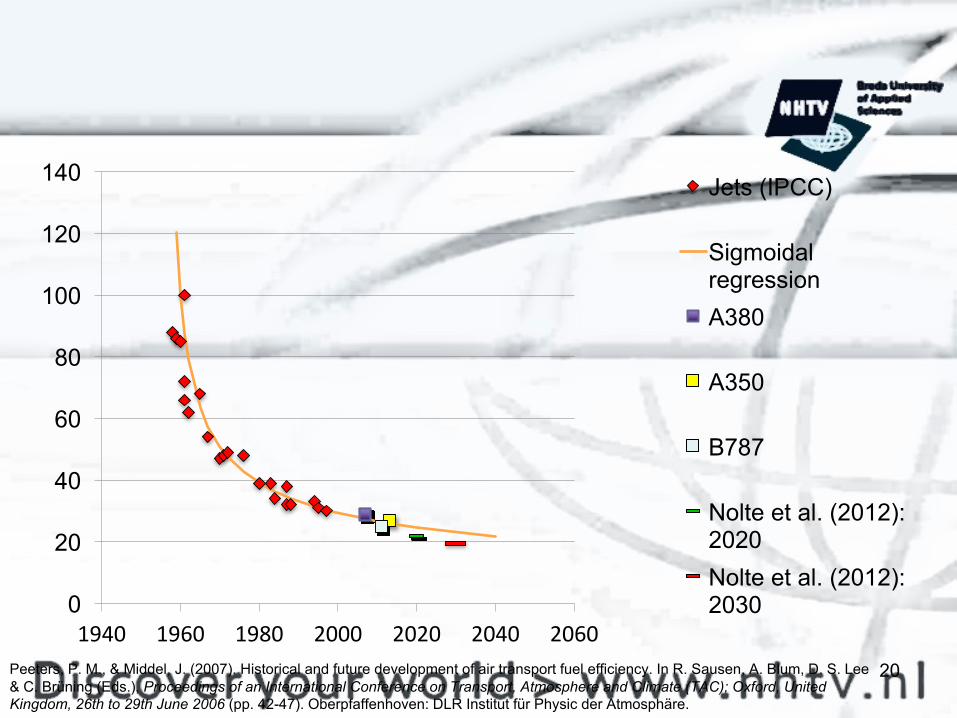
Jets (IPCC)
Sigmoidal regressionA380
A350
B787
Nolte et al. (2012): 2020Nolte et al. (2012): 2030
Peeters, P. M., & Middel, J. (2007). Historical and future development of air transport fuel efficiency. In R. Sausen, A. Blum, D. S. Lee & C. Brüning (Eds.), Proceedings of an International Conference on Transport, Atmosphere and Climate (TAC); Oxford, United Kingdom, 26th to 29th June 2006 (pp. 42-47). Oberpfaffenhoven: DLR Institut für Physic der Atmosphäre.
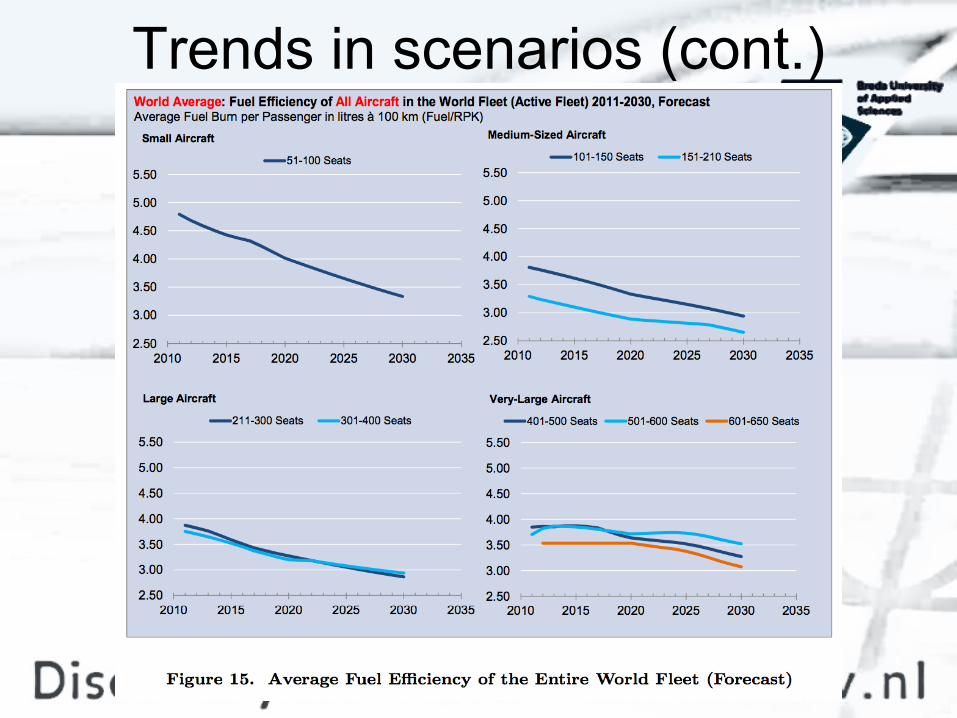
Trends in scenario studies• Out of over a hundred
scenarios studied not one assumes fuel efficiency to go backwards over the next decades/century.
• This means that a CO2standard set at a constant level for a longer period (6-9 years like for noise/NOx) has diminishing meaning for future aircraft.
Characteristics Economic Mitigation scenario in 2100• Emissions 95.5% down• Global trips, nights and
revenues as in Reference
• Average distance -40%• HSR share to 35%
(pkm)• Aviation:
– 80% pkm of 2020– 130% revenues of 2020– fleet at 11,000 aircraft
28
Modal split trips
01 Jan 1900 01 Jan 1950 01 Jan 2000 01 Jan 2050 01 Jan 21000
50
100%
*Air *Car Other Car Air
Non-commercial use only!
Modal split distance
01 Jan 1900 01 Jan 1950 01 Jan 2000 01 Jan 2050 01 Jan 21000
50
100%
*Air *Car Other Car Air
Non-commercial use only!
Conclusions• 2016 ICAO Assembly decisions set a
framework but almost ineffective and not in line with Paris goals
• CORSIA may cost couple of € per trip• CORSIA is not reducing aviation’s emissions• Offsetting by TO’s??• CO2 standard, if effective, safes cost!• Unlimited growth of aviation cannot be