Consequences of paternally inherited effectson the genetic evaluation of maternal effectsLuis Varona1,2*, Sebastián Munilla1,3, Joaquim Casellas4, Carlos Moreno1,2 and Juan Altarriba1,2
Abstract
Background: Mixed models are commonly used for the estimation of variance components and genetic evaluationof livestock populations. Some evaluation models include two types of additive genetic effects, direct and maternal.Estimates of variance components obtained with models that account for maternal effects have been the subject ofa long-standing controversy about strong negative estimates of the covariance between direct and maternaleffects. Genomic imprinting is known to be in some cases statistically confounded with maternal effects. In thisstudy, we analysed the consequences of ignoring paternally inherited effects on the partitioning of geneticvariance.
Results: We showed that the existence of paternal parent-of-origin effects can bias the estimation of variancecomponents when maternal effects are included in the evaluation model. Specifically, we demonstrated thatadding a constraint on the genetic parameters of a maternal model resulted in correlations between relatives thatwere the same as those obtained with a model that fits only paternally inherited effects for most pairs ofindividuals, as in livestock pedigrees. The main consequence is an upward bias in the estimates of the direct andmaternal additive genetic variances and a downward bias in the direct-maternal genetic covariance. This wasconfirmed by a simulation study that investigated five scenarios, with the trait affected by (1) only additive geneticeffects, (2) only paternally inherited effects, (3) additive genetic and paternally inherited effects, (4) direct andmaternal additive genetic effects and (5) direct and maternal additive genetic plus paternally inherited effects. Foreach scenario, the existence of a paternally inherited effect not accounted for by the estimation model resulted in apartitioning of the genetic variance according to the predicted pattern. In addition, a model comparison testconfirmed that direct and maternal additive models and paternally inherited models provided an equivalent fit.
Conclusions: Ignoring paternally inherited effects in the maternal models for genetic evaluation can lead to aspecific pattern of bias in variance component estimates, which may account for the unexpectedly strong negativedirect-maternal genetic correlations that are typically reported in the literature.
BackgroundGenetic evaluation based on mixed models [1] has becomethe main tool for prediction of breeding values in livestockpopulations. The most commonly used parameterizationaccounts for the direct polygenic additive genetic effect in-herent to each individual and for several systematic effects(e.g., sex, herd, season, etc.), as well as a residual source ofvariation. However, some traits may also be affected by ma-ternal genetic effects that refer to the influence from the
genome of the dam (e.g., milk production of the dam).These maternal genetic effects are commonly considered ingenetic evaluation models for some livestock populations[2, 3]. Nevertheless, variance components estimates thatare obtained with models that account for maternal effectshave been the subject of a long-standing controversy aboutthe unexpectedly strong negative estimates of the covari-ance between direct and maternal genetic effects [4–6].Genomic imprinting [7, 8] is the total or partial silen-
cing of paternal or maternal alleles in the progeny. Sev-eral specific genes with imprinted inheritance have beenidentified in livestock species [9], such as the callipygemutation in sheep [10, 11] and the insulin-like growthfactor 2 (IGF2) gene in pig [12, 13]. Imumorin et al. [14]
* Correspondence: [email protected] de Genética Cuantitativa y Mejora Animal, Universidad de Zaragoza,50013 Zaragoza, Spain2Instituto Agroalimentario de Aragón (IA2), Universidad de Zaragoza, 50013Zaragoza, SpainFull list of author information is available at the end of the article
also reported that genomic imprinting is involved in thedeterminism of quantitative trait loci (QTL) in cattle.More generally, genomic imprinting has been describedas a widespread phenomenon in other mammals [15].Studies on pig growth [16] and bovine fatness traits [17]have also provided statistical evidence for the existenceof genetic variation associated with paternal parent-of-origin inheritance that can account for over 10 % of thephenotypic variability in these traits. More recently,Neugenbauer et al. [18, 19] and Tier and Meyer [20]confirmed this result on other cattle and pig traits.Maternal effects can be statistically confounded with
maternal inheritance, as noted by Hager et al. [21]. Fur-thermore, Meyer and Tier [22] suggested that ignoringparent-of-origin effects may be one of the possiblecauses for the unexpectedly large negative estimates ofthe correlation between direct and maternal geneticeffects. In this paper, we provide further evidence thatsupports this latter argument by showing how the exist-ence of a paternal parent-of-origin inheritance caused bythe silencing of the alleles in the maternal gametes byimprinting can bias estimates of variance components inmodels that account for maternal effects. Specifically, weshow that for any two individuals that were not relatedwithin the paternal lineage, direct and maternal additivegenetic effects may generate the same expected covari-ance between relatives as paternal parent-of-origin orgametic effects. For most livestock pedigrees, the conse-quence of this is a downward bias in the estimate of thedirect-maternal genetic covariance when paternal inherit-ance occurs and is not properly accounted for. To confirmthis postulate, we developed a simulation experiment. Inaddition, we analysed a dataset of weight records at 210 daysfor the Pirenaica beef cattle population and we discuss theresults in the light of this new evidence.
MethodsQuantitative genetic modelsConsider a model with direct and maternal additive gen-etic effects. Hereafter, we use the subscripts “o” and “m”to differentiate between direct and maternal compo-nents, respectively. In addition, capital letters are used toidentify different individuals. Under this model, thephenotypic values of individuals A and B are defined as:
yA ¼ μþ aoA þ amAD þ eAyB ¼ μþ aoB þ amBD þ eB
;
where μ is the general mean, aoX and amX are the directand maternal additive genetic effects, respectively, andeX is the residual for individual X = {A, B, AD, BD}. Ac-cording to this notation, AD and BD stand for the damsof A and B, respectively.
Information for the estimation of variance compo-nents estimation originates from covariances betweenrelatives. Under the model with maternal effects de-scribed above, and assuming independence of the resid-uals, the covariance between the phenotypic values ofindividuals A and B is:
cov yA; yb� � ¼ cov aoA; aoBð Þ þ cov aoA; amBD
� �þcov amAD ; aoBð Þ þ cov amAD
; amBD
� �¼ r A;Bð Þσ2
a þ r A;Bð Þσam þ r AD;Bð Þσamþr AD;BDð Þσ2
m;
where σa2, σm
2 , and σam are the direct additive geneticvariance, the maternal additive genetic variance, and thedirect-maternal genetic covariance, respectively, andr(X,Y) represents the additive relationship between indi-viduals X and Y. In this context, the main sources of in-formation to estimate maternal parameters are theobserved correlations between phenotypes of full sibs(FS), maternal half sibs (MHS) and dam-offspring (DO)pairs. Equated to their expectations under the maternalmodel, the following expressions are obtained:
cov FSð Þ ¼ 12σ2a þ σam þ σ2m;
cov MHSð Þ ¼ 14σ2a þ σam þ σ2m;
cov DOð Þ ¼ 12σ2a þ
54σam þ 1
2σ2m:
Now, let:
σ2a ¼ 4σ2m ¼ −2σam: ð1Þ
A little algebra shows that under condition (1) the pre-vious expressions reduce to:
cov FSð Þ ¼ 14σ2a ;
cov MHSð Þ ¼ 0;cov DOð Þ ¼ 0:
This is exactly the expectation of the covariance be-tween relatives for these same relationships under a pa-ternal gametic model of inheritance. In the Appendixsection, we show that this result can be generalised toany genealogical relationship between a pair of individ-uals, on the condition that one was not an ancestor ofthe other within the paternal lineage. Specifically, the co-variance between the phenotypic values of any two indi-viduals (say A and B) under the condition set byEquation (1) is:
Varona et al. Genetics Selection Evolution (2015) 47:63 Page 2 of 13
cov yA; yBð Þ ¼ 14r AS;Bsð Þσ2a ;
where AS and BS are the sires of A and B, respectively.This striking result implies that the parameterization
of the genetic covariance under the standard maternalanimal model is confounded with a model that explainsthe whole genetic variation as paternally inherited; i.e.
covðyA; yBÞ ¼ rgðAP;BPÞσ2s ;
where rg(Ap,Bp) is the gametic relationship [23] between
paternal gametes of individuals A and B (Ap and Bp) andσs2 is the variance caused by paternally inherited gameticeffects. Stated the other way around, the existence of pa-ternally inherited variation that is not accounted for bythe maternal model will tend to be assigned to theremaining variance components according to Equation(1) in order to accommodate the observed correlationsbetween relatives. As a consequence, variance compo-nent estimation will explicitly inflate estimates of thedirect and maternal additive genetic variances, with amagnitude close to twice and one half the paternallyinherited variance, respectively, and it will reduce thedirect-maternal genetic covariance by a value equal tothe paternally inherited variance. The following sectiondescribes a simulation experiment that we developed inorder to test this result.
Simulation studyEach simulated dataset consisted of a base population of1000 individuals (500 males and 500 females) and twogenerations of 5000 phenotyped individuals that com-prised 2500 males and 2500 females. Phenotypic recordswere generated for the individuals of the last two gener-ations based on the following model:
y ¼ μþ Zaao þ Zmam þ Zssþ e;
where y is the vector of phenotypic data, μ is the generalmean, set to 100 units, ao and am are vectors of the dir-ect and maternal genetic effects, s is a vector of pater-nally inherited gametic effects, and e is the vector ofresiduals, while Za, Zm and Zs are incidence matrices.Covariances between genetic (ao and am) and gametic ef-fects (s) were assumed to be zero and
Var eð Þ ¼ Iσ2e;
where I is the identity matrix and σe2 is the residual
variance. The variances of the direct and maternal addi-tive genetic effects are:
Varaoam
� �¼ A⊗T;
where A is the numerator relationship matrix and
T¼ σ2a σamσam σ2
m
� �;
For the paternally inherited gametic effects (s):
Var sð Þ ¼ Gσ2s ;
where G is the gametic relationship matrixFive simulation scenarios were developed:Scenario 1 corresponds to a pure direct additive model
of inheritance with the following simulated parameters:
σ2a ¼ 500; σ2m ¼ 0; σam ¼ 0; σ2s ¼ 0; σ2e ¼ 1000:
Scenario 2 assumes that the only source of geneticvariation is the paternally inherited variance:
σ2a ¼ 0; σ2m ¼ 0; σam ¼ 0; σ2s ¼ 250; σ2e ¼ 1000:
Scenario 3 combines both sources of genetic variation,direct additive and paternally inherited variance. Thesimulated parameters were:
Scenario 4 corresponds to the covariance structurethat is assumed in a standard maternal animal model. Astrong negative covariance between direct and maternaladditive genetic effects was also simulated in order tomimic estimates that are frequently achieved in livestockpopulations for maternally influenced traits:
Finally, Scenario 5 includes all three types of geneticeffects: direct and maternal additive and paternallyinherited. The simulated parameters were:
σ2a ¼ 500; σ2m ¼ 250; σam ¼ −250; σ2s ¼ 250; σ2e
¼ 1000:
For each of these simulation scenarios, a total of 10 in-dependent populations were generated.
Pirenaica beef cattle dataIn addition to the simulated scenarios, we analysed data forphenotypic records on the Pirenaica beef cattle breed. ThePirenaica breed is a meat-type beef population from north-ern Spain with an approximate census of 20 000 individuals
Varona et al. Genetics Selection Evolution (2015) 47:63 Page 3 of 13
that are typically reared under extensive conditions [24].The dataset consisted of 17 069 records for weight at210 days (W210), with an average value of 266 kg and araw standard deviation of 52.9 kg. Phenotypic records wereadjusted according to the recommendations of the BeefImprovement Federation [25]. In addition, a pedigree fileincluding 125 974 individual-sire-dam records was used.This information was provided by the National BreedersConfederation (Confederación Nacional de Asociacionesde Ganado Pirenaico-CONASPI; http://www.conaspi.es).Ethical approval for animal care and use was not requiredfor this study since all data was field data from the YieldRecording System of the Pirenaica breed; furthermore, datawas recorded by the stockbreeders themselves, under stan-dard farm management, with no additional requirements.An additional simulation study was performed based on
the same scenarios as described in the previous section,but using genealogical information of the Pirenaica beefcattle breed and replacing each phenotypic record by asimulated value. The aim was to replicate the same struc-ture of relationships between individuals of the real dataset.
Statistical models of estimationAlthough a realistic implementation of all potentialgenetic sources of variation in the same hierarchicalmixed linear model may result in non-estimable func-tions, the description of the full model is essential tounderstand the simplified parameterizations that areused below. The full statistical model is:
y¼XbþZaaoþZmamþZssþZddþZppþZhhþe;
where y is the vector of phenotypic data, b is the vector ofsystematic effects, consisting of the general mean for thesimulated dataset and the two sexes and 16 age-groups ofdam age of parity for the Pirenaica beef cattle data, and ao,am, s and d are vectors of direct additive genetic, maternaladditive genetic, paternal gametic and maternal gametic ef-fects, respectively. Finally, p and h are vectors of randompermanent maternal (9224 levels) and herd-year-season(2781 levels) environmental effects (not included in thesimulated datasets), e is a vector of residuals, and X, Za,Zm, Zs, Zd, Zp, and Zh are incidence matrices that link theeffects with the phenotypic data. Variances and covariancesfor random sources of variation were defined as follows:
var
aoamsdphe
2666666664
3777777775¼
Aσ2a Aσam 0 0 0 0 0Aσam Aσ2
m 0 0 0 0 00 0 Gσ2s Gσ sd 0 0 00 0 Gσsd Gσ2
d 0 0 00 0 0 0 Iσ2
p 0 00 0 0 0 0 Iσ2
h 00 0 0 0 0 0 Iσ2
e
2666666664
3777777775;
where σp2 and σh
2 represent the variances of the perman-ent maternal and herd-year-season effects, σd
2 is the
variance of maternal gametic effects, and σsd is the co-variance between paternal and maternal gametic ef-fects. All other parameters were defined previously.Note that under a pure direct additive model:
σ2s ¼ σ2d ¼ σsd ¼ 12σ2a : ð2Þ
A number of models based on reduced parameteriza-tions of this full model were fitted to both the simulatedand the real data:
Model A: y = Xb + Zaao + e,Model S: y = Xb + Zss + e,Model AS: y = Xb + Zaao + Zss + e,Model SD: y = Xb + Zss + Zdd + e,Model AM: y = Xb + Zaao + Zmam + e,Model AMS: y = Xb + Zaao + Zmam + Zss + e,
When the Pirenaica beef data was used, all modelsalso included the terms zpp and zhh.For statistical analysis, we applied a Bayesian approach
through a Gibbs sampler [26]. The prior distributionsfor systematic effects and variance components wereassumed to be bounded uniform, and the prior distribu-tions for the genetic effects were multivariate Gaussiandistributions with mean zero and variance as defined inthe previous section. Analyses were run for each simu-lated or real dataset as a single chain of 525 000 cycleswith the first 25 000 iterations being discarded. Conver-gence was checked by visual inspection of the chainsand by applying the test of Raftery and Lewis [27]. Allsamples were stored to calculate summary statistics.
Model comparisonModels were compared using the pseudo log-marginalprobability of the phenotypic data [28]. If we consider thedata vector y = (yi,y-i), where yi is the ith datum and y-i isthe vector of data with ith datum deleted, the conditionalpredictive distribution has a probability density equal to:
p yijy−i� � ¼ Z
p yijy−i� �
f θjy−ið Þdy;
where θ is the vector of parameters. Therefore, p(yi|y-i)can be interpreted as the probability of each datumgiven the rest of the data and is known as the condi-tional predictive ordinate (CPO) for the ith datum. Thepseudo log-marginal probability of the data (LogCPO) isthen:X
i
lnp yijy−ið Þ:
The collection of conditional predictive densities isequivalent to the marginal probability of the data [29]. A
Varona et al. Genetics Selection Evolution (2015) 47:63 Page 4 of 13
Monte Carlo approximation of the LogCPO suggestedby Gelfand [28] is:
Xi
lnp̂ yijy−ið Þ;
where p̂ yijy−ið Þ ¼ NXNj¼1
1
p yijθj� �
" #−1
;
and N is the number of Markov chain Monte Carlo(McMC) draws, and θj is the jth draw from the poster-ior distribution of the corresponding parameter. Theinterpretation of the results of this test is that the lar-ger is LogCPO, the higher is the marginal probabilityof data and, thus, the better is the relative fit.
ResultsScenario 1: additive model of inheritanceIn Scenario 1, all genetic variation was generated as dir-ect additive; there were no maternal genetic or pater-nally inherited effects. The average posterior meanestimates of variance components and ratios of compo-nents of variance are in Table 1. When Model A wasused, the estimate of the direct additive genetic variancealmost matched the simulated value. Furthermore, whenthe estimation model only included paternal gametic ef-fects (Model S), a significant proportion of the variationwas assigned to these effects and the remaining additivevariation was incorporated into the residual variance.Implementation of a more complex parameterization,such as Model AS, attributed a small, although negli-gible, amount of the simulated variability to the pater-nally inherited effects. As expected, Model SD absorbedclose to half of the additive genetic variance of the pater-nal gametic effects and another half of the maternal ef-fects. In addition, the correlation between paternal and
maternal effects was close to 1. Finally, the models thatincluded an additive maternal genetic effect (AM andAMS) also correctly assigned most genetic variation tothe direct additive effects, and only small amounts toother variance components. The results of the modelcomparison test showed that Models A and SD pre-sented the best fit, followed closely by Models AM, ASand AMS. Model S had the worst fit.
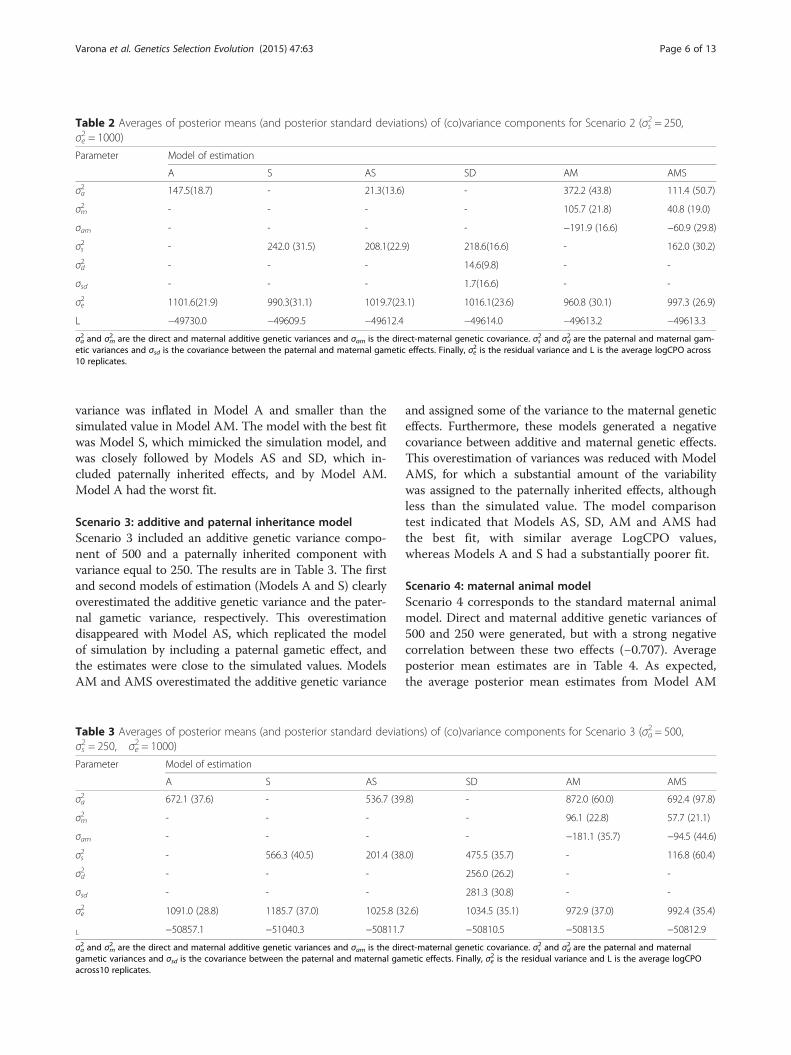
Scenario 2: paternal inheritance modelScenario 2 (Table 2) only included a variance of pater-nally inherited effects of 250, without considering anyother source of genetic variance. The average posteriormean estimate of variance due to paternally inherited ef-fects under Model S was close to the simulated value.However, with Model A, estimates of direct additivegenetic variance were on average close to 150, althoughthis variance component was not included in the simula-tion process. Model AS assigned most of the variance topaternally inherited effects and a small amount to thedirect additive effect. Model SD assigned most of thegenetic variance to paternal gametic effects, althoughnegligible amounts of variability were also assigned tothe gametic maternal variance component. Model AM,which corresponds to the standard maternal animal model,strongly overestimated the direct and maternal additivegenetic variances, and resulted in a negative estimate of thecovariance between direct and maternal additive genetic ef-fects, which resulted in a negative correlation close to −1.This tendency was reduced when paternally inherited ef-fects were included in the model (Model AMS). Averageposterior mean estimates of variances of both direct andmaternal additive genetic effects and the covariance be-tween them were smaller than in Model AM. However,the genetic correlation was still negative (−0.90) and asubstantial percentage of variability was assigned to pater-nally inherited effects. It should be noted that the residual
Table 1 Averages of posterior means (and standard deviations) of (co)variance components for Scenario 1 (σa2 = 500, σe2 = 1000)
L −50209.08 −50517.54 −50210.99 −50208.96 −50213.5 −50215.8
σa2 and σm
2 are the direct and maternal additive genetic variances and σam is the direct-maternal genetic covariance. σs2 and σd
2 are the paternal and maternalgametic variances and σsd is the covariance between the paternal and maternal gametic effects. Finally, σe
2 is the residual variance and L is the average logCPOacross 10 replicates.
Varona et al. Genetics Selection Evolution (2015) 47:63 Page 5 of 13
variance was inflated in Model A and smaller than thesimulated value in Model AM. The model with the best fitwas Model S, which mimicked the simulation model, andwas closely followed by Models AS and SD, which in-cluded paternally inherited effects, and by Model AM.Model A had the worst fit.
Scenario 3: additive and paternal inheritance modelScenario 3 included an additive genetic variance compo-nent of 500 and a paternally inherited component withvariance equal to 250. The results are in Table 3. The firstand second models of estimation (Models A and S) clearlyoverestimated the additive genetic variance and the pater-nal gametic variance, respectively. This overestimationdisappeared with Model AS, which replicated the modelof simulation by including a paternal gametic effect, andthe estimates were close to the simulated values. ModelsAM and AMS overestimated the additive genetic variance
and assigned some of the variance to the maternal geneticeffects. Furthermore, these models generated a negativecovariance between additive and maternal genetic effects.This overestimation of variances was reduced with ModelAMS, for which a substantial amount of the variabilitywas assigned to the paternally inherited effects, althoughless than the simulated value. The model comparisontest indicated that Models AS, SD, AM and AMS hadthe best fit, with similar average LogCPO values,whereas Models A and S had a substantially poorer fit.
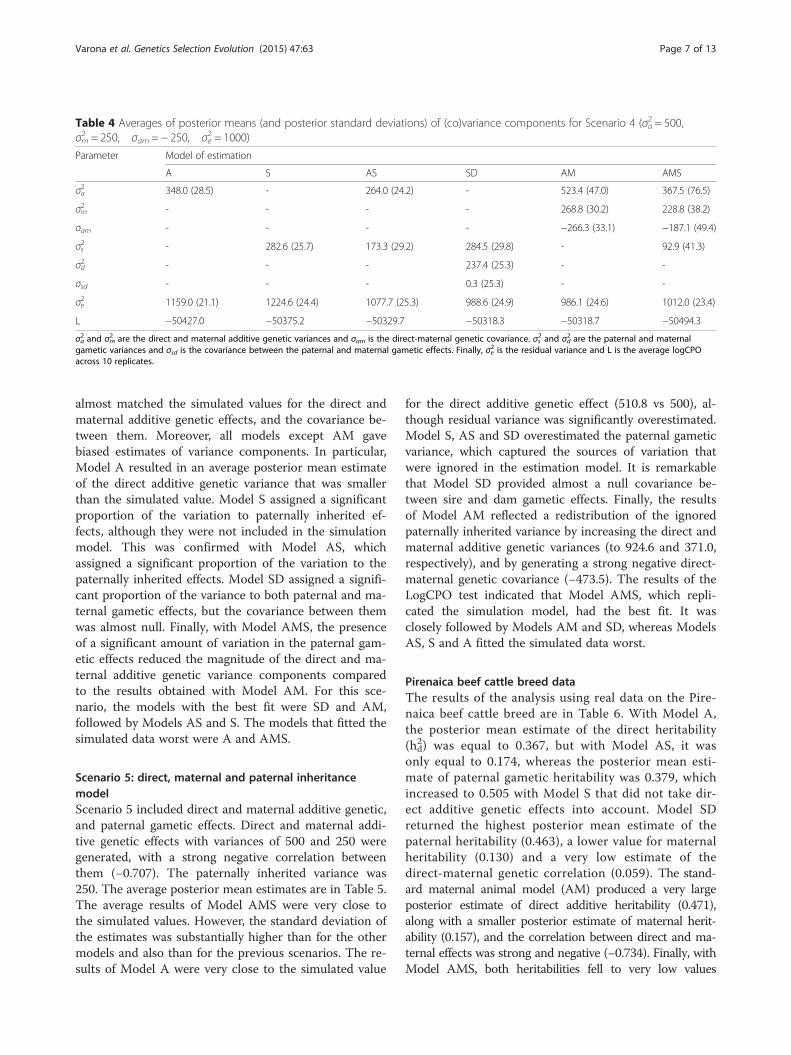
Scenario 4: maternal animal modelScenario 4 corresponds to the standard maternal animalmodel. Direct and maternal additive genetic variances of500 and 250 were generated, but with a strong negativecorrelation between these two effects (−0.707). Averageposterior mean estimates are in Table 4. As expected,the average posterior mean estimates from Model AM
Table 2 Averages of posterior means (and posterior standard deviations) of (co)variance components for Scenario 2 (σs2 = 250,σe2 = 1000)
L −50857.1 −51040.3 −50811.7 −50810.5 −50813.5 −50812.9
σa2 and σm
2 are the direct and maternal additive genetic variances and σam is the direct-maternal genetic covariance. σs2 and σd
2 are the paternal and maternalgametic variances and σsd is the covariance between the paternal and maternal gametic effects. Finally, σe
2 is the residual variance and L is the average logCPOacross10 replicates.
Varona et al. Genetics Selection Evolution (2015) 47:63 Page 6 of 13
almost matched the simulated values for the direct andmaternal additive genetic effects, and the covariance be-tween them. Moreover, all models except AM gavebiased estimates of variance components. In particular,Model A resulted in an average posterior mean estimateof the direct additive genetic variance that was smallerthan the simulated value. Model S assigned a significantproportion of the variation to paternally inherited ef-fects, although they were not included in the simulationmodel. This was confirmed with Model AS, whichassigned a significant proportion of the variation to thepaternally inherited effects. Model SD assigned a signifi-cant proportion of the variance to both paternal and ma-ternal gametic effects, but the covariance between themwas almost null. Finally, with Model AMS, the presenceof a significant amount of variation in the paternal gam-etic effects reduced the magnitude of the direct and ma-ternal additive genetic variance components comparedto the results obtained with Model AM. For this sce-nario, the models with the best fit were SD and AM,followed by Models AS and S. The models that fitted thesimulated data worst were A and AMS.
Scenario 5: direct, maternal and paternal inheritancemodelScenario 5 included direct and maternal additive genetic,and paternal gametic effects. Direct and maternal addi-tive genetic effects with variances of 500 and 250 weregenerated, with a strong negative correlation betweenthem (−0.707). The paternally inherited variance was250. The average posterior mean estimates are in Table 5.The average results of Model AMS were very close tothe simulated values. However, the standard deviation ofthe estimates was substantially higher than for the othermodels and also than for the previous scenarios. The re-sults of Model A were very close to the simulated value
for the direct additive genetic effect (510.8 vs 500), al-though residual variance was significantly overestimated.Model S, AS and SD overestimated the paternal gameticvariance, which captured the sources of variation thatwere ignored in the estimation model. It is remarkablethat Model SD provided almost a null covariance be-tween sire and dam gametic effects. Finally, the resultsof Model AM reflected a redistribution of the ignoredpaternally inherited variance by increasing the direct andmaternal additive genetic variances (to 924.6 and 371.0,respectively), and by generating a strong negative direct-maternal genetic covariance (−473.5). The results of theLogCPO test indicated that Model AMS, which repli-cated the simulation model, had the best fit. It wasclosely followed by Models AM and SD, whereas ModelsAS, S and A fitted the simulated data worst.
Pirenaica beef cattle breed dataThe results of the analysis using real data on the Pire-naica beef cattle breed are in Table 6. With Model A,the posterior mean estimate of the direct heritability(h2d) was equal to 0.367, but with Model AS, it wasonly equal to 0.174, whereas the posterior mean esti-mate of paternal gametic heritability was 0.379, whichincreased to 0.505 with Model S that did not take dir-ect additive genetic effects into account. Model SDreturned the highest posterior mean estimate of thepaternal heritability (0.463), a lower value for maternalheritability (0.130) and a very low estimate of thedirect-maternal genetic correlation (0.059). The stand-ard maternal animal model (AM) produced a very largeposterior estimate of direct additive heritability (0.471),along with a smaller posterior estimate of maternal herit-ability (0.157), and the correlation between direct and ma-ternal effects was strong and negative (−0.734). Finally, withModel AMS, both heritabilities fell to very low values
Table 4 Averages of posterior means (and posterior standard deviations) of (co)variance components for Scenario 4 (σa2 = 500,σm2 = 250, σam = − 250, σe2 = 1000)
L −50427.0 −50375.2 −50329.7 −50318.3 −50318.7 −50494.3
σa2 and σm
2 are the direct and maternal additive genetic variances and σam is the direct-maternal genetic covariance. σs2 and σd
2 are the paternal and maternalgametic variances and σsd is the covariance between the paternal and maternal gametic effects. Finally, σe
2 is the residual variance and L is the average logCPOacross 10 replicates.
Varona et al. Genetics Selection Evolution (2015) 47:63 Page 7 of 13
(0.045 and 0.056) and a significant proportion of the geneticvariation was assigned to the paternal gametic effects(0.436). The results of the comparison of models based onLogCPO showed that Model SD had the best predictiveability, followed by Models AM and ASs. Model AMS wasnext, and Models S and A showed the worst fit.
DiscussionWe present a theoretical development that shows that thestructure of the (co) variance components assumed by thestandard maternal animal model is partially confoundedwith a model that considers a paternal gametic effect.Meyer and Tier [22] postulated that this may be one
Table 6 Posterior means (and posterior standard deviations) of (co)variance components for weight at 210 days in the Pirenaicabeef cattle population
2 are the direct and maternal additive genetic variances and σam is the direct-maternal genetic covariance. σs2 and σd
2 are the paternal and maternalgametic variances and σsd is the covariance between the paternal and maternal gametic effects. σh
2 and σp2 are the herd and maternal permanent environmental
variances. σe2 is the residual variance. ha
2, hm2 , hs
2 and hd2 are the ratios of the direct additive genetic, maternal additive genetic, paternal gametic and maternal
gametic variances to the phenotypic variance, respectively. ram is the genetic correlation between direct and maternal additive effects and rsd is the correlationbetween paternal and maternal gametic effects. ch
2 and cp2 are the ratios of herd and permanent maternal environmental effects to the phenotypic variance.
Table 5 Averages of posterior means (and posterior standard deviations) of (co)variance components for Scenario 5 (σa2 = 500,σm2 = 250, σam = − 250, σs2 = 250, σe2 = 1000)
L −51048.4 −51010.0 −50902.3 −50868.6 −50860.6 −50858.1
σa2 and σm
2 are the direct and maternal additive genetic variances and σam is the direct-maternal genetic covariance. σs2 and σd
2 are the paternal and maternalgametic variances and σsd is the covariance between the paternal and maternal gametic effects. Finally, σe
2 is the residual variance and L is the average logCPOacross 10 replicates
Varona et al. Genetics Selection Evolution (2015) 47:63 Page 8 of 13
possible cause for the strong negative estimates of the gen-etic correlation between direct and maternal genetic effectsthat are typically obtained. We derived results that showthat, for most of the genetic relationships in livestock pedi-grees, the covariance between relatives generated by a pa-ternally inherited effect is mimicked by the maternal animalmodel when variance components follow the pattern de-fined by Equation (1). Thus, when paternally inherited ef-fects are ignored in the estimation model, its variance isassigned to the remaining variance components in order toaccommodate the observed correlations between relatives.Under the maternal animal model, its consequences are aninflation of the direct and maternal additive genetic vari-ances, and a downward bias of the direct-maternal geneticcorrelation.These results were confirmed by the simulation study.
When simulation and estimation models were analo-gous, the Bayesian analysis was able to provide suitableestimates of the variance components. Furthermore,when the true simulation structure of the (co)variancecomponents was included in the estimation model to-gether with other variance components, the procedurecorrectly estimated the true parameters, whereas estimatesof the non-simulated variance components were small.However, the presence of paternal gametic effects (Scenar-ios 2 and 3) and their absence in the estimation model re-sulted in an overestimation of the direct additive geneticvariance, as previously described by other authors [17, 22].Furthermore, when paternally inherited effects that play asignificant role in the genetic variation were ignored in amodel that included correlated direct and maternal addi-tive genetic effects, the direct additive genetic variancecomponent was increased by almost twice the paternalgametic variance, whereas the genetic covariance betweendirect and maternal effects became negative and the esti-mate of the maternal additive genetic variance increasedby almost one half of the simulated paternal gametic vari-ance, as was observed in Scenarios 2, 3 and 5. As de-scribed above, this redistribution of the gametic paternalvariance is linked to the constraint imposed in Equation(1). These results were also consistent with the presenceof a significant percentage of paternal gametic variance forModels S, AS, SD and AMS in Scenario 4, where only dir-ect and maternal additive effects were simulated, and withthe increase of paternal gametic variance in Models S, ASand SD in Scenario 5. Finally, the decrease in covariancebetween paternal and maternal effects under Model SDin Scenarios 4 and 5 may also be attributed to thisphenomenon.More generally, when any relevant variance compo-
nent in the simulation model was not considered in theestimation, substantial biases on the variance componentestimation were noted. For example, ignoring a true dir-ect additive genetic effect while assuming paternal and
maternal gametic effects in the estimation model, led tothe absorption of close to half of the additive geneticvariance by the paternal gametic variance and half bythe maternal gametic variance. In addition, the increasein the estimate of the covariance between paternal andmaternal gametic effects was also of this magnitude. Thisdistribution of the direct additive variance followed thepattern described in Equation (2) and was exploited in themodel proposed by Neugenbauer et al. [18, 19] in order todetect paternal and maternal inherited effects.The model comparison test that we performed pro-
vided support to our main argument. To illustrate thispoint, in Scenarios 2 and 3, where paternally inheritedeffects were included in the simulation model, the good-ness of fit of Model AM was very close to that obtainedwith Models S and AS, which mimicked the respectivesimulation models. Moreover, under Scenarios 4 and 5,Model SD performed almost as well as Models AM orAMS, which replicated the true simulation models.Clearly, the constraint imposed by Equation (1) explainsthe similarity observed between the maternal animalmodel and the paternally inherited model in those cases.It should be emphasized that the constraint imposed
by Equation (1) is not a pure parametric equivalence,since it is limited by the condition that available correla-tions between relatives do not involve genealogical rela-tionships where one individual is an ancestor of theother within the paternal lineage. Therefore, the ability toseparate direct and maternal additive genetic effects andsire imprinted effects can only be achieved if relevant re-cords from sires and their offspring are available or, moregenerally, if there exist records from individuals that aregenetically linked through the paternal pathway. However,in beef cattle datasets, phenotypes on sire-offspring pairsare usually rare. In the Pirenaica beef cattle dataset ana-lyzed here, there were 527 463 paternal half-sibs, 15 128maternal half-sibs, 2707 full-sibs, 2411 dam-progeny andonly 4566 sire-progeny pairs with phenotypic informationon both individuals. Thus, most of the information avail-able for estimation of variance components was providedby half-sib relatives, whose covariance generated by pater-nally inherited effects can be also achieved by the mater-nal animal model under the constraint imposed byEquation (1).This latter explanation helps to understand the results
of the analysis of the Pirenaica beef cattle dataset. Esti-mates of variance components obtained from Model Awere concordant with previous results obtained in thesame [30] and other beef cattle populations [31, 32]. Inturn, alternative estimation models, such as S, AS andSD, suggested that paternal gametic effects may play animportant role in the variation of weight at 210 days inthis breed. In contrast, under Model AM, maternal addi-tive effects were also very relevant. Furthermore, when
Varona et al. Genetics Selection Evolution (2015) 47:63 Page 9 of 13
both effects were fitted in the estimation model (AMS),the maternal effects contributed less to the total vari-ation than the paternal gametic effects. A similar reduc-tion in the maternal contribution on weaning weightwas also found in the Bruna dels Pirineus beef cattlebreed when paternal gametic effects were considered inthe estimation model [33]. Indeed, more evidence forthe presence of parent-of-origin variation is derived fromthe fact that when Model SD was used, a very low cor-relation between paternal and maternal gametic effectswas obtained. This is in contrast to the results reportedby Neugenbauer et al. [18, 19], which provided a highcorrelation between them, as in the outcome of the firstsimulation scenario, where a pure additive model wassimulated. However, as observed with Scenarios 4 and 5,independence between paternal and maternal gameticeffects, together with the presence of a significant pater-nally inherited variance component can also be due tothe existence of a strong and negative genetic correlationbetween direct and maternal genetic effects. Given thestructure of the information in the Pirenaica dataset, thegenetic variance is distributed between paternal gameticand direct and maternal effects depending on the modelof estimation and, thus, it is very difficult to clearly iden-tify the true sources of variation. However, at this point,it is worth mentioning that the results of the simulationstudy using the Pirenaica’s breed genealogical structurewere similar to those obtained with the above describedsimulation study (results in Tables S1, S2, S3, S4 and S5[See Additional file 1: Tables S1-S5]). This allowed us torule out the possibility of a statistical artefact caused bythe structure of the information. Nevertheless, the modelcomparison using logCPO indicated that Model SD wasmost suited to the Pirenaica beef cattle data. It shouldbe noted that this model performed well in all simula-tion scenarios (Tables 1, 2, 3, 4 and 5), since it can ac-commodate a significant amount of paternal inheritanceand also a strong negative correlation between direct ormaternal effects, as in Scenario 4. In fact, Model AMhad the second best predictive ability based on theLogCPO approach and showed a better fit than ModelAS. However, the very large difference in LogCPO be-tween Models SD and AM (−86178 vs −86378) and theresults of Model AMS suggest that the existence of sig-nificant paternal gametic effects is plausible in the Pire-naica population.Many studies have reported negative estimates of the
genetic covariance between direct and maternal additiveeffects for beef cattle populations [4–6]. Several explana-tions have been proposed, including environmental cor-relations between progeny performance and maternalenvironmental effects [34, 35] and sire × herd interac-tions [36, 37]. An additional explanation that should beconsidered is the presence of paternally inherited effects,
as previously suggested by Meyer and Tier [22]. Our evi-dence is consistent with the effect associated withimprinted genes, such as the insulin-like growth factor 2(IGF2) gene involved in fetal growth [38, 39] or postnatalgrowth and fat deposition in pigs [11, 12, 40] and mice[41]. Genomic imprinting of the IGF2 gene has also beenshown to affect meat quality traits in beef cattle [42, 43]and some mutations in IGF2 have been associated withcarcass traits [44] and body weight [45].Furthermore, a wealth of evidence on the role of par-
ental inheritance in fetal and early growth in mammalssupports the imprinting hypothesis [46, 47]. This is re-lated with parent-offspring conflict theories about theevolutionary origin of paternal effects [48], which arebased on the hypothesis that the self-interest of the pa-ternal genome is to increase the growth of the fetus oryoung individuals, whereas the aim of the maternal gen-ome is to sufficiently limit growth to ensure the successof future offspring without jeopardizing the mother’ssurvival. According to this hypothesis, genes that en-hance growth tend to be more expressed if they arepaternally inherited than when they are maternallyinherited. This phenomenon should be even moremarked in species with a low rate or absence of full sib-lings and a high frequency of multiple paternity [49], asis the case for cattle.Finally, other causes that can explain overestimation of
paternal gametic variance are a large difference in allelefrequencies between sires and dams or the presence ofsignificant dominance variation. However, these are notrelevant for close populations and that include few full-sib relationships, respectively. In future studies, a verypromising alternative to distinguish between paternallyand maternally inherited effects arises from the use ofmolecular information that may contribute to better dis-criminate between paternal and maternal alleles.
ConclusionsIgnoring paternally inherited effects in genetic evaluationswith maternal animal models can lead to a specific patternof bias in the estimates of variance components. Thisphenomenon may account for the unexpectedly strongnegative direct-maternal genetic correlations that are re-ported in the literature. In addition, we showed that theexistence of paternal effects may play a role in the explan-ation of the partitioning of genetic variation in growthtraits and possibly in some other relevant traits in live-stock production. The main implication of this study isthat the presence of relevant paternally inherited variationshould be investigated when the maternal animal modelprovided negative correlation estimates between directand maternal effects. In addition, in those cases, applyingmaternal animal models should be done with caution.
Varona et al. Genetics Selection Evolution (2015) 47:63 Page 10 of 13
AppendixConsider a model that fits direct and maternal additivegenetic effects. As pointed out in the Methods section,the phenotypic values of any two individuals, say A andB, are modelled as:
yA ¼ μþ aoA þ amADþ eA
yB ¼ μþ aoB þ amBDþ eB
:
Assuming independence of the residuals, the covari-ance between both phenotypic values can be describedas a function of the following four pairwise covariances:
cov yA; yBð Þ ¼ cov aoA; aoBð Þ þ cov aoA; amBD
� �þcov amAD
; aoB� �þ cov amAD
; amBD
� �:
Now, we will use the standard regression of an individ-ual’s breeding value on half the breeding values of itsparents plus a residual due to Mendelian segregation[49], i.e.
aoX ¼ 12aoXS þ
12aoXD þ ϕoX ;
to expand all the covariance terms to the parental gener-ation. Replacing first the direct breeding value of indi-vidual B and working out the resulting expression, thefirst term in the right hand side can be expressed as:
covðaoA; aoBÞ ¼ 12covðaoA; aoBSÞ þ
12covðaoA; aoBD
Þ
þcovðaoA;ϕoBÞ:A further step by replacing the breeding value of indi-
vidual A, results in:
cov aoA; aoBð Þ ¼ 14cov aoAS ; aoBSð Þ þ 1
4cov aoAD
; aoBS
� �þ 12cov ϕoA; aoBS
� �þ 14cov aoAS ; aoBD
� �þ 14cov aoAD ; aoBDð Þ þ 1
2cov ϕoA; aoBD
� �þ 12cov aoAS ;ϕoBð Þ þ 1
2cov aoAD ;ϕoBð Þ þ cov ϕoA;ϕBð Þ
Similarly,
cov aoA; amBDð Þ ¼ 12cov aoAS
; amBD
� �þ 12cov aoAD
; amBD
� �þ cov ϕoAS
; amBD
� �;
and
cov amAD ; aoBð Þ ¼ 12cov amAD ; aoBS
� �þ 12cov amAD ; aoBD
� �þ cov amAD ;ϕoBð Þ:
Collecting all these results,
cov yA; yBð Þ ¼ 14cov aoAS ; aoBSð Þ þ 1
4cov aoAD ; aoBSð Þ
þ 12cov ϕoA; aoBSð Þ þ 1
4cov aoAS ; aoBDð Þ
þ 14cov aoAD ; aoBDð Þ þ 1
2cov ϕoA; aoBDð Þ
þ 12cov aoAS ;ϕoBð Þ þ 1
2cov aoAD ;ϕoBð Þ
þcov ϕoA;ϕoBð Þ þ 12cov aoAS ; amBDð Þ
þ 12cov aoAD ; amBDð Þ þ cov ϕoA; amBDð Þ
þ 12cov amAD ; aoBSð Þ þ 1
2cov amAD ; aoBDð Þ
þ cov amAD ;ϕoBð Þ þ cov amAD ; amBDð Þ
Now, recalling that:
cov aoX ; aoYð Þ ¼ r X;Yð Þσ2a;
cov aoX ; amYð Þ ¼ r X;YDð Þσdm;cov amX ; amYð Þ ¼ r XD;YDð Þσ2
m;
where r(X,Y) stands for the additive relationship betweenany two individuals X and Y, the previous expression can bereformulated as:
cov yA; yBð Þ ¼ 14r AS;BSð Þσ2d þ
14r AD;BSð Þσ2
d
þ 12cov ϕoA; aoBsð Þ þ 1
4r AS;BDð Þσ2d
þ 14r AD;BDð Þσ2d þ
12cov ϕoA; aoBDð Þ
þ 12cov aoAS ;ϕoBð Þ þ 1
2cov aoAD ; ;ϕoBð Þ
þ cov ϕoA;ϕoBð Þ þ 12r AS;BDð Þσdm
þ 12r AD;BDð Þσdm þ cov ϕoA; amBDð Þ
þ 12r AD;BSð Þσdm þ 1
2r AD;BDð Þσdm
þ cov amAD ;ϕoBð Þ þ 12r AD;BDð Þσ2
m
At this point, we introduce the condition set by Equation(1). Let:
σ2d ¼ −2σdm ¼ 4σ2m:
Then, after proper cancelations and making use of thisidentity:
cov ϕoA; aoBDð Þcov ϕoA; amBDð Þ ¼
σ2aσam
;
the expression of the covariance between the two pheno-typic values is reduced to the following expression:
Varona et al. Genetics Selection Evolution (2015) 47:63 Page 11 of 13
cov yA; yBð Þ ¼ 14r As;Bsð Þσ2
d þ12cov ϕoA; aoBSð Þ
þ 12cov aoAS ;ϕoBð Þ þ cov ϕoA;ϕoBð Þ:
Notice that the cov ϕoX ; aoYSð Þ > 0 only if X is an an-cestor of Y through the paternal line. In turn, the cov(ϕoX,ϕoY) > 0 only if X =Y. Thus, for any other two individuals inthe population:
cov yA; yBð Þ ¼ 14r AS;BSð Þσ2d:
Additional file
Additional file 1: Table S1. (Co) variance components posterior means(and posterior standard deviations) for the first case of simulation (σa2 = 500, σe2
= 1000) using the genealogical and phenotypic information of the Pirenaicadataset. σa2 and σm2 are the direct and maternal additive genetic variances andσam is the direct-maternal genetic covariance. σs2 and σd2 are the paternal andmaternal gametic variances and σsd is the covariance between the paternaland maternal gametic effects. σh2 and σp2 are the herd and maternal permanentenvironmental variances. σe2 is the residual variance. Table S2. (Co) variancecomponents posterior means (and posterior standard deviations) for the firstcase of simulation (σs2 = 250, σe2 = 1000) using the genealogical anddata structure of the Pirenaica dataset. Description: same as for TableS1. Table S3. (Co) variance components posterior means (and posteriorstandard deviations) for the first case of simulation (σa2 =500, σs2 =250,σe2 =1000) using the genealogical and data structure of the Pirenaicadataset. Description: same as for Table S1. Table S4. (Co) variancecomponents posterior means (and posterior standard deviations) forthe first case of simulation (σa2 = 500, σm2 = 250, = −250, σe2 = 1000)using the genealogical and data structure of the Pirenaica dataset.Description: same as for Table S1. Table S5. (Co) variance componentsposterior means (and posterior standard deviations) for the first case ofsimulation (σa2 =500, σm2 = 250, σam= −250, σs2 = 250, σe2 = 1000) usingthe genealogical and data structure of the Pirenaica dataset. Description: sameas for Table S1. (DOCX 168 kb)
Competing interestsThe authors declare that they have no competing interest.
Authors’ contributionsLV derived the mathematical results, conceived the simulation study,developed the software code and drafted the initial manuscript. JA preparedthe genealogical and phenotypic datasets of the Pirenaica beef cattlepopulation. SM and JC aided in the preparation of the manuscript. SM, JC,CM and JA helped in the interpretation of the results. All authors read andapproved the final manuscript.
AcknowledgementsThe authors would like to thank the Pirenaica Breeders Association(Confederación Nacional de Asociaciones de Ganado Pirenaico) for providingthe data used in this work. Financial support was provided by Grant AGL2010-15903. S. Munilla acknowledges the financial support received by the groupDGA A51 through the project FITE 2012/2013. The authors also want to thankthe helpful suggestions of two anonymous reviewers and the valuable help ofDr. Helene Hayes and Dr. Jack Dekkers in the final edition of the manuscript.
Author details1Unidad de Genética Cuantitativa y Mejora Animal, Universidad de Zaragoza,50013 Zaragoza, Spain. 2Instituto Agroalimentario de Aragón (IA2),Universidad de Zaragoza, 50013 Zaragoza, Spain. 3Departamento deProducción Animal, Facultad de Agronomía, Universidad de Buenos Aires,1417 Ciudad Autónoma de Buenos Aires, Argentina. 4Grup de Recerca enRemugants, Departament de Ciència Animal i dels Aliments, UniversitatAutònoma de Barcelona, 08193 Bellaterra, Spain.
Received: 18 July 2014 Accepted: 17 July 2015
References1. Henderson CR. Application of linear models in animal breeding. 3rd ed.
Guelph: University of Guelph; 1984.2. Willham RL. The role of maternal effects in animal breeding. 3. Biometrical
aspects of maternal effects in animals. J Anim Sci. 1972;35:1288–93.3. Meyer K. Variance-components due to direct and maternal effects for
growth traits of Australian beef-cattle. Livest Prod Sci. 1992;31:179–204.4. Koch RM. The role of maternal effects in animal breeding. VI. Maternal
effects in beef cattle. J Anim Sci. 1972;35:1316–23.5. Robinson DL. Estimation and interpretation of direct and maternal genetic
parameters for weights of Australian Angus cattle. Livest Prod Sci.1996;45:1–11.
6. Meyer K. Estimates of genetic parameters for weaning weight of beef cattleaccounting for direct-maternal environmental covariances. Livest Prod Sci.1997;52:187–99.
7. Barlow DP. Competition - A common motif for the imprinting mechanism?EMBO J. 1997;16:6899–905.
8. Reik W, Walker J. Imprinting mechanisms in mammals. Curr Opin GenetDev. 1998;8:154–64.
9. Magee DA, Spillane C, Berkowicz EW, Sikora KM, MacHugh DE. Imprintedloci in domestic livestock species as epigenomic targets for artificialselection of complex traits. Anim Genet. 2014;45:25–39.
10. Cockett NE, Jackson SP, Shay TL, Farnir S, Berghmans S, Snowder GD, et al.Polar overdominance at the ovine callipyge locus. Science. 1996;273:236–8.
11. Georges M, Charlier C, Cockett N. The callipyge locus: evidence for the transinteraction of reciprocally imprinted genes. Trends Genet. 2003;19:248–52.
12. Jeon JT, Carlborg O, Törnsten A, Giuffra E, Amarger V, Chardon P, et al. Apaternally expressed QTL affecting skeletal and cardiac muscle mass in pigsmaps to the IGF2 locus. Nat Genet. 1999;21:157–8.
13. Nezer C, Moreau L, Brouwers B, Coppieters W, Detilleux J, Hanset R, et al.An imprinted QTL with major effect on muscle mass and fat depositionmaps to the IGF2 locus in pigs. Nat Genet. 1999;21:155–6.
14. Imumorin IG, Kim EH, Lee YM, De Koning DJ, van Arendonk J, De Donato M,et al. Genome scan for parent-of-origin QTL effects on bovine growth andcarcass traits. Front Genet. 2011;2:44.
15. Morison IM, Ramsay JP, Spencer HG. A census of mammalian imprinting.Trends Genet. 2005;21:457–65.
16. De Vries AG, Kerr R, Tier B, Long T, Meuwissen THE. Gametic imprinting effects onrate and composition of pig growth. Theor Appl Genet. 1994;88:1037–42.
17. Engellandt T, Tier B. Genetic variances due to imprinted genes in cattle.J Anim Breed Genet. 2002;119:154–65.
18. Neugenbauer N, Luther H, Reinsch N. Parent-of-origin effects cause geneticvariation in pig performance traits. Animal. 2010;4:672–81.
19. Neugenbauer N, Räder I, Schild HJ, Zimmer D, Reinsch N. Evidence ofparent-of-origin effects on genetic variability of beef traits. J Anim Sci.2010;88:523–32.
20. Tier B, Meyer K. Analysing quantitative parent-of-origin effects withexamples from ultrasonic measures of body composition in Australian beefcattle. J Anim Breed Genet. 2012;129:359–68.
21. Hager R, Cheverud JM, Wolf JB. Maternal effects as the cause of parent-of-origin effects that mimic genomic imprinting. Genetics. 2008;178:1755–62.
22. Meyer K, Tier B. Estimates of variances due to parent of origin effects forweights of Australian beef cattle. Anim Prod Sci. 2012;52:215–24.
23. Schaeffer LR, Kennedy BW, Gibson JP. The inverse of the gameticrelationship matrix. J Dairy Sci. 1989;72:1266–72.
24. Sánchez A, Ambrona J, Sánchez L. Razas ganaderas españolas bovinas.Madrid: MAPA-FEAGAS; 2002.
25. Beef Improvement Federation. Guidelines for uniform beef improvementprograms. Raleigh: North Carolina University Press; 2010.
26. Gelfand AE, Smith AFM. Sampling-based approaches to calculating marginaldensities. J Am Statist Assoc. 1990;85:398–409.
27. Raftery AE, Lewis SM. How many iterations in the Gibbs Sampler. In:Bayesian Statistics IV, editor. Edited by Bernardo JM, Berger JO, Dawid AP,Smith AFM. New York: Oxford University Press; 1992. p. 763–74.
28. Gelfand AE. Model determination using sampling-based methods. In: GilksWR, Richardson S, Spiegelhalter DJ, editors. Markov chain Monte Carlo inpractice. London: Chapman Hall; 1996. p. 145–61.
Varona et al. Genetics Selection Evolution (2015) 47:63 Page 12 of 13
29. Besag J. Spatial interaction and the statistical analysis of lattice systems(with discussion). J Roy Stat Soc Lond B. 1974;36:192–225.
30. Altarriba J, Yagüe G, Moreno C, Varona L. Exploring the possibilities ofgenetic improvement from traceability data an example in the Pirenaicabeef cattle. Livest Sci. 2009;125:115–20.
31. Utrera AR, Van Vleck LD. Heritability estimates for carcass traits of cattle:a review. Genet Mol Res. 2004;3:380–94.
32. Bouquet A, Fouilloux MN, Renand G, Phocas F. Genetic parameters forgrowth, muscularity, feed efficiency and carcass traits of young beef bulls.Livest Sci. 2010;129:38–48.
33. Fina M, Varona L, Piedrafita J, Casellas J. Sources of sire-specific geneticvariance for birth and weaning weight in Bruna dels Pirineus beef calves.Animal. 2012;6:1931–8.
34. Quintanilla R, Varona L, Pujol MR, Piedrafita J. Maternal animal model withcorrelation between maternal environmental effects of related dams.J Anim Sci. 1999;77:2904–17.
35. Bijma P. Estimating maternal genetic effects in livestock. J Anim Sci.2006;84:800–6.
36. Dodenhoff J, Van Vleck LD, Wilson DE. Comparison of models to estimategenetic effects for weaning weight of Angus cattle. J Anim Sci.1999;77:3176–84.
37. Gutiérrez JP, Fernández I, Álvarez I, Royo LJ, Goyache F. Sire x contemporarygroup interactions for birth weight and preweaning growth traits in theAsturiana de los Valles beef cattle breed. Livest Sci. 2006;99:61–8.
38. DeChiara TM, Efstratiadis A, Robertson EJ. A growth-deficiency phenotype inheterozygous mice carrying an insulin-like growth factor II gene disruptedby targeting. Nature. 1990;345:78–80.
39. Rotwein P, Hall LJ. Evolution of insulin-like growth factor 2: characterizationof the mouse IGF2 gene and identification of two pseudo-exons. DNA CellBiol. 1990;9:725–35.
40. Van Laere AS, Nguyen M, Braunschweig M, Nezer C, Collette C, Moreau L, etal. A regulatory mutation in IGF2 causes a major QTL effect on musclegrowth in the pig. Nature. 2003;42:832–6.
41. Rogler CE, Yang D, Rossetti L, Donohoe J, Alt E, Chang CJ, et al. Altered bodycomposition and increased frequency of diverse malignancies in insulin-likegrowth factor-II transgenic mice. J Biol Chem. 1994;269:13779–84.
42. Dindot SV, Kent KC, Evers B, Loskutoff N, Womack J, Piedrahita JA.Conservation of genomic imprinting at the XIST, IGF2 and GTL2 loci in thebovine. Mamm Genome. 2004;15:966–74.
43. Curchoe C, Zhang S, Bin Y, Zhang X, Yang L, Feng D, et al. Promoter-specificexpression of the imprinted IGF2 gene in cattle (Bos taurus). Biol Reprod.2005;73:1275–81.
44. Goodall JJ, Schmutz SM. IGF2 gene characterization and association with ribeye area in beef cattle. Anim Genet. 2007;38:154–61.
45. Zwierzchowski L, Siadkowska E, Oprzadek J, Flisikowski K, Dymnicki E. Anassociation of C/T polymorphism in exon 2 of the bovine insulin-like growthfactor 2 gene with meat production traits in Polish Holstein-Friesian cattle.Czech J Anim Sci. 2010;55:227–33.
46. Bartolomei MS, Tilghman SM. Genomic imprinting in mammals. Annu RevGenet. 1997;31:493–525.
47. Tilghman SM. The sins of the fathers and mothers: genomic imprinting inmammalian development. Cell. 1999;96:185–93.
48. Haig D. Genomic imprinting and the theory of parent-offspring conflict.Semin Cell Dev Biol. 1992;3:153–60.
49. Haig D. Multiple paternity and genomic imprinting. Genetics.1999;151:1229–31.
Submit your next manuscript to BioMed Centraland take full advantage of:
• Convenient online submission
• Thorough peer review
• No space constraints or color figure charges
• Immediate publication on acceptance
• Inclusion in PubMed, CAS, Scopus and Google Scholar
• Research which is freely available for redistribution
Submit your manuscript at www.biomedcentral.com/submit
Varona et al. Genetics Selection Evolution (2015) 47:63 Page 13 of 13