Page 1
RESEARCH PAPER
Consequences on water retention properties of double-porosityfeatures in a compacted silt
Francesca Casini • Jean Vaunat • Enrique Romero •
Augusto Desideri
Received: 2 September 2011 / Accepted: 23 January 2012 / Published online: 25 February 2012
� Springer-Verlag 2012
Abstract The paper deals with an experimental investiga-
tion aimed at studying microstructural features and their
consequences on water retention properties of statically
compacted unsaturated silt. The evolution of the micro-
structure of the aggregate fabric induced by compaction is
investigated by studying the pore size distribution changes
under different initial conditions (void ratio and water con-
tent). The material used is low plasticity silt from Jossigny
near Paris, France. A series of mercury intrusion porosimetry
tests (MIP) were performed at different void ratios and water
contents to provide microstructural information. The
arrangement of aggregation/particles and pore network was
also investigated with environmental scanning electron
microscopy (ESEM). The MIP data were used to determine
the water retention curve on drying for the specific pore
network configuration induced on compaction. The MIP data
were used to formulate and calibrate a multimodal water
retention model for a specific pore network configuration,
which is obtained by linear superposition of subcurves of a
modified van Genuchten type. The study is then comple-
mented with controlled suction oedometer tests on com-
pacted samples to obtain the water retention properties of the
material at two different void ratios. Finally, we compare
the water retention properties obtained by the simulated
progression of the different pore network configurations
induced on the hydraulic path with the water retention
properties under suction-controlled conditions. Good agree-
ment between the two methods for the drying path is reached.
Keywords Compacted soil � Pore network model �Pore size distribution � Water retention curve
1 Introduction
Compacted soil can be seen as an assemblage of particles
and aggregations having sizes that mainly depend on the
compaction water content [27]. To understand how these
soils behave as a composite body, one must consider the
manner in which the various particles and aggregates are
packed together forming a pore network, which depends on
void ratio and water content at compaction. Advances in
laboratory testing procedures such as mercury intrusion
porosimetry (MIP), useful to study the pore size distribu-
tion, and environmental scanning electron microscopy
(ESEM), able to visualise microstructural features at dif-
ferent hydraulic states, led to better understanding of the
soil structure evolution during hydro-mechanical loading
(e.g. [7, 8, 13–15, 20, 24, 26, 29, 30]).
The structure of most coarse-grained (or granular) soils
displays a dominant monomodal pore size distribution, as
there is little tendency to form aggregations. As the amount
F. Casini (&)
Institute for Geotechnical Engineering, HIL C 33.3, ETH,
Swiss Federal Institute of Technology Zurich,
Wolfgang Pauli Strasse 14, 8093 Zurich, Switzerland
e-mail: [email protected] ;
[email protected]
J. Vaunat � E. Romero
Departamento de Ingenierıa del Terreno, Cartografica y
Geofısica, c/Jordi Girona 1-3, Universitat Politecnica de
Catalunya, 08034 Barcelona, Spain
e-mail: [email protected]
E. Romero
e-mail: [email protected]
A. Desideri
Dipartimento di Ingegneria Strutturale e Geotecnica, Sapienza
Universita di Roma, via Eudossiana 18, 00184 Roma, Italy
e-mail: [email protected]
123
Acta Geotechnica (2012) 7:139–150
DOI 10.1007/s11440-012-0159-6
Page 2
of fines increases, particles tend to group themselves into
larger aggregates, whose size depends on the amount of
water added. Soils (with an appreciable content of clay)
compacted dry of optimum moisture content generally
exhibit a fabric made up of aggregates of varying sizes and
tend to have a bimodal pore size distribution, whereas soils
compacted wet of optimum tend to display a dominant
peak [8, 12]. It has been widely accepted that the different
behavioural features observed on soils compacted dry or
wet of optimum moisture content are almost exclusively
due to different structures set up during the process of
compaction (e.g. [11]). When aggregates are present, it is
possible to divide the pore size distribution into two dis-
tinguishable ranges, namely, macropores and micropores.
The macropores are mostly the inter-aggregate pores
between aggregations, whereas the micropores are the
intra-aggregate pores inside these elementary units.
In the literature, few works on the microstructural
behaviour on compaction are devoted to low-activity soils
with clay content less than 25% (see, for example, [8]).
These silty soils have a low tendency to form aggregates
(especially at low water contents), which are difficult to
detect, and thus, they present a microstructure usually
characterised by a monomodal pore size distribution. This
aspect makes them not so attractive for the study of
microstructural features. Nevertheless, with increasing
water content, the aggregated structure is highlighted,
developing two clear dominant modes. The current paper
studies a compacted silty material and specifically focuses
on the development and changes undergone on the aggre-
gated structure induced on compaction at different initial
conditions. The aggregation of the silty soil investigated at
lower content is a starting assumption that will be validated
later on by ESEM tests.
A deeper understanding of how microstructural features
affect the water storage mechanisms of a compacted soil is
of particular importance in earthworks engineering. The
water retention curve expressed in terms of water content
or degree of saturation and suction is hysteretic, stress path
dependent (void ratio) and depends on the pore network
[1, 10, 16, 18, 19, 21, 23, 25, 27, 28, 31]. To properly
describe its evolving water retention character, a multi-
modal retention model is proposed in the paper by con-
sidering a linear superposition of two subcurves of the
van Genuchten [33] type. The model is constructed based
on MIP data at specified initial state, and thus, it is
representative of this initial pore network configuration. The
different model parameters are fitted and their evolution with
water content and void ratio studied. The evolving nature
along generalised stress paths (with varying void ratio and
water content) is taken into account by updating the pore
network configuration as the hydraulic paths develop. Sim-
ulated water retention results are finally compared with
controlled-suction oedometer tests, in which different wet-
ting and drying paths are carried out at different initial void
ratios. In this way, the capability of the proposed multimodal
water retention model is analysed and discussed.
2 Material used in the research
The material used in the experimental programme is an
aeolian silt retrieved from a layer of alluvial soil located at
Jossigny, east of Paris, France. The behaviour of the sat-
urated and unsaturated state of this material has been
studied by various authors [4, 5, 6, 34]. The physical
properties of Jossigny silt are reported in Table 1. The soil
is classified as low-plasticity silt (CL) (Fig. 1) with a
clayey fraction of 25%. Clay minerals determined by X-ray
diffractometry are illite, kaolinite and inter-stratified illite–
smectite. No significant swelling properties on compacted
states have been observed on wetting [17].
The grain size distribution of the soil and the grain size
distribution function are shown in Fig. 1. As observed, a
dominant particle size is 20 lm (within the silty size
domain). It is expected that this dominant particle size is
assembling the shielding skeleton of the material and that
aggregations are mainly connecting and covering silty
grains. An inter-grain pore size of around 20% of the
particle size and around 4 lm is expected to prevail in this
shielding skeleton, which will be discussed in terms of the
pore size distribution data presented in the next section.
Several samples of Jossigny silt were statically com-
pacted at constant water content wo = (12.8 ± 0.5)% and
at different void ratios. The samples were then saturated
under oedometer conditions at constant vertical stress
rv = 100 and 200 kPa by Casini [4]. The volume change
results (Deasat, collapse on soaking) are plotted in Fig. 2 in
terms of the normalised variable Deasat/rvsat for the dif-
ferent initial void ratios studied. The compaction induces a
reduction in the macroporosity (inter-grain porosity), as
highlighted by Or [22] the collapse of voids is due to
Table 1 Physical properties of Jossigny silt
Unit weight of solids
cs (kN/m3)
Plastic limit
wP (%)
Liquid limit
wL (%)
Plasticity
index IP (%)
Clay fraction
(%)
Silt fraction
(%)
Sand fraction
(%)
26.4 17 32.3 15.3 25 70 5
140 Acta Geotechnica (2012) 7:139–150
123
Page 3
coalescence of aggregates into larger units. The informa-
tion in Fig. 2 is, thus, extremely useful to define the lim-
iting void ratio (around 0.6), above which the inter-grain
porosity plays an important role.
3 Experimental programme
Twenty MIP tests were performed at five different void
ratios e (0.5 B e B 0.9) above the limit previously indi-
cated and at four gravimetric water contents w (13% B W
B 21%). The detailed MIP programme is reported in
Table 2, in which the water ratios ew (volume of water over
solid volume) and degrees of saturation of the different
initial states are also included. The different initial states are
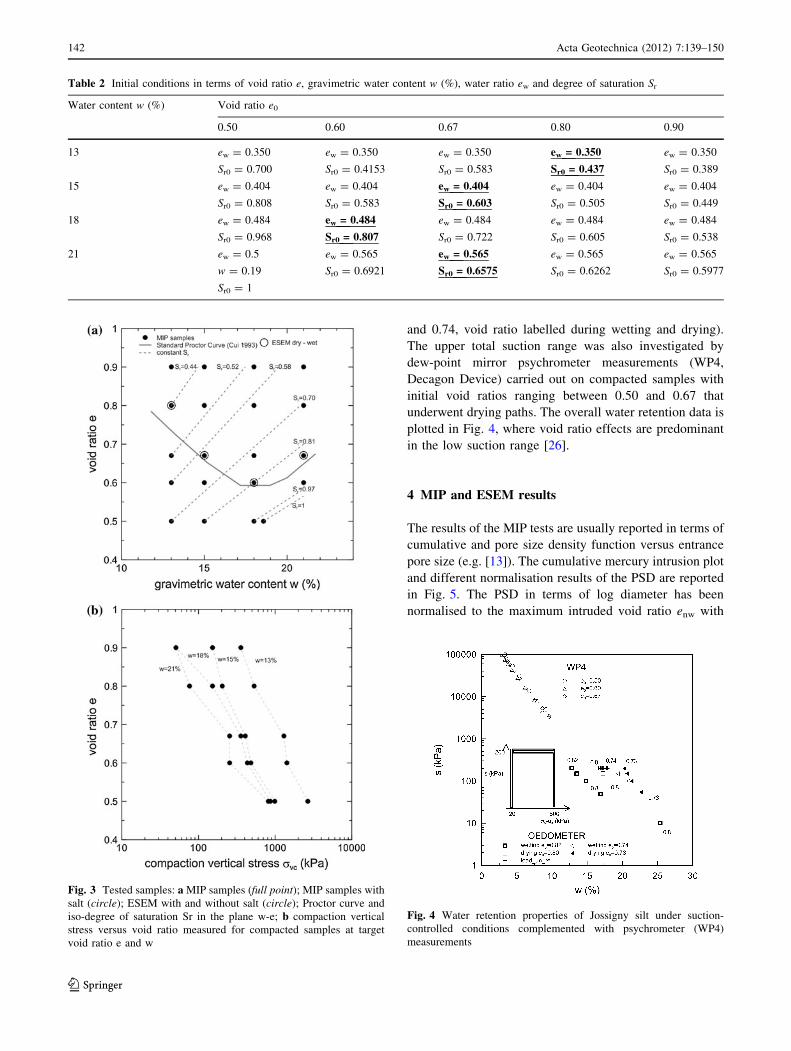
plotted with solid symbols in the Proctor plane shown in
Fig. 3a, together with the constant degree of saturation
lines. Some MIP tests have been repeated by adding
sodium chloride (NaCl) to the moulding water content in a
concentration of 0.5 and 3 M (indicated by circles in Fig. 3,
and with bold-underlined letters in Table 2). The addition
of salt is expected to induce contraction of the microstruc-
ture, because the osmotic effects should be predominant in
the microstructural domain and thus shifting of the domi-
nant micropore size to lower dimensions (e.g. [17]). The
ability to discern micro- and macroporosity is thus
enhanced. Figure 3b shows the different compaction verti-
cal stresses applied to achieve the different initial states.
Static compaction stresses decrease with void ratio decrease
and with the increase in the moulding water content.
MIP tests were performed on Pascal 140 and Pascal 440
apparatus from CE Instruments (France). Specimens were
placed in a volume-calibrated glass vessel (dilatometer)
and evacuated to about 0.03 kPa in the macropore unit
(Pascal 140). Mercury was then added, and the pressure
was increased continuously from vacuum to about
375 kPa. The dilatometer vessel was then transferred to the
micropore unit of the porosimeter (Pascal 440). The pres-
sure was increased stepwise to 400 MPa using pressure
transmission oil. The intruded volumes were corrected for
compressibility of mercury [35].
Environmental scanning electron microscopy (ESEM)
was also used to qualitatively describe the arrangement of
aggregation and particles, as well as the pore network
properties, of the compacted samples. The ESEM investi-
gation was performed using a FEI Quanta 600 ESEM at an
average water vapour pressure in the specimen chamber of
70 and 372 Pa, room temperature of 25� corresponding to a
relative humidity RH of 2.2 and 12%, respectively.
An oedometer test was performed to determine the water
retention properties following the stress paths shown in
Fig. 4. The stress paths allowed studying wetting and
drying paths at two different initial void ratios (e0 = 0.82
Fig. 1 Jossigny silt: a Grain size distribution; b Grain size density
function
Fig. 2 Deformation on saturation at constant vertical stress for
different initial void ratios (after Casini [4])
Acta Geotechnica (2012) 7:139–150 141
123
Page 4
and 0.74, void ratio labelled during wetting and drying).
The upper total suction range was also investigated by
dew-point mirror psychrometer measurements (WP4,
Decagon Device) carried out on compacted samples with
initial void ratios ranging between 0.50 and 0.67 that
underwent drying paths. The overall water retention data is
plotted in Fig. 4, where void ratio effects are predominant
in the low suction range [26].
4 MIP and ESEM results
The results of the MIP tests are usually reported in terms of
cumulative and pore size density function versus entrance
pore size (e.g. [13]). The cumulative mercury intrusion plot
and different normalisation results of the PSD are reported
in Fig. 5. The PSD in terms of log diameter has been
normalised to the maximum intruded void ratio enw with
Table 2 Initial conditions in terms of void ratio e, gravimetric water content w (%), water ratio ew and degree of saturation Sr
Water content w (%) Void ratio e0
0.50 0.60 0.67 0.80 0.90
13 ew = 0.350 ew = 0.350 ew = 0.350 ew = 0.350 ew = 0.350
Sr0 = 0.700 Sr0 = 0.4153 Sr0 = 0.583 Sr0 = 0.437 Sr0 = 0.389
15 ew = 0.404 ew = 0.404 ew = 0.404 ew = 0.404 ew = 0.404
Sr0 = 0.808 Sr0 = 0.583 Sr0 = 0.603 Sr0 = 0.505 Sr0 = 0.449
18 ew = 0.484 ew = 0.484 ew = 0.484 ew = 0.484 ew = 0.484
Sr0 = 0.968 Sr0 = 0.807 Sr0 = 0.722 Sr0 = 0.605 Sr0 = 0.538
21 ew = 0.5 ew = 0.565 ew = 0.565 ew = 0.565 ew = 0.565
w = 0.19 Sr0 = 0.6921 Sr0 = 0.6575 Sr0 = 0.6262 Sr0 = 0.5977
Sr0 = 1
Fig. 3 Tested samples: a MIP samples (full point); MIP samples with
salt (circle); ESEM with and without salt (circle); Proctor curve and
iso-degree of saturation Sr in the plane w-e; b compaction vertical
stress versus void ratio measured for compacted samples at target
void ratio e and w
Fig. 4 Water retention properties of Jossigny silt under suction-
controlled conditions complemented with psychrometer (WP4)
measurements
142 Acta Geotechnica (2012) 7:139–150
123
Page 5
non-wetting fluid to obtain a unit area below the curve
(Fig. 5c). To compare the effect of the initial void ratio of
the compacted material, the normalised density function
was further scaled by this initial void ratio, as shown in
Fig. 5d. This last plot PSD* was the one used to compare
the effect of the initial state on the pore size distribution.
In Fig. 6, the PSD* results are presented for the different
water contents and void ratios indicated in Fig. 3a. They
were classified into groups with the same water content;
and in each group, different void ratios were studied. It is
interesting to note that for the lower water content of
w = 13%, the PSD* is mono-modal, and the peak value is
centred on a diameter between 3 and 10 lm. This is rather
unusual for clayey soil, and this unusual trend can be
explained (supported by ESEM results Fig. 10a) because at
this low water content, the aggregates are not fully devel-
oped, and the intra-aggregate porosity is hidden by the
dominant inter-grain pores (associated with the pores
between grains of the shielding skeleton). This dominant
peak approximately coincides with the inter-grain pore size
estimated from the particle size distribution (Fig. 1b).
As the water content increases, the dominant pore mode
of the intra-aggregate domain emerges, and clear double-
porosity networks are detected in Fig. 6b, c. On loading at
wo = 15%, the macroporosity is consistently reduced, and
the dominant macropore sizes shifted towards lower pore
sizes. At wo = 18 and 21%, the dominant and arising
microporosity is shifted towards larger pore sizes. On
loading at this higher water contents, not only the
macroporosity is affected but also part of the micropore
volume (refer to Fig. 6c, d).
Similar results are also shown in Fig. 7, but grouped
together in terms of void ratio. On wetting at constant void
ratio, the microporosity emerges and progressively
occludes the macroporosity. During this wetting, the initial
monomodal structure observed at low water content pro-
gressively evolves towards a double-porosity network.
These behavioural features are consistently observed at the
different constant void ratios shown in Fig. 7.
Figure 8 shows the effects on the pore size distribution
when saline water is added to the soil at different initial
water contents and void ratios. The addition of salt induces
the contraction of the aggregates (microporosity) and the
shifting of the micropore size towards lower values, and
thus enhancing the double-porosity network. For a given
void ratio, the contraction of the microporosity induces the
development of macroporosity, as shown in Fig. 8c, d for
the higher water contents.
MIP results were interpreted using descriptors of the
PSD* and their evolution as a function of the initial con-
ditions (water content and void ratio). The descriptors used
to characterise the evolution of the PSD* are indicated in
Fig. 5, which correspond to:
• Peaks of the PSD* in terms of micro- and macropo-
rosities (pm and pM Fig. 5d).
• Dominant pore modes of micro- and macroporosities
(dm and dM Fig. 5c).
• Normalised pore volume corresponding to micro- and
macroporosities (indicated as aream and areaM in
Fig. 5c, and corresponding to aream ? areaM = 1).
The evolution of the descriptors as a function of the
initial state is indicated in Fig. 9. The peak values of the
Fig. 5 a Intruded void ratio; b pore size density function (PSD);
c PSD normalised with respect to the intruded void ratio (enw); d PSD
normalised over enw and scaled to the void ratio e
Fig. 6 Normalised PSD* curves for the same gravimetric water
content: a w = 13%; b w = 15%; c w = 18%; d w = 21%
Acta Geotechnica (2012) 7:139–150 143
123
Page 6
macroporosity range of the PSD* decrease with increasing
initial water content. An opposite trend is observed in the
dominant peaks of the microporosity range, as a
consequence of the expanding microstructure with water
content. Equivalent trends are observed for the normalised
micro- and macropore volumes in terms of their evolution
with water content. On regarding the dominant pore mode
of the microstructure, a slight shifting towards higher
values is observed at larger initial water contents, which is
also consistent with the expansion of the microporosity
with water content. Some shifting of the dominant pore
mode of the macroporosity towards larger values is also
observed at higher water contents. This trend may be
associated with some loss of the homogeneity of the
sample during compaction at high water contents (sticky
aggregates induced at high water contents). On regarding
initial void ratio effects, both micro- and macroporosity
peaks are decreased by compression. The dimensions of the
dominant micropore sizes are also shifted towards lower
dimensions on compression.
The arrangement of aggregations/particles and voids has
been also investigated at their initial water content using
environmental scanning electron microscopy (ESEM),
which works under controlled environmental conditions
[24]. Figure 10a, b presents the photomicrographs per-
formed at two contrasting water contents (w0 = 13 and
21%, respectively) and at the same void ratio (e0 = 0.80).
A double-porosity network is detected in the driest condi-
tion with well-defined inter-aggregate pores (around
10–20 lm), aggregations and particles. At higher water
content, the aggregates increase their size and reduce the
macropore volume, as shown in Fig. 10b.
The shielding skeleton formed by silt particles and
aggregates connecting particles and filling inter-grain
pores is clearly identified in Fig. 11a, b, in which the
driest state (w0 = 13%) is presented at two void ratios
(e0 = 0.8 and 0.9, respectively). On compression, the
macroporosity appears to be reduced when comparing
both photomicrographs.
The microstructural investigation was extended to
samples that were prepared with saline water. As observed
in Fig. 12 at w0 = 15%, a denser microstructure is induced
due to the contraction of the aggregates, in which clear
inter-aggregate pores are detected (the addition of salt
induces the enhancement of the double-porosity features).
5 Water retention properties based on MIP results
The MIP results can be used to obtain the relationship
between the suction and the degree of saturation or water
content at constant void ratio. The mercury intrusion is
assimilated to the air intrusion (non-wetting fluid) during
the drying path of the water retention curve. Thus, the
injection of mercury with a contact angle is equivalent to
the drainage of the water induced by air front advancing for
Fig. 7 Normalised PSD* curves for the same void ratio: a e = 0.50;
b e = 0.60; c e = 0.67; d e = 0.80; e e = 0.90
Fig. 8 Comparison of PSD curves for samples with and without the
addition of salt (NaCl): a w = 13%; e = 0.80; b w = 15%; e = 0.67;
c w = 18%; e = 0.6; d w = 21%; e = 0.6
144 Acta Geotechnica (2012) 7:139–150
123
Page 7
the same diameter of pores intruded. Under the hypoth-
esis of non-deformable soil skeleton, the volume of pores
non-intruded by the mercury should be used to evaluate
the degree of saturation or the water content corre-
sponding to the equivalent applied air overpressure.
Anyway, the non-intruded porosity by the mercury
should be taken into account for estimating the residual
water content in the evaluation of the water content [24].
The WRC obtained is valid in the range where the
capillarity is the predominant physical mechanism, usu-
ally for suction s \ 2 MPa [24].
The water ratio ew ¼ Vw=Vs ¼ Sr � e is estimated by the
following equations:
enw þ ew ¼ e; ew ¼ e� enw ¼ ð1� SrnwÞ � e ð1Þ
where enw is the non-wetting ratio (mercury) and Sr and
Srnw the degree of saturation of water and non-wetting
fluid, respectively (Sr ? Srnw = 1 for a two fluid mixture).
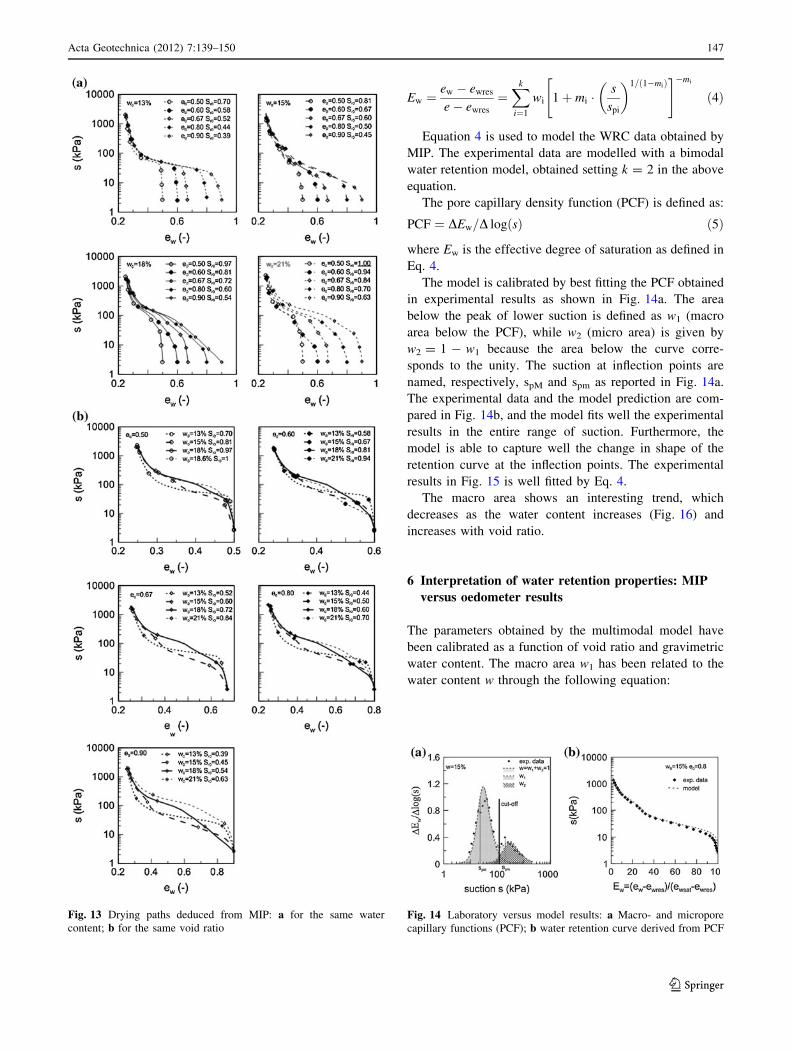
In Fig. 13, the WRCs obtained after the correction that
takes into account the non-intruded porosity and the
adsorbed water are reported. The residual water ratio has
been taken ewres = 0.25 in agreement with measurements
performed with a WP4 at different void ratios.
The results are reported in the plane water ratio ew—
suction s for the same water content (Fig. 13a) and the
same void ratio (Fig. 13b). As the void ratio decreases, the
air entry value increases, and the curves are steeper. This
trend is consistent for the four gravimetric water contents
investigated (Fig. 13a). The increase in the compaction
water content let the curves more dispersed in the higher
range of suctions (s C 100 kPa).
The driest samples (w = 13%) show a more rigid
behaviour before the air entry value, after that the curves
show a less steep trend compared to the wettest samples
(Fig. 13b). This behaviour persisting for the five void ratios
is explored. For the same compaction water content, the
form of the curves is similar, while the void ratio affects
the air entry values of the curves.
Usually the WRC obtained for the different types of soil
is best fitted with original or modified van Genuchten [33]
or Brooks and Corey [3] models without taking into
account the heterogeneity of the pore systems (e.g. [2, 25,
28, 32]). Here the heterogeneity of the pore system induced
by the compaction process is taken into account using a
multimodal retention model, defined by Durner [9] as a
linear superposition of subcurves of the van Genuchten
type with the following equation:
Ew ¼ew � ewres
e� ewres
¼Xk
i¼1
wi
1
1þ ai � sð Þni
� �mi
ð2Þ
Fig. 9 PSD* parameters versus gravimetric water content
Acta Geotechnica (2012) 7:139–150 145
123
Page 8
where k is the number of subsystems that assembled
together give the global pore size distribution, wi are
weighting factors for each subcurve subject to 0 \ wi \ 1
andP
wi ¼ 1. For the parameters of the subcurves (ai, ni,
mi) must be imposed the condition ai [ 0; mi [ 0; ni [ 1.
Here, the additional constraint ni ¼ 1= 1� mið Þ is imposed.
Each subcurve in Eq. 2 differentiated two times with
respect to the suction s gives the relationship between the
suction at the inflection point and the parameters given by
the following expression:
spi ¼m1�mi
i
ai
ð3Þ
where spi is the suction at the inflection point in the Ew-s
plane. Once ai is obtained, from Eq. 3 and substituting in
Eq. 2, the water storage mechanism in a heterogeneous
porous medium becomes:
Fig. 10 ESEM on Jossigny silt with void ratio e = 0.80: a water
content w = 13%; b water content w = 21%
Fig. 11 Shielding effect at water content w = 13%: a void ratio
e = 0.80; b void ratio e = 0.90
Fig. 12 Effect of the addition of NaCl on the microstructure of
Jossigny silt
146 Acta Geotechnica (2012) 7:139–150
123
Page 9
Ew ¼ew � ewres
e� ewres
¼Xk
i¼1
wi 1þ mi �s
spi
� �1=ð1�miÞ" #�mi
ð4Þ
Equation 4 is used to model the WRC data obtained by
MIP. The experimental data are modelled with a bimodal
water retention model, obtained setting k = 2 in the above
equation.
The pore capillary density function (PCF) is defined as:
PCF ¼ DEw=D logðsÞ ð5Þ
where Ew is the effective degree of saturation as defined in
Eq. 4.
The model is calibrated by best fitting the PCF obtained
in experimental results as shown in Fig. 14a. The area
below the peak of lower suction is defined as w1 (macro
area below the PCF), while w2 (micro area) is given by
w2 = 1 - w1 because the area below the curve corre-
sponds to the unity. The suction at inflection points are
named, respectively, spM and spm as reported in Fig. 14a.
The experimental data and the model prediction are com-
pared in Fig. 14b, and the model fits well the experimental
results in the entire range of suction. Furthermore, the
model is able to capture well the change in shape of the
retention curve at the inflection points. The experimental
results in Fig. 15 is well fitted by Eq. 4.
The macro area shows an interesting trend, which
decreases as the water content increases (Fig. 16) and
increases with void ratio.
6 Interpretation of water retention properties: MIP
versus oedometer results
The parameters obtained by the multimodal model have
been calibrated as a function of void ratio and gravimetric
water content. The macro area w1 has been related to the
water content w through the following equation:
Fig. 13 Drying paths deduced from MIP: a for the same water
content; b for the same void ratioFig. 14 Laboratory versus model results: a Macro- and micropore
capillary functions (PCF); b water retention curve derived from PCF
Acta Geotechnica (2012) 7:139–150 147
123
Page 10
w1ðarea macro) ¼ ðwres=wÞa ð6Þ
where a ¼ ðpar1 � eÞpar2 and wres = ewres/Gs = 0.25/
2.69 = 0.0929, which is the residual water content of the
soil. The values of the different parameters are reported in
Table 3. The comparison between MIP data and the model
(in dotted line) is presented in Fig. 17.
Also the suction at inflection points for micro and macro
domains have been related to the water content and void
ratio through similar equations:
spM ¼ A � ðwres=wÞb; spm ¼ B � ðwres=wÞd ð7Þ
where A ¼ par3, b ¼ par4 � eþ par5, B ¼ par6 � eþ par7
and d ¼ par8 � eþ par9.
The gradient of the macro mM and micro mm retention
functions has been related to the void ratio and water
content with the equations:
mM ¼ ðwres=wÞpar10 and mm ¼ par11 � ðwres=wÞpar12 ð8Þ
The values of the different parameters are given in
Table 3.
The data of drying path obtained under suction-con-
trolled conditions and oedometer conditions have been
compared with the model prediction in Fig. 18. Two drying
curves have been simulated, one for the path at lower
density (void ratio at the beginning of the drying path
e0 = 0.80) and the second for the path at higher density
(void ratio e0 = 0.73). Curves have been normalised in
order to fit the initial and final water contents of each path.
The evolution is reasonably reproduced by the model for
both changes in suction and vertical load.
7 Conclusions
An extended microstructural investigation (mercury intru-
sion porosimetry MIP and electron micrographs) has been
performed on statically compacted Jossigny silt at different
initial void ratios and water contents. The objective was to
obtain a deeper understanding of the evolution of the
microstructural changes on a silty soil and their consequences
Fig. 15 Comparison between model and experimental data for
different gravimetric water contents
13 15 17 19 21
w
0
0.2
0.4
0.6
0.8
1
w1
(are
amac
ro)
e=0.50e=0.60e=0.67
e=0.80e=0.90model
Fig. 16 Comparison between model and experimental results: area
macro versus gravimetric water content
Table 3 Bimodal retention model parameters
par1 par2 par3 (kPa) par4 par5 par6 (kPa) par7 (kPa) par8 par9 par10 par11 par12
1.36 0.61 150 4.73 0.54 -312 358 -2.01 1.95 0.99 0.75 0.45
13 15 17 19 21
w
0
10
20
30
40
50
60
s pM
(kP
a)
e=0.50e=0.60e=0.67
e=0.80e=0.90model
w
60
80
100
120
140
160
s pm
(kP
a)
13 15 17 19 21
(a) (b)
Fig. 17 Comparison between MIP data and model results of peak
value of suction as a function of water content: a Macro; b micro
148 Acta Geotechnica (2012) 7:139–150
123
Page 11
on the water retention properties. As highlighted by the
experimental results, the shape of the PSD is essentially
controlled by the compaction water content. The PSDs are
basically bimodal in the range of water contents and void
ratios tested. At low water contents, the microporosity
decreases and the PSD tends to a quasi-monomodal dis-
tribution for the driest compaction. At higher water con-
tents, more and more aggregates are created by the
compaction process, which induces the emergence of an
increasingly pronounced peak around 2 lm in the PSD.
For wet samples, aggregates form a shielding skeleton
around the sand/silt particles (confirmed by ESEM
micrographs), and the PSD recovers a monomodal distri-
bution. When compacted with saline solution, the material
presents a more pronounced double-porosity, as a result of
aggregate shrinkage.
The drying path of the water retention curve obtained by
MIP has been modelled with a multimodal retention model,
where the weighted parameters are related to the area
below the pore capillary distribution and the suctions at
inflection points to the peak value of the distribution. The
agreement between the measured and the estimated WRC
indicates that the multimodal prediction method leads to
more realistic estimation of the retention properties of
soils. The model parameters are related to the pore capil-
lary distribution and have a clear physical meaning. The
model has been satisfactorily used to reproduce the suc-
tion-water content path during drying at different initial
void ratios and under oedometer conditions.
The research work highlights the importance of mod-
elling the double-porosity development during compaction,
even for non-plastic materials, and proposes a flexible
model to capture the retention curve resulting from
microstructural features.
Acknowledgments The authors acknowledge Michael Plotze and
Gabriele Peschke of Institute of Geotechnical Engineering at ETHZ
for their technical support in performing the MIP and ESEM tests,
respectively.
References
1. Aubertin M, Mbonimpa M, Bussiere B, Chapuis RP (2003) A
model to predict the water retention curve from basic geotech-
nical properties. Can Geotech J 40:1104–1122
2. Barbour SL (1998) The soil-water characteristic curve: a histor-
ical perspective. Can Geotech J 35:873–894
3. Brooks RH, Corey AT (1964) Hydraulic properties of porous
media. Colo State Univ Hydrol Paper 3:1–27
4. Casini F (2008) Effetti del grado di saturazione sul comporta-
mento meccanico di un limo. PhD thesis, Universita degli Studi
di Roma ‘‘La Sapienza’’, Italy
5. Cui YJ (1993) Etude du comportement d’un limon non sature et
de sa modelisation dans un cadre elasto-plastique. PhD thesis,
Ecole Nationale des Ponts et Chassees, Paris, France
6. Cui YJ, Delage P (1996) Yielding and plastic behavior of an
unsaturated compacted silt. Geotechnique 46(2):291–311
7. Delage P (2010) A microstructure approach to the sensitivity and
compressibility of some Eastern Canada sensitive clays. Geo-
technique 60(5):353–368
8. Delage P, Audiguier M, Cui YJ, Howat M (1996) The micro-
structure of a compacted silt. Can Geotech J 33:150–158
9. Durner W (1994) Hydraulic conductivity estimation for soils with
heterogeneous pore structure. Water Resour Res 30(2):211–223
10. Gallipoli D, Wheeler S, Karstunen M (2003) Modelling the
variation of degree of saturation in a deformable unsaturated soil.
Geotechnique 53(1):105–112
11. Gens A, Alonso E, Suriol J, Lloret A (1995) Effect of structure on
the volumetric behaviour of a compacted soil. In: Proceedings of
1st international conference on unsaturated soils, Paris
12. Juang CH, Holtz RD (1986) Fabric, pore size distribution, and
permeability of sandy soils. J Geotech Eng Div ASCE 112(9):
855–868
13. Koliji A, Vuillet L, Laloui L (2010) Structural characterization of
unsaturated aggregated soil. Can Geotech J 47:297–311
14. Lapierre C, Leroueil S, Locat J (1990) Mercury intrusion and
permeability of Louisville clay. Can Geotech J 27:761–773
15. Leroueil S, Bouchlin G, Tavenas F, Bergeron L, La Rochelle P
(1990) Permeability anisotropy of natural clays as a function of
strain. Can Geotech J 27:568–579
16. Masın D (2010) Predicting the dependency of a degree of satu-
ration on void ratio and suction using effective stress principle for
unsaturated soils. Int J Numer Anal Meth Geomech 34:73–90
17. Mayne C, Murad M (2003) Macroscopic behavior of swelling
porous media derived from micromechanical analysis. Transp
Porous Media 50:127–151
18. Mbonimpa M, Aubertin M, Bussiere B (2006) Predicting the
unsaturated hydraulic conductivity of granular soils from basic
geotechnical properties using the modified Kovacs (MK) model
and statistical models. Can Geotech J 43:773–787
19. Miller GA, Khoury CN, Muraleetharan KK, Lui C, Kibbey TCG
(2008) Effects of soil skeleton deformations on hysteretic soil
water characteristics curves: experiments and simulations. Water
Resour Res 44:1–10. doi:10.1029/2007WR006492
20. Monroy R, Zdravkovic L, Ridley A (2010) Evolution of micro-
structure in compacted London clay during wetting and loading.
Geotechnique 60(2):105–119
21. Nuth M, Laloui L (2008) Advances in modelling hysteretic water
retention curve in deformable soils. Comput Geotech 35:835–844
22. Or D (1996) Wetting-induced soil structural changes: the theory
of liquid phase sintering. Water Resour Res 32(10):3041–3049
0 0.2 0.4 0.6 0.8 1
Ew=(ew-ewres)/(e-ewres)
0
40
80
120
160
200
s (k
Pa)
data e=0.80data e=0.73
model e=0.80model e=0.73
drying
Fig. 18 Comparison along drying paths between experimental data
under suction-controlled conditions and model predictions
Acta Geotechnica (2012) 7:139–150 149
123
Page 12
23. Richard G, Cousin I, Sillon JF, Bruand A, Guerif J (2001) Effect
of compaction on the porosity of a silty soil: influence on
unsaturated hydraulic properties. Eur J Soil Sci 52:49–58
24. Romero E, Simms PH (2008) Microstructure investigation in
unsaturated soils: a review with special attention to contribution
of mercury intrusion porosimetry and environmental scanning
electron microscopy. Geotech Geol Eng 26(6):705–727
25. Romero E, Vaunat J (2000) Retention curves of deformable clays.
In: Proceedings of international workshop on unsaturated soils:
experimental evidence and theoretical approaches, Balkema,
Trento, pp 91–106
26. Romero E, Lloret A, Gens A (1999) Water permeability, water
retention and microstructure of unsaturated Boom clay. Eng Geol
54:117–127
27. Romero E, Della Vecchia G, Jommi C (2011) An insight into the
water retention properties of compacted clayey soils. Geotech-
nique 61(4):313–328
28. Salager S, El Youssoufi MS, Saix C (2010) Definition and
experimental determination of a soil water retention surface. Can
Geotech J 47(6):609–622
29. Simms PH, Yanful EK (2004) Estimation of soil-water charac-
teristic curve of clayey till using measured pore-size distributions.
J Geotech Eng Div ASCE 130(8):847–854
30. Simms PH, Yanful EK (2005) A pore-network model for
hydromechanical coupling in unsaturated compacted clayey soils.
Can Geotech J 42:499–514
31. Tarantino A (2009) A water retention model for deformable soils.
Geotechnique 59(9):751–762
32. Tarantino A (2010) Compacted versus reconstituted states. In:
Proceedings of 5th international conference on unsaturated soils,
Balkema, Barcelona, pp 113–136
33. van Genuchten MT (1980) A closed-form equation for predicting
the hydraulic conductivity of unsaturated soil. Soil Sci Soc Am J
44:892–898
34. Vicol T (1990) Comportment hydraulique et mecanique d’un sol
fin non sature application a la modelisation. PhD Thesis, Ecole
Nationale des Ponts et Chassees, Paris, France
35. Weber TM, Plotze M, Laue J, Peschke G, Springman (2010)
Smear zone identification and soil properties around stone col-
umns constructed in-flight in centrifuge model tests. Geotech-
nique 60(3):197–206
150 Acta Geotechnica (2012) 7:139–150
123