30
Conservation value mapping and marine zoning in Hanö Bight Conference on “The interlink between MSFD and MSP” 2014-10-22 Riga, Latvia Frida Fyhr, AquaBiota Water Research, [email protected]

Conservation value mapping and
marine zoning in Hanö Bight
Conference on “The interlink
between MSFD and MSP”
2014-10-22
Riga, Latvia
Frida Fyhr,
AquaBiota Water Research,

Examples from MARMONI in Hanö Bight
1. Conservation value mapping
2. Ocean zoning
Conservation value mapping
Hands on methods for finding
suitable areas for MPAs

Conservation value
mapping

1. Identifying biotopes and habitats
2. Evaluation
3. Spatial mapping
4. Compilation of different data sets
Conservation value mapping
Method in four steps

Comparability and representativeness
• God spatial coverage
• Comparable spatial resolution and quality
• Temporal resolution
- “Snapshot data” can be fine for benthic species
- Time series required for mobile species
Conservation value mapping Step 1: Identifying biotopes and habitats
Considerations for data selection

Conservation value mapping Step 1: Identifying biotopes and habitats
Data available
• Benthic biotopes; flora and fauna
• Inshore fish recruitment
• Coastal and offshore wintering seabirds
• Seals

1. Identifying biotopes and habitats
2. Evaluation
3. Spatial mapping
4. Compilation of different data sets
Conservation value mapping
Method in four steps
Conservation value mapping
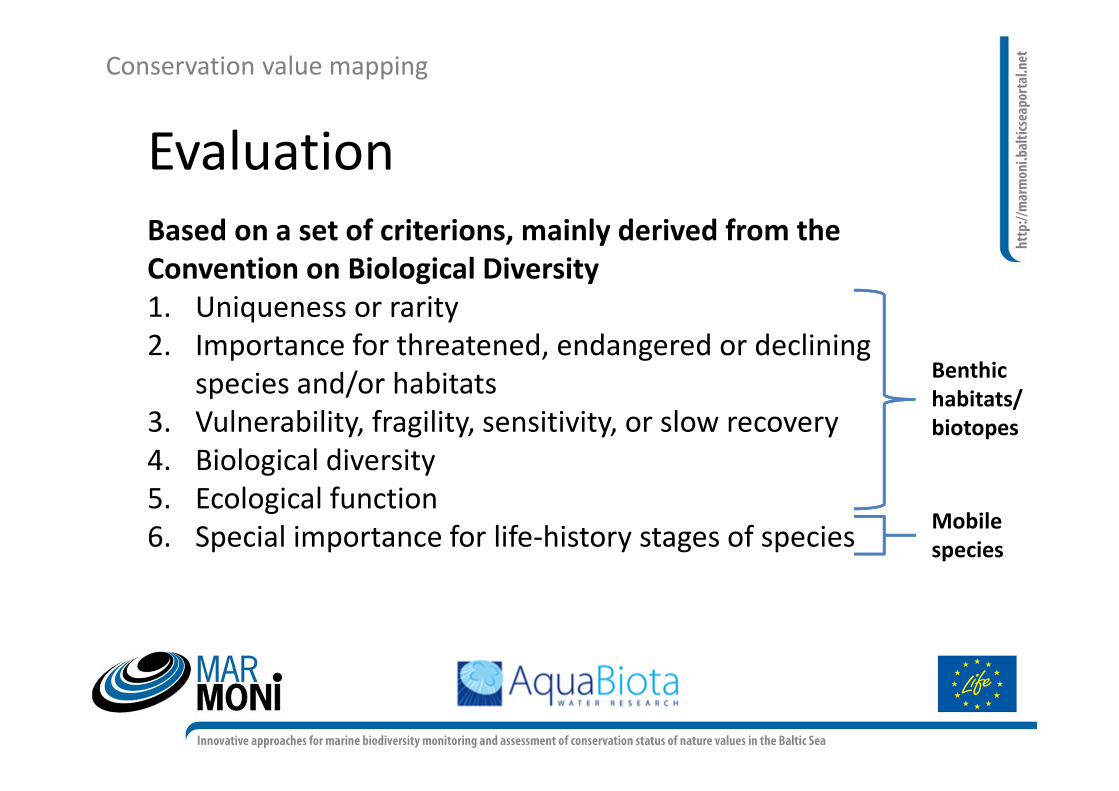
Evaluation
Based on a set of criterions, mainly derived from the
Convention on Biological Diversity
1. Uniqueness or rarity
2. Importance for threatened, endangered or declining
species and/or habitats
3. Vulnerability, fragility, sensitivity, or slow recovery
4. Biological diversity
5. Ecological function
6. Special importance for life-history stages of species
Benthic
habitats/
biotopes
Mobile
species

Biotope (≥ 50 % coverage) Rarity Threat Diversity FunctionGiven
value
Submerged rooted plants
Potamogeton perfoliatus and/or Stuckenia
pectinata1 10 10
Zanichellia spp. and/or Ruppia spp. 1 1 2
Myriphyllum spicatum and/or M. sibricum 10 1 10 10
Charales 10 1 1 10 10
Zostera marina 1 1 10 10
Perennial algae
Fucus spp. 1 10 10
Non-filamentous corticated red algae 1 1 1 3
Filamentous perennial algae 1 1 2
Stable aggregations of unattached algae
Loose Fucus typical/dwarf form 1 1 1 3
Ceratophyllum demersum 10 1 10
Annual algae
Filamentous annual algae 1 1 1 3
Chorda filum and/or Halosiphon
tomentosus1 1 1 3
Conservation value mapping Step 2: Evaluation
Example; Phytobenthic biotopes

Conservation value mapping Step 3: Spatial mapping
Benthic biotopes and fish
recruitment areasBased on modelled distribution of species
PikeBlue mussel

Conservation value mapping Step 2 and 3: Evaluation and mapping
Example; Wintering seabirds
Based on yearly mean concentrations (7/10 years)

1. Identifying biotopes and habitats
2. Evaluation
3. Spatial mapping
4. Compilation of different data sets
Conservation value mapping
Method in four steps

+
+
Wintering birds
Conservation value mapping Step 4: Compilation of different data sets
Compilation within organism groups

Zoobenthos
Fish Seals
Phytobenthos
Conservation value mapping Step 4: Compilation of different data sets
Compilation within organism groups

+
+
+
+
Conservation value mapping Step 4: Compilation of different data sets
Compilation between organism groups
Note! Not all values are represented! E.g.:
� Pelagic fish
� Bird breeding areas
� Harbor porpoises
� Underwater areas for seals

Ocean Zoning

• Spatial planning tool
• A part of MSP and can enable Ecosystem-Based
Management
• Enables holistic planning/management
• A way of integrating management of activities
within different sectors
• Supports communication
Ocean zoning
About ocean zoning

Ocean zoning
Objectives for Hanö Bight analysis
• Identify optimal areas for nature conservation, MPAs
• Test scenarios for protection targets
• Pilot case for national Marine Spatial Planning

Ocean zoning
Marxan with Zones• A planning tool, originally for creation of MPAs
• “most widely used conservation planning software in the
world“
• Producing a marine multi-use zoning map
• Locates areas that efficiently meet targets for (conservation)
values while minimizing area with conflicts between activities
and the selected values.
• Optimized to solve a complex task with numerous solutions.

Ocean zoning Conservation values
Conservation valuesV
eg
eta
tio
n Fucus serratus
Furcellaria lumbricalis
Coccotylus truncatus/ Phyllophora
pseudoceranoides
Bo
tto
m f
au
na
Mytilus edulis
Macoma balthica
Marenzelleria spp.
Monoporeia affinis/Pontoporeia
femorata
Bathyporeia
Se
ab
ird
s Medium concentration areas for
Long-tailed Duck
Medium concentration areas for
Long-tailed Duck
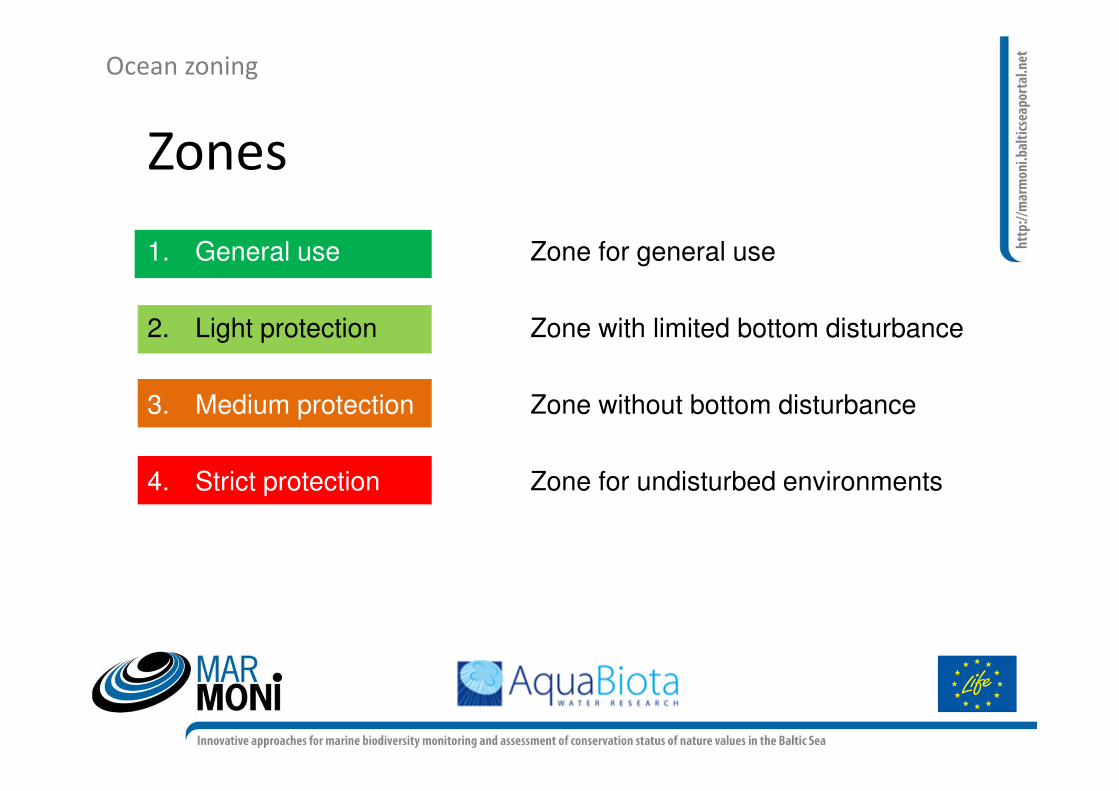
Ocean zoning
Zones
1. General use Zone for general use
2. Light protection Zone with limited bottom disturbance
3. Medium protection Zone without bottom disturbance
4. Strict protection Zone for undisturbed environments
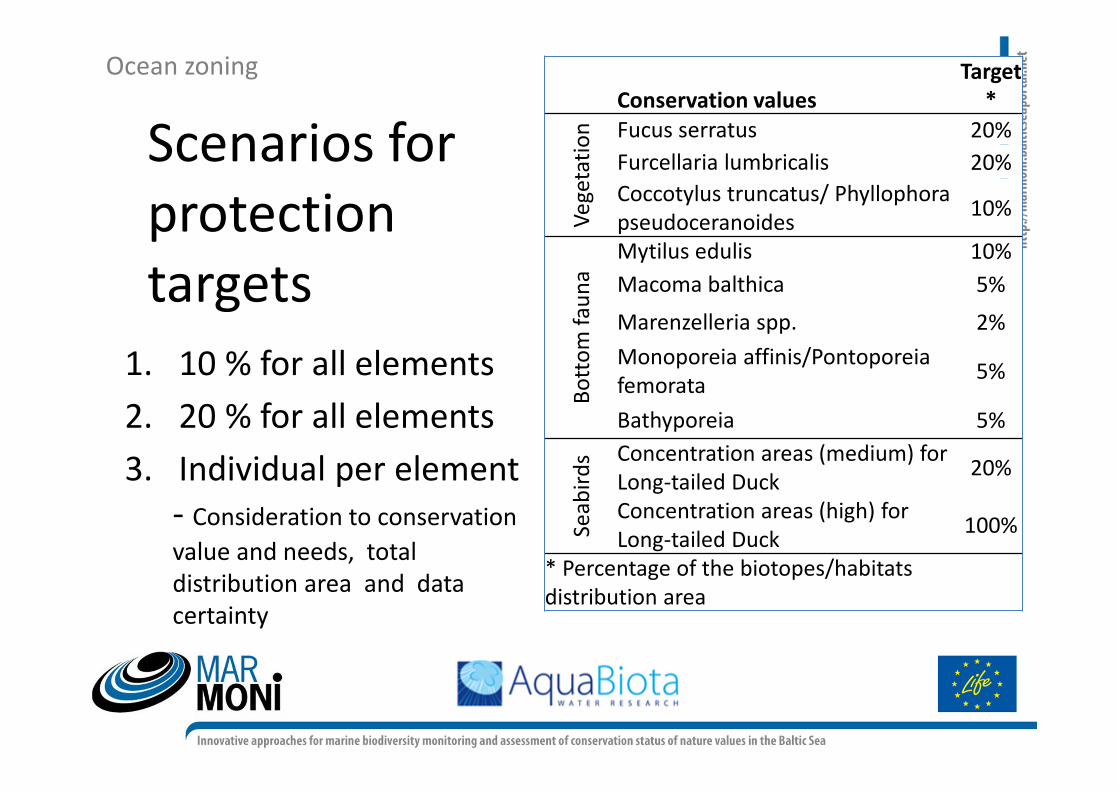
Ocean zoning
Scenarios for
protection
targets
1. 10 % for all elements
2. 20 % for all elements
3. Individual per element
- Consideration to conservation
value and needs, total
distribution area and data
certainty
Conservation values
Target
*
Ve
ge
tati
on Fucus serratus 20%
Furcellaria lumbricalis 20%
Coccotylus truncatus/ Phyllophora
pseudoceranoides10%
Bo
tto
m f
au
na
Mytilus edulis 10%
Macoma balthica 5%
Marenzelleria spp. 2%
Monoporeia affinis/Pontoporeia
femorata5%
Bathyporeia 5%
Se
ab
ird
s Concentration areas (medium) for
Long-tailed Duck 20%
Concentration areas (high) for
Long-tailed Duck100%
* Percentage of the biotopes/habitats
distribution area

Ocean zoning
ActivitiesActivity
Mil
ita
ry
Underwater blast zone
Military dumping area
Marine firing range (marine)
Risk area over water
Sh
ipp
ing Anchoring areas
Constant traffic
Heavy traffic
Frequent traffic
Wind turbines
Fis
hin
g
Bottom trawl (coarse mesh)
Bottom trawl (fine mesh)
Gillnets
Yarn
Fyke nets
Pelagic trawl (fine mesh)
Pelagic trawl (coarse mesh)
Cages
Long Line
Drivetrain
Trolls
Are
as
of
na
tio
na
l
inte
rest
National interest Commercial
fishing sea
National interest Harbour
National interest Maritime
National interest Outdoors
National interest Highly
exploited coastal

High conflict
No conflict
Ocean zoning
Conflicts
Zone
Activity
General
use
Light
protection
Medium
protection
High
protection
Mil
ita
ry
Underwater blast zone
Military dumping area
Marine firing range (marine)
Risk area over water
Sh
ipp
ing Anchoring areas
Constant traffic
Heavy traffic
Frequent traffic
Wind turbines
Fis
hin
g
Bottom trawl (coarse mesh)
Bottom trawl (fine mesh)
Gillnets
Yarn
Fyke nets
Pelagic trawl (fine mesh)
Pelagic trawl (coarse mesh)
Cages
Long Line
Drivetrain
Trolls
Are
as
of
na
tio
na
l
inte
rest
National interest Commercial
fishing sea
National interest Harbour
National interest Maritime
National interest Outdoors
National interest Highly
exploited coastal

Draft result
Ocean zoning
Scenario with goal of 10 %
Scenario with goal of 20 %
Scenario with individual goals
Zones:
General use
Light protection
Medium protection
Strict protection

Draft result, other parameters
Ocean zoning
Scenario with goal of 20 % Selection frequency for zone ”Strict
protection”
Selection frequency for zone ”Medium
protection”
Selection frequency for zone ”Light
protection”
High
Low

Draft result, other parameters
Ocean zoning
Area (m²) per biotope /habitat and zone
Scenario with goal of 20 %
0
200 000 000
400 000 000
600 000 000
800 000 000
1 000 000 000
1 200 000 000
No
Ligth
Medium
Strict
Area (%) per biotope/habitat and zone
0%
10%
20%
30%
40%
50%
60%
70%
80%
90%
100%
No
Ligth
Medium
Strict
% per biotope /habitat and zone
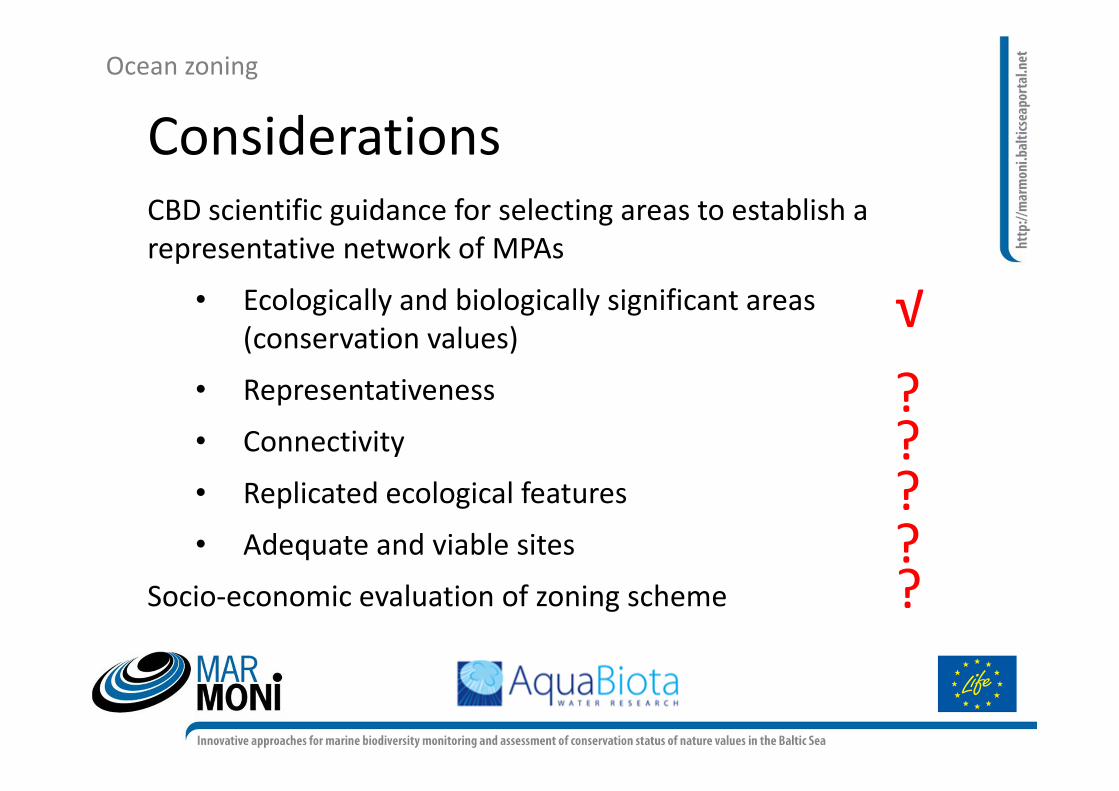
CBD scientific guidance for selecting areas to establish a
representative network of MPAs
• Ecologically and biologically significant areas
(conservation values)
• Representativeness
• Connectivity
• Replicated ecological features
• Adequate and viable sites
Socio-economic evaluation of zoning scheme
Considerations
Ocean zoning
√
??
??
?

• Marxan with Zones can provide a useful basis for
marine protection (and perhaps other sectors),
but the results are strongly dependent on the
underlying management
E. g. how much do we need to protect to achieve GES?
And with what kind of protection (zone design)?
• Instrument for external and internal
communication
Concluding thoughts
Conservation value mapping and Ocean zoning


