31


COVER
l e t ’s e m bar k on an adve nture . . .
and visit each of Penn National Gaming’s properties.
penn nat ional gaming has be en onan adventure of its own in recent years – operating in a
period of acquisition that has allowed the company to
become a leader in the gaming and entertainment industry.
our travels will take us to west virginia,Louisiana, Mississippi, Pennsylvania, New Jersey, Ontario
and Colorado. Let’s get started!
PENN NATIONAL GAMING
Consolidated Financial Highlights 2
The Year in Review 4
All About Us 6
Financial Information 15

YEAR ENDED DECEMBER 31, 1999 2000 2001
(In thousands, except per share data)
Income statement dataTotal revenues $170,360 $291,801 $519,392Income from operations 17,665 45,120 77,712Income before extraordinary item 6,733 18,575 23,758Net income 6,733 11,992 23,758
Per share dataBasic
Income before extraordinary item $.45 $1.24 $1.55Net income .45 .80 $1.55
DilutedIncome before extraordinary item .44 1.20 1.49Net income .44 .78 1.49
Weighted shares outstandingBasic 14,837 14,968 15,327Diluted 15,196 15,443 15,918
Balance data sheetCash $ 9,434 $ 23,287 $ 38,378Total assets 189,712 439,900 679,377Total debt 91,213 309,299 458,909Shareholders’ equity 66,272 79,221 103,265
EBITDA 26,496 59,481 112,336
TOTAL REVENUES (IN MILLIONS)
$0
$25
$50
$75
$10
0$
125
$15
0$
175
$20
0$
225
$25
0$
275
$30
0$
325
$35
0$
375
$40
0$
425
$45
0$
475
$50
0$
525
$55
0$
575
1999
2000
2001
$0
$5
$10
$15
$20
$25
$30
$35
$40
$45
$50
$55
$60
$65
$70
$75
$80
$85
$90
$95
$10
0$
105
$11
0$
115
1999
2000
2001
$.0
0$
.10
$.2
0$
.30
$.4
0$
.50
$.6
0$
.70
$.8
0$
.90
$1.
00$
1.10
$1.
20$
1.30
$1.
40$
1.50
$1.
60$
1.70
$1.
80$
1.90
$2.
00$
2.10
$2.
20$
2.30
1999
2000
2001
EBITDA (IN MILLIONS)*
DILUTED EARNINGS PER SHARE BEFORE EXTRAORDINARY ITEM
CONSOLIDATED FINANCIAL HIGHLIGHTS
32
* Earnings before interest, taxes, depreciation and amortization (EBITDA)

54
This May we expect to open a new 1,500 space parking
facility at Charles Town which is an important element
in this facility’s overall expansion plan.We have also
commenced construction of nearly 100,000 square feet
of new gaming, restaurant, entertainment, and back-of-
house facilities at Charles Town that will open in two phases
through 2002. Following the parking facility opening in
May, the first phase of the casino expansion will open this
Summer – along with the placement of an additional 500
slot machines – with the balance of the facility completed
by December.Throughout 2003 we have been authorized
by the West Virginia Lottery Commission to place an
additional 1,000 new gaming machines at Charles Town,
so by year-end 2003, we will operate 75% more gaming
devices at Charles Town than we do at present.As a result
of these expansion plans we expect to see considerable
growth at Charles Town in 2002, 2003, and beyond.
FINANCING GROWTHEarly in 2002, Penn National raised approximately $270
million through the issuance of stock and bonds.This
new capital was used to repay indebtedness – which was
incurred as a result of our expansion – under our existing
credit facilities. By reducing debt, we gained the flexibility
to finance other expansion opportunities that we may
identify that meet our criteria for financial and strategic
growth. Importantly, these financings significantly improved
Penn National’s credit statistics and at present, we have
one of the best credit profiles in the gaming industry.
MANAGEMENTGaming properties are highly management intensive and
require strong leadership to remain competitive with
surrounding properties. In 2001 we strengthened our
team, both at the corporate and property level with very
good results.We expect a few additions to our management
in 2002, which should complete our outstanding corporate
and property management teams. Penn National now
possesses one of the strongest management teams in the
gaming industry in terms of the depth of our operational
and financial experience.
With our portfolio of diversified gaming assets, expansion
plans at key properties, financial flexibility to support
further growth and a corporate and property level
management team capable of deriving the potential from
our growing asset base, we are on track in 2002 to exceed
the tremendous results of 2001.
DEAR SHAREHOLDERSWe are pleased to report that 2001 was another record
year financially for Penn National and that we were
successful in our ongoing efforts to further build and
diversify our gaming operations.The acquisition early in
the second quarter of 2001 of Casino Rouge, a riverboat
gaming facility in Baton Rouge, Louisiana, and the man-
agement contract for Casino Rama, a large, successful
gaming facility located approximately 90 miles north
of Toronto, has extended Penn National’s transformation
into a slot-driven regional gaming company from a 100%
pari-mutuel racing operator at the time of our 1994 initial
public offering. Our expansion initiatives of the past several
years positioned us to overcome national and regional
horse racing declines and about 81% of our record 2001
revenues and 85% of our record 2001 EBITDA was
derived from gaming operations, with the balance coming
from racing.
The second half of 2001 highlighted the strength of our
operations and acquisition growth strategy as each of the
four gaming properties or contracts acquired since 2000
generated revenues and EBITDA ahead of the 2000 levels.
We entered 2002 with solid prospects for further growth
from owned and managed assets and continue to seek
acquisition opportunities which meet our financial and
strategic criteria for growth.
2002 PROPERTY EXPANSION In the second quarter of 2002, we will complete the
Casino Magic Bay St. Louis property expansion which
includes a new 300 room hotel adjacent to the casino.
In addition to the hotel, this $37 million project includes
significant improvements to the casino floor and our
entertainment facilities including a variety of restaurants,
a spa and 10,000 square feet of conference space - all the
amenities necessary to make Casino Magic an outstanding
regional overnight destination and one of the most complete
resorts in the region.
THE YEAR IN REVIEW
WITH OUR PORTFOLIO OF DIVERSIFIED GAMINGASSETS, EXPANSION PLANS AT KEY PROPERTIES,FINANCIAL FLEXIBILITY TO SUPPORT FURTHERGROWTH AND A CORPORATE AND PROPERTY
LEVEL MANAGEMENT TEAM CAPABLE OF DERIVINGTHE POTENTIAL FROM OUR GROWING ASSET BASE,WE ARE ON TRACK IN 2002 TO EXCEED THETREMENDOUS RESULTS OF 2001.
Peter M. Carlino
Chairman of the Board & Chief Executive Officer
March 31, 2002
Kevin DeSanctis
President & Chief Operating Officer

BATON ROUGE
there ’s much moreto Baton Rouge than the
state capital – it’s the home
of Casino Rouge, the city’s
premier gaming hot spot.
Nothing is better than being
on a riverboat – especially at
night. And with over 1,000
slot machines and 38 table
games, not to mention live
entertainment and a number
of dining choices, there’s
always something to do!
located in the eastern panhandle near historic harper’s ferry,Charles Town Races is nestled in the quaint town of Charles Town, West
Virginia. But there’s nothing quaint about Charles Town Races – it’s a complete
entertainment complex that offers both coin-in, coin-out and video slots, live
and simulcast horseracing, live entertainment and a variety of dining options.
CHARLES TOWN
6 7
WEST VIRGINIA
LOUISIANA

penn national has twice the excitementin this gulf state!
cas ino mag ic, in bay st. louis ,is the only all-inclusive resort on the Mississippi
Gulf Coast.Along with all the slots, table games,
entertainment and food you’d expect at a Penn
National facility, this property features an 18-hole
Arnold Palmer golf course at the Bridges Golf
Resort, an RV park with all the amenities and
a 200-room hotel. Wait, there’s more – opening
in May 2002 – a brand new hotel tower with
300 additional guest rooms.
situated along mississippi’s historicback bay in Biloxi, Boomtown Casino boasts
a western theme that’s a real crowd pleaser.
Plus, the Family Fun Center features a motion
theater ride and arcade games for the kids.
BAY ST. LOUIS
BILOXI
MISSISSIPPI
8 9

for penn national gaming, pennsylvania represents the roots of the company. And these roots
mean horseracing.
penn national race course, a thoroughbredracetrack in Grantville, has been one of the industry leaders
for nearly thirty years. Penn National features year-round
thoroughbred racing that is simulcast to racetracks around
the country.
fans in wilkes-barre have known the excitementof live harness racing for over thirty-five years – thanks to
The Downs at Pocono.This venerable racetrack features live
racing eight months of the year and simulcast racing year-round.
both racetracks offer simulcast racingfrom thoroughbred and harness venues around the country.
The same simulcast offerings can be found at one of the
eleven off-track wagering facilities found in Allentown,
Carbondale, Chambersburg, East Stroudsburg, Erie, Hazleton,
Johnstown, Lancaster, Reading,Williamsport and York.
ERIE
JOHNSTOWN
CHAMBERSBURGYORK
LANCASTER
READINGGRANTVILLE
WILLIAMSPORT
HAZELTON
WILKES-BARRE
CARBONDALE
E.STROUDSBURG
10 11

boasting the nation’s oldest and fastest daytimehalf-mile harness racetrack, Freehold Raceway has achieved
legendary status among horseplayers over the years. With live
racing ten months of the year, the track also features simulcast
racing from domestic tracks seven days a week, 52 weeks a year.
FREEHOLD
ORILLIA
ONTARIO
in the land of ice and snow lies another hot spot that is managed by Penn National Gaming.
Casino Rama, just north of Toronto, is an entertainment complex beyond
compare.With over 2,100 slot machines, 122 gaming tables, seven restaurants
and a state-of-the-art 5,000 seat Entertainment Centre for concerts, theatrical
productions and sporting events, there’s never a lack of excitement.
13
NEW JERSEY
12

BLACK HAWK
oh, the wild west!
in august 2001, penn national agreed to acquireBullwhackers Casino, the adjoining Bullpen Sports Casino and the Silver
Saloon and Casino.With its prime location near both downtown Denver and
Colorado’s finest ski resorts, its Rocky Mountain locale draws many visitors.
The anticipated closing of this transaction is the second quarter of 2002.
Selected Consolidated Financial and Operating Data 16
18Management’s Discussion and Analysis of Financial Condition and Results of Operations
Consolidated Financial Statements 32
Summary of Significant Accounting Policies 38
Acquisitions 41
Long-Term Debt 43
Commitments and Contingencies 45
Income Taxes 48
Supplemental Disclosures of Cash Flow Information 49
Stock Based Compensation 49
Shareholder Rights Plan 52
Segment Information 53
Summarized Quarterly Data (Unaudited) 54
Pending Acquisition 54
Subsequent Events 55
Report of Independent Certified Public Accountants 55
COLORADO
14 15
17
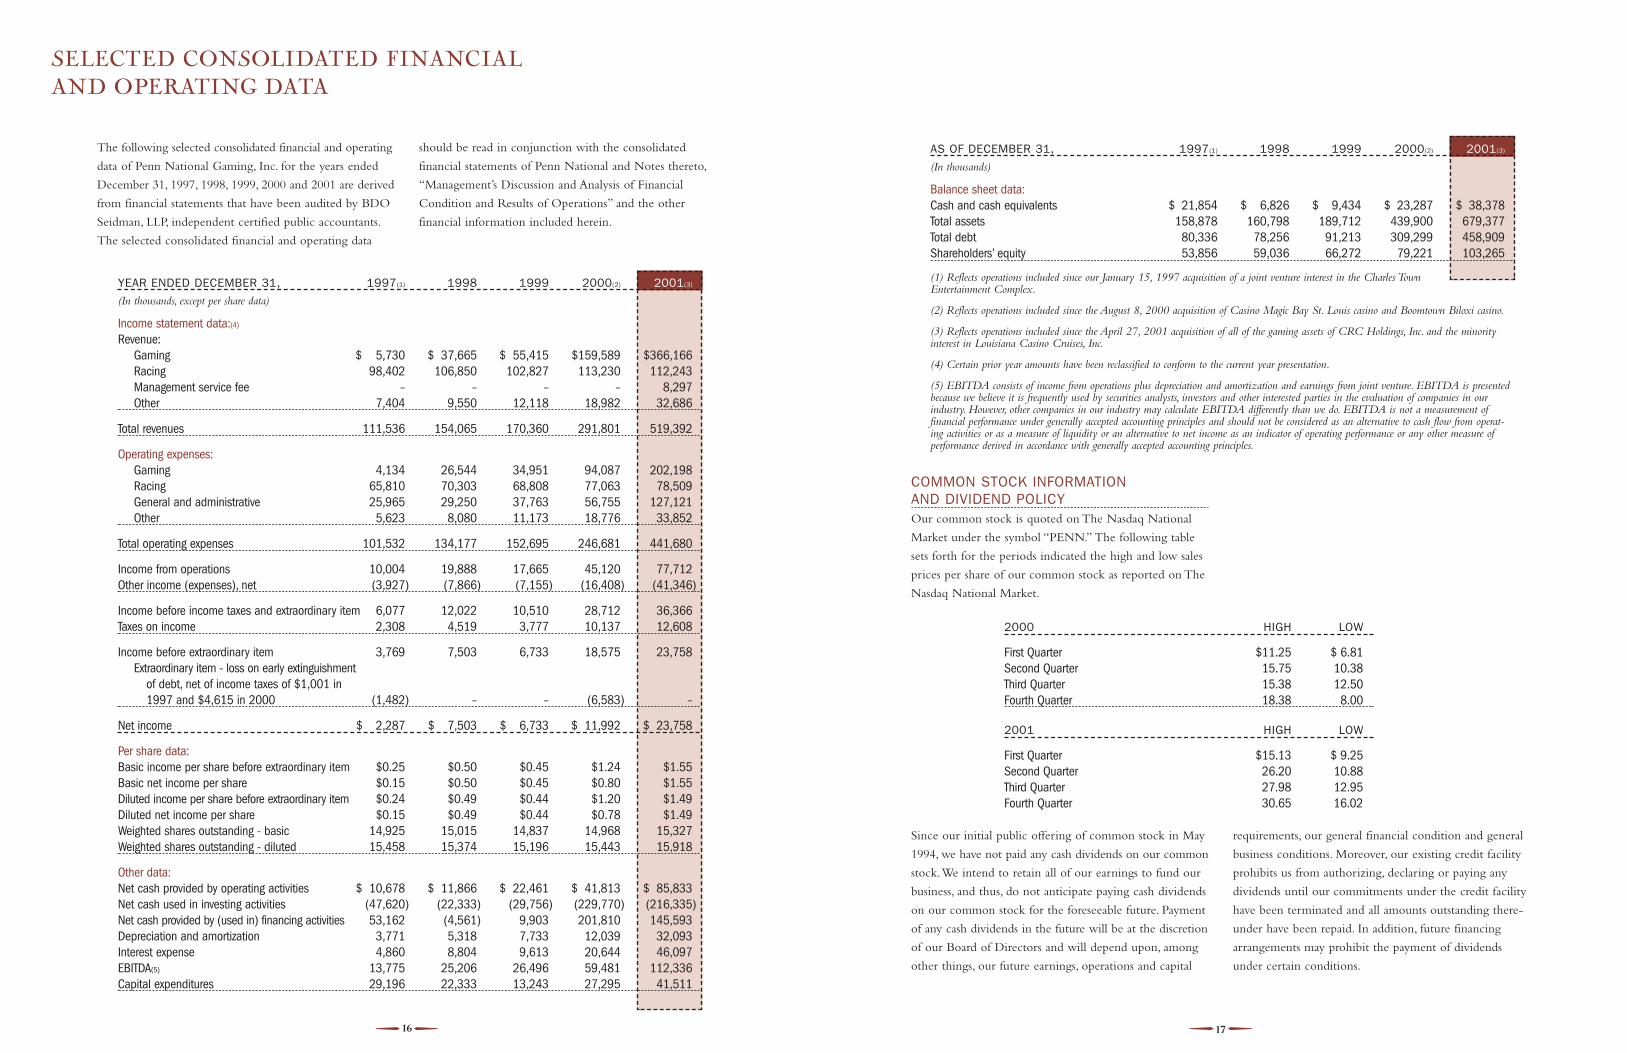
COMMON STOCK INFORMATION AND DIVIDEND POLICYOur common stock is quoted on The Nasdaq National
Market under the symbol “PENN.” The following table
sets forth for the periods indicated the high and low sales
prices per share of our common stock as reported on The
Nasdaq National Market.
Since our initial public offering of common stock in May
1994, we have not paid any cash dividends on our common
stock.We intend to retain all of our earnings to fund our
business, and thus, do not anticipate paying cash dividends
on our common stock for the foreseeable future. Payment
of any cash dividends in the future will be at the discretion
of our Board of Directors and will depend upon, among
other things, our future earnings, operations and capital
requirements, our general financial condition and general
business conditions. Moreover, our existing credit facility
prohibits us from authorizing, declaring or paying any
dividends until our commitments under the credit facility
have been terminated and all amounts outstanding there-
under have been repaid. In addition, future financing
arrangements may prohibit the payment of dividends
under certain conditions.
16
The following selected consolidated financial and operating
data of Penn National Gaming, Inc. for the years ended
December 31, 1997, 1998, 1999, 2000 and 2001 are derived
from financial statements that have been audited by BDO
Seidman, LLP, independent certified public accountants.
The selected consolidated financial and operating data
should be read in conjunction with the consolidated
financial statements of Penn National and Notes thereto,
“Management’s Discussion and Analysis of Financial
Condition and Results of Operations” and the other
financial information included herein.
SELECTED CONSOLIDATED FINANCIAL AND OPERATING DATA
YEAR ENDED DECEMBER 31, 1997(1) 1998 1999 2000(2) 2001(3)
(In thousands, except per share data)
Income statement data:(4)
Revenue:Gaming $ 5,730 $ 37,665 $ 55,415 $159,589 $366,166Racing 98,402 106,850 102,827 113,230 112,243Management service fee – – – – 8,297Other 7,404 9,550 12,118 18,982 32,686
Total revenues 111,536 154,065 170,360 291,801 519,392
Operating expenses:Gaming 4,134 26,544 34,951 94,087 202,198Racing 65,810 70,303 68,808 77,063 78,509General and administrative 25,965 29,250 37,763 56,755 127,121Other 5,623 8,080 11,173 18,776 33,852
Total operating expenses 101,532 134,177 152,695 246,681 441,680
Income from operations 10,004 19,888 17,665 45,120 77,712Other income (expenses), net (3,927) (7,866) (7,155) (16,408) (41,346)
Income before income taxes and extraordinary item 6,077 12,022 10,510 28,712 36,366Taxes on income 2,308 4,519 3,777 10,137 12,608
Income before extraordinary item 3,769 7,503 6,733 18,575 23,758Extraordinary item - loss on early extinguishment
of debt, net of income taxes of $1,001 in 1997 and $4,615 in 2000 (1,482) – – (6,583) –
Net income $ 2,287 $ 7,503 $ 6,733 $ 11,992 $ 23,758
Per share data:Basic income per share before extraordinary item $0.25 $0.50 $0.45 $1.24 $1.55Basic net income per share $0.15 $0.50 $0.45 $0.80 $1.55Diluted income per share before extraordinary item $0.24 $0.49 $0.44 $1.20 $1.49Diluted net income per share $0.15 $0.49 $0.44 $0.78 $1.49Weighted shares outstanding - basic 14,925 15,015 14,837 14,968 15,327Weighted shares outstanding - diluted 15,458 15,374 15,196 15,443 15,918
Other data:Net cash provided by operating activities $ 10,678 $ 11,866 $ 22,461 $ 41,813 $ 85,833Net cash used in investing activities (47,620) (22,333) (29,756) (229,770) (216,335)Net cash provided by (used in) financing activities 53,162 (4,561) 9,903 201,810 145,593Depreciation and amortization 3,771 5,318 7,733 12,039 32,093Interest expense 4,860 8,804 9,613 20,644 46,097EBITDA(5) 13,775 25,206 26,496 59,481 112,336Capital expenditures 29,196 22,333 13,243 27,295 41,511
AS OF DECEMBER 31, 1997(1) 1998 1999 2000(2) 2001(3)
(In thousands)
Balance sheet data:Cash and cash equivalents $ 21,854 $ 6,826 $ 9,434 $ 23,287 $ 38,378Total assets 158,878 160,798 189,712 439,900 679,377Total debt 80,336 78,256 91,213 309,299 458,909Shareholders’ equity 53,856 59,036 66,272 79,221 103,265
(1) Reflects operations included since our January 15, 1997 acquisition of a joint venture interest in the Charles Town Entertainment Complex.
(2) Reflects operations included since the August 8, 2000 acquisition of Casino Magic Bay St. Louis casino and Boomtown Biloxi casino.
(3) Reflects operations included since the April 27, 2001 acquisition of all of the gaming assets of CRC Holdings, Inc. and the minority interest in Louisiana Casino Cruises, Inc.
(4) Certain prior year amounts have been reclassified to conform to the current year presentation.
(5) EBITDA consists of income from operations plus depreciation and amortization and earnings from joint venture. EBITDA is presentedbecause we believe it is frequently used by securities analysts, investors and other interested parties in the evaluation of companies in ourindustry. However, other companies in our industry may calculate EBITDA differently than we do. EBITDA is not a measurement offinancial performance under generally accepted accounting principles and should not be considered as an alternative to cash flow from operat-ing activities or as a measure of liquidity or an alternative to net income as an indicator of operating performance or any other measure ofperformance derived in accordance with generally accepted accounting principles.
2000 HIGH LOW
First Quarter $11.25 $ 6.81Second Quarter 15.75 10.38Third Quarter 15.38 12.50Fourth Quarter 18.38 8.00
2001 HIGH LOW
First Quarter $15.13 $ 9.25Second Quarter 26.20 10.88Third Quarter 27.98 12.95Fourth Quarter 30.65 16.02

1918
MANAGEMENT'S DISCUSSION AND ANALYSIS OF FINANCIAL CONDITION AND RESULTS OF OPERATIONS
OVERVIEWWe derive substantially all of our revenues from gaming
and pari-mutuel operations. Since September 1997,
revenues from our gaming machines at the Charles Town
Entertainment Complex have accounted for an increasingly
large share of our total revenues. Our pari-mutuel revenues
have been derived from wagering on our live races, wagering
on import simulcasts at our racetracks and OTWs and
through telephone account wagering, and fees from
wagering on export simulcasting our races at out-of-state
locations. Our other revenues have been derived from
admissions, program sales, food and beverage sales,
concessions and certain other ancillary activities.
Our acquisitions of Casino Magic Bay St. Louis, Boomtown
Biloxi, Casino Rouge and the management contract for
Casino Rama will continue to impact our revenue mix
between gaming and pari-mutuel revenues on a prospective
basis.We expect that in future periods gaming revenue as
a percentage of our total revenues will continue to increase
as we continue to focus on our gaming operations. For
the years ended December 31, 1999, 2000 and 2001, gaming
revenue represented approximately 32%, 54% and 71% of
our total revenue, respectively.
RECENT AND PENDING ACQUISITIONS
CASINO MAGIC AND BOOMTOWN BILOXI
On August 8, 2000, we completed our acquisition of the
Casino Magic Bay St. Louis casino and the Boomtown
Biloxi casino from Pinnacle Entertainment, Inc. for
approximately $201.3 million in cash, including acquisition
costs of $6.3 million. The purchase price was funded with
a portion of the proceeds from our $350 million senior
secured credit facility.As a result of the refinancing and
repayment of existing debt, we recorded an $11.2 million
pre-tax extraordinary charge, which was included in our
results of operations for the year ended December 31, 2000.
The results of operations for these properties from the
period August 8, 2000 to December 31, 2001 are included
in the results of operations discussed below.
CASINO ROUGE AND CASINO RAMA
On April 27, 2001, we completed our acquisition of Casino
Rouge in Baton Rouge, Louisiana and the management
contract for Casino Rama in Orillia, Ontario, Canada for
approximately $182 million, including the repayment of
existing debt of CRC and its subsidiaries. The purchase
price of the acquisition was funded by the proceeds of our
offering of 11⅛% senior subordinated notes due 2008,
which was completed in March 2001. The results of oper-
ations for these properties for the period April 28, 2001 to
December 31, 2001 are included in the results of operations
discussed below.
BULLWHACKERS CASINO
In August 2001, we signed an agreement to acquire the
operations of Bullwhackers Casino, the adjoining Bullpen
Sports Casino and Silver Hawk Saloon and Casino in
Black Hawk, Colorado for $6.5 million cash.We expect
to close the acquisition in the second quarter of 2002.
CRITICAL ACCOUNTING POLICIESFinancial Reporting Release No. 60, which was recently
released by the Securities and Exchange Commission,
requires all companies to include a discussion of critical
accounting policies or methods used in the preparation
of financial statements. Our significant accounting policies
are described in Note 1 of the Notes to the Consolidated
Financial Statements. The significant accounting policies
that we believe are the most critical to aid in fully under-
standing our reported financial results include the following:
REVENUE RECOGNITION
In accordance with common industry practice, our casino
revenues are the net of gaming wins less losses. Racing
revenues include our share of pari-mutuel wagering on
live races after payment of amounts returned as winning
wagers, and our share of wagering from import and export
simulcasting as well as our share of wagering from our
OTWs.The vast majority of wagers for both businesses
are in the form of cash and we do not grant credit to our
customers to a significant extent. Our receivables consist
principally of amounts due from simulcasting of our races
to other racetracks and their OTWs.We also have receiv-
ables due under our management contract with Casino
Rama for management fees and for expenses, primarily
salaries and wages, payable in accordance with our contract.
Historically, we have not experienced any significant bad
debts from uncollectable receivables.
RECENT ACCOUNTING STANDARDS
In June 2001, the Financial Accounting Standards Board
finalized FASB Statements No. 141,“Business Combinations”
(“SFAS 141”) and No. 142,“Goodwill and Other
Intangibles Assets” (“SFAS 142”). SFAS 141 requires the use
of the purchase method accounting and prohibits the use
of pooling-of-interests method of accounting for business
combinations initiated after June 30, 2001. SFAS 141 also
requires that we recognize acquired intangible assets apart
from goodwill if the acquired intangible assets meet cer-
tain criteria. SFAS 141 applies to all business combinations
initiated after June 30, 2001 and for purchase business
combinations completed on or after July 1, 2001. It also
requires, upon adoption of SFAS 142, that we reclassify
the carrying amounts of intangible assets and goodwill
based on certain criteria in SFAS 141.
SFAS 142 requires, among other things, that companies
no longer amortize goodwill, but instead test goodwill for
impairment at least annually. In addition, SFAS 142 requires
that we identify reporting units for the purpose of assessing
potential future impairments of goodwill, reassess the useful
lives of the other existing recognized intangible assets, and
cease amortization of intangible assets with an indefinite
useful life.Any intangible asset with an indefinite useful
life should be tested for impairment in accordance with
the guidance in SFAS 142. SFAS 142 is required to be
applied in fiscal years beginning after December 15, 2001
to all goodwill and other intangible assets recognized
at that date, regardless of when those assets were initially
recognized. SFAS 142 requires us to complete a transitional
goodwill impairment test six months from the date of
adoption.We are also required to reassess the useful lives
of the other intangible assets within the first interim quarter
after adoption of SFAS 142.
Our previous business combinations were accounted for
using the purchase method.As of December 31, 2001, net
carrying amount of goodwill is $160.2 million and other
intangible assets (management service contract for Casino
Rama) is $24.1 million.Amortization expense for goodwill
and other intangible assets for the year ended December
31, 2001 was $3.5 million and $1.7 million, respectively.
Currently, we are assessing but have not yet determined
how the adoption of SFAS 142 will impact our financial
position and results of operations.
In October 2001, the FASB issued SFAS No. 144,
“Accounting for the Impairment or Disposal of Long-Lived
Assets” (“SFAS 144”).This statement addresses financial
accounting and reporting for the impairment or disposal
of long-lived assets.This statement supersedes SFAS
Statement No. 121,“Accounting for the Impairment
of Long-Lived Assets and for Long-Lived Assets to Be
Disposed Of,” and the accounting and reporting provisions
of APB Opinion No. 30, “Reporting the Results of
Operations-Reporting the Effects of Disposal of a Segment
of a Business, and Extraordinary, Unusual and Infrequently
Occurring Events and Transactions.” This statement also
amends ARB No. 51 “Consolidated Financial Statements,”
to eliminate the exception to consolidation for a subsidiary
for which control is likely to be temporary.This statement
requires that one accounting model be used for long-lived
assets to be disposed of by sale, whether previously held
and used or newly acquired.This statement also broadens
the presentation of discontinued operations to include
more disposal transactions. SFAS 144 is effective for fiscal
years beginning after December 15, 2001 and interim
periods within those fiscal years. Currently, we are assessing
but have not determined how the adoption of SFAS 144
will impact our financial position and results of operations.

2120
CRC properties also accounted for $54.3 million of the
increase. Operating expenses increased at the Charles Town
Entertainment Complex by $48.3 million, or 46.5%, to
$152.2 million in 2001 from $103.9 million in 2000 due
in large part to additional gaming machines in 2001 and
a higher percentage of more expensive coin-out machines
compared to video voucher machines. Operating expenses
at the Pennsylvania racetracks and OTWs increased by $.4
million. Corporate overhead increased by $4.2 million, or
64.6%, to $10.7 million in 2001 from $6.5 million in 2000
primarily due to additional corporate staff needed to support
the recent acquisitions.
EBITDA increased by $52.8 million, or 88.7%, to $112.3
million in 2001 from $59.5 million in 2000. EBITDA
increased at our Mississippi properties by $22.6 million to
$32.2 million in 2001 from $9.6 million in 2000. The CRC
properties accounted for $22.6 million of the increase.
EBITDA at the Charles Town Entertainment Complex
increased by $15.8 million, or 44.5%, to $51.3 million in
2001 from $35.5 million in 2000. The Pennsylvania race-
tracks and OTWs and New Jersey joint venture EBITDA
accounted for a decrease of $3.2 million over last year.
Corporate overhead increased by $3.9 million, or 65.0%,
to $9.9 million in 2001 from $6.0 million in 2000.
Net interest expense increased $24.3 million in 2001 due
primarily to additional borrowings in August 2000 of
approximately $200.0 million to finance the Mississippi
acquisitions and $200.0 million in April 2001 to finance
the CRC acquisition.
CHARLES TOWN ENTERTAINMENT COMPLEX
Total revenues for the year ended December 31, 2001
increased by $58.3 million, or 43.1%, to $193.6 million
in 2001 from $135.3 million in 2000. Gaming revenues
increased by $55.7 million, or 51.0%, to $165.0 million
in 2001 from $109.3 million in 2000, primarily due to
expansion of the gaming floor, which was completed in
December 2000.As a result of the expansion, we added
500 reel-spinning, coin-out gaming machines, bringing
the total average number of machines to approximately
2,000 for the year 2001, compared to approximately 1,500
gaming machines for the year 2000. These additional
gaming machines, and the continued shift in machine mix
to a higher percentage of reel-spinning, coin-out machines,
resulted in an increase in average win per machine of $224
for the year ended December 31, 2001 compared to $199
for the year ended December 31, 2000. Racing revenues
increased by $1.8 million, or 8.9%, to $22.1 million in 2001
from $20.3 million in 2000. This increase was primarily
due to 25 additional racing days and an increase in export
wagering by $43.1 million, or 28.2%, to $196.2 million as
a result of additional racing days and overall larger per day
wagering averages. Other revenue increased by $.8 million,
or 14.0%, to $6.5 million in 2001 from $5.7 million in
2000 primarily as a result of higher food and beverage
revenues from opening of the Sundance Café in November
2000, and expansion of the concession areas, dining room
and the buffet.
Total operating expenses for the year ended December 31,
2001 increased $48.3 million, or 46.5%, to $152.2 million
in 2001 from $103.9 million in 2000. The increase was
primarily due to an increase in gaming and racing related
taxes of $32.5 million attributable to increased gaming
and racing revenues and a change in gaming legislation
that resulted in higher gaming taxes and a higher net
administrative fee paid to the State of West Virginia. Salaries
and wages increased by $5.2 million primarily due to
additional staffing associated with increased gaming units,
gaming square footage, and expanded concession and dining
facilities. Total marketing expenses increased $1.9 million
in 2001 as a result of additional media advertising and
promotional campaigns to increase awareness of the facility.
Other expenses increased due to an increase in property
insurance premiums and operating costs associated with
the expanded capacity of the facility. Depreciation and
amortization increased by $4.8 million as a result of higher
capital expenditures in 2001. EBITDA for the year ended
December 31, 2001 increased by $15.8 million, or 44.5%,
to $51.3 million in 2001 from $35.5 million in 2000.
MISSISSIPPI CASINOS
Operating results in 2000 for Casino Magic Bay St. Louis
and Boomtown Biloxi only include the period from
August 8, 2000 through December 31, 2000. For the year
ended December 31, 2001, Casino Magic Bay St. Louis
YEAR ENDED DECEMBER 31, 2001 COMPARED TO YEAR ENDED DECEMBER 31, 2000Revenues for the year ended December 31, 2001 increased
by $227.6 million, or 78.0%, to $519.4 million in 2001
from $291.8 million in 2000. Revenues increased at our
Mississippi properties by $101.9 million to $158.1 million
in 2001 from $56.2 million in 2000 (which represented
revenues from the August 8, 2000 acquisition date through
December 31, 2000). The CRC properties, which were
acquired on April 27, 2001, accounted for $70.3 million
of the increase. Revenues also increased at the Charles Town
Entertainment Complex by $58.3 million, or 43.1%, to
$193.6 million in 2001 from $135.3 million in 2000 as
a result of an increase in the number of gaming machines
from 1,500 to 2,000 in 2001 and a higher percentage in
2001 of coin-out machines compared to video voucher
machines. Revenues from the Pennsylvania racetracks and
OTWs decreased by approximately $3.2 million due to
a Commonwealth of Pennsylvania racing subsidy of $1.6
million received in 2000 but not in 2001 and a decrease
in wagering.
Operating expenses for the year ended December 31, 2001
increased by $195.0 million, or 79.0%, to $441.7 million
in 2001 from $246.7 million in 2000. Operating expenses
increased at our Mississippi properties by $87.9 million to
$138.4 million in 2001 from $50.5 million in 2000. The
REVENUES EBITDA(1)
1999 2000 2001 1999 2000 2001
Charles Town Entertainment Complex $ 80,015 $135,290 $193,612 $16,023 $35,469 $ 51,252Casino Magic-Bay St. Louis(2) – 31,571 87,752 – 6,092 18,658Boomtown Biloxi(2) – 24,634 70,370 – 3,460 13,546Casino Rouge(3) – – 61,981 – – 15,444Casino Rama Management Contract(3) – – 8,297 – – 7,632Penn National Race Course and its OTWs 55,609 64,364 59,821 9,065 10,380 7,582Pocono Downs and its OTWs 36,324 37,573 38,945 8,955 7,791 7,127New Jersey Joint Venture – – – 1,098 2,322 2,531Corporate eliminations(4) (1,588) (1,631) (1,386) – – –Corporate overhead – – – (5,361) (6,033) (9,946)Corporate overhead CRC Holdings(3) – – – – – (490)
Total before non-recurring charges 170,360 291,801 519,392 29,780 59,481 113,336Non-recurring charges and expenses – – – (3,284) – (1,000)
Total $170,360 $291,801 $519,392 $26,496 $59,481 $112,336
(1) EBITDA consists of income from operations plus depreciation and amortization and earnings from joint venture. EBITDA is presented because we believe it is frequently used by securities analysts, investors and other interested parties in the evaluation of companies in our industry. However, other companies in our industry may calculate EBITDA differently than we do. EBITDA is not a measurement of financial performance under generally accepted accounting principles and should not be considered as an alternative to cash flow from operating activities or as a measure of liquidity or an alternative to net income as an indicator of operating performance, or any other measure of performance derived in accordance with generally accepted accounting principles.
(2) Reflects results since the August 8, 2000 acquisition from Pinnacle Entertainment.
(3) Reflects results since April 27, 2001 acquisition of CRC Holdings, Inc., including corporate overhead at CRC’s executive office in Miami, Florida.
(4) Primarily reflects intracompany transactions related to import/export simulcasting.
RESULTS OF OPERATIONSThe results of operations by property level for the years
ended December 31, 1999, 2000 and 2001 are summarized
below (in thousands):

had revenues of $87.8 million consisting mainly of gaming
revenue. Operating expenses for Casino Magic totaled
$76.5 million consisting of gaming ($44.0 million), other
($6.7 million), general and administrative ($18.4 million),
and depreciation and amortization expense ($7.4 million).
For the year ended December 31, 2001, Boomtown
Biloxi had revenues of $70.4 million consisting mainly
of gaming revenue. Operating expenses for Boomtown
totaled $61.8 million consisting of gaming ($28.9 million),
other ($8.8 million), general and administrative ($19.1
million), and depreciation and amortization expense ($5.0
million). EBITDA for the Mississippi casinos totaled $32.2
million for the period. Our Mississippi casino operations
have numerous competitors, many of which have greater
name recognition and financial and marketing resources
than we do. Competition in the Mississippi gaming markets
is significantly more intense than the competition that our
gaming operations face in West Virginia or our pari-mutuel
operations face in Pennsylvania and New Jersey.
CASINO ROUGE AND CASINO RAMA
The CRC acquisition was completed on April 27, 2001
and includes the purchase of Casino Rouge in Baton Rouge,
Louisiana, and a management contract to operate Casino
Rama in Orillia, Canada. For the period from April 28,
2001 to December 31, 2001, Casino Rouge had revenues
of $62.0 million consisting mainly of gaming revenues.
Operating expenses for Casino Rouge totaled $51.3 million
consisting of gaming ($29.4 million), other ($3.4 million),
general and administrative ($13.8 million) and depreciation
and amortization expense ($4.7 million). For the period
from April 28, 2001 to December 31, 2001, management
fees from the Casino Rama management contract totaled
$8.3 million for which there was $.7 million of direct
operating expenses relating to the associated revenues and
amortization of $1.7 million related to the management
services contract. EBITDA for Casino Rouge and Casino
Rama totaled $22.6 million for the same period.
PENN NATIONAL RACE COURSE AND ITS OTW FACILITIES
Revenues for the year ended December 31, 2001 decreased
by $4.6 million, or 7.1%, to $59.8 million in 2001 from
$64.4 million in 2000. Live racing revenue accounted for
$1.4 million of the decrease as a result of a decline in
attendance, inclement weather and smaller fields in the
first five months of 2001. Full card simulcasting accounted
for $2.0 million of the $4.6 million decline, again due to
lower attendance in 2001. Other racing revenue declined
by $1.0 million in 2001 compared to 2000 as a result of
a Commonwealth of Pennsylvania racing subsidy received
in 2000 but not in 2001.Although the Commonwealth
passed a similar subsidy measure in 2001, subsidy payments
by the Commonwealth were frozen and were not received.
Operating expenses for the year ended December 31, 2001
decreased by $1.8 million, or 3.2%, to $55.7 million in 2001
from $55.8 million in 2000. Racing-related expenses such
as purses, simulcast fees and pari-mutuel taxes declined by
$1.6 million, in part due to lower racing revenues. EBITDA
for the year ended December 31, 2001 decreased by $2.8
million, or 26.9%, to $7.6 million in 2001 from $10.4
million in 2000.
POCONO DOWNS AND ITS OTW FACILITIES
Revenues for the year ended December 31, 2001 increased
by $1.3 million, or 3.4%, to $38.9 million in 2001 from
$37.6 million in 2000. Revenues increased approximately
$2.3 million due to the opening of a new OTW facility
in East Stroudsburg, Pennsylvania, that was in operation
for all of 2001 compared to five months in 2000. This
increase was offset by a decline of $.6 million as a result
of a Commonwealth of Pennsylvania racing subsidy
received in 2000 but not in 2001, and a net decline in
revenues at the other Pocono Downs OTWs.
Operating expenses for the year ended December 31, 2001
increased by $2.3 million, or 7.2%, to $34.2 million in 2001
from $31.9 million in 2000. Other operating expenses,
administrative expense and concessions expenses increased
$.9 million to $11.6 million compared to $10.7 million
for the same period the previous year due to a full year of
operations at the East Stroudsburg OTW. Racing-related
expenses, such as purses, simulcast fees and pari-mutuel
taxes, increased $1.0 million, in part due to higher racing
revenues. For the year ended December 31, 2001 EBITDA
decreased by $.7 million to $7.1 million in 2001 from
$7.8 million in 2000.
CORPORATE OVERHEAD EXPENSES
Corporate overhead expenses increased by $4.2 million, or
64.6%, to $10.7 million in 2001 from $6.5 million in 2000.
Salaries and wages, payroll taxes, employee benefits, reloca-
tion expenses and office rent increased by $2.0 million due
to the addition of new staff at the corporate office to support
the Mississippi and CRC acquisitions. Liability insurance
increased by $.5 million due to increased limits for general
liability, fiduciary and directors and officers liability insurance
and increased insurance rates as a result of market conditions.
Consulting and professional services increased by $1.0
million due to acquisition-related activities and regulatory
expenses. Travel expenses increased by $.4 million as
a result of supporting properties in Mississippi, Louisiana
and Canada.
NEW JERSEY JOINT VENTURE
We have an investment in Pennwood Racing, Inc., which
operates Freehold Raceway in New Jersey and, until May
2001, operated Garden State Park. In May 2001, Garden
State Park was sold and the joint venture ceased operating
Garden State Park. Our 50% share of net income was $2.5
million in 2001 compared to $2.3 million in 2000 and
was recorded as other income on the income statement.
The increase in the joint venture’s net income is due in
part to impairment expenses recorded in December 2000
related to the then-proposed May 2001 closure of Garden
State Park and decreased interest expense in 2001, offset
by the decrease in operating income in 2001 as a result
of the closure of Garden State Park.
NON-RECURRING CHARGES AND EXPENSES
Non-recurring charges and expenses for the year ended
December 31, 2001 were $1.0 million as a result of the
settlement of the Showboat litigation.
YEAR ENDED DECEMBER 31, 2000COMPARED TO YEAR ENDED DECEMBER 31, 1999Revenues for the year ended December 31, 2000 increased
71.2% or $121.4 million to $291.8 million, from $170.4
for the year ended December 31, 1999. Operating expenses
increased 61.6%, or $94.6 million, to $248.2 million in 2000,
from $153.6 million in 1999. The increases in revenues and
operating expenses were primarily a result of the Casino
Magic and Boomtown Biloxi acquisition in August 2000,
the change to more reel-spinning, coin-out gaming machines
at the Charles Town Entertainment Complex and the
addition of 500 new machines at Charles Town.As a result,
income from operations increased 160.5%, or $26.8 million,
to $43.5 million in 2000 from $16.7 million in 1999.
Total other expense increased 138.7%, or $8.6 million,
to $14.8 million in 2000 from $6.2 million in 1999.
Net interest expenses increased $9.9 million in 2000 due
to additional borrowings of $200 million to finance the
Mississippi acquisition. Earnings from the New Jersey
joint venture increased by $1.2 million compared to 1999.
Taxes on income increased by 168.4%, or $6.4 million, due
to the factors discussed above. Income before extraordinary
item was $18.6 million in 2000 compared to net income
of $6.7 million in 1999. In 2000, we incurred an extraor-
dinary charge net of taxes of $6.6 million for the early
extinguishment of debt; after giving effect to this change,
our net income was $12.0 million for the year ended
December 31, 2000.
CHARLES TOWN ENTERTAINMENT COMPLEX
Revenues increased at Charles Town by approximately
$55.3 million, or 69.1%, to $135.3 million in 2000 from
$80.0 million in 1999. Gaming revenue increased by
$53.9 million, or 97.3%, to $109.3 million in 2000 from
$55.4 million in 1999 due to the addition of 136 new video
lottery machines in mid-1999, 565 new reel-spinning,
coin-out gaming machines in late 1999 and 452 gaming
machines in the OK Corral slots center, which opened on
November 25, 2000. The average number of machines in
play increased to 1,494 in 2000 from 923 in 1999 and the
average win per machine increased to $199 in 2000 from
$163 in 1999. Racing revenue increased by $1.0 million,
or 5.2%, to $20.3 million in 2000 from $19.3 million in
1999. This increase is due primarily to a change in the
schedule from a Wednesday afternoon race program to a
Thursday evening race program in 2000 to accommodate
export simulcasting. Charles Town began exporting its live
race program to tracks across the country on June 5, 1999
2322

25
executed in January 2000 accounted for most of the
increase in expenses. EBITDA decreased $1.2 million, or
13.3%, to $7.8 million in 2000 from $9.0 million in 1999.
CORPORATE OVERHEAD EXPENSES
Corporate overhead expenses increased by $0.7 million, or
13.2%, to $6.0 million in 2000 from $5.3 million in 1999.
Salaries and wages, payroll taxes, and benefits increased by
$0.7 million due to new positions created for business
development, employee training, and marketing. Expenses
also increased for SEC and annual reporting ($73,000),
office space ($30,000) and corporate travel for acquisitions
and Mississippi operations ($246,000).These increases were
partially offset by a decrease in outside services, professional
fees and consulting fees in the amount of $0.4 million.
NEW JERSEY JOINT VENTURE
We completed our investment in Pennwood Racing, Inc.,
the New Jersey joint venture, on July 29, 1999. Pennwood
Racing operates Freehold Raceway and Garden State Park.
Revenues of the joint venture increased to $61.5 million
in 2000 from $28.0 million in 1999 as a result of the
operating results in 2000 reflecting a full twelve-month
period. Net income was $5.6 million in 2000, before non-
recurring charges of $1.0 million relating to the termination
of the Garden State lease, compared to $2.2 million in 1999.
Our 50% share of net income was $2.3 million, after a
non-recurring charge of $0.5 million, in 2000 compared
to $1.1 million in 1999.
NON-RECURRING CHARGES AND EXPENSES
Non-recurring charges and expenses totaled $3.3 million
for the year ended December 31, 1999. In connection
with our gaming operations in West Virginia, we recorded
litigation expense of $1.5 million for liquidated damages
awarded to Amtote International, Inc. in a wagering services
contract dispute. In Tennessee, the Tennessee Supreme
Court declined to review the substantive issue of whether
pari-mutuel wagering on horse racing is lawful under the
existing statute without the Tennessee Racing Commission.
As a result of this decision we recorded a charge against
earnings of $0.5 million for costs incurred for our Tennessee
racing license. In Pennsylvania, we incurred expenses totaling
$1.3 million as a result of the Horsemen’s action that closed
Penn National Race Course and its OTWs from February
16 to March 24, 1999 and resulted in the loss of 46 race
days in 1999.
LIQUIDITY AND CAPITAL RESOURCESHistorically, our primary sources of liquidity and capital
resources have been cash flow from operations, borrowings
from banks and proceeds from the issuance of debt and
equity securities.
Net cash provided by operating activities was $85.8 million
for the year ended December 31, 2001. This consisted
of net income ($24.4 million), adjusted for non-cash
reconciling items ($36.8 million) and net increases in cur-
rent liability accounts along with net decreases in current
asset accounts ($24.6 million), net of assets and liabilities
acquired in the CRC acquisition. Net income, non-cash
items and the net change in the balance sheet accounts
increased by $12.4 million, $12.3 million and $19.1 mil-
lion, respectively, in 2001 as compared to 2000.
Cash flows used in investing activities totaled $216.3 million
for the year ended December 31, 2001. Expenditures for
property, plant, and equipment totaled $41.5 million and
included renovations of the buffet restaurant and new hotel
construction at Casino Magic Bay St. Louis ($18.0 million),
new gaming equipment at Casino Magic ($1.6 million),
new gaming equipment and slot system at Boomtown
Biloxi ($2.4 million), land and building acquisitions at the
Charles Town Entertainment Complex ($1.0 million),
the OK Corral slot center at Charles Town ($0.6 million),
property additions at Charles Town ($0.3 million), con-
struction of parking garage and expansion at Charles Town
($3.2 million), construction and design of a steak house at
Casino Rouge ($1.6 million), other small projects ($1.3
million) and maintenance capital expenditures at our
properties ($11.5 million). The CRC acquisition totaled
$182.7 million. Cash received from the New Jersey joint
venture totaled $2.9 million. Cash in escrow decreased
by $4.6 million as a result of the closing of the CRC
acquisition on April 27, 2001.
24
and generated export simulcasting revenues of $2.2 million
in 2000 compared to $1.0 million in 1999. Operating
expenses increased by $36.5 million, or 54.2%, to $103.9
million in 2000 from $67.4 million in 1999. The increase
was primarily due to an increase in gaming expenses of
$30.1 million, or 86.0%, to $65.1 million in 2000 from
$35.0 million in 1999. This increase was mainly due to
increased lottery taxes, purses, salaries and wages and
administrative expenses related to the increase in gaming
revenues. Racing, other and general and administrative
expenses increased by $4.1 million, or 13.4%, to $34.7
million in 2000 from $30.6 million in 1999. The increase
was due to an increase in direct costs associated with
additional wagering on horse racing and gaming machine
play, the addition of gaming machines and floor space (new
temporary facility for gaming machines and the opening
of the OK Corral slot center), export simulcast expenses
and expanded concession and dining capability and capacity.
Depreciation expense increased by $2.3 million, or 127.8%,
to $4.1 million in 2000 from $1.8 million in 1999 due to
additional gaming machines and improvements in 2000.
EBITDA attributable to Charles Town increased by $19.5
million, or 121.9%, to $35.5 million in 2000 from $16.0
million in 1999.
MISSISSIPPI CASINOS
The Casino Magic Bay St Louis and Boomtown Biloxi
acquisitions were completed on August 8, 2000. For the
period August 8 to December 31, 2000, Casino Magic
Bay St. Louis had revenues of $31.6 million consisting
mainly of gaming revenue. Operating expenses for Casino
Magic totaled $27.8 million consisting of gaming ($18.0
million), other ($2.5 million), general and administrative
($5.0 million), and depreciation and amortization expense
($2.3 million). For the period August 8 to December 31,
2000 Boomtown Biloxi had revenues of $24.6 million
consisting mainly of gaming revenue. Operating expenses
for Boomtown totaled $22.7 million consisting of gaming
($11.0 million), other ($3.2 million), general and adminis-
trative ($7.0 million), and depreciation and amortization
expense ($1.5 million). EBITDA for the Mississippi casinos
totaled $9.6 million for the period. Our Mississippi casino
operations have numerous competitors, many of which
have greater name recognition and financial and marketing
resources than we do. Competition in the Mississippi gaming
markets is significantly more intense than the competition
that our gaming operations face in West Virginia or our
pari-mutuel operations face in Pennsylvania and New Jersey.
PENN NATIONAL RACE COURSE AND ITS OTW FACILITIES
Penn National Race Course had an increase in revenue of
approximately $8.8 million, or 15.8%, to $64.4 million in
2000 from $55.6 million in 1999. Pari-mutuel wagering
was $386.6 million in 2000 compared to $333.8 million
in 1999. The increase in wagering and revenues is attrib-
uted to Penn National Race Course running 201 live race
days in 2000 compared to 153 live races days in 1999.
Penn National only ran 153 live race days in 1999 due to
the Horsemen action in the first quarter that resulted in
the closure of all of the facilities from February 16 to
March 24, 1999. Operating expenses increased by approxi-
mately $6.2 million, or 12.5%, to $55.8 million in 2000
from $49.6 million in 1999. The increase was primarily
due to an increase in racing expenses of $5.6 million, or
16.0%, to $40.5 million in 2000 from $34.9 million in
1999. This increase was due to the temporary closure of
Penn National Race Course and its OTWs in 1999 and
a limited live race schedule during a portion of 1999 due
to the Horsemen action described above.Adjusting for the
Horsemen action in 1999, EBITDA attributable to these
properties increased by $1.3 million, or 14.3%, to $10.4
million in 2000 from $9.1 million in 1999.
POCONO DOWNS AND ITS OTW FACILITIES
Revenues at Pocono Downs increased by $1.3 million,
or 3.6%, to $37.6 million in 2000 from $36.3 million in
1999. Pari-mutuel wagering was $161.6 million in 2000
compared to $160.2 million in 1999. Operating expenses
increased by approximately $2.4 million, or 8.1%, to $31.9
million in 2000 from $29.5 million in 1999. The increase
was primarily due to an increase in racing expenses of
$2.0 million, or 9.9%, to $22.3 million in 2000 from $20.3
million in 1999. The opening of the new OTW facility in
East Stroudsburg, Pennsylvania, and the increase in purse
expense per the terms of the new Horsemen’s contract

2726
Cash flows from financing activities provided net cash flow
of $145.6 million for the year ended December 31, 2001.
Aggregate proceeds from the issuance of notes were $200.0
million, a portion of which were used to pay financing
costs associated with the issuance ($6.9 million). Principal
payments on long-term debt under our existing credit
facility, net of additional borrowings on the revolving line
of credit, were $50.4 million. Proceeds from the exercise
of stock options totaled $2.9 million.
CAPITAL EXPENDITURES
The following table summarizes our planned capital
expenditures, other than maintenance capital expenditures,
by property level for fiscal years ended December 31, 2002
and 2003:
YEAR ENDING DECEMBER 31, 2002 2003
(in thousands)
PropertyCharles Town Entertainment Complex $41,400 $10,000Casino Magic Bay St. Louis 20,700 -Boomtown Biloxi - 4,500Bullwhackers Casino(1) 9,000 -
Totals $71,100 $14,500
(1) Pending acquisition.
Beginning in late 2001 and continuing through the end
of 2002, we expect to expend significant amounts on
capital expenditures at the Charles Town Entertainment
Complex and Casino Magic Bay St. Louis.At Charles
Town, we expect to spend an additional $41.4 million in
2002 on capital expenditures that were begun in 2001.
Specifically, we expect to complete construction of a
structured parking facility, at an estimated additional cost
of $10.2 million in 2002, and expand the gaming and
entertainment facility at Charles Town, at an estimated
cost of $31.2 million in 2002, which includes the purchase
of 500 additional gaming machines. In 2003, we expect
to expend approximately $10.0 million to purchase and
install an additional 1,000 machines at Charles Town. On
February 28, 2002, the West Virginia Lottery Commission
approved our request to add up to 1,500 additional gaming
machines to the 2,000 machines already in place at Charles
Town. Depending on future market conditions in the West
Virginia gaming market, we will continue to evaluate our
plans to build a 300-room hotel at Charles Town.
At Casino Magic, we have begun construction of a 300-
room hotel with meeting and conference facilities, three
new restaurant venues, renovations to the existing buffet
restaurant and certain amenities to the gaming floor.
Through December 31, 2001, we spent approximately
$18.0 million on these projects. In 2002, we expect to spend
an additional $20.7 million to complete these projects.
In January 2002, we signed an option to purchase approx-
imately 4 acres of land adjacent to our Boomtown Biloxi
property for $4.0 million. The purchase is contingent upon
receiving certain governmental and third-party consents,
authorizations, approvals and licenses which we expect could
occur in 2003. If successful, we expect to use the land for
additional parking for our Boomtown facility. In addition,
we expect to make certain property improvements in 2003
at Boomtown at a cost of approximately $0.5 million.
On August 30, 2001, we entered into a definitive agreement
to acquire all of the assets of the Bullwhackers Casino
operations, in Black Hawk, Colorado, from Colorado
Gaming and Entertainment Co., a subsidiary of Hilton
Group plc, for $6.5 million in cash. The Bullwhackers assets
consist of the Bullwhackers Casino, the adjoining Bullpen
Sports Casino, the Silver Hawk Saloon and Casino, an
administrative building and a 475-car parking area, all
located in Black Hawk, Colorado. The Bullwhackers
properties comprise a total of 63,800 square feet of
interior space, 20,700 square feet of which is devoted
to gaming, consisting of 1,002 slot machines and 16 table
games. The properties are located on leased land as well
as 3.25 acres of land included in the acquisition, much of
which is utilized for parking.We currently expect that the
transaction will close in the second quarter of 2002.As of
December 31, 2001, we had made a deposit of $500,000
under the terms of the agreement. In the year 2002, we
expect to spend $9.0 million for the acquisition, closing
costs and improvements to the Bullwhackers Casino.
For 2002 and 2003, we expect to expend approximately
between $14.0 million and $16.0 million each year for
maintenance capital expenditures at our properties.
We expect to use cash generated from operations and cash
available under the revolver portion of our existing senior
secured credit facility to fund our anticipated capital
expenditure and maintenance capital expenditures in 2002
and 2003. See “Outlook” below.
SENIOR SECURED CREDIT FACILITY
On August 8, 2000, we entered into a $350 million senior
secured credit facility with a syndicate of lenders led by
Lehman Brothers Inc. and CIBC World Markets Corp. that
replaced our then-existing credit facilities. The credit facility
is comprised of a $75 million revolving credit facility
maturing on August 8, 2005, a $75 million Tranche A term
loan maturing on August 8, 2005 and a $200 million
Tranche B term loan maturing on August 8, 2006. Up to
$10 million of the revolving credit facility may be used
for the issuance of standby letters of credit, of which there
was $2.6 million outstanding as of December 31, 2001. In
addition, up to $10 million of the revolving credit facility
also may be used for short-term credit to be provided to us
on a same-day basis, which must be repaid within five days.
At our option, the revolving credit facility and the Tranche
A term loan may bear interest at (1) the highest of ½ of
1% in excess of the federal funds effective rate or the rate
that the bank group announces from time to time as its
prime lending rate plus an applicable margin of up to 2.25%,
or (2) a rate tied to a eurodollar rate plus an applicable
margin up to 3.25%, in either case with the applicable
rate based on our total leverage.At our option, the
Tranche B term loan may bear interest at (1) the highest
of ½ of 1% in excess of the federal funds effective rate or
the rate that the bank group announces from time to time
as its prime lending rate plus an applicable margin of up
to 3.25%, or (2) a rate tied to a eurodollar rate plus an
applicable margin up to 4.00%, in either case with the
applicable rate based on our total leverage. The eurodollar
rate is defined as the rate that appears on page 3750 of the
Dow Jones Telerate Screen as of 11:00 a.m. London time
two days before the applicable funding date (adjusted for
statutory reserve requirements for eurocurrency liabilities)
at which eurodollar deposits for one, two, three or six
months, as selected by us, are offered in the interbank
eurodollar market.At December 31, 2001, the weighted
average loan rate for the Tranche A and Tranche B loans
was 8.4%. In addition, as of December 22, 2000, we entered
into a $100.0 million interest rate swap contract obligating
us to pay a fixed rate of 5.825% against a variable interest
rate based on the 90-day LIBOR rate, which expires on
December 22, 2003. On August 3, 2001, we entered into
a $36.0 million interest rate swap contract obligating us
to pay a fixed rate of 4.8125% against a variable interest
rate based on the 90-day LIBOR rate, which expires on
June 30, 2004.
As of December 31, 2001, $61.9 million was outstanding
on the Tranche A term loan, $197.0 million was outstand-
ing on the Tranche B term loan and there was no outstanding
balance under the revolving credit portion of the facility.
Proceeds from the credit facility to date have been used to
finance the acquisition of the Mississippi properties, to
replace our existing term loan and revolving credit facilities,
to complete a tender offer for our 1997 senior notes and
for working capital purposes.
11 1/8% SENIOR SUBORDINATED NOTES DUE 2008
On March 12, 2001, we completed a private offering of
$200,000,000 of our 11⅛% senior subordinated notes due
2008. The net proceeds of the 11⅛% notes were used, in
part, to finance our acquisition of Casino Rouge and the
management contract at Casino Rama, including the
repayment of certain existing indebtedness at CRC.
Interest on the 11⅛% notes is payable on March 1 and
September 1 of each year. The 11⅛% notes mature on
March 1, 2008.As of February 28, 2002, all of the principal
amount of the 11⅛% notes are outstanding.
We may redeem all or part of the 11⅛% notes on or after
March 1, 2005 at certain specified redemption prices.
Prior to March 1, 2004, we may redeem up to 35% of
the 11⅛% notes from proceeds of certain sales of our
equity securities. The 11⅛% notes also are subject to
redemption requirements imposed by state and local
gaming laws and regulations.
The 11⅛% notes are general unsecured obligations and are
guaranteed on a senior subordinated basis by certain of
our current and future wholly-owned domestic subsidiaries.

28
The 11⅛% notes rank equally with our future senior
subordinated debt and junior to our senior debt, including
debt under our senior credit facility. In addition, the 11⅛%
notes will be effectively junior to any indebtedness of our
non-U.S. or unrestricted subsidiaries, none of which have
guaranteed the 11⅛% notes.
The 11⅛% notes and guarantees were originally issued in
a private placement pursuant to an exemption from the
registration requirements of the Securities Act of 1933.
On July 30, 2001, we completed an offer to exchange the
11⅛% notes and guarantees for 11⅛% notes and guarantees
registered under the Securities Act having substantially
identical terms.
RECENT FINANCING TRANSACTIONSEQUITY OFFERING
On February 20, 2002, we completed a public offering of
4,600,000 shares of our common stock at a public offering
price of $30.50 per share. Of the common shares sold
in the offering, 3,350,000 shares were sold by us and
1,250,000 shares were sold by The Carlino Family Trust,
a related party.We have used the net proceeds from the
offering, totaling approximately $96.1 million after deducting
underwriting discounts and related expenses, to repay term
loan indebtedness under the existing senior secured credit
facility.We did not receive any proceeds from the offering
by The Carlino Family Trust.
8 7/8% SENIOR SUBORDINATED NOTES DUE 2010On February 28, 2002, we completed a public offering of$175,000,000 of our 8⅞% senior subordinated notes due2010. Interest on the 8⅞% notes is payable on March 15and September 15 of each year, beginning September 15,2002. The 8⅞% notes mature on March 15, 2010.As ofFebruary 28, 2002, all of the principal amount of the 8⅞% notes is outstanding.We have used the net proceedsfrom the offering, totaling approximately $170.1 millionafter deducting underwriting discounts and relatedexpenses, to repay term loan indebtedness under the existing senior secured credit facility.
We may redeem all or part of the 8⅞% notes on or afterMarch 15, 2006 at certain specified redemption prices.Prior to March 15, 2005, we may redeem up to 35% ofthe 8⅞% notes from proceeds of certain sales of our equitysecurities. The 8⅞% notes also are subject to redemptionrequirements imposed by state and local gaming laws andregulations.
The 8⅞% notes are general unsecured obligations and areguaranteed on a senior subordinated basis by certain ofour current and future wholly-owned domestic subsidiaries.The 8⅞% notes rank equally with our future senior sub-ordinated debt, including the 11⅛% senior subordinatednotes, and junior to our senior debt, including debt underour senior credit facility. In addition, the 8⅞% notes willbe effectively junior to any indebtedness of our non-U.S.or unrestricted subsidiaries, none of which have guaranteedthe 8⅞% notes.
Although we repaid the term indebtedness under theexisting senior secured credit facility, we did not cancelthe related interest rate swap agreements.We continue tomaintain these agreements.The changes in the fair valuesof the interest rate swaps as well as the amortization of theamounts recorded in other comprehensive income will berecognized as components of interest expense subsequentto the payoff of the floating rate debt.
COMMITMENTS AND CONTINGENCIES
CONTRACTUAL CASH OBLIGATIONSAs discussed above, in February 2002 we completed publicofferings of common stock and 8⅞% senior subordinatednotes and used the proceeds of those offerings to repaythe outstanding term loan indebtedness under the seniorsecured credit facility.As of March 8, 2002, there was noindebtedness outstanding under the credit facility and therewas approximately $71.0 million available for borrowingunder the revolving credit portion of the credit facility.The following table reflects these recent offerings and the repayment of the senior secured credit facility as ofMarch 8, 2002.
OTHER COMMERCIAL COMMITMENTSThe following table presents our material commercialcommitments as of March 8, 2002 for the followingfuture periods:
29
PAYMENTS DUE BY PERIOD
2003- 2005- 2007 TOTAL 2002 2004 2006 & AFTER
(In thousands)
Senior secured credit facility(1) $ – $ – $ – $ – $ –11 1/8% senior subordinated notes due 2008(2)
Principal 200,000 – – – 200,000Interest 159,458 22,250 44,500 44,500 48,208
8 7/8% senior subordinated notes due 2010(3)
Principal 175,000 – – – 175,000Interest 124,248 7,766 31,063 31,063 54,356
Operating leases 11,929 3,530 5,474 1,978 947Bullwhackers Casino purchase agreement 6,500 6,500 – – –
Total $677,135 $40,046 $81,037 $77,541 $478,511
(1) Subsequent to December 31, 2001, we completed public offerings of common stock and 8 7/8% senior subordinated notes and used theproceeds of those offerings to repay the outstanding term loan indebtedness under the credit facility.As of March 8, 2002, there was noindebtedness outstanding under the credit facility and there was approximately $71.0 million available for borrowing under the revolvingcredit portion of the credit facility.
(2) The $200.0 million aggregate principal amount of 11 1/8% notes matures on March 1, 2008. Interest payments of approximately$11.1 million are due on each March 1 and September 1 until March 1, 2008.
(3) The $175.0 million aggregate principal amount of 8 7/8% notes matures on March 15, 2010. Interest payments of approximately$7.8 million are due on each March 15 and September 15 until March 15, 2010.
AMOUNT OF COMMITMENTEXPIRATION PER PERIOD
TOTAL AMOUNTS 2003- 2005- 2007 COMMITTED 2002 2004 2006 & AFTER
(In thousands)
Revolving Credit Facility(1) $70,600 $ - $ - $70,600 $ -Letters of Credit(1) 4,400 4,400 - - -Guarantees of New Jersey Joint
Venture Obligations(2) 10,400 767 9,633 - -
Total $85,400 $5,167 $9,633 $70,600 $ -
(1) The available balance under the revolving portion of the $75.0 senior secured credit facility is diminished by outstanding letters of credit.
(2) In connection with our 50% ownership interest in Pennwood Racing, our joint venture in New Jersey, we have entered into a debt service maintenance agreement with Pennwood’s lender to guarantee up to 50% of Pennwood’s $23.0 million term loan. Our obligation as of March 8, 2002 under this guarantee is approximately $10.4 million.

30
LITIGATION
On August 20, 2001, Showboat Development Company
brought a lawsuit against us and certain other parties
related to the Charles Town Entertainment Complex.
The suit alleges, among other things, that our operation
of coin-out video lottery terminals at the Charles Town
facility constitutes the operation of a casino, thereby trig-
gering Showboat’s option to manage the casino. The suit
also alleges that our March 2000 acquisition of the 11%
minority interest in Charles Town Races from BDC Group,
our former joint venture partner, was made in violation
of a right of first refusal that Showboat holds from BDC
covering the sale of any interest in any casino at Charles
Town Races.We filed in federal district court in Nevada
a motion to dismiss this action for lack of personal
jurisdiction and, in the alternative, a motion to transfer
the case to the state of West Virginia. On January 25, 2002,
the district court granted our motion to dismiss. On
February 13, 2002, Showboat filed a lawsuit in the
United States District Court for the Eastern District of
Pennsylvania.The substance of the lawsuit was substantially
similar to Showboat’s previous claim filed in Nevada.
On March 28, 2002, Penn National and Showboat agreed
to settle all litigation related to this matter. Under the
settlement, we agreed to make a one-time payment of
$1.0 million to Showboat, which was recognized in
general and administrative expenses in our operating
results for the fourth quarter of 2001.
In July 2001, a lawsuit was filed against us by certain
surveillance employees at the Charles Town facility claiming
that our surveillance of those employees during working
hours was improper. The lawsuit claims damages of $7.0
million and punitive damages of $15.0 million.We currently
are conducting discovery in the case but, at this time, believe
that all of the claims of the employees are without merit.
On February 12, 2002, we filed a motion for summary
judgment that is pending before the court.We intend to
vigorously defend ourselves against this action and do not
believe that this action will have a material adverse effect
on our financial condition or results of operations.
In January 2002, an employee at our Charles Town facility
initiated a suit against us alleging invasion of privacy. The
employee claims in the suit that she was subjected to an
involuntary strip search by other Charles Town employees
as part of a theft investigation and is seeking punitive
damages. The lawsuit claims damages of $0.5 million and
punitive damages of $3.5 million.We believe we have
meritorious defenses and intend to vigorously defend
ourselves against this suit.
We also are parties to certain other litigation but do not
believe it will have a material adverse effect on our financial
condition or results of operations if any of these legal pro-
ceedings were adversely adjudicated or settled. Furthermore,
the nature of our business subjects us to the risk of lawsuits
filed by customers and others in the ordinary course. In
general, litigation can be expensive and time consuming
to defend and could result in settlements or damages that
could significantly impact results of operations or financial
condition.
INTEREST RATE SWAP AGREEMENTS
We currently use interest rate swaps to assist in managing
interest incurred on our long-term debt. The difference
between amounts received and amounts paid under such
agreements, as well as any costs or fees, is recorded as
a reduction of, or addition to, interest expense as incurred
over the life of the swap or similar financial instrument.
On December 20, 2000, we entered into a forward interest
rate swap with a notional amount of $100 million, which
has an effective date of December 22, 2000 and a termi-
nation date of December 22, 2003. Under this agreement,
31
we pay a fixed rate of 5.835% against a variable interest
rate based on the 90-day LIBOR rate. On August 3, 2001,
we entered into a forward interest rate swap with a notional
amount of $36 million, which has an effective date of
August 7, 2001 and a termination date of June 30, 2004.
Under this agreement, we pay a fixed rate of 4.8125%
against a variable interest rate based on the 90-day LIBOR
rate.At December 31, 2001, the 90-day LIBOR rate was
1.92%.We entered into these interest rate swap agreements
to reduce the impact of future variable interest payments
related to our senior secured credit facility.We account for
the interest rate swap agreements as cash flow hedges. The
changes in the fair values of the interest rate swaps are
recorded as adjustments to accrued interest in the accom-
panying consolidated balance sheet with the offset recorded
in accumulated other comprehensive loss, which as of
December 31, 2001 amounted to $3.8 million, net of an
income tax benefit of $2.0 million.Any hedge ineffectiveness
was not material for the year ended December 31, 2001.
Amounts recorded in accumulated other comprehensive
income will be amortized as an adjustment to interest
expense over the term of the related derivative.We estimate
$1.8 million of net derivative losses included in other
comprehensive income will be reclassified into interest
expense within the next twelve months.
The interest rate swap agreements hedge a portion of our
exposure on our outstanding floating rate obligations, which
were $258.9 million at December 31, 2001. For the year
ended December 31, 2001, we increased interest expense
by approximately $1.7 million as a result of the interest
rate swap agreements.We are exposed to credit loss in the
event of nonperformance by our counter parties to the
interest rate swap agreements.We do not anticipate non-
performance by these financial institutions, and no material
loss would be expected from the nonperformance of these
financial institutions.
Although we repaid the term indebtedness under the
existing senior secured credit facility, we did not cancel
the related interest rate swap agreements.We continue to
maintain these agreements.The changes in the fair values
of the interest rate swaps as well as the amortization of the
amounts recorded in other comprehensive income will be
recognized as components of interest expense subsequent
to the payoff of the floating rate debt.
OUTLOOKBased on our current level of operations, and anticipated
revenue growth, we believe that cash generated from
operations and amounts available under our credit facility
will be adequate to meet our anticipated debt service
requirements, capital expenditures and working capital
needs for the foreseeable future.We cannot assure you,
however, that our business will generate sufficient cash
flow from operations, that our anticipated revenue growth
will be realized, or that future borrowings will be available
under our credit facility or otherwise will be available to
enable us to service our indebtedness, including the credit
facility and the notes, to retire or redeem the notes when
required or to make anticipated capital expenditures. In
addition, if we consummate significant acquisitions in the
future, our cash requirements may increase significantly.
We may need to refinance all or a portion of our debt on
or before maturity. Our future operating performance and
our ability to service or refinance our debt will be subject
to future economic conditions and to financial, business
and other factors, many of which are beyond our control.
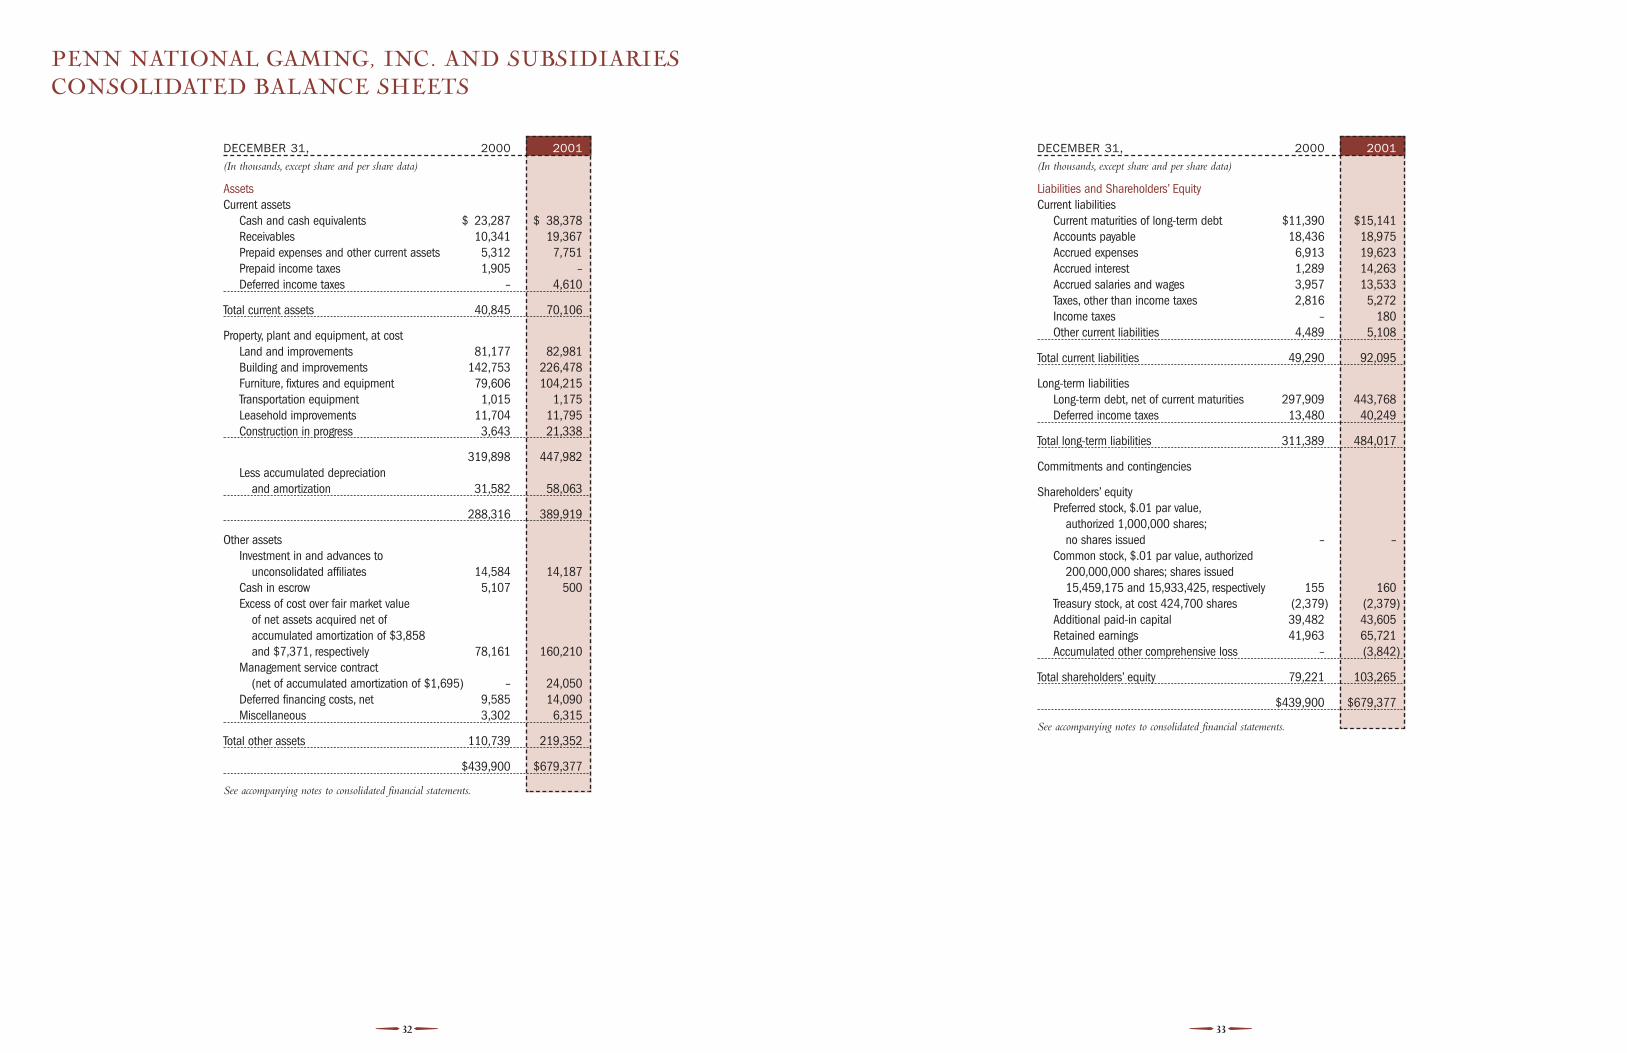
3332
PENN NATIONAL GAMING, INC. AND SUBSIDIARIESCONSOLIDATED BALANCE SHEETS
DECEMBER 31, 2000 2001
(In thousands, except share and per share data)
AssetsCurrent assets
Cash and cash equivalents $ 23,287 $ 38,378Receivables 10,341 19,367Prepaid expenses and other current assets 5,312 7,751Prepaid income taxes 1,905 –Deferred income taxes – 4,610
Total current assets 40,845 70,106
Property, plant and equipment, at costLand and improvements 81,177 82,981Building and improvements 142,753 226,478Furniture, fixtures and equipment 79,606 104,215Transportation equipment 1,015 1,175Leasehold improvements 11,704 11,795Construction in progress 3,643 21,338
319,898 447,982Less accumulated depreciation
and amortization 31,582 58,063
288,316 389,919
Other assetsInvestment in and advances to
unconsolidated affiliates 14,584 14,187Cash in escrow 5,107 500Excess of cost over fair market value
of net assets acquired net of accumulated amortization of $3,858 and $7,371, respectively 78,161 160,210
Management service contract (net of accumulated amortization of $1,695) – 24,050
Deferred financing costs, net 9,585 14,090Miscellaneous 3,302 6,315
Total other assets 110,739 219,352
$439,900 $679,377
See accompanying notes to consolidated financial statements.
DECEMBER 31, 2000 2001
(In thousands, except share and per share data)
Liabilities and Shareholders’ EquityCurrent liabilities
Current maturities of long-term debt $11,390 $15,141Accounts payable 18,436 18,975Accrued expenses 6,913 19,623Accrued interest 1,289 14,263Accrued salaries and wages 3,957 13,533Taxes, other than income taxes 2,816 5,272Income taxes – 180Other current liabilities 4,489 5,108
Total current liabilities 49,290 92,095
Long-term liabilitiesLong-term debt, net of current maturities 297,909 443,768Deferred income taxes 13,480 40,249
Total long-term liabilities 311,389 484,017
Commitments and contingencies
Shareholders’ equityPreferred stock, $.01 par value,
authorized 1,000,000 shares; no shares issued – –
Common stock, $.01 par value, authorized 200,000,000 shares; shares issued 15,459,175 and 15,933,425, respectively 155 160
Treasury stock, at cost 424,700 shares (2,379) (2,379)Additional paid-in capital 39,482 43,605Retained earnings 41,963 65,721Accumulated other comprehensive loss – (3,842)
Total shareholders’ equity 79,221 103,265
$439,900 $679,377
See accompanying notes to consolidated financial statements.

3534
PENN NATIONAL GAMING, INC. AND SUBSIDIARIESCONSOLIDATED STATEMENTS OF INCOME
YEAR ENDED DECEMBER 31, 1999 2000 2001
(In thousands, except per share data)
RevenuesGaming $ 55,415 $159,589 $366,166Racing 102,827 113,230 112,243Management service fee – – 8,297Other revenue 12,118 18,982 32,686
Total revenues 170,360 291,801 519,392
Operating expensesGaming 34,951 94,087 202,198Racing 68,808 77,063 78,509Other 11,173 18,776 33,852General and administrative 30,030 44,716 95,028Depreciation and amortization 7,733 12,039 32,093
Total operating expenses $152,695 $246,681 $441,680
Income from operations 17,665 45,120 77,712
Other income (expense)Interest expense (9,613) (20,644) (46,097)Interest income 1,368 1,875 3,016Earnings from joint venture 1,098 2,322 2,531Other (8) 39 (796)
Total other expense (7,155) (16,408) (41,346)
Income before income taxes and extraordinary item 10,510 28,712 36,366Taxes on income 3,777 10,137 12,608
Income before extraordinary item 6,733 18,575 23,758Extraordinary item, loss on early extinguishment
of debt, net of income taxes of $4,615 – (6,583) –
Net income $ 6,733 $ 11,992 $ 23,758
Per share dataBasicIncome before extraordinary item $.45 $1.24 $1.55Extraordinary item – (.44) –
Net income $.45 $.80 $1.55
DilutedIncome before extraordinary item $.44 $1.20 $1.49Extraordinary item – (.42) –
Net income $.44 $ .78 $1.49
Weighted shares outstandingBasic 14,837 14,968 15,327Diluted 15,196 15,443 15,918
See accompanying notes to consolidated financial statements.
ACCUMULATEDOTHER
ADDITIONAL COMPRE- COMPRE-COMMON STOCK TREASURY PAID-IN RETAINED HENSIVE HENSIVE
SHARES AMOUNT STOCK CAPITAL EARNINGS LOSS TOTAL INCOME
(In thousands, except share data)
Balance, December 31, 1998 15,164,080 $152 $(2,379) $38,025 $23,238 $ – $ 59,036 $ –Exercise of stock options and warrants 150,095 1 – 502 – – 503 –Net income for the year – – – – 6,733 – 6,733 –
Balance, December 31, 1999 15,314,175 153 (2,379) 38,527 29,971 – 66,272 –Exercise of stock options including
tax benefit of $265 145,000 2 – 955 – – 957 –Net income for the year – – – – 11,992 – 11,992 –
Balance, December 31, 2000 15,459,175 155 (2,379) 39,482 41,963 – 79,221 –Exercise of stock options including
tax benefit of $1,196 474,250 5 – 4,123 – – 4,128 –Fair market value of swap agreement,
net of income tax benefit of $2,043 – – – – – (3,794) (3,794) (3,794)Foreign currency translation adjustment – – – – – (48) (48) (48)Net income for the year – – – – 23,758 – 23,758 23,758
Balance, December 31, 2001 15,933,425 $160 $(2,379) $43,605 $65,721 $(3,842) $103,265 $19,916
See accompanying notes to consolidated financial statements.
PENN NATIONAL GAMING, INC. AND SUBSIDIARIESCONSOLIDATED STATEMENTS OF SHAREHOLDERS’ EQUITY AND COMPREHENSIVE INCOME

3736
PENN NATIONAL GAMING, INC. AND SUBSIDIARIESCONSOLIDATED STATEMENTS OF CASH FLOWS
YEAR ENDED DECEMBER 31, 1999 2000 2001
(In thousands)
Cash flows from operating activitiesNet income $ 6,733 $11,992 $23,758Adjustments to reconcile net income
to net cash provided by operating activitiesDepreciation and amortization 7,733 12,039 32,093Amortization of deferred financing costs
charged to interest expense 946 1,555 2,444Loss on sale of fixed assets – – 809Earnings from joint venture (1,098) (2,322) (2,531)Extraordinary loss on early extinguishment
of debt, before income tax benefit – 11,198 –Deferred income taxes 910 3,278 6,959Tax benefit from stock options exercised – 265 1,196Decrease (increase), net of businesses acquired, in
Receivables (939) (5,562) 2,226Prepaid expenses and other current assets 338 (3,663) (546)Prepaid income taxes (229) (817) 1,905Miscellaneous other assets (202) (2,025) (1,149)
Increase (decrease), net of businesses acquired, inAccounts payable 3,993 8,226 (2,473)Accrued expenses 1,744 2,385 (4,663)Accrued interest (35) 856 12,974Accrued salaries and wages 346 2,859 9,576Taxes, other than income taxes 988 1,325 2,456Income taxes payable – – 180Other current liabilities 1,233 224 619
Net cash provided by operating activities 22,461 41,813 85,833
See accompanying notes to consolidated financial statements.
YEAR ENDED DECEMBER 31, 1999 2000 2001
(In thousands)
Cash flows from investing activitiesExpenditures for property, plant and equipment (13,243) (27,295) (41,511)Proceeds from sale of property and equipment – 151 299(Investment in and advances to) and
distributions from joint venture (11,764) 511 2,928Acquisition of businesses, net of cash acquired 251 (203,030) (182,658)(Increase) decrease in cash in escrow (5,000) (107) 4,607
Net cash used in investing activities (29,756) (229,770) (216,335)
Cash flows from financing activitiesProceeds from exercise of options and warrants 503 692 2,932Proceeds from long-term debt 24,350 323,395 211,000Principal payments on long-term debt (11,393) (105,185) (61,389)Increase in unamortized financing cost (3,557) (10,407) (6,950)Payment of tender fees on senior notes – (6,685) -
Net cash provided by financing activities 9,903 201,810 145,593
Net increase in cash and cash equivalents 2,608 13,853 15,091Cash and cash equivalents at beginning of year 6,826 9,434 23,287
Cash and cash equivalents at end of year $ 9,434 $ 23,287 $ 38,378
See accompanying notes to consolidated financial statements.

39
NET INCOME PER COMMON SHAREBasic net income per share includes no dilution and is
calculated by dividing net income by the weighted average
number of common shares outstanding for the period.
Dilutive net income per share reflects the potential dilution
of net income per share that could result upon the exercise
of outstanding stock options to purchase the Company’s
common stock (using the treasury stock method).
Shares of common stock from dilutive stock options included
in the denomination for the calculation of diluted earnings
per share were 359,000, 475,000 and 591,000 shares at
December 1999, 2000 and 2001, respectively.
Options to purchase 590,000, 590,500 and 68,000 shares
of common stock, with average exercise prices per share
of $16.74, $17.14 and $19.61 were outstanding at
December 31, 1999, 2000 and 2001, respectively.These
options were not included in the computations of diluted
earnings per common share for the respective years because
the exercise prices of the options were greater than the
average market prices of the common stock during the
respective periods.These options expire at various times
between October 2002 and January 2011.
DEFERRED FINANCING COSTSDeferred financing costs that are incurred by the Company
in connection with the issuance of debt are deferred and
amortized to interest expense over the life of the underlying
indebtedness using the interest method adjusted to reflect
any early repayments.
CONCENTRATION OF CREDIT RISKFinancial instruments that potentially subject the
Company to credit risk consist of cash equivalents
and accounts receivable.
The Company’s policy is to limit the amount of credit
exposure to any one financial institution and place
investments with financial institutions evaluated as being
creditworthy, or in short-term money market and tax-free
bond funds which are exposed to minimal interest rate
and credit risk.At December 31, 2001, and during the year
then ended the Company had bank deposits and overnight
repurchase agreements which, at times, exceeded federally
insured limits.
Concentration of credit risk, with respect to receivables,
is limited through the Company’s credit evaluation
process. The Company does not require collateral on its
receivables. The Company’s receivables consist principally
of amounts due from other racetracks and their OTWs
and $9.3 million due from Casino Rama for management
service fees of $1.1 million and reimbursement of $8.2
million of expenses to be paid on behalf of Casino Rama
as of December 31, 2001. The payable on behalf of Casino
Rama is included in accrued salaries and wages in the
accompanying consolidated balance sheet as of December 31,
2001. Historically, the Company has not incurred any
significant credit-related losses.
FAIR VALUE OF FINANCIAL INSTRUMENTSThe following methods and assumptions are used to estimate
the fair value of each class of financial instruments for
which it is practical to estimate:
Cash and Cash Equivalents:The carrying amount
approximates the fair value due to the short maturity
of the cash equivalents.
Long-term Debt: The fair value of the Company’s
long-term debt is estimated based on the quoted
market prices for the same or similar issues or on the
current rates offered to the Company for debt of the
same remaining maturities. The carrying amount
approximates fair value since the Company’s interest
rates approximate current interest rates.
USE OF ESTIMATESThe preparation of financial statements in conformity
with generally accepted accounting principles requires
management to make estimates and assumptions that
affect the reported amounts of assets and liabilities and
disclosure of contingent assets and liabilities at the date
of the financial statements, and the reported amounts of
revenue and expenses for the reporting periods.Actual
results could differ from those estimates.
38
1. SUMMARY OF SIGNIFICANT ACCOUNTING POLICIES
BUSINESSPenn National Gaming, Inc. (the “Company”) owns and
operates the Charles Town Entertainment Complex in
Charles Town,West Virginia, which features gaming
machines and live thoroughbred racing; two Mississippi
casinos: the Casino Magic Bay St. Louis casino, hotel, golf
resort and marina in Bay St. Louis, and the Boomtown
Biloxi casino in Biloxi; Louisiana Casino Cruises, Inc.
(“LCCI”) which owns and operates the Casino Rouge,
a riverboat gaming facility in Baton Rouge, Louisiana;
CRC Holdings, Inc. (“CRC”) which has a management
contract for the operation of Casino Rama, a casino located
approximately ninety miles north of Toronto, Canada on
the Chippewas of Mnjikaning First Nation land and two
racetracks and eleven off-track wagering (OTW) facilities
located in Pennsylvania. The Company also owns a 50%
interest in Pennwood Racing, Inc., a joint venture that
operates Freehold Raceway in New Jersey.
BASIS OF PRESENTATIONThe consolidated financial statements include the accounts
of the Company and its wholly owned subsidiaries.All
significant intercompany accounts and transactions have
been eliminated in consolidation.
REVENUESIn accordance with common industry practice, casino
revenues are the net of gaming wins less losses. Revenues
exclude the retail value of complimentary rooms, food
and beverage furnished gratuitously to customers. The
estimated cost of providing these promotional allowances
(which are netted against gross revenue) during the years
ended December 31, 2000 and 2001 was $8,806,000 and
$24,579,000, respectively. These complimentary items
were not significant to the Company’s total revenues
prior to 2000 when the Company operated primarily
as a pari-mutuel company.
Racing revenues include the Company’s share of pari-mutuel
wagering on live races after payment of amounts returned
as winning wagers, and the Company’s share of wagering
from import and export simulcasting, as well as its share
of wagering from its OTWs.
MANAGEMENT SERVICE FEERevenues from the management service contract for
Casino Rama (see Note 2) are based upon contracted
terms and are recognized when the services are performed.
DEPRECIATION AND AMORTIZATIONDepreciation of property, plant and equipment and amor-
tization of leasehold improvements are computed by the
straight-line method at rates adequate to allocate the cost
of applicable assets over their estimated useful lives ranging
from three to forty years. The excess of cost over fair
value of net assets acquired is being amortized on the
straight-line method over forty years.
Amortization of the management service contract for
Casino Rama is computed by the straight-line method
through July, 2011, the expiration date of the agreement.
The Company reviews the carrying values of its long-lived
and identifiable intangible assets for possible impairment
whenever events or changes in circumstances indicate that
the carrying amount of the assets may not be recoverable
based on undiscounted estimated future operating
cash flows.As of December 31, 2001, the Company
has determined that no impairment has occurred.
INCOME TAXESThe Company recognizes deferred tax assets and liabilities
for the expected future tax consequences of events that have
been recognized in the Company’s financial statements
or tax returns. Under this method, deferred tax assets and
liabilities are determined based on the difference between
the financial statement carrying amounts and the tax bases
of assets and liabilities using enacted tax rates in effect in
the years in which the differences are expected to reverse.
CASH AND CASH EQUIVALENTSThe Company considers all cash balances and highly liquid
investments with original maturities of three months or
less to be cash equivalents.

41
2. ACQUISITIONS
40
INTEREST RATE SWAPSThe Company has a policy aimed at managing interest
rate risk associated with its current and anticipated future
borrowings. This policy enables the Company to use any
combination of interest rate swaps, futures, options, caps
and similar instruments. To the extent the Company
employs such financial instruments pursuant to this policy,
they are accounted for as hedging instruments. In order to
qualify for hedge accounting, the underlying hedged item
must expose the Company to risks associated with market
fluctuations and the financial instrument used must be
designated as a hedge and must reduce the Company’s
exposure to the market in fluctuations throughout the hedge
period. If these criteria are not met, a change in the market
value of the financial instrument is recognized as a gain or
loss in the period of change. Otherwise, gains and losses
are not recognized except to the extent that the financial
instrument is disposed of prior to maturity. Net interest
paid or received pursuant to the financial instrument is
included as interest expense in the period.
Financial Accounting Standards Board (“FASB”) Statement
No. 133 (SFAS 133),“Accounting for Derivative Instruments
and Hedging Activities,” and Statement No. 138 (SFAS
138),“Accounting for Derivative Instruments and Hedging
Activities - an amendment of SFAS 133,” were effective for
fiscal years beginning after June 15, 2000 - fiscal year 2001
for the Company.The Company has conducted evaluations
of hedging policies and strategies for existing and anticipated
future derivative transactions.Adoption of these statements
as of January 1, 2001 did not have a significant effect on
the Company’s financial statements. Recognition of deriv-
ative assets or liabilities on the balance sheet with market
value adjustments recognized in other comprehensive
income was not material as of January 1, 2001.
RECENT ACCOUNTING STANDARDSIn June 2001, the Financial Accounting Standards Board
finalized FASB Statements No. 141, Business Combinations
(SFAS 141) and No. 142, Goodwill and Other Intangibles
Assets (SFAS 142). SFAS 141 requires the use of the purchase
method accounting and prohibits the use of pooling-of-
interests method of accounting for business combinations
initiated after June 30, 2001. SFAS 141 also requires that
the Company recognize acquired intangible assets apart
from goodwill if the acquired intangible assets meet certain
criteria. SFAS 141 applies to all business combinations
initiated after June 30, 2001 and for purchase business
combinations completed on or after July 1, 2001. It also
requires, upon adoption of SFAS 142 that the Company
reclassify the carrying amounts of intangible assets and
goodwill based on certain criteria in SFAS 141.
SFAS 142 requires, among other things, that companies
no longer amortize goodwill, but instead test goodwill for
impairment at least annually. In addition, SFAS 142 requires
that the Company identify reporting units for the purpose
of assessing potential future impairments of goodwill,
reassess the useful lives of the other existing recognized
intangible assets, and cease amortization of intangible assets
with an indefinite useful life.Any intangible asset with an
indefinite useful life should be tested for impairment in
accordance with the guidance in SFAS 142. SFAS 142
is required to be applied in fiscal years beginning after
December 15, 2001 to all goodwill and other intangible
assets recognized at that date, regardless of when those
assets were initially recognized. SFAS 142 requires the
Company to complete a transitional goodwill impairment
test six months from the date of adoption. The Company
is also required to reassess the useful lives of the other
intangible assets within the first interim quarter after
adoption of SFAS 142.
The Company’s previous business combinations were
accounted for using the purchase method. As of
December 31, 2001, net carrying amount of goodwill is
$160.2 million and other intangible assets (management
service contract for Casino Rama) is $24.1 million.
Amortization expense or goodwill and other intangible
assets for the year ended December 31, 2001 was $3.5
million and $1.7 million, respectively. Currently, the
Company is assessing but has not yet determined how
the adoption of SFAS 142 will impact its financial
position and results of operations.
In October 2001, the FASB issued SFAS No. 144,
“Accounting for the Impairment or Disposal of Long-
Lived Assets” (“SFAS 144”). This statement addresses
financial accounting and reporting for the impairment
or disposal of long-lived assets. This statement supersedes
SFAS Statement No. 121,“Accounting for the Impairment
of Long-Lived Assets and for Long-Lived Assets to Be
Disposed Of,” and the accounting and reporting provisions
of APB Opinion No. 30, “Reporting the Results of
Operations-Reporting the Effects of Disposal of a Segment
of a Business, and Extraordinary, Unusual and Infrequently
Occurring Events and Transactions.”This statement also
amends ARB No. 51 “Consolidated Financial Statements,”
to eliminate the exception to consolidation for a subsidiary
for which control is likely to be temporary. This statement
requires that one accounting model be used for long-lived
assets to be disposed of by sale, whether previously held
and used or newly acquired. This statement also broadens
the presentation of discontinued operations to include more
disposal transactions. SFAS 144 is effective for fiscal years
beginning after December 15, 2001 and interim periods
within those fiscal years. Currently, the Company is assessing
but has not determined how the adoption of SFAS 144
will impact its financial position and results of operations.
RECLASSIFICATIONCertain prior years amounts have been reclassified to
conform to the current year presentation.
CRCOn April 27, 2001, the Company completed its acquisitions
of (i) CRC Holdings, Inc. (“CRC”) from the shareholders
of CRC and (ii) the minority interest in Louisiana Casino
Cruises, Inc. (“LCCI”) not owned by CRC from certain
shareholders (together, the “CRC Acquisition”).The CRC
Acquisition was accomplished pursuant to the terms of
Agreement and Plan of Merger among CRC Holdings, Inc.,
Penn National Gaming, Inc., Casino Holdings, Inc. and
certain shareholders of CRC Holdings, Inc., dated as of
July 31, 2000 (the “Merger Agreement”), and a Stock
Purchase Agreement by and among Penn National Gaming,
Inc. and certain shareholders of LCCI, dated as of July 31,
2000. Under the Merger Agreement, CRC merged with
Casino Holdings, Inc., a wholly owned subsidiary of the
Company (the “Merger”). The aggregate consideration
paid by the Company for the CRC Acquisition was
approximately $182 million, including the repayment of
existing debt of CRC and its subsidiaries. The purchase
price of the CRC Acquisition was funded by the proceeds
of the Company’s offering of senior subordinated notes,
which was completed in March 2001.
The assets acquired pursuant to the Merger and CRC
Acquisition consist primarily of the Casino Rouge
riverboat gaming facility in Baton Rouge, Louisiana,
and a management contract for Casino Rama, a gaming
facility located in Orillia, Canada.
The management service contract expires July 31, 2011.
CHC Casinos Canada Limited (“CHC”), a wholly owned
subsidiary of the Company, operates Casino Rama in the
province of Ontario. The Company derives all of its man-
agement service fee revenue from this agreement.As of the
date of the acquisition, the fair value of the management
service contract was $25.7 million.

43
SENIOR SECURED CREDIT FACILITYOn August 8, 2000, the Company entered into a $350
million senior secured credit facility with Lehman Brothers,
Inc. and CIBC World Markets Corp. as co-arrangers, among
others. The proceeds of the credit facility were used to
finance the Mississippi Acquisitions, to pay off the Company’s
existing long-term debt and for working capital purposes.
The credit facility provides for a $75 million revolving
credit facility maturing on August 8, 2005, a $75 million
Tranche A term loan maturing on August 8, 2005
and a $200 million Tranche B term loan maturing on
August 8, 2006.The Company is required to repay the
principal balance of the debt based upon a payment as
stipulated in the loan agreement.
At the Company’s option, the revolving credit facility and
the Tranche A term loan may bear interest at (1) the highest
of 1/2 of 1% in excess of the federal funds effective rate
or the rate that the bank group announces from time to
time as its prime lending rate plus an applicable margin of
up to 2.25%, or (2) a rate tied to a eurodollar rate plus an
applicable margin up to 3.25%.At the Company’s option,
the Tranche B term loan may bear interest at (1) the highest
of 1/2 of 1% in excess of the federal funds effective rate
or the rate that the bank group announces from time to
time as its prime lending rate plus an applicable margin
of up to 3.25%, or (2) a rate tied to a eurodollar rate plus
an applicable margin up to 4.00%.
The credit facility provides for certain covenants, including
those of a financial nature. Substantially all of the Company’s
assets are pledged as collateral under the credit agreement.
The weighted average effective interest rate at
December 31, 2001 was 8.40%.
The outstanding amounts under the credit facility
as of December 31, 2001 (in thousands) are as follows:
2001
Revolving credit facility $ - Tranche A 61,875Tranche B 197,000
Total $258,875
As a result of the refinancing, the Company charged to
operations deferred financing costs of $4.5 million related
to the repayment of existing outstanding debt. In addition,
the Company paid a tender premium of $6.7 million. The
total, $11.2 million, has been reflected as an extraordinary
item, net of an income tax benefit of $4.6 million in the
Long-term debt is as follows:
3. LONG-TERM DEBT
42
YEAR ENDED DECEMBER 31, 2000 2001
(In thousands, except per share data)
Revenues $493,776 $555,366
Income before extraordinary item $21,617 $26,956Extraordinary item, net of income tax benefit (6,583) –
Net income $15,034 $26,956
Net income per common shareBasic $1.00 $1.76Diluted $ .97 $1.69
Weighted shares outstandingBasic 14,968 15,327Diluted 15,443 15,918
DECEMBER 31, 2000 2001
(In thousands)
$350 million senior secured credit facility.This credit facility is secured by substantially all of the assets of the Company. $309,250 $258,875
$200 million 11 1/8 % senior subordinated notes. These notes are general unsecured obligations of the Company. – 200,000
Other notes payable 49 34
309,299 458,909Less current maturities 11,390 15,141
$297,909 $443,768
MISSISSIPPIOn August 8, 2000, the Company completed its acquisition
of all of the assets of the Casino Magic hotel, casino, golf
resort, recreational vehicle park and marina in Bay St. Louis,
Mississippi and the Boomtown Biloxi casino in Biloxi,
Mississippi (the “Mississippi Acquisitions”), from Pinnacle
Entertainment, Inc. (formerly Hollywood Park, Inc.). The
Mississippi Acquisitions were accomplished pursuant to
the terms of two asset purchase agreements, each dated
December 10, 1999, for an aggregate of $195 million.
In addition to acquiring all of the operating assets and
related operations of the Casino Magic Bay St. Louis
and Boomtown Biloxi properties, the Company entered
into a licensing agreement to use the Boomtown and
Casino Magic names and marks at the properties acquired.
CHARLES TOWN MINORITY INTERESTOn March 15, 2000, the Company purchased from the
BDC Group (“BDC”), its joint venture partner in West
Virginia, BDC’s 11% interest in PNGI Charles Town
Gaming Limited Liability Company, which owns and
operates the Charles Town Entertainment Complex, for
$6.0 million in cash. As a result of the purchase, PNGI
Charles Town Gaming Limited Liability Company is
now a 100% owned subsidiary of the Company.
ACQUISITION ACCOUNTINGThe Company accounted for its acquisitions as purchases
in accordance with Accounting Principles Board No. 16.
The results of operations of the acquisitions are included in
the consolidated financial statements from their respective
dates of acquisition through December 31, 2001.
The excess of the purchase price paid over the fair market
value of the net assets acquired, or goodwill, is currently
amortized on a straight-line basis over 40 years. During
2001, as a result of the CRC Acquisition, the Company
recorded goodwill totaling $85.5 million. Goodwill
recorded in 2000 from the Mississippi and Charles Town
minority interest acquisitions was $62.1 million and $1.5
million, respectively.
UNAUDITED PROFORMA FINANCIAL INFORMATIONUnaudited pro forma financial information for the years
ended December 31, 2000 and 2001, as though the
Mississippi and CRC Acquisitions had occurred on
January 1, 2000, is as follows:

45
4. COMMITMENTS AND CONTINGENCIES
44
LITIGATIONIn 1997 the Company acquired the Charles Town Races
property in Charles Town,West Virginia, by exercising an
option held by Showboat Development Company, now a
wholly owned subsidiary of Harrah’s Entertainment, Inc.
In return for assigning the option, Showboat retained the
right to operate a casino at the Charles Town Races prop-
erty in return for a management fee, to be negotiated at
the time of exercise, based on reasonable rates for similar
properties. The express terms of the Showboat option do
not specify what activities at Charles Town Races would
constitute operation of a casino. The Company believes
that its installation and operation of video lottery terminals
linked to the West Virginia Lottery at the Charles Town
Races facility does not constitute the operation of a casino
under the Showboat option or under West Virginia law
and therefore does not trigger Showboat’s right to exercise
the Showboat option. The rights under the Showboat
option extended until November 2001.
On August 20, 2001, the Company was served with
a lawsuit brought by Showboat Development Company
against the Company and certain other parties related to
the Charles Town Entertainment Complex.The suit alleges,
among other things, that the Company’s operation of coin-
out video lottery terminals at the Charles Town facility
constitutes the operation of a casino, thereby triggering
Showboat’s option. The suit also alleges that the Company’s
March 2000 acquisition of the 11% minority interest in
Charles Town Races from BDC Group, the Company’s
former joint venture partner, was made in violation of
a right of first refusal that Showboat holds from BDC
covering the sale of any interest in any casino at Charles
Town Races. The Company filed in federal district court
in Nevada a motion to dismiss this action for lack of
personal jurisdiction. And, in the alternative, a motion
to transfer the case to the state of West Virginia was filed.
On January 25, 2002, the United States Court for the
District of Nevada granted the Company’s motion to
dismiss. (See Note 12 – Subsequent Events.)
In July 2001, a lawsuit was filed against the Company by
certain surveillance employees at the Charles Town facility
claiming that the Company’s surveillance of those employees
during working hours was improper. The lawsuit claims
damages of $7.0 million and punitive damages of $15.0
million.The Company currently is conducting discovery
in the case but, at this time, it believes that all of the claims
of the employees are without merit. On February 12, 2002,
the Company filed a motion for summary judgment that
is pending before the court.The Company intends to
vigorously defend itself against this action and does not
believe that this action will have a material adverse
effect on the Company’s financial condition or results
of operations.
consolidated statement of income for the year ended
December 31, 2000.
SENIOR SUBORDINATED NOTESOn March 12, 2001, the Company completed an offering
of $200 million of its 11⅛% Senior Subordinated Notes
due 2008. Interest on the notes is payable on March 1 and
September 1 of each year, beginning September 1, 2001.
These notes mature on March 1, 2008.
The Company may redeem all or part of the notes on or
after March 1, 2005 at certain specified redemption prices.
Prior to March 1, 2004, the Company may redeem up
to 35% of the notes from proceeds of certain sales of its
equity securities. The notes also are subject to redemption
requirements imposed by state and local gaming laws
and regulations.
The notes are general unsecured obligations and are
guaranteed on a senior subordinated basis by all of the
Company’s current and future wholly owned domestic
subsidiaries. The notes rank equally with the Company’s
future senior subordinated debt and junior to its senior debt,
including debt under the Company’s senior credit facility.
In addition, the notes will be effectively junior to any
indebtedness of our non-U.S. or unrestricted subsidiaries,
none of which guarantee the notes.
The notes and guarantees were originally issued in a private
placement pursuant to an exemption from the registration
requirements of the Securities Act of 1933, as amended
(the “Securities Act”). On July 30, 2001, the Company
completed an offer to exchange the notes and guarantees
for notes and guarantees registered under the Securities
Act having substantially identical terms.
The proceeds from these notes were used to finance the
CRC Acquisition that was completed on April 27, 2001.
The following is a schedule of future minimum repayments
of long-term debt as of December 31, 2001:
DECEMBER 31,
(In thousands)
2002 $ 15,1412003 18,8932004 22,6252005 107,2502006 95,000Thereafter 200,000
Total minimum payments 458,909
At December 31, 2001, the Company was contingently
obligated under letters of credit issued pursuant to the
senior secured credit facility with face amounts aggregating
$3.6 million.
The Company currently uses interest rate swaps to assist
in managing interest incurred on its long-term debt. The
difference between amounts received and amounts paid
under such agreements, as well as any costs or fees, is
recorded as a reduction of, or addition to, interest expense
as incurred over the life of the swap or similar financial
instrument. On December 20, 2000, the Company
entered into a forward interest rate swap with a notional
amount of $100 million, which has an effective date
of December 22, 2000 and a termination date of
December 22, 2003. Under this agreement, the Company
pays a fixed rate of 5.835% against a variable interest rate
based on the 90-day LIBOR rate. On August 3, 2001, the
Company entered into a forward interest rate swap with a
notional amount of $36 million, which has an effective date
of August 7, 2001 and a termination date of June 30, 2004.
Under this agreement, the Company pays a fixed rate
of 4.8125% against a variable interest rate based on the
90-day LIBOR rate. At December 31, 2001, the 90-day
LIBOR rate was 1.92%. The Company entered into
these interest rate swap agreements to reduce the impact
of future variable interest payments related to the
Company’s senior secured credit facility. The Company
accounts for the interest rate swap agreements as cash flow
hedges. The changes in the fair values of the interest rate
swaps are recorded as adjustments to accrued interest in
the accompanying consolidated balance sheet with the
offset recorded in accumulated other comprehensive loss,
which as of December 31, 2001 amounted to $3.8 million,
net of an income tax benefit of $2.0 million. Any hedge
ineffectiveness was not material for the year ended
December 31, 2001.Amounts recorded in accumulated
other comprehensive income will be amortized as an
adjustment to interest expense over the term of the related
derivative. The Company estimates $1.8 million of net
derivative losses included in other comprehensive income
will be reclassified into interest expense within the next
twelve months.

4746
contribution amounts. Plan contributions, net of forfeitures,
for the initial period ended December 31, 2001 amounted
to $0.5 million.
AGREEMENTS WITH HORSEMEN AND PARI-MUTUEL CLERKSThe Company has agreements with the horsemen at each
of the racetracks. The continuation of these agreements is
required to allow the Company to conduct live racing and
export and import simulcasting. In addition, the simulcasting
agreements are subject to the horsemen’s approval.
On March 23, 1999, the Company entered into a new
four-year, nine-month purse agreement with the Horsemen’s
Benevolent and Protection Association, which represents
the horsemen at the Company’s Penn National Race Course
facility in Grantville, Pennsylvania. The agreement ended
an action by the horsemen, which began on February 16,
1999 and caused the Company to close Penn National
Race Course and its six affiliated OTWs.As a result of the
action the Company incurred a nonrecurring $1.3 million
expense, primarily related to costs incurred to maintain
the closed facilities inclusive of employee salaries and rents,
for Horsemen’s Action Expense. The initial term of the
agreement ends on January 1, 2004 and automatically renews
for another two-year period, without change, unless notice
is given by either party at least ninety days prior to the
end of the initial term.
On December 17, 1999, the Company entered into a new
three-year purse agreement with the Pennsylvania Harness
Horsemen’s Association, Inc., which represents the owners,
trainers, and drivers at the Company’s The Downs Racing, Inc.
facility in Wilkes-Barre, Pennsylvania. The contract term
began on January 16, 2000 and ends on January 15, 2003.
The Company also has an agreement with the Charles
Town Horsemen that expires on December 31, 2002.
In addition to the horsemen agreements, in order to operate
gaming machines in West Virginia, the Company is required
to enter into written agreements regarding the proceeds
of the gaming machines at the Charles Town Entertainment
Complex with the parti-mutuel clerks at Charles Town.
The agreement with the pari-mutuel clerks at Charles
Town expires on December 31, 2004.
NEW JERSEY JOINT VENTUREOn January 28, 1999, the Company, along with its Joint
Venture partner, Greenwood New Jersey, Inc. purchased
certain assets and assumed certain liabilities of Freehold
Racing Association, Garden State Racetrack and related
entities, in a transaction accounted for as a purchase
(the “New Jersey Acquisition”).
Upon completion of the New Jersey Acquisition, the
Company entered into a lease agreement for real property
and equipment at Garden State Park (the leased premises).
In December 2000, the leased premises were sold. In
accordance with the lease, the agreement terminated 180
days after the closing of the sale.As a result, the Joint
Venture’s operations at Garden State Park ceased during
May 2001.
The purchase price for the New Jersey Acquisition was
approximately $46.0 million.The Company made an $11.3
million loan to the Joint Venture and an equity investment
of $0.3 million.The loan is evidenced by a subordinated
secured note which has been included in investment in
and advances to unconsolidated affiliates in the consolidated
financial statements. The note bears interest at prime plus
2.25% or a minimum of 10% (as of December 31, 2001
the interest rate was 10%). The Company has recorded
interest income in the accompanying consolidated financial
statements of $1.0 million, $1.3 million, and $1.2 million
for the years ended December 31, 1999, 2000 and 2001,
respectively.
In conjunction with the closing, the Company entered
into a Debt Service Maintenance Agreement with a bank
to guarantee 50% of a $23.0 million term loan to the Joint
Venture.As of December 31, 2001, our obligation under
our guarantee of the term loan was limited to approximately
$10.4 million. The Company’s investment in the Joint
Venture is accounted for under the equity method. The
original investment was recorded at cost and has been
adjusted by the Company’s share of income of the Joint
Venture and distributions received. The Company’s 50%
share of the income of the Joint Venture is included in
other income (expense) in the accompanying consolidated
statements of income.
In January 2002, an employee at the Charles Town facility
initiated a suit against the Company alleging invasion of
privacy. The employee claims in the suit that she was sub-
jected to an involuntary strip search by other Charles Town
employees as part of a theft investigation and is seeking
punitive damages. The lawsuit claims damages of $0.5
million and punitive damages of $3.5 million.The Company
believes that it has meritorious defenses and intends to
vigorously defend itself against this suit.
The Company also is a party to certain other litigation but
does not believe it will have a material adverse effect on
the Company’s financial condition or results of operations
if any of these legal proceedings were adversely adjudicated
or settled. Furthermore, the nature of the Company’s business
subjects it to the risk of lawsuits filed by customers and
others in the ordinary course. In general, litigation can be
expensive and time consuming to defend and could result
in settlements or damages that could significantly impact
results of operations or financial condition.
OPERATING LEASESThe Company is liable under numerous operating leases
for automobiles, other equipment and buildings, which
expire through 2010. Total rental expense under these
agreements was $1.3 million, $2.1 million and $4.0 million
for the years ended December 31, 1999, 2000, and 2001,
respectively.
The future lease commitments relating to noncancelable
operating leases as of December 31, 2001 are as follows:
2001
(In thousands)
2002 $3,5302003 3,3252004 2,1492005 1,1632006 815Thereafter 947
$11,929
In addition, the Company leases land for use by Boomtown
Biloxi. The lease term is 99 years and is cancelable upon
one year’s notice. The lease called for an initial deposit by
the Company of $2.0 million and for annual base lease rent
payments of $2.0 million and percentage rent equal to 5.0%
of adjusted gaming win (as defined in the lease) over
$25.0 million and 6.0% of the amount by which the
adjusted gaming win exceeds $50.0 million. During the
period from August 8, 2000 to December 31, 2000 and
for the year ended December 31, 2001, the Company
paid lease rent under this agreement of $1.3 million and
$3.6 million respectively.
EMPLOYEE BENEFIT PLANSThe Company has profit sharing plans under the provisions
of Section 401(k) of the Internal Revenue Code that cover
all eligible employees who are not members of a bargaining
unit. The plans enable employees choosing to participate
to defer a portion of their salary in a retirement fund
to be administered by the Company. The Company’s
contributions to the plans are set at 50% of employees’
elective salary deferrals up to a maximum of 6% of employee
compensation. The Company also has a defined contribution
plan, the Charles Town Races Future Service Retirement
Plan, covering substantially all of its union employees at
the Charles Town Entertainment Complex.The Company
makes monthly contributions equal to the amount accrued
for retirement expense, which is calculated as .25% of the
daily mutual handle and .5% of the net video lottery rev-
enues. Total contributions to the plans for the years ended
December 31, 1999, 2000 and 2001 were $0.4 million,
$1.1 million and $1.8 million, respectively.
The Company maintains a non-qualified defined contri-
bution deferred compensation plan that covers most
management and other highly compensated employees.
This plan was effective March 1, 2001. The plan allows
the participants to defer, on a pre-tax basis, a portion of
their base annual salary and bonus and earn tax-deferred
earnings on these deferrals. The plan also provides for
matching Company contributions that vest over a seven-
year period. The Company has established a Trust and
transfers to the Trust, on an annual basis, an amount necessary
to provide on a present value basis for its respective future
liabilities with respect to participant deferral and Company

48
Deferred tax assets and liabilities are comprised of the
following:
The provision for income taxes charged to operations was
as follows:
5. INCOME TAXES
49
Cash paid during the year for interest was $8.7 million,
$18.4 million and $36.7 million in 1999, 2000 and 2001,
respectively.
Cash paid during the year for income taxes was $3.0
million, $3.9 million and $3.5 million in 1999, 2000
and 2001, respectively.
6. SUPPLEMENTAL DISCLOSURES OF CASH FLOW INFORMATION
YEAR ENDED DECEMBER 31, 1999 2000 2001
(In thousands)
Current tax expenseFederal $2,759 $ 6,199 $ 5,542State 108 660 107
Total current 2,867 6,859 5,649
Deferred tax expense (benefit)Federal 1,227 3,447 7,159State (317) (169) (200)
Total deferred 910 3,278 6,959
Total provision $3,777 $10,137 $12,608
YEAR ENDED DECEMBER 31, 1999 2000 2001
Percent of pretax incomeFederal tax rate 34.0% 34.0% 35.0%State and local income taxes,
net of federal tax benefit 2.0 1.1 (.2)Permanent difference relating
to amortization of goodwill .2 .1 .3
Other miscellaneous items (.3) .1 (.4)
35.9% 35.3% 34.7%
DECEMBER 31, 2000 2001
(In thousands)
Deferred tax assetsAccrued expenses $ – $ 3,625State net operating losses 2,027 2,303Other comprehensive income – 2,043
Gross deferred tax assets $ 2,027 $ 7,971
Deferred tax liabilitiesProperty, plant and equipment ($15,507) ($43,610)
Net deferred taxes ($13,480) ($35,639)
Reflected on consolidated balance sheets:Current deferred tax assets, net $ – $ 4,610Noncurrent deferred tax liabilities, net (13,480) (40,249)
Net deferred taxes ($13,480) ($35,639)
The following is a reconciliation of the statutory federal
income tax rate to the actual effective income tax rate for
the following periods:

50
In addition, 300,000 Common Stock options were
issued to the Company’s Chairman outside the Plan on
October 23, 1996. These options were issued at $17.63
per share and are exercisable through October 23, 2006.
Exercisable at year end:
51
The weighted average fair value of the stock options granted
during the years ended December 31, 1999, 2000 and
2001 were $2.21 million, $3.95 million and $7.71 million,
respectively.The fair value of each option grant is estimated
on the date of grant using the Black-Scholes option-pricing
model with the following weighted average assumptions
used for grants in 1999, 2000 and 2001: dividend yield
of 0%; expected volatility of 35%; risk-free interest rate
of 6%; and expected lives of five years. The effects of
applying SFAS 123 in the above pro forma disclosure
are not indicative of future amounts. SFAS 123 does
not apply to awards prior to 1995.Additional awards
in future years are anticipated.
OPTION WEIGHTED AVERAGESHARES EXERCISE PRICE
1999 1,242,625 $ 9.492000 1,228,792 10.032001 900,418 11.98
EXERCISE PRICE RANGE TOTAL
$3.33 TO $7.31 TO $10.75 TO $3.33 TO$6.88 $10.63 $27.77 $27.77
Outstanding optionsNumber outstanding 424,750 673,250 636,500 1,734,500Weighted average remaining
contractual life (years) 3.96 6.51 4.69 5.22Weighted average exercise price $5.08 $9.63 $17.25 $11.32
Exercisable optionsNumber outstanding 336,959 58,459 505,000 900,418Weighted average exercise price $4.65 $8.14 $17.32 $11.98
In accordance with Statement of Financial Accounting
Standards No. 123, “Accounting for Stock-Based
Compensation” (“SFAS 123”), the Company has adopted
fair value as the measurement basis for transactions in which
the Company acquires goods or services from nonemployees
in exchange for equity instruments. In addition, SFAS 123
also has certain disclosure provisions.Accounting Principles
Board Opinion No. 25, “Accounting for Stock Issued to
Employers” (“APB 25”), uses an intrinsic value based
method of accounting. The Company has decided to
continue to apply APB 25 for its stock-based employee
compensation arrangements.Accordingly, no compensation
cost has been recognized. Had compensation cost for the
Company’s employee stock option plan been determined
based on the fair value at the grant date for awards under
the plan consistent with the method of SFAS 123, the
Company’s net income and net income per share would
have been as follows:
In April 1994, the Company’s Board of Directors and
shareholders adopted and approved the Stock Option Plan
(the “Plan”).The Plan permits the grant of options to pur-
chase up to 3,000,000 shares of Common Stock, subject to
antidilution adjustments, at a price per share no less than 100%
of the fair market value of the Common Stock on the date
an option is granted with respect to incentive stock options
only.The price would be no less than 110% of fair market
value in the case of an incentive stock option granted to any
individual who owns more than 10% of the total combined
voting power of all classes of outstanding stock. The Plan
provides for the granting of both incentive stock options
intended to qualify under Section 422 of the Internal
Revenue Code of 1986, and nonqualified stock options, which
do not so qualify.At December 31, 2001, there were 758,250
options available for future grants under the Plan. Unless the
Plan is terminated earlier by the Board of Directors, the Plan
will terminate in April 2004.
Stock options that expire between October 23, 2002 and
January 1, 2011 have been granted to officers and directors
to purchase Common Stock at prices ranging from $3.33
to $27.77 per share.All options were granted at market
prices at date of grant. The following table contains infor-
mation on stock options issued under the Plan for the
three-year period ended December 31, 2001:
7. STOCK BASED COMPENSATION
OPTION AVERAGE SHARES EXERCISE PRICE
Outstanding at January 1, 1999 1,184,500 $ 9.50Granted 149,500 6.98Exercised (27,000) 5.63Canceled (31,750) 13.40
Outstanding at December 31, 1999 1,275,250 7.27Granted 294,500 9.65Exercised (145,000) 4.77Canceled (11,000) 10.36
Outstanding at December 31, 2000 1,413,750 8.01Granted 518,000 11.70Exercised (474,250) 6.19Canceled (23,000) 4.77
Outstanding at December 31, 2001 1,434,500 10.00
The following table summarizes information about
stock options outstanding at December 31, 2001:
YEAR ENDED DECEMBER 31, 1999 2000 2001
(In thousands, except per share data)
Net incomeAs reported $6,733 $11,992 $23,758Pro forma 6,143 11,702 22,985
Basic net income per shareAs reported $.45 $.80 $1.55Pro forma .41 .78 1.50
Diluted net income per shareAs reported $.44 $.78 $1.49Pro forma .40 .76 1.44

5352
The Company has adopted SFAS No. 131 “Disclosures
About Segments of an Enterprise and Related Information.”
The Company has determined that it currently operates
in two segments: (1) gaming and (2) racing.
The accounting policies for each segment are the same as
those described in the “Summary of Significant Accounting
Policies” for the year ended December 31, 2001. The
Company and the gaming industry use earnings before
interest, taxes, depreciation and amortization, (“EBITDA”)
as a means to evaluate performance. EBITDA should not
be considered as an alternative to, or more meaningful
than, net income (as determined in accordance with
accounting principles generally accepted in the United
States) as a measure of operating results or cash flows
(as determined in accordance with accounting principles
generally accepted in the United States) or as a measure
of the Company’s limitations.
The table below presents information about reported
segments (in thousands):
9. SEGMENT INFORMATION
YEAR ENDED DECEMBER 31, 1999 2000 2001
(In thousands)
REVENUESGaming(1)(2) $ 80,015 $191,495 $422,012Racing 91,933 101,937 98,766Eliminations(3) (1,588) (1,631) (1,386)
Total $170,360 $291,801 $519,392
YEAR ENDED DECEMBER 31, 1999 2000 2001
(In thousands)
EBITDA(4)
Gaming(1)(2) $ 8,628 $38,988 $ 95,100Racing 17,868 20,493 17,236
Total $26,496 $59,481 $112,336
AS OF DECEMBER 31, 2000 2001
(In thousands)
TOTAL ASSETSGaming(1)(2) $673,682 $1,092,400Racing 91,756 90,014Eliminations(5) (325,538) (503,037)
$439,900 $ 679,377
(1) Reflects results of the Mississippi properties since August 8, 2000 acquisition.
(2) Reflects results of the CRC Acquisition since April 28, 2001.
(3) Primarily reflects intercompany transactions related to import/export simulcasting.
(4) EBITDA consists of income from operations, plus depreciation and amortization, plus earnings from joint venture.
(5) Primarily reflects elimination of intercompany investments, receivables and payables.
8. SHAREHOLDER RIGHTS PLAN
On May 20, 1998, the Board of Directors of the Company
authorized and declared a dividend distribution of one
Preferred Stock purchase right (the “Rights”) for each
outstanding share of the Company’s common stock, par
value $.01 per share (the “Common Shares”), payable
to shareholders of record at the close of business on
March 19, 1999. Each Right entitles the registered holder
to purchase from the Company one one-hundredth of
a share (a “Preferred Stock Fraction”), or a combination
of securities and assets of equivalent value, at a purchase
price of $40.00 per Preferred Stock Fraction (the “Purchase
Price”), subject to adjustment. The description and terms
of the Rights are set forth in a Rights Agreement (the
“Rights Agreement”) dated March 2, 1999 between the
Company and Continental Stock Transfer and Trust Company
as Rights Agent.All terms not otherwise defined herein
are used as defined in the Rights Agreement.
The Rights will be exercisable only if a person or group
acquires 15% or more of the Company’s common stock
(the “Stock Acquisition Date”), announces a tender or
exchange offer that will result in such person or group
acquiring 20% or more of the outstanding common stock
or is a beneficial owner of a substantial amount of Common
Shares (at least 10%) whose ownership may have a material
adverse impact (“Adverse Person”) on the business or
prospects of the Company. The Company will be entitled
to redeem the Rights at a price of $.01 per Right (payable
in cash or stock) at any time until 10 days following the
Stock Acquisition Date or the date on which a person has
been determined to be an Adverse Person. If the Company
is involved in certain transactions after the Rights become
exercisable, a Holder of Rights (other than Rights owned
by a shareholder who has acquired 15% or more of the
Company’s outstanding common stock or is determined
to be an Adverse Person, which Rights become void) is
entitled to buy a number of the acquiring company’s
Common Shares or the Company’s common stock, as the
case may be, having a market value of twice the exercise
price of each Right.A potential dilutive effect may exist
upon the exercise of the Rights. Until a Right is exercised,
the holder will have no rights as a stockholder of the
Company, including, without limitations, the right to vote
as a stockholder or to receive dividends. The Rights are
not exercisable until the Distribution Date and will expire
at the close of business on March 18, 2009, unless earlier
redeemed or exchanged by the Company.

54
On February 20, 2002 the Company closed an offering
of 4,600,000 shares of common stock in a public offering.
The price of the public offering was $30.50 per share. Of
the common shares sold in the offering, 3,350,000 shares
were sold by the Company and 1,250,000 shares were sold
by The Carlino Family Trust, a related party.The Company
intends to use its net proceeds from the offering of approxi-
mately $96.0 million, after deducting underwriting discounts
and related expenses, to repay indebtedness under the existing
senior secured credit facility.The Company did not receive
any proceeds from the offering by The Carlino Family Trust.
On February 28, 2002, the Company consummated an
offering of up to $175.0 million aggregate principal of 8⅞%
Senior Subordinated Notes due March 15, 2010. The net
proceeds of these notes will be used to repay outstanding
loan indebtedness under the Company’s senior credit facility.
The Senior Subordinated Notes will rank equally with all
of the Company’s other existing and future senior subor-
dinated indebtedness and will be junior to the Company’s
senior indebtedness, including debt under the Company’s
secured credit facility.
On February 13, 2002, Showboat Development Company
filed a lawsuit against the Company in the United States
District Court for the Eastern District of Pennsylvania.
The substance of this lawsuit is similar to the claim that
was dismissed in Nevada.
On March 28, 2002, Penn National and Showboat agreed
to settle all litigation related to this matter. Under the
settlement, the Company agreed to make a one-time
payment of $1.0 million to Showboat, which was
recognized in general and administrative expenses in
our operating results for the fourth quarter of 2001.
(See Note 4 – Commitments and Contingencies.)
12. SUBSEQUENT EVENTS
55
On August 30, 2001, the Company entered into a definitive
agreement to acquire all of the assets of the Bullwhackers
Casino operations, in Black Hawk, Colorado, from Colorado
Gaming and Entertainment Co., a subsidiary of Hilton
Group plc, for $6.5 million in cash. The Bullwhackers
assets consist of the Bullwhackers Casino, the adjoining
Bullpen Sports Casino, the Silver Hawk Saloon and Casino,
an administrative building and a 475-car parking area, all
located in the Black Hawk, Colorado gaming jurisdiction.
The Bullwhackers properties comprise a total of 63,800
square feet of interior space, 20,700 square feet of which
is devoted to gaming, consisting of 1,002 slot machines
and 16 table games. The properties are located on leased
land as well as 3.25 acres of land included in the acquisition,
much of which is utilized for parking. The transaction is
anticipated to close in the second quarter of 2002.As of
December 31, 2001, the Company has advanced $0.5
million under the terms of the agreement.
11. PENDING ACQUISITION
Following is a summary of the quarterly results of operations
for the years ended December 31, 2000 and 2001:
10. SUMMARIZED QUARTERLY DATA (UNAUDITED)
FISCAL QUARTERFIRST SECOND THIRD FOURTH
(In thousands, except per share data)
2000Total revenues $ 52,119 $ 60,911 $ 86,982 $ 91,789Income from operations 7,627 11,208 14,446 11,839Net income (loss) 3,622 6,227 (582) 2,725Basic earnings (loss) per share .24 .42 (.04) .18Diluted earnings (loss) per share .24 .40 (.04) .18
2001Total revenues $105,160 $132,732 $145,534 $135,966Income from operations 14,778 21,236 23,298 18,400Net income 4,619 6,485 7,710 4,944Basic earnings per share .31 .42 .50 .32Diluted earnings per share .30 .40 .48 .31
REPORT OF INDEPENDENT CERTIFIED PUBLIC ACCOUNTANTS
PENN NATIONAL GAMING, INC. AND SUBSIDIARIESWYOMISSING, PENNSYLVANIA
We have audited the accompanying consolidated balance
sheets of Penn National Gaming, Inc. and subsidiaries as of
December 31, 2000 and 2001, and the related consolidated
statements of income, shareholders’ equity, and cash flows
for each of the three years in the period ended December
31, 2001. These consolidated financial statements are the
responsibility of the Company’s management. Our respon-
sibility is to express an opinion on these consolidated
financial statements based on our audits.
We conducted our audits in accordance with auditing
standards generally accepted in the United States of America.
Those standards require that we plan and perform the
audit to obtain reasonable assurance about whether the
consolidated financial statements are free of material
misstatement.An audit includes examining, on a test basis,
evidence supporting the amounts and disclosures in the
consolidated financial statements. An audit also includes
assessing the accounting principles used and significant
estimates made by management, as well as evaluating
the overall consolidated financial statement presentation.
We believe that our audits provide a reasonable basis for
our opinion.
In our opinion, the consolidated financial statements referred
to above present fairly, in all material respects, the financial
position of Penn National Gaming, Inc. and subsidiaries
at December 31, 2000 and 2001, and the results of their
operations and their cash flows for each of the three years
in the period ended December 31, 2001 in conformity
with accounting principles generally accepted in the United
States of America.
BDO Seidman, LLP
Philadelphia, Pennsylvania
January 25, 2002, except for Note 12,
which is as of March 28, 2002.

56
OFFICERS AND DIRECTORS
PETER M. CARLINOChairman of the Board and Chief Executive Officer
KEVIN DESANCTISPresident and Chief Operating Officer (1)
ROBERT S. IPPOLITOVice President, Secretary and Treasurer
WILLIAM J. CLIFFORDSenior Vice President, Finance, and Chief Financial Officer (1)
RICHARD ORBANNPresident of Racing Operations
HAROLD CRAMER, ESQ.Director, Retired Partner of Schnader Harrison Segal & Lewis LLP
DAVID A. HANDLERDirector, Senior Managing Director, Bear, Stearns & Co., Inc.
ROBERT P. LEVYDirector, Chairman of the Board,Atlantic City Racing Association
WILLIAM J. BORKDirector, Retired President, Penn National Gaming, Inc.
JOHN M. JACQUEMINDirector, President, Mooring Financial Corporation
BDO SEIDMAN, LLPIndependent Certified Public Accountants1700 Market Street, Philadelphia, Pennsylvania 19103
SCHNADER HARRISON SEGAL & LEWIS LLPLegal Counsel1600 Market Street, Philadelphia, Pennsylvania 19103
TRANSFER AGENT AND REGISTRARContinental Stock Transfer & Trust Company17 Battery Place, New York, New York 10004
FORM 10-KThe annual report to the Securities and Exchange Commission may beobtained free of charge upon written request at its corporate offices.
MARKET INFORMATIONThe Common Stock of the Company is listed on the NASDAQ NationalMarket under the symbol PENN.
(1) Subject to the receipt of necessary licensing and regulatory approval in certain jurisdictions,
Messrs. DeSanctis and Clifford will become executive officers.


