1 Toyosu IHI Bldg. 1-1, Toyosu 3-chome, Koto-ku Tokyo 135-8710, Japan May 19, 2020 CONSOLIDATED FINANCIAL REPORT FOR THE FISCAL YEAR ENDED MARCH 31, 2020 <Japanese GAAP> IHI Corporation (IHI) is listed on the First Section of the Tokyo Stock Exchange, Nagoya Stock Exchange, Sapporo Securities Exchange and Fukuoka Stock Exchange with the securities code number 7013. Representative: Chairman of the Board and President, Tsugio Mitsuoka For further information contact: Finance & Accounting Division, General Manager, Seiji Maruyama Tel: +81-3-6204-7065 URL: http://www.ihi.co.jp Annual General Meeting of Shareholders: June 25, 2020 (planned) Commencement of Dividend Payments: June 26, 2020 (planned) Submission date of Annual Securities Report: June 25, 2020 (planned) Preparing supplementary material on financial results: Yes Holding financial results presentation meeting: Yes (for institutional investors, analysts and the media) This consolidated financial report has been prepared in accordance with Japanese accounting standards and Japanese law. Figures are in Japanese yen rounded to the nearest millions. 1. CONSOLIDATED PERFORMANCE FOR THE YEAR ENDED MARCH 31, 2020 (APRIL 1, 2019 to MARCH 31, 2020) (1) Consolidated Business Results (Millions of yen, except per share figures; percentages show the rate of increase or decrease from the previous fiscal year) Net Sales Percentage Change Operating Profit Percentage Change Ordinary Profit Percentage Change Fiscal year ended March 31, 2020 1,386,503 (6.5)% 60,797 (26.3)% 32,251 (50.9)% Fiscal year ended March 31, 2019 1,483,442 (6.7)% 82,488 14.1% 65,749 206.9% Profit Attributable to Owners of Parent Percentage Change Basic Earnings per Share (Yen) Diluted Earnings per Share (Yen) Return on Equity Ordinary Profit to Total Assets Operating Profit to Net Sales Fiscal year ended March 31, 2020 12,812 (67.9)% 84.21 84.19 3.8% 1.9% 4.4% Fiscal year ended March 31, 2019 39,889 381.1% 258.53 258.37 11.8% 4.0% 5.6% (Note) Comprehensive income Fiscal year ended March 31, 2020: ¥8,610 million (78.3)% Fiscal year ended March 31, 2019: ¥39,597 million 136.1% (Reference) Share of profit (loss) of entities accounted for using equity method Fiscal year ended March 31, 2020: ¥ (12,991) million Fiscal year ended March 31, 2019: ¥ 4,108 million
Transcript
1
Toyosu IHI Bldg.
1-1, Toyosu 3-chome, Koto-ku Tokyo 135-8710, Japan
May 19, 2020
CONSOLIDATED FINANCIAL REPORT FOR THE FISCAL YEAR ENDED MARCH 31, 2020
<Japanese GAAP> IHI Corporation (IHI) is listed on the First Section of the Tokyo Stock Exchange, Nagoya Stock Exchange, Sapporo Securities Exchange and Fukuoka Stock Exchange with the securities code number 7013. Representative: Chairman of the Board and President, Tsugio Mitsuoka For further information contact: Finance & Accounting Division, General Manager, Seiji Maruyama
Tel: +81-3-6204-7065 URL: http://www.ihi.co.jp
Annual General Meeting of Shareholders: June 25, 2020 (planned) Commencement of Dividend Payments: June 26, 2020 (planned) Submission date of Annual Securities Report: June 25, 2020 (planned) Preparing supplementary material on financial results: Yes Holding financial results presentation meeting: Yes (for institutional investors, analysts and the media) This consolidated financial report has been prepared in accordance with Japanese accounting standards and Japanese law. Figures are in Japanese yen rounded to the nearest millions.
1. CONSOLIDATED PERFORMANCE FOR THE YEAR ENDED MARCH 31, 2020
(APRIL 1, 2019 to MARCH 31, 2020) (1) Consolidated Business Results
(Millions of yen, except per share figures; percentages show the rate of increase or decrease from the previous fiscal year) Net Sales Percentage
Change Operating
Profit Percentage
Change Ordinary
Profit Percentage
Change Fiscal year ended March 31, 2020
1,386,503 (6.5)% 60,797 (26.3)% 32,251 (50.9)%
Fiscal year ended March 31, 2019
1,483,442 (6.7)% 82,488 14.1% 65,749 206.9%
Profit Attributable to Owners of
Parent
Percentage Change
Basic Earnings per Share (Yen)
Diluted Earnings per Share (Yen)
Return on Equity
Ordinary Profit to
Total Assets
Operating Profit to Net Sales
Fiscal year ended March 31, 2020
12,812 (67.9)% 84.21 84.19 3.8% 1.9% 4.4%
Fiscal year ended March 31, 2019
39,889 381.1% 258.53 258.37 11.8% 4.0% 5.6%
(Note) Comprehensive income
Fiscal year ended March 31, 2020: ¥8,610 million (78.3)%
Fiscal year ended March 31, 2019: ¥39,597 million 136.1% (Reference) Share of profit (loss) of entities accounted for using equity method
Fiscal year ended March 31, 2020: ¥ (12,991) million
Fiscal year ended March 31, 2019: ¥ 4,108 million
2
(2) Consolidated Financial Position (Millions of yen, except per share figures)
Total Assets Net Assets Equity to Total Assets Net Assets per Share (Yen) As of March 31, 2020 1,740,782 353,746 18.7% 2,195.96 As of March 31, 2019 1,664,529 381,692 21.0% 2,263.12
(Reference) Equity at the end of the period (consolidated)
* Year-end dividend forecast per share for the fiscal year ended March 31, 2020 was changed from ¥40 per share to ¥20 per share. For details, please refer to “Notice Regarding Revision to the Year-End Dividend Forecast for the Fiscal Year Ended March 31, 2020” which was announced on May 12, 2020.
* The dividend forecast for the fiscal year ending March 31, 2021 is undetermined, since it is difficult to calculate the forecasts of results at this point. 3. CONSOLIDATED FORECASTS OF RESULTS FOR THE YEAR ENDING MARCH 31, 2021
The consolidated forecasts of results for the year ending March 31, 2021 are undetermined, since it is difficult to calculate a reasonable impact amount from the spread of the novel coronavirus (COVID-19) at this point.
3
* NOTES
(1) Changes in significant subsidiaries during the period under review (Changes in specified subsidiaries accompanying changes in scope of consolidation): Yes
Exclusion: One company (IHI Investment for Aero Engine Leasing LLC) (Note) For details, please refer to “(5) NOTES TO THE CONSOLIDATED FINANCIAL STATEMENTS (BASIS OF
PREPARATION OF THE CONSOLIDATED FINANCIAL STATEMENTS)” of “4. CONSOLIDATED FINANCIAL STATEMENTS AND NOTES THERETO” on page 22.
(2) Changes in accounting policies, changes in accounting estimates, and restatement of prior period
financial statements after error corrections (i) Changes in accounting policies due to revisions to accounting standards: Yes (ii) Changes in accounting policies due to other reasons: Not applicable (iii) Changes in accounting estimates: Not applicable (iv) Restatement of prior period financial statements after error corrections: Not applicable
(Note) For details, please refer to “(5) NOTES TO THE CONSOLIDATED FINANCIAL STATEMENTS (CHANGES IN ACCOUNTING POLICIES)” of “4. CONSOLIDATED FINANCIAL STATEMENTS AND NOTES THERETO” on page25.
(3) Number of shares issued (Common stock):
(i) Number of shares issued at the end of the period (including treasury shares) As of March 31, 2020 154,679,954 shares As of March 31, 2019 154,679,954 shares
(ii) Number of treasury shares owned at the end of the period As of March 31, 2020 6,054,574 shares As of March 31, 2019 388,346 shares
(iii) Average number of shares outstanding during the period Fiscal year ended March 31, 2020 152,136,569 shares Fiscal year ended March 31, 2019 154,290,387 shares
(REFERENCE) OVERVIEW OF NON-CONSOLIDATED PERFORMANCE NON-CONSOLIDATED PERFORMANCE FOR THE YEAR ENDED MARCH 31, 2020 (APRIL 1, 2019 to MARCH 31, 2020) (1) Non-Consolidated Business Results
(Millions of yen, except per share figures; percentages show the rate of increase or decrease from the fiscal year)
(2) Non-Consolidated Financial Position (Millions of yen, except per share figures)
Total Assets Net Assets Equity to Total Assets Net Assets per Share (Yen) As of March 31, 2020 1,201,832 205,266 17.0% 1,377.51 As of March 31, 2019 1,113,379 238,305 21.3% 1,540.24
(Reference) Equity at the end of the period (non-consolidated)
As of March 31, 2020: ¥204,734 million
As of March 31, 2019: ¥237,646 million
* The Consolidated Financial Report is outside the scope of external audit. * Proper use of forecast of results, and other special matters
Earnings estimates made in this report and other statements that are not historical facts are forward-looking statements about the future performance of the IHI Group. These statements are based on management’s assumptions and beliefs in light of the information currently available to it and therefore readers should not place undue reliance on them. IHI cautions that a number of important factors such as political and general economic conditions and currency exchange rates could cause actual results to differ materially from those discussed in the forward-looking statements, etc.
(How to obtain supplementary material on financial results) The supplementary material on financial results shall be posted on IHI’s website.
5
1. SUMMARY OF BUSINESS RESULTS
(1) SUMMARY OF BUSINESS RESULTS AND FINANCIAL POSITION A. Summary of business results for the fiscal year under review
During the fiscal year under review, the Japanese economy was generally remained stable, supported by moderate increases in capital investment and improvements in situation of employment and income until latter half of the fiscal year. In the global economy, while overall moderate growth continued, business conditions in China and Europe were in a slowdown trend and, in the political side, the unstable situation remained from problems including the trade friction between the U.S. and China, the issue of the U.K. regarding leaving EU, and heightened geopolitical risks. After January 2020, the global spread of COVID-19 caused temporary shutdowns of manufacturing activity and slumps of consumption by restrictions on the movement of people. As a result, the economies among Japan and the globe have been in a rapid downturn and an extremely severe condition. Under this business environment, orders received of the IHI Group in the fiscal year under review decreased 1.8% from the previous fiscal year to ¥1,373.9 billion. Net sales decreased 6.5% from the previous fiscal year to ¥1,386.5 billion. In terms of profit, operating profit decreased by ¥21.6 billion to ¥60.7 billion due mainly to decreased numbers of delivery in Europe in the Vehicular turbochargers Business, in addition to a downturn of sales in the Boilers Business and the Power plants Business, also a downturn of sales caused by making its inspection process stricter in the Civil aero engines Business and additional program costs in this business. Ordinary profit decreased by ¥33.4 billion to ¥32.2 billion, saw a further down of profit margin than operating profit, due mainly to share of loss of entities accounted for using equity method caused by downturn in the operating performance of IHI’s affiliate Japan Marine United Corporation. Profit attributable to owners of parent was ¥12.8 billion, a decrease of ¥27.0 billion. In a situation where the convergence of the spread of COVID-19 cannot be predicted, the IHI Group, while giving top priority to the safety and health of employees, their families and all stakeholders, continues to carry out its business activities with taking measures to prevent the spread of infection, such as thorough implementation of working from home. On the other hand, under such severe circumstance, the Civil aero engines Business will be affected by the drastic decline in demand for aero transportation and the deterioration of airlines and the Vehicular turbochargers Business is expected to be affected by the downturn of demand for automotive and the suspension of factory production at automotive manufacturing companies. Furthermore, related to other businesses, the Group has also a concern to occur delays in construction phase of ongoing projects caused by the impact from prolongation of measures to prevent the spread of infection such as refraining from going out. In order to minimize the impact of the spread of COVID-19, the Group will implement flexible measures to cope with changes of business environment, such as reinforcement of risk management and innovative change in business structure. The business environments by reportable segment for the fiscal year under review are as follows: Resources, Energy and Environment With long-term targets having been set in the Paris Agreement in relation to upper limits on increases in average global temperatures, and the balance between the volume of greenhouse gases emitted and absorbed, the movement to respond to climate change and the world’s shift towards carbon-free societies are accelerating more quickly than expected. In accordance with this, the issues facing societies and our customers are becoming more diversified based on the region and the current level of development, and the diffusion of renewable energy and distributed power sources, as well as the movement towards energy management as a means of achieving stable energy supplies, is gaining speed. In this business area, the IHI Group has undertaken initiatives to put in place the social infrastructure required for stable supply of necessary energy, and to provide optimized and integrated solutions by region and by customer through the promotion of the effective use of exhaustible resources, of the use of renewable and distributed energy, and the utilization of renewable resources in preparation for the shift to carbon-free, recycling societies. Social Infrastructure and Offshore Facility In Japan, new demand is expected to be generated by orders related to themes such as regions that are not yet served by expressways, and the Chuo Shinkansen. Whereas, as a result of the recent intensification in disasters and the progressive deterioration of infrastructure, demand for measures to make infrastructure more robust and to extend its life is rising sharply, and the trend toward a maintenance business is accelerating. In addition, regulatory reforms are moving forward as a means of responding to shortages of managers and engineers, and there is a need to improve efficiency and reduce labor requirements in all businesses through the utilization of
6
ICT/IoT. Overseas, in Europe, the U.S., Asia, and the Middle East, from the twin perspectives of environmental considerations and improved efficiency of investment in infrastructure, concession businesses that take a comprehensive approach to everything from design and construction to operation and maintenance are becoming more common, and projects for road and bridge construction, which includes bridges and tunnels, are moving ahead. In this business area, the IHI Group is working on initiatives to roll out and expand life-cycle businesses, which include planning, operation, maintenance and conservation, primarily of bridges and tunnels, both in Japan and overseas so as to offer robust and sustainable social infrastructure systems. Industrial System and General-Purpose Machinery The major trends that affect industrial systems in general, such as advances in automation resulting from the growth of digital technology, and the globalization of supply chains, are accelerating every year. On the other hand, for the automotive industry, the global slowdown in markets that began in China, and the associated slump in related components industries have resulted in a slowdown in demand for the Vehicular turbochargers Business and the Thermal and surface treatment Business, which are our mainstay field. In addition, due to the prolonged stagnation of economic activity incurred by the spread of COVID-19, there is a concern that our automotive related businesses will also be affected significantly, in a situation where world-wide decreases in demand for automotive is supposed. The IHI Group is working to minimize the impact and making preparations to facilitate a rapid restart when the recovery phase begins. In this business area, we are realizing the development of sophisticated industrial infrastructure by pursuing, together with the customers, optimized operations throughout the life cycle. Combining the IHI Group’s knowledge and track record, we will use adaptive business processes as a foundation from which to address issues in customer businesses, including reducing lead times, labor shortages, and declines in know-how and technical capabilities, by working on automation and electric motorization etc. leveraged digital transformation, and reduction of environmental burdens. Aero Engine, Space and Defense The Civil aero engines Business has previously been trying to expand its business scale, responding world-wide growth of demand for aircraft, by advancing its proprietary technology and Monozukuri (manufacturing) capabilities further through participating in development and mass production of wide range of aero engines classes from small size to large sizes. Also, in the civil aero engine maintenance business where inadequate practices occurred, we are thoroughly going forward the recurrence preventive measures and reorganizing robust quality assurance system. On the other hand, the current global spread of COVID-19 evokes the drastic decline in demand for international aero transportation and the deterioration of operating performance and financial position of airlines, and it is supposed that the recovery of the market will take a certain amount of time. In the situation where sales of aero engines and spare parts are expected to decrease and our business will inevitably be affected by the situation significantly, we are reviewing production system to meet the changes of demand and shifting resources. Moreover, our aero engines are mounted on relatively new type aircrafts, and due to their superiority in operating costs such as fuel efficiency, it is expected that operation will be resumed preferentially and earnings in the aftermarket will recover rapidly. Therefore, we will give top priority to strengthening responses to the aftermarket field in order to fully support the resumption of aircraft operations by customers in the recovery period of demand for aero transportation. In addition, as a member in aviation industry, we will contribute for the efforts for reduction of environmental burden through the development of new type engines with high efficiency and low fuel consumption, while preparing for the return to a growth path of the market. The results by reportable segment for the fiscal year under review amid this business environment are as follows:
Total 1,399.2 1,373.9 (1.8) 1,483.4 82.4 1,386.5 60.7 (6.5) (26.3)
B. Profit Distribution IHI continuously sets its basic dividend policy as providing stable dividends to shareholders. Also, taking into consideration a broad range of factors, including investments for improvement of corporate value, enhancement and reinforcement of equity capital, IHI aims sustainable increment of dividends according to the growth of the IHI Group. After taking into consideration the broad range of factors according to the above dividend policy, IHI plans to pay a dividend of ¥50 per share (interim dividend already paid: ¥30, year-end dividend: ¥20) for the fiscal year ended March 31, 2020.
8
C. Summary of financial position for the fiscal year under review Assets and liabilities, and net assets Total assets at the end of the fiscal year under review were ¥1,740.7 billion, up ¥76.2 billion from the end of the previous fiscal year. The items with the most significant increases were cash and deposits, up ¥52.2 billion, notes and accounts receivable – trade, up ¥26.1 billion and investments and other assets including investments in capital, up ¥18.6 billion. The item with the most significant decrease was investment securities, down ¥54.4 billion. Total liabilities were ¥1,387.0 billion, up ¥104.1 billion from the end of the previous fiscal year. The items with the most significant increases were short-term loans payable, up ¥73.8 billion and commercial papers, ¥56.0 billion. The item with the most significant decreases was notes and accounts payable - trade, down ¥27.4 billion. The balance on interest-bearing liabilities, including lease obligations, was ¥488.1 billion, up ¥133.0 billion from the end of the previous fiscal year. Net assets were ¥353.7 billion, down ¥27.9 billion compared with the end of the previous fiscal year. This decrease of ¥27.9 billion included decreases by repurchase of treasury shares of ¥14.8 billion and dividends of surplus of ¥10.8 billion, also of profit attributable to owners of parent of ¥12.8 billion. As a result of the above, the ratio of equity to total assets decreased from 21.0% at the end of the previous fiscal year to 18.7%.
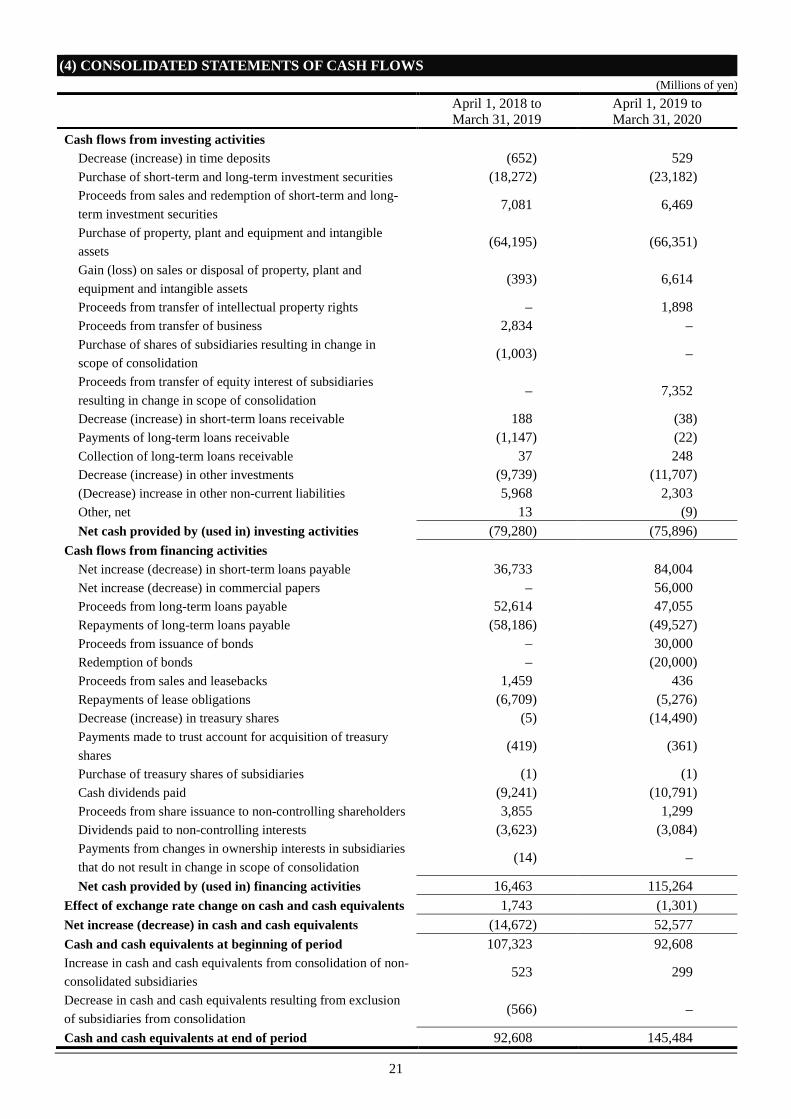
Cash flows At the end of the fiscal year under review, the outstanding balance of cash and cash equivalents (hereinafter, “cash”) was ¥145.4 billion, up ¥52.8 billion from the end of the previous fiscal year. This was mainly due to securing sufficient liquidity in order to cope with the impact of the spread of COVID-19. Net cash provided by operating activities was ¥14.5 billion. This was due mainly to profit excluding the impact of items such as non-cash expenses including depreciation and share of loss of entities accounted for using equity method, in spite of an increase in notes and accounts receivable - trade and a decrease of notes and accounts payable - trade. Net cash used in investing activities was ¥75.8 billion. This was due mainly to purchase of property, plant and equipment and intangible assets of ¥66.3 billion and purchase of short-term and long-term investment securities of ¥23.1 billion. Net cash provided by financing activities was ¥115.2 billion. This was due mainly to increases in short-term loans payable of ¥84.0 billion and commercial papers of ¥56.0 billion, which were prepared for the deterioration of the business environment caused by the spread of COVID-19.
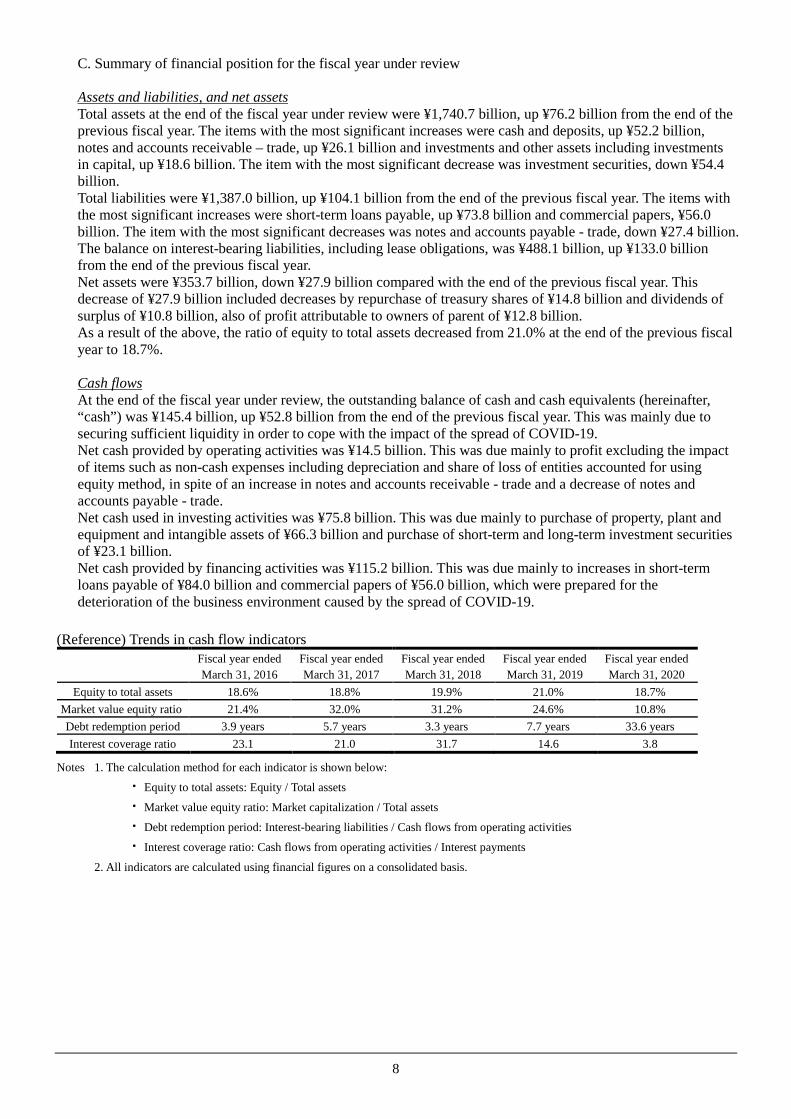
(Reference) Trends in cash flow indicators
Fiscal year ended March 31, 2016
Fiscal year ended March 31, 2017
Fiscal year ended March 31, 2018
Fiscal year ended March 31, 2019
Fiscal year ended March 31, 2020
Equity to total assets 18.6% 18.8% 19.9% 21.0% 18.7% Market value equity ratio 21.4% 32.0% 31.2% 24.6% 10.8% Debt redemption period 3.9 years 5.7 years 3.3 years 7.7 years 33.6 years Interest coverage ratio 23.1 21.0 31.7 14.6 3.8
Notes 1. The calculation method for each indicator is shown below:
・ Equity to total assets: Equity / Total assets
・ Market value equity ratio: Market capitalization / Total assets
2. All indicators are calculated using financial figures on a consolidated basis.
9
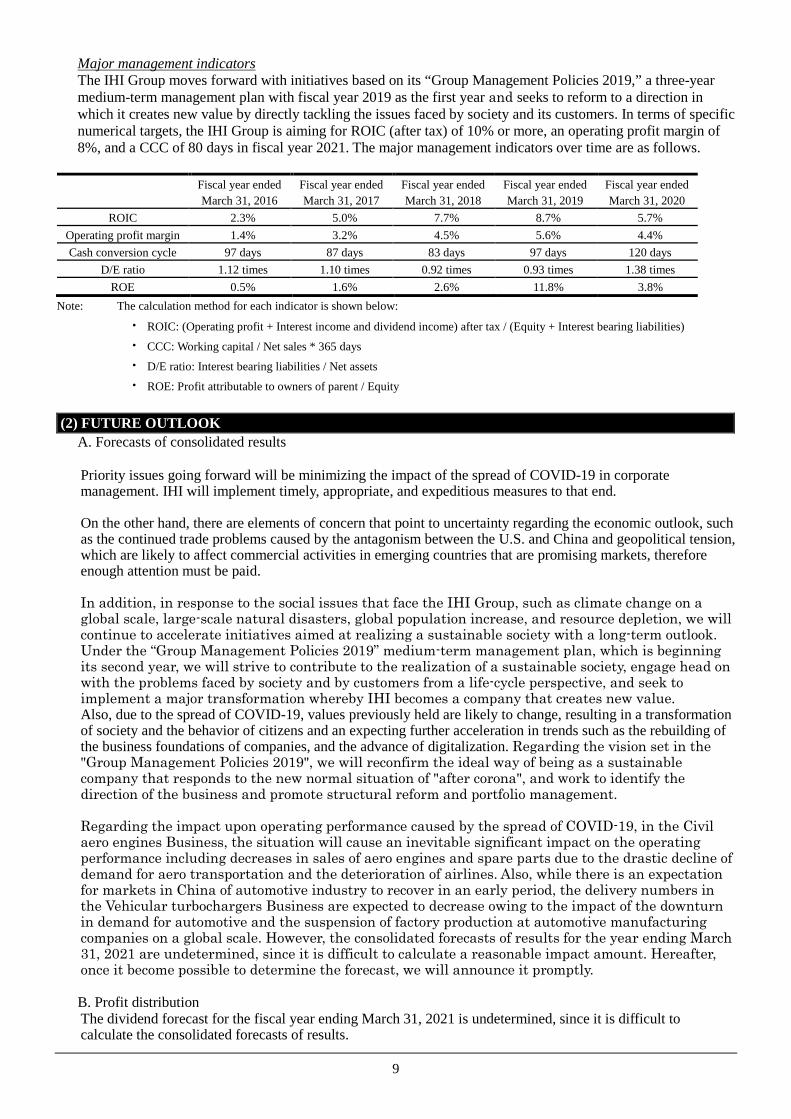
Major management indicators The IHI Group moves forward with initiatives based on its “Group Management Policies 2019,” a three-year medium-term management plan with fiscal year 2019 as the first year and seeks to reform to a direction in which it creates new value by directly tackling the issues faced by society and its customers. In terms of specific numerical targets, the IHI Group is aiming for ROIC (after tax) of 10% or more, an operating profit margin of 8%, and a CCC of 80 days in fiscal year 2021. The major management indicators over time are as follows.
Fiscal year ended March 31, 2016
Fiscal year ended March 31, 2017
Fiscal year ended March 31, 2018
Fiscal year ended March 31, 2019
Fiscal year ended March 31, 2020
ROIC 2.3% 5.0% 7.7% 8.7% 5.7% Operating profit margin 1.4% 3.2% 4.5% 5.6% 4.4% Cash conversion cycle 97 days 87 days 83 days 97 days 120 days
D/E ratio 1.12 times 1.10 times 0.92 times 0.93 times 1.38 times ROE 0.5% 1.6% 2.6% 11.8% 3.8%
Note: The calculation method for each indicator is shown below:
・ ROIC: (Operating profit + Interest income and dividend income) after tax / (Equity + Interest bearing liabilities)
・ CCC: Working capital / Net sales * 365 days
・ D/E ratio: Interest bearing liabilities / Net assets
・ ROE: Profit attributable to owners of parent / Equity
(2) FUTURE OUTLOOK
A. Forecasts of consolidated results Priority issues going forward will be minimizing the impact of the spread of COVID-19 in corporate management. IHI will implement timely, appropriate, and expeditious measures to that end. On the other hand, there are elements of concern that point to uncertainty regarding the economic outlook, such as the continued trade problems caused by the antagonism between the U.S. and China and geopolitical tension, which are likely to affect commercial activities in emerging countries that are promising markets, therefore enough attention must be paid. In addition, in response to the social issues that face the IHI Group, such as climate change on a global scale, large-scale natural disasters, global population increase, and resource depletion, we will continue to accelerate initiatives aimed at realizing a sustainable society with a long-term outlook. Under the “Group Management Policies 2019” medium-term management plan, which is beginning its second year, we will strive to contribute to the realization of a sustainable society, engage head on with the problems faced by society and by customers from a life-cycle perspective, and seek to implement a major transformation whereby IHI becomes a company that creates new value. Also, due to the spread of COVID-19, values previously held are likely to change, resulting in a transformation of society and the behavior of citizens and an expecting further acceleration in trends such as the rebuilding of the business foundations of companies, and the advance of digitalization. Regarding the vision set in the "Group Management Policies 2019", we will reconfirm the ideal way of being as a sustainable company that responds to the new normal situation of "after corona", and work to identify the direction of the business and promote structural reform and portfolio management. Regarding the impact upon operating performance caused by the spread of COVID-19, in the Civil aero engines Business, the situation will cause an inevitable significant impact on the operating performance including decreases in sales of aero engines and spare parts due to the drastic decline of demand for aero transportation and the deterioration of airlines. Also, while there is an expectation for markets in China of automotive industry to recover in an early period, the delivery numbers in the Vehicular turbochargers Business are expected to decrease owing to the impact of the downturn in demand for automotive and the suspension of factory production at automotive manufacturing companies on a global scale. However, the consolidated forecasts of results for the year ending March 31, 2021 are undetermined, since it is difficult to calculate a reasonable impact amount. Hereafter, once it become possible to determine the forecast, we will announce it promptly. B. Profit distribution The dividend forecast for the fiscal year ending March 31, 2021 is undetermined, since it is difficult to calculate the consolidated forecasts of results.
10
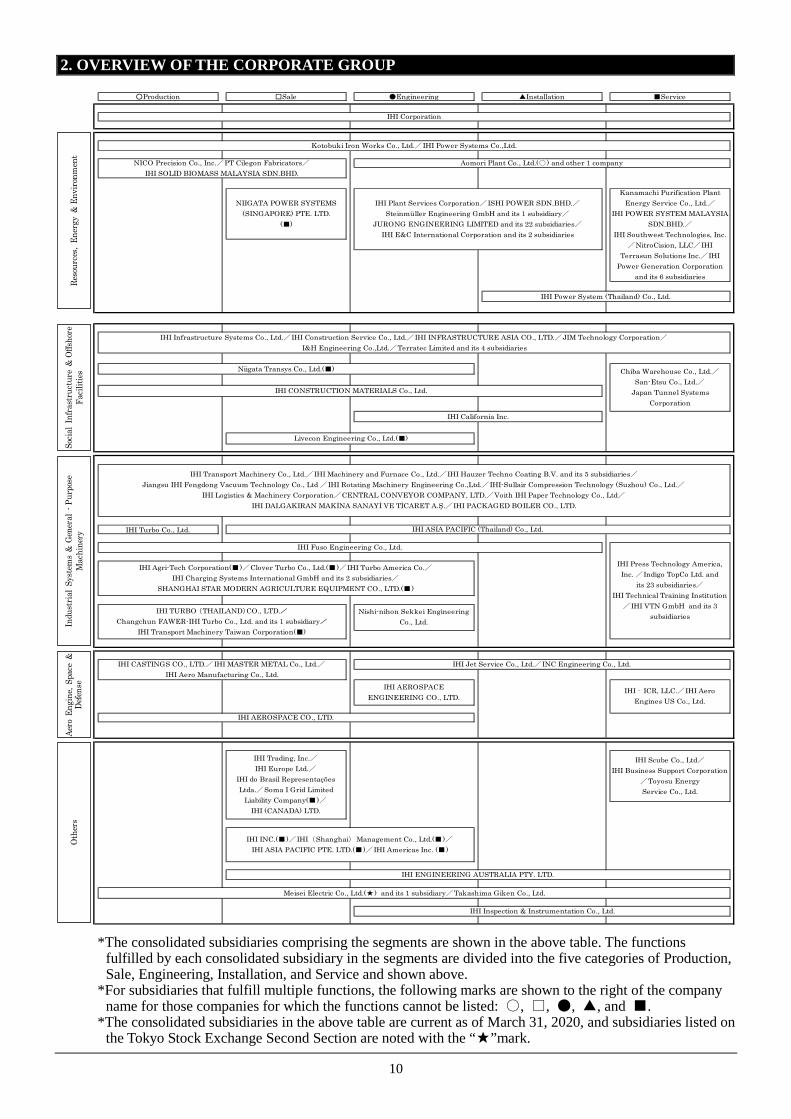
2. OVERVIEW OF THE CORPORATE GROUP
*The consolidated subsidiaries comprising the segments are shown in the above table. The functions
fulfilled by each consolidated subsidiary in the segments are divided into the five categories of Production, Sale, Engineering, Installation, and Service and shown above.
*For subsidiaries that fulfill multiple functions, the following marks are shown to the right of the company name for those companies for which the functions cannot be listed: ○, □, ●, ▲, and ■.
*The consolidated subsidiaries in the above table are current as of March 31, 2020, and subsidiaries listed on the Tokyo Stock Exchange Second Section are noted with the “★”mark.
IHI TURBO (THAILAND)CO., LTD./Changchun FAWER-IHI Turbo Co., Ltd. and its 1 subsidiary/
IHI Transport Machinery Taiwan Corporation(■)
IHI INC.(■)/IHI(Shanghai)Management Co., Ltd.(■)/IHI ASIA PACIFIC PTE. LTD.(■)/IHI Americas Inc. (■)
IHI CONSTRUCTION MATERIALS Co., Ltd.
Chiba Warehouse Co., Ltd./San-Etsu Co., Ltd./
Japan Tunnel SystemsCorporation
IHI AEROSPACEENGINEERING CO., LTD.
Niigata Transys Co., Ltd.(■)
IHI Infrastructure Systems Co., Ltd./IHI Construction Service Co., Ltd./IHI INFRASTRUCTURE ASIA CO., LTD./JIM Technology Corporation/I&H Engineering Co.,Ltd./Terratec Limited and its 4 subsidiaries
IHI Corporation
Kotobuki Iron Works Co., Ltd./IHI Power Systems Co.,Ltd.
NICO Precision Co., Inc./PT Cilegon Fabricators/IHI SOLID BIOMASS MALAYSIA SDN.BHD.
NIIGATA POWER SYSTEMS(SINGAPORE) PTE. LTD.
(■)
Kanamachi Purification PlantEnergy Service Co., Ltd./
IHI Jet Service Co., Ltd./INC Engineering Co., Ltd.
IHI Fuso Engineering Co., Ltd.
IHI Press Technology America,Inc. /Indigo TopCo Ltd. and
its 23 subsidiaries/IHI Technical Training Institution
/IHI VTN GmbH and its 3subsidiaries
IHI Agri-Tech Corporation(■)/Clover Turbo Co., Ltd.(■)/IHI Turbo America Co./IHI Charging Systems International GmbH and its 2 subsidiaries/
SHANGHAI STAR MODERN AGRICULTURE EQUIPMENT CO., LTD.(■)
IHI ASIA PACIFIC (Thailand) Co., Ltd.
Nishi-nihon Sekkei EngineeringCo., Ltd.
IHI‐ICR, LLC./IHI AeroEngines US Co., Ltd.
IHI Scube Co., Ltd/IHI Business Support Corporation
/Toyosu EnergyService Co., Ltd.
IHI Inspection & Instrumentation Co., Ltd.
IHI AEROSPACE CO., LTD.
IHI Trading, Inc./IHI Europe Ltd./
IHI do Brasil RepresentaçõesLtda./Soma I Grid Limited
Liability Company(■)/IHI (CANADA) LTD.
IHI ENGINEERING AUSTRALIA PTY. LTD.
Meisei Electric Co., Ltd.(★) and its 1 subsidiary/Takashima Giken Co., Ltd.
Socia
l Inf
rast
ruct
ure
& O
ffsho
re
Facil
ities
Indu
stria
l Sys
tem
s &
Gen
eral
-Pu
rpos
e M
achi
nery
Aero
Eng
ine,
Spac
e &
De
fense
Othe
rsRe
sour
ces,
Ener
gy &
Env
ironm
ent
11
3. SELECTION OF ACCOUNTING STANDARDS The IHI Group prepares its consolidated financial statements in accordance with the generally accepted accounting principles and accounting standards in Japan (Japanese GAAP). The IHI Group is preparing to adopt international financial reporting standards (IFRS) from the point of view of improving the quality of the Group’s corporate management and strengthening the Group’s corporate governance, while receiving advice from external professionals.
12
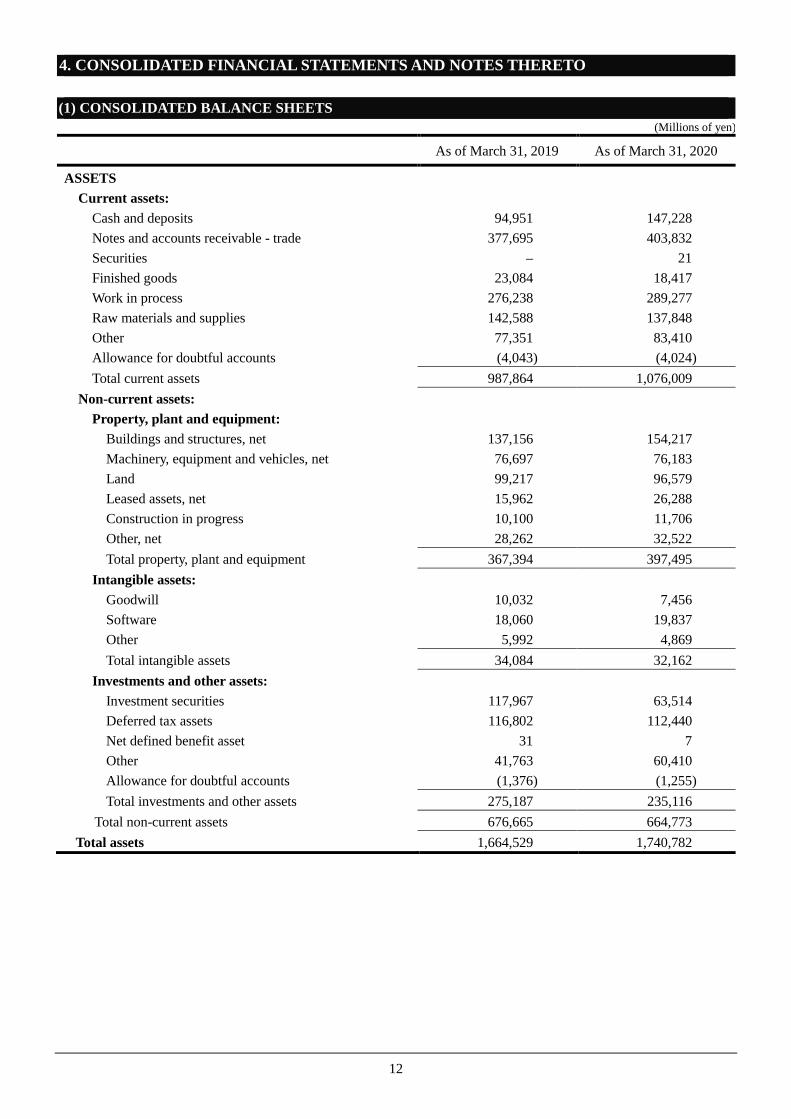
4. CONSOLIDATED FINANCIAL STATEMENTS AND NOTES THERETO
(1) CONSOLIDATED BALANCE SHEETS (Millions of yen)
As of March 31, 2019 As of March 31, 2020
ASSETS Current assets:
Cash and deposits 94,951 147,228 Notes and accounts receivable - trade 377,695 403,832 Securities – 21 Finished goods 23,084 18,417 Work in process 276,238 289,277 Raw materials and supplies 142,588 137,848 Other 77,351 83,410 Allowance for doubtful accounts (4,043) (4,024) Total current assets 987,864 1,076,009
Non-current assets: Property, plant and equipment:
Buildings and structures, net 137,156 154,217 Machinery, equipment and vehicles, net 76,697 76,183 Land 99,217 96,579 Leased assets, net 15,962 26,288 Construction in progress 10,100 11,706 Other, net 28,262 32,522 Total property, plant and equipment 367,394 397,495
Intangible assets: Goodwill 10,032 7,456 Software 18,060 19,837 Other 5,992 4,869 Total intangible assets 34,084 32,162
Investments and other assets: Investment securities 117,967 63,514 Deferred tax assets 116,802 112,440 Net defined benefit asset 31 7 Other 41,763 60,410 Allowance for doubtful accounts (1,376) (1,255) Total investments and other assets 275,187 235,116
Total non-current assets 676,665 664,773 Total assets 1,664,529 1,740,782
13
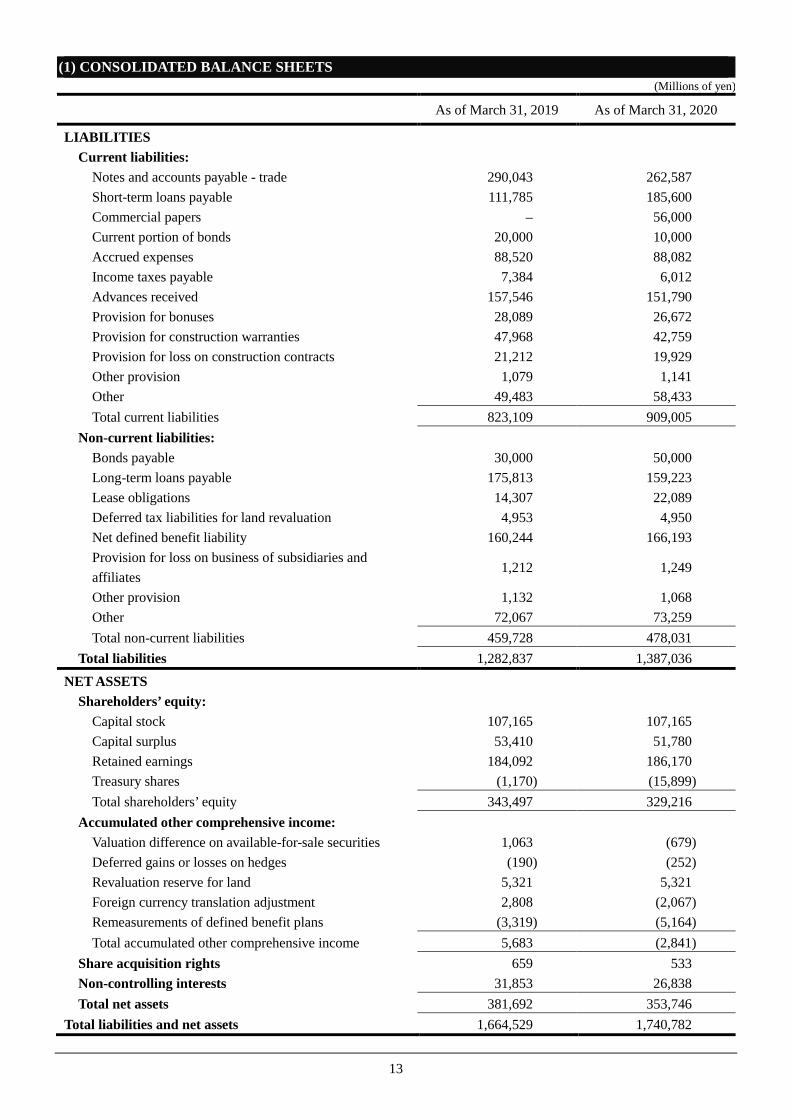
(1) CONSOLIDATED BALANCE SHEETS (Millions of yen)
As of March 31, 2019 As of March 31, 2020
LIABILITIES Current liabilities:
Notes and accounts payable - trade 290,043 262,587 Short-term loans payable 111,785 185,600 Commercial papers – 56,000 Current portion of bonds 20,000 10,000 Accrued expenses 88,520 88,082 Income taxes payable 7,384 6,012 Advances received 157,546 151,790 Provision for bonuses 28,089 26,672 Provision for construction warranties 47,968 42,759 Provision for loss on construction contracts 21,212 19,929 Other provision 1,079 1,141 Other 49,483 58,433 Total current liabilities 823,109 909,005
Non-current liabilities: Bonds payable 30,000 50,000 Long-term loans payable 175,813 159,223 Lease obligations 14,307 22,089 Deferred tax liabilities for land revaluation 4,953 4,950 Net defined benefit liability 160,244 166,193 Provision for loss on business of subsidiaries and affiliates
1,212 1,249
Other provision 1,132 1,068 Other 72,067 73,259 Total non-current liabilities 459,728 478,031
Total liabilities 1,282,837 1,387,036 NET ASSETS
Shareholders’ equity: Capital stock 107,165 107,165 Capital surplus 53,410 51,780 Retained earnings 184,092 186,170 Treasury shares (1,170) (15,899) Total shareholders’ equity 343,497 329,216
Accumulated other comprehensive income: Valuation difference on available-for-sale securities 1,063 (679) Deferred gains or losses on hedges (190) (252) Revaluation reserve for land 5,321 5,321 Foreign currency translation adjustment 2,808 (2,067) Remeasurements of defined benefit plans (3,319) (5,164) Total accumulated other comprehensive income 5,683 (2,841)
Share acquisition rights 659 533 Non-controlling interests 31,853 26,838 Total net assets 381,692 353,746
Total liabilities and net assets 1,664,529 1,740,782
14
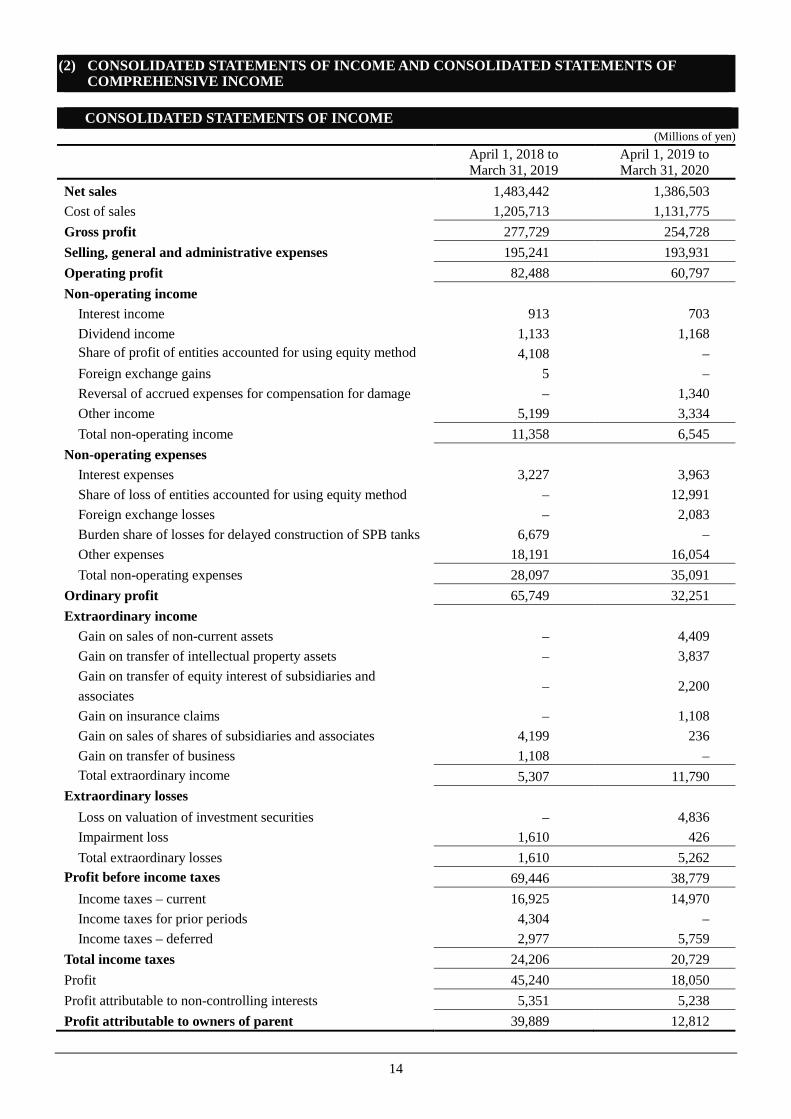
(2) CONSOLIDATED STATEMENTS OF INCOME AND CONSOLIDATED STATEMENTS OF COMPREHENSIVE INCOME
CONSOLIDATED STATEMENTS OF INCOME (Millions of yen)
April 1, 2018 to April 1, 2019 to March 31, 2019 March 31, 2020
Net sales 1,483,442 1,386,503 Cost of sales 1,205,713 1,131,775 Gross profit 277,729 254,728 Selling, general and administrative expenses 195,241 193,931 Operating profit 82,488 60,797 Non-operating income
Interest income 913 703 Dividend income 1,133 1,168 Share of profit of entities accounted for using equity method 4,108 – Foreign exchange gains 5 – Reversal of accrued expenses for compensation for damage – 1,340 Other income 5,199 3,334 Total non-operating income 11,358 6,545
Non-operating expenses Interest expenses 3,227 3,963 Share of loss of entities accounted for using equity method – 12,991 Foreign exchange losses – 2,083 Burden share of losses for delayed construction of SPB tanks 6,679 – Other expenses 18,191 16,054 Total non-operating expenses 28,097 35,091
Ordinary profit 65,749 32,251 Extraordinary income
Gain on sales of non-current assets – 4,409 Gain on transfer of intellectual property assets – 3,837 Gain on transfer of equity interest of subsidiaries and associates
– 2,200
Gain on insurance claims – 1,108 Gain on sales of shares of subsidiaries and associates 4,199 236 Gain on transfer of business 1,108 – Total extraordinary income 5,307 11,790
Extraordinary losses Loss on valuation of investment securities – 4,836 Impairment loss 1,610 426 Total extraordinary losses 1,610 5,262
Profit before income taxes 69,446 38,779 Income taxes – current 16,925 14,970 Income taxes for prior periods 4,304 – Income taxes – deferred 2,977 5,759
Total income taxes 24,206 20,729 Profit 45,240 18,050 Profit attributable to non-controlling interests 5,351 5,238 Profit attributable to owners of parent 39,889 12,812
15
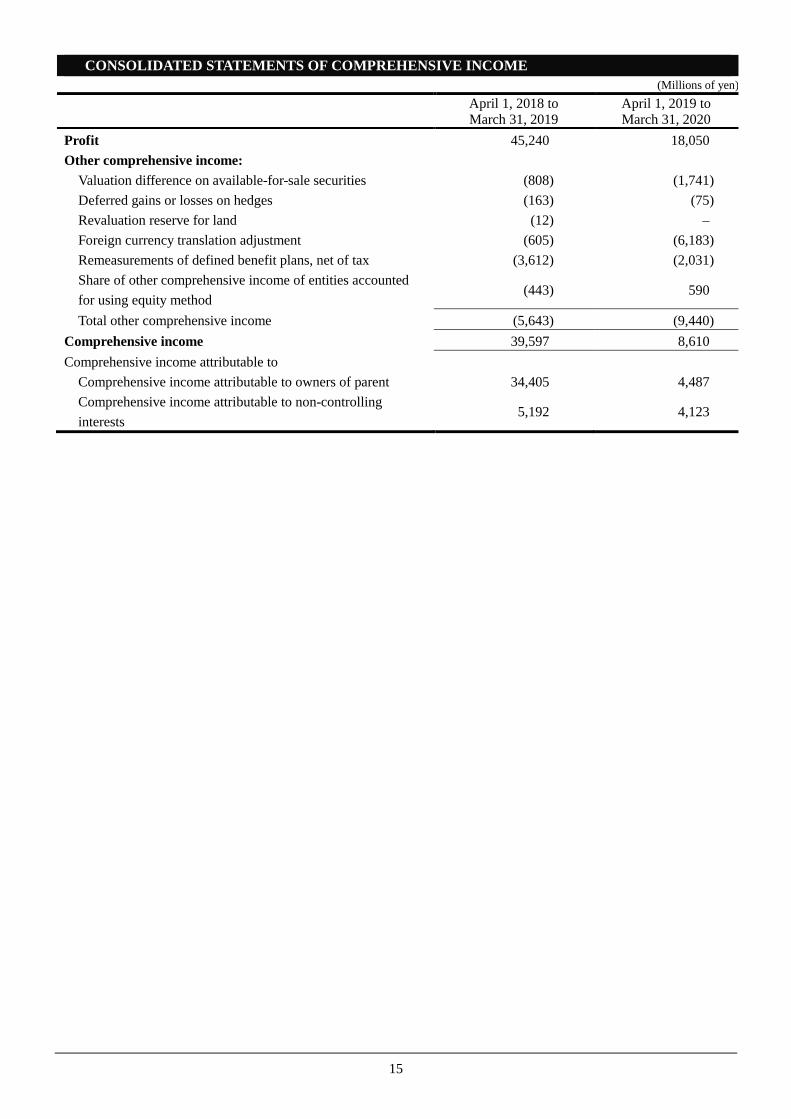
CONSOLIDATED STATEMENTS OF COMPREHENSIVE INCOME (Millions of yen)
April 1, 2018 to April 1, 2019 to March 31, 2019 March 31, 2020
Profit 45,240 18,050 Other comprehensive income:
Valuation difference on available-for-sale securities (808) (1,741) Deferred gains or losses on hedges (163) (75) Revaluation reserve for land (12) – Foreign currency translation adjustment (605) (6,183) Remeasurements of defined benefit plans, net of tax (3,612) (2,031) Share of other comprehensive income of entities accounted for using equity method
(443) 590
Total other comprehensive income (5,643) (9,440) Comprehensive income 39,597 8,610 Comprehensive income attributable to
Comprehensive income attributable to owners of parent 34,405 4,487 Comprehensive income attributable to non-controlling interests
5,192 4,123
16
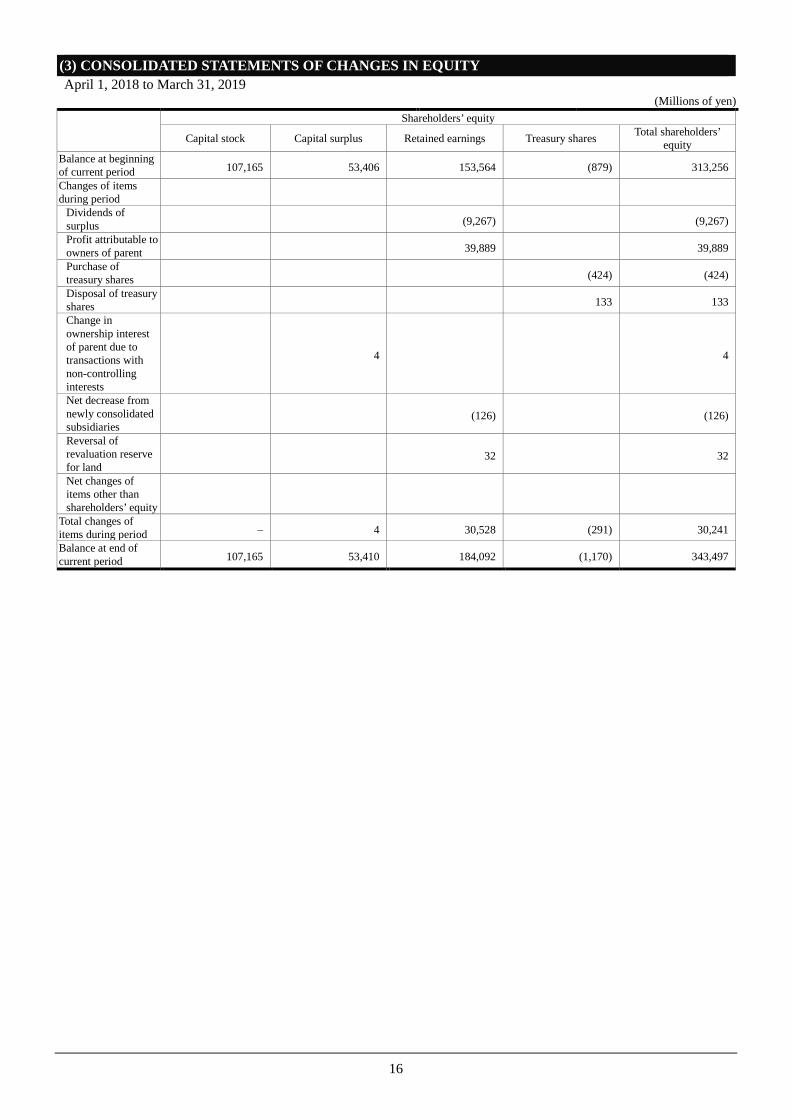
(3) CONSOLIDATED STATEMENTS OF CHANGES IN EQUITY April 1, 2018 to March 31, 2019
(Millions of yen)
Shareholders’ equity
Capital stock Capital surplus Retained earnings Treasury shares Total shareholders’ equity
Balance at beginning of current period 107,165 53,406 153,564 (879) 313,256 Changes of items during period
Dividends of surplus (9,267) (9,267) Profit attributable to owners of parent 39,889 39,889 Purchase of treasury shares (424) (424) Disposal of treasury shares 133 133 Change in ownership interest of parent due to transactions with non-controlling interests
4 4
Net decrease from newly consolidated subsidiaries
(126) (126)
Reversal of revaluation reserve for land
32 32
Net changes of items other than shareholders’ equity
Total changes of items during period – 4 30,528 (291) 30,241 Balance at end of current period 107,165 53,410 184,092 (1,170) 343,497
17
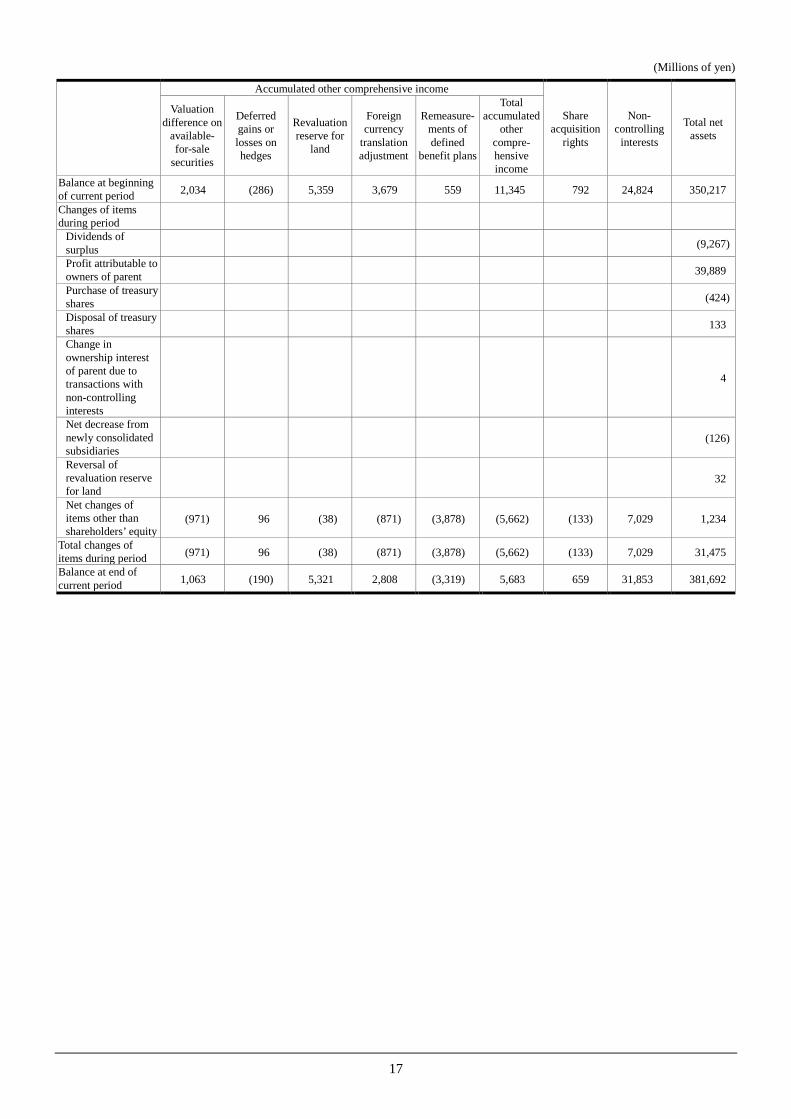
(Millions of yen)
Accumulated other comprehensive income
Share acquisition
rights
Non-controlling
interests
Total net assets
Valuation difference on
available-for-sale
securities
Deferred gains or losses on hedges
Revaluation reserve for
land
Foreign currency
translation adjustment
Remeasure-ments of defined
benefit plans
Total accumulated
other compre-hensive income
Balance at beginning of current period 2,034 (286) 5,359 3,679 559 11,345 792 24,824 350,217
Changes of items during period
Dividends of surplus (9,267)
Profit attributable to owners of parent 39,889
Purchase of treasury shares (424)
Disposal of treasury shares 133
Change in ownership interest of parent due to transactions with non-controlling interests
4
Net decrease from newly consolidated subsidiaries
(126)
Reversal of revaluation reserve for land
32
Net changes of items other than shareholders’ equity
Total changes of items during period (971) 96 (38) (871) (3,878) (5,662) (133) 7,029 31,475
Balance at end of current period 1,063 (190) 5,321 2,808 (3,319) 5,683 659 31,853 381,692
18
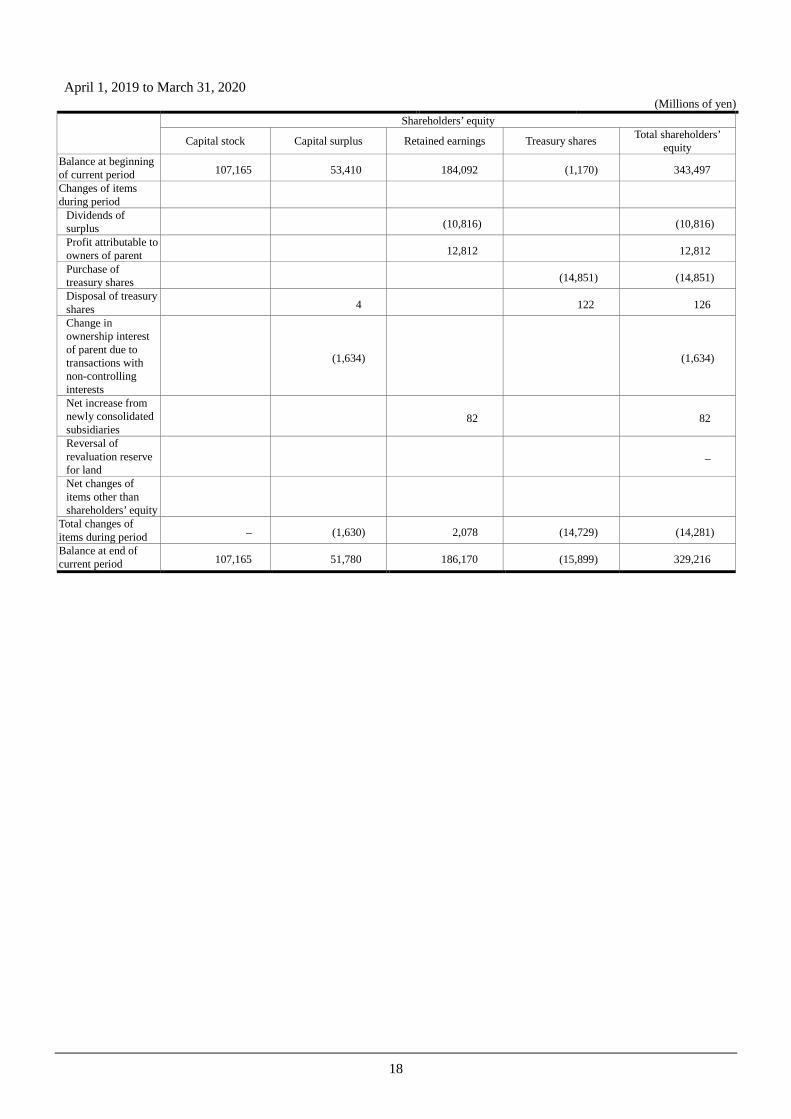
April 1, 2019 to March 31, 2020
(Millions of yen)
Shareholders’ equity
Capital stock Capital surplus Retained earnings Treasury shares Total shareholders’ equity
Balance at beginning of current period 107,165 53,410 184,092 (1,170) 343,497 Changes of items during period
Dividends of surplus (10,816) (10,816) Profit attributable to owners of parent 12,812 12,812 Purchase of treasury shares (14,851) (14,851) Disposal of treasury shares 4 122 126 Change in ownership interest of parent due to transactions with non-controlling interests
(1,634) (1,634)
Net increase from newly consolidated subsidiaries
82 82
Reversal of revaluation reserve for land
–
Net changes of items other than shareholders’ equity
Total changes of items during period – (1,630) 2,078 (14,729) (14,281) Balance at end of current period 107,165 51,780 186,170 (15,899) 329,216
19
(Millions of yen)
Accumulated other comprehensive income
Share acquisition
rights
Non-controlling
interests
Total net assets
Valuation difference on
available-for-sale
securities
Deferred gains or losses on hedges
Revaluation reserve for
land
Foreign currency
translation adjustment
Remeasure-ments of defined
benefit plans
Total accumulated
other compre-hensive income
Balance at beginning of current period 1,063 (190) 5,321 2,808 (3,319) 5,683 659 31,853 381,692
Changes of items during period
Dividends of surplus (10,816)
Profit attributable to owners of parent 12,812
Purchase of treasury shares (14,851)
Disposal of treasury shares 126
Change in ownership interest of parent due to transactions with non-controlling interests
(1,634)
Net increase from newly consolidated subsidiaries
82
Reversal of revaluation reserve for land
–
Net changes of items other than shareholders’ equity
Total changes of items during period (1,742) (62) – (4,875) (1,845) (8,524) (126) (5,015) (27,946)
Balance at end of current period (679) (252) 5,321 (2,067) (5,164) (2,841) 533 26,838 353,746
20
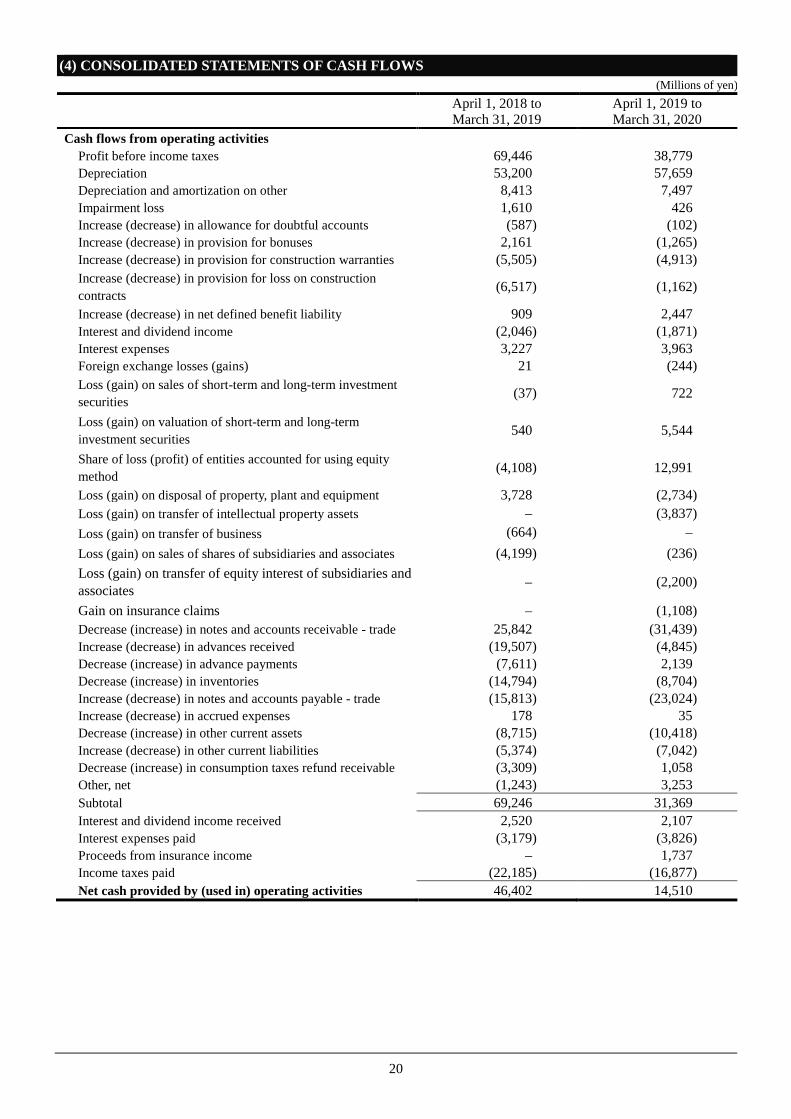
(4) CONSOLIDATED STATEMENTS OF CASH FLOWS (Millions of yen)
April 1, 2018 to April 1, 2019 to March 31, 2019 March 31, 2020
Cash flows from operating activities Profit before income taxes 69,446 38,779 Depreciation 53,200 57,659 Depreciation and amortization on other 8,413 7,497 Impairment loss 1,610 426 Increase (decrease) in allowance for doubtful accounts (587) (102) Increase (decrease) in provision for bonuses 2,161 (1,265) Increase (decrease) in provision for construction warranties (5,505) (4,913) Increase (decrease) in provision for loss on construction contracts
(6,517) (1,162)
Increase (decrease) in net defined benefit liability 909 2,447 Interest and dividend income (2,046) (1,871) Interest expenses 3,227 3,963 Foreign exchange losses (gains) 21 (244) Loss (gain) on sales of short-term and long-term investment securities (37) 722
Loss (gain) on valuation of short-term and long-term investment securities
540 5,544
Share of loss (profit) of entities accounted for using equity method (4,108) 12,991
Loss (gain) on disposal of property, plant and equipment 3,728 (2,734) Loss (gain) on transfer of intellectual property assets – (3,837) Loss (gain) on transfer of business (664) – Loss (gain) on sales of shares of subsidiaries and associates (4,199) (236) Loss (gain) on transfer of equity interest of subsidiaries and associates
– (2,200)
Gain on insurance claims – (1,108) Decrease (increase) in notes and accounts receivable - trade 25,842 (31,439) Increase (decrease) in advances received (19,507) (4,845) Decrease (increase) in advance payments (7,611) 2,139 Decrease (increase) in inventories (14,794) (8,704) Increase (decrease) in notes and accounts payable - trade (15,813) (23,024) Increase (decrease) in accrued expenses 178 35 Decrease (increase) in other current assets (8,715) (10,418) Increase (decrease) in other current liabilities (5,374) (7,042) Decrease (increase) in consumption taxes refund receivable (3,309) 1,058 Other, net (1,243) 3,253 Subtotal 69,246 31,369 Interest and dividend income received 2,520 2,107 Interest expenses paid (3,179) (3,826) Proceeds from insurance income – 1,737 Income taxes paid (22,185) (16,877) Net cash provided by (used in) operating activities 46,402 14,510
21
(4) CONSOLIDATED STATEMENTS OF CASH FLOWS (Millions of yen)
April 1, 2018 to April 1, 2019 to March 31, 2019 March 31, 2020
Cash flows from investing activities Decrease (increase) in time deposits (652) 529 Purchase of short-term and long-term investment securities (18,272) (23,182) Proceeds from sales and redemption of short-term and long-term investment securities
7,081 6,469
Purchase of property, plant and equipment and intangible assets
(64,195) (66,351)
Gain (loss) on sales or disposal of property, plant and equipment and intangible assets
(393) 6,614
Proceeds from transfer of intellectual property rights – 1,898 Proceeds from transfer of business 2,834 – Purchase of shares of subsidiaries resulting in change in scope of consolidation
(1,003) –
Proceeds from transfer of equity interest of subsidiaries resulting in change in scope of consolidation
– 7,352
Decrease (increase) in short-term loans receivable 188 (38) Payments of long-term loans receivable (1,147) (22) Collection of long-term loans receivable 37 248 Decrease (increase) in other investments (9,739) (11,707) (Decrease) increase in other non-current liabilities 5,968 2,303 Other, net 13 (9) Net cash provided by (used in) investing activities (79,280) (75,896)
Cash flows from financing activities Net increase (decrease) in short-term loans payable 36,733 84,004 Net increase (decrease) in commercial papers – 56,000 Proceeds from long-term loans payable 52,614 47,055 Repayments of long-term loans payable (58,186) (49,527) Proceeds from issuance of bonds – 30,000 Redemption of bonds – (20,000) Proceeds from sales and leasebacks 1,459 436 Repayments of lease obligations (6,709) (5,276) Decrease (increase) in treasury shares (5) (14,490) Payments made to trust account for acquisition of treasury shares
(419) (361)
Purchase of treasury shares of subsidiaries (1) (1) Cash dividends paid (9,241) (10,791) Proceeds from share issuance to non-controlling shareholders 3,855 1,299 Dividends paid to non-controlling interests (3,623) (3,084) Payments from changes in ownership interests in subsidiaries that do not result in change in scope of consolidation
(14) –
Net cash provided by (used in) financing activities 16,463 115,264 Effect of exchange rate change on cash and cash equivalents 1,743 (1,301) Net increase (decrease) in cash and cash equivalents (14,672) 52,577 Cash and cash equivalents at beginning of period 107,323 92,608 Increase in cash and cash equivalents from consolidation of non-consolidated subsidiaries
523 299
Decrease in cash and cash equivalents resulting from exclusion of subsidiaries from consolidation
(566) –
Cash and cash equivalents at end of period 92,608 145,484
22
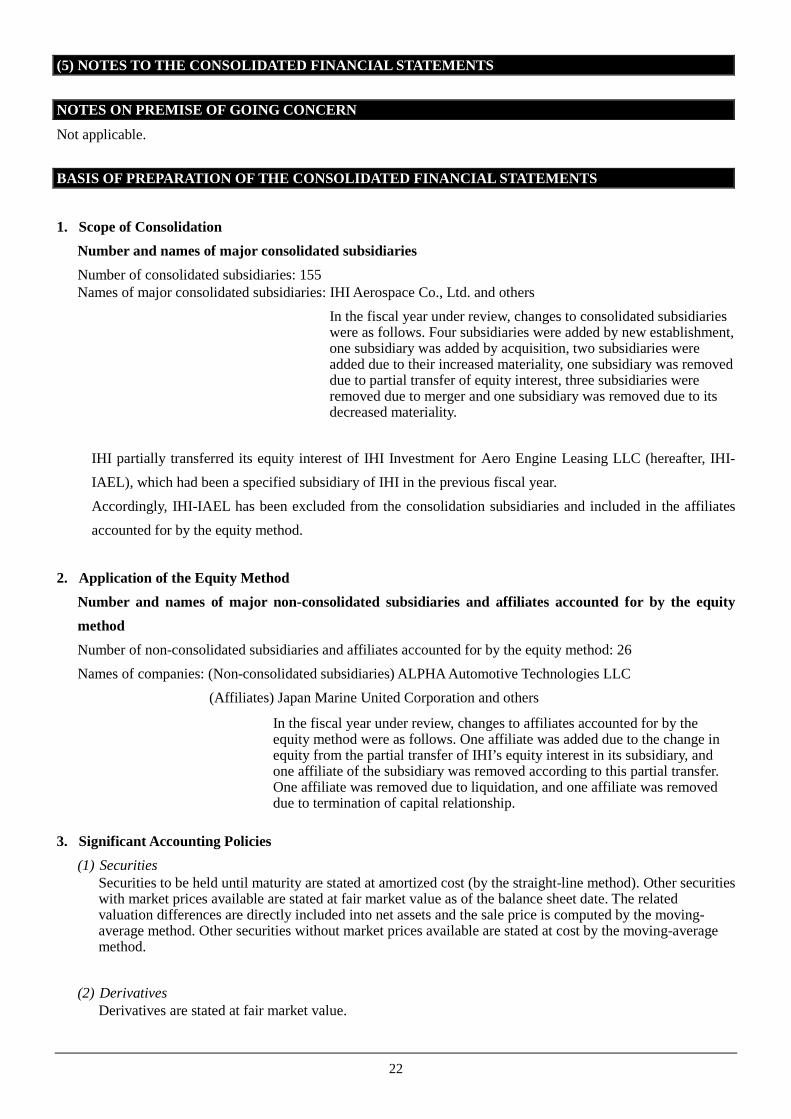
(5) NOTES TO THE CONSOLIDATED FINANCIAL STATEMENTS
NOTES ON PREMISE OF GOING CONCERN
Not applicable. BASIS OF PREPARATION OF THE CONSOLIDATED FINANCIAL STATEMENTS
1. Scope of Consolidation
Number and names of major consolidated subsidiaries Number of consolidated subsidiaries: 155 Names of major consolidated subsidiaries: IHI Aerospace Co., Ltd. and others
In the fiscal year under review, changes to consolidated subsidiaries were as follows. Four subsidiaries were added by new establishment, one subsidiary was added by acquisition, two subsidiaries were added due to their increased materiality, one subsidiary was removed due to partial transfer of equity interest, three subsidiaries were removed due to merger and one subsidiary was removed due to its decreased materiality.
IHI partially transferred its equity interest of IHI Investment for Aero Engine Leasing LLC (hereafter, IHI-IAEL), which had been a specified subsidiary of IHI in the previous fiscal year. Accordingly, IHI-IAEL has been excluded from the consolidation subsidiaries and included in the affiliates accounted for by the equity method.
2. Application of the Equity Method
Number and names of major non-consolidated subsidiaries and affiliates accounted for by the equity method Number of non-consolidated subsidiaries and affiliates accounted for by the equity method: 26 Names of companies: (Non-consolidated subsidiaries) ALPHA Automotive Technologies LLC
(Affiliates) Japan Marine United Corporation and others
In the fiscal year under review, changes to affiliates accounted for by the equity method were as follows. One affiliate was added due to the change in equity from the partial transfer of IHI’s equity interest in its subsidiary, and one affiliate of the subsidiary was removed according to this partial transfer. One affiliate was removed due to liquidation, and one affiliate was removed due to termination of capital relationship.
3. Significant Accounting Policies
(1) Securities Securities to be held until maturity are stated at amortized cost (by the straight-line method). Other securities with market prices available are stated at fair market value as of the balance sheet date. The related valuation differences are directly included into net assets and the sale price is computed by the moving-average method. Other securities without market prices available are stated at cost by the moving-average method.
(2) Derivatives
Derivatives are stated at fair market value.
23
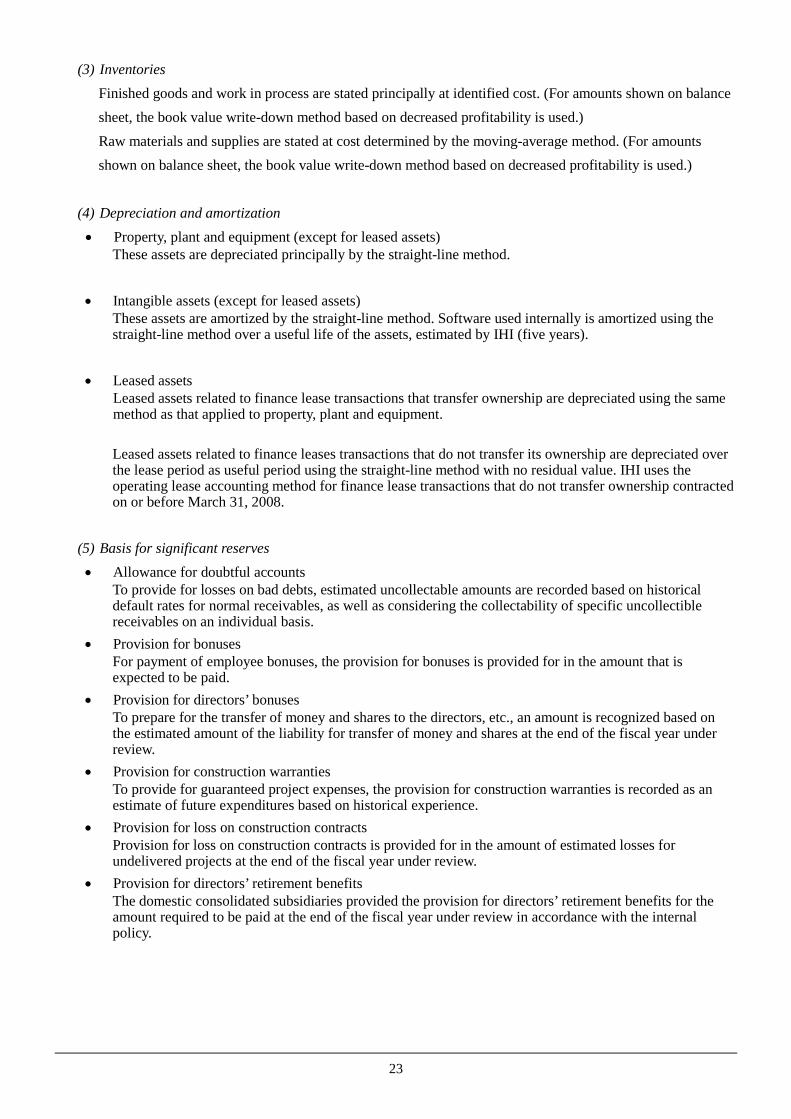
(3) Inventories Finished goods and work in process are stated principally at identified cost. (For amounts shown on balance sheet, the book value write-down method based on decreased profitability is used.) Raw materials and supplies are stated at cost determined by the moving-average method. (For amounts shown on balance sheet, the book value write-down method based on decreased profitability is used.)
(4) Depreciation and amortization • Property, plant and equipment (except for leased assets)
These assets are depreciated principally by the straight-line method. • Intangible assets (except for leased assets)
These assets are amortized by the straight-line method. Software used internally is amortized using the straight-line method over a useful life of the assets, estimated by IHI (five years).
• Leased assets
Leased assets related to finance lease transactions that transfer ownership are depreciated using the same method as that applied to property, plant and equipment.
Leased assets related to finance leases transactions that do not transfer its ownership are depreciated over the lease period as useful period using the straight-line method with no residual value. IHI uses the operating lease accounting method for finance lease transactions that do not transfer ownership contracted on or before March 31, 2008.
(5) Basis for significant reserves • Allowance for doubtful accounts
To provide for losses on bad debts, estimated uncollectable amounts are recorded based on historical default rates for normal receivables, as well as considering the collectability of specific uncollectible receivables on an individual basis.
• Provision for bonuses For payment of employee bonuses, the provision for bonuses is provided for in the amount that is expected to be paid.
• Provision for directors’ bonuses To prepare for the transfer of money and shares to the directors, etc., an amount is recognized based on the estimated amount of the liability for transfer of money and shares at the end of the fiscal year under review.
• Provision for construction warranties To provide for guaranteed project expenses, the provision for construction warranties is recorded as an estimate of future expenditures based on historical experience.
• Provision for loss on construction contracts Provision for loss on construction contracts is provided for in the amount of estimated losses for undelivered projects at the end of the fiscal year under review.
• Provision for directors’ retirement benefits The domestic consolidated subsidiaries provided the provision for directors’ retirement benefits for the amount required to be paid at the end of the fiscal year under review in accordance with the internal policy.
24
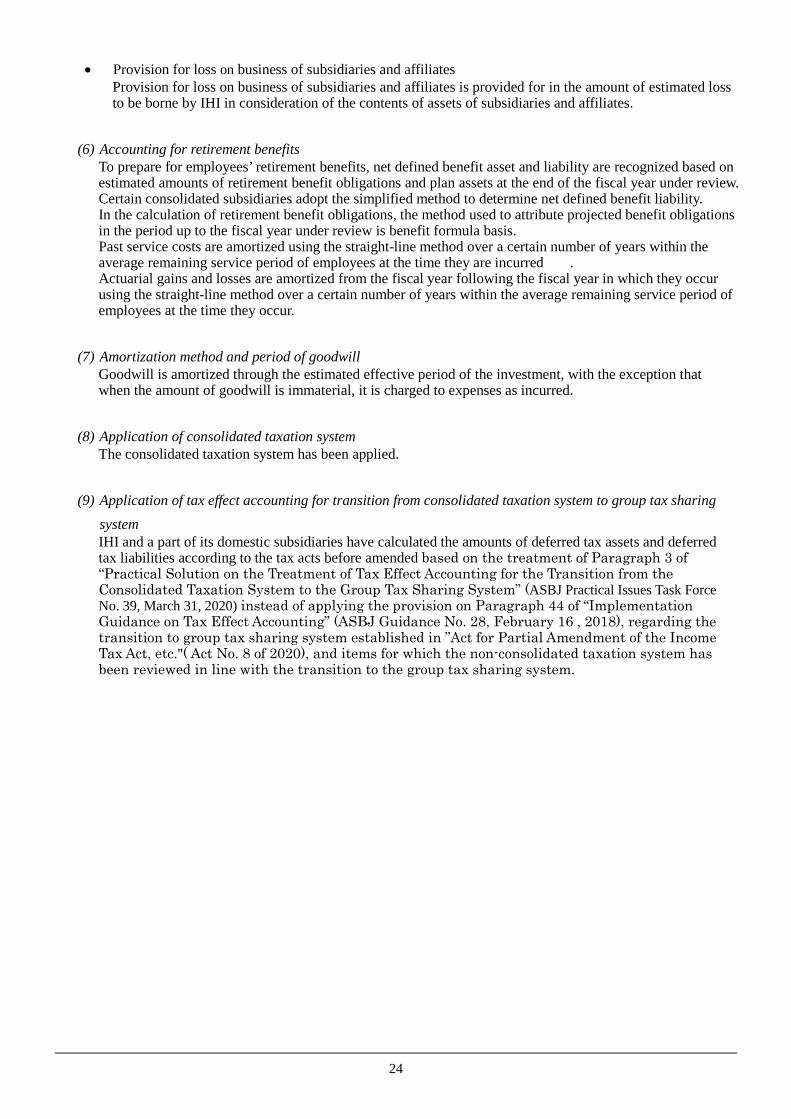
• Provision for loss on business of subsidiaries and affiliates Provision for loss on business of subsidiaries and affiliates is provided for in the amount of estimated loss to be borne by IHI in consideration of the contents of assets of subsidiaries and affiliates.
(6) Accounting for retirement benefits
To prepare for employees’ retirement benefits, net defined benefit asset and liability are recognized based on estimated amounts of retirement benefit obligations and plan assets at the end of the fiscal year under review. Certain consolidated subsidiaries adopt the simplified method to determine net defined benefit liability. In the calculation of retirement benefit obligations, the method used to attribute projected benefit obligations in the period up to the fiscal year under review is benefit formula basis. Past service costs are amortized using the straight-line method over a certain number of years within the average remaining service period of employees at the time they are incurred . Actuarial gains and losses are amortized from the fiscal year following the fiscal year in which they occur using the straight-line method over a certain number of years within the average remaining service period of employees at the time they occur.
(7) Amortization method and period of goodwill
Goodwill is amortized through the estimated effective period of the investment, with the exception that when the amount of goodwill is immaterial, it is charged to expenses as incurred.
(8) Application of consolidated taxation system
The consolidated taxation system has been applied.
(9) Application of tax effect accounting for transition from consolidated taxation system to group tax sharing system IHI and a part of its domestic subsidiaries have calculated the amounts of deferred tax assets and deferred tax liabilities according to the tax acts before amended based on the treatment of Paragraph 3 of “Practical Solution on the Treatment of Tax Effect Accounting for the Transition from the Consolidated Taxation System to the Group Tax Sharing System” (ASBJ Practical Issues Task Force No. 39, March 31, 2020) instead of applying the provision on Paragraph 44 of “Implementation Guidance on Tax Effect Accounting” (ASBJ Guidance No. 28, February 16 , 2018), regarding the transition to group tax sharing system established in ”Act for Partial Amendment of the Income Tax Act, etc."( Act No. 8 of 2020), and items for which the non-consolidated taxation system has been reviewed in line with the transition to the group tax sharing system.
25
CHANGES IN ACCOUNTING POLICIES
Application of Practical Solution on Unification of Accounting Policies Applied to Foreign Subsidiaries, etc. for Consolidated Financial Statements, etc. IHI has applied the “Practical Solution on Unification of Accounting Policies Applied to Foreign Subsidiaries, etc. for Consolidated Financial Statements” (ASBJ Practical Issues Task Force No. 18, September 14, 2018) and “Practical Solution on Unification of Accounting Policies Applied to Associates Accounted for Using Equity Method” (ASBJ Practical Issues Task Force No. 24, September 14, 2018) effective from the beginning of the fiscal year under review. The resulting effect on consolidated financial statements for the fiscal year under review is nothing.
CHANGES IN PRESENTATION
CONSOLIDATED STATEMENTS OF INCOME “Expenses for delayed delivery”, which was presented separately under “Non-operating expenses” in the previous fiscal year, was included in “Other expenses” under “Non-operating expenses” in the fiscal year under review since its materiality was diminished. As a result, ¥838 million presented as “Expenses for delayed delivery” under “Non-operating expenses” in the previous fiscal year was reclassified as “Other expenses” under “Non-operating expenses.”
ADDITIONAL INFORMATION
Recognition of revenue on engine programs Regarding the engine programs in which IHI participates, we record the revenue amount recorded by its main partners toward airlines etc. in net sales according to the participation rate. Although previously, the net sales were recorded based on the sales notification sent by the main partners on the following month after they had sold, we changed from March 2020 to record net sales within the same month, because it became possible to obtain the sales information earlier. As a result, net sales of a thirteen-month including March 2020 were recorded in the fiscal year under review and net sales increased by ¥29,300 million. Impact of the spread of COVID-19 Due to the spread of COVID-19, there is a concern of significant impact mainly on the Civil aero engines Business and the Vehicular turbochargers Business. Therefore, deferred tax assets for the fiscal year under review were calculated on the basis of an estimation of the impact to future taxable income under certain assumptions.
26
SEGMENT INFORMATION [Segment information]
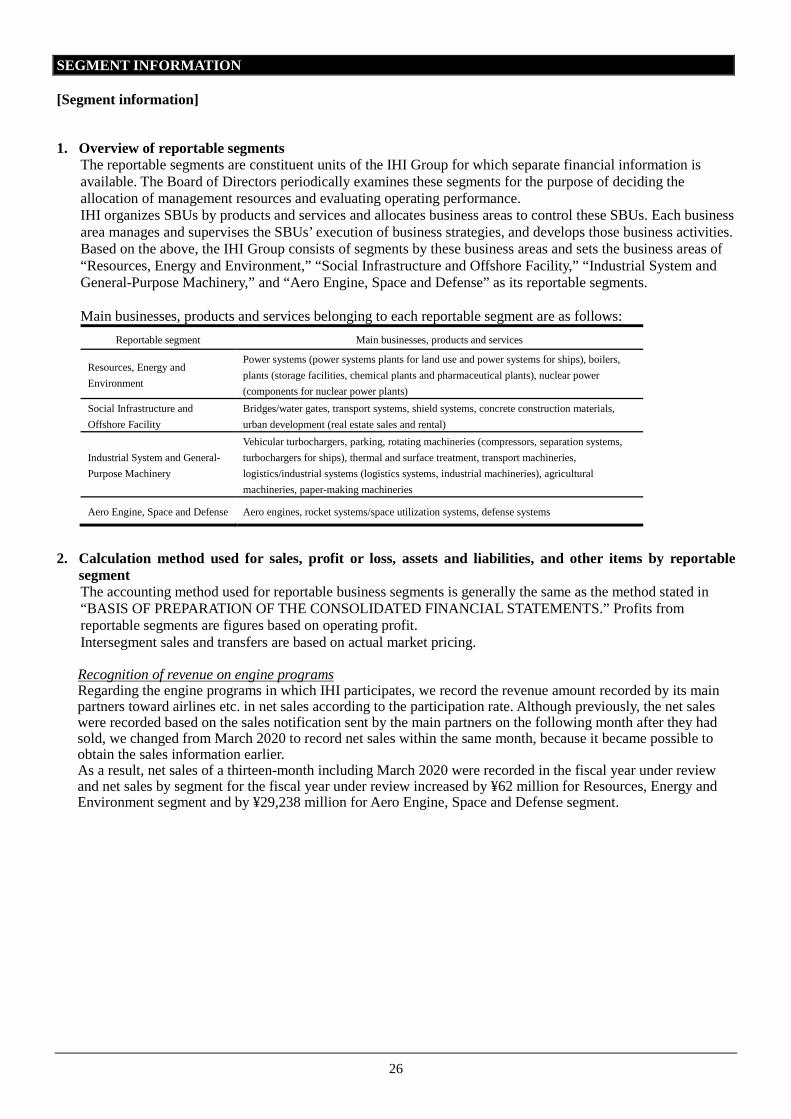
1. Overview of reportable segments The reportable segments are constituent units of the IHI Group for which separate financial information is available. The Board of Directors periodically examines these segments for the purpose of deciding the allocation of management resources and evaluating operating performance. IHI organizes SBUs by products and services and allocates business areas to control these SBUs. Each business area manages and supervises the SBUs’ execution of business strategies, and develops those business activities. Based on the above, the IHI Group consists of segments by these business areas and sets the business areas of “Resources, Energy and Environment,” “Social Infrastructure and Offshore Facility,” “Industrial System and General-Purpose Machinery,” and “Aero Engine, Space and Defense” as its reportable segments.
Main businesses, products and services belonging to each reportable segment are as follows:
Reportable segment Main businesses, products and services
Resources, Energy and Environment
Power systems (power systems plants for land use and power systems for ships), boilers, plants (storage facilities, chemical plants and pharmaceutical plants), nuclear power (components for nuclear power plants)
Social Infrastructure and Offshore Facility
Bridges/water gates, transport systems, shield systems, concrete construction materials, urban development (real estate sales and rental)
Industrial System and General-Purpose Machinery
Vehicular turbochargers, parking, rotating machineries (compressors, separation systems, turbochargers for ships), thermal and surface treatment, transport machineries, logistics/industrial systems (logistics systems, industrial machineries), agricultural machineries, paper-making machineries
Aero Engine, Space and Defense Aero engines, rocket systems/space utilization systems, defense systems
2. Calculation method used for sales, profit or loss, assets and liabilities, and other items by reportable segment The accounting method used for reportable business segments is generally the same as the method stated in “BASIS OF PREPARATION OF THE CONSOLIDATED FINANCIAL STATEMENTS.” Profits from reportable segments are figures based on operating profit. Intersegment sales and transfers are based on actual market pricing. Recognition of revenue on engine programs Regarding the engine programs in which IHI participates, we record the revenue amount recorded by its main partners toward airlines etc. in net sales according to the participation rate. Although previously, the net sales were recorded based on the sales notification sent by the main partners on the following month after they had sold, we changed from March 2020 to record net sales within the same month, because it became possible to obtain the sales information earlier. As a result, net sales of a thirteen-month including March 2020 were recorded in the fiscal year under review and net sales by segment for the fiscal year under review increased by ¥62 million for Resources, Energy and Environment segment and by ¥29,238 million for Aero Engine, Space and Defense segment.
27
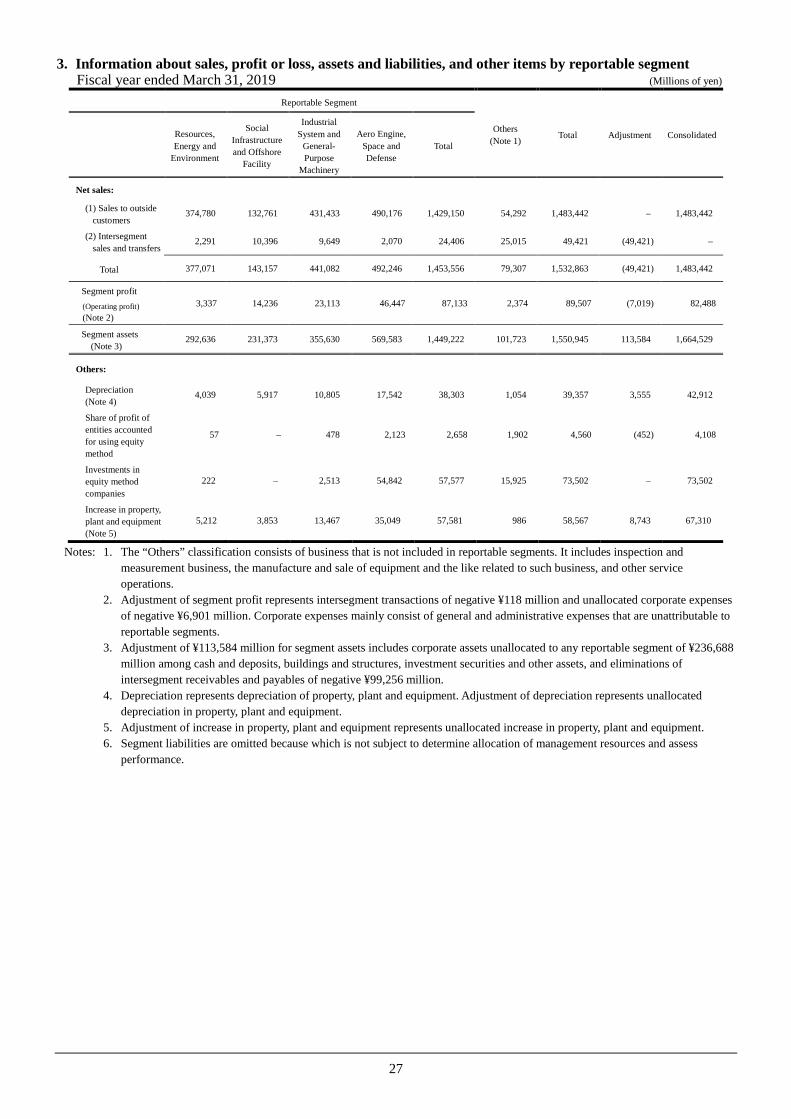
3. Information about sales, profit or loss, assets and liabilities, and other items by reportable segment Fiscal year ended March 31, 2019 (Millions of yen)
Notes: 1. The “Others” classification consists of business that is not included in reportable segments. It includes inspection and measurement business, the manufacture and sale of equipment and the like related to such business, and other service operations.
2. Adjustment of segment profit represents intersegment transactions of negative ¥118 million and unallocated corporate expenses of negative ¥6,901 million. Corporate expenses mainly consist of general and administrative expenses that are unattributable to reportable segments.
3. Adjustment of ¥113,584 million for segment assets includes corporate assets unallocated to any reportable segment of ¥236,688 million among cash and deposits, buildings and structures, investment securities and other assets, and eliminations of intersegment receivables and payables of negative ¥99,256 million.
4. Depreciation represents depreciation of property, plant and equipment. Adjustment of depreciation represents unallocated depreciation in property, plant and equipment.
5. Adjustment of increase in property, plant and equipment represents unallocated increase in property, plant and equipment. 6. Segment liabilities are omitted because which is not subject to determine allocation of management resources and assess
performance.
28
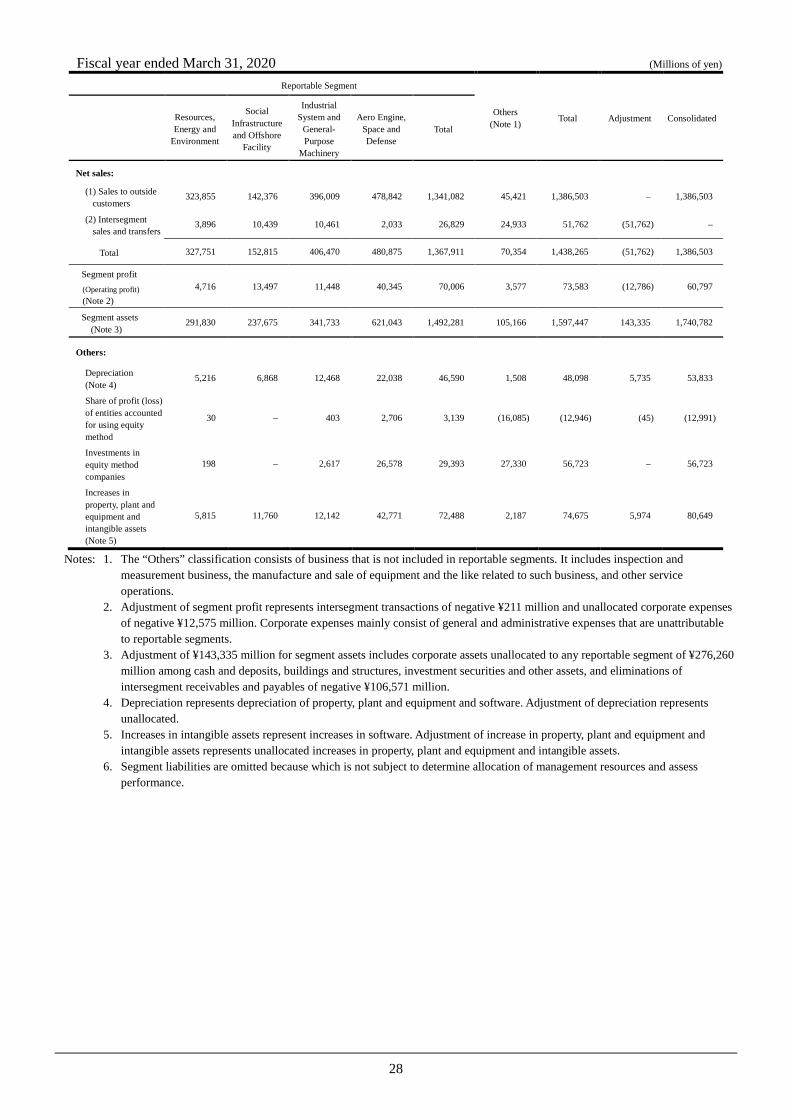
Fiscal year ended March 31, 2020 (Millions of yen)
Notes: 1. The “Others” classification consists of business that is not included in reportable segments. It includes inspection and measurement business, the manufacture and sale of equipment and the like related to such business, and other service operations.
2. Adjustment of segment profit represents intersegment transactions of negative ¥211 million and unallocated corporate expenses of negative ¥12,575 million. Corporate expenses mainly consist of general and administrative expenses that are unattributable to reportable segments.
3. Adjustment of ¥143,335 million for segment assets includes corporate assets unallocated to any reportable segment of ¥276,260 million among cash and deposits, buildings and structures, investment securities and other assets, and eliminations of intersegment receivables and payables of negative ¥106,571 million.
4. Depreciation represents depreciation of property, plant and equipment and software. Adjustment of depreciation represents unallocated.
5. Increases in intangible assets represent increases in software. Adjustment of increase in property, plant and equipment and intangible assets represents unallocated increases in property, plant and equipment and intangible assets.
6. Segment liabilities are omitted because which is not subject to determine allocation of management resources and assess performance.
29
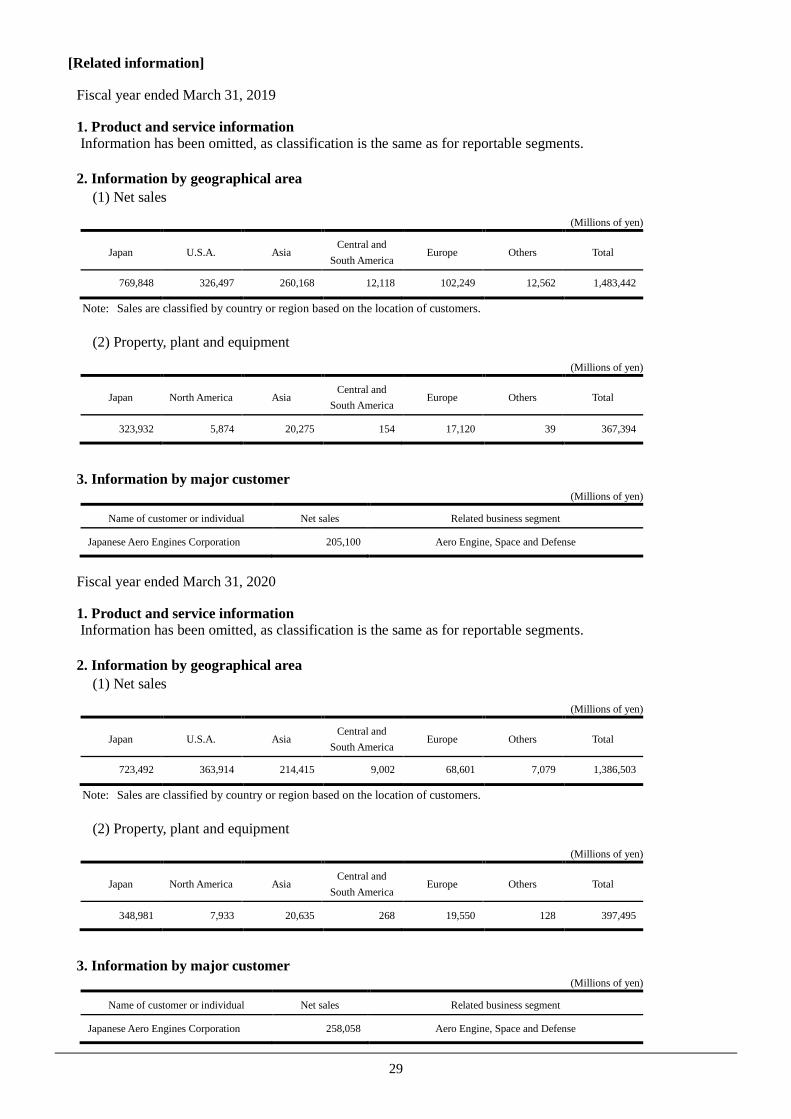
[Related information]
Fiscal year ended March 31, 2019
1. Product and service information Information has been omitted, as classification is the same as for reportable segments.
Fiscal year ended March 31, 2020 (Millions of yen)
Reportable Segment
Others (Note)
Total Adjustment Consolidated
Resources, Energy and
Environment
Social Infrastructure and Offshore
Facility
Industrial System and
General-Purpose
Machinery
Aero Engine, Space and Defense
Total
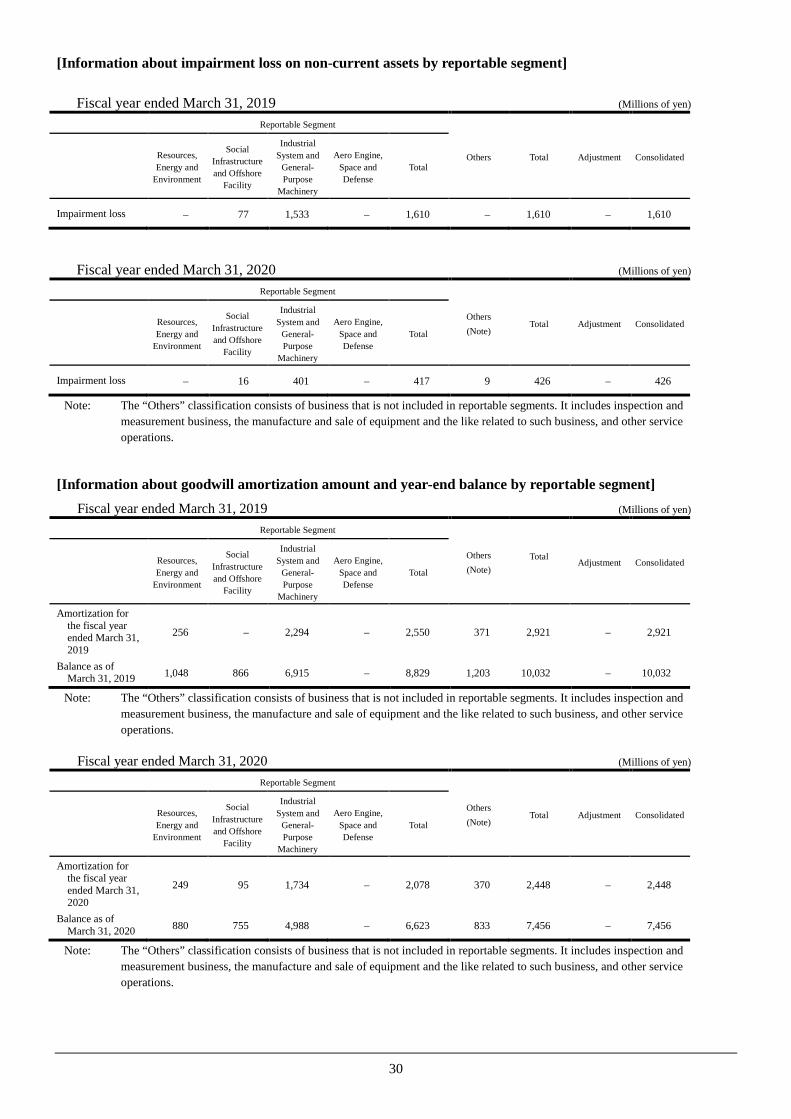
Impairment loss – 16 401 – 417 9 426 – 426
Note: The “Others” classification consists of business that is not included in reportable segments. It includes inspection and measurement business, the manufacture and sale of equipment and the like related to such business, and other service operations.
[Information about goodwill amortization amount and year-end balance by reportable segment]
Fiscal year ended March 31, 2019 (Millions of yen)
Reportable Segment
Others (Note)
Total Adjustment Consolidated
Resources, Energy and
Environment
Social Infrastructure and Offshore
Facility
Industrial System and
General-Purpose
Machinery
Aero Engine, Space and Defense
Total
Amortization for the fiscal year ended March 31, 2019
256 – 2,294 – 2,550 371 2,921 – 2,921
Balance as of March 31, 2019 1,048 866 6,915 – 8,829 1,203 10,032 – 10,032
Note: The “Others” classification consists of business that is not included in reportable segments. It includes inspection and measurement business, the manufacture and sale of equipment and the like related to such business, and other service operations.
Fiscal year ended March 31, 2020 (Millions of yen)
Reportable Segment
Others (Note)
Total Adjustment Consolidated
Resources, Energy and
Environment
Social Infrastructure and Offshore
Facility
Industrial System and
General-Purpose
Machinery
Aero Engine, Space and Defense
Total
Amortization for the fiscal year ended March 31, 2020
249 95 1,734 – 2,078 370 2,448 – 2,448
Balance as of March 31, 2020 880 755 4,988 – 6,623 833 7,456 – 7,456
Note: The “Others” classification consists of business that is not included in reportable segments. It includes inspection and measurement business, the manufacture and sale of equipment and the like related to such business, and other service operations.
31
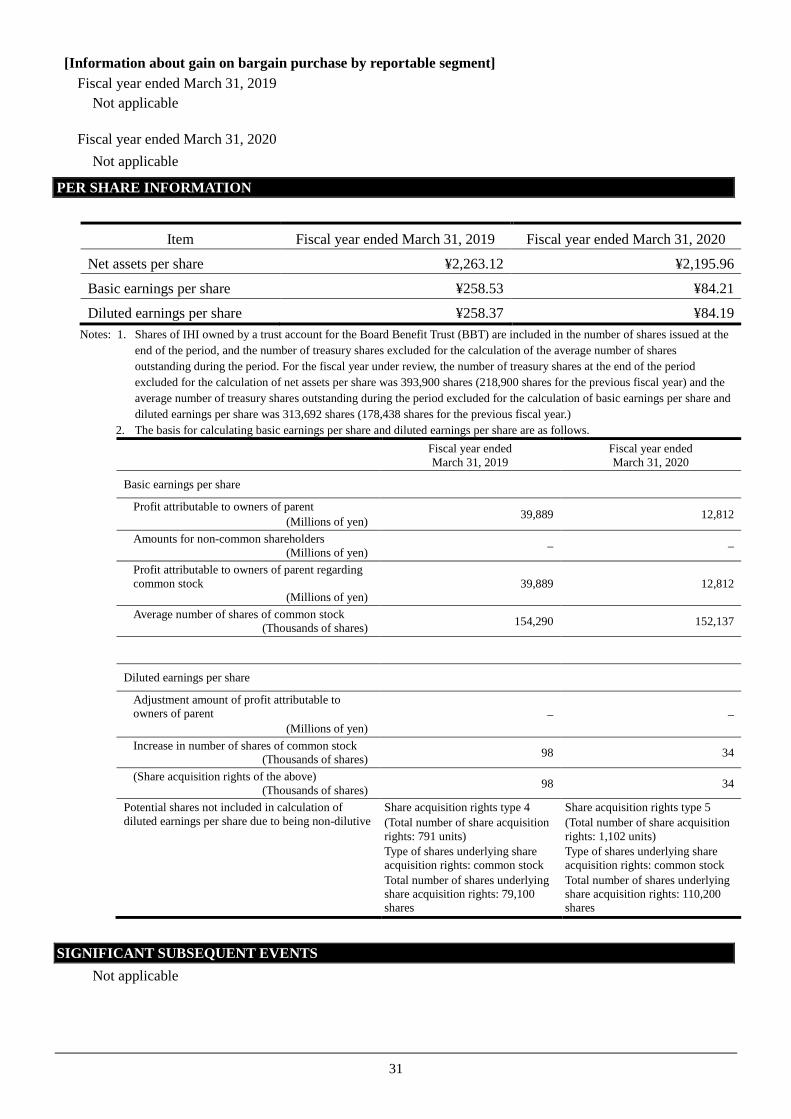
[Information about gain on bargain purchase by reportable segment] Fiscal year ended March 31, 2019
Not applicable
Fiscal year ended March 31, 2020 Not applicable
PER SHARE INFORMATION
Item Fiscal year ended March 31, 2019 Fiscal year ended March 31, 2020
Net assets per share ¥2,263.12 ¥2,195.96
Basic earnings per share ¥258.53 ¥84.21
Diluted earnings per share ¥258.37 ¥84.19 Notes: 1. Shares of IHI owned by a trust account for the Board Benefit Trust (BBT) are included in the number of shares issued at the
end of the period, and the number of treasury shares excluded for the calculation of the average number of shares outstanding during the period. For the fiscal year under review, the number of treasury shares at the end of the period excluded for the calculation of net assets per share was 393,900 shares (218,900 shares for the previous fiscal year) and the average number of treasury shares outstanding during the period excluded for the calculation of basic earnings per share and diluted earnings per share was 313,692 shares (178,438 shares for the previous fiscal year.)
2. The basis for calculating basic earnings per share and diluted earnings per share are as follows.
Fiscal year ended March 31, 2019
Fiscal year ended March 31, 2020
Basic earnings per share
Profit attributable to owners of parent (Millions of yen) 39,889 12,812
Amounts for non-common shareholders (Millions of yen) – –
Profit attributable to owners of parent regarding common stock (Millions of yen)
39,889 12,812
Average number of shares of common stock (Thousands of shares) 154,290 152,137
Diluted earnings per share
Adjustment amount of profit attributable to owners of parent (Millions of yen)
– –
Increase in number of shares of common stock (Thousands of shares) 98 34
(Share acquisition rights of the above) (Thousands of shares) 98 34
Potential shares not included in calculation of diluted earnings per share due to being non-dilutive
Share acquisition rights type 4 (Total number of share acquisition rights: 791 units) Type of shares underlying share acquisition rights: common stock Total number of shares underlying share acquisition rights: 79,100 shares
Share acquisition rights type 5 (Total number of share acquisition rights: 1,102 units) Type of shares underlying share acquisition rights: common stock Total number of shares underlying share acquisition rights: 110,200 shares