Nihon Unisys, Ltd. Stock Listing: Tokyo Stock Exchange 1st Section Stock Code: URL: http://www.unisys.co.jp/ Representative: Akiyoshi Hiraoka, Representative Director, President & CEO Scheduled Date for Ordinary General Meeting of Shareholders: June 28, 2016 Scheduled Starting Date for Dividend Payment: Scheduled Submission Date for Securities Report: June 29, 2016 Earnings Supplementary Explanatory Documents: yes Earnings Results Briefing: yes (for institutional investors, analysts and press) 1. Consolidated Financial Results in FY2016 (from April 1, 2015 to March 31, 2016) (1) Consolidated Results of Operations (Note) Comprehensive Income FY2016: -1,480 Million Yen (�%) FY2015: 13,725 Million Yen (75.9%) (Reference) Share of Profit (Loss) of Entities Accounted for Using Equity Method FY2016: 61 Million Yen FY2015: 54 Million Yen (2) Consolidated Financial Position (Reference) Equity FY2016: 90,374 Million Yen FY2015: 81,021 Million Yen (3) Consolidated Cash Flow Status 2. Dividends 3. Consolidated Earnings Forecast for FY2017 (from April 1, 2016 to March 31, 2017) 20.8 13.5 3,200 10,000 % 1,880 3,010 26.0 32.0 2.5 3.5 28.2 12.1 37.3 Ordinary Income Profit attributable to owners of parent Earnings Per Share Yen Millions of Yen % Millions of yen % 30.01 93.78 4,500 13,800 4.1 % FY2016 FY2015 Net Assets Equity Ratio Net Assets Per Share Millions of Yen % Yen 91,213 81,975 46.8 40.6 847.51 861.53 FY2016 FY2015 10.5 9.7 14.9 Earnings Per Share Diluted Earnings Per Share Operating Income to Net Sales Ordinary Income to Total Assets Return on Equity 93.71 25.9 82.33 4.5 14.1 FY2015 10,924 Millions of Yen 12,525 Yen Yen % 77.07 66.72 Operating Activities Investing Activities Financing Activities FY2016 FY2015 Millions of Yen % Millions of Yen FY2016 FY2015 % 14.6 12,371 (1.7) End of Q2 10.00 � 10.00 Yen End of Q3 Yen Year-end Yen Millions of Yen 10,989 18,037 193,094 199,772 Millions of Yen 3.3 (4.8) % 6.2 6.2 Note) This is an English translation of summarized consolidated financial results prepared for readers' convenience. Should there be any inconsistency between the translation and the original Japanese text, the latter shall prevail. for the Fiscal Year Ended March 31, 2016 [Japan GAAP] Net Sales June 29, 2016 May 10, 2016 8056 Millions of Yen Operating Income Ordinary Income Profit Attributable to Owners of Parent � Consolidated Financial Report Millions of Yen % Millions of Yen (Percentage below represents increase (decrease) from previous year) 278,039 269,154 23.1 Total Dividends (Annual) Dividend Payout Ratio (Consolidated) 20.00 30.00 Millions of Yen (10,565) 7,246 FY2017 Millions of Yen % Millions of Yen % Net Sales Operating Income (8,186) (12,886) FY2016 FY2017 (Forecast) � 17.50 35.00 130,000 285,000 1.3 2.5 4,500 14,000 5.1 11.8 (Percentage below represents increase (decrease) from previous year) FY2017 1 st Half 15,564 23,326 % 12,155 Ratio of Dividends to Net Assets (Consolidated) Total Assets Dividends Per Share End of Q1 Yen Yen Total � � � 15.00 � 15.00 Cash and Cash Equivalents at End of Period Millions of Yen 17.50 8,920 (10,548) (Amounts are rounded down to the nearest million yen.)
Transcript
Nihon Unisys, Ltd.Stock Listing: Tokyo Stock Exchange 1st SectionStock Code:URL: http://www.unisys.co.jp/Representative: Akiyoshi Hiraoka, Representative Director, President & CEOScheduled Date for Ordinary General Meeting of Shareholders: June 28, 2016Scheduled Starting Date for Dividend Payment:Scheduled Submission Date for Securities Report: June 29, 2016Earnings Supplementary Explanatory Documents: yesEarnings Results Briefing: yes (for institutional investors, analysts and press)
1. Consolidated Financial Results in FY2016 (from April 1, 2015 to March 31, 2016)
(1) Consolidated Results of Operations
(Note) Comprehensive Income FY2016: -1,480 Million Yen (-%) FY2015: 13,725 Million Yen (75.9%)
(Reference) Share of Profit (Loss) of Entities Accounted for Using Equity Method FY2016: 61 Million Yen FY2015: 54 Million Yen
(2) Consolidated Financial Position
(Reference) Equity FY2016: 90,374 Million Yen FY2015: 81,021 Million Yen
(3) Consolidated Cash Flow Status
2. Dividends
3. Consolidated Earnings Forecast for FY2017 (from April 1, 2016 to March 31, 2017)
20.813.5
3,20010,000
%
1,8803,010
26.032.0
2.53.5
28.212.1
37.3
Ordinary Income Profit attributable toowners of parent
Earnings Per Share
YenMillions of Yen % Millions of yen %30.0193.78
4,50013,800
4.1
%
FY2016FY2015
Net Assets Equity Ratio Net Assets Per ShareMillions of Yen % Yen
Note) This is an English translation of summarized consolidated financial results prepared for readers' convenience. Should there be anyinconsistency between the translation and the original Japanese text, the latter shall prevail.
for the Fiscal Year Ended March 31, 2016 [Japan GAAP]
Net Sales
June 29, 2016
May 10, 2016
8056
Millions of Yen
Operating Income Ordinary Income Profit Attributable toOwners of Parent
%
Consolidated Financial Report
Millions of Yen % Millions of Yen
(Percentage below represents increase (decrease) from previous year)
278,039269,154
23.1
Total Dividends(Annual)
Dividend PayoutRatio
(Consolidated)
20.0030.00
Millions of Yen(10,565)
7,246
FY2017
Millions of Yen % Millions of Yen %
Net Sales Operating Income
(8,186)(12,886)
FY2016FY2017
(Forecast) - 17.50 35.00
130,000285,000
1.32.5
4,50014,000
5.111.8
(Percentage below represents increase (decrease) from previous year)
FY2017 1st Half
15,56423,326
%
12,155
Ratio of Dividendsto Net Assets
(Consolidated)
Total Assets
Dividends Per ShareEnd of Q1
Yen Yen
Total
--
-
15.00 - 15.00
Cash and Cash Equivalentsat End of Period
Millions of Yen
17.50
8,920
(10,548)
(Amounts are rounded down to the nearest million yen.)
* Notes(1) Change in the scope of consolidation (change of condition of significant consolidated subsidiaries) during the period: No
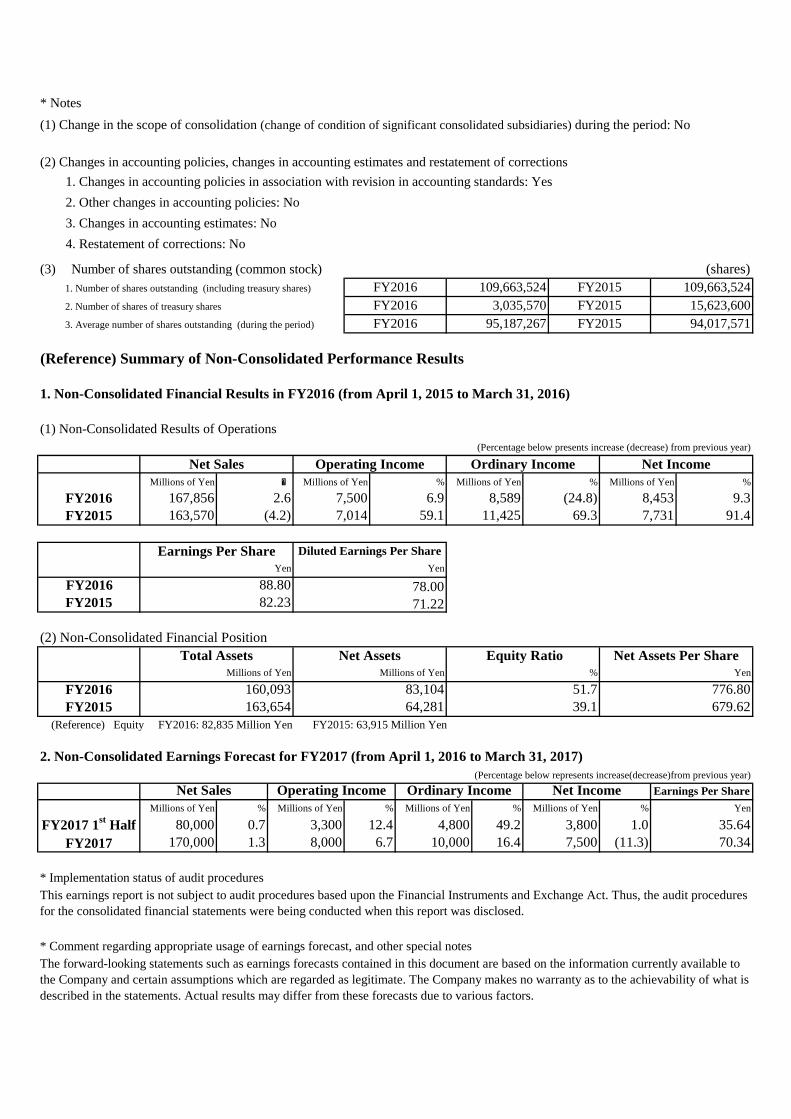
(2) Changes in accounting policies, changes in accounting estimates and restatement of corrections1. Changes in accounting policies in association with revision in accounting standards: Yes2. Other changes in accounting policies: No 3. Changes in accounting estimates: No 4. Restatement of corrections: No
(3) Number of shares outstanding (common stock) (shares)
(Reference) Summary of Non-Consolidated Performance Results
1. Non-Consolidated Financial Results in FY2016 (from April 1, 2015 to March 31, 2016)
(1) Non-Consolidated Results of Operations
(2) Non-Consolidated Financial Position
2. Non-Consolidated Earnings Forecast for FY2017 (from April 1, 2016 to March 31, 2017)
* Implementation status of audit procedures
* Comment regarding appropriate usage of earnings forecast, and other special notes
2.6 7,500
82.2378.0071.22
(Percentage below presents increase (decrease) from previous year)
Earnings Per Share Diluted Earnings Per ShareYen Yen
88.80
8,453 9.37,731 91.4
6.9% Millions of Yen
The forward-looking statements such as earnings forecasts contained in this document are based on the information currently available tothe Company and certain assumptions which are regarded as legitimate. The Company makes no warranty as to the achievability of what isdescribed in the statements. Actual results may differ from these forecasts due to various factors.
3. Average number of shares outstanding (during the period) FY2016 95,187,267 FY2015 94,017,571
This earnings report is not subject to audit procedures based upon the Financial Instruments and Exchange Act. Thus, the audit proceduresfor the consolidated financial statements were being conducted when this report was disclosed.
Net Sales Operating Income Ordinary Income Net Income
Total Assets Net Assets Equity Ratio Net Assets Per Share
Millions of Yen % Millions of Yen
109,663,5242. Number of shares of treasury shares FY2016 3,035,570 FY2015 15,623,6001. Number of shares outstanding (including treasury shares) FY2016 109,663,524 FY2015
% Millions of Yen %
69.3FY2016 167,856
FY2016 160,093 83,104 51.7 776.80Millions of Yen Millions of Yen % Yen
(Percentage below represents increase(decrease)from previous year)Net Sales Operating Income Ordinary Income Net Income Earnings Per Share
FY2015 163,654 64,281 39.1 679.62 (Reference) Equity FY2016: 82,835 Million Yen FY2015: 63,915 Million Yen
Millions of Yen % Millions of Yen % YenMillions of Yen % Millions of Yen %
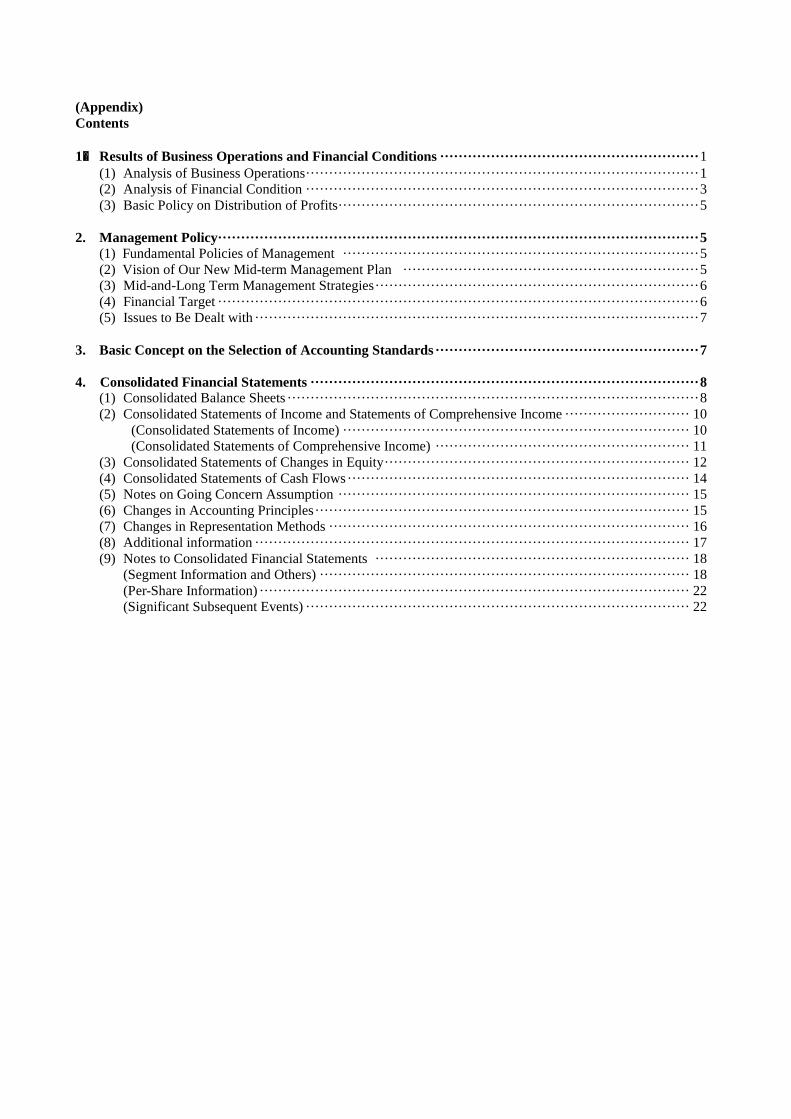
(Appendix) Contents 1. Results of Business Operations and Financial Conditions ························································ 1 (1) Analysis of Business Operations ····················································································· 1 (2) Analysis of Financial Condition ····················································································· 3 (3) Basic Policy on Distribution of Profits ·············································································· 5 2. Management Policy········································································································ 5 (1) Fundamental Policies of Management ············································································· 5 (2) Vision of Our New Mid-term Management Plan ································································ 5 (3) Mid-and-Long Term Management Strategies ······································································ 6 (4) Financial Target ········································································································ 6 (5) Issues to Be Dealt with ································································································ 7 3. Basic Concept on the Selection of Accounting Standards ························································· 7 4. Consolidated Financial Statements ···················································································· 8 (1) Consolidated Balance Sheets ························································································· 8 (2) Consolidated Statements of Income and Statements of Comprehensive Income ··························· 10
(Consolidated Statements of Income) ··········································································· 10 (Consolidated Statements of Comprehensive Income) ······················································· 11
(3) Consolidated Statements of Changes in Equity ·································································· 12 (4) Consolidated Statements of Cash Flows ·········································································· 14 (5) Notes on Going Concern Assumption ············································································ 15 (6) Changes in Accounting Principles ················································································· 15 (7) Changes in Representation Methods ·············································································· 16 (8) Additional information ······························································································ 17 (9) Notes to Consolidated Financial Statements ···································································· 18 (Segment Information and Others) ················································································ 18 (Per-Share Information) ····························································································· 22 (Significant Subsequent Events) ··················································································· 22
1
1. Results of Business Operations and Financial Conditions (1) Analysis of Business Operations
① Overview of performance for the fiscal year under review
The information services market in Japan is expected to get on a track to recovery, due to a general increase
in software investment during the fiscal year ended March 2016. Despite this prospect, we are aware of concerns
about the Japanese economy slowing down due to uncertain global situations, and we are faced with further
intensifying rivalries against our competitors. Thus, we recognize that we continue to operate in a severe
environment.
In this environment, the Nihon Unisys group started our Mid-term Management Plan” in order to enhance
further the strengths that have been developed under the aegis of the “Mid-term Management Plan (2012→2014)”:
collaborative relationships with customers in various industries; capabilities of enabling successful system
implementation; capabilities of enabling one-stop support that is free from vendor lock-in; and capabilities of
designing and delivering new services. We have established strategic policies such as of reforming corporate
culture/strengthening of human resources capabilities as well as growth strategies of: expanding the areas of digital
innovation and life innovation; and reforming the area of business ICT platforms. Furthermore, we established our
new corporate statement ‘Foresight in sight®’ that expresses our vision towards 2020 concurrently with the launch
of the Mid-term Management Plan.
The first year of the Mid-term Management Plan witnessed results which promise to better our performance
in the future in three strategic growth areas and one strategic policy area. This trio consists of two ‘challenge’ areas:
digital innovation; and life innovation, and one reform area, which is business ICT platform. The one strategic
policy area refers to reform of corporate culture/strengthening of human resources capabilities.
In the area of digital innovation, our market-proven payment card business has achieved steady growth in the
rapidly expanding settlement service field. Furthermore, a global brand prepaid card service was launched under an
alliance with Dai Nippon Printing Co., Ltd. The service enabled another launch of a one-stop service for global
brand direct debit service provision. This service consists of functions needed for settlement such as: transaction
processing, membership management, links to accounting systems, and night time service coverage.
These initiatives eye a governmental growth strategy promoting cashless payment systems. They will be enhanced
in the future in order to improve convenience for domestic users and the likely increasing number of visitors from
abroad towards 2020. The enhancement will include services to enable various types of settlement and coordination
with marketing services through the use of purchase date therefrom.
In the area of life innovation, our efforts have been intensified, keeping in mind societal issues posed by low
birthrate and longevity in order to deal with increasingly onerous medical care, nursing care and childcare. In the
areas of medical care and nursing care, our “Mirai Kanae Net” started service in April. The ICT system was created
on the basis of already proven “Sado Himawari Net”, and it enables the Kesen medical care zone to coordinate
community-based health care and nursing care presence. These services network and enable easy local access to
healthcare information necessary for maintaining and strengthening public health in an aging society through the
use of ICT.
2
In the childcare area, we released “ChiReaff Space™” childcare support service that will improve quality
of childcare by childminders who are helped by streamlined administrative processes and ensure the peace of mind
of and trust from guardians who can view records. This service will contribute to female empowerment which will
be more significant in the future, and further help private companies participate in the industry of childcare business.
In the field of life innovation, we have strengthened our services for electric vehicles, and
implemented initiatives in relation to energy issues such as electric power deregulation. Furthermore, we have
launched services that have real relevance for the lives of civilians.
We will continue to endeavor to enhance these services and coordinate them in order to meet the needs of society.
In the area of business ICT platforms, we will release an "IoT Business Platform Service’ capable of
harnessing censor devices and analyzing camera images. The Services comprised of machine learning capabilities
as well as the IoT platform capabilities will enable big data analyses if they serve in combination with our common
PaaS, which is capable of data integration and analysis. Furthermore, the one-stop service “IoT Ecosystem Lab”
will be released in the fiscal year ending March 2017. It is comprised of services ranging from making IoT use
proposals outside of the conventional use boundaries to enabling the actual performance.
Our endeavors in respective industries include: a production operation of a core-banking system for a new
Shinkin bank in our traditionally strong financial business area; an order for private cloud creation awarded by a
major manufacturer through the use of new technologies; and orders from government offices, public organizations
and distribution businesses for renewing IT platforms. Furthermore, proactive efforts to standardize and re-use
knowledge have been made in order to enable reforms in our business. We have been making efforts to provide the
most suitable services in the fastest way through coordination with the IoT business platform service and data use
platform.
Last but not least, we have promoted the cultivation of a corporate culture where employees spontaneously
innovate towards achievements as envisioned in the Mid-term Management Plan through efforts of: developing an
environment where working styles are reformed; establishing a personnel program where employees can learn to
be reform-minded leaders capable of innovation; promoting open innovation through coordination with external
accelerator programs; and unhesitant use of new technologies and generation of ideas through hackathons.
As above, the entire Nihon Unisys group has made efforts towards these achievements as envisioned in
the Mid-term Management Plan.
Net sales for the fiscal year under review were ¥278,039 million, an increase of 3.3% compared with the
previous fiscal year, as a result of the continuing strength of system services and hardware businesses.
Partly attributable to the increase in the net sales and partly due to the efforts of reducing selling and general
administrative expenses, operating income was ¥12,525 million, an increase of 14.6% compared with the previous
fiscal year; ordinary income was ¥12,155 million, a decrease of 1.7%; and profit attributable to owners of parent
was ¥8,920 million, an increase of 23.1%.
Please note that the ‘Accounting Standard for Business Combinations’ (Accounting Standards Board of Japan, ASBJ, Statement No. 21, issued on September 13, 2013), etc. were adopted from the first quarter of the fiscal year under review. As a result, ‘net income’ was changed to ‘profit attributable to owners of parent’.
3
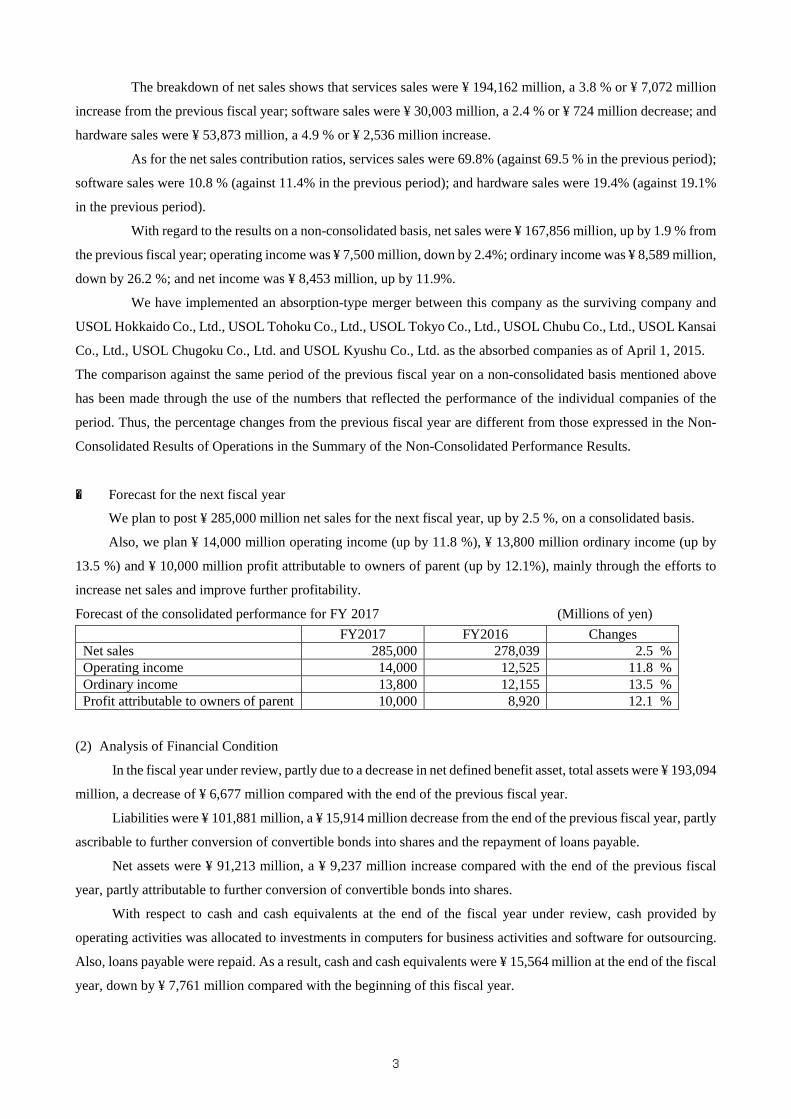
The breakdown of net sales shows that services sales were ¥ 194,162 million, a 3.8 % or ¥ 7,072 million
increase from the previous fiscal year; software sales were ¥ 30,003 million, a 2.4 % or ¥ 724 million decrease; and
hardware sales were ¥ 53,873 million, a 4.9 % or ¥ 2,536 million increase.
As for the net sales contribution ratios, services sales were 69.8% (against 69.5 % in the previous period);
software sales were 10.8 % (against 11.4% in the previous period); and hardware sales were 19.4% (against 19.1%
in the previous period).
With regard to the results on a non-consolidated basis, net sales were ¥ 167,856 million, up by 1.9 % from
the previous fiscal year; operating income was ¥ 7,500 million, down by 2.4%; ordinary income was ¥ 8,589 million,
down by 26.2 %; and net income was ¥ 8,453 million, up by 11.9%.
We have implemented an absorption-type merger between this company as the surviving company and
Co., Ltd., USOL Chugoku Co., Ltd. and USOL Kyushu Co., Ltd. as the absorbed companies as of April 1, 2015.
The comparison against the same period of the previous fiscal year on a non-consolidated basis mentioned above
has been made through the use of the numbers that reflected the performance of the individual companies of the
period. Thus, the percentage changes from the previous fiscal year are different from those expressed in the Non-
Consolidated Results of Operations in the Summary of the Non-Consolidated Performance Results.
② Forecast for the next fiscal year
We plan to post ¥ 285,000 million net sales for the next fiscal year, up by 2.5 %, on a consolidated basis.
Also, we plan ¥ 14,000 million operating income (up by 11.8 %), ¥ 13,800 million ordinary income (up by
13.5 %) and ¥ 10,000 million profit attributable to owners of parent (up by 12.1%), mainly through the efforts to
increase net sales and improve further profitability.
Forecast of the consolidated performance for FY 2017 (Millions of yen) FY2017 FY2016 Changes Net sales 285,000 278,039 2.5 % Operating income 14,000 12,525 11.8 % Ordinary income 13,800 12,155 13.5 % Profit attributable to owners of parent 10,000 8,920 12.1 %
(2) Analysis of Financial Condition
In the fiscal year under review, partly due to a decrease in net defined benefit asset, total assets were ¥ 193,094
million, a decrease of ¥ 6,677 million compared with the end of the previous fiscal year.
Liabilities were ¥ 101,881 million, a ¥ 15,914 million decrease from the end of the previous fiscal year, partly
ascribable to further conversion of convertible bonds into shares and the repayment of loans payable.
Net assets were ¥ 91,213 million, a ¥ 9,237 million increase compared with the end of the previous fiscal
year, partly attributable to further conversion of convertible bonds into shares.
With respect to cash and cash equivalents at the end of the fiscal year under review, cash provided by
operating activities was allocated to investments in computers for business activities and software for outsourcing.
Also, loans payable were repaid. As a result, cash and cash equivalents were ¥ 15,564 million at the end of the fiscal
year, down by ¥ 7,761 million compared with the beginning of this fiscal year.
4
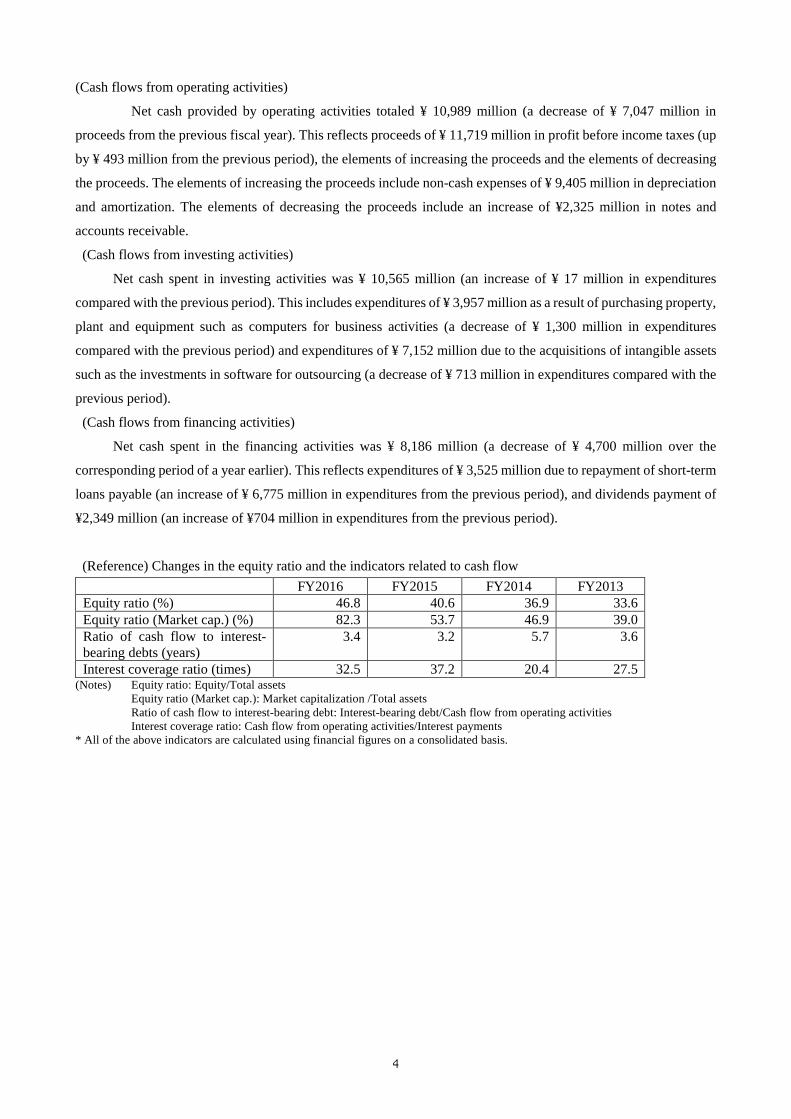
(Cash flows from operating activities)
Net cash provided by operating activities totaled ¥ 10,989 million (a decrease of ¥ 7,047 million in
proceeds from the previous fiscal year). This reflects proceeds of ¥ 11,719 million in profit before income taxes (up
by ¥ 493 million from the previous period), the elements of increasing the proceeds and the elements of decreasing
the proceeds. The elements of increasing the proceeds include non-cash expenses of ¥ 9,405 million in depreciation
and amortization. The elements of decreasing the proceeds include an increase of ¥2,325 million in notes and
accounts receivable.
(Cash flows from investing activities)
Net cash spent in investing activities was ¥ 10,565 million (an increase of ¥ 17 million in expenditures
compared with the previous period). This includes expenditures of ¥ 3,957 million as a result of purchasing property,
plant and equipment such as computers for business activities (a decrease of ¥ 1,300 million in expenditures
compared with the previous period) and expenditures of ¥ 7,152 million due to the acquisitions of intangible assets
such as the investments in software for outsourcing (a decrease of ¥ 713 million in expenditures compared with the
previous period).
(Cash flows from financing activities)
Net cash spent in the financing activities was ¥ 8,186 million (a decrease of ¥ 4,700 million over the
corresponding period of a year earlier). This reflects expenditures of ¥ 3,525 million due to repayment of short-term
loans payable (an increase of ¥ 6,775 million in expenditures from the previous period), and dividends payment of
¥2,349 million (an increase of ¥704 million in expenditures from the previous period).
(Reference) Changes in the equity ratio and the indicators related to cash flow FY2016 FY2015 FY2014 FY2013 Equity ratio (%) 46.8 40.6 36.9 33.6 Equity ratio (Market cap.) (%) 82.3 53.7 46.9 39.0 Ratio of cash flow to interest-bearing debts (years)
3.4 3.2 5.7 3.6
Interest coverage ratio (times) 32.5 37.2 20.4 27.5 (Notes) Equity ratio: Equity/Total assets Equity ratio (Market cap.): Market capitalization /Total assets Ratio of cash flow to interest-bearing debt: Interest-bearing debt/Cash flow from operating activities Interest coverage ratio: Cash flow from operating activities/Interest payments * All of the above indicators are calculated using financial figures on a consolidated basis.
5
(3) Basic Policy on Distribution of Profits
The Company seeks to achieve a stable and continuous distribution of profits in line with a policy of paying
dividends in accordance with our performance. The specific amount of dividends will be determined taking into
consideration the need to secure internal reserves for business development, and also comprehensively considering
the business environment and other factors.
For the fiscal year under review, we will pay a ¥30 annual dividend per share (¥15.00 for the mid-term
dividend and ¥15.00 for the term-end dividend), which is ¥10 more than the previous full fiscal year, as we
announced previously.
As for the dividends of the next period, we expect an increase in net income. Thus, we plan to pay a ¥35
annual dividend per share (¥17.50 for the mid-term dividend and ¥17.50 for the term-end dividend), which is more
than this fiscal year.
2. Management Policy (1) Fundamental Policies of Management
The Group will continue to respond to the expectations and needs of society, pursuant to the corporate
philosophy. <Nihon Unisys Group Corporate Philosophy> Our Mission Work with all people to contribute to creating a society that is friendly to people and the environment Our Vision Be a group that strives to be sensitive to the expectations and needs of society and that thinks through how ICT
can contribute to meet them Our Values
1. Pursuit of High Quality and High Technology Always have the latest knowledge that is useful for society while improving our skills
2. Respect for Individuals and Importance of Teamwork Identify each other’s good points, encourage each other to improve those good points and harness the strength of each person
3. Attractive Company for Society, Customers, Shareholders and Employees Listen sincerely to our stakeholders to improve our corporate value
(2) Vision of our New Mid-term Management Plan
Our understanding of the external market environments as described in our new mid-term management plan
(for the fiscal year 2015 through the fiscal year 2017) is that: new markets have emerged among consumers against
the backdrop of cloud computing, social media and an enhancement of IoT use; services have come to be created
across industry boundaries; and the conventional ICT business areas need to be merged with new areas and undergo
imminent change.
We will aim for a new position where we will provide new schemes of connecting various types of industries
in the growing area of the digital economy. This will be enabled by using our time-proven strengths (partnership
with customers in various types of industries, capabilities of completing system implementation, and capabilities of
one-stop support without vendor lock-in) as well as our recent strength as demonstrated in our capabilities of
designing and enabling new services.
6
Our group will endeavor and achieve the vision as described in our new mid-term management plan.
(3) Mid-and-Long Term Management Strategies
Our entire Group will strive for growth pursuant to the three key axes of strategy laid out in the new mid-
term management plan above.
(4) Financial Target
Our Group recognizes an increase in sales and income as our critical agenda. Our plan on a consolidated basis
for the fiscal year ending March 2018 indicates net sales of ¥ 320,000 million, operating income of ¥ 17,000 million,
“Mobilize services based on interconnected businesses.
Build our future through ICT advances.”
The era of new reform has come.
We have created and integrated numerous solutions together with customers
of various industries on the basis of accumulated ICT experience and expertise.
We will integrate services using our accumulated wisdom,
start and develop ICT businesses, and proactively envisage new forms of
cooperation in business in a more inter-connected world enabled by the ‘Internet of Things’.
The Nihon Unisys Group will take the initiative in creating unparalleled bases
for delivering innovative services till they become the norm.
Innovations in the areas of digital economy Creating sustainable new business models
with a keen awareness of social needs and issues
Challenge 1
Digital Innovation
Providing services and platforms that will help companies operate digital businesses in the fastest and optimum manner
beyond the boundaries of individual industries
Challenge 2 Life Innovation
Creating service businesses that will serve
our society better and operating them as part of our business portfolio
Reform Business ICT Platforms
Promoting the industrialization of services in order to
accelerate our service delivery and revising the service portfolio to include the capabilities of combining the services of
our company and others and providing them in the fastest and optimum manner
7
and an operating margin of 5.3 %.
(5) Issues to Be Dealt with
The entirety of our Group endeavors to achieve the new mid-term management plan towards our critical aim
of an increase in sales and income. The mid-term management plan is based on the key strategies: reform of business
ICT platforms; an increase in the areas of digital/life innovation; and reform of our corporate culture and workforce.
We will take measures to further accelerate our businesses in the second year of the plan.
① Strengthening of our efforts in the areas of ‘Challenge’ and ‘Reform’
(Acceleration of service-type businesses)
We will accelerate our service-type businesses by integrating into the Service and Product Planning the functions
of platform creation and promotion such as IoT, cloud and standardization; and re-organizing the marketing
functions.
(Development of outsourcing services)
We will further develop business processes in order to optimize the outsourcing service business and enhance
profitability thereof.
(Promotion of Group-wide Projects)
We will transfer the existing group-wide projects to the Business Innovation Division in order to accelerate our
businesses and strengthen our capabilities of implementation. Further, we will newly establish the Strategic Projects
in the Incubation Division that will help new businesses to be launched.
② Reform of Corporate Culture and Workforce
We have set forth the reform of corporate culture and workforce as one of our key strategies, due to our
understanding that a continued improvement of corporate culture is material in order to put our Group back on track
towards growth. Efforts to reform corporate culture, working style, and workforce capabilities were made in the
fiscal year 2016. We will further enhance our efforts through comprehensive promotion by the newly established
“Organization Development”.
We will further strengthen the existing management of business risks that will be diversified as a result of further
intensified intra-group coordination and business growth in the future.
3. [Basic Concept on the Selection of Accounting Standards] We have been examining the principles for applying IFRS (International Financial Reporting Standards) and periods
Accumulated other comprehensive incomeValuation difference on available-for-sale securities 5,511 4,297Deferred gains or losses on hedges (10) (16)Remeasurements of defined benefit plans 6,004 (3,216)Total accumulated other comprehensive income 11,505 1,065
Subscription rights to shares 366 269Non-controlling interests 587 569Total net assets 81,975 91,213
Total liabilities and net assets 199,772 193,094
9
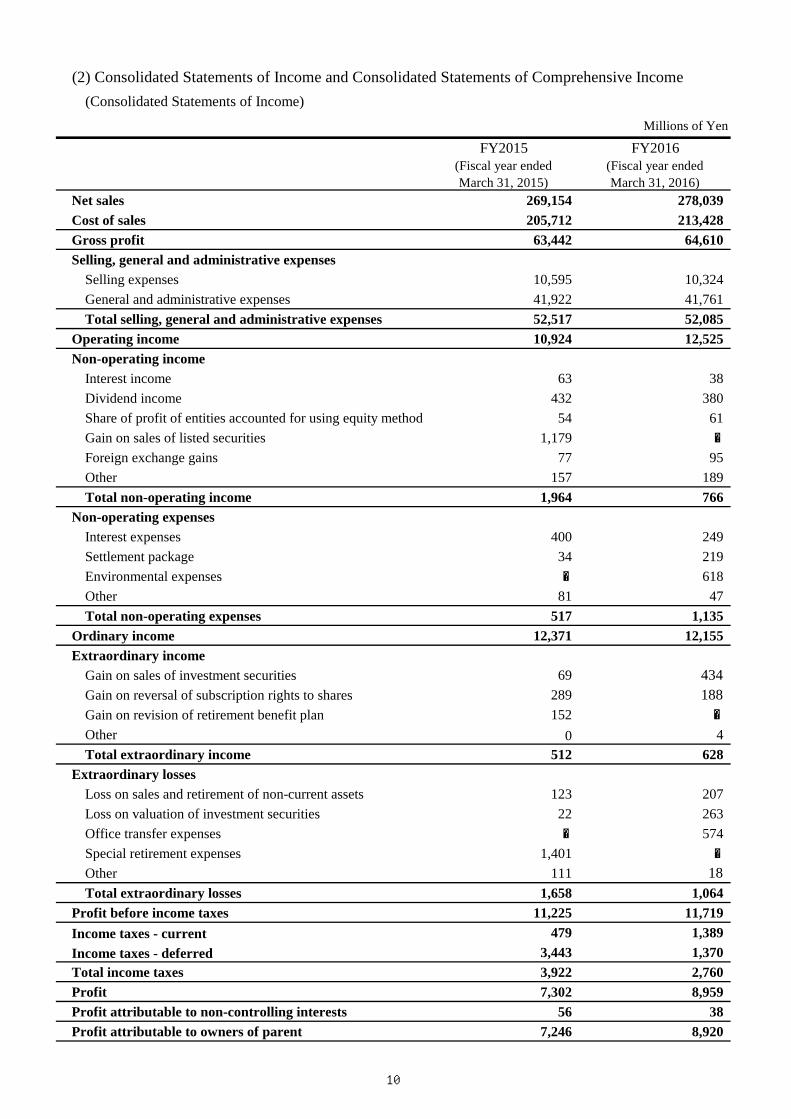
(2) Consolidated Statements of Income and Consolidated Statements of Comprehensive Income(Consolidated Statements of Income)
Millions of Yen
FY2015 FY2016(Fiscal year endedMarch 31, 2015)
(Fiscal year endedMarch 31, 2016)
Net sales 269,154 278,039Cost of sales 205,712 213,428Gross profit 63,442 64,610Selling, general and administrative expenses
Selling expenses 10,595 10,324General and administrative expenses 41,922 41,761Total selling, general and administrative expenses 52,517 52,085
Operating income 10,924 12,525Non-operating income
Interest income 63 38Dividend income 432 380Share of profit of entities accounted for using equity method 54 61Gain on sales of listed securities 1,179 -
Gain on sales of investment securities 69 434Gain on reversal of subscription rights to shares 289 188Gain on revision of retirement benefit plan 152 -
Other 0 4Total extraordinary income 512 628
Extraordinary lossesLoss on sales and retirement of non-current assets 123 207Loss on valuation of investment securities 22 263Office transfer expenses - 574Special retirement expenses 1,401 -
Other 111 18Total extraordinary losses 1,658 1,064
Profit before income taxes 11,225 11,719Income taxes - current 479 1,389Income taxes - deferred 3,443 1,370Total income taxes 3,922 2,760Profit 7,302 8,959Profit attributable to non-controlling interests 56 38Profit attributable to owners of parent 7,246 8,920
10
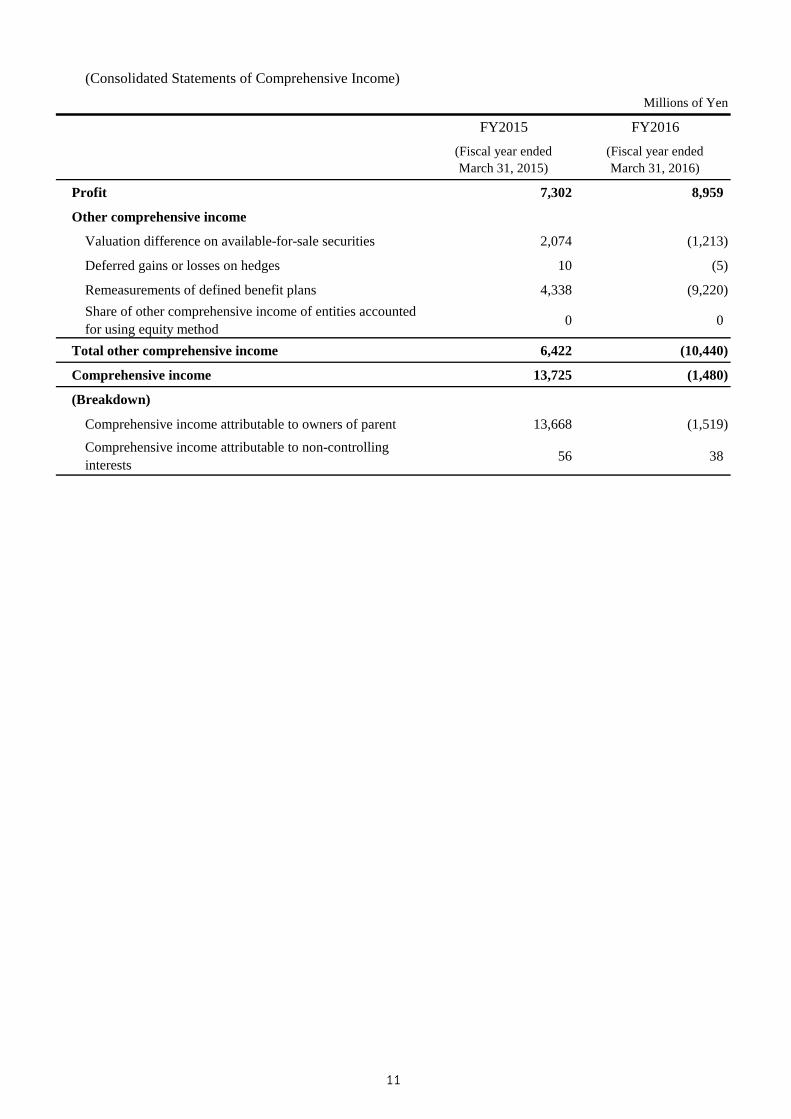
(Consolidated Statements of Comprehensive Income)Millions of Yen
FY2015 FY2016(Fiscal year endedMarch 31, 2015)
(Fiscal year endedMarch 31, 2016)
Profit 7,302 8,959
Other comprehensive income
Valuation difference on available-for-sale securities 2,074 (1,213)
Deferred gains or losses on hedges 10 (5)
Remeasurements of defined benefit plans 4,338 (9,220)Share of other comprehensive income of entities accountedfor using equity method 0 0
Total other comprehensive income 6,422 (10,440)
Comprehensive income 13,725 (1,480)
(Breakdown)
Comprehensive income attributable to owners of parent 13,668 (1,519)
Comprehensive income attributable to non-controllinginterests 56 38
11
(3) Consolidated Statement of Changes in EquityFY2015 [From April 1, 2014 to March 31, 2015]
Balance at beginning of period Cumulative effects of changes in accounting policiesRestated balance
Changes of items during the period
Dividends from surplus
Profit attributable to owners of parent
Purchase of treasury shares
Disposal of treasury shares
Deposit for subscriptions to treasury sharesNet changes of items other thanshareholders' equity
Total changes of items during the period
Balance at end of period
Valuationdifference onavailable-for-
salesecurities
Totalaccumulated
othercomprehensive
incomeBalance at beginning of period 3,437 5,082 Cumulative effects of changes in accounting policiesRestated balance 3,437 5,082
Changes of items during the period
Dividends from surplus
Profit attributable to owners of parent
Purchase of treasury shares
Disposal of treasury shares
Deposit for subscriptions to treasury sharesNet changes of items other thanshareholders' equity 2,074 6,422
Total changes of items during the period 2,074 6,422
Balance at end of period 5,511 11,505
(Millions of Yen)
(1,672)
7,246
(20) 1,665 661 558 70,184
76,016
(5,832)
31
2
Shareholders' equity
63,881
7,246
(0)
Total shareholders'equity
69,714
(5,832)
Capital stock Capital surplus Retained earnings Treasuryshares
Deposit forsubscriptions totreasury shares
5,483 15,281 68,267 (19,318) -
(5,832)
5,483 15,281 62,435 (19,318) -
2
7,246
(0)
(1,645) (1,645)
(20) 1,665 661 558
Deferredgains
(losses) onhedges
Re-measurements
of definedbenefit plans
(4) 35
- - 5,596 34 2 5,634
5,483 15,281 68,031 (19,283) 2 69,515
Accumulated other comprehensive incomeSubscription
rights toshares
Non-controlling
interestsTotal net assets
(0)
(27)
31
2
(10) 6,004 366 587 81,975
10 4,338 (294) 56 6,185
10 4,338 (294) 29 11,791
12
FY2016 [From April 1, 2015 to March 31, 2016]
Balance at beginning of period Cumulative effects of changes in accounting policiesRestated balance
Changes of items during the period
Dividends of surplus
Profit attributable to owners of parentChange in treasury shares of parent arisingfrom transactions with non-controllingshareholdersConversion of convertible bond
Purchase of treasury shares
Disposal of treasury sharesDeposit for subscriptions to treasury sharesNet changes of items other thanshareholders' equity
Total changes of items during the period
Balance at end of period
Valuationdifference onavailable-for-
salesecurities
Totalaccumulated
othercomprehensive
incomeBalance at beginning of period 5,511 11,505 Cumulative effects of changes in accounting policiesRestated balance 5,511 11,505
Changes of items during the period
Dividends of surplus
Profit attributable to owners of parentChange in treasury shares of parent arisingfrom transactions with non-controllingshareholdersConversion of convertible bond
Purchase of treasury shares
Disposal of treasury sharesDeposit for subscriptions to treasury sharesNet changes of items other thanshareholders' equity (1,213) (10,440)
Total changes of items during the period (1,213) (10,440)
Balance at end of period 4,297 1,065(16) (3,216) 269 569 91,213
(5) (9,220) (97) 38 (10,498)
(5) (9,220) (97) (18) 10,030
(0)
679
8,920
13,933
(8) (8)
(48) (2,400)
366 587 81,975
(793)
(10) 6,004 366 587 81,182
Accumulated other comprehensive incomeSubscription
rights toshares
Non-controlling
interestsTotal net assets
Deferredgains
(losses) onhedges
Re-measurements
of definedbenefit plans
5,483 14,200 73,364 (3,746) 6 89,309
(0) (0)
- 0 5,045 15,537 3 20,586
(12) 94 (2) 79
(1,510) 15,443 13,933
8,920 8,920
0 0
(2,351)
(Millions of Yen)
Shareholders' equity
Capital stock Capital surplus Retained earnings Treasuryshares
Deposit forsubscriptions totreasury shares
Total shareholders'equity
5,483 15,281 68,031
(2,351)
6 6
(10) 6,004
(19,283) 2 69,515
5,483 14,200 68,319 (19,283) 2 68,722
(1,081) 287 (793)
13
(4) Consolidated Statements of Cash Flows
Millions of Yen
FY2015 FY2016(Fiscal year endedMarch 31, 2015)
(Fiscal year endedMarch 31, 2016)
Net cash provided by (used in) operating activitiesProfit before income taxes 11,225 11,719Depreciation and amortization 9,746 9,405Amortization of goodwill 137 83Loss (gain) on sales of investment securities (1,249) (434)Loss (gain) on valuation of investment securities 22 263Increase(decrease) in allowance for loss on contractdevelopment (1,583) (1,632)
Increase (decrease) in other provision 52 797Increase (decrease) in net defined benefit liability (2,533) 4,269Decrease (increase) in net defined benefit asset (6,551) 6,343Increase (decrease) in remeasurements of defined benefitplans 6,298 (13,442)
Interest and dividend income (496) (419)Interest expenses 400 249Decrease (increase) in notes and accounts receivable - trade (162) (2,325)Decrease (increase) in inventories 3,867 (2,038)Increase (decrease) in notes and accounts payable - trade 796 (2,290)Increase (decrease) in accrued expenses 13 1,232Other (854) (527)Subtotal 19,129 11,253Interest and dividend income received 499 422Interest expenses paid (485) (337)Income taxes paid (1,106) (347)Net cash provided by (used in) operating activities 18,037 10,989
Net cash provided by (used in) investing activitiesPurchase of property, plant and equipment (5,257) (3,957)Proceeds from sales of property, plant and equipment 242 7Purchase of intangible assets (7,865) (7,152)Purchase of investment securities (456) (710)Proceeds from sales of investment securities 2,630 1,195Proceeds from redemption of investment securities 100 -Other 59 51Net cash provided by (used in) investing activities (10,548) (10,565)
Net cash provided by (used in) financing activitiesIncrease (decrease) in short-term loans payable 3,250 (3,525)Proceeds from long-term loans payable - 13,275Repayments of long-term loans payable (3,940) (15,115)Redemption of bonds (10,000) -Repayments of other loans (549) (482)Purchase of treasury shares 0 0Cash dividends paid (1,645) (2,349)Dividends paid to non-controlling interests (27) (48)Other 27 60Net cash provided by (used in) financing activities (12,886) (8,186)
Net increase (decrease) in cash and cash equivalents (5,397) (7,761)Cash and cash equivalents at beginning of period 28,723 23,326Cash and cash equivalents at end of period 23,326 15,564
14
15
(5) Notes on Going Concern Assumption
None applicable
(6) Changes in Accounting Principles
(Adoption of Accounting Standard for Business Combinations) The ‘Accounting Standard for Business Combinations’ (Accounting Standards Board of Japan, ASBJ,
Statement No. 21, issued on September 13, 2013, hereinafter referred to as the ‘Business Combinations Accounting Standard’), ‘Accounting Standard for Consolidated Financial Statements’ (ASBJ Statement No. 22, issued on September 13, 2013, hereinafter referred to as the ‘Consolidation Accounting Standard’), ‘Accounting Standard for Business Divestitures’ (ASBJ Statement No. 7, issued on September 13, 2013, hereinafter referred to as the ‘Business Divestitures Accounting Standard’) and other standards were adopted from the fiscal year under review. Accordingly, the accounting method was changed to record any differences arising from changes in a parent company’s ownership interest in its subsidiary as capital surplus as long as the parent retains control over its subsidiary, and to record acquisition-related costs as expenses for the fiscal year in which they occur.
In addition, with regard to business combinations on or after April 1, 2015, the accounting method was changed to retroactively reflect adjustments to the amount allocated to acquisition cost in the consolidated financial statements of the fiscal year in which the relevant business combinations became or will become effective, upon finalizing provisional accounting treatment. Such adjustments shall be recognized as if the accounting for the business combination had been complete at the acquisition date.
Furthermore, we have made changes in presentation, such as a change from net income to profit attribute to owners of parent and a change from minority interests to non-controlling interests. To reflect these changes in presentation, adjustments have been made to the consolidated financial statements for the prior fiscal year presented herein.
The Business Combinations Accounting Standard and other standards were applied in accordance with the transitional treatments set forth in Article 58 -2 (3) of the Business Combinations Accounting Standard, Article 44-5 (3) of the Consolidation Accounting Standard, and Article 57-4 (3) of the Business Divestitures Accounting Standard. The cumulative effect arising from the retroactive application of these new accounting policies to all the previous fiscal years were added to or deducted from capital surplus and retained earnings as of April 1, 2015. As a result, goodwill decreased by ¥793 million, capital surplus decreased by ¥1,081 million, and retained earnings increased by ¥287 million as of April 1, 2015. Operating income, ordinary income and profit before income taxes increased by ¥53 million for the fiscal year under review, respectively. The cumulative effect was reflected in the net assets as of April 1, 2015 of the fiscal year under review. Thus, capital
surplus decreased by ¥1,081 million and retained earnings increased by ¥287 million as of April 1, 2015 in the
Consolidated Statement of Changes in Equity.
In the fiscal year under review, net asset amount per share decreased by ¥6.94; earnings per share increased by
¥0.56; and diluted earnings per share increased by ¥0.49.
16
(7) Changes in Representation Methods
(Consolidated State of Income)
‘Foreign exchange gains’ that used to be included in the ‘Others’ of non-operating income in the previous
fiscal year are described separately for the fiscal year under review because they constitute more than 10/100 of the
amount of total non-operating income. (Note that they are ¥ 95 million for the fiscal year under review.)
Consolidated financial statements for the previous fiscal year have been restated in order to reflect this change in
presentation.
‘Foreign exchange gains’ of the previous fiscal year were ¥77 million.
‘Settlement package’ that used to be included in the ‘Others’ of non-operating expenses in the previous fiscal
year are described separately for the fiscal year under review because they constitute more than 10/100 of the amount
of total non-operating expenses. (Note that it is ¥219 million for the fiscal year under review.)
Consolidated financial statements for the previous fiscal year have been restated in order to reflect this change in
presentation.
‘Settlement package’ of previous fiscal year was ¥34 million.
‘Loss on valuation of investment securities’ of extraordinary losses that were included in ‘Others’ of the
amount of extraordinary losses in the previous fiscal year are independently described in the fiscal year under review
because they constitute more than 10/100 of the total extraordinary losses. (Note that they are ¥263 million for the
fiscal year under review.)
Consolidated financial statements for the previous fiscal year have been restated in order to reflect this change in
presentation.
‘Loss on valuation of investment securities’ of the previous fiscal year was ¥22 million.
(Consolidated Statements of Cash Flows)
‘Impairment loss’ of ‘Net cash provided by (used in) operating activities’ that was separately described in
the previous fiscal year is included in ‘Others’ in the fiscal year under review due to the less significant amount.
(Note that it is ¥18 million for the fiscal year under review.) Consolidated financial statements for the previous
fiscal year have been restated in order to reflect this change in presentation.
‘Impairment loss’ of the previous fiscal year was ¥110 million.
‘Increase (decrease) in deposits received’ of ‘Net cash provided by (used in) operating activities’ that were
separately described in the previous fiscal year are included in ‘Others’ in the fiscal year under review due to the
less significant amount. (Note that it is ¥(110) million for the fiscal year under review.) Consolidated financial
statements for the previous fiscal year have been restated in order to reflect this change in presentation.
‘Increase (decrease) in deposits received’ of the previous fiscal year were ¥503 million.
17
(8) Additional Information
(Corrections of Deferred Tax Assets and Deferred Tax Liabilities from Changes in Corporation Tax Rate)
The “Act for Partial Amendment of the Income Tax Act, etc.” (Act No. 15 of 2016) and the “Act for Partial
Amendment of the Local Tax Act, etc.” (Act No. 13 of 2016) were passed by the Diet on March 29, 2016. The
corporation tax rate was lowered from the fiscal year beginning on or after April 1, 2016.
Accordingly, the effective tax rate for the calculation of deferred tax assets and deferred tax liabilities will be
lowered from 33.1% to 30.9% for temporary differences expected to be eliminated in the fiscal year beginning on
April 1, 2016, and the fiscal year beginning on April 1, 2017, and to 30.6% for fiscal year beginning on April 1,
2018 and thereafter.
The deductible amount for loss carryforwards will be limited to 60/100 equivalent to the amount of taxable income
for fiscal years beginning on or after April 1, 2016, to 55/100 for fiscal years beginning on or after April 1, 2017,
and to 50/100 for fiscal years beginning on or after April 1, 2018.
As a result of these changes in the tax rate, deferred tax assets (amount after the reduction of the amount of
deferred tax liabilities) decreased by ¥133 million. Also, income taxes-deferred increased ¥209 million and
valuation difference on available-for-sale securities increased ¥101 million, and re-measurements of defined benefit
plans decreased by ¥25 million.
18
(9) Notes to Consolidated Financial Statements
(Segment Information and Others)
(Segment information)
1. Overview of reportable segments
The reportable segments of the Company are those units among the constituent units of the Company for
which separate financial statements can be obtained and which are regularly examined by the Board of
Directors for decisions on the allocation of management resources and for assessing business performance.
By fully harnessing the collective capabilities of the Group, the Company provides comprehensive IT
solution services, from identifying customers' management issues to providing solutions to them. Our
businesses involve proposing comprehensive strategies for products and services that together constitute IT
solution services.
The Company's operations therefore consist of segments comprised of products and services that constitute
our IT solution services. We have five reportable segments; System Services, Support Services, Outsourcing,
Software, and Hardware.
Details of the reportable segments are as follows:
• System Services: Entrusted with software development business, system engineer services
and consulting
• Support Services: Software and hardware maintenance, installation support
and related services
• Outsourcing: Entrusted with management of information systems, and related services
• Software: Provision of software based on software license agreements
• Hardware: Provision of hardware based on equipment sales agreements
or rental agreements
2. Methods to determine net sales, income or loss, assets and other amounts by reportable segment
The accounting methods by business segment reported herein are the same as described in the
“Basis of Presentation of the Consolidated Financial Statements.”
19
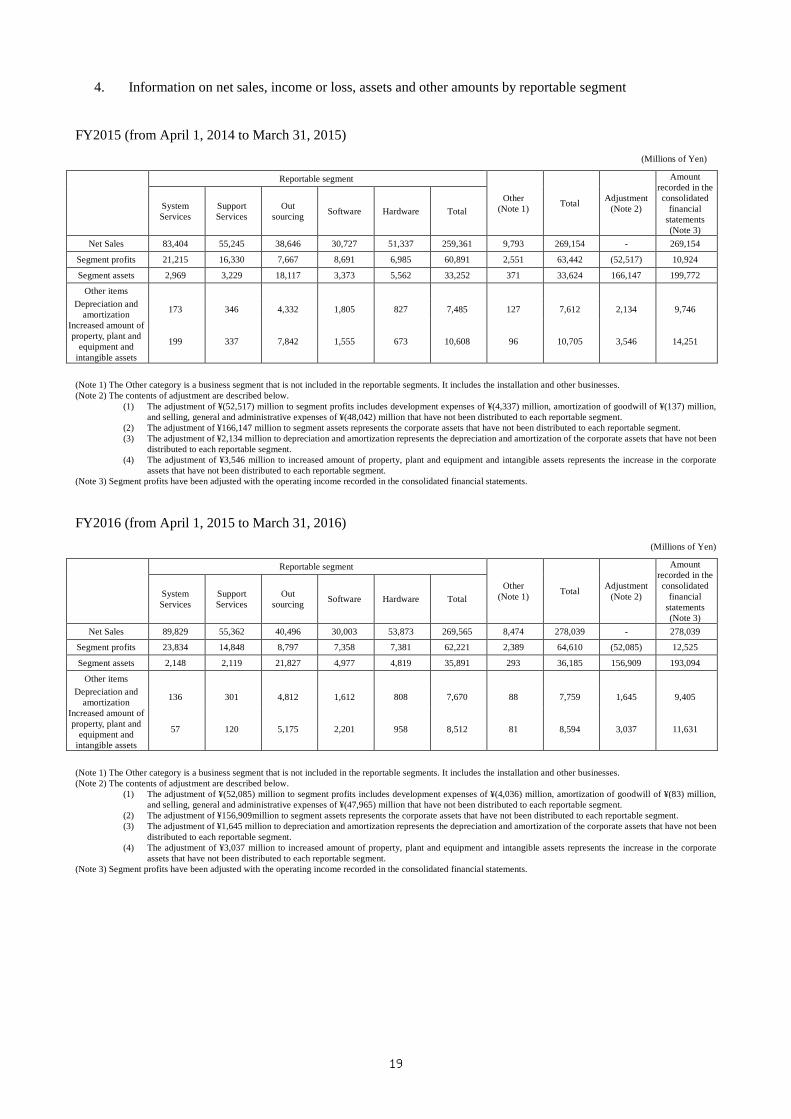
4. Information on net sales, income or loss, assets and other amounts by reportable segment
(Note 1) The Other category is a business segment that is not included in the reportable segments. It includes the installation and other businesses. (Note 2) The contents of adjustment are described below.
(1) The adjustment of ¥(52,517) million to segment profits includes development expenses of ¥(4,337) million, amortization of goodwill of ¥(137) million, and selling, general and administrative expenses of ¥(48,042) million that have not been distributed to each reportable segment.
(2) The adjustment of ¥166,147 million to segment assets represents the corporate assets that have not been distributed to each reportable segment. (3) The adjustment of ¥2,134 million to depreciation and amortization represents the depreciation and amortization of the corporate assets that have not been
distributed to each reportable segment. (4) The adjustment of ¥3,546 million to increased amount of property, plant and equipment and intangible assets represents the increase in the corporate
assets that have not been distributed to each reportable segment. (Note 3) Segment profits have been adjusted with the operating income recorded in the consolidated financial statements.
(Note 1) The Other category is a business segment that is not included in the reportable segments. It includes the installation and other businesses. (Note 2) The contents of adjustment are described below.
(1) The adjustment of ¥(52,085) million to segment profits includes development expenses of ¥(4,036) million, amortization of goodwill of ¥(83) million, and selling, general and administrative expenses of ¥(47,965) million that have not been distributed to each reportable segment.
(2) The adjustment of ¥156,909million to segment assets represents the corporate assets that have not been distributed to each reportable segment. (3) The adjustment of ¥1,645 million to depreciation and amortization represents the depreciation and amortization of the corporate assets that have not been
distributed to each reportable segment. (4) The adjustment of ¥3,037 million to increased amount of property, plant and equipment and intangible assets represents the increase in the corporate
assets that have not been distributed to each reportable segment. (Note 3) Segment profits have been adjusted with the operating income recorded in the consolidated financial statements.
20
(Related information) FY2015 (from April 1, 2014 to March 31, 2015) 1. Information by product and service
Information by product and service is not described because the same information is stated as part of segment information.
2. Information by region
(1) Net sales Net sales by region are not disclosed because the amount of net sales to customers in Japan accounts for more than 90% of the amount of net sales of consolidated statements of income.
(2) Property, plant and equipment Property, plant and equipment by region are not disclosed because the amount of property, plant and equipment that are located in Japan accounts for more than 90% of the amount of property, plant and equipment of consolidated balance sheets.
3. Information by major customer
No major customer is stated because no customer accounted for more than 10% of net sales as stated in the consolidated statements of income.
FY2016 (from April 1, 2015 to March 31, 2016) 1. Information by product and service
Information by product and service is not described because the same information is stated as part of segment information.
2. Information by region
(1) Net sales Net sales by region are not disclosed because the amount of net sales to customers in Japan
accounts for more than 90% of the amount of net sales of consolidated statements of income. (2) Property, plant and equipment
Property, plant and equipment by region are not disclosed because the amount of property, plant and equipment that are located in Japan accounts for more than 90% of the amount of property, plant and equipment of consolidated balance sheets.
3. Information by major customer
No major customer is stated because no customer accounted for more than 10% of net sales as stated in the consolidated statements of income.
21
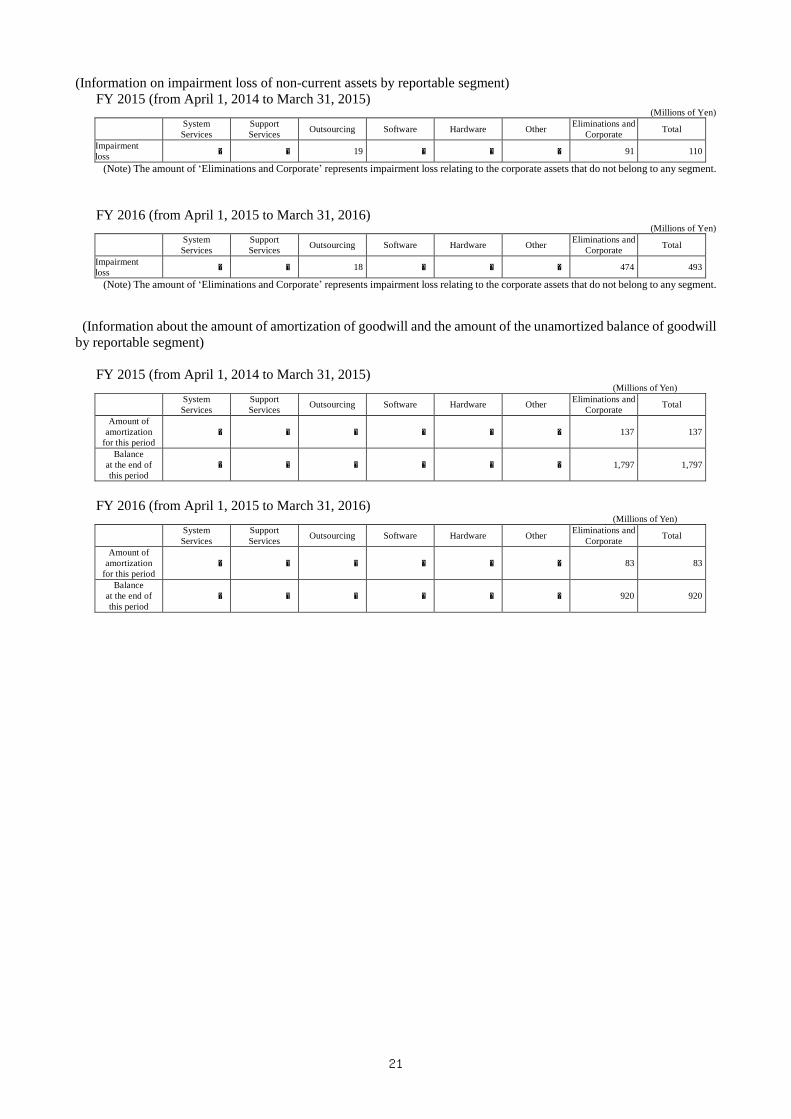
(Information on impairment loss of non-current assets by reportable segment) FY 2015 (from April 1, 2014 to March 31, 2015) (Millions of Yen)
System Services
Support Services Outsourcing Software Hardware Other Eliminations and
Corporate Total
Impairment loss - - 19 - - - 91 110
(Note) The amount of ‘Eliminations and Corporate’ represents impairment loss relating to the corporate assets that do not belong to any segment.
FY 2016 (from April 1, 2015 to March 31, 2016) (Millions of Yen) System
Services Support Services Outsourcing Software Hardware Other Eliminations and
Corporate Total
Impairment loss - - 18 - - - 474 493
(Note) The amount of ‘Eliminations and Corporate’ represents impairment loss relating to the corporate assets that do not belong to any segment. (Information about the amount of amortization of goodwill and the amount of the unamortized balance of goodwill by reportable segment)
FY 2015 (from April 1, 2014 to March 31, 2015) (Millions of Yen)
System Services
Support Services Outsourcing Software Hardware Other Eliminations and
Corporate Total
Amount of amortization
for this period - - - - - - 137 137
Balance at the end of this period
- - - - - - 1,797 1,797
FY 2016 (from April 1, 2015 to March 31, 2016)
(Millions of Yen)
System Services
Support Services Outsourcing Software Hardware Other Eliminations and
Corporate Total
Amount of amortization
for this period - - - - - - 83 83
Balance at the end of this period
- - - - - - 920 920
22
(Per-Share Information)
FY 2015 (from April 1, 2014 to March 31, 2015)
FY 2016 (from April 1, 2015 to March 31, 2016)
Net assets per share (¥) 861.53 847.51 Earnings per share (¥) 77.07 93.71 Diluted earnings per share (¥) 66.72 82.33
Note: 1. The basic information used to calculate earnings per share or diluted earnings per share is as follows.
FY 2015 (from April 1, 2014 to March 31, 2015)
FY 2016 (from April 1, 2015 to March 31, 2016)
Earnings per share
Profit attributable to owners parent for the year (¥ mil) 7,246 8,920 Amount that does not belong to ordinary shareholders (¥ mil) - - Profit attributable to owners of parent, available to common stock (¥ mil) 7,246 8,920
Average number of common stock outstanding during the year (thousand shares) 94,017 95,187
Diluted earnings per share
Adjustments to profit attributable to owners of parent (¥ mil) -48 -41 (Interest expenses (after the adjustment of amount equivalent to tax) (¥mil)) (Note 2) (-48) (-45)
(Conversion commission (after the adjustment of amount equivalent to tax) (¥mil)) - (4)
Increase of common stock (thousand shares) 13,854 12,656
(Convertible bond (thousand shares)) (13,464) (12,281)
(Subscription rights to shares (thousand shares)) (389) (374) Dilutive shares, which were not included in the calculation of diluted earnings per share, due to lack of dilution effect Subscription rights to shares
-
Day when an extraordinary resolution was adopted at general shareholders’ meetings
June 27, 2008 (4,476 units of subscription rights to shares)
Note: 2. The amount represents the amount of amortization for the fiscal year ended March 31, 2016 for the amount of difference resulted from issuing
at a higher price than the face amount of bond. (Note that the amount equivalent to tax has been deducted.)
3. The basic information used to calculate net asset per share is as follows.
FY 2015 (from April 1, 2014 to March 31, 2015)
FY 2016 (from April 1, 2015 to March 31, 2016)
Total net assets (¥ mil) 81,975 91,213
Amounts to be deducted from the total net assets (¥ mil) 957 845
(Deposit for subscriptions to treasury shares) (¥ mil) (2) (6)
(Subscription rights to shares) (¥ mil) (366) (269)
(Non-controlling interests) (¥ mil) (587) (569)
Net assets at the end of period attributable to common stock (¥ mil) 81,018 90,368 Number of common stock at the end of period utilized for the calculation of net assets per share (thousand shares) 94,039 106,627