Page 1
Consolidated Financial Results
for the Fiscal Year Ended March 31, 2015
[Japanese GAAP]
May 8, 2015
Company name: MIRAIT Holdings Corporation
Stock exchange listing: TSE
Code number: 1417
URL: http://www.mirait.co.jp/
Representative: Masatoshi Suzuki, President and CEO
Contact: Manabu Kiriyama, Director and CFO
Phone: +81-3-6807-3124
Scheduled date of Ordinary General Meeting of Shareholders: June 25, 2015
Scheduled date of commencing dividend payments: June 26, 2015
Scheduled date of filing annual securities report: June 26, 2015
Availability of supplementary briefing material on annual results: available
Schedule of quarterly results briefing session: scheduled (for analysts and institutional investors)
(Amounts of less than one million yen are rounded down.)
1. Consolidated Financial Results for the Fiscal Year Ended March 31, 2015 (April 1, 2014 to March 31, 2015)
(1) Consolidated Operating Results (% indicates changes from the previous period.)
Net sales Operating income Ordinary income Net income million yen % million yen % million yen % million yen %
Fiscal year ended March 31, 2015
283,747 2.2 14,139 23.4 14,834 20.9 11,108 54.6
Fiscal year ended March 31, 2014
277,720 2.5 11,454 5.6 12,267 4.3 7,186 71.1
(Note) Comprehensive income: Fiscal year ended March 31, 2015:12,835 million yen (48.1%) Fiscal year ended March 31, 2014:8,664 million yen (66.5%)
Net income per share Diluted net income per
share
Return on equity
Ordinary income to total
assets
Operating income to net
sales yen yen % % %
Fiscal year ended March 31, 2015
136.58 ― 9.5 8.0 5.0
Fiscal year ended March 31, 2014
87.30 ― 6.7 7.0 4.1
(Reference) Equity in earnings (losses) of affiliated companies: Fiscal year ended March 31, 2015: 52 million yen Fiscal year ended March 31, 2014: (40 million yen)
(2) Consolidated Financial Position
Total assets Net assets Equity ratio Net assets per share million yen million yen % yen
Fiscal Year Ended March 31, 2015
192,700 126,184 63.8 1,510.59
Fiscal year ended March 31, 2014
175,992 114,173 63.0 1,362.61
(Reference) Equity: Fiscal year ended March 31, 2015: 122,860 million yen Fiscal year ended March 31, 2014: 110,827 million yen
-1-
Page 2
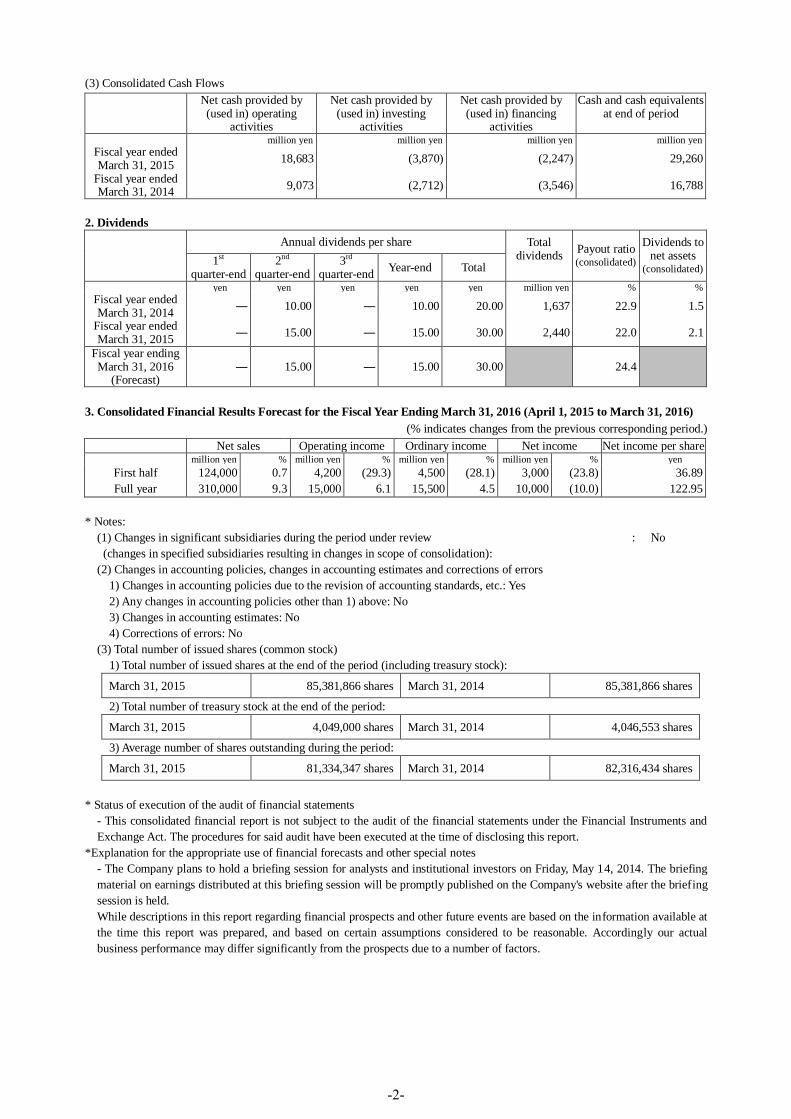
(3) Consolidated Cash Flows
Net cash provided by (used in) operating
activities
Net cash provided by (used in) investing
activities
Net cash provided by (used in) financing
activities
Cash and cash equivalents at end of period
million yen million yen million yen million yen
Fiscal year ended March 31, 2015
18,683 (3,870) (2,247) 29,260
Fiscal year ended March 31, 2014
9,073 (2,712) (3,546) 16,788
2. Dividends
Annual dividends per share Total
dividends
Payout ratio (consolidated)
Dividends to net assets
(consolidated) 1st
quarter-end 2nd
quarter-end 3rd
quarter-end Year-end Total
yen yen yen yen yen million yen % %
Fiscal year ended March 31, 2014
― 10.00 ― 10.00 20.00 1,637 22.9 1.5
Fiscal year ended March 31, 2015
― 15.00 ― 15.00 30.00 2,440 22.0 2.1
Fiscal year ending March 31, 2016
(Forecast) ― 15.00 ― 15.00 30.00 24.4
3. Consolidated Financial Results Forecast for the Fiscal Year Ending March 31, 2016 (April 1, 2015 to March 31, 2016)
(% indicates changes from the previous corresponding period.)
Net sales Operating income Ordinary income Net income Net income per share million yen % million yen % million yen % million yen % yen
First half 124,000 0.7 4,200 (29.3) 4,500 (28.1) 3,000 (23.8) 36.89
Full year 310,000 9.3 15,000 6.1 15,500 4.5 10,000 (10.0) 122.95
* Notes:
(1) Changes in significant subsidiaries during the period under review
(changes in specified subsidiaries resulting in changes in scope of consolidation):
: No
(2) Changes in accounting policies, changes in accounting estimates and corrections of errors
1) Changes in accounting policies due to the revision of accounting standards, etc.: Yes
2) Any changes in accounting policies other than 1) above: No
3) Changes in accounting estimates: No
4) Corrections of errors: No
(3) Total number of issued shares (common stock)
1) Total number of issued shares at the end of the period (including treasury stock):
March 31, 2015 85,381,866 shares March 31, 2014 85,381,866 shares
2) Total number of treasury stock at the end of the period:
March 31, 2015 4,049,000 shares March 31, 2014 4,046,553 shares
3) Average number of shares outstanding during the period:
March 31, 2015 81,334,347 shares March 31, 2014 82,316,434 shares
* Status of execution of the audit of financial statements
- This consolidated financial report is not subject to the audit of the financial statements under the Financial Instruments and
Exchange Act. The procedures for said audit have been executed at the time of disclosing this report.
*Explanation for the appropriate use of financial forecasts and other special notes
- The Company plans to hold a briefing session for analysts and institutional investors on Friday, May 14, 2014. The briefing
material on earnings distributed at this briefing session will be promptly published on the Company's website after the briefing
session is held.
While descriptions in this report regarding financial prospects and other future events are based on the information available at
the time this report was prepared, and based on certain assumptions considered to be reasonable. Accordingly our actual
business performance may differ significantly from the prospects due to a number of factors.
-2-
Page 3
Contents of Appendix
1. Analysis of Operating Results and Financial Position 2
(1) Analysis of Operating Results 2
(2) Analysis of Financial Position 5
(3) Basic Policy of Appropriation of Profits and Dividend Payment for Current Fiscal Year and
Next Fiscal Year 6
(4) Business Risks 7
2. Overview of the Corporate Group 8
3. Management Policies 9
(1) Basic Management Policies 9
(2) Targeted Management Benchmarks 9
(3) Medium- to Long-term Management Strategies 9
(4) Issues to be Addressed 10
4. Basic Approach Concerning the Selection of Accounting Policies 10
5. Consolidated Financial Statements 11
(1) Consolidated Balance Sheets 11
(2) Consolidated Statements of Income and Comprehensive Income 13
(3) Consolidated Statement of Changes in Net Assets 15
(4) Consolidated Statement of Cash Flows 17
(5) Notes to Consolidated Financial Statements 19
(Notes on Going Concern Assumption) 19
(Changes in Accounting Policies) 19
(Changes in Presentation Method) 19
(Additional Information) 19
(Segment Information) 20
(Per Share Information) 23
(Significant Subsequent Events) 23
-3-
Page 4
1. Analysis of Operating Results and Financial Position
(1) Analysis of Operating Results
Although the impact of the increased consumption tax was prolonged and there was a slump in the
overseas economy, the Japanese economy underwent an a moderate recovery in the fiscal year ended
March 31, 2015, such as steady improvements in employment conditions and corporate earnings.
In the telecommunications sector, new demand for wholesaling of optical lines was seen as the fixed
broadband market matured. Meanwhile, smartphones and tablets have become more widespread in mobile
communications, and the telecommunications carriers who are MIRAIT's main clients are focusing on the
implementation of fixed pricing plans and expansion into new usage situations. In order to respond to
rapidly increasing traffic, these carriers are swiftly building high-speed broadband mobile networks such
as LTE and Wi-Fi.
Furthermore, in addition to movements toward the liberalization of the electric power market and
environmental and energy issues, there are heightening expectations in the rebuilding of social
infrastructure due to the Olympic and Paralympic Games being held in Tokyo in 2020, resulting in
significant changes to the environment surrounding the MIRAIT Group.
In order to actively track such changes in the business environment and to enhance corporate value and
achieving sustained growth as a “Comprehensive Engineering & Service Company,” the MIRAIT Group
has established a three-year medium-term management plan beginning in the year ended March 31, 2015
(targets for the year ending March 31, 2017: sales of 310,000 million yen, operating income of 17,000
million yen, operating margin of 5.5%, ROE of 8% or more), and is actively expanding its scope of
business and strengthening its management base.
In NTT business, the Company engaged in business reforms such as shifting personnel to growing
businesses and consolidating offices.
In the multi-carrier business, the Company strengthened support for a high volume of small-scale
projects such as LTE and worked to improve productivity, in addition to converting an Australian local
subsidiary into a consolidated subsidiary.
In the environmental & social innovation and ICT solution business, MIRAIT worked to build solar
power facilities, install EV charging equipment, and expand large-scale network projects in universities
and enterprises, in addition to actively developing new business areas such as commencing the provision
of the ee-TaB Plus tablet service for hotels.
Consequently, in the consolidated business performance at the end of current fiscal year, orders received
amounted to 293,690 million yen (up 4.1% year-on-year) and net sales were 283,747 million yen (up 2.2%
year-on-year). In terms of profit, operating income was 14,139 million yen (up 23.4% year-on-year) and
ordinary income was 14,834 million yen (up 20.9% year-on-year). Net income increased significantly to
11,108 million yen (up 54.6% year-on-year) partly due to the recording of extraordinary income associated
with the revision of the retirement benefits system and pension assets in subsidiaries.
-4-
Page 5
[Business Results of MIRAIT]
MIRAIT has actively engaged in the creation and establishment of all kinds of networks aimed at
diversifying and advancing services as a “Comprehensive Engineering & Service Company” with the
aim of achieving the targets set out in the medium-term management plan.
In the NTT business, personnel have been shifted to growing areas, and we have also made an effort to
improve productivity and increase business efficiency through moves such as the establishment of the
Fujisawa Technical Center in Kanagawa Prefecture and the consolidation of work offices in the
prefecture.
In the multi-carrier business, we have proceeded to improve business efficiency by strengthening
management aimed at performing a high volume of small-scale projects such as LTE. Furthermore, we
established the Next Generation Mobile Business Creation Headquarters, and worked to expand
business peripheral to mobile carriers and new business utilizing mobile technologies.
In the environmental & social innovation and ICT solution business, MIRAIT worked to build solar
power facilities, install EV charging equipment, develop software, and conduct large-scale network
projects such as upgrading PBX in universities, in addition to actively developing new business areas
such as commencing the provision of the ee-TaB Plus information service for hotel guests. Furthermore,
we strengthened sales by establishing the ICT Sales & Marketing Group, the Environment & Energy
Sales and Marketing Group and the Social Infrastructure Sales & Marketing Group in order to expand
businesses that will serve as drivers for future growth, while also working to promote the development
of business through the establishment of a new incubation organization.
As a result of the above, in the consolidated results for the year ended March 31, 2015, orders
received were 189,953 million yen (up 2.3% year-on-year), net sales were 187,999 million yen (up 1.6%
year-on-year), and operating income was 11,477 million yen (up 26.8% year-on-year).
[Business Results of MIRAIT Technologies]
MIRAIT Technologies, placing the highest priority on ensuring safety, improving quality and
thorough compliance, has made an effort to secure profits in the NTT business by expanding facility
management services, promoting work across a wide area such as post-earthquake reconstruction work
and pole renewal, and consolidating technical centers.
In the multi-carrier business, we engaged in the generation of profit such as improving the efficiency
of allocation of personnel to match decreased capital expenditure by mobile carriers and the utilization
of business support systems, and also made an effort to expand fixed communication services such as
network transmission design. In global business, the management of our Australian local subsidiary was
consolidated and business expanded with the launch of MIRAIT Technologies Australia Pty. Limited. In
addition, further efforts were made to expand business in Myanmar and other rapidly growing
economies in the Asia-Pacific region.
In the environmental & social innovation and ICT solution business, we fully engaged in the
construction and maintenance of solar power facilities, and established a Hong Kong branch office to
facilitate procurement of solar panels from China. Moreover, we have been actively engaged in a wide
range of areas utilizing ICT, such as commencing field tests of new wireless networks for power and gas
meters using the 280MHz band previously used by pagers.
As a result of the above, in the consolidated results for the year ended March 31, 2015, orders
received were 115,154 million yen (up 4.2% year-on-year), net sales were 107,240 million yen (up 3.7%
year-on-year), and operating income was 2,393 million yen (up 14.7% year-on-year).
-5-
Page 6
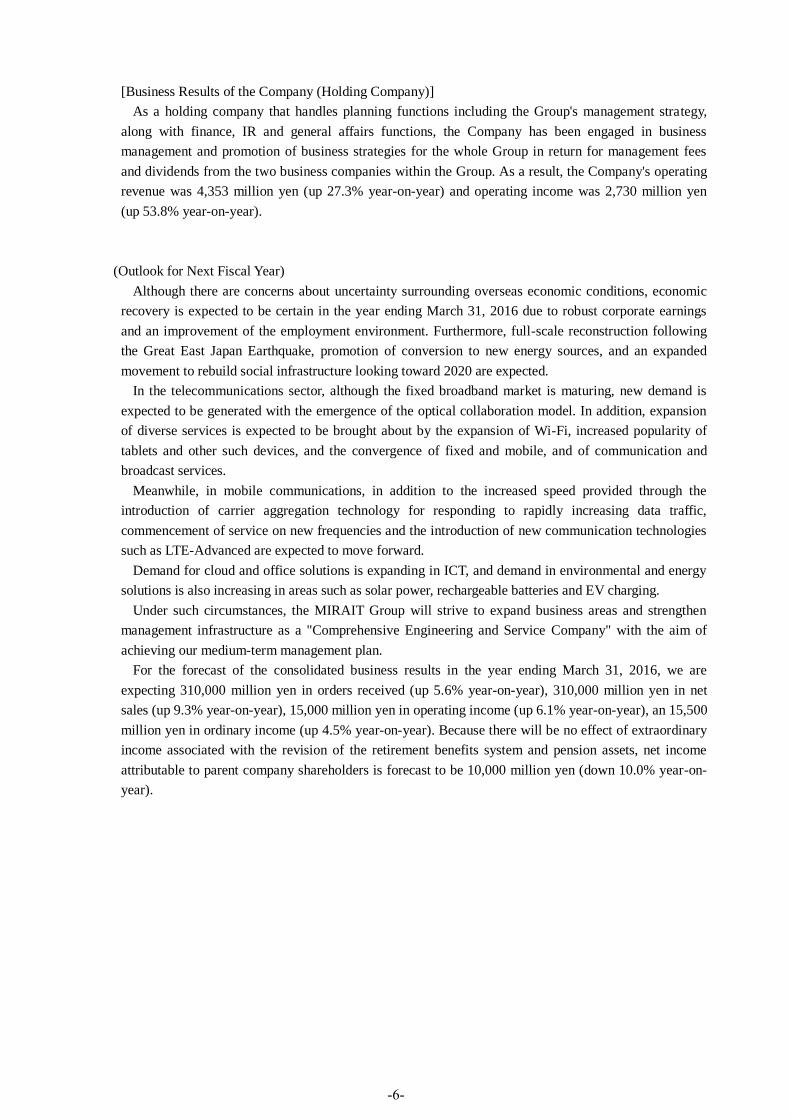
[Business Results of the Company (Holding Company)]
As a holding company that handles planning functions including the Group's management strategy,
along with finance, IR and general affairs functions, the Company has been engaged in business
management and promotion of business strategies for the whole Group in return for management fees
and dividends from the two business companies within the Group. As a result, the Company's operating
revenue was 4,353 million yen (up 27.3% year-on-year) and operating income was 2,730 million yen
(up 53.8% year-on-year).
(Outlook for Next Fiscal Year)
Although there are concerns about uncertainty surrounding overseas economic conditions, economic
recovery is expected to be certain in the year ending March 31, 2016 due to robust corporate earnings
and an improvement of the employment environment. Furthermore, full-scale reconstruction following
the Great East Japan Earthquake, promotion of conversion to new energy sources, and an expanded
movement to rebuild social infrastructure looking toward 2020 are expected.
In the telecommunications sector, although the fixed broadband market is maturing, new demand is
expected to be generated with the emergence of the optical collaboration model. In addition, expansion
of diverse services is expected to be brought about by the expansion of Wi-Fi, increased popularity of
tablets and other such devices, and the convergence of fixed and mobile, and of communication and
broadcast services.
Meanwhile, in mobile communications, in addition to the increased speed provided through the
introduction of carrier aggregation technology for responding to rapidly increasing data traffic,
commencement of service on new frequencies and the introduction of new communication technologies
such as LTE-Advanced are expected to move forward.
Demand for cloud and office solutions is expanding in ICT, and demand in environmental and energy
solutions is also increasing in areas such as solar power, rechargeable batteries and EV charging.
Under such circumstances, the MIRAIT Group will strive to expand business areas and strengthen
management infrastructure as a "Comprehensive Engineering and Service Company" with the aim of
achieving our medium-term management plan.
For the forecast of the consolidated business results in the year ending March 31, 2016, we are
expecting 310,000 million yen in orders received (up 5.6% year-on-year), 310,000 million yen in net
sales (up 9.3% year-on-year), 15,000 million yen in operating income (up 6.1% year-on-year), an 15,500
million yen in ordinary income (up 4.5% year-on-year). Because there will be no effect of extraordinary
income associated with the revision of the retirement benefits system and pension assets, net income
attributable to parent company shareholders is forecast to be 10,000 million yen (down 10.0% year-on-
year).
-6-
Page 7
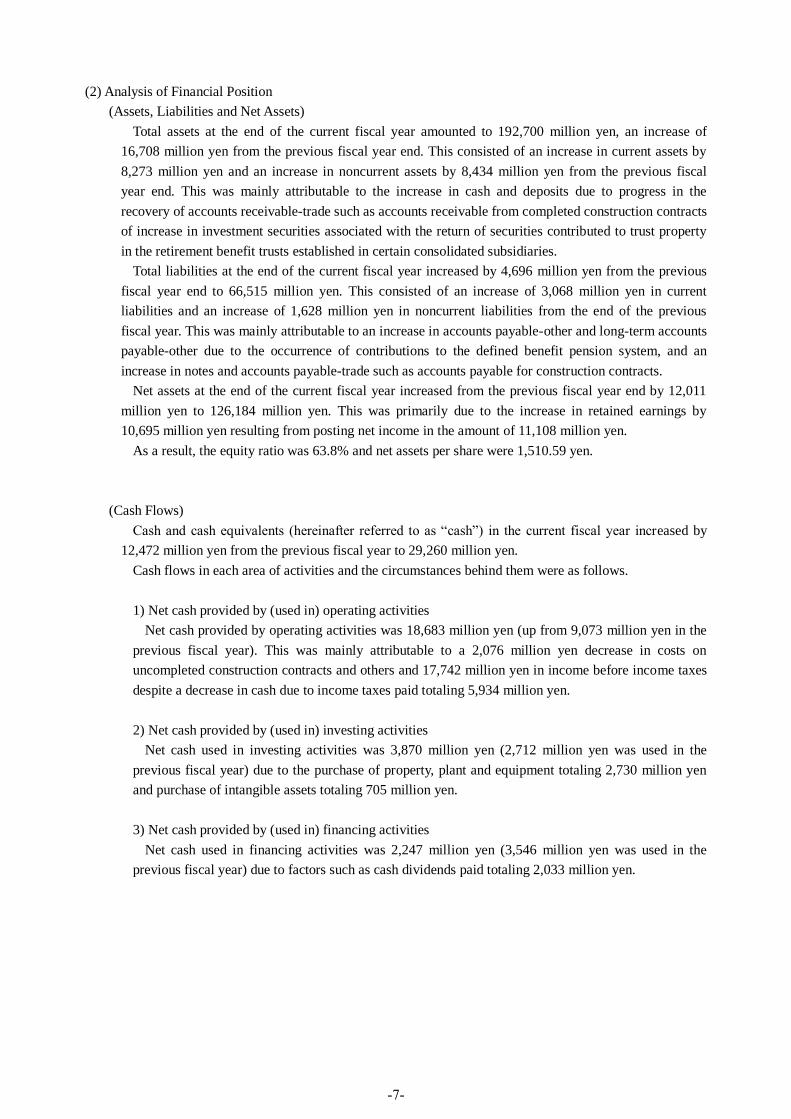
(2) Analysis of Financial Position
(Assets, Liabilities and Net Assets)
Total assets at the end of the current fiscal year amounted to 192,700 million yen, an increase of
16,708 million yen from the previous fiscal year end. This consisted of an increase in current assets by
8,273 million yen and an increase in noncurrent assets by 8,434 million yen from the previous fiscal
year end. This was mainly attributable to the increase in cash and deposits due to progress in the
recovery of accounts receivable-trade such as accounts receivable from completed construction contracts
of increase in investment securities associated with the return of securities contributed to trust property
in the retirement benefit trusts established in certain consolidated subsidiaries.
Total liabilities at the end of the current fiscal year increased by 4,696 million yen from the previous
fiscal year end to 66,515 million yen. This consisted of an increase of 3,068 million yen in current
liabilities and an increase of 1,628 million yen in noncurrent liabilities from the end of the previous
fiscal year. This was mainly attributable to an increase in accounts payable-other and long-term accounts
payable-other due to the occurrence of contributions to the defined benefit pension system, and an
increase in notes and accounts payable-trade such as accounts payable for construction contracts.
Net assets at the end of the current fiscal year increased from the previous fiscal year end by 12,011
million yen to 126,184 million yen. This was primarily due to the increase in retained earnings by
10,695 million yen resulting from posting net income in the amount of 11,108 million yen.
As a result, the equity ratio was 63.8% and net assets per share were 1,510.59 yen.
(Cash Flows)
Cash and cash equivalents (hereinafter referred to as “cash”) in the current fiscal year increased by
12,472 million yen from the previous fiscal year to 29,260 million yen.
Cash flows in each area of activities and the circumstances behind them were as follows.
1) Net cash provided by (used in) operating activities
Net cash provided by operating activities was 18,683 million yen (up from 9,073 million yen in the
previous fiscal year). This was mainly attributable to a 2,076 million yen decrease in costs on
uncompleted construction contracts and others and 17,742 million yen in income before income taxes
despite a decrease in cash due to income taxes paid totaling 5,934 million yen.
2) Net cash provided by (used in) investing activities
Net cash used in investing activities was 3,870 million yen (2,712 million yen was used in the
previous fiscal year) due to the purchase of property, plant and equipment totaling 2,730 million yen
and purchase of intangible assets totaling 705 million yen.
3) Net cash provided by (used in) financing activities
Net cash used in financing activities was 2,247 million yen (3,546 million yen was used in the
previous fiscal year) due to factors such as cash dividends paid totaling 2,033 million yen.
-7-
Page 8
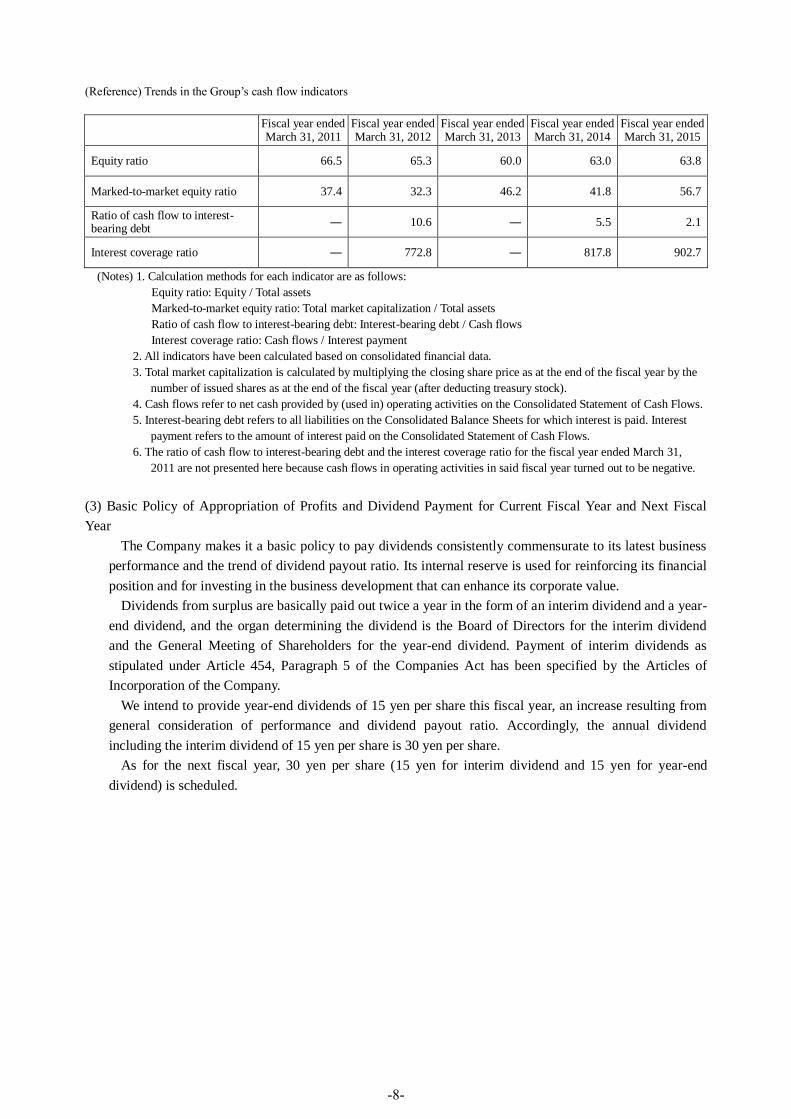
(Reference) Trends in the Group’s cash flow indicators
Fiscal year ended March 31, 2011
Fiscal year ended March 31, 2012
Fiscal year ended March 31, 2013
Fiscal year ended March 31, 2014
Fiscal year ended March 31, 2015
Equity ratio 66.5 65.3 60.0 63.0 63.8
Marked-to-market equity ratio 37.4 32.3 46.2 41.8 56.7
Ratio of cash flow to interest-bearing debt
― 10.6 ― 5.5 2.1
Interest coverage ratio ― 772.8 ― 817.8 902.7
(Notes) 1. Calculation methods for each indicator are as follows:
Equity ratio: Equity / Total assets
Marked-to-market equity ratio: Total market capitalization / Total assets
Ratio of cash flow to interest-bearing debt: Interest-bearing debt / Cash flows
Interest coverage ratio: Cash flows / Interest payment
2. All indicators have been calculated based on consolidated financial data.
3. Total market capitalization is calculated by multiplying the closing share price as at the end of the fiscal year by the
number of issued shares as at the end of the fiscal year (after deducting treasury stock).
4. Cash flows refer to net cash provided by (used in) operating activities on the Consolidated Statement of Cash Flows.
5. Interest-bearing debt refers to all liabilities on the Consolidated Balance Sheets for which interest is paid. Interest
payment refers to the amount of interest paid on the Consolidated Statement of Cash Flows.
6. The ratio of cash flow to interest-bearing debt and the interest coverage ratio for the fiscal year ended March 31,
2011 are not presented here because cash flows in operating activities in said fiscal year turned out to be negative.
(3) Basic Policy of Appropriation of Profits and Dividend Payment for Current Fiscal Year and Next Fiscal
Year
The Company makes it a basic policy to pay dividends consistently commensurate to its latest business
performance and the trend of dividend payout ratio. Its internal reserve is used for reinforcing its financial
position and for investing in the business development that can enhance its corporate value.
Dividends from surplus are basically paid out twice a year in the form of an interim dividend and a year-
end dividend, and the organ determining the dividend is the Board of Directors for the interim dividend
and the General Meeting of Shareholders for the year-end dividend. Payment of interim dividends as
stipulated under Article 454, Paragraph 5 of the Companies Act has been specified by the Articles of
Incorporation of the Company.
We intend to provide year-end dividends of 15 yen per share this fiscal year, an increase resulting from
general consideration of performance and dividend payout ratio. Accordingly, the annual dividend
including the interim dividend of 15 yen per share is 30 yen per share.
As for the next fiscal year, 30 yen per share (15 yen for interim dividend and 15 yen for year-end
dividend) is scheduled.
-8-
Page 9
(4) Business Risks
The MIRAIT Group is exposed to the following risks that could have impact on its operating results and
financial position. Forward-looking statements contained herein are based on the Group’s judgment as at
the end of the fiscal year ended March 31, 2014.
1) Risks associated with excessive dependence on particular clients
Principal clients of MIRAIT Group are telecommunications carriers such as the NTT Group, and owing
to the fact that they account for a large portion of net sales, their capital expenditures or technological
breakthroughs and other factors could have an impact on the Group’s business performance.
2) Risks associated with safety and quality issues
The MIRAIT Group is wholly committed to the safety and quality control over its engineering works to
deliver quality engineering and services that deserve customers’ trust and appreciation by making use of
the safety and quality management system operated by the two business companies.
However, in the event serious accidents or other contingencies occur, these could have serious social
consequences and result in the loss of clients’ confidence and restriction on the Group’s operating
activities, and have an impact on its business results.
3) Risks associated with the management of critical information
In handling the critical information such as technical data and personal information from the clients, the
MIRAIT Group is wholly committed to the prevention of leakage of classified information through the use
of
ISMS (information security management system) operated by the two business companies.
In the event of unforeseen information leakage, however, the Group may suffer liability for damages
with potential impact on its financial results, let alone loss of the clients’ confidence, which could have an
impact on the Group’s business results.
4) Risks associated with the clients’ credit uncertainty
The MIRAIT Group is adopting measures to avoid credit risks by using external credit agencies for
credit management regarding clients and the contract review by the legal section.
However, in the event the credit of clients is uncertain, the Group might not be able to collect fees for
engineering works or may be forced to delay works, which could have an impact on the Group's business
results.
5) Risks associated with assets held by the Group
The MIRAIT Group holds assets such as real estate and securities due to operational requirements, and
significant fluctuation of the fair values thereof could have an impact on the Group’s business results.
6) Risks associated with natural disasters
The MIRAIT Group has adopted countermeasures against events such as natural disasters including
earthquakes, but the occurrence of contingencies such as shortages of electricity, fuel or materials resulting
from such events could have an impact on the Group's business results.
-9-
Page 10
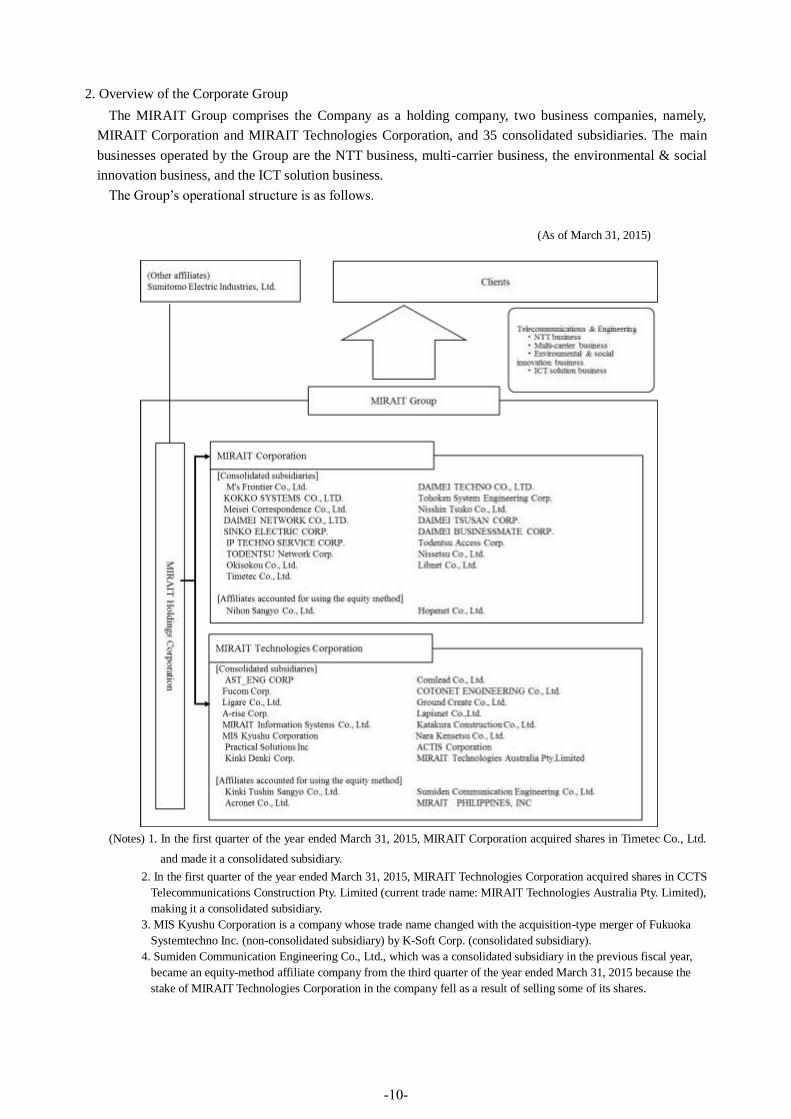
2. Overview of the Corporate Group
The MIRAIT Group comprises the Company as a holding company, two business companies, namely,
MIRAIT Corporation and MIRAIT Technologies Corporation, and 35 consolidated subsidiaries. The main
businesses operated by the Group are the NTT business, multi-carrier business, the environmental & social
innovation business, and the ICT solution business.
The Group’s operational structure is as follows.
(As of March 31, 2015)
(Notes) 1. In the first quarter of the year ended March 31, 2015, MIRAIT Corporation acquired shares in Timetec Co., Ltd.
and made it a consolidated subsidiary.
2. In the first quarter of the year ended March 31, 2015, MIRAIT Technologies Corporation acquired shares in CCTS
Telecommunications Construction Pty. Limited (current trade name: MIRAIT Technologies Australia Pty. Limited),
making it a consolidated subsidiary.
3. MIS Kyushu Corporation is a company whose trade name changed with the acquisition-type merger of Fukuoka
Systemtechno Inc. (non-consolidated subsidiary) by K-Soft Corp. (consolidated subsidiary).
4. Sumiden Communication Engineering Co., Ltd., which was a consolidated subsidiary in the previous fiscal year,
became an equity-method affiliate company from the third quarter of the year ended March 31, 2015 because the
stake of MIRAIT Technologies Corporation in the company fell as a result of selling some of its shares.
-10-
Page 11
3. Management Policies
(1) Basic Management Policies
The Company will work to enhance corporate value and ensure sustained growth by:
(i) Striving to be a leading Japanese corporation that realizes the highest levels of customer satisfaction
and trust as a "Comprehensive Engineering & Services Company" that continually creates new value
centered on the field of information and telecommunications;
(ii) Contributing to the realization of an enriched and comfortable society by placing value on safety and
quality and offering the highest level of services.
(iii) Continuing to be an enterprise that coexists and mutually prospers with people and society as a
company that fulfils its corporate social responsibility and always respects human beings.
(2) Targeted Management Benchmarks
The MIRAIT Group has established a medium-term management plan starting in the year ended March
31, 2015, (targeting net sales of 310,000 million yen, operating income of 17,000 million yen, an
operating margin of 5. 5% and ROE of 8% or more in the fiscal year ending March 31, 2017) and aims to
attain these targets.
(3) Medium- to Long-term Management Strategies
The Group will accelerate the transformation of the business structure to respond to changes in the
external environment, and work to achieve sustained growth as a "Comprehensive Engineering & Service
Company" by focusing on improving efficiency in existing businesses and expanding drivers for future
growth.
-11-
Page 12
(4) Issues to be Addressed
The business environment surrounding the MIRAIT Group has reached a turning point. In the
telecommunications sector, diverse services are expanding through the convergence of fixed and mobile
communication and of communication and broadcasting services as a result of the emergence of optical
collaboration model and the expansion of Wi-Fi, and increased popularity of devices such as smartphones
and tablets.
Furthermore, in mobile communications, in addition to the increased speed provided through the
introduction of carrier aggregation technology, we are proceeding with the commencement of service on
new frequencies and the introduction of new communication technologies such as LTE-Advanced.
Furthermore, the promotion of growth strategies involving the public and private sectors working as one,
and the advancement and utilization of ICT provide the impetus for social innovation aimed at full-scale
reconstruction following the Great East Japan Earthquake, promotion of conversion to new energy sources,
the introduction of the My Number system and the reconstruction of social infrastructure aimed at the
2020 Tokyo Olympics and Paralympics are bringing about social innovation and new growth markets.
Under such business conditions, the Group needs to strengthen its technological capability and ability to
provide solutions, and work to restructure its business portfolio by actively expanding into many growth
areas such as cloud computing, office solutions, Wi-Fi solutions and new energy sources. Moreover, we
need to conduct business overseas by utilizing the business experience we have gained in Japan.
Meanwhile, in the NTT network engineering business, it is necessary to work to further improve
productivity and operational efficiency to respond to the decline in demand for optical related work
associated with the maturing of the fixed broadband market. Furthermore, in the mobile business, further
cost reductions and improvements in work efficiency need to be made due to the intensification of service
competition among telecommunications carriers and the reduction in scale of projects undertaken.
Under these circumstances, the MIRAIT Group will bring together the combined strength of the group
to take on the following challenges with the aim of attaining targets in the Medium-term Management Plan.
(i) Strengthening of business operation
- Support for improvement of efficiency and rebuilding of existing business
- Steady expansion of sales and improvement profitability in “drivers for future growth”
(ii) Strengthening of management foundation
- Strengthening formation inside and outside of the Group
- Strengthening of nationwide construction and maintenance organization
- Development of multi-skilled employees and acquisition of certified personnel
- Improvement of work platform for promoting the improvement of efficiency (utilization of the latest
ICT)
(iii) Transformation of corporate culture
- Founding of corporate culture of “safety first” and establishment of MIRAIT Quality
- Encouragement of a free-spirited culture and mentality of attacking challenges
- Promotion of CSR and enhancement of the MIRAIT brand
4. Basic Approach Concerning the Selection of Accounting Policies
The MIRAIT Group's operations are focused within Japan, and we intend to prepare consolidated financial
statements based on Japanese accounting standards for now, but we intend to consider the application of
IFRS (International Financial Reporting Standards) based on consideration of business developments
overseas and trends of adoption of IFRS within other companies in Japan.
<Notes>
This document contains forward-looking statements based on the plans, outlooks, management strategies and policies of
the Company as of the time of its issuance. Such forward-looking statements describe management judgments and
assumptions based on information available at this point in time.
As such, actual business results could be significantly different from which stated in this document due to changes in
conditions. Thus, please be advised that we will not be able to guarantee the accuracy of the forward-looking statements in
this document in the future.
-12-
Page 13
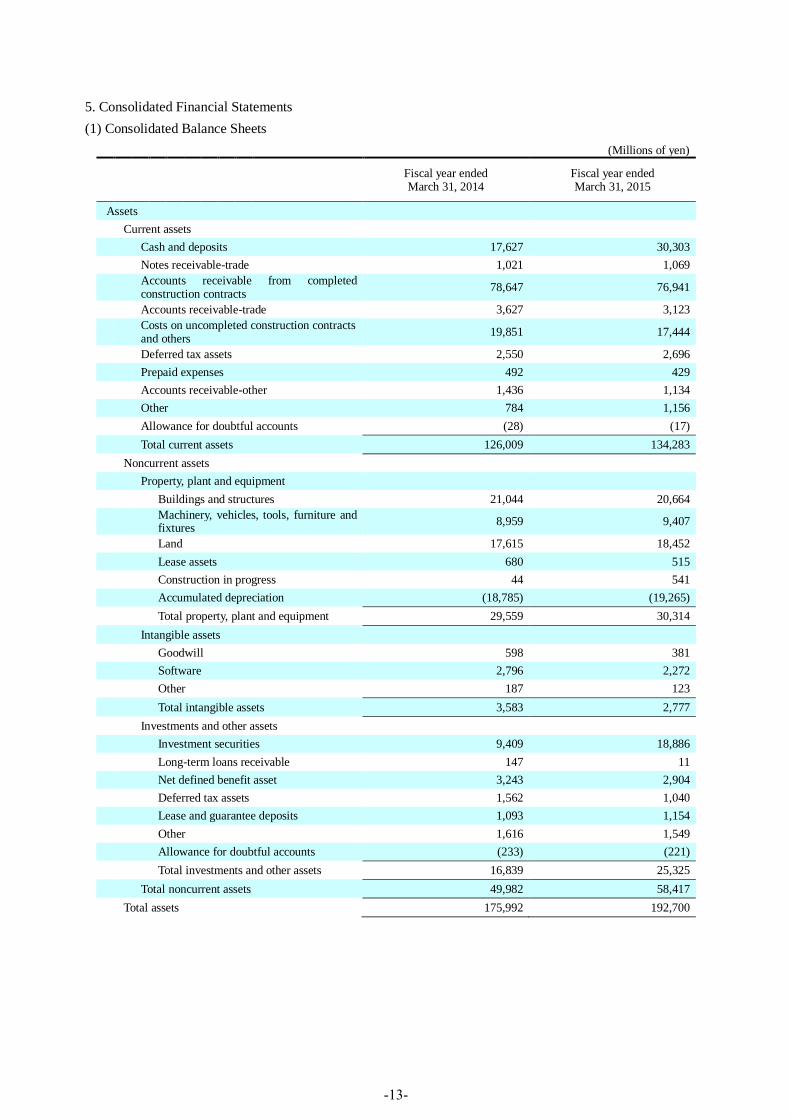
5. Consolidated Financial Statements
(1) Consolidated Balance Sheets
(Millions of yen)
Fiscal year ended March 31, 2014
Fiscal year ended March 31, 2015
Assets
Current assets
Cash and deposits 17,627 30,303
Notes receivable-trade 1,021 1,069
Accounts receivable from completed construction contracts
78,647 76,941
Accounts receivable-trade 3,627 3,123
Costs on uncompleted construction contracts and others
19,851 17,444
Deferred tax assets 2,550 2,696
Prepaid expenses 492 429
Accounts receivable-other 1,436 1,134
Other 784 1,156
Allowance for doubtful accounts (28) (17)
Total current assets 126,009 134,283
Noncurrent assets
Property, plant and equipment
Buildings and structures 21,044 20,664
Machinery, vehicles, tools, furniture and fixtures
8,959 9,407
Land 17,615 18,452
Lease assets 680 515
Construction in progress 44 541
Accumulated depreciation (18,785) (19,265)
Total property, plant and equipment 29,559 30,314
Intangible assets
Goodwill 598 381
Software 2,796 2,272
Other 187 123
Total intangible assets 3,583 2,777
Investments and other assets
Investment securities 9,409 18,886
Long-term loans receivable 147 11
Net defined benefit asset 3,243 2,904
Deferred tax assets 1,562 1,040
Lease and guarantee deposits 1,093 1,154
Other 1,616 1,549
Allowance for doubtful accounts (233) (221)
Total investments and other assets 16,839 25,325
Total noncurrent assets 49,982 58,417
Total assets 175,992 192,700
-13-
Page 14
(Millions of yen)
Fiscal year ended March 31, 2014
Fiscal year ended March 31, 2015
Liabilities
Current liabilities
Notes payable-trade 742 481
Construction in progress 33,919 35,448
Current portion of long-term loans payable 64 24
Accounts payable-other 1,717 2,897
Income taxes payable 2,959 2,059
Advances received on uncompleted construction contracts
1,388 1,702
Provision for loss on construction contracts 450 323
Provision for bonuses 4,278 4,106
Provision for directors' bonuses 78 72
Provision for warranties for completed construction
14 16
Other 3,961 5,509
Total current liabilities 49,575 52,643
Noncurrent liabilities
Long-term loans payable 60 36
Deferred tax liabilities 778 3,317
Deferred tax liabilities for land revaluation 44 42
Provision for directors' retirement benefits 175 125
Net defined benefit liability 9,926 7,943
Asset retirement obligations 59 86
Negative goodwill 268 -
Long-term accounts payable-other 329 1,860
Other 600 459
Total noncurrent liabilities 12,243 13,872
Total liabilities 61,818 66,515
Net assets
Shareholders' equity
Capital stock 7,000 7,000
Capital surplus 25,947 25,947
Retained earnings 76,775 87,471
Treasury stock (2,623) (2,626)
Total shareholders' equity 107,098 117,791
Accumulated other comprehensive income
Valuation difference on available-for-sale securities
1,971 3,109
Revaluation reserve for land (101) (100)
Foreign currency translation adjustment 56 1
Remeasurements of defined benefit plans 1,802 2,057
Total accumulated other comprehensive income
3,729 5,068
Minority interests 3,345 3,324
Total net assets 114,173 126,184
Total liabilities and net assets 175,992 192,700
-14-
Page 15
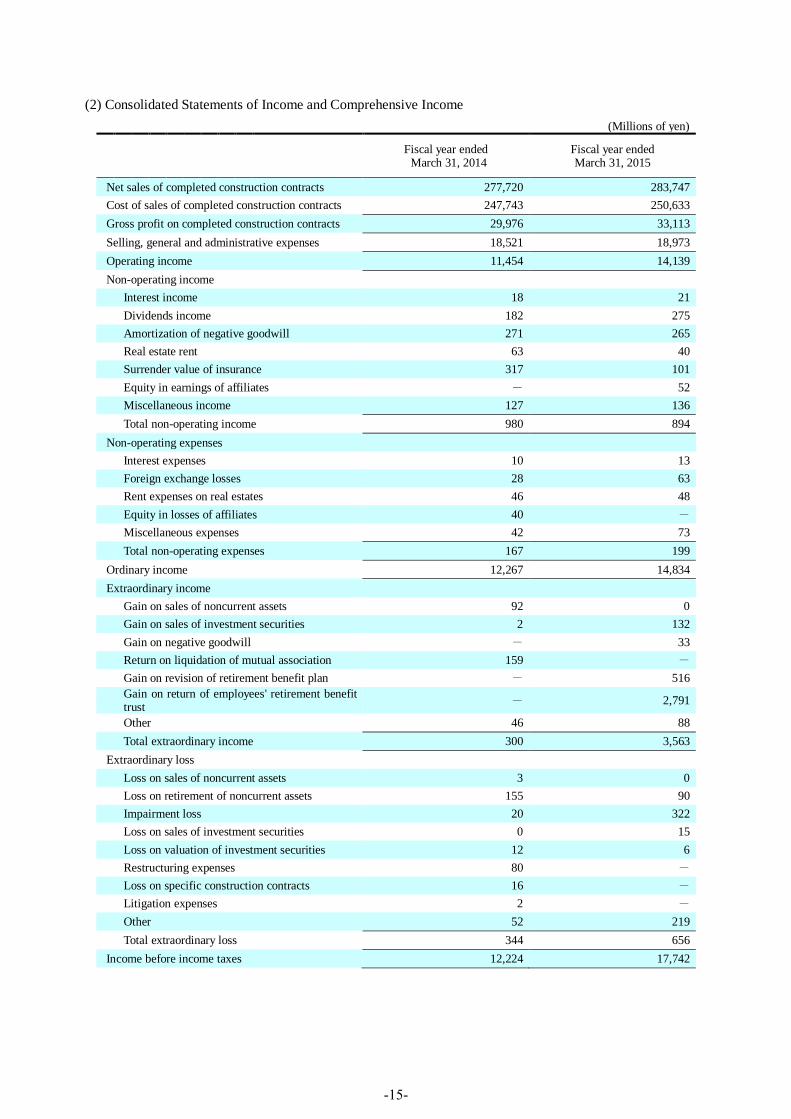
(2) Consolidated Statements of Income and Comprehensive Income
(Millions of yen)
Fiscal year ended March 31, 2014
Fiscal year ended March 31, 2015
Net sales of completed construction contracts 277,720 283,747
Cost of sales of completed construction contracts 247,743 250,633
Gross profit on completed construction contracts 29,976 33,113
Selling, general and administrative expenses 18,521 18,973
Operating income 11,454 14,139
Non-operating income
Interest income 18 21
Dividends income 182 275
Amortization of negative goodwill 271 265
Real estate rent 63 40
Surrender value of insurance 317 101
Equity in earnings of affiliates - 52
Miscellaneous income 127 136
Total non-operating income 980 894
Non-operating expenses
Interest expenses 10 13
Foreign exchange losses 28 63
Rent expenses on real estates 46 48
Equity in losses of affiliates 40 -
Miscellaneous expenses 42 73
Total non-operating expenses 167 199
Ordinary income 12,267 14,834
Extraordinary income
Gain on sales of noncurrent assets 92 0
Gain on sales of investment securities 2 132
Gain on negative goodwill - 33
Return on liquidation of mutual association 159 -
Gain on revision of retirement benefit plan - 516
Gain on return of employees' retirement benefit trust
- 2,791
Other 46 88
Total extraordinary income 300 3,563
Extraordinary loss
Loss on sales of noncurrent assets 3 0
Loss on retirement of noncurrent assets 155 90
Impairment loss 20 322
Loss on sales of investment securities 0 15
Loss on valuation of investment securities 12 6
Restructuring expenses 80 -
Loss on specific construction contracts 16 -
Litigation expenses 2 -
Other 52 219
Total extraordinary loss 344 656
Income before income taxes 12,224 17,742
-15-
Page 16
(Millions of yen)
Fiscal year ended March 31, 2014
Fiscal year ended March 31, 2015
Income taxes-current 4,657 4,582
Income taxes-deferred (24) 1,670
Total income taxes 4,633 6,253
Income before minority interests 7,590 11,488
Minority interests in income 404 380
Net income 7,186 11,108
Minority interests in income 404 380
Income before minority interests 7,590 11,488
Other comprehensive income
Valuation difference on available-for-sale securities
1,029 1,144
Revaluation reserve for land - 1
Foreign currency translation adjustment - 1
Remeasurements of defined benefit plans - 254
Share of other comprehensive income of associates accounted for using equity method
43 (55)
Total other comprehensive income 1,073 1,346
Comprehensive income: 8,664 12,835
(Breakdown)
Comprehensive income attributable to owners of the parent
8,254 12,447
Comprehensive income attributable to minority interests
409 387
-16-
Page 17
(3) Consolidated Statement of Changes in Net Assets
Previous fiscal year (From April 1, 2013 to March 31, 2014)
(Millions of yen)
Shareholders' equity
Capital stock Capital surplus Retained earnings Treasury stock Total shareholders' equity
Balance at start of the period 7,000 25,947 71,457 (1,622) 102,783
Cumulative effect of changes in accounting
policies -
Balance at start of period in which changes
in accounting policies were reflected 7,000 25,947 71,457 (1,622) 102,783
Change during the period
Dividends from surplus (1,648) (1,648)
Net income 7,186 7,186
Purchase of treasury stock (1,001) (1,001)
Disposal of treasury stock 0 0 0
Change of scope of equity method (220) (220)
Net changes in items other than
shareholders' equity
Total changes of items during the period - 0 5,317 (1,001) 4,315
Balance at end of the period 7,000 25,947 76,775 (2,623) 107,098
Accumulated other comprehensive income
Minority
interests Total net assets
Valuation
difference on
available-for-sale
securities
Revaluation
reserve for land
Foreign currency
translation
adjustment
Remeasurements
of defined benefit
plans
Total
accumulated
other
comprehensive
income
Balance at start of the
period 946 (101) 12 - 857 2,989 106,630
Cumulative effect of
changes in accounting
policies
-
Balance at start of period
in which changes in
accounting policies were
reflected
946 (101) 12 - 857 2,989 106,630
Change during the period
Dividends from surplus (1,648)
Net income 7,186
Purchase of treasury
stock (1,001)
Disposal of treasury
stock 0
Change of scope of
equity method (220)
Net changes in items
other than shareholders'
equity
1,024 - 43 1,802 2,871 356 3,227
Total changes of items
during the period 1,024 - 43 1,802 2,871 356 7,543
Balance at end of the
period 1,971 (101) 56 1,802 3,729 3,345 114,173
-17-
Page 18
Current fiscal year (From April 1, 2014 to March 31, 2015)
(Millions of yen)
Shareholders' equity
Capital stock Capital surplus Retained earnings Treasury stock Total shareholders' equity
Balance at start of the period 7,000 25,947 76,775 (2,623) 107,098
Cumulative effect of changes in accounting
policies 1,620 1,620
Balance at start of period in which changes
in accounting policies were reflected 7,000 25,947 78,396 (2,623) 108,719
Change during the period
Dividends from surplus (2,033) (2,033)
Net income 11,108 11,108
Purchase of treasury stock (3) (3)
Disposal of treasury stock 0 0 0
Change of scope of equity method -
Net changes in items other than
shareholders' equity
Total changes of items during the period - 0 9,075 (3) 9,072
Balance at end of the period 7,000 25,947 87,471 (2,626) 117,791
Accumulated other comprehensive income
Minority
interests Total net assets
Valuation
difference on
available-for-sale
securities
Revaluation
reserve for land
Foreign currency
translation
adjustment
Remeasurements
of defined benefit
plans
Total
accumulated
other
comprehensive
income
Balance at start of the
period 1,971 (101) 56 1,802 3,729 3,345 114,173
Cumulative effect of
changes in accounting
policies
1,620
Balance at start of period
in which changes in
accounting policies were
reflected
1,971 (101) 56 1,802 3,729 3,345 115,794
Change during the period
Dividends from surplus (2,033)
Net income 11,108
Purchase of treasury
stock (3)
Disposal of treasury
stock 0
Change of scope of
equity method -
Net changes in items
other than shareholders'
equity
1,137 1 (54) 254 1,339 (21) 1,318
Total changes of items
during the period 1,137 1 (54) 254 1,339 (21) 10,390
Balance at end of the
period 3,109 (100) 1 2,057 5,068 3,324 126,184
-18-
Page 19
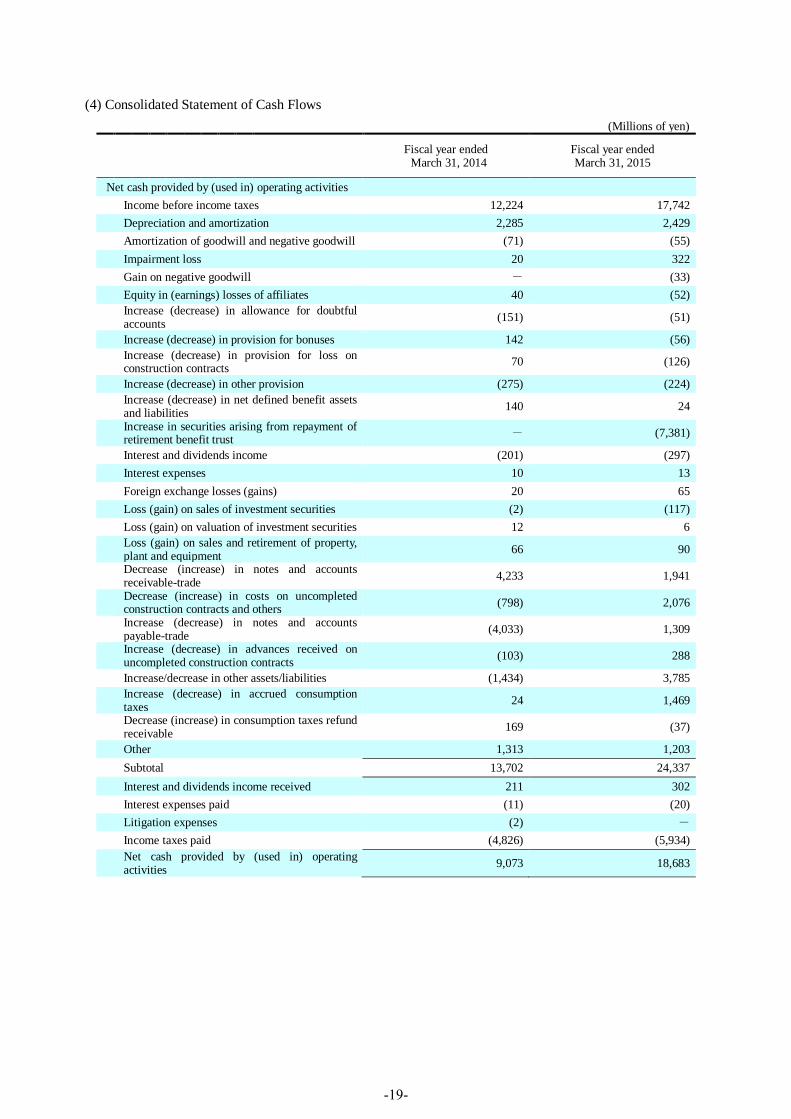
(4) Consolidated Statement of Cash Flows
(Millions of yen)
Fiscal year ended March 31, 2014
Fiscal year ended March 31, 2015
Net cash provided by (used in) operating activities
Income before income taxes 12,224 17,742
Depreciation and amortization 2,285 2,429
Amortization of goodwill and negative goodwill (71) (55)
Impairment loss 20 322
Gain on negative goodwill - (33)
Equity in (earnings) losses of affiliates 40 (52)
Increase (decrease) in allowance for doubtful accounts
(151) (51)
Increase (decrease) in provision for bonuses 142 (56)
Increase (decrease) in provision for loss on construction contracts
70 (126)
Increase (decrease) in other provision (275) (224)
Increase (decrease) in net defined benefit assets and liabilities
140 24
Increase in securities arising from repayment of retirement benefit trust
- (7,381)
Interest and dividends income (201) (297)
Interest expenses 10 13
Foreign exchange losses (gains) 20 65
Loss (gain) on sales of investment securities (2) (117)
Loss (gain) on valuation of investment securities 12 6
Loss (gain) on sales and retirement of property, plant and equipment
66 90
Decrease (increase) in notes and accounts receivable-trade
4,233 1,941
Decrease (increase) in costs on uncompleted construction contracts and others
(798) 2,076
Increase (decrease) in notes and accounts payable-trade
(4,033) 1,309
Increase (decrease) in advances received on uncompleted construction contracts
(103) 288
Increase/decrease in other assets/liabilities (1,434) 3,785
Increase (decrease) in accrued consumption taxes
24 1,469
Decrease (increase) in consumption taxes refund receivable
169 (37)
Other 1,313 1,203
Subtotal 13,702 24,337
Interest and dividends income received 211 302
Interest expenses paid (11) (20)
Litigation expenses (2) -
Income taxes paid (4,826) (5,934)
Net cash provided by (used in) operating activities
9,073 18,683
-19-
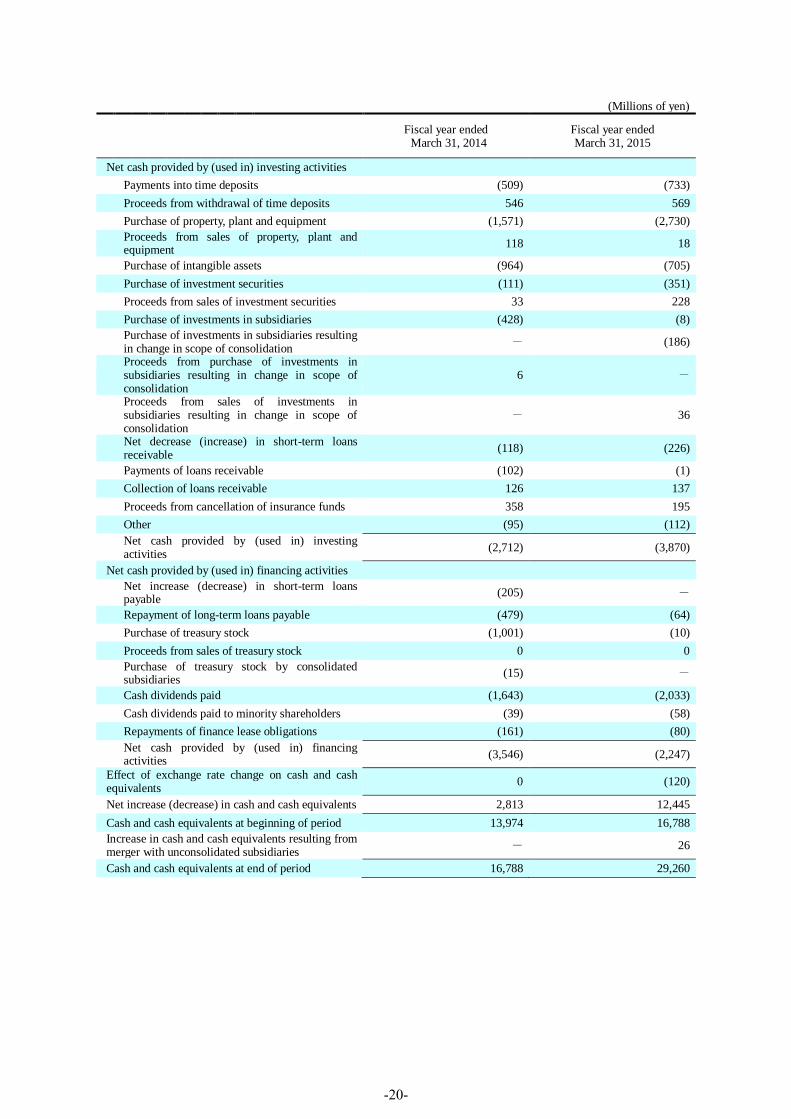
Page 20
(Millions of yen)
Fiscal year ended March 31, 2014
Fiscal year ended March 31, 2015
Net cash provided by (used in) investing activities
Payments into time deposits (509) (733)
Proceeds from withdrawal of time deposits 546 569
Purchase of property, plant and equipment (1,571) (2,730)
Proceeds from sales of property, plant and equipment
118 18
Purchase of intangible assets (964) (705)
Purchase of investment securities (111) (351)
Proceeds from sales of investment securities 33 228
Purchase of investments in subsidiaries (428) (8)
Purchase of investments in subsidiaries resulting in change in scope of consolidation
- (186)
Proceeds from purchase of investments in subsidiaries resulting in change in scope of consolidation
6 -
Proceeds from sales of investments in subsidiaries resulting in change in scope of consolidation
- 36
Net decrease (increase) in short-term loans receivable
(118) (226)
Payments of loans receivable (102) (1)
Collection of loans receivable 126 137
Proceeds from cancellation of insurance funds 358 195
Other (95) (112)
Net cash provided by (used in) investing activities
(2,712) (3,870)
Net cash provided by (used in) financing activities
Net increase (decrease) in short-term loans payable
(205) -
Repayment of long-term loans payable (479) (64)
Purchase of treasury stock (1,001) (10)
Proceeds from sales of treasury stock 0 0
Purchase of treasury stock by consolidated subsidiaries
(15) -
Cash dividends paid (1,643) (2,033)
Cash dividends paid to minority shareholders (39) (58)
Repayments of finance lease obligations (161) (80)
Net cash provided by (used in) financing activities
(3,546) (2,247)
Effect of exchange rate change on cash and cash equivalents
0 (120)
Net increase (decrease) in cash and cash equivalents 2,813 12,445
Cash and cash equivalents at beginning of period 13,974 16,788
Increase in cash and cash equivalents resulting from merger with unconsolidated subsidiaries
- 26
Cash and cash equivalents at end of period 16,788 29,260
-20-
Page 21
(5) Notes to Consolidated Financial Statements
(Notes on Going Concern Assumption)
Not Applicable.
(Changes in Accounting Policies)
The Accounting Standard for Retirement Benefits (ASBJ Statement No.26 dated May 17, 2012, hereinafter “Accounting
Standard for Retirement Benefits”) and the Guidance on Accounting Standard for Retirement Benefits (ASBJ Guidance
No.25 dated March 26, 2015, hereinafter “Guidance on Retirement Benefits ”) were applied to the provisions shown in the
main text of Section 35 of the Accounting Standard for Retirement Benefits and the main text of Section 67 of the Guidance
on Retirement Benefits from the current consolidated fiscal year. Accordingly, the Company revised the method of
calculation of retirement benefit obligations and current service costs, changed the method of determining the period for the
estimated amount of retirement benefits from being based on a fixed amount for the period to being based on the calculation
of benefits, and changed the method for determining the period of the bonds forming the basis for determining the discount
rate from a method based on the approximated number of average remaining service period to a method using a single
weighted average discount rate reflecting the estimated payment period for retirement benefits and the amount for each
estimated payment period.
With regard to the application of the Accounting Standard for Retirement Benefits, the impact associated with the change
in the method of calculating retirement benefit obligations and current service costs was taken into account in retained
earnings at the beginning of April 1, 2014 in accordance with the provisional treatment specified in Section 37 of the
Accounting Standard for Retirement Benefits.
As a result, the retirement benefit liabilities as of as of April 1, 2014 decreased by 1,479 million yen, retirement benefit
assets increased by 1,039 million yen, and retained earnings increased by 1,620 million yen. The impact on operating
income, ordinary income and income before income taxes during the year ended March 31, 2015 is minor.
(Changes in Presentation Method)
(Consolidated Statement of Cash Flows)
The “decrease (increase) in net defined benefit asset” and “increase (decrease) in net defined benefit liability” which were
listed separately in “Net cash provided by (used in) operating activities” in the previous consolidated fiscal year are now
shown as “increase (decrease) in net defined benefit assets and liabilities” from the current consolidated fiscal year due to
little significance in listing them separately. To reflect this change in the presentation method, the Consolidated Statement of
Cash Flows for the previous consolidated fiscal year has been rearranged.
As a result, the 123 million yen “decrease (increase) in net defined benefit asset” and 17 million yen “increase (decrease)
in net defined benefit liability” in the Consolidated Statement of Cash Flows for the previous consolidated fiscal year have
been rearranged into a 140 million yen “increase (decrease) in net defined benefit assets and liabilities.”
(Additional Information)
(Changes in the Retirement Benefits System)
In order to make a transition from a defined benefit pension and lump sum retirement payment system to a defined benefit
pension system, defined contribution pension system and lump sum retirement payment system in some consolidated
subsidiaries, the "Accounting of Transitions Between Retirement Benefit Systems" (Guidance on Accounting Standard for
Retirement Benefit No. 1 dated January 31, 2002) and the "Practical Solution on Accounting for Transfer between
Retirement Benefit Plans" (PITF No.2 dated February 7, 2007) have been applied.
In association with the changes in the system, 516 million yen was recorded as extraordinary income (gain on revision of
retirement benefit plan) in the current consolidated fiscal year.
Return of employees' retirement benefit trust
In some consolidated subsidiaries, retirement benefit trusts have been established for the purpose of improving the
soundness of pension finances, but there has been a surplus of pension assets including trust property in retirement benefit
trusts due to a change in the retirement benefit scheme loss on contribution of securities to retirement benefit system, and the
surplus reserve was returned because the trust property is not expected to be used for retirement benefits in the future.
In association with the return, 2,791 million yen was recorded as extraordinary income (gain on return of employees'
retirement benefit trust) in the current consolidated fiscal year.
-21-
Page 22
(Segment Information, etc.)
[Segment Information]
1. Overview of Segment Information
(1) Method of determining reporting segments
The reportable segments of the Company refer to the components of the Company whose separate financial information is
available, and which are regularly reviewed by the Board of Directors in order to determine allocation of management
resources and evaluate performance.
Under the guidance of the Company, which is the MIRAIT Group's holding company, groups centered on two business
companies draw up comprehensive strategies and engage in activities relating to the businesses for which each group is
responsible.
Therefore the business segments (consolidated basis) of the Company consists of two reportable segments, namely, the
"MIRAIT" and "MIRAIT Technologies."
(2) Types of products and services attributable to each reportable segment
MIRAIT and MIRAIT Technologies mainly conduct telecommunication engineering, electrical facility work and air
conditioning and sanitation work.
2. Method of calculation of amounts of sales, income, assets and other items by reportable segment
The methods of accounting for reportable business segments are generally the same as the accounting methods used in the
preparation of consolidated financial statements.
Income for the reportable segments are figures based on operating income.
As stated in “Changes in Accounting Policies,” with the change in the method of calculating retirement benefit
obligations and current service costs from this consolidated fiscal year, we have also changed the method of calculating
retirement benefit obligations and current service costs in each business segment. The impact of the change on each
reportable segment is minor.
-22-
Page 23
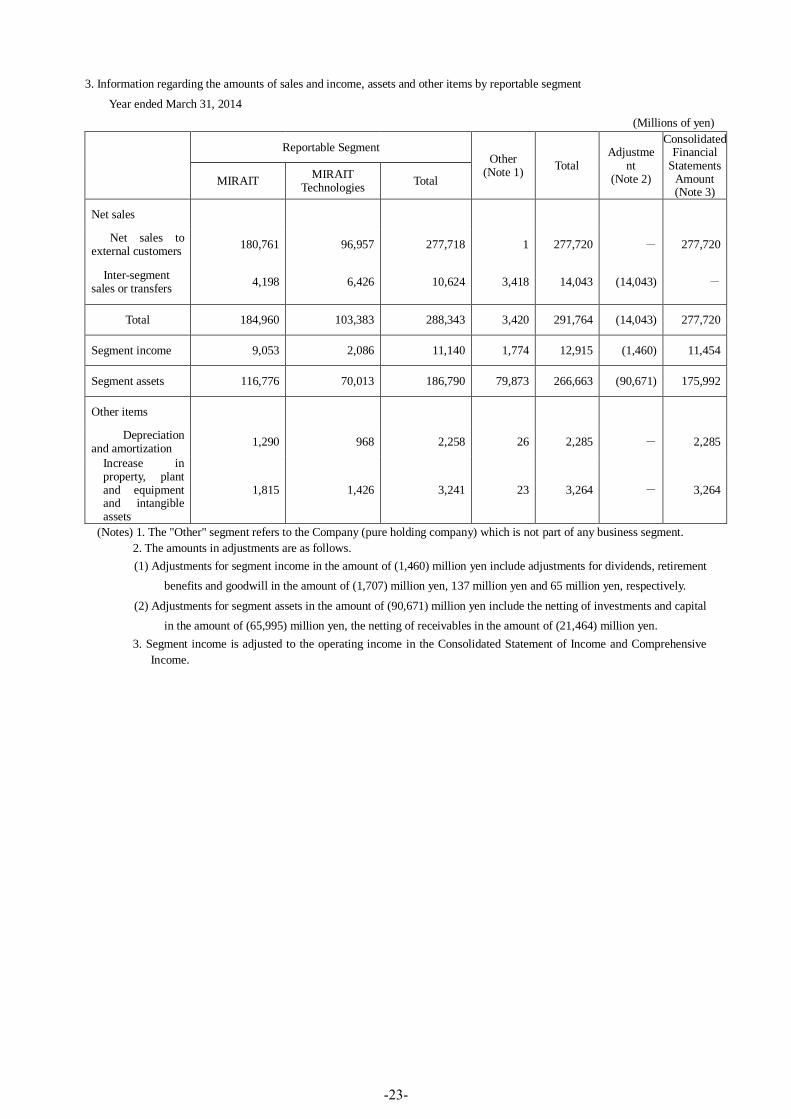
3. Information regarding the amounts of sales and income, assets and other items by reportable segment
Year ended March 31, 2014
(Millions of yen)
Reportable Segment Other
(Note 1) Total
Adjustment
(Note 2)
Consolidated Financial
Statements Amount (Note 3)
MIRAIT MIRAIT
Technologies Total
Net sales
Net sales to external customers
180,761 96,957 277,718 1 277,720 - 277,720
Inter-segment sales or transfers
4,198 6,426 10,624 3,418 14,043 (14,043) -
Total 184,960 103,383 288,343 3,420 291,764 (14,043) 277,720
Segment income 9,053 2,086 11,140 1,774 12,915 (1,460) 11,454
Segment assets 116,776 70,013 186,790 79,873 266,663 (90,671) 175,992
Other items
Depreciation and amortization
1,290 968 2,258 26 2,285 - 2,285
Increase in property, plant and equipment and intangible assets
1,815 1,426 3,241 23 3,264 - 3,264
(Notes) 1. The "Other" segment refers to the Company (pure holding company) which is not part of any business segment.
2. The amounts in adjustments are as follows.
(1) Adjustments for segment income in the amount of (1,460) million yen include adjustments for dividends, retirement
benefits and goodwill in the amount of (1,707) million yen, 137 million yen and 65 million yen, respectively.
(2) Adjustments for segment assets in the amount of (90,671) million yen include the netting of investments and capital
in the amount of (65,995) million yen, the netting of receivables in the amount of (21,464) million yen.
3. Segment income is adjusted to the operating income in the Consolidated Statement of Income and Comprehensive
Income.
-23-
Page 24
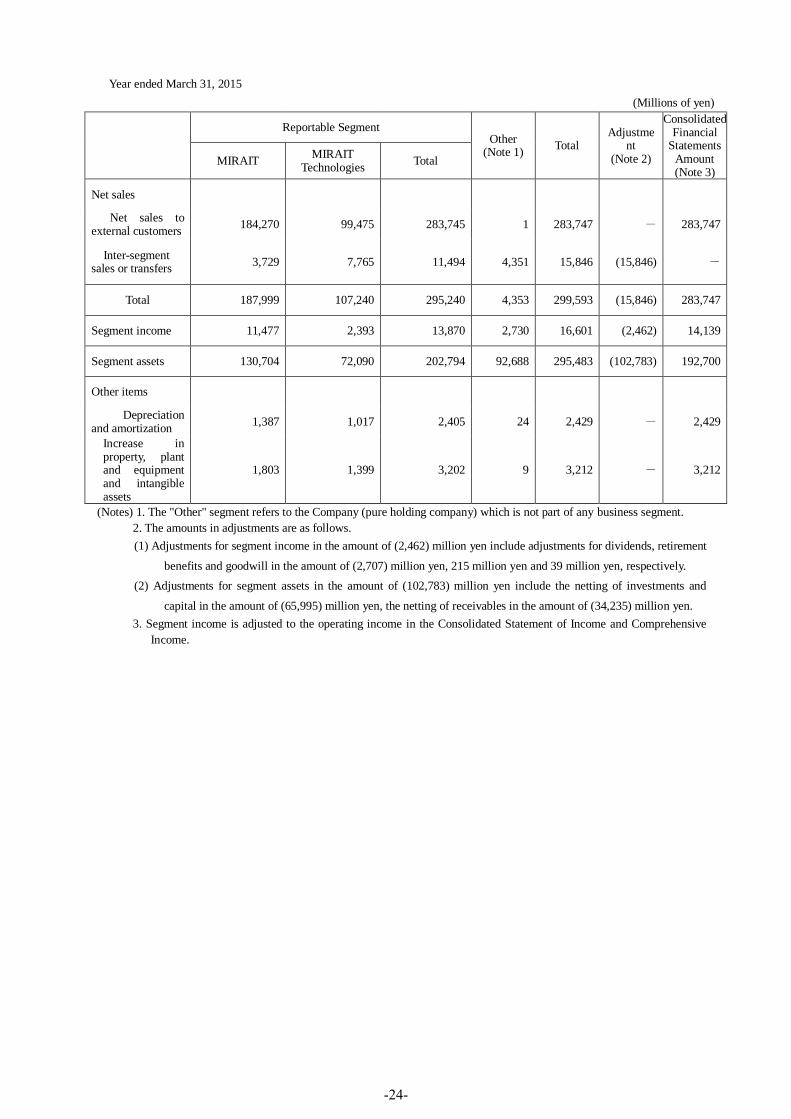
Year ended March 31, 2015
(Millions of yen)
Reportable Segment Other
(Note 1) Total
Adjustment
(Note 2)
Consolidated Financial
Statements Amount (Note 3)
MIRAIT MIRAIT
Technologies Total
Net sales
Net sales to external customers
184,270 99,475 283,745 1 283,747 - 283,747
Inter-segment sales or transfers
3,729 7,765 11,494 4,351 15,846 (15,846) -
Total 187,999 107,240 295,240 4,353 299,593 (15,846) 283,747
Segment income 11,477 2,393 13,870 2,730 16,601 (2,462) 14,139
Segment assets 130,704 72,090 202,794 92,688 295,483 (102,783) 192,700
Other items
Depreciation and amortization
1,387 1,017 2,405 24 2,429 - 2,429
Increase in property, plant and equipment and intangible assets
1,803 1,399 3,202 9 3,212 - 3,212
(Notes) 1. The "Other" segment refers to the Company (pure holding company) which is not part of any business segment.
2. The amounts in adjustments are as follows.
(1) Adjustments for segment income in the amount of (2,462) million yen include adjustments for dividends, retirement
benefits and goodwill in the amount of (2,707) million yen, 215 million yen and 39 million yen, respectively.
(2) Adjustments for segment assets in the amount of (102,783) million yen include the netting of investments and
capital in the amount of (65,995) million yen, the netting of receivables in the amount of (34,235) million yen.
3. Segment income is adjusted to the operating income in the Consolidated Statement of Income and Comprehensive
Income.
-24-
Page 25
(Per Share Information)
Fiscal year ended March 31, 2014
Fiscal year ended March 31, 2015
Net assets per share 1,362.61 yen 1,510.59 yen
Net income per share 87.30 yen 136.58 yen
(Notes) 1. Diluted net income per share is not stated since there are no dilutive shares.
2. As stated in "Changes in Accounting Policies," the Accounting Standard for Retirement Benefits has been applied, and
provisional treatment stipulate din Section 37 of the Accounting Standard for Retirement Benefits is being followed.
As a result, net assets per share increased by 19.93 yen in the current fiscal year. The impact on net income per
share during the year ended March 31, 2015 is minor.
3. The basis for calculation of the net income per share is shown below.
Fiscal year ended March 31, 2014
Fiscal year ended March 31, 2015
Net income (million yen) 7,186 11,108
Net income not attributable to common shareholders (million yen)
- -
Net income related to common stocks (million yen)
7,186 11,108
Average number of common stocks during the fiscal year (thousand shares)
82,316 81,334
(Significant Subsequent Events)
Not Applicable.
-25-