Rudolf van Houten, Acting CFO Consolidated Financial Results FY2015 Q3 February 3, 2016 Important Notice 2 Forward-Looking Statements This presentation contains forward-looking statements regarding Takeda’s future business, financial position and results of operations, including estimates, forecasts, targets and plans. These forward-looking statements may be identified by the use of forward-looking words such as “aim,” “anticipate,” “assume,” “believe,” “continue,” “endeavor,” “estimate,” “expect,” “forecast,” “initiative,” “intend,” “may,” “outlook,” “plan,” “potential,” “probability,” “pro-forma,” “project,” “risk,” “seek,” “should,” “strive,” “target,” “will” or similar words, or expressions of the negative thereof, or by discussions of strategy, plans or intentions. Any forward-looking statements in this document are based on the current assumptions and beliefs of Takeda in light of the information currently available to it. Such forward-looking statements do not represent any guarantee by Takeda or its management of future performance and involve known and unknown risks, uncertainties and other factors, including but not limited to: the economic circumstances surrounding Takeda’s business, including general economic conditions in Japan, the United States and worldwide; competitive pressures and developments; applicable laws and regulations; the success or failure of product development programs; decisions of regulatory authorities and the timing thereof; changes in exchange rates; claims or concerns regarding the safety or efficacy of marketed products or product candidates; and post-merger integration with acquired companies, any of which may cause Takeda’s actual results, performance, achievements or financial position to be materially different from any future results, performance, achievements or financial position expressed or implied by such forward-looking statements. Neither Takeda nor its management gives any assurances that the expectations expressed in these forward-looking statements will turn out to be correct, and actual results, performance or achievements could materially differ from expectations. Any forward looking statements herein speak only as of the date of this document, and Takeda and its management undertake no obligation to update or revise any forward-looking statements or other information contained in this presentation, whether as a result of new information, future events or otherwise. Medical Information This presentation contains information about products that may not be available in all countries, or may be available under different trademarks, for different indications, in different dosages, or in different strengths. Nothing contained herein should be considered a solicitation, promotion or advertisement for any prescription drug including the ones under development.
Transcript
Rudolf van Houten, Acting CFO
Consolidated Financial ResultsFY2015 Q3
February 3, 2016
Important Notice
2
Forward-Looking Statements
This presentation contains forward-looking statements regarding Takeda’s future business, financial position and results of operations, including estimates, forecasts, targets and plans. These forward-looking statements may be identified by the use of forward-looking words such as “aim,” “anticipate,” “assume,” “believe,” “continue,” “endeavor,” “estimate,” “expect,” “forecast,” “initiative,” “intend,” “may,” “outlook,” “plan,” “potential,” “probability,” “pro-forma,” “project,” “risk,” “seek,” “should,” “strive,” “target,” “will” or similar words, or expressions of the negative thereof, or by discussions of strategy, plans or intentions.
Any forward-looking statements in this document are based on the current assumptions and beliefs of Takeda in light of the information currently available to it. Such forward-looking statements do not represent any guarantee by Takeda or its management of future performance and involve known and unknown risks, uncertainties and other factors, including but not limited to: the economic circumstances surrounding Takeda’s business, including general economic conditions in Japan, the United States and worldwide;competitive pressures and developments; applicable laws and regulations; the success or failure of product development programs;decisions of regulatory authorities and the timing thereof; changes in exchange rates; claims or concerns regarding the safety or efficacy of marketed products or product candidates; and post-merger integration with acquired companies, any of which may cause Takeda’s actual results, performance, achievements or financial position to be materially different from any future results, performance, achievements or financial position expressed or implied by such forward-looking statements. Neither Takeda nor its management gives any assurances that the expectations expressed in these forward-looking statements will turn out to be correct, and actual results, performance or achievements could materially differ from expectations.
Any forward looking statements herein speak only as of the date of this document, and Takeda and its management undertake no obligation to update or revise any forward-looking statements or other information contained in this presentation, whether as a result of new information, future events or otherwise.
Medical Information
This presentation contains information about products that may not be available in all countries, or may be available under different trademarks, for different indications, in different dosages, or in different strengths. Nothing contained herein should be considered a solicitation, promotion or advertisement for any prescription drug including the ones under development.
Definitions of Disclosure Terms
- "Underlying Growth" compares two periods of financial results under a common basis, showing the real performance of the business.
- "Underlying Growth" excludes the impact of foreign exchange and exceptional items such as product divestments and acquisitions, impact of purchase accounting, amortization and impairment loss of intangible assets, restructuring costs and major litigation costs.
- Takeda's management guidance consists of"Underlying Growth" of revenue, Core Earnings and Core EPS.
The detailed definitions of Core Earnings and Core EPS are shown in the Appendix.Please note these terms are non-GAAP items, used for internal evaluation purposes and are not audited.
3
4
Underlying Growth in FY15 Q3 YTD;+3.8% for revenue, +1.5% for Core Earnings, +17.3% for Core EPS
Takeda’s “Growth Drivers”; GI, Oncology and Emerging Markets, representing half of Takeda’s revenue, delivering robust growth of +8.5%
ENTYVIO on the way to over $2 bln in peak sales
NINLARO launched in the US in December 2015
In Japan, new product growth offsetting generic decline in Q3
Project Summit already exceeding full year savings target
Operating free cash flow shows large improvement versus prior year but more work remains to be done
On the Road to Sustained GrowthQ3 Highlights
Management guidance reaffirmed for full year 2015
Reported Income Statement
FY14 YTD FY15 YTD
1,340.0 1,393.3 +53.3 + 4.0%
953.6 990.8 +37.2 + 3.9%
317.3 336.0 +18.7 + 5.9%
G&A 120.7 139.5 +18.8 + 15.5%
249.2 253.9 +4.7 + 1.9%
126.5 93.1 -33.4 - 26.4%
94.7 20.9 -73.8 - 77.9%
35.4 21.7 -13.7 - 38.7%
199.1 167.5 -31.6 - 15.9%
(11.5) (12.9) -1.4 + 12.1%
187.6 154.6 -33.0 - 17.6%
105.2 38.2 -67.0 - 63.7%
2.6 2.7 +0.1 + 4.6%
79.7 113.6 +33.9 + 42.5%
101 JPY 145 JPY +44 JPY + 43.0%
Yen per USD 106 122Yen per EUR 140 134
Change
Revenue
S&M
R&D
Gross profit
Amortization and impairment losses on intangible assets associated with products
Other income
Other expenses
Operating profit
Profit before tax
Net profit
Financial income/expenses, other
Income tax
Non-controlling interests
EPS
Exchange Rate
Reported Income Statement
6
(billion JPY)
*4
*5 *6
*2 Profit from revaluation of contingent consideration liability for COLCRYS56.4 (gain),Gain from sales of real estate 25.4 (gain)
*1 Impairment of COLCRYS 30.5 (loss)
*4 Decrease of Restructuring Costs -7.7
*5 Revaluation of R&D credit 42.7 (loss)
*6 Tax impact due to capital redemption from a subsidiary-14.5 (gain)
*3 Termination cost for TAK-700 (orteronel) development 4.9 (loss)
*Adjustment applying a constant currency at 1USD=120JPY, 1EUR=130JPY and etc.
(billion JPY)
FY14: Divestment of Mizusawa Industrial Chemicals, Ltd. -9.9, etc.FY15: Acquisition of Neutec Toplam Kalite -2.5
Revenue Continues to Grow in line with Full Year Guidance
9
GI*
Oncology
Emerging Markets*
+8.5%
+10.4%
+4.0%
+8.1%
+24.7%
+0.4%
+5.7%
FY14
FY15YTD
240.9
333.8
316.3
(billion JPY) (vs FY13)
Growth Drivers Total**
(vs FY14 YTD)
* Pantoprazole is included in Emerging Markets (EM), but not in GI (Gastrointestinal), as it is a key driver in EM** Total GI/Oncology/EM, eliminated duplications (e.g. ADCETRIS in EM and in Oncology)
48%Growth Drivers Total**
Takeda Total
Underlying revenue growth
Growth Drivers Continue to Deliver a Robust Performance
* GI / Oncology / EM: See Appendix for products list in GI and Oncology.** Growth (+3.9%) from the FY14 Q3 YTD total revenue (1,360.9 billion JPY) and grown (+8.5%) from the FY14 Q3 YTD Growth Drivers revenue (630.3 billion JPY).
- 2.3Underlying revenue growth
(billion JPY)
Broad Portfolio of Growing Products Offsets LOE Decline
11
FY15 YTD Regional Revenue* vs. FY14 YTD
Strong growth driven by the U.S. and Emerging Markets
+5.7%Emerging Markets
-1.7%
JapanPharma
+11.6%
U.S.
+0.2%
Europe and Canada
* Previously, out-license business (royalty and supply income) was excluded from each region and recognized as "others", but from FY15 Q2, allocated to each region.** "Japan Others" includes Japan Consumer Healthcare and Other business.
+4.9%
JapanOthers**
US and Emerging Markets Drive Sales Growth
Underlying revenue growth
Middle east,Oceania &
Africa
Russia/CIS Latin America Asia
16.9%
17.6%
8.6%26.6%
30.3%
JapanPharma
428.3- 1.7 %
Europe and Canada238.2 +0.2%
U.S.375.6
+ 11.6%
JapanOthers*121.1
+ 4.9%
Emerging Markets249.0+5.7%
28.6+2.2%
54.6+6.2%
72.2+3.4%
93.6+8.4%
Russia+11.7%
Brazil+3.9%
China+10.3%
12
Underlying revenue growth
(billion JPY)
* including Japan Consumer Healthcare and Other business
Emerging Markets YTD Underlying Growth +5.7%Double Digit Growth in Russia and China
13
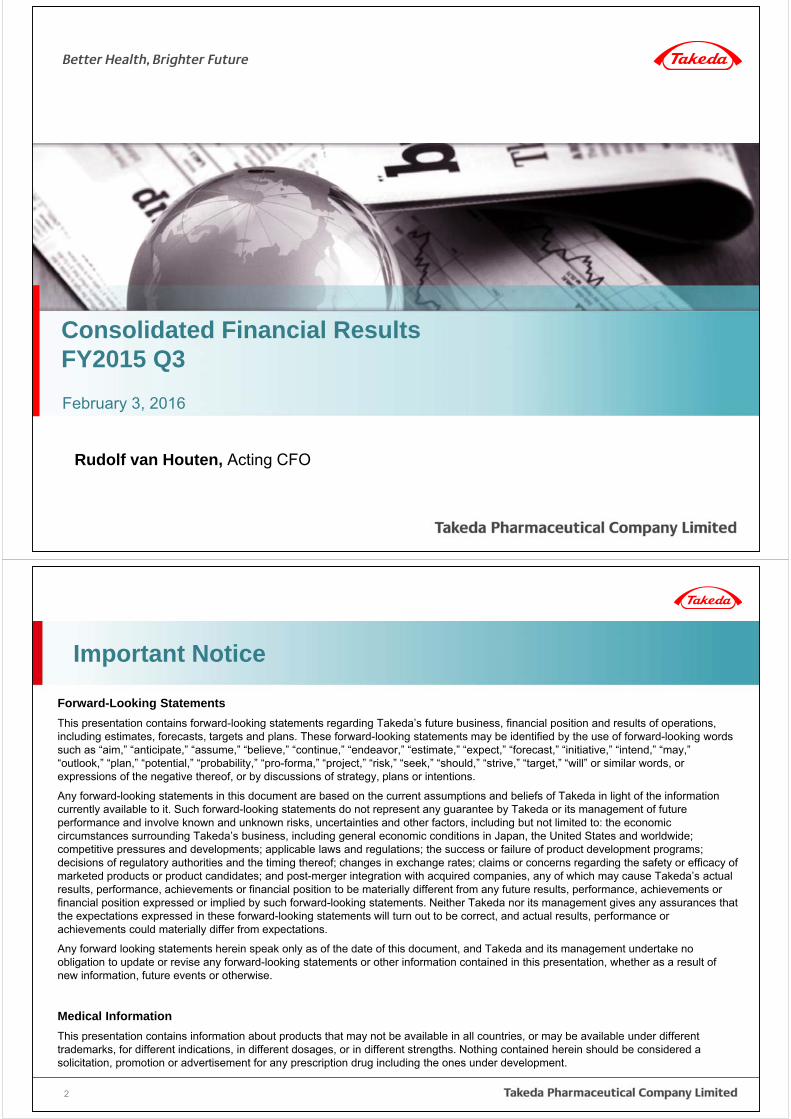
NINLARO® Launched in US in December 2015Effective, Safe & Simple for Sustainable Treatment of Multiple Myeloma
EFFECTIVE • ~6 month PFS improvement in a real-world representative population• Efficacy in high risk patients
SAFE • Low neuropathy and mostly low grade• No CV toxicity
SIMPLE • One capsule, once weekly
• The 1st and only oral proteasome inhibitorUNIQUE
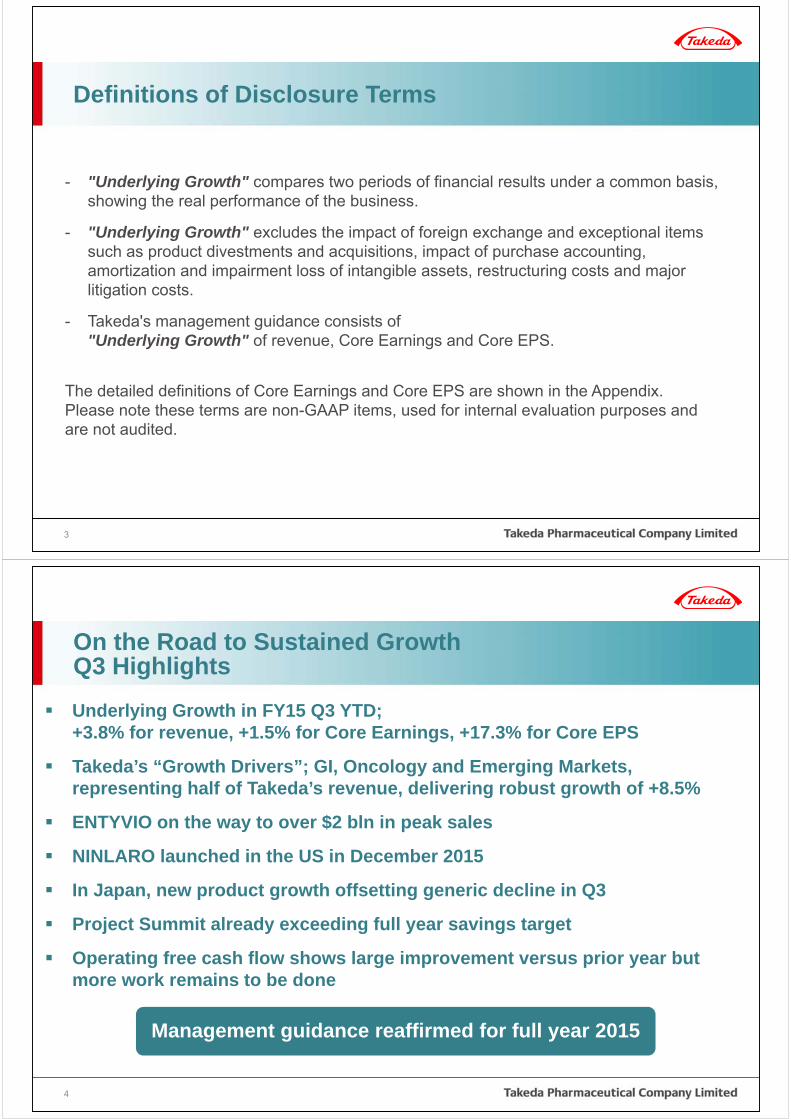
0.0
10.0
20.0
30.0
40.0
50.0
60.0
70.0
2014Jun.
2014Sep.
2014Dec.
2015Mar.
2015Jun.
2015Sep.
2015Dec.
Emerging markets
Europe and Canada
U.S.
Sales generated from 21 countries as of end of December 2015
Revenue(billion JPY)
Moving Annual Total sales @ Constant currency
14
Q3 ENTYVIO® Sales Make it Takeda's Fourth Largest ProductGrowth More Than Offsetting CANDESARTAN Decline
FY14 Full Year FY14 YTD FY15 YTD Reported % Underlying % Japan Total Japan United States Europe and Canada Emerging Markets Total United States Total
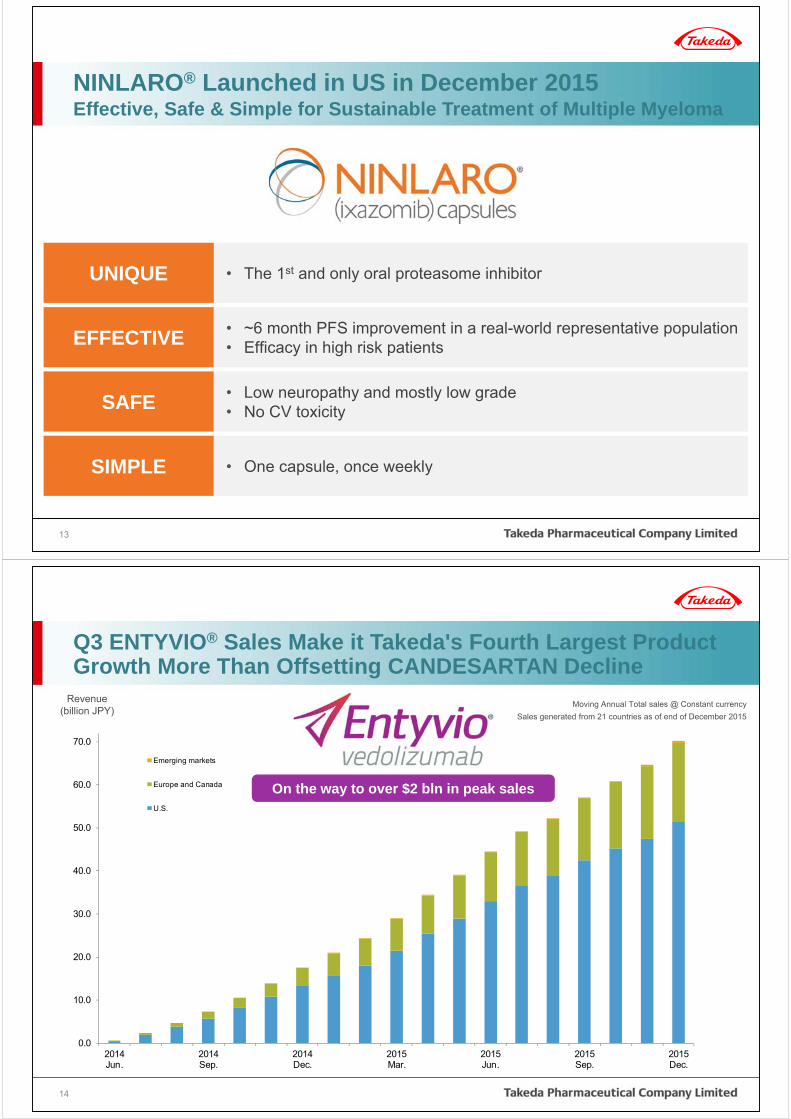
Sales of Top 10 Products and 4 Additional Products (2/2)
The total sales of top 10 products and 4 additional products account for 61% of Takeda's total revenue.
* 4 additional products are ULORIC, AMITIZA, ADCETRIS, and BRINTELLIX.These products are selected due to their significant revenue contribution and investors' interest in their performance.
18
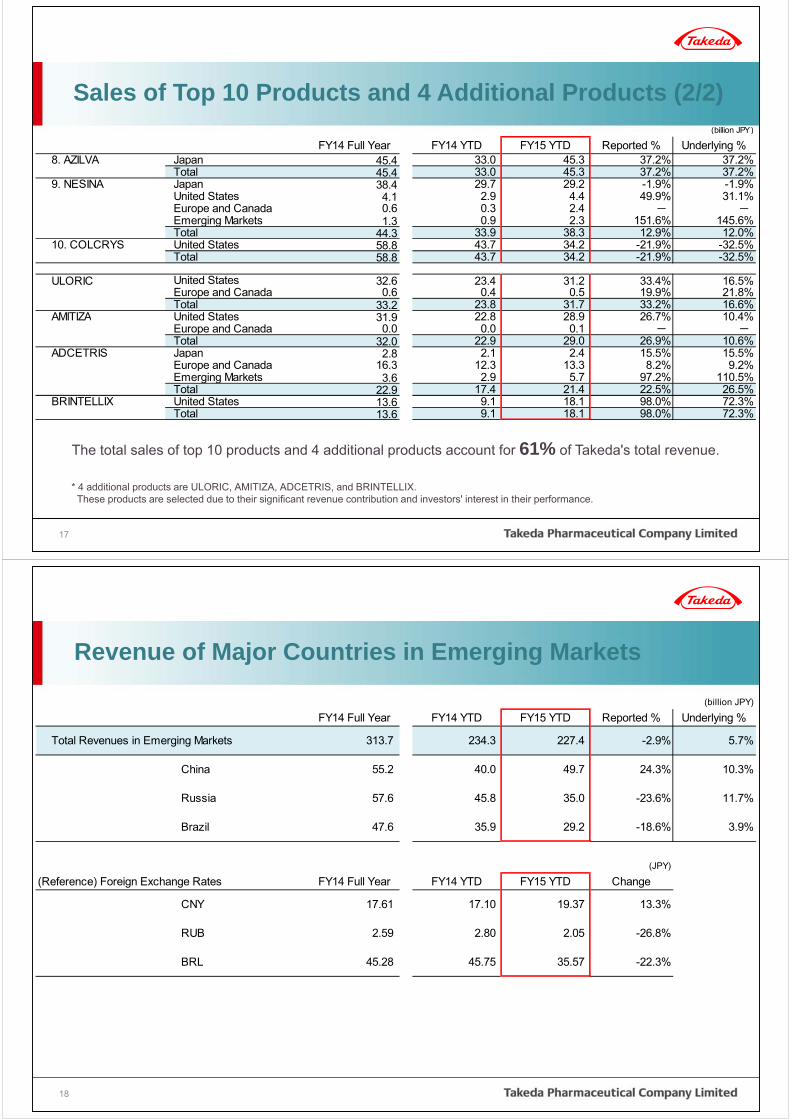
Revenue of Major Countries in Emerging Markets
(billion JPY)
Total Revenues in Emerging Markets 313.7 234.3 227.4 -2.9% 5.7%
China 55.2 40.0 49.7 24.3% 10.3%
Russia 57.6 45.8 35.0 -23.6% 11.7%
Brazil 47.6 35.9 29.2 -18.6% 3.9%
(JPY)
CNY 17.61 17.10 19.37 13.3%
RUB 2.59 2.80 2.05 -26.8%
BRL 45.28 45.75 35.57 -22.3%
(Reference) Foreign Exchange Rates FY14 Full Year FY14 YTD FY15 YTD Change
FY14 Full Year FY14 YTD FY15 YTD Reported % Underlying %
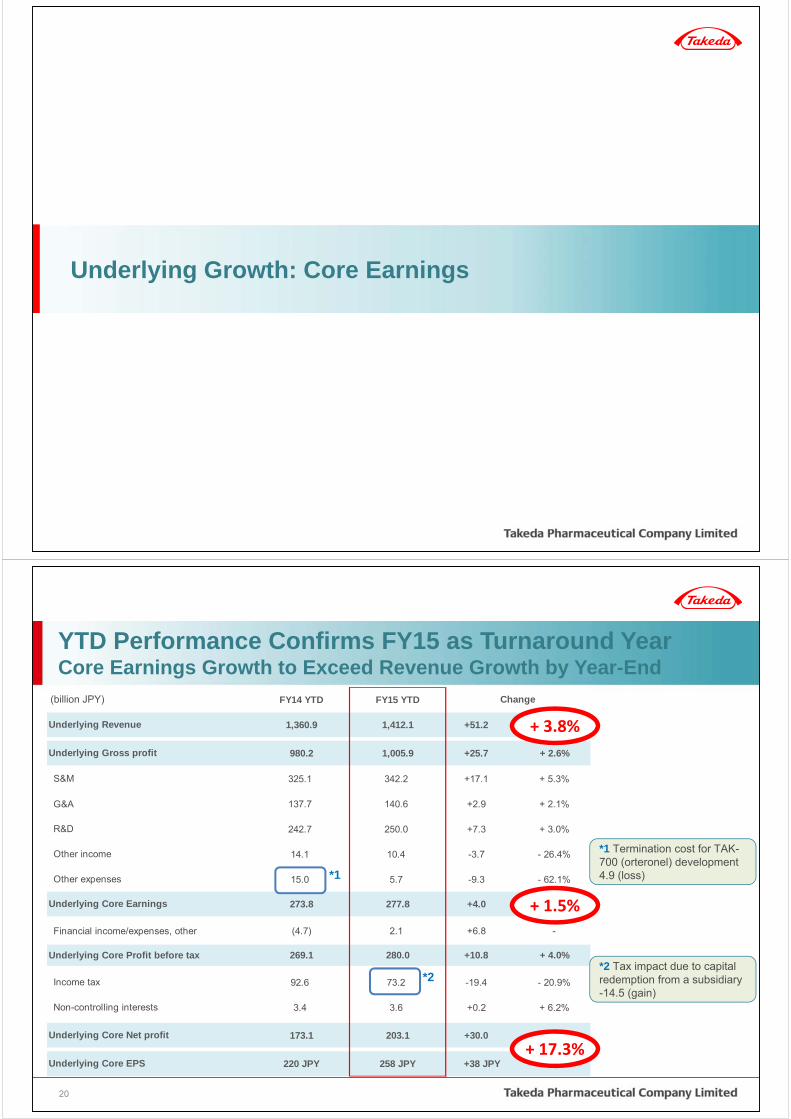
Underlying Growth: Core Earnings
FY14 YTD FY15 YTD
1,360.9 1,412.1 +51.2 + 3.8%
980.2 1,005.9 +25.7 + 2.6%
325.1 342.2 +17.1 + 5.3%
G&A 137.7 140.6 +2.9 + 2.1%
242.7 250.0 +7.3 + 3.0%
14.1 10.4 -3.7 - 26.4%
15.0 5.7 -9.3 - 62.1%
273.8 277.8 +4.0 + 1.5%
(4.7) 2.1 +6.8 -]
269.1 280.0 +10.8 + 4.0%
92.6 73.2 -19.4 - 20.9%
3.4 3.6 +0.2 + 6.2%
173.1 203.1 +30.0 + 17.3%
220 JPY 258 JPY +38 JPY + 17.3%
Income tax
Non-controlling interests
Financial income/expenses, other
Change
Underlying Revenue
Underlying Core Profit before tax
Underlying Core Net profit
Underlying Core EPS
Underlying Gross profit
S&M
R&D
Other income
Other expenses
Underlying Core Earnings
20
(billion JPY)
+ 3.8%
+ 1.5%
+ 17.3%
*2 Tax impact due to capital redemption from a subsidiary-14.5 (gain)
YTD Performance Confirms FY15 as Turnaround YearCore Earnings Growth to Exceed Revenue Growth by Year-End
*1 Termination cost for TAK-700 (orteronel) development 4.9 (loss)*1
*2
21
100.0
120.0
140.0
160.0
180.0
200.0
SG&A
FY14 FY15Underlying
growth (billion JPY)
40.0
60.0
80.0
100.0
120.0
140.0
R&D
Focus on Controlling OPEX
Q1 Q2 Q3 Q4 Q1 Q2 Q3 Q1 Q2 Q3 Q4 Q1 Q2 Q3
Project Summit Already Exceeding Full Year Target
22
(billion JPY)FY15-17(each year)
Cost savings
Implementation costs
FY15 YTD
21*
12
>20 avg.
>15 avg.
>120
Up to 100
FY13-17(cumulative)
34 3462
28
>20**
>20**
>20**
0
50
100
150
FY13 FY14 FY15 FY16 FY17
5-year cumulative savings**Average of the
next 3 years.
• 62% Procurement and 37% Non-Procurement
• 33% Commercial, 31% R&D, 19% Production & Supply, and 17% G&A* FY15 YTD Savings Breakdown
Cash Flow and Debt
FY15 YTD Operating Free Cash Flow was 110 billion JPY,an increase of 46 bln JPY vs. FY14 YTD
- 11.5
- 66.7
+ 170.6
- 60.7
- 133.8
- 31.2
24
* Debt figures in this slide represent bonds and loans FX rate hedged basis. Cash and cash equivalents include short‐term investments which mature or become due within one year from the reporting date.
** Other includes purchase of treasury shares for ESOP and BIP, acquisitions and others.
Operating Free Cash Flow Over 100 bln JPYImproved by 46 bln JPY
(billion JPY)
Operating Free Cash Flow+ 109.8
Net Cash from Operating activities
Dividends paid
Net cash at the end of March*
Net cash at the end of December*
Other**
Capital expenditures
100.0
60.0
140.0
120.0130.0
119.4
0.0
50.0
100.0
150.0
200.0
FY15 FY16 FY17 FY18 FY19 FY20
USD*
JPY
Maturing Debt to be Re-Financed
*All USD debt is swapped into JPY.
25
(billion JPY)
Reported Forecast and Management Guidance
FY15PreviousForecast
ChangeFY15
RevisedForecast*
1,820.0 - 1,820.0
330.0 - 330.0
105.0 +15.0 120.0
115.0 - 115.0
68.0 - 68.0
87 yen - yen 87 yen
Yen per USD 120 +1 121Yen per EUR 135 -2 133
Revenue
Exchange Rate
R&D expenses
Operating profit
Net profit for the year
EPS
Profit before tax
27
*Our operations are exposed to various risks at present and in the future, such as changes in the business environment and fluctuation of foreign exchange rates. All guidance in this presentation are based on information currently available to the management, and various factors could cause actual results to differ.
(billion yen)
FY2015 Full Year Reported Forecast:Operating Profit Upgraded, Others Unchanged
28
Takeda phasing has historically resulted in a weak Q4. A similar pattern is expected this year. Some of the major items that are likely to impact results in the last quarter are as follows:
Lower Q4 Japan sales versus YTD run-rate, and the recent weakening of emerging market currencies
Higher operating expenses in Q4 in line with historical patterns; however, still expected to be in line with budget
Most impairment losses to fall in Q4 in line with historical patterns; however, still expected to be in line with budget
Forecast includes risk of write-down related to economic crisis in Venezuela and FX losses on EM currencies
Forecast includes revaluation of deferred tax assets related to Japan tax reform
Items Expected to Impact in Q4
On the Road to Sustained GrowthFull Year Management Guidance Reaffirmed
29
Underlying Revenue Low single digit
Underlying Core EPSHigher than underlyingcore earnings growth
Underlying Core EarningsHigher than underlying
revenue growth
Annual Dividend per Share 180 yen
Save the Date – Takeda IR Event in June 2016
30
Thursday June 9th, 2016Takeda IR event in Tokyo with a focus on R&D strategy and oncology
More details soon...
Appendix
Definition of Core Earnings and Core EPS
32
Core Earnings
- Core Earnings is calculated from operating profit by excluding the impact of exceptional items, such as purchase accounting, amortization and impairment loss of intangible assets, restructuring costs and major litigation costs.
- Adjustment items are detailed on the next slide.
Core EPS
- Core EPS is earnings per share based on Core Net Profit, which is calculated from Net profit for the period by excluding the impact of exceptional items, similar to those listed above, and the tax effects on them.
Adjustment Items of Core Earnings
33
Adjustment items from Operating profit Note
1 Amortization of intangibles recognized through acquisition and in-licensing
Amortization costs of • Intangibles of launched product derived from corporate acquisition• Intangibles of upfront payments and any milestone payment (e.g.
stage-up, NDA, approval) derived from in-licensing contract• Intangibles of platform technology
2 Impairments of intangibles recognized through acquisition and in-licensing
Impairments of • Intangibles (launched products and R&D pipeline) derived from
corporate acquisition and in-licensing contract• Goodwill
3 Other purchase accounting effects • Inventory step-up amortization• Fair value adjustment of contingent consideration
4 Profits and losses from the disposal of affiliates, business and others
• Disposal of businesses, affiliates, real estate and securities** Adjustment item of Core net profit
5 Costs of major restructuring programs • Integration costs• Implementation costs
6 Gains and charges from legal settlements/judgments/fines and large sized litigation expense (payment to lawyer)
• e.g. Actos settlement provision, litigation expense (payment to lawyer), etc.
7 Gains and losses not related to underlying business performance which the company deems exceptional
• Global issues outside the healthcare sector beyond the Group’s control (ex. disaster, etc.)
• Expense caused by product recall• Government grants• Tax refund/ dispute, etc.
FY14 Q3 FY15 Q3
488.6 489.2 +0.6 + 0.1%
349.2 344.2 -5.0 - 1.4%
111.9 110.6 -1.3 - 1.1%
G&A 43.0 51.4 +8.4 + 19.6%
92.7 92.5 -0.2 - 0.2%
63.3 30.1 -33.2 - 52.4%
55.9 5.7 -50.3 - 89.8%
12.0 8.2 -3.8 - 31.6%
82.4 57.0 -25.3 - 30.8%
74.4 52.6 -21.9 - 29.4%
18.3 59.3 +41.0 -
23 JPY 76 JPY +52 JPY -EPS
S&M
R&D
Amortization and impairment losses on intangible assets associated with products
* Pantoprazole is included in Emerging Markets (EM), but not in GI (Gastrointestinal), as it is a key driver in EM** Year and month of the first launch by Takeda in any region.
FY14 YTD FY15 YTD
ENTYVIO 17.6 58.8 +41.2 -
DEXILANT 50.8 56.8 +6.0 +11.8%
AMITIZA 25.9 28.6 +2.7 +10.6%
TAKECAB - 4.2 +4.2 -
LANSOPRAZOLE 80.9 70.1 -10.8 -13.4%
GI 175.1 218.4 +43.3 +24.7%
ADCETRIS 17.5 22.1 +4.6 +26.5%
VECTIBIX 14.1 14.2 +0.2 +1.1%
LEUPRORELIN 94.8 95.4 +0.6 +0.6%
VELCADE 129.4 124.6 -4.7 -3.7%
NINLARO - 0.5 +0.5 -
Oncology 255.8 256.9 +1.1 +0.4%
Underlying growth
Growth Drivers in GI and OncologyUnderlying Revenue Growth
*Adjustment applying a constant currency at 1USD=120JPY, 1EUR=130JPY and etc.
+ 1.5%
Bridge from Operating Profit to Underlying Core Earnings
FY14 YTD FY15 YTD Growth
79.7 113.6 + 42.5%
101 JPY 145 JPY + 43.0%
Purchase accounting effects 47.5 62.7
Disposal of affiliates, business and others -19.9 -0.2
Restructuring costs 14.3 9.1
Tax expense related to R&D credit 42.7 -
Other exceptional gains and losses 5.4 3.3
169.8 188.6 + 11.1%
216 JPY 241 JPY + 11.4%
Fx effects* 0.0 14.9
Divestments / Acquisition 3.3 -0.4Underlying
Growth
173.1 203.1 + 17.3%
220 JPY 258 JPY + 17.3%
Net profit
EPS
Underlying Core net profit
Underlying Core EPS
Core net profit
Core EPS
Bridge from Net Profit to Underlying Core Net Profit
40
*Adjustment applying a constant currency at 1USD=120JPY, 1EUR=130JPY and etc.
(billion JPY)
+ 17.3%
FY14 YTD FY15 YTD Change
82.3 116.4 +34.0
180.4 145.4
-100.9 -66.7
-62.8 -29.9
50.4 5.5
149.5 170.6 +21.0
-35.8 -38.8
-50.0 -21.9
(+63.7) (+109.8) (+46.1)
25.4 0.4
Proceeds from sales/redemption of investment and time deposit 162.9 4.4
1.0 -43.3
103.4 -99.3 - 202.7
-17.6 -22.3
-132.1 -133.8
-19.5 -6.8
-169.2 -162.9 +6.3
83.8 -91.6 - 175.4Net increase (decrease) in cash and cash equivalents*
Acquisition of tangible assets
Acquisition of intangible assets
Other
Payment for acquisition of treasury stock
Dividends paid
Other
Net cash used in financing activities
(Operating Free Cash Flow)
Proceeds from sales of tangible assets
Net cash from (used in) investing activities
Decrease (increase) in trade working capital
Income taxes paid
Other
Net cash from operating activities
Net profit
Depreciation, amortization and impairment loss
Cash Flow
41
(billion JPY)
* Net decrease in cash and cash equivalents does not include effect of movements in exchange rates on cash and cash equivalents.
Average Exchange Rates for FY15 YTD
42
-22%
13%
-27%
-4%
15%
-30% -20% -10% 0% 10% 20%
USD
EUR
RUB
CNY
BRL
105.68
139.71
2.80
17.10
45.75
121.68
133.64
2.05
19.37
35.57
FY14 YTD
FY15 YTD
Average Exchange Rates (JPY)*
vs. FY14 YTD
*Average of preceding month-end spot rates for each month of the period
Monthly Exchange Rates and Outlook
43
Actual*FY14 FY15
USD EUR USD EUR
Apr 103 141 120 130
May 102 141 119 130
Jun 102 138 124 136
Jul 101 138 123 138
Aug 103 138 124 136
Sep 104 137 122 136
Oct 109 139 120 135
Nov 109 138 121 133
Dec 118 147 123 130
average Apr-Dec 106 140 122 134
(JPY)
OutlookFY15
USD EUR
average Jan-Mar 117 128
average Apr-Mar 121 133
*Preceding month-end spot rates applied to each month of the period(JPY)
Impact of 1% Depreciation of Yen
44
FY15
USD EUR RUB CNY BRL
Revenue 14 5 1 2 1
Operating profit 0 -1 0 0 0
Core Earnings 2 1 0 0 0
Impact of 1% depreciation of yen for Jan-Mar (hundred million JPY)
Sharpen Therapeutic Area Focus in R&D
45
Hone and develop industry-leading capabilities to deeply explore these therapeutic areas to develop
innovative, meaningful new therapies for patients
VaccinesSpecialty CV
Oncology GIPsychiatry Neurology
(partnering)
CNS
46
Divestment of Respiratory Portfolio Will AllowTakeda to Focus on Core Therapeutic Areas
• Revenue of approx. 24bn yen in FY2014• Deal expected to close during Q1 CY2016• Deal value offsets book value of intangibles and goodwill
Divestment Aligned with Takeda's Sharpened Therapeutic Area Focus
OMNARIS
ALVESCODAXAS
+ some regional products & pre-clinical assets
In Japan there is an increasing need for stable supply of affordable high-quality generics due to government policies to reduce healthcare costs
47
Generic Business Venture with Teva UnderscoresTakeda's Focus on Innovation
High-quality genericsSome long-listed products
(incl. BLOPRESS, TAKEPRON, BASEN)
Leading brand reputation,strong distribution network
Global leader in generics,operational expertise
51% stake49% stakeOffer broad portfolio
to patients
• Revenue of LLPs to be transferred: approx. 125bn yen in FY14 (declining in FY15 due to generic penetration)• Takeda will book revenue for services related to the supply of LLPs and distribution of LLPs and generics• As a result of the transaction, Takeda’s FY16 revenue is estimated to decrease by approx. 50bn yen• Accretive to Takeda's EPS and cash flow in FY16 and over the long-term
New company will be established in or after April 2016


![MARCH 2016 [FY2015] Q3 FINANCIAL RESULT SUMMARY · MARCH 2016 [FY2015] Q3 FINANCIAL RESULT SUMMARY February 2016 1) Summary of Result and Forecast (Unit: Billion Yen) Q1 Q2 Q3 Total](https://static.documents.pub/doc/80x56/5fcc43cdfc3b99546a3a9ae2/march-2016-fy2015-q3-financial-result-summary-march-2016-fy2015-q3-financial.jpg)


![FY2015 Full-Year Consolidated Financial Results [Japan GAAP] (April 1, 2015 through March 31, 2016) · FY2015 Full-Year Consolidated Financial Results [Japan GAAP] (April 1, 2015](https://static.documents.pub/doc/80x56/5fcc42730482603d5603dd4a/fy2015-full-year-consolidated-financial-results-japan-gaap-april-1-2015-through.jpg)


