95
CONSOLIDATED FINANCIAL STATEMENTS * * * Year ended December 31, 2019
CONSOLIDATED FINANCIAL STATEMENTS
* *
*
Year ended December 31, 2019

Deloitte & Associés 7, boulevard Jacques Saadé
Quai de la Joliette 13235 Marseille Cedex 02
S.A.S. au capital de 2 188 160 € 572 028 041 RCS Nanterre
KPMG Audit Division of KPMG S.A. 480 avenue du Prado
CS 90021 13272 Marseille Cedex 08
CMA CGM
Société Anonyme Boulevard Jacques Saadé
4 Quai d’Arenc 13235 Marseille Cedex 2
Statutory auditors’ report on the consolidated financial statements
For the year ended December 31, 2019

Deloitte & Associés 7, boulevard Jacques Saadé
Quai de la Joliette 13235 Marseille Cedex 02
S.A.S. au capital de 2 188 160 € 572 028 041 RCS Nanterre
KPMG Audit Division of KPMG S.A. 480 avenue du Prado
CS 90021 13272 Marseille Cedex 08
CMA CGM Société Anonyme
Boulevard Jacques Saadé 4 Quai d’Arenc
13235 Marseille Cedex 2
______
Statutory auditors’ report on the consolidated financial statements
For the year ended December 31, 2019 ______
This is a translation into English of the statutory auditors’ report on the consolidated financial statements of the Company issued in French and it is provided solely for the convenience of English speaking users. This statutory auditors’ report includes information required by European regulation and French law, such as information about the appointment of the statutory auditors or verification of the management report and other documents provided to shareholders. This report should be read in conjunction with, and construed in accordance with, French law and professional auditing standards applicable in France. To the annual general meeting of CMA CGM,
Opinion
In compliance with the engagement entrusted to us by your Shareholders’ general meeting, we have audited the accompanying consolidated financial statements of CMA CGM for the year ended December 31, 2019.
In our opinion, the consolidated financial statements give a true and fair view of the assets and liabilities and of the financial position of the Group as at December 31, 2019 and of the results of its operations for the year then ended in accordance with International Financial Reporting Standards as adopted by the European Union.
Basis for Opinion
Audit Framework
We conducted our audit in accordance with professional standards applicable in France. We believe that the audit evidence we have obtained is sufficient and appropriate to provide a basis for our opinion.
CMA CGM S.A. – Statutory auditor’s report on the consolidated financial statements Year ended December 31, 2019
2 / 5
Our responsibilities under those standards are further described in the “Statutory Auditors’ Responsibilities for the Audit of the Consolidated Financial Statements” section of our report.
Independence
We conducted our audit engagement in compliance with independence rules applicable to us, for the period from January 1st, 2019 to the date of our report and specifically we did not provide any prohibited non-audit services referred to in the French Code of ethics (Code de déontologie) for statutory auditors.
Emphasis of matter
We draw attention to the following matters described in Notes 2.2.1 and 2.2.4 to the consolidated financial statements relating to changes in accounting policies arising from the application of new standards and interpretations since January 1st, 2019 with respect to:
i. The changes in accounting methods arising from the mandatory application of the new standard IFRS 16 – Leases and the interpretation IFRIC 23 – Uncertainty over income tax treatment since January 1st, 2019 ;
ii. A change in presentation of the operating exchange gains and losses in the consolidated financial statements.
Our opinion is not modified in respect of these matters.
Justification of Assessments
In accordance with the requirements of Articles L.823-9 and R.823-7 of the French Commercial Code (Code de commerce) relating to the justification of our assessments, we inform you of the following assessments that, in our professional judgment, were of most significance in our audit of the consolidated financial statements of the current period.
These matters were addressed in the context of our audit of the consolidated financial statements as a whole, and in forming our opinion thereon, and we do not provide a separate opinion on specific items of the consolidated financial statements.
Note 2.3 “Significant accounting judgments, estimates and assumptions” to the consolidated financial statements discloses the significant accounting judgments, estimates and assumptions adopted by management. These significant estimates mainly relate to judgments and assumptions used for the purchase price allocation related to business combinations, the determination of the operating segments, the accounting for investment premiums related to the financing of vessels with leveraged tax leases, the measurement of deferred tax assets, the impairment testing of non-financial assets, the determination of the useful lives and residual values of the vessels, the determination of demurrage receivables and accruals for port call expenses, transportation costs and handling services, the assessment of whether the lease contract options are reasonably certain to be exercised or not and the assessment of other items which may affect the lease term and the measurement of the lease liability, the determination of the consolidation scope, the analysis of interests in associates and joint ventures and the determination of the risks related to cargo and corporate claims.
CMA CGM S.A. – Statutory auditor’s report on the consolidated financial statements Year ended December 31, 2019
3 / 5
Our procedures consisted in assessing the data and assumptions underlying these judgments and estimates, reviewing, using sampling techniques, the calculations performed by the company and verifying the appropriateness of disclosures provided in the notes to the consolidated financial statements on the assumptions and options adopted by the company.
As indicated in Note 2.3 to the consolidated financial statements, these estimates are based on assumptions that are by nature uncertain, and actual results may sometimes differ significantly from forecast data used.
Specific verifications
We have also performed, in accordance with professional standards applicable in France, the specific verifications required by laws and regulations of the Group information given in the management report of the Board of Directors.
We have no matters to report as to its fair presentation and its consistency with the consolidated financial statements.
We attest that the consolidated non-financial statement required by Article L.225-102-1 of the French Commercial Code (Code de commerce), is included in the Group’s management report, it being specified that, in accordance with Article L.823-10 of this Code, we have verified neither the fair presentation nor the consistency with the consolidated financial statements of the information contained therein. This information must be reported by an independent third party.
Responsibilities of Management and Those Charged with Governance for the Consolidated Financial Statements
Management is responsible for the preparation and fair presentation of the consolidated financial statements in accordance with International Financial Reporting Standards as adopted by the European Union, and for such internal control as management determines is necessary to enable the preparation of consolidated financial statements that are free from material misstatement, whether due to fraud or error.
In preparing the consolidated financial statements, management is responsible for assessing the Company’s ability to continue as a going concern, disclosing, as applicable, matters related to going concern and using the going concern basis of accounting unless it is expected to liquidate the Company or to cease operations.
The consolidated financial statements were approved by the Board of Directors.
Statutory Auditors’ Responsibilities for the Audit of the Consolidated Financial Statements
Our role is to issue a report on the consolidated financial statements. Our objective is to obtain reasonable assurance about whether the consolidated financial statements as a whole are free from material misstatement. Reasonable assurance is a high level of assurance, but is not a guarantee that an audit conducted in accordance with professional standards will always detect a material misstatement when it exists. Misstatements can arise from fraud or error and are
CMA CGM S.A. – Statutory auditor’s report on the consolidated financial statements Year ended December 31, 2019
4 / 5
considered material if, individually or in the aggregate, they could reasonably be expected to influence the economic decisions of users taken on the basis of these financial statements.
As specified in Article L.823-10-1 of the French Commercial Code (Code de commerce), our statutory audit does not include assurance on the viability of the Company or the quality of management of the affairs of the Company.
As part of an audit conducted in accordance with professional standards applicable in France, the statutory auditor exercises professional judgment throughout the audit and furthermore:
• Identifies and assesses the risks of material misstatement of the consolidated financial statements, whether due to fraud or error, designs and performs audit procedures responsive to those risks, and obtains audit evidence considered to be sufficient and appropriate to provide a basis for his opinion. The risk of not detecting a material misstatement resulting from fraud is higher than for one resulting from error, as fraud may involve collusion, forgery, intentional omissions, misrepresentations, or the override of internal control.
• Obtains an understanding of internal control relevant to the audit in order to design audit procedures that are appropriate in the circumstances, but not for the purpose of expressing an opinion on the effectiveness of the internal control.
• Evaluates the appropriateness of accounting policies used and the reasonableness of accounting estimates and related disclosures made by management in the consolidated financial statements.
• Assesses the appropriateness of management’s use of the going concern basis of accounting and, based on the audit evidence obtained, whether a material uncertainty exists related to events or conditions that may cast significant doubt on the Company’s ability to continue as a going concern. This assessment is based on the audit evidence obtained up to the date of his audit report. However, future events or conditions may cause the Company to cease to continue as a going concern. If the statutory auditor concludes that a material uncertainty exists, there is a requirement to draw attention in the audit report to the related disclosures in the consolidated financial statements or, if such disclosures are not provided or inadequate, to modify the opinion expressed therein.
• Evaluates the overall presentation of the consolidated financial statements and assesses whether these statements represent the underlying transactions and events in a manner that achieves fair presentation.
CMA CGM S.A. – Statutory auditor’s report on the consolidated financial statements Year ended December 31, 2019
5 / 5
• Obtains sufficient appropriate audit evidence regarding the financial information of the entities or business activities within the Group to express an opinion on the consolidated financial statements. The statutory auditor is responsible for the direction, supervision and performance of the audit of the consolidated financial statements and for the opinion expressed on these consolidated financial statements.
Marseille, March 6, 2020
The statutory auditors French original signed by
Deloitte & Associés
Hugues Desgranges Partner
KPMG Audit Division of KPMG S.A
Georges Maregiano Partner
CMA CGM / 2 Consolidated financial statements Year ended December 31, 2019
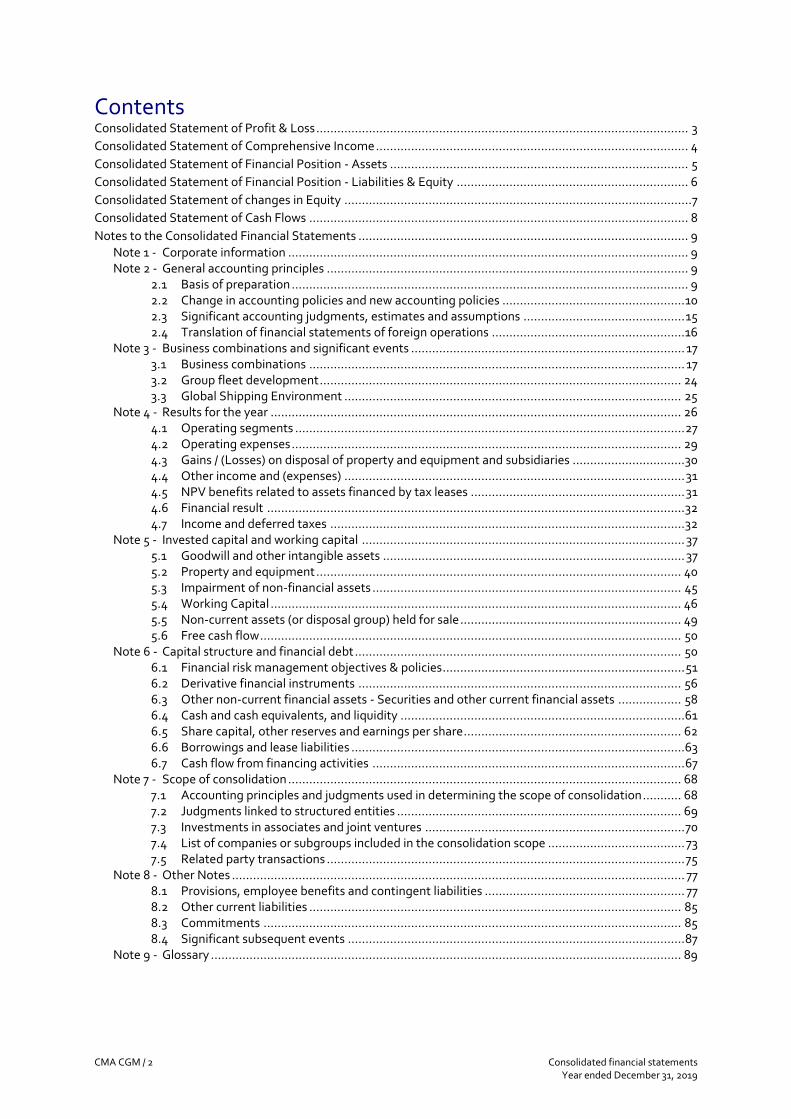
Contents Consolidated Statement of Profit & Loss .......................................................................................................... 3 Consolidated Statement of Comprehensive Income ......................................................................................... 4 Consolidated Statement of Financial Position - Assets ..................................................................................... 5 Consolidated Statement of Financial Position - Liabilities & Equity .................................................................. 6 Consolidated Statement of changes in Equity ................................................................................................... 7 Consolidated Statement of Cash Flows ............................................................................................................ 8 Notes to the Consolidated Financial Statements .............................................................................................. 9
Note 1 - Corporate information .................................................................................................................. 9 Note 2 - General accounting principles ....................................................................................................... 9
2.1 Basis of preparation ................................................................................................................. 9 2.2 Change in accounting policies and new accounting policies .................................................... 10 2.3 Significant accounting judgments, estimates and assumptions .............................................. 15 2.4 Translation of financial statements of foreign operations .......................................................16
Note 3 - Business combinations and significant events .............................................................................. 17 3.1 Business combinations ........................................................................................................... 17 3.2 Group fleet development ....................................................................................................... 24 3.3 Global Shipping Environment ................................................................................................ 25
Note 4 - Results for the year ..................................................................................................................... 26 4.1 Operating segments ............................................................................................................... 27 4.2 Operating expenses ............................................................................................................... 29 4.3 Gains / (Losses) on disposal of property and equipment and subsidiaries ................................30 4.4 Other income and (expenses) ................................................................................................. 31 4.5 NPV benefits related to assets financed by tax leases ............................................................. 31 4.6 Financial result ....................................................................................................................... 32 4.7 Income and deferred taxes ..................................................................................................... 32
Note 5 - Invested capital and working capital ............................................................................................ 37 5.1 Goodwill and other intangible assets ...................................................................................... 37 5.2 Property and equipment ........................................................................................................ 40 5.3 Impairment of non-financial assets ........................................................................................ 45 5.4 Working Capital ..................................................................................................................... 46 5.5 Non-current assets (or disposal group) held for sale ............................................................... 49 5.6 Free cash flow ........................................................................................................................ 50
Note 6 - Capital structure and financial debt ............................................................................................. 50 6.1 Financial risk management objectives & policies..................................................................... 51 6.2 Derivative financial instruments ............................................................................................ 56 6.3 Other non-current financial assets - Securities and other current financial assets .................. 58 6.4 Cash and cash equivalents, and liquidity .................................................................................61 6.5 Share capital, other reserves and earnings per share .............................................................. 62 6.6 Borrowings and lease liabilities ...............................................................................................63 6.7 Cash flow from financing activities ......................................................................................... 67
Note 7 - Scope of consolidation ................................................................................................................ 68 7.1 Accounting principles and judgments used in determining the scope of consolidation ........... 68 7.2 Judgments linked to structured entities ................................................................................. 69 7.3 Investments in associates and joint ventures .......................................................................... 70 7.4 List of companies or subgroups included in the consolidation scope ....................................... 73 7.5 Related party transactions ...................................................................................................... 75
Note 8 - Other Notes ................................................................................................................................. 77 8.1 Provisions, employee benefits and contingent liabilities ......................................................... 77 8.2 Other current liabilities .......................................................................................................... 85 8.3 Commitments ....................................................................................................................... 85 8.4 Significant subsequent events ................................................................................................ 87
Note 9 - Glossary ...................................................................................................................................... 89
Consolidated financial statements CMA CGM / 3 Year ended December 31, 2019
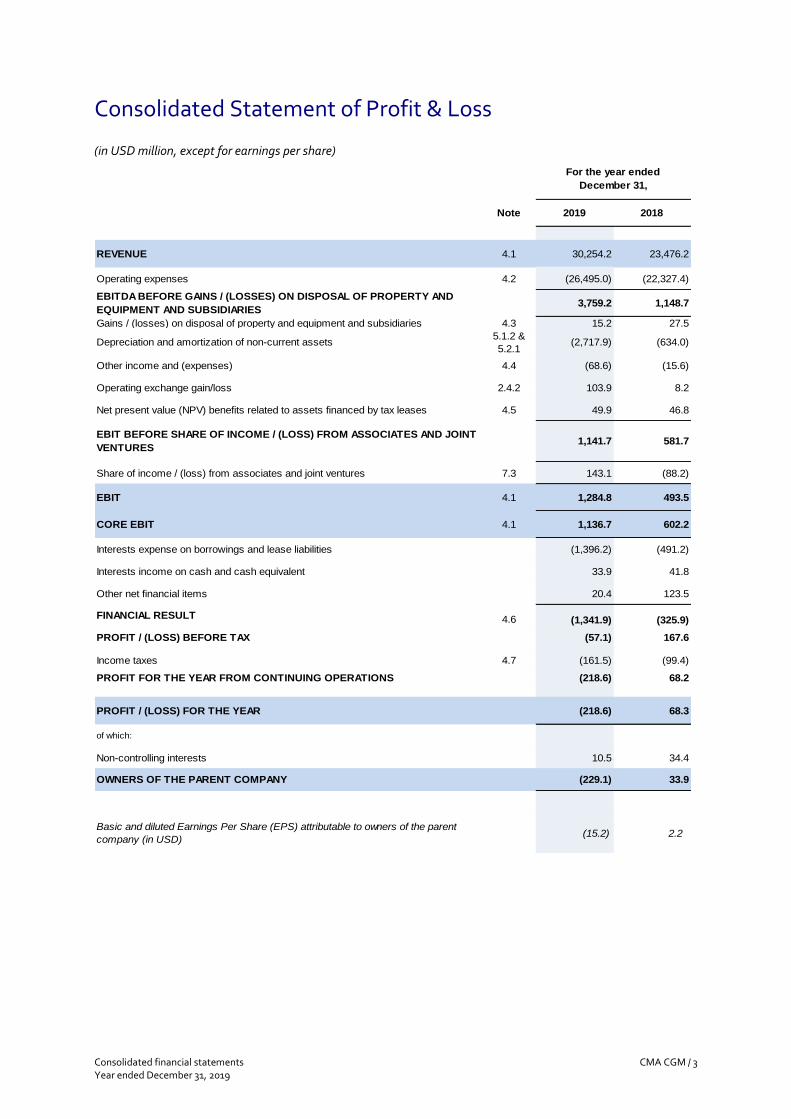
Consolidated Statement of Profit & Loss
(in USD million, except for earnings per share)
Note 2019 2018
REVENUE 4.1 30,254.2 23,476.2
Operating expenses 4.2 (26,495.0) (22,327.4)
EBITDA BEFORE GAINS / (LOSSES) ON DISPOSAL OF PROPERTY AND
EQUIPMENT AND SUBSIDIARIES3,759.2 1,148.7
Gains / (losses) on disposal of property and equipment and subsidiaries 4.3 15.2 27.5
Depreciation and amortization of non-current assets5.1.2 &
5.2.1(2,717.9) (634.0)
Other income and (expenses) 4.4 (68.6) (15.6)
Operating exchange gain/loss 2.4.2 103.9 8.2
Net present value (NPV) benefits related to assets financed by tax leases 4.5 49.9 46.8
EBIT BEFORE SHARE OF INCOME / (LOSS) FROM ASSOCIATES AND JOINT
VENTURES1,141.7 581.7
Share of income / (loss) from associates and joint ventures 7.3 143.1 (88.2)
EBIT 4.1 1,284.8 493.5
CORE EBIT 4.1 1,136.7 602.2
Interests expense on borrowings and lease liabilities (1,396.2) (491.2)
Interests income on cash and cash equivalent 33.9 41.8
Other net financial items 20.4 123.5
FINANCIAL RESULT 4.6 (1,341.9) (325.9)
PROFIT / (LOSS) BEFORE TAX (57.1) 167.6
Income taxes 4.7 (161.5) (99.4)
PROFIT FOR THE YEAR FROM CONTINUING OPERATIONS (218.6) 68.2
PROFIT / (LOSS) FOR THE YEAR (218.6) 68.3
of which:
Non-controlling interests 10.5 34.4
OWNERS OF THE PARENT COMPANY (229.1) 33.9
Basic and diluted Earnings Per Share (EPS) attributable to owners of the parent
company (in USD) (15.2) 2.2
For the year ended
December 31,

CMA CGM / 4 Consolidated financial statements Year ended December 31, 2019
Consolidated Statement of Comprehensive Income
(in USD million)
Note 2019 2018
PROFIT / (LOSS) FOR THE YEAR (218.6) 68.3
Other comprehensive income / (loss) reclassifiable to Profit and Loss
Cash flow hedges:
Effective portion of changes in fair value (16.7) 14.2
Reclassified to profit or loss 1.2 1.9
Net investment hedge 6.2.2 7.1 9.1
Net investment hedge - Share of other comprehensive income of associates and
joint ventures7.3.2 5.3 12.3
Foreign operations – foreign currency translation differences 24.4 (40.3)
Share of other comprehensive income of associates and joint ventures 7.3.2 (9.4) (35.4)
Other comprehensive income / (loss) non reclassifiable to
Profit and Loss
Remeasurment of defined benefit pension plans 8.1 (11.7) (3.8)
Remeasurement of defined benefit pension plans of associates and joint ventures 7.3.2 (0.1) 0.2
Tax on other comprehensive income non reclassifiable to Profit and Loss 4.7.2 1.2 (1.3)
Tax on other comprehensive income non reclassifiable to Profit and Loss -
Associates and joint ventures7.3.2 (0.0) (0.1)
TOTAL OTHER COMPREHENSIVE INCOME / (LOSS)
FOR THE YEAR, NET OF TAX1.2 (43.1)
TOTAL COMPREHENSIVE INCOME / (LOSS)
FOR THE YEAR, NET OF TAX(217.4) 25.1
of which:
Non-controlling interests 9.3 34.3
Owners of the parent company (226.7) (9.1)
For the year ended
December 31,
Consolidated financial statements CMA CGM / 5 Year ended December 31, 2019
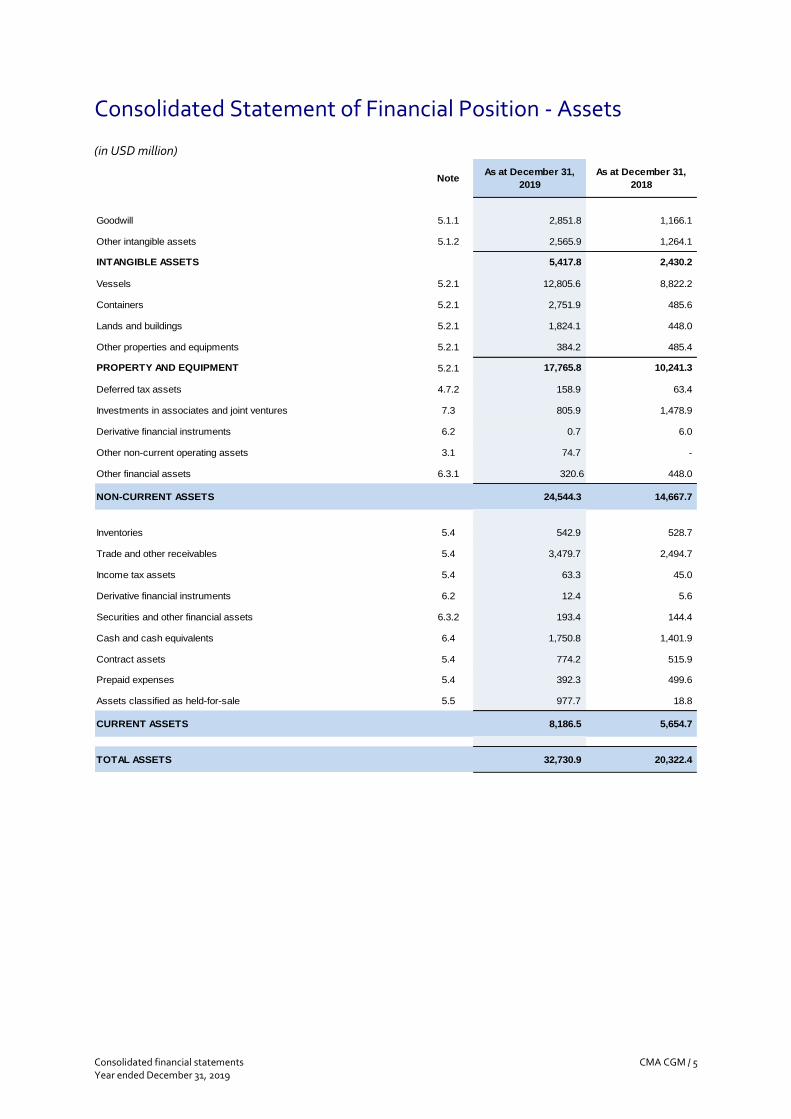
Consolidated Statement of Financial Position - Assets
(in USD million)
NoteAs at December 31,
2019
As at December 31,
2018
Goodwill 5.1.1 2,851.8 1,166.1
Other intangible assets 5.1.2 2,565.9 1,264.1
INTANGIBLE ASSETS 5,417.8 2,430.2
Vessels 5.2.1 12,805.6 8,822.2
Containers 5.2.1 2,751.9 485.6
Lands and buildings 5.2.1 1,824.1 448.0
Other properties and equipments 5.2.1 384.2 485.4
PROPERTY AND EQUIPMENT 5.2.1 17,765.8 10,241.3
Deferred tax assets 4.7.2 158.9 63.4
Investments in associates and joint ventures 7.3 805.9 1,478.9
Derivative financial instruments 6.2 0.7 6.0
Other non-current operating assets 3.1 74.7 -
Other financial assets 6.3.1 320.6 448.0
NON-CURRENT ASSETS 24,544.3 14,667.7
Inventories 5.4 542.9 528.7
Trade and other receivables 5.4 3,479.7 2,494.7
Income tax assets 5.4 63.3 45.0
Derivative financial instruments 6.2 12.4 5.6
Securities and other financial assets 6.3.2 193.4 144.4
Cash and cash equivalents 6.4 1,750.8 1,401.9
Contract assets 5.4 774.2 515.9
Prepaid expenses 5.4 392.3 499.6
Assets classified as held-for-sale 5.5 977.7 18.8
CURRENT ASSETS 8,186.5 5,654.7
TOTAL ASSETS 32,730.9 20,322.4
CMA CGM / 6 Consolidated financial statements Year ended December 31, 2019
Consolidated Statement of Financial Position - Liabilities & Equity
(in USD million)
NoteAs at December 31,
2019
As at December 31,
2018
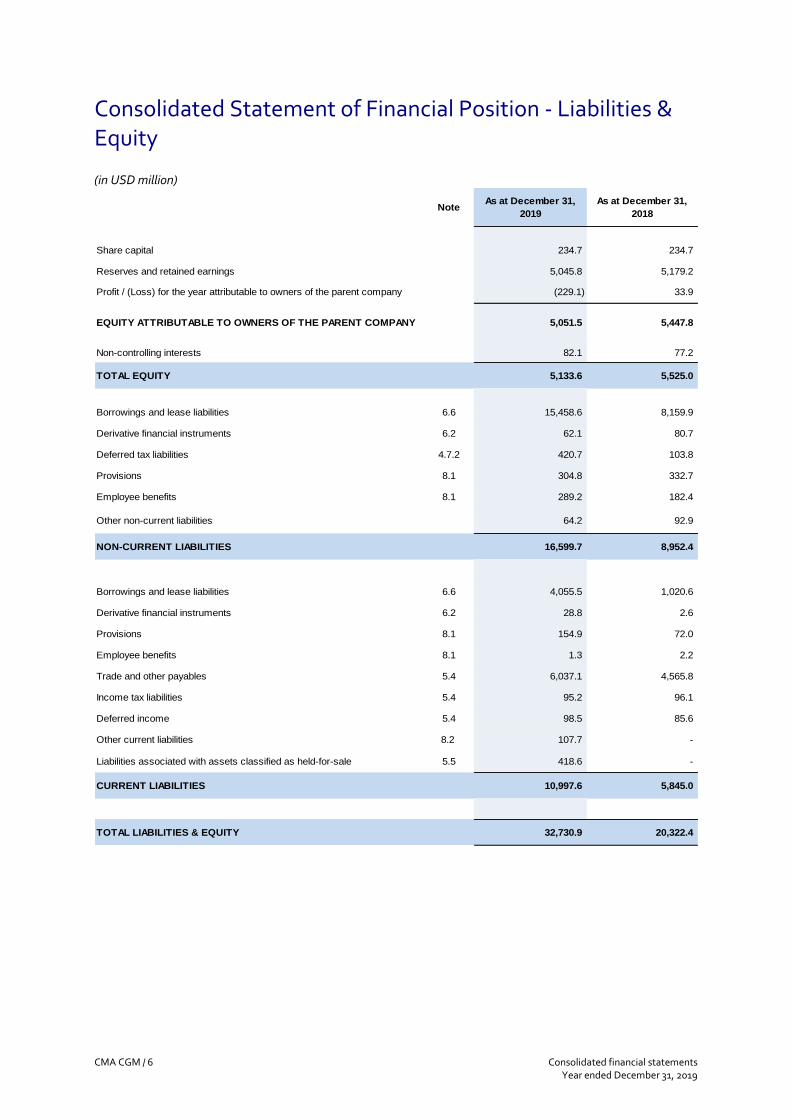
Share capital 234.7 234.7
Reserves and retained earnings 5,045.8 5,179.2
Profit / (Loss) for the year attributable to owners of the parent company (229.1) 33.9
EQUITY ATTRIBUTABLE TO OWNERS OF THE PARENT COMPANY 5,051.5 5,447.8
Non-controlling interests 82.1 77.2
TOTAL EQUITY 5,133.6 5,525.0
Borrowings and lease liabilities 6.6 15,458.6 8,159.9
Derivative financial instruments 6.2 62.1 80.7
Deferred tax liabilities 4.7.2 420.7 103.8
Provisions 8.1 304.8 332.7
Employee benefits 8.1 289.2 182.4
Other non-current liabilities 64.2 92.9
NON-CURRENT LIABILITIES 16,599.7 8,952.4
Borrowings and lease liabilities 6.6 4,055.5 1,020.6
Derivative financial instruments 6.2 28.8 2.6
Provisions 8.1 154.9 72.0
Employee benefits 8.1 1.3 2.2
Trade and other payables 5.4 6,037.1 4,565.8
Income tax liabilities 5.4 95.2 96.1
Deferred income 5.4 98.5 85.6
Other current liabilities 8.2 107.7 -
Liabilities associated with assets classified as held-for-sale 5.5 418.6 -
CURRENT LIABILITIES 10,997.6 5,845.0
TOTAL LIABILITIES & EQUITY 32,730.9 20,322.4
Consolidated financial statements CMA CGM / 7 Year ended December 31, 2019
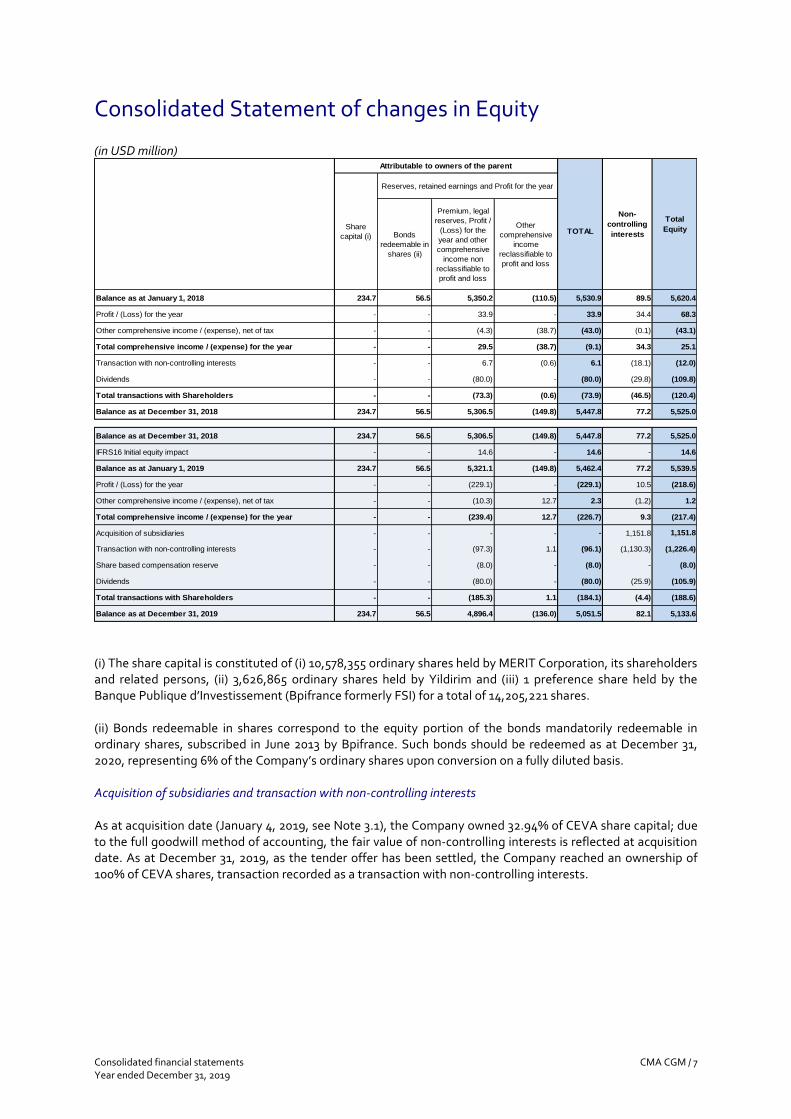
Consolidated Statement of changes in Equity
(in USD million)
Bonds
redeemable in
shares (ii)
Premium, legal
reserves, Profit /
(Loss) for the
year and other
comprehensive
income non
reclassifiable to
profit and loss
Other
comprehensive
income
reclassifiable to
profit and loss
Balance as at January 1, 2018 234.7 56.5 5,350.2 (110.5) 5,530.9 89.5 5,620.4
Profit / (Loss) for the year - - 33.9 - 33.9 34.4 68.3
- - (4.3) (38.7) (43.0) (0.1) (43.1)
Total comprehensive income / (expense) for the year - - 29.5 (38.7) (9.1) 34.3 25.1
Transaction with non-controlling interests - - 6.7 (0.6) 6.1 (18.1) (12.0)
Dividends - - (80.0) - (80.0) (29.8) (109.8)
Total transactions with Shareholders - - (73.3) (0.6) (73.9) (46.5) (120.4)
Balance as at December 31, 2018 234.7 56.5 5,306.5 (149.8) 5,447.8 77.2 5,525.0
Balance as at December 31, 2018 234.7 56.5 5,306.5 (149.8) 5,447.8 77.2 5,525.0
IFRS16 Initial equity impact - - 14.6 - 14.6 - 14.6
Balance as at January 1, 2019 234.7 56.5 5,321.1 (149.8) 5,462.4 77.2 5,539.5
Profit / (Loss) for the year - - (229.1) - (229.1) 10.5 (218.6)
- - (10.3) 12.7 2.3 (1.2) 1.2
Total comprehensive income / (expense) for the year - - (239.4) 12.7 (226.7) 9.3 (217.4)
Acquisition of subsidiaries - - - - - 1,151.8 1,151.8
Transaction with non-controlling interests - - (97.3) 1.1 (96.1) (1,130.3) (1,226.4)
Share based compensation reserve - - (8.0) - (8.0) - (8.0)
Dividends - - (80.0) - (80.0) (25.9) (105.9)
Total transactions with Shareholders - - (185.3) 1.1 (184.1) (4.4) (188.6)
Balance as at December 31, 2019 234.7 56.5 4,896.4 (136.0) 5,051.5 82.1 5,133.6
Share
capital (i)
Other comprehensive income / (expense), net of tax
Other comprehensive income / (expense), net of tax
Non-
controlling
interestsTOTAL
Attributable to owners of the parent
Reserves, retained earnings and Profit for the year
Total
Equity
(i) The share capital is constituted of (i) 10,578,355 ordinary shares held by MERIT Corporation, its shareholders and related persons, (ii) 3,626,865 ordinary shares held by Yildirim and (iii) 1 preference share held by the Banque Publique d’Investissement (Bpifrance formerly FSI) for a total of 14,205,221 shares. (ii) Bonds redeemable in shares correspond to the equity portion of the bonds mandatorily redeemable in ordinary shares, subscribed in June 2013 by Bpifrance. Such bonds should be redeemed as at December 31, 2020, representing 6% of the Company’s ordinary shares upon conversion on a fully diluted basis. Acquisition of subsidiaries and transaction with non-controlling interests As at acquisition date (January 4, 2019, see Note 3.1), the Company owned 32.94% of CEVA share capital; due to the full goodwill method of accounting, the fair value of non-controlling interests is reflected at acquisition date. As at December 31, 2019, as the tender offer has been settled, the Company reached an ownership of 100% of CEVA shares, transaction recorded as a transaction with non-controlling interests.
CMA CGM / 8 Consolidated financial statements Year ended December 31, 2019
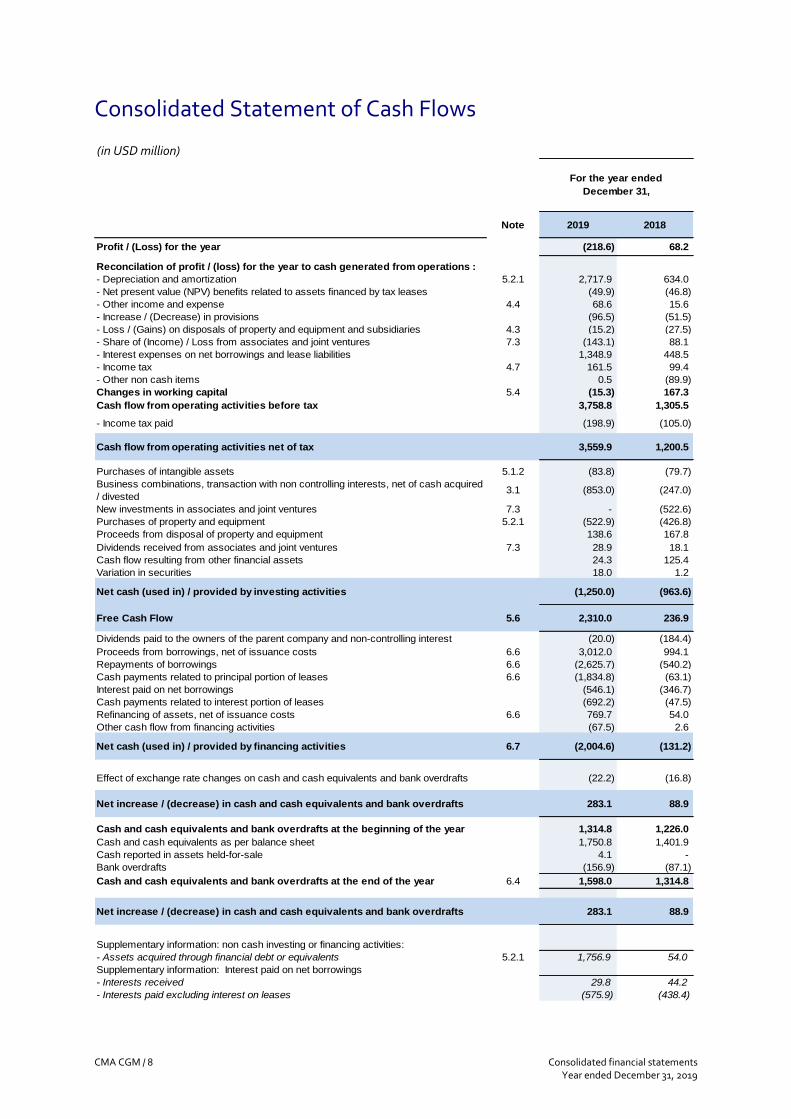
Consolidated Statement of Cash Flows
(in USD million)
Note 2019 2018
Profit / (Loss) for the year (218.6) 68.2
Reconcilation of profit / (loss) for the year to cash generated from operations :
- Depreciation and amortization 5.2.1 2,717.9 634.0
- Net present value (NPV) benefits related to assets financed by tax leases (49.9) (46.8)
- Other income and expense 4.4 68.6 15.6
- Increase / (Decrease) in provisions (96.5) (51.5)
- Loss / (Gains) on disposals of property and equipment and subsidiaries 4.3 (15.2) (27.5)
- Share of (Income) / Loss from associates and joint ventures 7.3 (143.1) 88.1
- Interest expenses on net borrowings and lease liabilities 1,348.9 448.5
- Income tax 4.7 161.5 99.4
- Other non cash items 0.5 (89.9)
Changes in working capital 5.4 (15.3) 167.3
Cash flow from operating activities before tax 3,758.8 1,305.5
- Income tax paid (198.9) (105.0)
Cash flow from operating activities net of tax 3,559.9 1,200.5
Purchases of intangible assets 5.1.2 (83.8) (79.7)
Business combinations, transaction with non controlling interests, net of cash acquired
/ divested3.1 (853.0) (247.0)
New investments in associates and joint ventures 7.3 - (522.6)
Purchases of property and equipment 5.2.1 (522.9) (426.8)
Proceeds from disposal of property and equipment 138.6 167.8
Dividends received from associates and joint ventures 7.3 28.9 18.1
Cash flow resulting from other financial assets 24.3 125.4
Variation in securities 18.0 1.2
Net cash (used in) / provided by investing activities (1,250.0) (963.6)
Free Cash Flow 5.6 2,310.0 236.9
Dividends paid to the owners of the parent company and non-controlling interest (20.0) (184.4)
Proceeds from borrowings, net of issuance costs 6.6 3,012.0 994.1
Repayments of borrowings 6.6 (2,625.7) (540.2)
Cash payments related to principal portion of leases 6.6 (1,834.8) (63.1)
Interest paid on net borrowings (546.1) (346.7)
Cash payments related to interest portion of leases (692.2) (47.5)
Refinancing of assets, net of issuance costs 6.6 769.7 54.0
Other cash flow from financing activities (67.5) 2.6
Net cash (used in) / provided by financing activities 6.7 (2,004.6) (131.2)
Effect of exchange rate changes on cash and cash equivalents and bank overdrafts (22.2) (16.8)
Net increase / (decrease) in cash and cash equivalents and bank overdrafts 283.1 88.9
Cash and cash equivalents and bank overdrafts at the beginning of the year 1,314.8 1,226.0
Cash and cash equivalents as per balance sheet 1,750.8 1,401.9
Cash reported in assets held-for-sale 4.1 -
Bank overdrafts (156.9) (87.1)
Cash and cash equivalents and bank overdrafts at the end of the year 6.4 1,598.0 1,314.8
Net increase / (decrease) in cash and cash equivalents and bank overdrafts 283.1 88.9
Supplementary information: non cash investing or financing activities:
- Assets acquired through financial debt or equivalents 5.2.1 1,756.9 54.0
Supplementary information: Interest paid on net borrowings
- Interests received 29.8 44.2
- Interests paid excluding interest on leases (575.9) (438.4)
For the year ended
December 31,
Consolidated financial statements CMA CGM / 9 Year ended December 31, 2019
Notes to the Consolidated Financial Statements
Note 1 - Corporate information The Consolidated Financial Statements (“CFS”) of CMA CGM S.A. (“CMA CGM”) and its subsidiaries (hereafter referred to together as “the Group” or “the Company”) for the year ended December 31, 2019 were approved by the Board of Directors on March 6, 2020, subject to the approval by the shareholders during the next Annual General Meeting. The Group operates primarily in the international containerized transportation of goods and in logistics business, through the end-to-end Freight Management and Contract Logistics solutions operated by CEVA. Other activities mainly include container terminal operations. CMA CGM S.A. is a limited liability company (“Société Anonyme”) incorporated and located in France. The address of its registered office is Boulevard Jacques Saadé, 4 Quai d’Arenc, 13235 Marseille Cedex 2, France.
Note 2 - General accounting principles Starting from Note 4, the accounting principles have been highlighted in blue.
2.1 Basis of preparation The consolidated financial statements of CMA CGM have been prepared under the historical cost basis, with the exception of financial assets measured at fair value, securities, derivative financial instruments and net assets acquired through business combinations which have all been measured at fair value. The principal accounting policies applied in the preparation of these consolidated financial statements are set out below. These policies have been consistently applied to all periods.
2.1.1 Statement of compliance The CFS of CMA CGM have been prepared in accordance with IFRS as adopted by the European Union (“EU”). IFRSs can be found at: https://eur-lex.europa.eu/legal-content/FR/TXT/?uri=LEGISSUM%3Al26040 IFRSs include the standards approved by the IASB, that is, IAS and accounting interpretations issued by the IFRS IC or the former IFRIC (until 2010) and SIC (until 2002).
2.1.2 Basis of consolidation The CFS comprise:
▪ The financial statements of CMA CGM;
▪ The financial statements of its subsidiaries, including CEVA Group (see Note 3.1); and
▪ The share in the net result and the net assets of associates and joint ventures. The CFS are presented in U.S. Dollar (“USD”), which is also the currency of the primary economic environment in which CMA CGM operates (the “functional currency”). The functional currency of the shipping activities is U.S. Dollar, except for certain regional carriers. This means that, among other things, the carrying amounts of property, plant and equipment and intangible assets and, hence, depreciation and amortization are maintained in USD from the date of acquisition. For other activities, the functional currency is generally the local currency of the country in which such activities are operated. All values are rounded to the nearest million (USD 000,000) with a decimal unless otherwise indicated.
CMA CGM / 10 Consolidated financial statements Year ended December 31, 2019
2.2 Change in accounting policies and new accounting policies The accounting policies adopted in the preparation of these CFS have been applied consistently with those described in the annual financial statements for the year ended December 31, 2018, except as outlined in the paragraphs below.
2.2.1 Adoption of new and amended IFRS and IFRS IC interpretations from January 1, 2019 IFRS 16: Leases: adopted by the European Union on November 9, 2017; effective date January 1, 2019 with earlier application permitted Principles, transition method and options The Group has adopted IFRS 16 using the modified retrospective transition method, as permitted by the standard. Hence, comparative information have not been restated. The cumulative effect of IFRS 16 initial application is recognized as an adjustment to the opening values of retained earnings as at January 1, 2019. The application of IFRS 16 has a material impact on amounts reported in respect of the Group’s non-current assets and financial liabilities, given the magnitude of the Group’s operating lease arrangements. Under the former standard, expenses from operating lease contracts were recognized in the income statement on a straight-line basis under chartering expenses, logistic expenses, general and administrative and other operating expenses. Since IFRS 16 has come into effect as at January 1, 2019, the expenses from operating lease contracts consists in the recognition of a depreciation charge of the right-of-use assets on a straight-line basis and the recognition of an interest expense on lease liabilities. The Group primarily enters into leases with respect of vessels, containers, real estate and terminal concessions. Lease liabilities were measured at the present value of the remaining lease payments, discounted using the CMA CGM’s incremental borrowing rates, at transition date. In applying IFRS 16, the group used the following practical expedients permitted by the standard:
▪ Grandfathering the pre-existing lease definition retained under the previous IAS 17 standard; ▪ Reliance on previous assessments on whether leases are onerous; ▪ Application of short-term exemption for operating leases with a remaining lease term of less than 12
months as at January 1, 2019; Such exemption consisting in excluding leases with a lease term of less than one year has been applied to new contracts entered into after January 1, 2019;
▪ The use of hindsight in determining the lease term where the contract contains options to extend or terminate the lease.
At transition date, the right-of-use (“ROU”) assets were measured at the amount equal to the residual lease liability, adjusted by (i) the amount of any prepaid or accrued lease payments relating to that lease recognized in the balance sheet as at December 31, 2018, (ii) the initial direct costs, (iii) the provisions for dismantling costs and onerous contracts, (iv) the dry dock components, (v) the financial positions related to the measurement at fair value of operating lease contracts acquired through previous business combinations and (vi) deferred gains recognized as at December 31, 2018. Subsequently, ROU are measured at cost less cumulated depreciation, impairment and certain remeasurement of the lease liabilities due to modifications. When lease agreements include both lease and non-lease components, the Company separated both components based on their relative stand-alone price. This split was primarily applicable for vessel chartering contracts in order to exclude the running costs from the rental expense and thus determine a bareboat equivalent lease component. Recent IFRIC position related to lease term and useful life of leasehold improvements
Consolidated financial statements CMA CGM / 11 Year ended December 31, 2019
In assessing whether a lessee is reasonably certain to extend (or not to terminate) a lease, IFRS 16 requires an entity to consider all relevant facts and circumstances that create an economic incentive for the lessee. This includes significant leasehold improvements undertaken (or expected to be undertaken) over the term of the contract that are expected to have significant economic benefit for the lessee when an option to extend or terminate the lease becomes exercisable. In addition, as noted above, an entity considers the broader economics of the contract when determining the enforceable period of a lease. This includes, for example, the costs of abandoning or dismantling non-removable leasehold improvements. If an entity expects to use non-removable leasehold improvements beyond the date on which the contract can be terminated, the existence of those leasehold improvements indicates that the entity might incur a more than insignificant penalty if it terminates the lease. Consequently, applying IFRS 16, an entity considers whether the contract is enforceable for at least the period of expected utility of the leasehold improvements. As a consequence of this IFRIC position, the Group may have to reassess certain lease terms in 2020 but does not expect material impacts. Effects of first-time adoption of IFRS 16 As a consequence of the new classification of expenses mentioned above, the Group’s EBITDA margin and Core EBIT margin, excluding CEVA, improved by respectively USD 1,855.3 million and USD 326.3 million for the year ended December 31, 2019 (see Note 3.1.1). As at January 1, 2019, the measurement of IFRS 16 lease liabilities amounted to USD 6.9 billion, excluding pre-existing finance leases:
▪ The lease liability of equivalent bareboat commitments under vessel operating leases amounts to USD 4.1 billion;
▪ The lease liability corresponding to commitments under container operating leases amounts to USD 2.4 billion;
▪ The lease liability corresponding to commitments under terminal concession operating leases amounts to USD 0.2 billion; and
▪ The lease liability corresponding to commitments under real estate and other operating leases amounts to USD 0.2 billion.
There has been no material impact regarding pre-existing finance leases, for which the carrying amount of assets and liabilities reported as at December 31, 2018 have been maintained under IFRS 16 at transition date in accordance with the new standard. As mentioned above, a provision for dismantling costs has been recognized in the containers right-of-use assets, accounted and measured in accordance with IAS 37, in order to reflect obligations liable to the lessee in certain container lease contracts to restore the leased assets before redelivering it to the lessor.

CMA CGM / 12 Consolidated financial statements Year ended December 31, 2019
The application of IFRS16 had the following impact on the Group’s statement of financial position at transition date:
As at December 31,
2018IFRS 16 application As at January 1, 2019
INTANGIBLE ASSETS 2,430.2 2,430.2
Vessels 8,822.2 4,171.1 12,993.3
Containers 485.6 2,437.7 2,923.3
Lands and buildings 448.0 152.2 600.2
Other properties and equipments 485.4 219.7 705.1
PROPERTY AND EQUIPMENT 10,241.3 6,980.7 17,221.9
Investments in associates and joint ventures 1,478.9 (13.9) 1,465.1
NON-CURRENT ASSETS 14,667.7 6,966.8 21,634.5
Trade and other receivables 2,494.7 - 2,494.7
Contract assets 515.9 - 515.9
Prepaid expenses 499.6 (189.8) 309.8
CURRENT ASSETS 5,654.7 (189.8) 5,464.9
TOTAL ASSETS 20,322.4 6,777.0 27,099.4
Reserves and retained earnings 5,179.2 14.6 5,193.8
EQUITY ATTRIBUTABLE TO OWNERS OF THE PARENT COMPANY 5,447.8 14.6 5,462.4
TOTAL EQUITY 5,525.0 14.6 5,539.6
Borrowings and lease liabilities 8,159.9 5,768.0 13,927.9
Provisions 332.7 34.7 367.4
Other non-current liabilities 92.9 (63.6) 29.3
NON-CURRENT LIABILITIES 8,952.4 5,739.1 14,691.5
Borrowings and lease liabilities 1,020.6 1,144.6 2,165.3
Provisions 72.0 (11.9) 60.2
Trade and other payables 4,565.8 (37.1) 4,528.7
Deferred income 85.6 (72.3) 13.3
CURRENT LIABILITIES 5,845.0 1,023.4 6,868.4
TOTAL LIABILITIES & EQUITY 20,322.4 6,777.0 27,099.5 Regarding the impact of IFRS 16 on CEVA, information is not included in the table above as the acquisition date is subsequent to IFRS 16 application date. However, CEVA applied IFRS 16 using similar principles than CMA CGM in all material aspects and recognized lease liabilities and right-of-use for an amount of USD 1.3 billion. Had CEVA been consolidated as at January 1, 2019, the impact of IFRS 16 in terms of lease liabilities would have been USD 8.2 billion. IFRS 16 impacts on the statement of Profit and loss, statement of Financial Position and statement of Cash Flows, including impacts on CEVA, are disclosed in Note 3.1.1. The reconciliation between the opening balance of lease liabilities as at January 1, 2019 and the commitments under operating leases reported in Note 8.2.1 of 2018 CFS can be presented as follows:
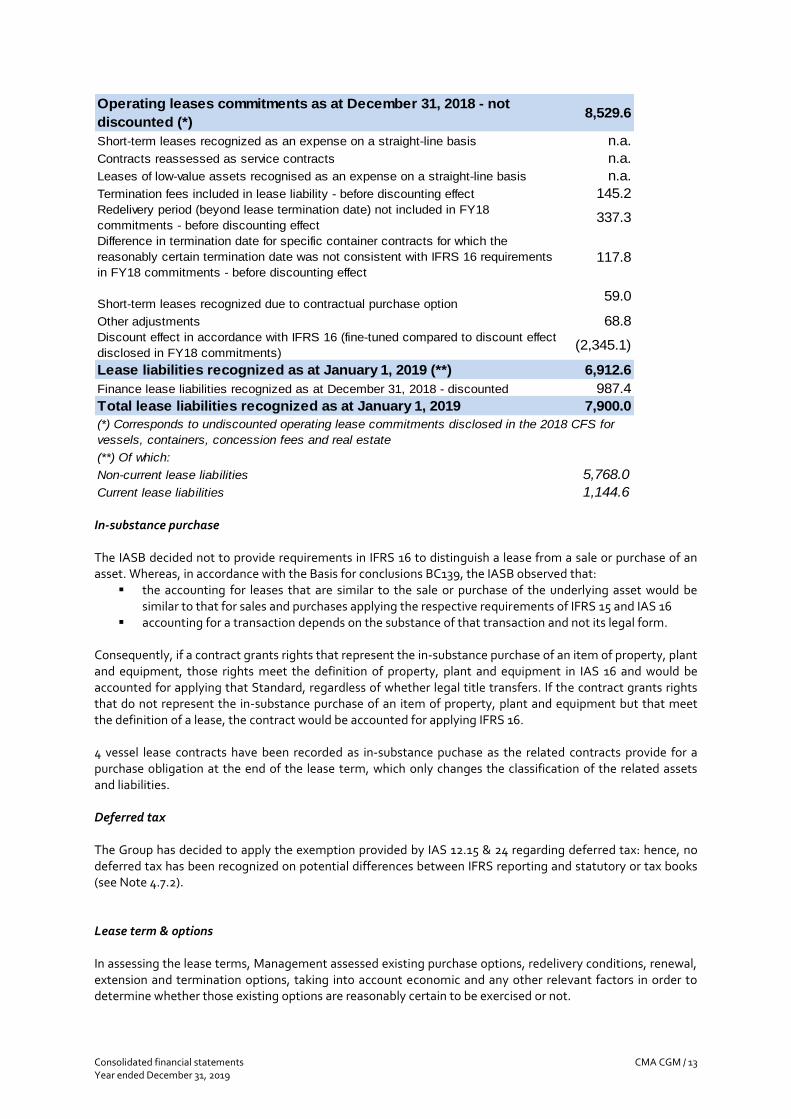
Consolidated financial statements CMA CGM / 13 Year ended December 31, 2019
Operating leases commitments as at December 31, 2018 - not
discounted (*)8,529.6
Short-term leases recognized as an expense on a straight-line basis n.a.
Contracts reassessed as service contracts n.a.
Leases of low-value assets recognised as an expense on a straight-line basis n.a.
Termination fees included in lease liability - before discounting effect 145.2 Redelivery period (beyond lease termination date) not included in FY18
commitments - before discounting effect337.3
Difference in termination date for specific container contracts for which the
reasonably certain termination date was not consistent with IFRS 16 requirements
in FY18 commitments - before discounting effect
117.8
Short-term leases recognized due to contractual purchase option 59.0
Other adjustments 68.8 Discount effect in accordance with IFRS 16 (fine-tuned compared to discount effect
disclosed in FY18 commitments)(2,345.1)
Lease liabilities recognized as at January 1, 2019 (**) 6,912.6
Finance lease liabilities recognized as at December 31, 2018 - discounted 987.4
Total lease liabilities recognized as at January 1, 2019 7,900.0
(**) Of which:
Non-current lease liabilities 5,768.0
Current lease liabilities 1,144.6
(*) Corresponds to undiscounted operating lease commitments disclosed in the 2018 CFS for
vessels, containers, concession fees and real estate
In-substance purchase The IASB decided not to provide requirements in IFRS 16 to distinguish a lease from a sale or purchase of an asset. Whereas, in accordance with the Basis for conclusions BC139, the IASB observed that:
▪ the accounting for leases that are similar to the sale or purchase of the underlying asset would be similar to that for sales and purchases applying the respective requirements of IFRS 15 and IAS 16
▪ accounting for a transaction depends on the substance of that transaction and not its legal form. Consequently, if a contract grants rights that represent the in-substance purchase of an item of property, plant and equipment, those rights meet the definition of property, plant and equipment in IAS 16 and would be accounted for applying that Standard, regardless of whether legal title transfers. If the contract grants rights that do not represent the in-substance purchase of an item of property, plant and equipment but that meet the definition of a lease, the contract would be accounted for applying IFRS 16. 4 vessel lease contracts have been recorded as in-substance puchase as the related contracts provide for a purchase obligation at the end of the lease term, which only changes the classification of the related assets and liabilities. Deferred tax The Group has decided to apply the exemption provided by IAS 12.15 & 24 regarding deferred tax: hence, no deferred tax has been recognized on potential differences between IFRS reporting and statutory or tax books (see Note 4.7.2). Lease term & options In assessing the lease terms, Management assessed existing purchase options, redelivery conditions, renewal, extension and termination options, taking into account economic and any other relevant factors in order to determine whether those existing options are reasonably certain to be exercised or not.

CMA CGM / 14 Consolidated financial statements Year ended December 31, 2019
This assessment is made on a quarterly basis in order to assess any changes in Management’s intention. These changes can modify the lease term or the option status and lead to a change in the value of lease liabilities, among others. The lease term also takes into account the redelivery period for vessels and the build-down period for containers that are part of the enforceable period of the leases, based on historical statistics and contractual provisions. These elements will be reassessed on a yearly basis. Discount rate The Group uses the incremental borrowing rates method to determine the discount rates for all the leases. These rates are determined according to several criteria including mainly the asset category, the duration (for the avoidance of doubt, different from lease term), the age of the assets, the lease currency etc… The weighted average discount rate used at transition was 8.9%. The discount rates are updated quarterly. Impairment Impairment testing of right-of-use assets follows the same principles than other property and equipment (see Note 5.3). IFRIC 23: Uncertainty over Income Tax Treatments IFRIC 23 clarifies the principles of uncertain tax treatments included in the scope of IAS 12 “Income taxes”. In essence, it assumes that tax authorities will examine all uncertain tax treatments and will have full knowledge of all related information when doing so. Hence, a tax liability should be recognized when it is probable that the tax authority will refuse the tax treatment. In applying IFRIC23, Management extensively reviewed its tax risks included in the scope of the interpretation and concluded that no additional liability would have to be recognized. CEVA also applied such interpretation and requalified tax risks under the interpretation for an amount of USD 24.9 million as at January 1, 2019, reduced at USD 18.5 million as at December 31, 2019. Amended Standards with non-significant impact The following amended Standards did not have any significant impact on the Group’s CFS and performance: Prepayment Features with Negative Compensation (Amendments to IFRS 9) This amendment modifies the existing requirements in IFRS 9 regarding termination rights in order to allow measurement at amortised cost (or, depending on the business model, at fair value through other comprehensive income) even in the case of negative compensation payments. Amendments to IAS 28: Long-term interests in associates and joint-ventures This amendment clarifies that an entity applies IFRS 9 Financial Instruments to long-term interests in an associate or joint venture that form part of the net investment in the associate or joint venture but to which the equity method is not applied. Annual Improvements to IFRS Standards 2015-2017 Cycle Amendments to IAS 19: Plan Amendment, Curtailment or Settlement If a plan amendment, curtailment or settlement occurs, it is now mandatory that the current service cost and the net interest for the period after the remeasurement are determined using the assumptions used for the

Consolidated financial statements CMA CGM / 15 Year ended December 31, 2019
remeasurement. In addition, amendments have been included to clarify the effect of a plan amendment, curtailment or settlement on the requirements regarding the asset ceiling.
2.2.2 New IFRS and IFRS IC interpretations effective for the financial year beginning after January 1, 2019, endorsed by the European Union and not early adopted
Amendments to IAS 1 and IAS 8: Definition of Material These amendments to IAS 1 and IAS 8 clarify the definition of “material” and align the definition used in the Conceptual Framework and the standards themselves. Amendments endorsed but without earlier application permitted: The following amendments have been recently endorsed by the European Union with an effective date on January 1, 2020, and without earlier application permitted and are not expected to have a material impact on the Group’s CFS: Amendments to References to the Conceptual Framework in IFRS Standards
2.2.3 New IFRS and IFRS IC interpretations effective for the financial year beginning on or after January 1, 2019 and not yet endorsed by the European Union
▪ New IFRS and IFRS IC interpretations effective for the financial year beginning on January 1, 2019 and
not yet endorsed by the European Union IFRS 14: Regulatory Deferral Accounts The endorsement process of this interim standard has been suspended until the publication of the final IFRS standard.
▪ New IFRS and IFRS IC interpretations effective for the financial year beginning after January 1, 2019 and not yet endorsed by the European Union
The impacts of the following new or amended Standards are currently being assessed by the Company: IFRS 17: Insurance contracts Amendments to IFRS 3 Business Combinations Amendments to IFRS 9, IAS 39 and IFRS 7: Interest Rate Benchmark Reform
2.2.4 Change of presentation For a better measurement of operating profitability, Management decided to exclude operating exchange gains / (losses) from EBITDA and to classify them below EBITDA and within EBIT, and excluded from Core EBIT. Such operating exchange gain / (losses) have been restated in the comparative period for better comparison.
2.3 Significant accounting judgments, estimates and assumptions The preparation of the CFS requires the use of judgments, estimates and assumptions that affect the reported amount of revenues, expenses, assets, liabilities and the disclosure of contingent liabilities at the reporting date. Although these CFS reflect management's best estimates based on information available at the time of the preparation of these financial statements, the outcome of transactions and actual situations could differ from those estimates due to changes in assumptions or economic conditions.
CMA CGM / 16 Consolidated financial statements Year ended December 31, 2019
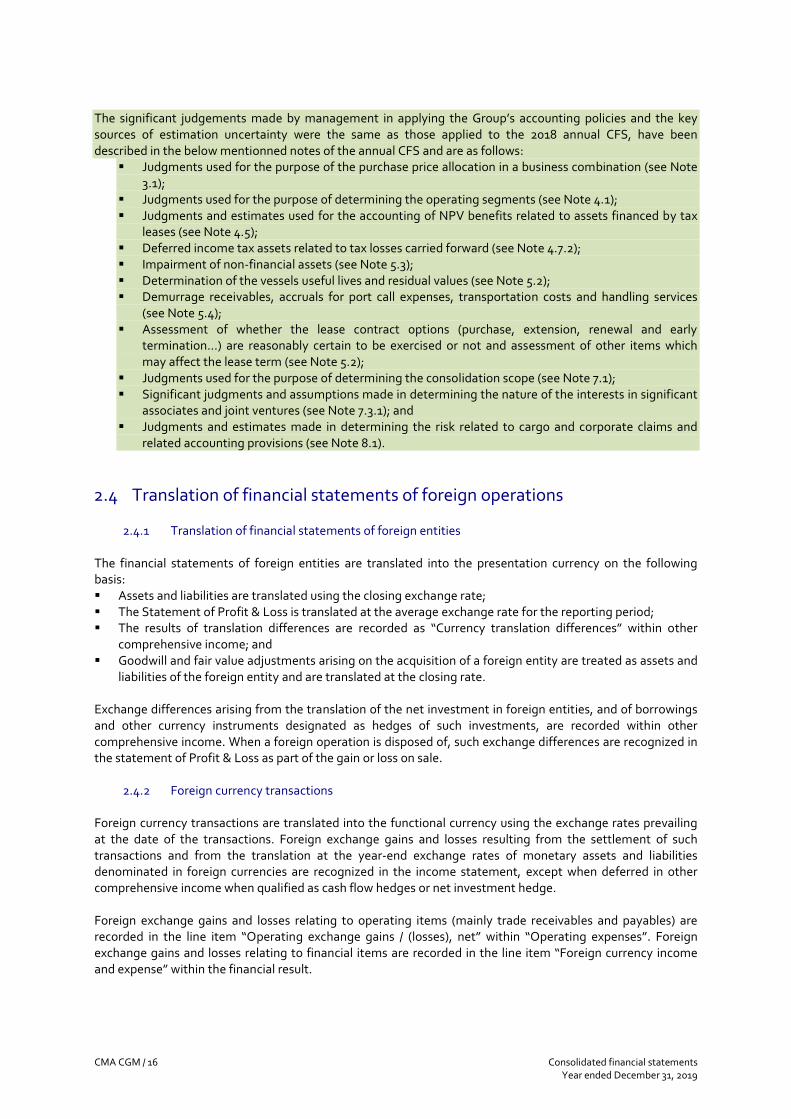
The significant judgements made by management in applying the Group’s accounting policies and the key sources of estimation uncertainty were the same as those applied to the 2018 annual CFS, have been described in the below mentionned notes of the annual CFS and are as follows:
▪ Judgments used for the purpose of the purchase price allocation in a business combination (see Note 3.1);
▪ Judgments used for the purpose of determining the operating segments (see Note 4.1); ▪ Judgments and estimates used for the accounting of NPV benefits related to assets financed by tax
leases (see Note 4.5); ▪ Deferred income tax assets related to tax losses carried forward (see Note 4.7.2); ▪ Impairment of non-financial assets (see Note 5.3); ▪ Determination of the vessels useful lives and residual values (see Note 5.2); ▪ Demurrage receivables, accruals for port call expenses, transportation costs and handling services
(see Note 5.4); ▪ Assessment of whether the lease contract options (purchase, extension, renewal and early
termination…) are reasonably certain to be exercised or not and assessment of other items which may affect the lease term (see Note 5.2);
▪ Judgments used for the purpose of determining the consolidation scope (see Note 7.1); ▪ Significant judgments and assumptions made in determining the nature of the interests in significant
associates and joint ventures (see Note 7.3.1); and ▪ Judgments and estimates made in determining the risk related to cargo and corporate claims and
related accounting provisions (see Note 8.1).
2.4 Translation of financial statements of foreign operations
2.4.1 Translation of financial statements of foreign entities The financial statements of foreign entities are translated into the presentation currency on the following basis: ▪ Assets and liabilities are translated using the closing exchange rate; ▪ The Statement of Profit & Loss is translated at the average exchange rate for the reporting period; ▪ The results of translation differences are recorded as “Currency translation differences” within other
comprehensive income; and ▪ Goodwill and fair value adjustments arising on the acquisition of a foreign entity are treated as assets and
liabilities of the foreign entity and are translated at the closing rate. Exchange differences arising from the translation of the net investment in foreign entities, and of borrowings and other currency instruments designated as hedges of such investments, are recorded within other comprehensive income. When a foreign operation is disposed of, such exchange differences are recognized in the statement of Profit & Loss as part of the gain or loss on sale.
2.4.2 Foreign currency transactions Foreign currency transactions are translated into the functional currency using the exchange rates prevailing at the date of the transactions. Foreign exchange gains and losses resulting from the settlement of such transactions and from the translation at the year-end exchange rates of monetary assets and liabilities denominated in foreign currencies are recognized in the income statement, except when deferred in other comprehensive income when qualified as cash flow hedges or net investment hedge. Foreign exchange gains and losses relating to operating items (mainly trade receivables and payables) are recorded in the line item “Operating exchange gains / (losses), net” within “Operating expenses”. Foreign exchange gains and losses relating to financial items are recorded in the line item “Foreign currency income and expense” within the financial result.

Consolidated financial statements CMA CGM / 17 Year ended December 31, 2019
Exchange rates used for the translation of significant foreign currency transactions against one USD are as follows:
2019 2018 2019 2018
Euro 0.89015 0.87336 0.89309 0.84721
British pound sterling 0.75734 0.78122 0.78350 0.74958
Australian Dollar 1.42380 1.41659 1.43800 1.33857
Chinese Yuan 6.96146 6.87782 6.90930 6.61692
Singapore Dollar 1.34511 1.36166 1.36427 1.34922
Average rateClosing rate
Note 3 - Business combinations and significant events
3.1 Business combinations Significant judgments and estimates In accordance with IFRS 3, all acquired assets, liabilities and contingent liabilities assumed have been measured at fair value according to IFRS 13 principles. The valuation methods used to determine the fair values of the main assets and liabilities are as follows: ▪ Market comparison method: This valuation method considers the prices observable on the principal
market of similar assets if these are available. This method was mainly used for the valuation of the acquired vessels and other property and equipment, as well as for the measurement of advantageous and disadvantageous contracts;
▪ Discounted cash flow method: This valuation method considers future cash flows and appropriate
discounting valuation to measure the present value of assets and liabilities for which there is no market data. Such valuation is based on observable data to the extent possible.
▪ Income approach: this valuation consists in both (i) the relief from royalty method applied to the
valuation of brands and (ii) the excess earnings method applied to the valuation of customer contracts and terminal concession rights.
3.1.1 Acquisition of CEVA Logistics
Description of the transaction On May 3, 2018, the Group invested in CEVA Logistics (“CEVA”), a global leading player in the logistics sector, at the time of CEVA’s initial public offering (IPO). This investment initially took the form of convertible bonds, subsequently converted into CEVA common shares on August 13, 2018, upon obtaining all the requisite regulatory approvals. CMA CGM’s investment then represented 24.99% of CEVA’s capital. At an IPO price of CHF 27.5 per share, CMA CGM’s investment amounted to CHF 379 million (or USD 381 million). On October 17, 2018, the Group acquired additional shares increasing its stake by 7.95%, for a total of 32.94%. These investments gave CMA CGM two seats on CEVA’s Board of Directors, thus granting the Group a significant influence. Hence, the investment has been recognized as an associate until December 31, 2018. The Group also secured 17.6% ownership through derivative instruments, the last one being entered into on January 4, 2019 representing 5% of CEVA shares, thus reaching 50.6% of economic exposure as of January 4, 2019, which has been defined as the acquisition date in accordance with IFRS 3. The Group announced on October 25, 2018, its intention to make a tender offer to the shareholders of CEVA Logistics AG at CHF 30 per share. Such tender offer has been opened on January 28, 2019 and closed on April
CMA CGM / 18 Consolidated financial statements Year ended December 31, 2019
2, 2019, which resulted in a total participation corresponding to 96.65% of CEVA shares and voting rights at the end of the offer. The Group then continued to purchase some CEVA shares over the market, thus reaching a 99.60% ownership as at September 30, 2019. The settlement of derivatives as well as tender offer occurred in April, for a total consideration of USD 1,188.1 million, partly financed through the drawdown of a USD 725 million acquisition facility maturing in 1.5 years with early repayment incentive options. With the purpose of acquiring 100% of the issued CEVA shares, CMA CGM S.A. has submitted an application for the cancellation of the remaining CEVA shares in accordance with Art. 137 of the Financial Market Infrastructure Act (FMIA) with the Supreme Courts of the Canton of Zug on 7 May 2019. By decision dated 12 September, the High Court Canton of Zug cancelled all publically held registered shares of CEVA Logistics AG with a par value of CHF 0.10 each. The delisting process of CEVA Logistics AG was finalized mid-October with the payment of the residual shares held by minorities. The total consideration paid in 2018 and 2019 to acquire 100 % of CEVA shares amounted to USD 1.7 billion. The USD 725 million acquisition facility has been partially refinanced through certain operations disclosed in Note 6.6 and amounts to USD 192.8 million as at December 31, 2019 (see Note 8.4 for subsequent evolution). Besides, the disposal of most of CMA CGM logistics activities to CEVA was closed on May 2, 2019, for a total consideration of USD 105 million, for which CMA CGM granted a one year vendor loan to CEVA. Such operation did not have any material impact to these CFS as it occurred within the new Group.
Consolidated financial statements CMA CGM / 19 Year ended December 31, 2019
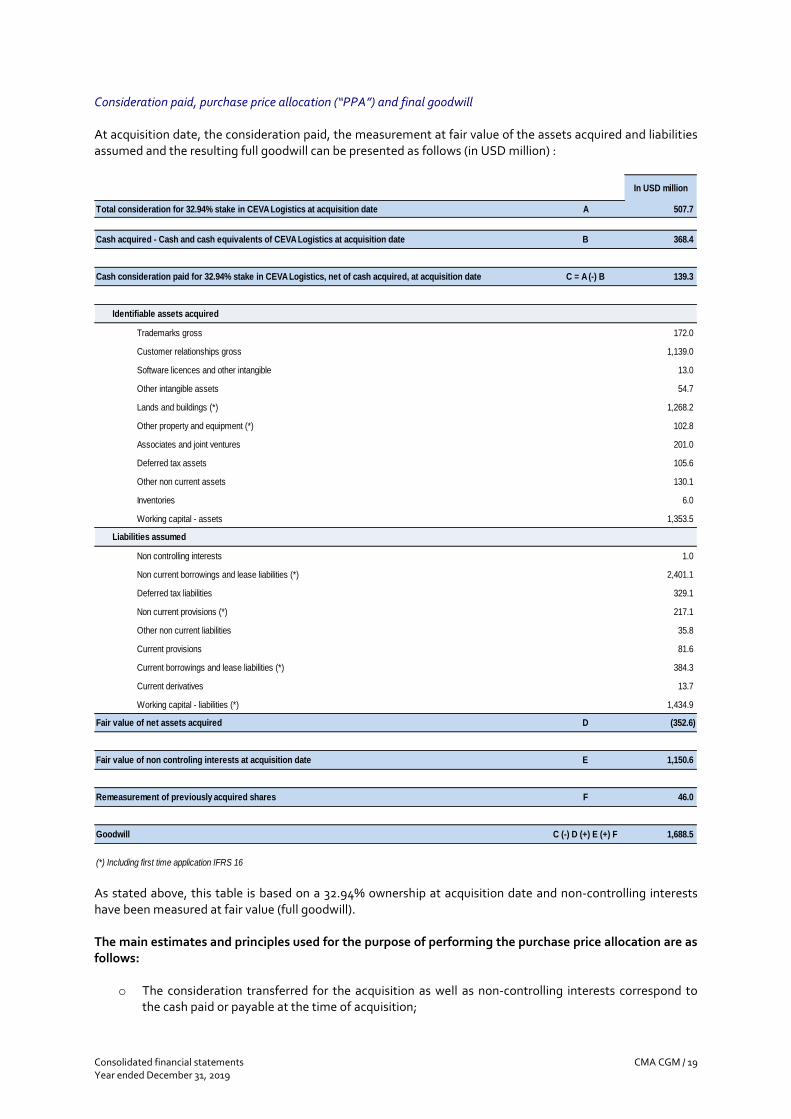
Consideration paid, purchase price allocation (“PPA”) and final goodwill At acquisition date, the consideration paid, the measurement at fair value of the assets acquired and liabilities assumed and the resulting full goodwill can be presented as follows (in USD million) :
In USD million
Total consideration for 32.94% stake in CEVA Logistics at acquisition date A 507.7
Cash acquired - Cash and cash equivalents of CEVA Logistics at acquisition date B 368.4
Cash consideration paid for 32.94% stake in CEVA Logistics, net of cash acquired, at acquisition date C = A (-) B 139.3
Identifiable assets acquired
Trademarks gross 172.0
Customer relationships gross 1,139.0
Software licences and other intangible 13.0
Other intangible assets 54.7
Lands and buildings (*) 1,268.2
Other property and equipment (*) 102.8
Associates and joint ventures 201.0
Deferred tax assets 105.6
Other non current assets 130.1
Inventories 6.0
Working capital - assets 1,353.5
Liabilities assumed
Non controlling interests 1.0
Non current borrowings and lease liabilities (*) 2,401.1
Deferred tax liabilities 329.1
Non current provisions (*) 217.1
Other non current liabilities 35.8
Current provisions 81.6
Current borrowings and lease liabilities (*) 384.3
Current derivatives 13.7
Working capital - liabilities (*) 1,434.9
Fair value of net assets acquired D (352.6)
Fair value of non controling interests at acquisition date E 1,150.6
Remeasurement of previously acquired shares F 46.0
Goodwill C (-) D (+) E (+) F 1,688.5
(*) Including first time application IFRS 16 As stated above, this table is based on a 32.94% ownership at acquisition date and non-controlling interests have been measured at fair value (full goodwill). The main estimates and principles used for the purpose of performing the purchase price allocation are as follows:
o The consideration transferred for the acquisition as well as non-controlling interests correspond to the cash paid or payable at the time of acquisition;

CMA CGM / 20 Consolidated financial statements Year ended December 31, 2019
o As the intention of CMA CGM SA was to obtain the full control of CEVA, management decided to
apply the full goodwill option in accordance with IFRS 3. The shares acquired after the acquisition date are treated as transactions with non-controlling interests.
o Excluding debt issuance costs, acquisition-related costs were incurred in the course of the
transaction; these were recognised as “other income and expenses” (see Note 4.4), out of EBITDA and Core EBIT.
o Prior to the acquisition date, the Company had invested in CEVA, such investment being treated as an investment in associate till acquisition date, including the Group’s share in CEVA’s 2018 losses. Such investment has been revalued at fair value at acquisition date, resulting in a revaluation gain amounting to USD 96.6 million reported as a share of income in associates into the consolidated statement of Profit & Loss.
In accordance with IFRS 3, all acquired assets, liabilities and contingent liabilities assumed have been measured at fair value. The valuation methods used to determine the fair values of the main assets and liabilities mainly consisted in incremental cash flow method and discounted cash flow method in order to assess the CEVA trademark and customer relationships. The purchase price allocation has resulted in the recognition of a final goodwill of USD 1,688.5 million, mainly explained by the value of future customer relationships, additional synergies and assembled workforce.
Consolidated financial statements CMA CGM / 21 Year ended December 31, 2019
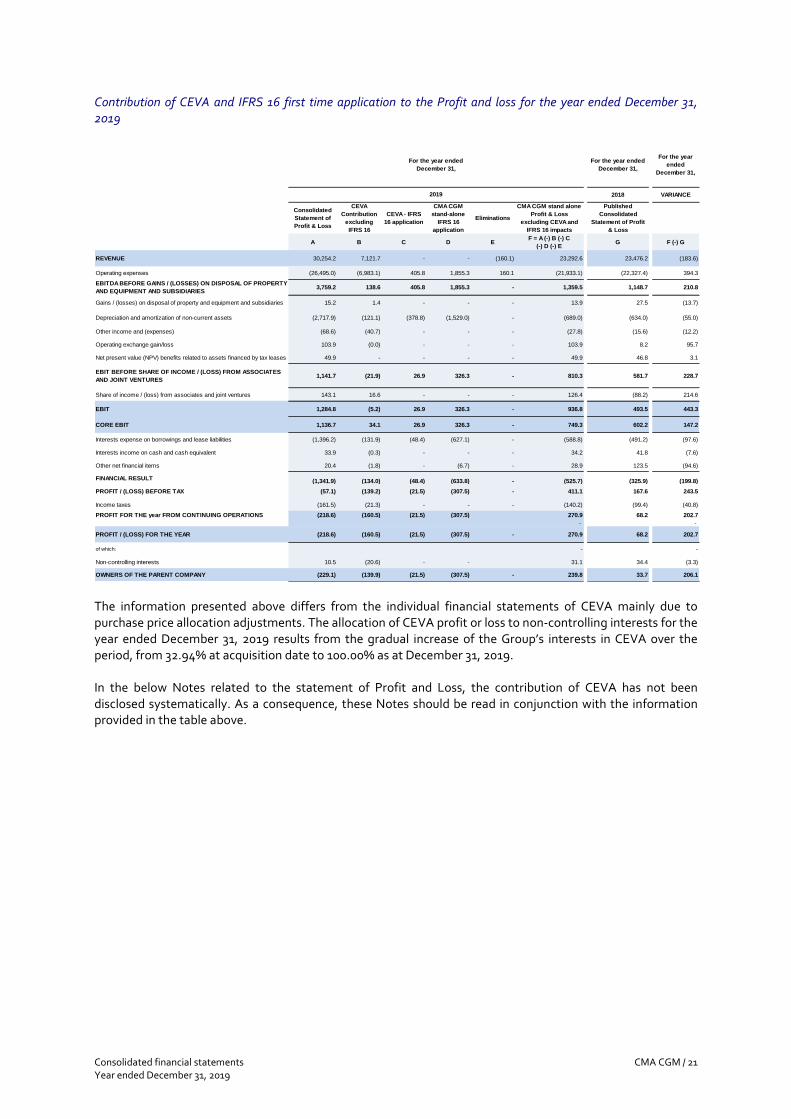
Contribution of CEVA and IFRS 16 first time application to the Profit and loss for the year ended December 31, 2019
For the year ended
December 31,
For the year
ended
December 31,
2018 VARIANCE
Consolidated
Statement of
Profit & Loss
CEVA
Contribution
excluding
IFRS 16
CEVA - IFRS
16 application
CMA CGM
stand-alone
IFRS 16
application
Eliminations
CMA CGM stand alone
Profit & Loss
excluding CEVA and
IFRS 16 impacts
Published
Consolidated
Statement of Profit
& Loss
A B C D EF = A (-) B (-) C
(-) D (-) EG F (-) G
REVENUE 30,254.2 7,121.7 - - (160.1) 23,292.6 23,476.2 (183.6)
Operating expenses (26,495.0) (6,983.1) 405.8 1,855.3 160.1 (21,933.1) (22,327.4) 394.3
EBITDA BEFORE GAINS / (LOSSES) ON DISPOSAL OF PROPERTY
AND EQUIPMENT AND SUBSIDIARIES3,759.2 138.6 405.8 1,855.3 - 1,359.5 1,148.7 210.8
Gains / (losses) on disposal of property and equipment and subsidiaries 15.2 1.4 - - - 13.9 27.5 (13.7)
Depreciation and amortization of non-current assets (2,717.9) (121.1) (378.8) (1,529.0) - (689.0) (634.0) (55.0)
Other income and (expenses) (68.6) (40.7) - - - (27.8) (15.6) (12.2)
Operating exchange gain/loss 103.9 (0.0) - - - 103.9 8.2 95.7
Net present value (NPV) benefits related to assets financed by tax leases 49.9 - - - - 49.9 46.8 3.1
EBIT BEFORE SHARE OF INCOME / (LOSS) FROM ASSOCIATES
AND JOINT VENTURES1,141.7 (21.9) 26.9 326.3 - 810.3 581.7 228.7
Share of income / (loss) from associates and joint ventures 143.1 16.6 - - - 126.4 (88.2) 214.6
EBIT 1,284.8 (5.2) 26.9 326.3 - 936.8 493.5 443.3
CORE EBIT 1,136.7 34.1 26.9 326.3 - 749.3 602.2 147.2
Interests expense on borrowings and lease liabilities (1,396.2) (131.9) (48.4) (627.1) - (588.8) (491.2) (97.6)
Interests income on cash and cash equivalent 33.9 (0.3) - - - 34.2 41.8 (7.6)
Other net financial items 20.4 (1.8) - (6.7) - 28.9 123.5 (94.6)
FINANCIAL RESULT (1,341.9) (134.0) (48.4) (633.8) - (525.7) (325.9) (199.8)
PROFIT / (LOSS) BEFORE TAX (57.1) (139.2) (21.5) (307.5) - 411.1 167.6 243.5
Income taxes (161.5) (21.3) - - - (140.2) (99.4) (40.8)
PROFIT FOR THE year FROM CONTINUING OPERATIONS (218.6) (160.5) (21.5) (307.5) 270.9 68.2 202.7
- -
PROFIT / (LOSS) FOR THE YEAR (218.6) (160.5) (21.5) (307.5) - 270.9 68.2 202.7
of which: - -
Non-controlling interests 10.5 (20.6) - - 31.1 34.4 (3.3)
OWNERS OF THE PARENT COMPANY (229.1) (139.9) (21.5) (307.5) - 239.8 33.7 206.1
2019
For the year ended
December 31,
The information presented above differs from the individual financial statements of CEVA mainly due to purchase price allocation adjustments. The allocation of CEVA profit or loss to non-controlling interests for the year ended December 31, 2019 results from the gradual increase of the Group’s interests in CEVA over the period, from 32.94% at acquisition date to 100.00% as at December 31, 2019. In the below Notes related to the statement of Profit and Loss, the contribution of CEVA has not been disclosed systematically. As a consequence, these Notes should be read in conjunction with the information provided in the table above.

CMA CGM / 22 Consolidated financial statements Year ended December 31, 2019
Contribution of CEVA to the Statement of Financial Position as at December 31, 2019
As at December 31, 2019 GROUP as PublishedCEVA Contribution to
CMA CGM CFS (*)
GROUP
without CEVA
Goodwill 2,851.8 1,696.4 1,155.5
Other intangible assets 2,565.9 1,347.0 1,218.9
INTANGIBLE ASSETS 5,417.8 3,043.4 2,374.4
Vessels 12,805.6 - 12,805.6
Containers 2,751.9 - 2,751.9
Lands and buildings 1,824.1 1,266.5 557.6
Other properties and equipments 384.2 106.3 277.8
PROPERTY AND EQUIPMENT 17,765.8 1,372.8 16,393.0
Other non-current 554.9 207.0 347.9
Investments in associates and joint ventures 805.9 (248.8) 1,054.7
NON-CURRENT ASSETS 24,544.3 4,374.4 20,170.0
Trade and other receivables 3,479.7 1,255.6 2,224.1
Other current assets 2,956.0 179.3 2,776.7
Cash and cash equivalents 1,750.8 14.6 1,736.2
CURRENT ASSETS 8,186.5 1,449.5 6,737.0
TOTAL ASSETS 32,730.9 5,823.9 26,907.0
TOTAL EQUITY 5,133.6 (111.6) 5,245.2
Borrowings and lease liabilities 15,458.6 2,388.1 13,070.5
Other non-current liabilities 1,141.1 528.3 612.9
NON-CURRENT LIABILITIES 16,599.7 2,916.4 13,683.3
Borrowings and lease liabilities 4,055.5 1,257.3 2,798.1
Trade and other payables 6,037.1 1,597.8 4,439.3
Other current liabilities 905.1 163.9 741.1
CURRENT LIABILITIES 10,997.6 3,019.1 7,978.5
TOTAL LIABILITIES & EQUITY 32,730.9 5,823.9 26,907.0
(*) including the effect of CEVA acquisition on cash (urpuchase of shares), borrowings (acquisition bridge) and investment in
associates (derecognition of 33% investment in CEVA at change of control)
The CEVA contribution presented above includes the effect of CMA CGM LOGISTICS integration into CEVA, including a goodwill recognized historically for an amount of USD 7.9 million.

Consolidated financial statements CMA CGM / 23 Year ended December 31, 2019
Contribution of CEVA and IFRS 16 effect to the Statement of Cash Flows
Group as
reported
of which
CEVA
Contribution
of which
IFRS16 CEVA
contribution
CMA CGM stand
alone (excluding
CEVA)
IFRS 16
CMA CGM
contribution
CMA CGM stand
alone excluding
CEVA and IFRS16
contribution
2019 2019 2019 2019
Profit / (Loss) for the year (218.6) (182.0) (21.5) (36.6) (307.5) 270.9
Reconcilation of profit / (loss) for the year to cash generated from operations :
- Depreciation and amortization 2,717.9 499.9 378.8 2,218.0 1,529.0 689.0
- Net present value (NPV) benefits related to assets financed by tax leases (49.9) - (49.9) (49.9)
- Other income and expense 68.6 0.0 68.6 68.6
- Increase / (Decrease) in provisions (96.5) (21.5) (75.0) (75.0)
- Loss / (Gains) on disposals of property and equipment and subsidiaries (15.2) (1.5) (13.8) (13.8)
- Share of (Income) / Loss from associates and joint ventures (143.1) (16.6) (126.4) (126.4)
- Interest expenses on net borrowings and lease liabilities 1,348.9 184.5 48.4 1,164.4 633.8 530.7
- Income tax 161.5 21.3 140.2 140.2
- Other non cash items 0.5 24.7 - (24.2) - (24.2)
Changes in working capital (15.3) 130.8 (146.1) (146.1)
Cash flow from operating activities before tax 3,758.8 639.6 405.8 3,119.2 1,855.3 1,263.9
- Income tax paid (198.9) (38.4) (160.4) (160.4)
Cash flow from operating activities net of tax 3,559.9 601.1 405.8 2,958.8 1,855.3 1,103.5
Purchases of intangible assets (83.8) (29.5) (54.3) (54.3)
Business combinations, transaction with non controlling interests, net of cash
acquired / divested(853.0) 348.9 (1,201.9) (1,201.9)
New investments in associates and joint ventures - - - -
Purchases of property and equipment (522.9) (73.5) (449.4) (449.4)
Proceeds from disposal of property and equipment 138.6 4.1 134.5 134.5
Dividends received from associates and joint ventures 28.9 13.0 15.9 15.9
Cash flow resulting from other financial assets 24.3 - 24.3 24.3
Variation in securities 18.0 - 18.0 18.0
Net cash (used in) / provided by investing activities (1,250.0) 262.9 - (1,512.9) - (1,512.9)
Free Cash Flow 2,310.0 864.1 405.8 1,445.9 1,855.3 (409.4)
Dividends paid to the owners of the parent company and non-controlling interest (20.0) - (20.0) (20.0)
CEVA capital increase - 200.0 (200.0) (200.0)
Proceeds from borrowings, net of issuance costs 3,012.0 853.0 2,159.0 2,159.0
Intragroup proceeds from borrowings - 80.0 (80.0) (80.0)
Repayments of borrowings (2,625.7) (795.0) (1,830.7) (1,830.7)
Cash payments related to principal portion of leases (1,834.8) (360.4) (361.2) (1,474.4) (1,265.9) (208.5)
Interest paid on net borrowings (546.1) (119.7) (426.4) (426.4)
Cash payments related to interest portion of leases (692.2) (44.6) (44.6) (647.6) (589.4) (58.2)
Refinancing of assets, net of issuance costs 769.7 - 769.7 769.7
Other cash flow from financing activities (67.5) 0.1 (67.6) (67.6)
Net cash (used in) / provided by financing activities (2,004.6) (186.6) (405.8) (1,818.0) (1,855.3) 37.4
Effect of exchange rate changes on cash and cash equivalents and bank
overdrafts(22.2) (4.7) (17.5) (17.5)
Net increase / (decrease) in cash and cash equivalents and bank
overdrafts 283.1 672.7 (0.0) (389.6) 0.0 (389.6)
Cash and cash equivalents and bank overdrafts at the beginning of the year 1,314.8 - 1,314.8 1,314.8
Cash and cash equivalents as per balance sheet 1,750.8 683.7 1,067.1 1,067.1
Cash reported in assets held-for-sale 4.1 - 4.1 4.1
Bank overdrafts (156.9) (11.0) (145.9) (145.9)
Cash and cash equivalents and bank overdrafts at the end of the year 1,598.0 672.7 925.3 925.3
Net increase / (decrease) in cash and cash equivalents and bank
overdrafts 283.1 672.7 - (389.6) - (389.6)
Update on CEVA governance During CEVA’s Annual General Meeting (AGM) on April 29, 2019, among the key resolutions was the proposal to renew governance following the successful completion of the Public Tender Offer. Rodolphe Saadé, Chairman and Chief Executive Officer of CMA CGM, was then elected as Chairman of the CEVA Board of Directors, with Rolf Watter acting as Vice-Chairman.

CMA CGM / 24 Consolidated financial statements Year ended December 31, 2019
3.1.2 Strengthening of the Group’s financial structure Further to the acquisition of CEVA Logistics acquisition, the Group has engaged a program aiming at strengthening its financial structure and reinforcing its liquidity. This program includes divestments of certain assets as well as refinancing transactions. This program should raise more than USD 2 billion of liquidity, extending the Group’s debt maturities and reducing its net debt by more than USD 1.3 billion. Its main parts are as follows:
▪ USD 860 million proceeds from vessel sale and leaseback transactions. The proceeds are primarily used to pay down the bridge loan contracted to acquire CEVA Logistics, with the balance now standing at USD 192.8 million.
▪ USD 968 million proceeds from the sale of investments stakes held by CMA CGM in ten port terminals
to Terminal Link, a joint venture (owned 51% by CMA CGM and 49% by China Merchants Port or “CMP”) holding investments in 13 port terminals since 2013. Terminal Link will finance these acquisitions through an issue of USD 468 million in mandatory convertible bonds issued by Terminal Link to the benefit of CMP and a 8 years loan (at 6%) from CMP. Both instruments will be converted to equity in TL in 8 years time, through conversion of the bonds and capital increase subscribed by CMA CGM. The transaction, which is subject to antitrust and other regulatory approvals, is expected to be closed during H1 2020 and has led the Group to reclassify the related assets and liabilities as held-for sale in accordance with IFRS 5 (see Note 5.5 and 8.4).
▪ USD 93 million proceeds (of which USD 85 million at closing and USD 8 million of earn out) from the
sale of a 50% stake in a logistics hub in India, which is expected to be closed in the first quarter of 2020. Such investment in joint venture has been reclassified as held-for-sale as at December 31, 2019 (see Note 5.5).
▪ Lastly, an additional USD 100 million proceeds resulting from the increase of CEVA Logistics’
receivables securitisation program. The Company has already signed the renewal of its USD 450 million securitisation program in Europe, the United States and Australia, for a 3-year period.
3.2 Group fleet development
3.2.1 Shipbuilding and financing of the 9 container ships of TEU 23,000 The CMA CGM Group, a leading worldwide shipping and logistics group, announced in September 2019 the launching of the world's largest containership (23,000 TEU) powered by liquefied natural gas (LNG), named CMA CGM JACQUES SAADE. Such vessel will be delivered in 2020. The Group finalized an agreement with its core banks to finance the USD 1.4 billion orderbook related to the 9 TEU 23,000 containerships for an amount up to 75% of the orderbook.
3.2.2 Other development On March 25, 2019, Rodolphe Saadé, Chairman and CEO of the CMA CGM Group, signed two strategic agreements with the China State Shipbuilding Corporation (CSSC), in the presence of French President Emmanuel Macron and Chinese President Xi Jinping, by which the Group ordered ten TEU 15,000 vessels expected to be delivered from 2021. CMA CGM chose to power half of these newbuilds with LNG, which allows for a significant reduction in CO2, sulphur, fine particles and nitrogen oxides emissions. The remaining five vessels will be fitted with hybrid scrubbers, allowing for the elimination of sulphur and fine particles emissions. The new vessels are expected to support CMA CGM’s growth and modernize the company’s fleet.

Consolidated financial statements CMA CGM / 25 Year ended December 31, 2019
The financing of this orderbook has been closed and will allow the financing of 98% of these vessels under 15-year leases. Refer to the information disclosed in Note 5.2, notably for the deliveries occurred during the period.
3.3 Global Shipping Environment Low sulphur regulation The new International Maritime Organization (IMO) Low Sulphur Regulation is effective from January 1, 2020 and require all shipping companies to reduce their Sulphur emissions by 85%. This new regulation aims to reduce the environmental impact of the industry and significantly improve air quality, an initiative in which the CMA CGM Group has been involved for more than 15 years. In this context, CMA CGM has decided to favor the use of 0.5% fuel oil for its fleet and to invest significantly by using LNG to power some of its future container ships (notably 9 giant ships on order), notably resulting in a 99% reduction in Sulphur emissions and by ordering several scrubbers for its ships. Additional cost resulting from this new regulation will be taken into account through the application or adjustment of fuel surcharges on a trade-by-trade basis.
CMA CGM / 26 Consolidated financial statements Year ended December 31, 2019
Note 4 - Results for the year Revenue recognition and related expenses Revenue comprises the payment the Company expects to be entitled in exchange for the sale of services, net of value-added tax, rebates and discounts after eliminating sales within the Group. As required by IFRS 15 “Revenue from contracts with customers”, the Group recognize revenue respecting the following five steps approach : (i) identify the contract with a customer, (ii) identify all the individual performance obligations within the contract, (iii) determine the transaction price, (iv) allocate the price to the performance obligations, (v) recognize revenue as the performance obligations are fulfilled. Container shipping For container shipping activity, no individual performance obligations have been identified by the Group for container transportation itself, inland transportation and ancillary services (such as THC, BAF…) as they are all part of one global shipping transportation performance obligation and as the transaction is contracted with the customers as a whole transaction. Freight revenues and costs directly attributable to the transport of containers are recognized on a percentage of completion basis, which is based on the proportion of transit time completed at report date for each individual container. Deferred freight costs directly attributable to containers are reported as prepaid expenses. Freight receivables for which the Company transferred a portion of the services to the customers as per revenue recognition principles, are reported as contract assets; hence, deferred income which were recognized under the previous standard, corresponding to the portion of the services not performed at cut-off dates, have been reclassified from current liabilities to contract assets (net). Logistics activities CEVA derives revenue from the transfer of services mainly over time in four major product lines, Contract Logistics, Air Freight Management, Ocean Freight Management and other Freight Management services (“Other FM”) which includes Ground, Brokerage and value added services. The CEVA sub-Group recognizes revenue when (or as) performance obligations are satisfied by transferring promised goods or services to the customer, which generally is dictated by the type of service CEVA is providing in agreement with the customer. Contract logistics services CEVA provides a range of logistics services such as distribution, pick and pack, materials management services, international insurance services, global project management services and trade facilitation services. The revenue performance obligation is satisfied over time based on the service delivered measured by either actual costs or output provided depending on the terms and conditions in the contracts. Costs are recorded or accrued to match revenue recognition. Air and Ocean Freight Management – indirect carrier As an indirect carrier, CEVA obtains shipments from its customers, consolidates shipments bound for a particular destination, determines the routing, selects the direct carrier and tenders each consolidated lot as a single shipment to the direct carrier for transportation to a distribution point. CEVA issues a Bill of Lading to customers as the contract of carriage. CEVA has complete discretion in selecting the means, route and procedures to be followed in handling, transportation and delivery of freight. CEVA is the direct point of contact for service fulfillment. The progress towards complete satisfaction of each performance obligation is
Consolidated financial statements CMA CGM / 27 Year ended December 31, 2019
measured based on the progress of each shipment during its time of travel, and thus met on an over time basis. The share of travel time not falling into a given reporting period is deferred to next period. Other FM – Value added services CEVA provides services at either origin or destination to clear shipments through customs, helping customers clear shipments through customs by preparing required documentation, calculating and providing for payment of duties and other taxes on behalf of the customers as well as arranging for any required inspections by governmental agencies and arranging for delivery or providing additional services such as warehousing, transportation, storage and document handling. The performance obligation is satisfied at the point in time once the service has been completed, as the performance obligation is either met or not met. Cargo agent (direct freight services) revenue as included in the Air and Ocean Freight Management business lines As an authorized cargo sales agent of most airlines and ocean shipping lines, CEVA also arranges for transportation of individual shipments and receives a commission from the airline or ocean shipping line for arranging the shipments or earns net revenue for the excess of amounts billed to the customer over amounts paid to the direct carrier. The contract of carriage is between the customer and the direct carrier and the direct carrier is the primary obligor from the perspective of the customer. When acting in this capacity, CEVA does not consolidate shipments or have responsibility for shipments once they have been tendered to the carrier, therefore the CEVA performance obligation is satisfied at the point in time once an agreement on the shipment between the customer and the carrier is reached. The revenue respective to agent revenue is recognized as either Ocean or Air. The group does not expect to have any contracts where the period between the transfer of the promised goods or services to the customer and payment by the customer exceeds one year. As a consequence, the group does not adjust any of the transaction prices for the time value of money. Other activities For other activities, no individual performance obligations have been identified in the contracts: revenue is recognized when the services have been rendered or when the goods have been delivered.
4.1 Operating segments As required by IFRS 8 “Operating Segments”, the segment information reported below is based on the internal reporting used by the Company’s management to allocate resources between segments and to assess their performance. Significant judgments Before CEVA acquisition (i.e. until 2018 CFS), the Group only reported two operating segments: container shipping activity and other activities. As a consequence of CEVA acquisition, Management reviewed its segment information and now disclosed a new “Logistics” segment including (i) freight management activities operated by CEVA and through CMA CGM subsidiaries, notably CMA CGM Logistics which have been transferred to CEVA early May, as well as (ii) contract logistics activities performed by CEVA and (iii) ground activities handled by CEVA and other subsidiaries. For management purposes, since 2019, the Group reports three operating segments: (i) container shipping activity (ii) logistics and (iii) other activities. For container shipping activity, CMA CGM is organized as a worldwide container carrier, managing its customer base and fleet of vessels and containers on a global basis. Logistics includes freight management activities and contract logistics activities. Other activities mainly include container terminal operations.
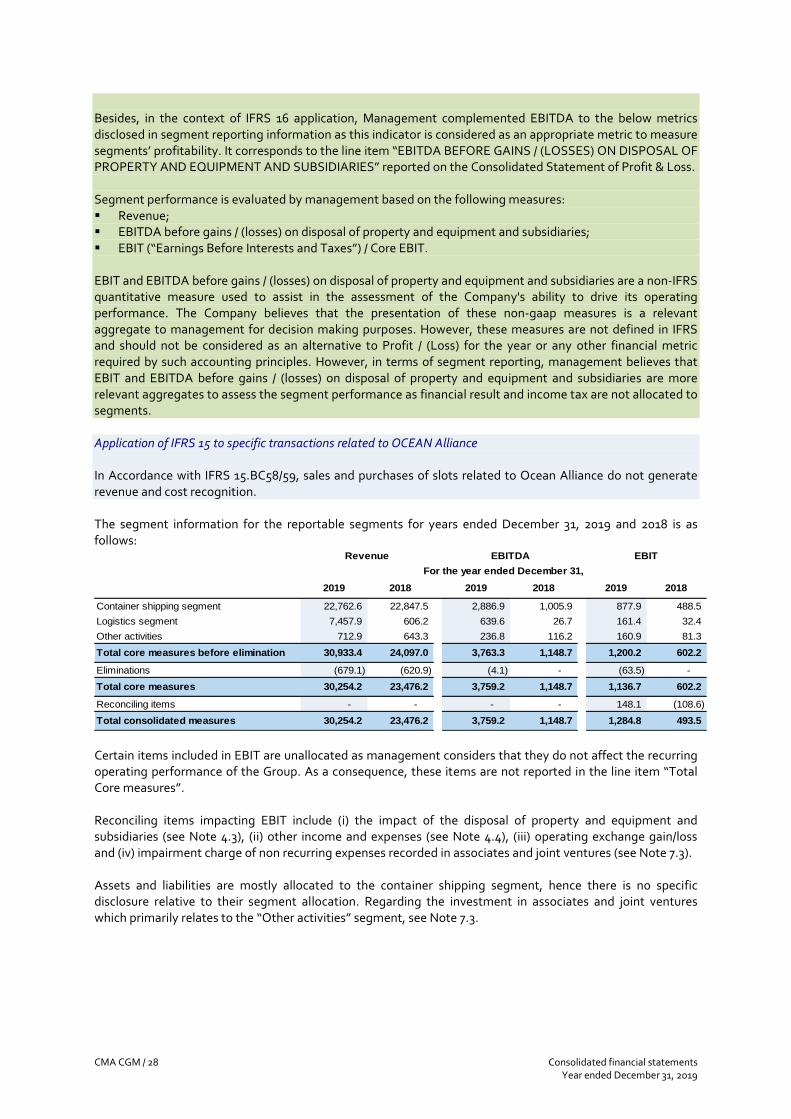
CMA CGM / 28 Consolidated financial statements Year ended December 31, 2019
Besides, in the context of IFRS 16 application, Management complemented EBITDA to the below metrics disclosed in segment reporting information as this indicator is considered as an appropriate metric to measure segments’ profitability. It corresponds to the line item “EBITDA BEFORE GAINS / (LOSSES) ON DISPOSAL OF PROPERTY AND EQUIPMENT AND SUBSIDIARIES” reported on the Consolidated Statement of Profit & Loss. Segment performance is evaluated by management based on the following measures: ▪ Revenue; ▪ EBITDA before gains / (losses) on disposal of property and equipment and subsidiaries; ▪ EBIT (“Earnings Before Interests and Taxes”) / Core EBIT. EBIT and EBITDA before gains / (losses) on disposal of property and equipment and subsidiaries are a non-IFRS quantitative measure used to assist in the assessment of the Company's ability to drive its operating performance. The Company believes that the presentation of these non-gaap measures is a relevant aggregate to management for decision making purposes. However, these measures are not defined in IFRS and should not be considered as an alternative to Profit / (Loss) for the year or any other financial metric required by such accounting principles. However, in terms of segment reporting, management believes that EBIT and EBITDA before gains / (losses) on disposal of property and equipment and subsidiaries are more relevant aggregates to assess the segment performance as financial result and income tax are not allocated to segments. Application of IFRS 15 to specific transactions related to OCEAN Alliance In Accordance with IFRS 15.BC58/59, sales and purchases of slots related to Ocean Alliance do not generate revenue and cost recognition. The segment information for the reportable segments for years ended December 31, 2019 and 2018 is as follows:
2019 2018 2019 2018 2019 2018
Container shipping segment 22,762.6 22,847.5 2,886.9 1,005.9 877.9 488.5
Logistics segment 7,457.9 606.2 639.6 26.7 161.4 32.4
Other activities 712.9 643.3 236.8 116.2 160.9 81.3
Total core measures before elimination 30,933.4 24,097.0 3,763.3 1,148.7 1,200.2 602.2
Eliminations (679.1) (620.9) (4.1) - (63.5) -
Total core measures 30,254.2 23,476.2 3,759.2 1,148.7 1,136.7 602.2
Reconciling items - - - - 148.1 (108.6)
Total consolidated measures 30,254.2 23,476.2 3,759.2 1,148.7 1,284.8 493.5
Revenue EBITDA EBIT
For the year ended December 31,
Certain items included in EBIT are unallocated as management considers that they do not affect the recurring operating performance of the Group. As a consequence, these items are not reported in the line item “Total Core measures”. Reconciling items impacting EBIT include (i) the impact of the disposal of property and equipment and subsidiaries (see Note 4.3), (ii) other income and expenses (see Note 4.4), (iii) operating exchange gain/loss and (iv) impairment charge of non recurring expenses recorded in associates and joint ventures (see Note 7.3). Assets and liabilities are mostly allocated to the container shipping segment, hence there is no specific disclosure relative to their segment allocation. Regarding the investment in associates and joint ventures which primarily relates to the “Other activities” segment, see Note 7.3.
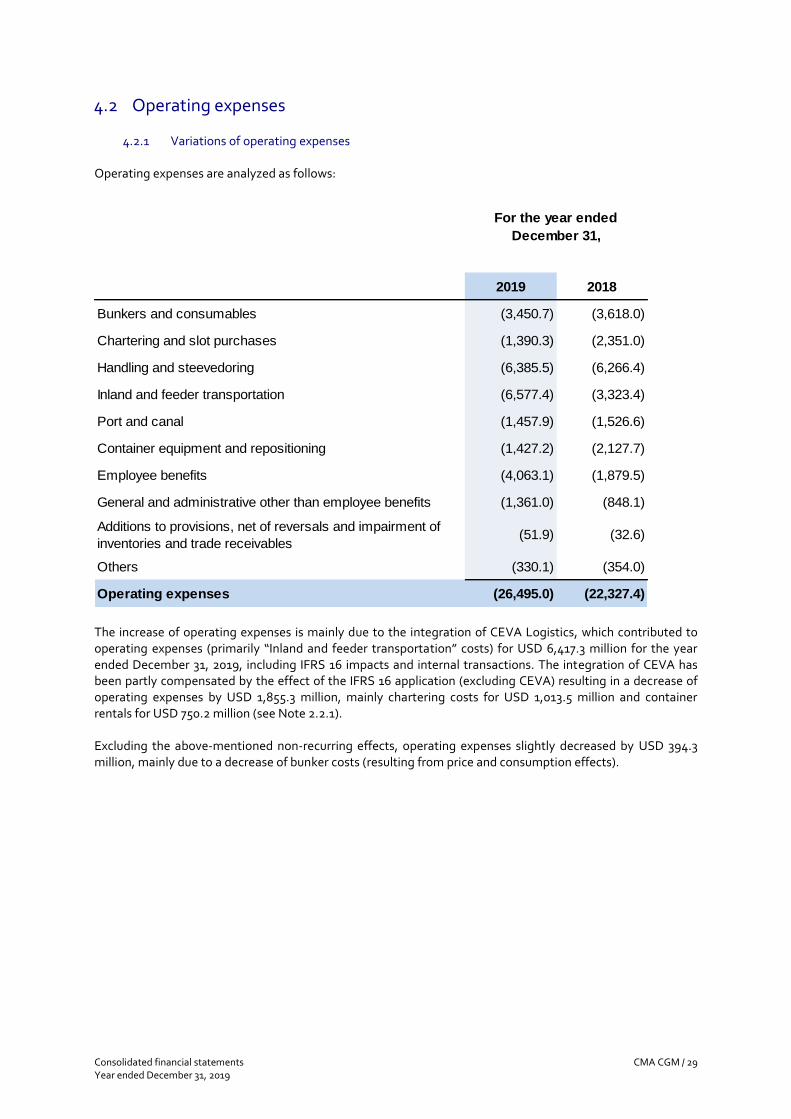
Consolidated financial statements CMA CGM / 29 Year ended December 31, 2019
4.2 Operating expenses
4.2.1 Variations of operating expenses Operating expenses are analyzed as follows:
2019 2018
Bunkers and consumables (3,450.7) (3,618.0)
Chartering and slot purchases (1,390.3) (2,351.0)
Handling and steevedoring (6,385.5) (6,266.4)
Inland and feeder transportation (6,577.4) (3,323.4)
Port and canal (1,457.9) (1,526.6)
Container equipment and repositioning (1,427.2) (2,127.7)
Employee benefits (4,063.1) (1,879.5)
General and administrative other than employee benefits (1,361.0) (848.1)
Additions to provisions, net of reversals and impairment of
inventories and trade receivables(51.9) (32.6)
Others (330.1) (354.0)
Operating expenses (26,495.0) (22,327.4)
For the year ended
December 31,
The increase of operating expenses is mainly due to the integration of CEVA Logistics, which contributed to operating expenses (primarily “Inland and feeder transportation” costs) for USD 6,417.3 million for the year ended December 31, 2019, including IFRS 16 impacts and internal transactions. The integration of CEVA has been partly compensated by the effect of the IFRS 16 application (excluding CEVA) resulting in a decrease of operating expenses by USD 1,855.3 million, mainly chartering costs for USD 1,013.5 million and container rentals for USD 750.2 million (see Note 2.2.1). Excluding the above-mentioned non-recurring effects, operating expenses slightly decreased by USD 394.3 million, mainly due to a decrease of bunker costs (resulting from price and consumption effects).
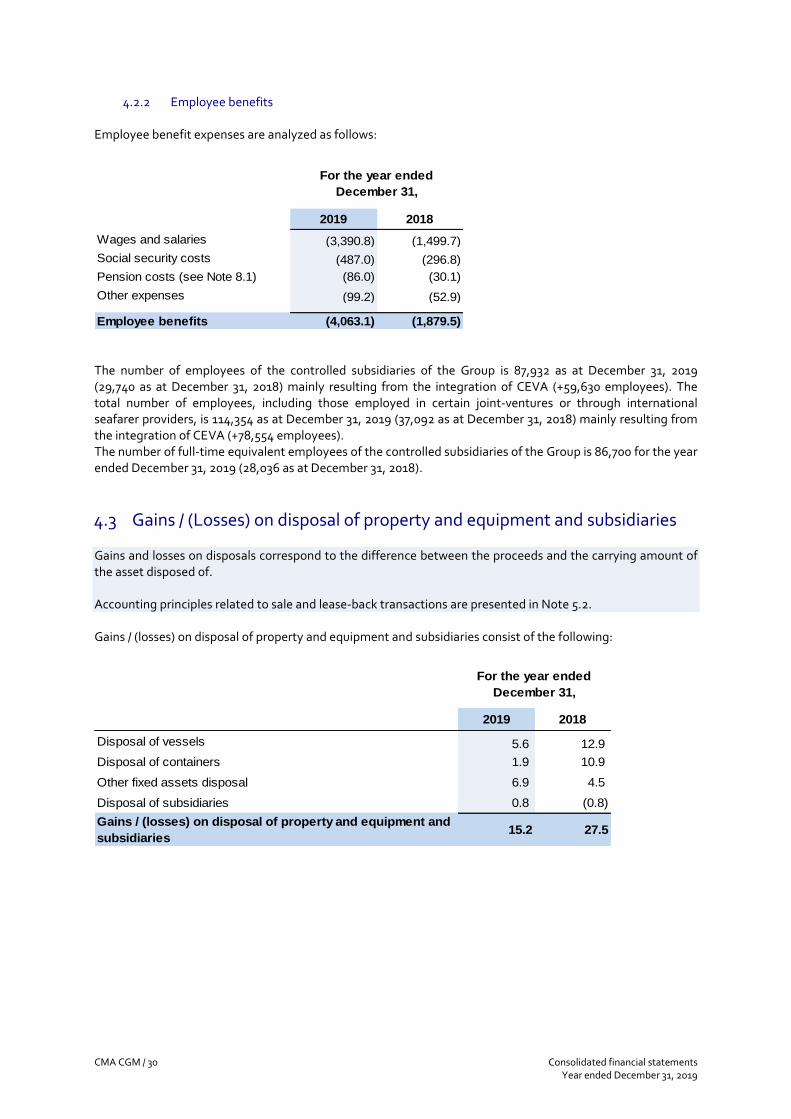
CMA CGM / 30 Consolidated financial statements Year ended December 31, 2019
4.2.2 Employee benefits Employee benefit expenses are analyzed as follows:
2019 2018
Wages and salaries (3,390.8) (1,499.7)
Social security costs (487.0) (296.8)
Pension costs (see Note 8.1) (86.0) (30.1)
Other expenses (99.2) (52.9)
Employee benefits (4,063.1) (1,879.5)
For the year ended
December 31,
The number of employees of the controlled subsidiaries of the Group is 87,932 as at December 31, 2019 (29,740 as at December 31, 2018) mainly resulting from the integration of CEVA (+59,630 employees). The total number of employees, including those employed in certain joint-ventures or through international seafarer providers, is 114,354 as at December 31, 2019 (37,092 as at December 31, 2018) mainly resulting from the integration of CEVA (+78,554 employees). The number of full-time equivalent employees of the controlled subsidiaries of the Group is 86,700 for the year ended December 31, 2019 (28,036 as at December 31, 2018).
4.3 Gains / (Losses) on disposal of property and equipment and subsidiaries Gains and losses on disposals correspond to the difference between the proceeds and the carrying amount of the asset disposed of. Accounting principles related to sale and lease-back transactions are presented in Note 5.2. Gains / (losses) on disposal of property and equipment and subsidiaries consist of the following:
2019 2018
Disposal of vessels 5.6 12.9
Disposal of containers 1.9 10.9
Other fixed assets disposal 6.9 4.5
Disposal of subsidiaries 0.8 (0.8)
Gains / (losses) on disposal of property and equipment and
subsidiaries15.2 27.5
For the year ended
December 31,
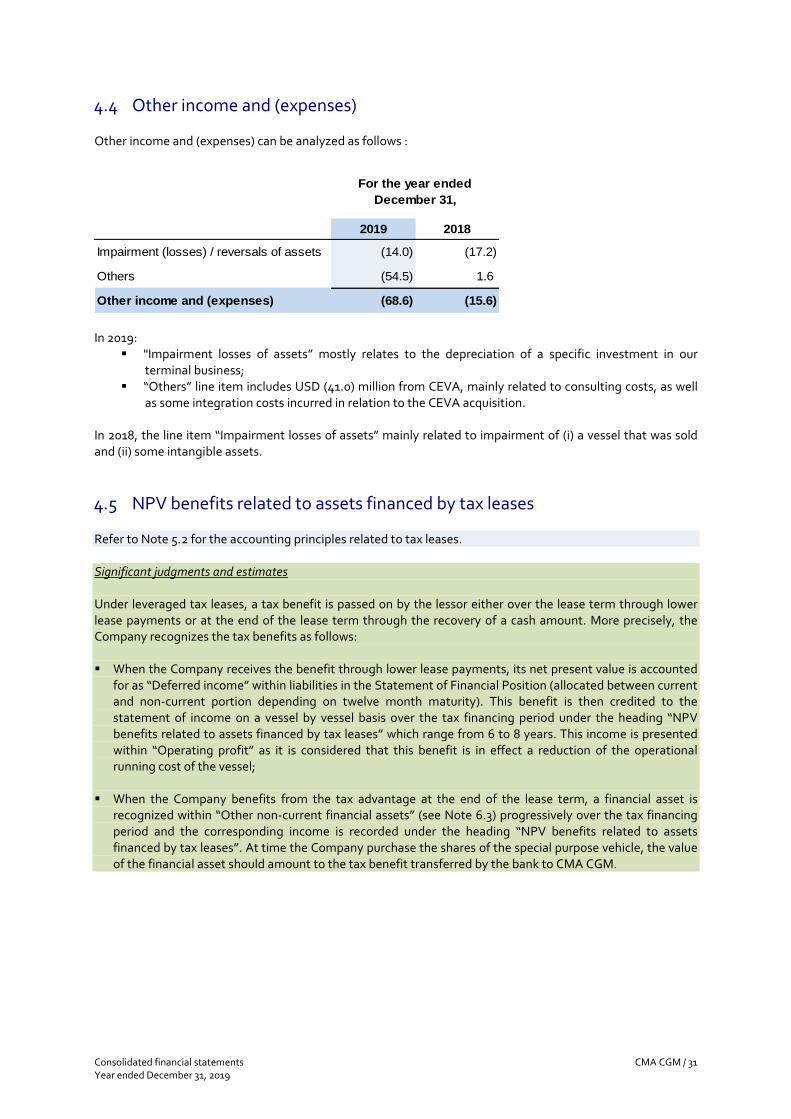
Consolidated financial statements CMA CGM / 31 Year ended December 31, 2019
4.4 Other income and (expenses) Other income and (expenses) can be analyzed as follows :
2019 2018
Impairment (losses) / reversals of assets (14.0) (17.2)
Others (54.5) 1.6
Other income and (expenses) (68.6) (15.6)
For the year ended
December 31,
In 2019:
▪ "Impairment losses of assets” mostly relates to the depreciation of a specific investment in our terminal business;
▪ “Others” line item includes USD (41.0) million from CEVA, mainly related to consulting costs, as well as some integration costs incurred in relation to the CEVA acquisition.
In 2018, the line item “Impairment losses of assets” mainly related to impairment of (i) a vessel that was sold and (ii) some intangible assets.
4.5 NPV benefits related to assets financed by tax leases Refer to Note 5.2 for the accounting principles related to tax leases. Significant judgments and estimates Under leveraged tax leases, a tax benefit is passed on by the lessor either over the lease term through lower lease payments or at the end of the lease term through the recovery of a cash amount. More precisely, the Company recognizes the tax benefits as follows: ▪ When the Company receives the benefit through lower lease payments, its net present value is accounted
for as “Deferred income” within liabilities in the Statement of Financial Position (allocated between current and non-current portion depending on twelve month maturity). This benefit is then credited to the statement of income on a vessel by vessel basis over the tax financing period under the heading “NPV benefits related to assets financed by tax leases” which range from 6 to 8 years. This income is presented within “Operating profit” as it is considered that this benefit is in effect a reduction of the operational running cost of the vessel;
▪ When the Company benefits from the tax advantage at the end of the lease term, a financial asset is
recognized within “Other non-current financial assets” (see Note 6.3) progressively over the tax financing period and the corresponding income is recorded under the heading “NPV benefits related to assets financed by tax leases”. At time the Company purchase the shares of the special purpose vehicle, the value of the financial asset should amount to the tax benefit transferred by the bank to CMA CGM.

CMA CGM / 32 Consolidated financial statements Year ended December 31, 2019
4.6 Financial result Accounting principles related to borrowings and cash and cash equivalents have been presented in Notes 6.4 and 6.6. In its consolidated statement of cash flows, the Company presents interest expenses as a cash flow used for financing activities. The financial result is analyzed as follows:
2019 2018
Interest expense on borrowings and lease liabilities (1,396.3) (491.2)
Interests income on cash and cash equivalents 33.9 41.8
Cost of borrowings and lease liabilities, net of interest
income on cash and cash equivalents(1,362.3) (449.4)
Settlements and change in fair value of derivative instruments (4.4) 2.1
Foreign currency income and expense, net 21.5 103.1
Other financial income and expense, net 3.4 18.3
Other net financial items 20.4 123.5
Financial result (1,341.9) (325.9)
For the year ended
December 31,
For the year ended December 31, 2019, “Interest expense on borrowings and lease liabilities” includes USD (627.1) million corresponding to IFRS 16 new finance cost and USD (183.8) million contribution from CEVA. In addition, it includes USD (57.8) million corresponding to the amortization of past issuance costs recognized using the effective interest method (USD (27.1) million for the year ended December 31, 2018 excluding CEVA). “Settlements and change in fair value of derivative instruments” reflect the impact, on the portfolio of derivative financial instruments, of the volatility of currencies and interest rates during the periods presented. “Foreign currency income and expense, net” is mainly composed of foreign currency exchange gains / (losses) on financial operations due to the translation of borrowings and financial instruments denominated in currencies different from USD (mainly but not limited to transactions in EUR). Among other minor effects, the exchange gains for the year ended December 31, 2019 are due to the depreciation of EUR currency versus USD at respective closing dates, as incurred in the year ended December 31, 2018 to a larger extent. “Other financial income and expense, net” mainly includes unwinding of discount effects, some effect related to IFRS16 provisions for dismantling costs as well as potential effect on lease modifications, some interests income related to financial assets and some dividends received from related parties.
4.7 Income and deferred taxes
4.7.1 Current income taxes In Accordance with IAS 12 “Income Taxes”, current income tax is the amount of income tax payable (recoverable) in respect of the taxable profit (tax loss) for the year. Taxable profit (tax loss) is the profit (loss) for the year, determined in accordance with the rules established by the taxation authorities, upon which income tax is payable (recoverable).
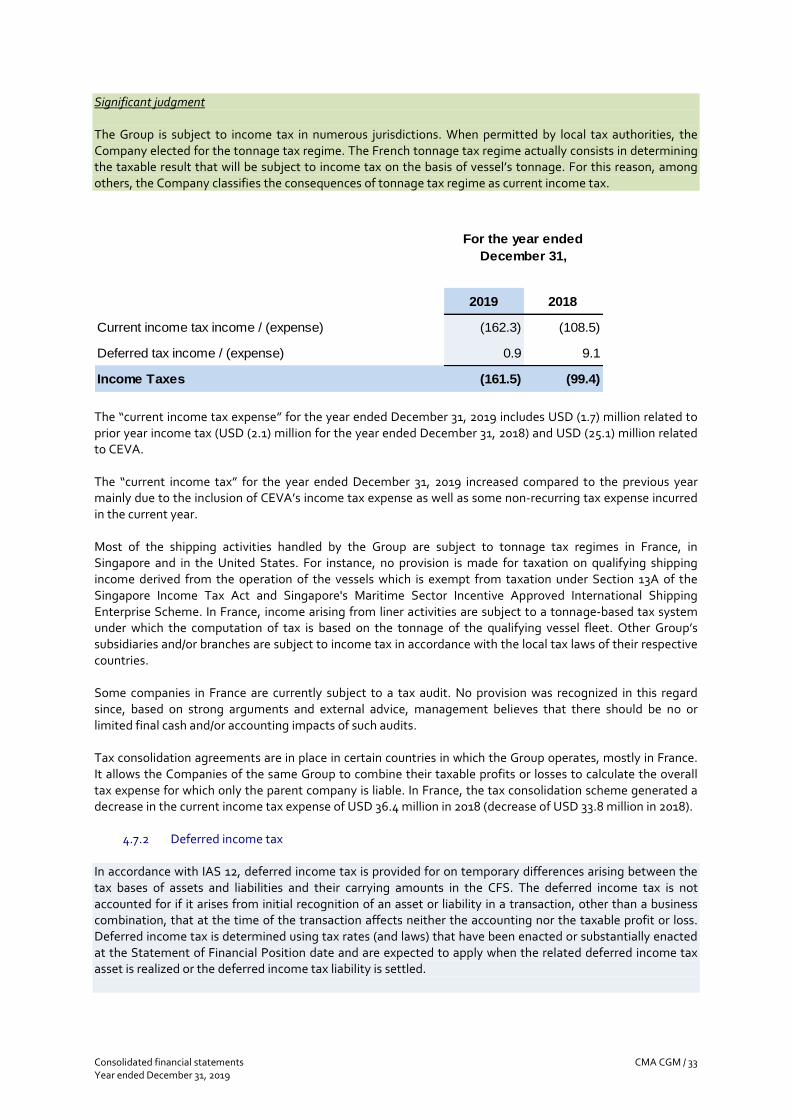
Consolidated financial statements CMA CGM / 33 Year ended December 31, 2019
Significant judgment The Group is subject to income tax in numerous jurisdictions. When permitted by local tax authorities, the Company elected for the tonnage tax regime. The French tonnage tax regime actually consists in determining the taxable result that will be subject to income tax on the basis of vessel’s tonnage. For this reason, among others, the Company classifies the consequences of tonnage tax regime as current income tax.
2019 2018
Current income tax income / (expense) (162.3) (108.5)
Deferred tax income / (expense) 0.9 9.1
Income Taxes (161.5) (99.4)
For the year ended
December 31,
The “current income tax expense” for the year ended December 31, 2019 includes USD (1.7) million related to prior year income tax (USD (2.1) million for the year ended December 31, 2018) and USD (25.1) million related to CEVA. The “current income tax” for the year ended December 31, 2019 increased compared to the previous year mainly due to the inclusion of CEVA’s income tax expense as well as some non-recurring tax expense incurred in the current year. Most of the shipping activities handled by the Group are subject to tonnage tax regimes in France, in Singapore and in the United States. For instance, no provision is made for taxation on qualifying shipping income derived from the operation of the vessels which is exempt from taxation under Section 13A of the Singapore Income Tax Act and Singapore's Maritime Sector Incentive Approved International Shipping Enterprise Scheme. In France, income arising from liner activities are subject to a tonnage-based tax system under which the computation of tax is based on the tonnage of the qualifying vessel fleet. Other Group’s subsidiaries and/or branches are subject to income tax in accordance with the local tax laws of their respective countries. Some companies in France are currently subject to a tax audit. No provision was recognized in this regard since, based on strong arguments and external advice, management believes that there should be no or limited final cash and/or accounting impacts of such audits. Tax consolidation agreements are in place in certain countries in which the Group operates, mostly in France. It allows the Companies of the same Group to combine their taxable profits or losses to calculate the overall tax expense for which only the parent company is liable. In France, the tax consolidation scheme generated a decrease in the current income tax expense of USD 36.4 million in 2018 (decrease of USD 33.8 million in 2018).
4.7.2 Deferred income tax In accordance with IAS 12, deferred income tax is provided for on temporary differences arising between the tax bases of assets and liabilities and their carrying amounts in the CFS. The deferred income tax is not accounted for if it arises from initial recognition of an asset or liability in a transaction, other than a business combination, that at the time of the transaction affects neither the accounting nor the taxable profit or loss. Deferred income tax is determined using tax rates (and laws) that have been enacted or substantially enacted at the Statement of Financial Position date and are expected to apply when the related deferred income tax asset is realized or the deferred income tax liability is settled.
CMA CGM / 34 Consolidated financial statements Year ended December 31, 2019
Deferred income tax assets are recognized to the extent that it is probable that future taxable profit will be available against which the temporary differences can be utilized. Deferred income tax is provided on temporary differences arising on investments in subsidiaries, joint ventures and associates, except where the timing of the reversal of the temporary difference is controlled by the Group and it is probable that the temporary difference will not be reversed in the foreseeable future. The deferred income taxes are recognized in the income statement, except to the extent that it relates to items recognized in other comprehensive income or directly in equity. In this case, the deferred income taxes are recognized in other comprehensive income or directly in equity, respectively. Regarding lease contracts under IFRS 16, there are two approaches permitted by the Standard: ▪ Asset and liability are treated as a whole: Initial recognition: the value of the asset and the value of the liability are quite the same. So, there is no
temporary difference and no deferred tax. Subsequently: values are different. A deferred tax has to be recognized. ▪ Initial recognition exemption provided by IAS 12.15 & 24 regarding deferred tax based on the fact that
assets and liabilities are quite equivalent at inception and that both assets and liabilities will be amortized at the end of the lease.
The Group has decided to follow the second approach. Significant judgment and estimates Deferred tax assets are recognized for all temporary differences to the extent that it is probable that taxable profit will be available against which the losses can be utilized. Management judgment is required to determine the amount of deferred tax assets that can be recognized, based upon the likely timing and level of future taxable profits. Due to the tonnage tax regime applicable on the main part of the Company’s activity, resulting in a lower income tax payable in the future, the amount of deferred tax assets to be recognized is limited. The mechanism of tonnage tax requires to estimate the portion of the future results that will be treated as part of tonnage tax regime and the residual portion that will not be subject to tonnage tax regime. For the purpose of the recognition of the deferred tax assets in France, Management has also based its estimates on: ▪ The fact that the French tonnage tax regime has been renewed in 2013 for a 10-year period; ▪ The best estimates of the future taxable results of activities that are not subject to tonnage tax regime. Considering the tonnage tax regime applicable to Group shipping activities, differences between taxable and book values of assets and liabilities are generally of a permanent nature. This is due to the fact that the taxable result for tonnage tax eligible activities has no correlation with either the carrying value or the generally applicable tax value of assets and liabilities. As a consequence, temporary differences are limited to those arising from other activities which are subject to usual tax laws.
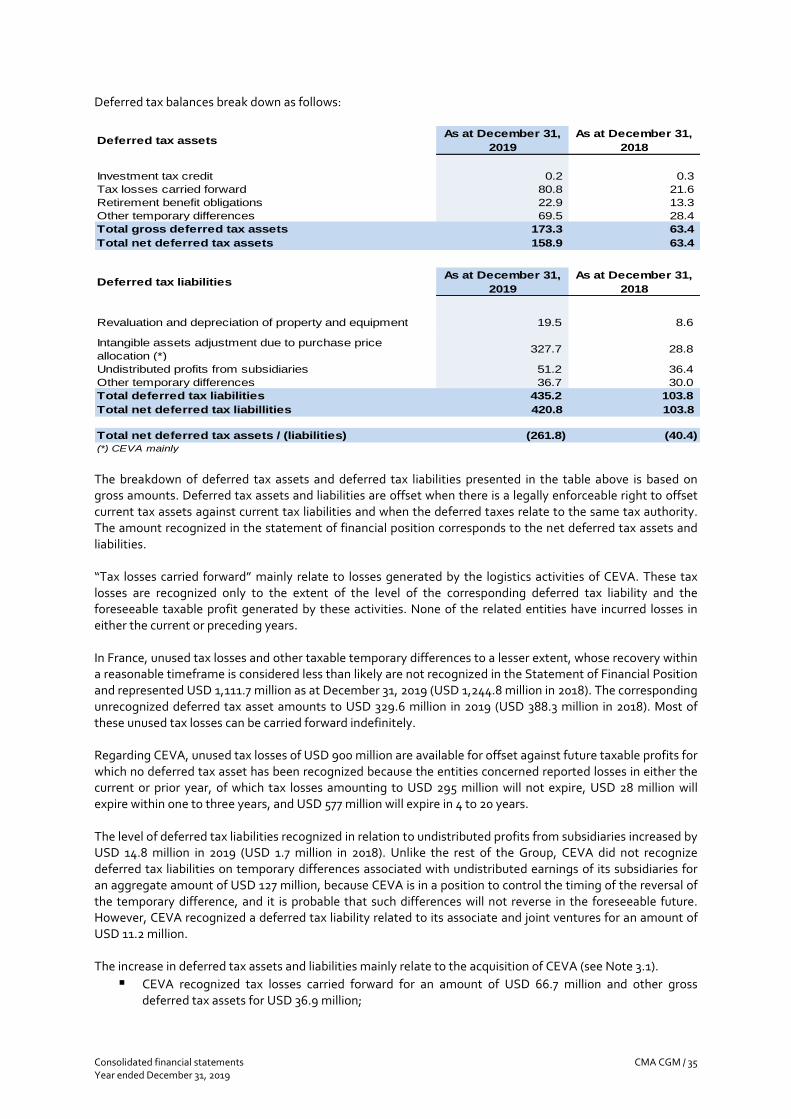
Consolidated financial statements CMA CGM / 35 Year ended December 31, 2019
Deferred tax balances break down as follows:
Deferred tax assetsAs at December 31,
2019
As at December 31,
2018
Investment tax credit 0.2 0.3
Tax losses carried forward 80.8 21.6
Retirement benefit obligations 22.9 13.3
Other temporary differences 69.5 28.4
Total gross deferred tax assets 173.3 63.4
Total net deferred tax assets 158.9 63.4
Deferred tax liabilitiesAs at December 31,
2019
As at December 31,
2018
Revaluation and depreciation of property and equipment 19.5 8.6
Intangible assets adjustment due to purchase price
allocation (*)327.7 28.8
Undistributed profits from subsidiaries 51.2 36.4
Other temporary differences 36.7 30.0
Total deferred tax liabilities 435.2 103.8
Total net deferred tax liabillities 420.8 103.8
Total net deferred tax assets / (liabilities) (261.8) (40.4)
(*) CEVA mainly The breakdown of deferred tax assets and deferred tax liabilities presented in the table above is based on gross amounts. Deferred tax assets and liabilities are offset when there is a legally enforceable right to offset current tax assets against current tax liabilities and when the deferred taxes relate to the same tax authority. The amount recognized in the statement of financial position corresponds to the net deferred tax assets and liabilities. “Tax losses carried forward” mainly relate to losses generated by the logistics activities of CEVA. These tax losses are recognized only to the extent of the level of the corresponding deferred tax liability and the foreseeable taxable profit generated by these activities. None of the related entities have incurred losses in either the current or preceding years. In France, unused tax losses and other taxable temporary differences to a lesser extent, whose recovery within a reasonable timeframe is considered less than likely are not recognized in the Statement of Financial Position and represented USD 1,111.7 million as at December 31, 2019 (USD 1,244.8 million in 2018). The corresponding unrecognized deferred tax asset amounts to USD 329.6 million in 2019 (USD 388.3 million in 2018). Most of these unused tax losses can be carried forward indefinitely. Regarding CEVA, unused tax losses of USD 900 million are available for offset against future taxable profits for which no deferred tax asset has been recognized because the entities concerned reported losses in either the current or prior year, of which tax losses amounting to USD 295 million will not expire, USD 28 million will expire within one to three years, and USD 577 million will expire in 4 to 20 years. The level of deferred tax liabilities recognized in relation to undistributed profits from subsidiaries increased by USD 14.8 million in 2019 (USD 1.7 million in 2018). Unlike the rest of the Group, CEVA did not recognize deferred tax liabilities on temporary differences associated with undistributed earnings of its subsidiaries for an aggregate amount of USD 127 million, because CEVA is in a position to control the timing of the reversal of the temporary difference, and it is probable that such differences will not reverse in the foreseeable future. However, CEVA recognized a deferred tax liability related to its associate and joint ventures for an amount of USD 11.2 million. The increase in deferred tax assets and liabilities mainly relate to the acquisition of CEVA (see Note 3.1).
▪ CEVA recognized tax losses carried forward for an amount of USD 66.7 million and other gross deferred tax assets for USD 36.9 million;

CMA CGM / 36 Consolidated financial statements Year ended December 31, 2019
▪ The change of control did not lead Management to reassess the value of deferred tax recognized by CEVA, except in relation to purchase price allocation, which resulted in the recognition of an additional deferred tax liability amounting to USD 322.0 million at acquisition date, reflecting the temporary difference resulting from the recognition of new intangible assets (see Note 3.1).
Income tax impacts related to other comprehensive income are presented in the statement of comprehensive income.
For the year ended
December 31,
2019
Net deferred tax at the begining of the year (40.4)
Changes through Profit & Loss 0.9
Currency translation adjustment (0.7)
Other variations (222.7)
Net deferred tax at the end of the period (261.8) The lines item “Other variations” in the table above mainly relate to the acquisition of CEVA (see Note 3.1).
4.7.3 Tax proof
2019 2018
(200.2) 255.8
68.9 (88.1)
(161.5) (99.4)
(230.4) (11.4)
37.7 (30.9)
14.3 15.3
(13.9) 66.4
(76.1) (13.9)
Initial recognition of assets and liabilities exception (1.8) 93.0
(190.6) (141.4)
Difference (230.4) (11.4)
For the year ended
December 31,
Theoritical income tax (tax rate of 34.43% in 2019 / 34.43%
in 2018)
Profit / (Loss) before tax and excluding share of profit
(or loss) of the associates and joint ventures
Other Permanent differences
Effect of different tax rates in foreign tax jurisdictions
Unrecognized tax losses generated by certain activities not
liable to tonnage tax
Income tax expense
Difference between theoritical and effective income
tax
Not taxable income (mainly due to impact of the tonnage
tax regime)
Use or recognition of deferred tax assets previously
unrecognized

Consolidated financial statements CMA CGM / 37 Year ended December 31, 2019
Note 5 - Invested capital and working capital
5.1 Goodwill and other intangible assets
5.1.1 Goodwill Goodwill and Business Combinations Business combinations are accounted for using the acquisition method defined in IFRS 3 “Business combinations”. Accordingly, all acquisition-related costs are recognized as operating expenses. The consideration transferred for the acquisition of a subsidiary is the fair value of the assets acquired, the liabilities assumed and the equity interests issued by the Group at transaction date. The consideration transferred includes the fair value of any asset or liability resulting from a contingent consideration arrangement. Contingent payments classified as debt are subsequently remeasured through the consolidated income statement. Identifiable assets acquired and liabilities assumed in a business combination are measured initially at their fair values at the acquisition date. Determination of goodwill Goodwill is measured as the difference between: ▪ The aggregate of (i) the value of the consideration transferred, (ii) the amount of any non-controlling
interest, and (iii) in a business combination achieved in stages, the acquisition-date fair value of the acquirer's previously-held equity interest in the acquiree, and
▪ The net of the acquisition-date amounts of the identifiable assets acquired and the liabilities assumed. If this is less than the fair value of the net assets of the subsidiary acquired in the case of a bargain purchase, then the difference is recognized directly in the income statement. Non-controlling interests represent the portion of the profit or loss and net assets (of the Group or of one of its subsidiaries) attributable to equity interests held by third parties. Adjustments are recognized as changes to goodwill, provided they result from new information obtained about facts and circumstances that existed at acquisition date and are made within twelve months of the date of acquisition. Presentation and subsequent measurement of goodwill Goodwill on acquisition of subsidiaries is disclosed separately in the Statement of Financial Position. Goodwill on acquisition of associates and joint ventures is included in the Company’s share in investments in associates and joint ventures. At the time of the sale of a subsidiary or a jointly controlled entity, the amount of the goodwill attributable to the subsidiary or associates and joint ventures is included in the calculation of the gain and loss on disposal. Impairment of goodwill See Note 5.3.

CMA CGM / 38 Consolidated financial statements Year ended December 31, 2019
The carrying amount of goodwill has been allocated to the following operating segments and cash generating units based on the management structure:
As at December 31,
2019
As at December 31,
2018
Beginning of the year 1,166.1 1,054.5
Goodwill from business combinations (see Note 3.1) 1,688.5 142.8
Other variations 2.0 (11.5)
Foreign currency translation adjustment (4.8) (19.7)
At the end of the year 2,851.8 1,166.1
of which:
Allocated to container shipping segment 1,143.1 1,145.8
Allocated to logistics segment 1,696.4 0.0
Allocated to other activities 12.4 20.4 In 2019, the line item “Goodwill from business combinations (see Note 3.1)” corresponds to: ▪ The goodwill recognized as a result of the purchase price allocation performed on CEVA acquisition (see
Note 3.1); ▪ The line item “Other variations” corresponds mainly to the update of the purchase price allocation related
to the acquisition of Containerships. In 2018, the line item “Goodwill from business combinations (see Note 3.1)” corresponds to: ▪ The finalization of the purchase price allocation performed on Mercosul acquisition in December 2018; ▪ The goodwill recognized as part of the provisional purchase price allocation performed on Containerships
acquisition.
5.1.2 Other intangible assets Other intangible assets mainly consist of: ▪ Software developed and acquired for internal corporate use, which is recorded at the initial acquisition
cost plus the cost of development minus the total of the amortization and any impairment loss. In-house software development costs are capitalized in accordance with criteria set out in IAS 38 “Intangible assets”;
▪ Terminal concession rights, trademarks and customer relationships recognized as part of purchase price allocations and amortized over their respective useful life, except for the trademarks which usually have an indefinite useful life.
Costs associated with maintaining computer software programs are recognized as an expense when incurred. Software developed or acquired is amortized on a straight-line basis over five to ten years based on the estimated useful life.

Consolidated financial statements CMA CGM / 39 Year ended December 31, 2019
Other intangible assets are analyzed as follows:
In use In-progress
Cost of Other intangible assets
As at December 31, 2017 542.5 270.6 715.8 115.0 18.3 1,662.2
Acquisitions 13.5 72.6 - - 1.1 87.3
Acquisitions of subsidiaries (see Note 3.1) 0.4 - 123.1 - 2.7 126.2
Disposals (41.2) - - - (0.7) (41.9)
Reclassification 51.6 (59.7) - - 4.0 (4.1)
Foreign currency translation adjustment (0.8) (0.1) (15.4) - (0.3) (16.7)
As at December 31, 2018 566.0 283.4 823.5 115.0 25.1 1,813.0
Acquisitions 18.7 65.2 - - 0.4 84.2
Acquisitions of subsidiaries (see Note 3.1) 53.9 12.8 1,318.2 - 1.1 1,386.1
Disposals (10.0) (1.5) - - (0.4) (11.8)
Reclassification to assets held-for-sale (see
Note 5.5)- - - - (14.1) (14.1)
Reclassification 39.8 (29.4) - - (2.6) 7.8
Foreign currency translation adjustment (1.5) (0.3) (4.2) - 0.2 (5.7)
As at December 31, 2019 666.9 330.2 2,137.6 115.0 9.9 3,259.6
Others Total
SoftwareTrademarks &
Customer
relationships
Terminal
concession
rights
In use In-progress
Amortization and impairment
As at December 31, 2017 (408.6) - (49.7) (31.5) (2.3) (492.0)
Amortization (47.0) - (32.8) (4.2) (2.8) (86.7)
Disposals 39.4 - - - 0.7 40.2
Reclassification (0.1) - 1.0 - (0.4) 0.5
Foreign currency translation adjustment 0.4 - 0.2 - 0.1 0.7
As at December 31, 2018 (426.7) - (81.2) (35.6) (5.4) (549.0)
Amortization (60.8) - (82.7) (4.2) (3.3) (151.1)
Acquisitions of subsidiaries (0.0) - (0.6) - - (0.6)
Disposals 8.9 - - - - 8.9
Reclassification to assets held-for-sale (see
Note 5.5)- - - - 4.8 4.8
Reclassification (5.7) - - - (0.5) (6.2)
Foreign currency translation adjustment (0.5) - 0.1 - (0.1) (0.5)
As at December 31, 2019 (484.8) - (164.4) (39.8) (4.6) (693.7)
Others Total
Software Trademarks &
Customer
relationships
Terminal
concession
rights
In use In-progress
As at December 31, 2019 182.1 330.2 1,973.2 75.2 5.3 2,566.0
As at December 31, 2018 139.3 283.4 742.3 79.4 19.7 1,264.1
As at December 31, 2017 133.9 270.6 666.1 83.5 16.0 1,170.2
Terminal
concession
rights
Others TotalNet book value of Other intangible
assets
SoftwareTrademarks &
Customer
relationships
The net carrying value of other intangible assets mainly relates to (i) the trademark and customer relationships recognized as part of the purchase price allocations for USD 1,973.2 million (USD 742.3 million as at December 31, 2018), out of which USD 1,311.0 million consists of the customer relationships and trademarks recognized as part of CEVA purchase price allocation, (ii) USD 75.2 million to terminal concession rights (USD 79.4 million as at December 31, 2018) and (iii) software in use or in progress for an amount of USD 512.3 million (USD 422.7 million as at December 31, 2018) out of which CEVA contributes for USD 78.5 million. High-performance information systems are critical within our industry, which requires significant internal and external software development. Software capitalized costs mainly correspond to costs incurred for the in-house development of (i) shipping agency systems, implemented throughout the worldwide Group agency
CMA CGM / 40 Consolidated financial statements Year ended December 31, 2019
network, which address bookings, billings and transportation documentation, (ii) the operating system including logistical support and container tracking and (iii) the comprehensive accounting and financial reporting ERP systems implemented in all Group shipping entities. Through a strategic partnership with SAP, the Company decided some years ago to invest in a new innovative information system. It will enable the Group to develop an information system specifically designed for container shipping, it aims at enhancing efficiency and flexibility in an industry that is constantly evolving. Some preliminary parts of this new information system have been recently implemented within the Group. The software in progress recorded as at December 31, 2019 and 2018 mainly corresponds to this project. During the year ended December 31, 2019, the capitalized costs of the future information system amounted to USD 33.5 million (USD 65.1 million during the year ended December 31, 2018). Most of the value of this program will be put into service in 2020. The amortization schedule of the currently used ERP has been adjusted to its reassessed remaining useful life.
5.2 Property and equipment Recognition of property and equipment In accordance with IAS 16 “Property, Plant and Equipment”, items of property and equipment are recognized as assets when it is probable that the future economic benefits associated with the asset will flow to the Company and the cost of the asset can be measured reliably. Right-of-use under IFRS 16 IFRS 16 requires to recognize a right of use (and a lease liability) representing its obligation to make lease payments for leases. At the commencement date, the right-of-use asset should be measured at cost, which includes: (i) the amount of the initial measurement of the lease liability, (ii) prepayments, (iii) initial direct costs and (iv) dismantling and removing costs. Depreciation of the right- of -use is calculated using the straight-line method. The right-of-use asset should be depreciated from the commencement date to the earlier between the end of the useful life of the right-of-use asset and the end of the lease term. Otherwise, if the lease transfers ownership of the underlying asset to the lessee by the end of the lease term, or if the cost of the right-of-use asset reflects that the lessee will exercise a purchase option, the right-of-use asset should be depreciated from the commencement date to the end of the useful life of the underlying asset, taking into account the relevant residual value. Sale and lease-back transactions In order to determine the accounting treatment applicable to a sale and leaseback transaction, the Group assesses whether the transfer of the asset is a sale under IFRS 15 requirements or not. ▪ If the transfer of an asset by the Group satisfies the requirements of IFRS 15 to be accounted for as a sale
of the asset, the Group shall measure the right-of-use asset arising from the leaseback at the proportion of the previous carrying amount of the asset that relates to the right of use retained by the seller-lessee. Accordingly, the Group recognise only the amount of any gain or loss that relates to the rights transferred to the buyer-lessor. The lease is accounted applying IFRS 16.
▪ If the transfer of an asset by the seller-lessee does not satisfy the requirements of IFRS 15 to be accounted
for as a sale of the asset, the Group continue to recognise the transferred asset and recognise a financial liability equal to the transfer proceeds. It shall account for the financial liability applying IFRS 9.

Consolidated financial statements CMA CGM / 41 Year ended December 31, 2019
Measurement of property and equipment As required by IAS 16, property and equipment are recorded at the historical acquisition or manufacturing cost, less accumulated depreciation and any impairment loss. Acquisition or manufacturing costs comprise any costs directly attributable to bringing the asset to the location and condition necessary for it to be capable of operating in the manner intended by management. The pre-operating costs are expensed when incurred. Borrowing costs incurred for the construction of any qualifying assets are capitalized during the period of time that is required to complete and prepare the asset for its intended use. Other borrowing costs are expensed. On initial recognition, the cost of property and equipment acquired is allocated to each component of the asset and depreciated separately. Maintenance costs are recognized as expenses for the year, with the exception of mandatory dry-docks required to maintain vessel navigation certificates, which constitute an identifiable component upon the acquisition of a vessel and which are thereafter capitalized when the following dry-docks occur. Dry-docks are depreciated over the remaining useful life of the related vessel or to the date of the next dry-dock, whichever is sooner. Depreciation on assets is calculated using the straight-line method to allocate the cost of each part of the asset to its residual value (scrap value for vessels and estimated sale price for containers) over its estimated useful life, as follows:
AssetUseful life in
years
Buildings (depending on components) 15 to 40
New vessels 25
Dry-docks (component of vessels) 1 to 7
Second-hand container vessels and Roll-on Roll-off vessels (depending on residual useful life) 6 to 22
New barges/ Second-hand barges 40 / 20
New dry containers 13
New reefer containers 12
Second-hand containers (depending on residual useful life) 3 to 5
Fixtures and fittings 10
Other fixed assets such as handling and stevedoring equipment 3 to 20 Concerning the scrubbers a 7-year useful life has been retained. The assets’ residual values and useful lives are reviewed, and adjusted if necessary, at each Statement of Financial Position date. The residual value for vessels is based on the lightweight and the average market price of steel. The residual value for containers is based on the Company’s historical experience of the sale of used containers. An asset’s carrying amount is immediately written down to its recoverable amount if the asset’s carrying amount is greater than its estimated recoverable amount (see Note 5.3). Significant estimates: Determination of the vessels useful lives and residual values The depreciation of vessels is a significant expense for the Company. Vessels are depreciated over their expected useful lives to a residual value. Useful lives and residual values are reassessed regularly based on available information such as the age of vessels in service on the market and the average age of scrapped vessels. This assessment also reflects current technology, service potential and vessel structure. This approach excludes short-term market fluctuations to the extent possible. Changes to estimates of useful lives and residual values may affect the depreciation expenses significantly.
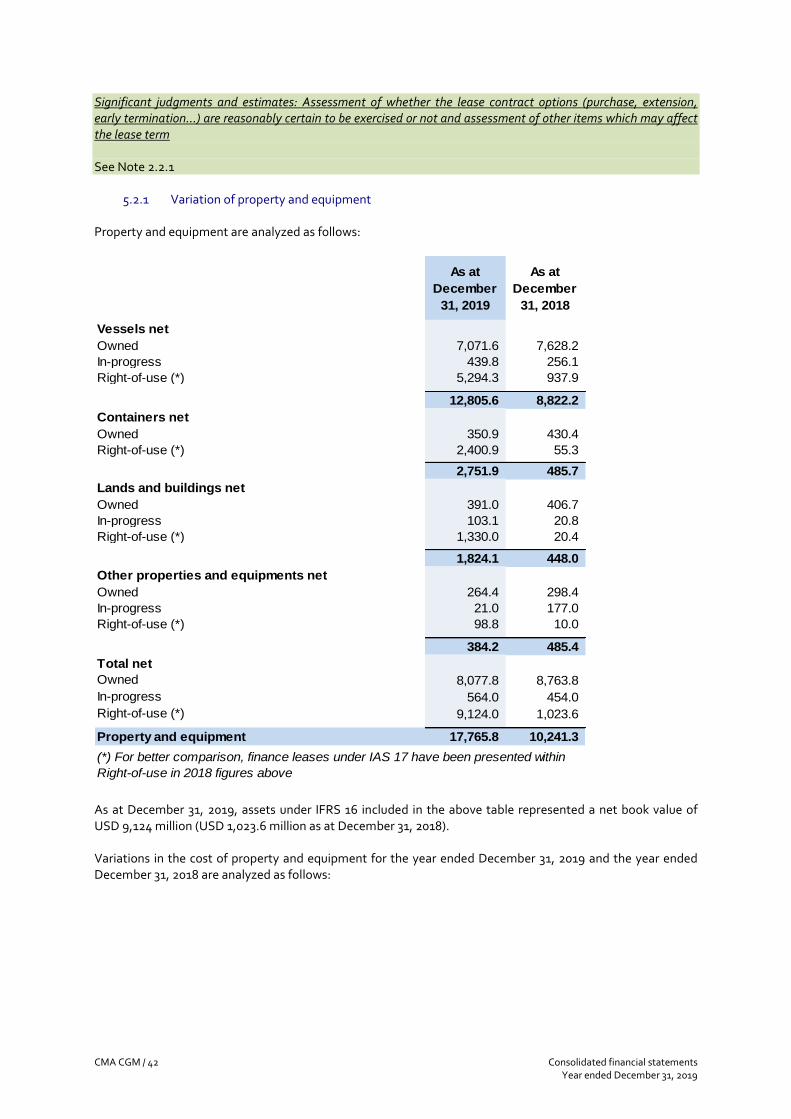
CMA CGM / 42 Consolidated financial statements Year ended December 31, 2019
Significant judgments and estimates: Assessment of whether the lease contract options (purchase, extension, early termination…) are reasonably certain to be exercised or not and assessment of other items which may affect the lease term See Note 2.2.1
5.2.1 Variation of property and equipment Property and equipment are analyzed as follows:
As at
December
31, 2019
As at
December
31, 2018
Vessels net
Owned 7,071.6 7,628.2
In-progress 439.8 256.1
Right-of-use (*) 5,294.3 937.9
12,805.6 8,822.2
Containers net
Owned 350.9 430.4
Right-of-use (*) 2,400.9 55.3
2,751.9 485.7
Lands and buildings net
Owned 391.0 406.7
In-progress 103.1 20.8
Right-of-use (*) 1,330.0 20.4
1,824.1 448.0
Other properties and equipments net
Owned 264.4 298.4
In-progress 21.0 177.0
Right-of-use (*) 98.8 10.0
384.2 485.4
Total net
Owned 8,077.8 8,763.8
In-progress 564.0 454.0
Right-of-use (*) 9,124.0 1,023.6
Property and equipment 17,765.8 10,241.3
(*) For better comparison, finance leases under IAS 17 have been presented within
Right-of-use in 2018 figures above
As at December 31, 2019, assets under IFRS 16 included in the above table represented a net book value of USD 9,124 million (USD 1,023.6 million as at December 31, 2018). Variations in the cost of property and equipment for the year ended December 31, 2019 and the year ended December 31, 2018 are analyzed as follows:

Consolidated financial statements CMA CGM / 43 Year ended December 31, 2019
Containers Total
OwnedRight-of-use
(*)In-progress
As at January 1, 2018 9,526.8 1,083.9 463.7 922.5 697.1 649.2 13,343.2
Acquisitions 165.4 148.7 345.5 71.9 3.8 116.5 851.8
Acquisitions of subsidiaries 10.2 - 26.8 31.7 1.0 5.1 74.8
Adjustment on purchase price allocation (35.4) - - - - - (35.4)
Disposals (54.8) (1.8) - (151.9) (7.6) (14.8) (230.9)
Reclassification to held-for-sale - - - - (20.0) - (20.0)
Reclassification (1.1) - - (1.6) - 4.7 2.0
Vessels put into service 501.6 76.6 (578.1) - - - 0.0
Foreign currency translation adjustment (17.4) (1.6) (1.8) (2.4) (30.2) (13.3) (66.7)
As at December 31, 2018 10,095.3 1,305.8 256.1 870.3 644.1 747.3 13,918.9
First time application IFRS 16 (1,010.1) 5,180.0 - 2,437.7 152.1 221.2 6,980.9
Acquisitions 268.4 567.9 329.7 543.6 435.1 135.1 2,279.8
Acquisitions of subsidiaries - - - - 1,268.3 103.1 1,371.3
Disposals (64.0) (8.3) - (179.2) (52.0) (29.7) (333.4)
Reclassification to held-for-sale - - - - - (464.1) (464.1)
Reclassification - - - (0.8) 1.9 (10.3) (9.2)
Vessels put into service 188.6 (42.9) (145.6) - - - 0.0
Foreign currency translation adjustment (3.6) (0.7) (0.5) (0.6) (16.7) (6.0) (28.1)
As at December 31, 2019 9,474.6 7,001.7 439.8 3,670.9 2,432.8 696.5 23,716.2
Other
properties
and
equipments
Vessels Lands and
buildings
(*) For better comparison, finance leases under IAS 17 have been presented within Right-of-use in 2018 figures above As at December 31, 2019, the Group operates 112 vessels owned and 188 under IFRS 16 or equivalent agreements (147 vessels as at December 31, 2018). During the year ended December 31, 2019: ▪ “First time application of IFRS 16” relates to the effect of applying IFRS 16 as at January 1, 2019 (see Note
2.2.1); ▪ “Acquisitions” of owned vessels relate to the delivery of four TEU 3,300 vessel and 3 TEU 1,380 LNG-
powered ships; ▪ “Acquisitions” of right-of-use vessels relate to 37 new leases entered into in the year ended December 31,
2019; ▪ “Acquisitions” of in-progress vessels relate to prepayments paid to shipyards in relation to the orderbook
(including nine TEU 23,000 vessels), and includes the delivery instalments paid at the delivery date of four TEU 3,300 vessel and prepayments related to scrubbers;
▪ Acquisition of containers relate to the exercise of purchase options and to new leases entered into as well as some modification of existing leases;
▪ Acquisitions of land and buildings mainly include leases entered into by CEVA since acquisition date for an amount of USD 358.1 million;
▪ “Acquisition of subsidiaries” mainly relates to the fair value of property and equipment acquired through CEVA acquisition, including CEVA’s right-of-use (see Note 3.1);
▪ “Reclassification to held-for-sale” relates to the reclassification of certain of the Group’s terminals assets as held-for-sale (see Note 5.5);
▪ “Vessels put into service” relate to delivery of four TEU 3,300 vessel. During the year ended December 31, 2018: ▪ “Acquisitions” of owned vessels relate to the purchase of four second-hand vessels (below TEU 2,000) and
one tugboat; ▪ “Acquisitions” of leased vessels mainly relate to the delivery of one TEU 14,000 vessel and to the delivery
of one LNG of Containerships; ▪ “Acquisitions” of in-progress vessels relate to prepayments paid to shipyards in relation to the orderbook
(including nine TEU 23,000 vessels) and include the delivery installments paid at the delivery dates of three TEU 2,500 vessels and three TEU 20.600 vessels;
▪ “Vessels put into service” relate to the reclassification of the prepayments mainly following the deliveries of three TEU 20,600 vessel and three TEU 2,500 vessel.
Borrowing costs capitalized during the year ended December 31, 2019 amounted to USD 13.0 million (USD 13.1 million for the year ended December 31, 2018).

CMA CGM / 44 Consolidated financial statements Year ended December 31, 2019
Acquisition of property and equipment and reconciliation with the Consolidated Statement of Cash Flows Purchases of property and equipment amounted to USD 2,279.8 million for the year ended December 31, 2019 (USD 851.8 million for the year ended December 31, 2018). The reconciliation of these acquisitions with the capital expenditures (CAPEX) presented in the statement of cash-flows, under the heading “Purchase of property and equipment” can be presented as follows:
2019 2018
Acquisition of assets presented in the above table a 2,279.8 851.8
(-) Assets not resulting in a cash outflow (i) b 391.2 425.0
(-) IFRS16 leases increase c 1,365.6 -
CAPEX cash from purchases of property and equipment a (-) b (-) c = d 522.9 426.8
CAPEX cash from purchases of intangible assets e 83.8 79.7
CAPEX cash from business combination f 853.0 769.6
Total CAPEX as per Consolidated Statement of Cash Flows d (+) e (+) f 1,459.7 1,276.1
As at December 31,
(i) The group assets include assets financed via financial leases or assets which purchase price is settled directly by the
financing bank to the yard hence not resulting in a cash stream upon acquisition.
Variations in the accumulated depreciation for the year ended December 31, 2019 and the year ended December 31, 2018 are analyzed as follows:
Total
OwnedRight-of-
use (*)In-progress
As at January 1, 2018 (2,140.8) (312.8) - (359.9) (187.3) (222.8) (3,223.6)
Depreciation (381.1) (48.1) - (38.3) (21.8) (57.9) (547.3)
Disposals 44.2 1.8 - 13.2 5.0 11.7 75.8
Impairment (5.3) - - - (0.1) - (5.4)
Vessels refinancing & exercise of purchase option 9.1 (9.1) - - - - -
Reclassification to held-for-sale - - - - 1.2 - 1.2
Reclassification 2.3 - - 0.1 - (0.2) 2.2
Foreign currency translation adjustment 4.6 0.3 - 0.3 6.9 7.3 19.6
As at December 31, 2018 (2,467.1) (367.9) - (384.6) (196.1) (261.8) (3,677.5)
First time application IFRS 16 405.5 (404.4) - - 0.1 (0.8) 0.5
Depreciation (374.9) (951.1) - (643.4) (461.2) (141.0) (2,571.6)
Disposals 34.9 8.2 - 108.8 48.2 22.2 222.2
Impairment 5.3 - - - (0.0) - 5.3
Vessels refinancing & exercise of purchase option - 7.9 - - - - 7.9
Reclassification to held-for-sale - - - - - 57.3 57.3
Reclassification (7.9) - - 0.2 (2.0) 8.7 (0.9)
Foreign currency translation adjustment 1.1 (0.0) - 0.0 2.2 3.1 6.4
As at December 31, 2019 (2,403.0) (1,707.4) - (919.0) (608.7) (312.3) (5,950.5)
(*) For better comparison, finance leases under IAS 17 have been presented within Right-of-use in 2018 figures above
Vessels Containers Lands and
buildings
Other
properties
and
equipments
The net book value of property and equipment at the opening and closing for the year ended December 31, 2019 and the year ended December 31, 2018 are analyzed as follows:
Total
OwnedRight-of-
use (*)In-progress
As at December 31, 2019 7,071.6 5,294.3 439.8 2,751.9 1,824.1 384.2 17,765.8
As at December 31, 2018 7,628.2 937.9 256.1 485.6 448.0 485.5 10,241.3
As at December 31, 2017 7,385.9 771.1 463.7 562.6 509.8 426.5 10,119.6
Vessels
Containers Lands and
buildings
Other
properties
and
equipments
(*) For better comparison, finance leases under IAS 17 have been presented within Right-of-use in 2018 figures above As at December 31, 2019, the carrying amount of property and equipment held as collateral (mainly of financial debts) amounts to USD 15,992.8 million (USD 7,091.0 million as at December 31, 2018) and USD 6,869.2 million excluding assets under IFRS 16.

Consolidated financial statements CMA CGM / 45 Year ended December 31, 2019
The net book value of the container fleet as at December 31, 2019 includes USD 2,400.9 million related to containers under IFRS 16 (USD 55.3 million as at December 31, 2018 related to finance leases).
5.2.2 Group fleet development Prepayments made to shipyards relating to owned vessels under construction are presented within “Vessels” in the consolidated statement of Financial Position and amount to USD 439.8 million as at December 31, 2019 (USD 256.1 million as at December 31, 2018). Regarding the commitments related to ordered vessels, see Note 8.3.1.
5.3 Impairment of non-financial assets As required by IAS 16 “Property, Plant and Equipment” and IAS 36 “Impairment of Assets”, the Group reviews the carrying amounts of property and equipment (see Note 5.2) and intangible assets (see Note 5.1) annually in order to assess whether there is any indication that the value of these assets might not be recoverable. If such an indication exists, the recoverable value of the asset is estimated in order to determine the amount, if any, of the impairment loss. The recoverable amount is the higher of an asset’s fair value less costs to sell and value in use. For the purposes of assessing impairment of goodwill and other assets that do not generate independent cash inflows, assets are grouped at the lowest levels for which there are separately identifiable cash inflows (cash generating units or “CGU”). The impairment tests on goodwill and intangible assets with an indefinite useful life or unavailable for use are performed annually at the CGU level, irrespective of whether there is an indication of impairment. Right-of-use assets under IFRS 16 are considered as non-financial assets. Thus, they are in the scope of IAS 36. Right-of-use assets are tested annually or when impairment indicators exist. They are assessed for impairment at Group’s CGUs level. The impairment test is performed according to the following assumptions: ▪ Right-of-use assets are included in the carrying amount of the related CGU; ▪ Lease payments are taken into account in the cash flows; and ▪ The carrying amount of the lease liabilities is deducted from the carrying amount of the CGU. Any impairment recorded on goodwill may not subsequently be reversed. Significant judgment, estimates and assumptions When value in use calculations are undertaken, management must estimate the expected future cash flows of the asset or cash-generating unit and choose a suitable discount rate and a perpetual long-term growth rate in order to calculate the present value of those cash flows. These estimates take into account certain assumptions about the global economic situation and the future growth of the container shipping industry. The main assumptions used by the Company in order to perform impairment testing of non-financial assets are the following: ▪ The level at which the assets were tested: (i) CMA CGM, is organized as a global container carrier, managing its customer base and fleet of vessels and
containers on a global basis. Large customers are dealt with centrally and assets are regularly reallocated within trades according to demand. Even though certain trades may have their own specificities, none generates cash flows independently of the others. As such, vessels, containers, goodwill and other long-term assets related to the container shipping activity are not tested individually but rather on the basis of the cash flows generated by the overall container shipping activity.
CMA CGM / 46 Consolidated financial statements Year ended December 31, 2019
(ii) As far as logistics activities are concerned, Management monitors goodwill based on two cash generating units (Freight Management and Contract Logistics). The recoverable amount of each CGU is determined based on calculating its value in use.
(iii) For terminal operations, when the Company controls the entity, the CGU correspond to each individual terminal or entity, or to a group of terminals or entities when they operate in the same geographic area and their activities are interrelated.
▪ For the container shipping activity, the cash flows used to determine the value in use are based on the
most recent business plan prepared by management, which covers a 4 or 5-year period. The container shipping industry remains volatile and pressure on freight rates and overcapacity in the global containership fleet are still a potential concern for the industry. To prepare its business plan, management considered historical data and opinions from independent shipping experts which tend to indicate that in the medium term, fleet capacity and demand will be more balanced.
▪ For logistics, the value in use is calculated by applying discounted cash flow modeling to management’s
own projections covering a five year period. Management’s projections have been prepared on the basis of strategic and performance improvement plans, knowledge of the market, performance of competitors and management’s views on achievable growth in market share and margins over the longer term.
▪ The post-tax discount rates, or Weighted Average Cost of Capital (“WACC”) , used for testing purposes
are included within the range 7%-18% (7.3%-14% in 2018) depending upon the inherent risk of each activity tested.
▪ The perpetual growth rate applied to periods subsequent to those covered by management’s business plan was generally set between 1% and 2% (1% at end of 2018 – see sensitivity analysis below).
Sensitivity of the impairment test to changes in the assumptions used in the determination of the value in use Regarding the container shipping activity: ▪ If the discount rate had been increased by 1%, the net present value of future cash flows would have been
lowered by USD 2.4 billion (USD 3.1 billion as at December 31, 2018), which would not have resulted in any impairment charge;
▪ The estimated value in use of the container shipping assets to be tested would have been approximately equal to its carrying amount if the discount rate had been increased by 4.1% (5.5% as at December 31, 2018);
▪ If the perpetual growth rate had been set at 0%, the net present value of future cash flows would have been lowered by USD 2.0 billion (USD 2.4 billion as at December 31, 2018), which would not have resulted in any impairment charge;
▪ The estimated value in use of the container shipping assets to be tested would have been approximately equal to its carrying amount if the perpetual growth rate had been decreased by 5.8% (9.4% as at December 31, 2018), i.e. negative perpetual growth rate of 4.8% (negative 8.4% as at December 31, 2018).
5.4 Working Capital Inventories - Initial recognition Inventories are initially recorded at cost. Cost represents the purchase price and any directly attributable costs. Inventories mainly relate to bunker fuel at the end of the year. Cost is determined on a first-in, first-out basis. Inventories - Write-down rules When the net realizable value of an item of inventory is less than its cost, the excess is immediately written-down in profit or loss.

Consolidated financial statements CMA CGM / 47 Year ended December 31, 2019
The amount of any reversal of any write-down of inventories, arising from an increase in net realizable value, is recognized through profit or loss so that the new carrying value is the lower of the cost and the revised net realizable value. Impairment of trade receivables According to the simplified approach allowed by IFRS 9 for trade receivables, the Group determined that the provision that would be recognized using a provision matrix based on historical and projected statistics for determining expected credit loss (ECL) on trade receivables would not be materially different from the provision accounted through the currently used methodology. Write down is measured taking into account: ▪ Customer segments that have similar loss patterns : the Group differentiates freight receivables from demurrage receivables; ▪ The receivables’ maturities in correlation with their estimated collection rate : at date, the Group fully depreciates aged receivables above one year. Individual receivable identified as risky are also depreciated when: ▪ It is probable that the receivable will not be recovered; and ▪ The amount of the loss can be reliably measured. Impairment of contract assets Contract assets are impaired following the same rules as trade receivables. Securitization of receivables The Company transfers certain receivables of certain shipping agencies by way of a securitization program. As a portion of the risks and rewards of ownership related to these trade receivables have been retained by the Group, they are not derecognized and a borrowing is recorded against the cash consideration received from the lenders (collateralized borrowing). Similarly, when the Company receives shares from the securitization vehicle either (i) as a consideration for receivables transferred during the period or (ii) as an advance consideration for receivables to be transferred in a subsequent period, the related receivables are not derecognized and maintained in the Statement of Financial Position (see Note 6.6 and Note 8.3.2). Significant estimates: Demurrage and detention receivables, accruals for port call expenses, transportation costs and handling services The amount of demurrage receivables as well as port call expenses, transportation costs and handling services are estimated on the basis of standard costs, as there can be delays between the provision of services and the receipt of the final invoices from shipping agents and customers or suppliers throughout the world (see Note 4 for revenue recognition accounting principles).
5.4.1 Inventories
As at December 31,
2019
As at December 31,
2018
Bunkers 474.2 451.7
Other inventories 69.5 78.4
Provision for obsolescence (0.8) (1.4)
Inventories 542.9 528.7
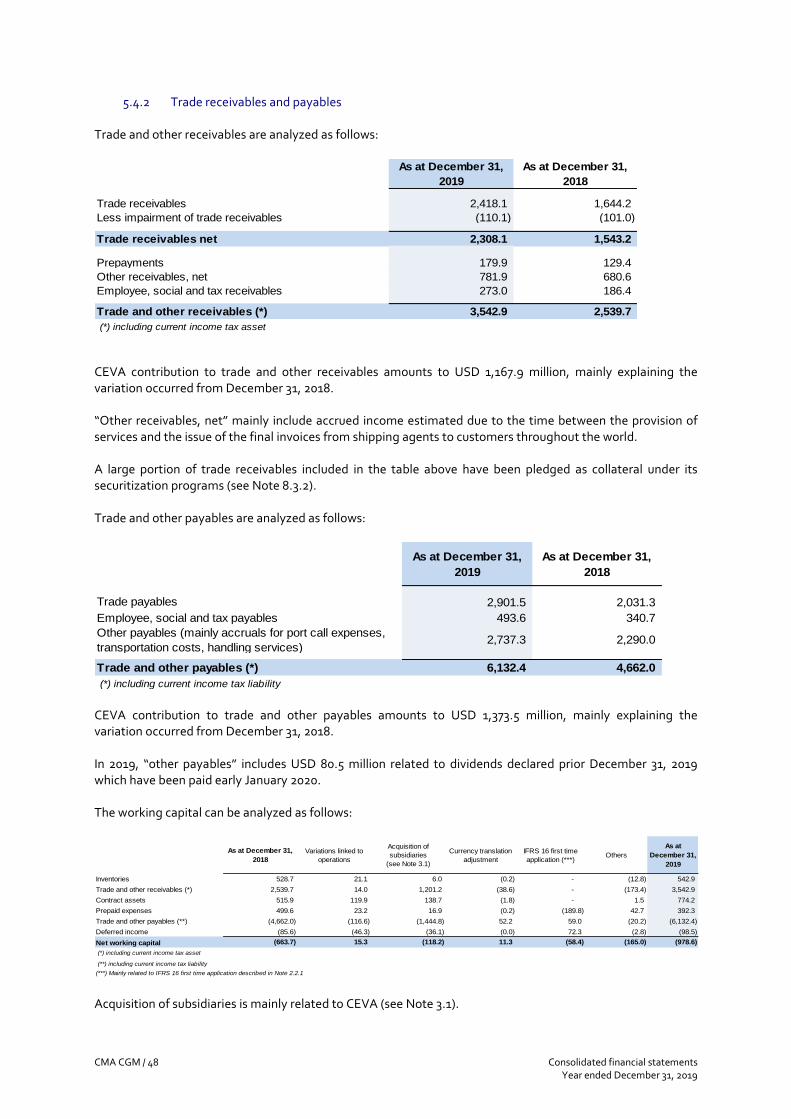
CMA CGM / 48 Consolidated financial statements Year ended December 31, 2019
5.4.2 Trade receivables and payables Trade and other receivables are analyzed as follows:
As at December 31,
2019
As at December 31,
2018
Trade receivables 2,418.1 1,644.2
Less impairment of trade receivables (110.1) (101.0)
Trade receivables net 2,308.1 1,543.2
Prepayments 179.9 129.4
Other receivables, net 781.9 680.6
Employee, social and tax receivables 273.0 186.4
Trade and other receivables (*) 3,542.9 2,539.7
(*) including current income tax asset
CEVA contribution to trade and other receivables amounts to USD 1,167.9 million, mainly explaining the variation occurred from December 31, 2018. “Other receivables, net” mainly include accrued income estimated due to the time between the provision of services and the issue of the final invoices from shipping agents to customers throughout the world. A large portion of trade receivables included in the table above have been pledged as collateral under its securitization programs (see Note 8.3.2). Trade and other payables are analyzed as follows:
As at December 31,
2019
As at December 31,
2018
Trade payables 2,901.5 2,031.3
Employee, social and tax payables 493.6 340.7
Other payables (mainly accruals for port call expenses,
transportation costs, handling services)2,737.3 2,290.0
Trade and other payables (*) 6,132.4 4,662.0
(*) including current income tax liability CEVA contribution to trade and other payables amounts to USD 1,373.5 million, mainly explaining the variation occurred from December 31, 2018. In 2019, “other payables” includes USD 80.5 million related to dividends declared prior December 31, 2019 which have been paid early January 2020. The working capital can be analyzed as follows:
As at December 31,
2018
Variations linked to
operations
Acquisition of
subsidiaries
(see Note 3.1)
Currency translation
adjustment
IFRS 16 first time
application (***)Others
As at
December 31,
2019
Inventories 528.7 21.1 6.0 (0.2) - (12.8) 542.9
Trade and other receivables (*) 2,539.7 14.0 1,201.2 (38.6) - (173.4) 3,542.9
Contract assets 515.9 119.9 138.7 (1.8) - 1.5 774.2
Prepaid expenses 499.6 23.2 16.9 (0.2) (189.8) 42.7 392.3
Trade and other payables (**) (4,662.0) (116.6) (1,444.8) 52.2 59.0 (20.2) (6,132.4)
Deferred income (85.6) (46.3) (36.1) (0.0) 72.3 (2.8) (98.5)
Net working capital (663.7) 15.3 (118.2) 11.3 (58.4) (165.0) (978.6)
(*) including current income tax asset
(**) including current income tax liability
(***) Mainly related to IFRS 16 first time application described in Note 2.2.1 Acquisition of subsidiaries is mainly related to CEVA (see Note 3.1).
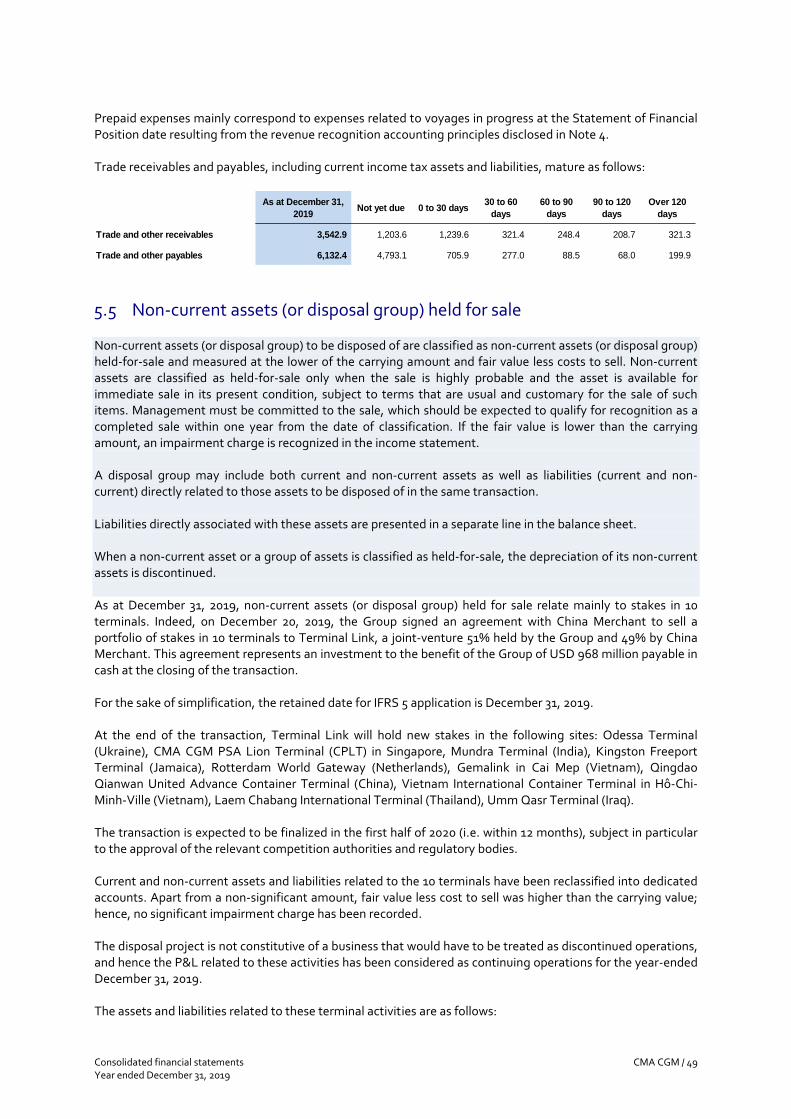
Consolidated financial statements CMA CGM / 49 Year ended December 31, 2019
Prepaid expenses mainly correspond to expenses related to voyages in progress at the Statement of Financial Position date resulting from the revenue recognition accounting principles disclosed in Note 4. Trade receivables and payables, including current income tax assets and liabilities, mature as follows:
As at December 31,
2019Not yet due 0 to 30 days
30 to 60
days
60 to 90
days
90 to 120
days
Over 120
days
Trade and other receivables 3,542.9 1,203.6 1,239.6 321.4 248.4 208.7 321.3
Trade and other payables 6,132.4 4,793.1 705.9 277.0 88.5 68.0 199.9
5.5 Non-current assets (or disposal group) held for sale
Non‐current assets (or disposal group) to be disposed of are classified as non-current assets (or disposal group) held‐for‐sale and measured at the lower of the carrying amount and fair value less costs to sell. Non‐current assets are classified as held‐for‐sale only when the sale is highly probable and the asset is available for immediate sale in its present condition, subject to terms that are usual and customary for the sale of such items. Management must be committed to the sale, which should be expected to qualify for recognition as a completed sale within one year from the date of classification. If the fair value is lower than the carrying amount, an impairment charge is recognized in the income statement. A disposal group may include both current and non-current assets as well as liabilities (current and non-current) directly related to those assets to be disposed of in the same transaction. Liabilities directly associated with these assets are presented in a separate line in the balance sheet. When a non‐current asset or a group of assets is classified as held‐for‐sale, the depreciation of its non‐current assets is discontinued. As at December 31, 2019, non-current assets (or disposal group) held for sale relate mainly to stakes in 10 terminals. Indeed, on December 20, 2019, the Group signed an agreement with China Merchant to sell a portfolio of stakes in 10 terminals to Terminal Link, a joint-venture 51% held by the Group and 49% by China Merchant. This agreement represents an investment to the benefit of the Group of USD 968 million payable in cash at the closing of the transaction. For the sake of simplification, the retained date for IFRS 5 application is December 31, 2019. At the end of the transaction, Terminal Link will hold new stakes in the following sites: Odessa Terminal (Ukraine), CMA CGM PSA Lion Terminal (CPLT) in Singapore, Mundra Terminal (India), Kingston Freeport Terminal (Jamaica), Rotterdam World Gateway (Netherlands), Gemalink in Cai Mep (Vietnam), Qingdao Qianwan United Advance Container Terminal (China), Vietnam International Container Terminal in Hô-Chi-Minh-Ville (Vietnam), Laem Chabang International Terminal (Thailand), Umm Qasr Terminal (Iraq). The transaction is expected to be finalized in the first half of 2020 (i.e. within 12 months), subject in particular to the approval of the relevant competition authorities and regulatory bodies. Current and non-current assets and liabilities related to the 10 terminals have been reclassified into dedicated accounts. Apart from a non-significant amount, fair value less cost to sell was higher than the carrying value; hence, no significant impairment charge has been recorded. The disposal project is not constitutive of a business that would have to be treated as discontinued operations, and hence the P&L related to these activities has been considered as continuing operations for the year-ended December 31, 2019. The assets and liabilities related to these terminal activities are as follows:
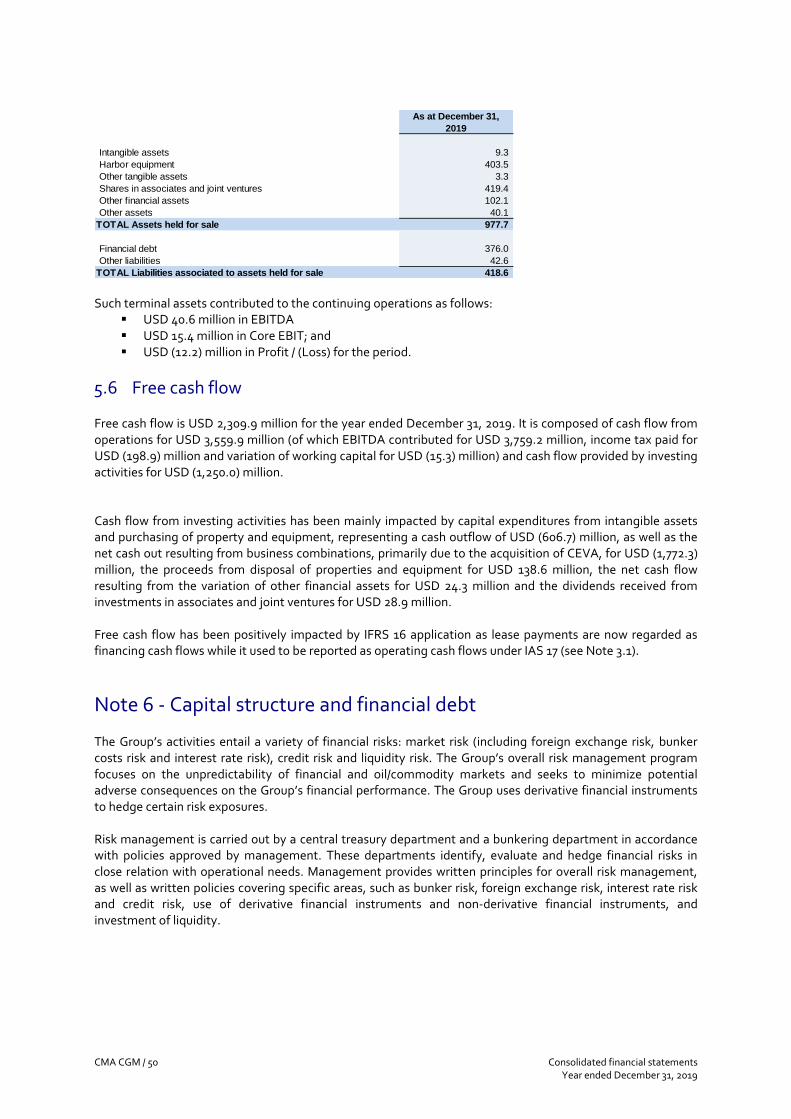
CMA CGM / 50 Consolidated financial statements Year ended December 31, 2019
As at December 31,
2019
Intangible assets 9.3
Harbor equipment 403.5
Other tangible assets 3.3
Shares in associates and joint ventures 419.4
Other financial assets 102.1
Other assets 40.1
TOTAL Assets held for sale 977.7
Financial debt 376.0
Other liabilities 42.6
TOTAL Liabilities associated to assets held for sale 418.6 Such terminal assets contributed to the continuing operations as follows:
▪ USD 40.6 million in EBITDA ▪ USD 15.4 million in Core EBIT; and ▪ USD (12.2) million in Profit / (Loss) for the period.
5.6 Free cash flow Free cash flow is USD 2,309.9 million for the year ended December 31, 2019. It is composed of cash flow from operations for USD 3,559.9 million (of which EBITDA contributed for USD 3,759.2 million, income tax paid for USD (198.9) million and variation of working capital for USD (15.3) million) and cash flow provided by investing activities for USD (1,250.0) million. Cash flow from investing activities has been mainly impacted by capital expenditures from intangible assets and purchasing of property and equipment, representing a cash outflow of USD (606.7) million, as well as the net cash out resulting from business combinations, primarily due to the acquisition of CEVA, for USD (1,772.3) million, the proceeds from disposal of properties and equipment for USD 138.6 million, the net cash flow resulting from the variation of other financial assets for USD 24.3 million and the dividends received from investments in associates and joint ventures for USD 28.9 million. Free cash flow has been positively impacted by IFRS 16 application as lease payments are now regarded as financing cash flows while it used to be reported as operating cash flows under IAS 17 (see Note 3.1).
Note 6 - Capital structure and financial debt The Group’s activities entail a variety of financial risks: market risk (including foreign exchange risk, bunker costs risk and interest rate risk), credit risk and liquidity risk. The Group’s overall risk management program focuses on the unpredictability of financial and oil/commodity markets and seeks to minimize potential adverse consequences on the Group’s financial performance. The Group uses derivative financial instruments to hedge certain risk exposures. Risk management is carried out by a central treasury department and a bunkering department in accordance with policies approved by management. These departments identify, evaluate and hedge financial risks in close relation with operational needs. Management provides written principles for overall risk management, as well as written policies covering specific areas, such as bunker risk, foreign exchange risk, interest rate risk and credit risk, use of derivative financial instruments and non-derivative financial instruments, and investment of liquidity.

Consolidated financial statements CMA CGM / 51 Year ended December 31, 2019
6.1 Financial risk management objectives & policies
6.1.1 Market risk Bunker costs risk The Group seeks to apply bunker surcharges (Bunker Adjustment Factor “BAF”) in addition to freight rates to compensate for fluctuations in the price of fuel. The Group’s risk management policy is also to hedge through fixed price forward contracts. The analyzes of the exposure to price fluctuations is performed on a continual basis. The fuel prices over the last three years are as follows:
Market data as at : 2019 2018 2017 2019 2018 2017
Nymex WTI (1st nearby, in $ per barrel) * 61.06 45.41 60.42 57.04 64.90 50.85
Brent (1st nearby, in $ per barrel) * 66.00 53.80 66.44 64.16 71.79 54.74
* Based on the future contract maturing at the closest maturity on each considered date
Closing rate Average rate
As at December 31, 2019, the Company hedged approximately 0.8% of expected purchase of bunkers for the next year through a forward fixed price with delivery (10.0% of expected purchase for the year 2019 as at December 31, 2018). These bunker purchases are treated as executory contracts. As at December 31, 2019, the Group has no outstanding derivative financial instruments relating to bunker cost hedging (USD 1.7 million as at December 31, 2018), other than the contracts accounted as executory contracts (“own use”). Based on the fuel consumption for the year ended December 31, 2019, an increase of the fuel prices by USD 10 (in USD per ton) would have had a negative impact on the Statement of Profit & Loss of approximately USD 78.0 million, excluding any effect on the BAF mechanism mentioned above as well as any other correlation with freight prices. Foreign exchange risk The Group operates internationally and is exposed to foreign exchange risk arising from various currency exposures. The functional currency of the Group being the U.S. Dollar, the Company is primarily exposed to the Euro currency fluctuations regarding its operational and financing transactions. Transactional currency exposure risks arise from sales or purchases by an operating unit in a currency other than the Group’s functional currency. The Company may conclude certain derivative transactions to hedge specific risks. The Group’s exposure to the transaction currencies, taking into account the effect of hedges, can be presented as follows:
As at December 31, 2019Carrying
amountUSD EUR CNY GBP Others
Trade receivables and prepaid expenses 3,872.0 2,360.0 477.4 86.3 74.3 873.9
Cash and cash equivalents and securities 1,750.8 935.6 320.8 41.8 6.7 445.9
Trade payables and current deferred income 6,135.6 4,125.0 946.7 125.2 81.0 858.4
Borrowings 19,514.1 14,694.3 4,066.4 16.9 62.1 674.4
This exposure is mitigated to a certain extent by the currency mix of operating revenues and expenses.

CMA CGM / 52 Consolidated financial statements Year ended December 31, 2019
Cash Flow Interest rate risk The evolution of short-term USD rates is as follows:
Market data: 2019 2018 2017 2019 2018 2017
LIBOR USD 3 M 1.91% 2.81% 1.69% 2.33% 2.31% 1.26%
Closing rate as at December 31, Annual average rate
The Group’s interest rate risk mainly arises from borrowings. The Company has borrowings (including obligations under capital leases) issued at variable rates (USD Libor) that expose the Company to a cash flow interest rate risk. As at December 31, 2019, taking into account the interest rate hedges, the borrowings bearing interest at variable rates represent 33% of total debts 67% at fixed rates. The table below presents the fair value of the Group’s interest rate derivatives in relevant maturity groupings based on the remaining period, from the Statement of Financial Position date to the contractual maturity date:
As at December 31, 2019
Interest swaps- cash flow hedge 403.5 380.4 23.1 (1.4)
Interest swaps - not qualifying for cash flow hedge 38.3 38.3 - (0.1)
Cross currency interest rates swaps - fair value hedge 385.1 131.2 253.9 (37.9)
Cross currency interest rates swaps - cash flow hedge 995.7 995.7 - (50.8)
FX Forward Contracts - Cashflow Hedges 296.0 296.0 - 3.5
Total 1,822.6 1,545.6 277.0 (86.6)
Nominal amountFair value of
derivatives
Maturity
Less than 5
years
More than 5
years
The following table presents the sensitivity of the Group’s profit before tax and of the Cash Flow reserve as at December 31, 2019 to a possible change in interest rates, assuming no change in other parameters:
Balance Sheet
impact
Change in fair
value of
derivatives
Interest
expenses *
Cash Flow
Reserve
U.S Dollar +100 bps (6.2) 1.1 4.6
U.S Dollar -100 bps (5.1) 0.4 (9.0)
* excluding the effect on underlying hedged transactions
Income Statement impact
6.1.2 Credit risk The Group trades with large, recognized, creditworthy third parties and also with a very large number of smaller customers for which prepayments are often required. Trade receivables and third party agents outstanding balances are monitored on an ongoing basis with the result that the Group’s exposure to bad debt is not significant (bad debts represent 0.5% of revenue in 2019 and 0.4% of revenue in 2018). Because of the large customer base, the Group has no significant concentration of credit risk. No customer represents more than 5% of Group revenue. Counterparties for transactions on derivatives are limited to high-credit-quality financial institutions. The Group has policies that limit its exposure to credit risk towards financial institutions when dealing derivative financial instruments.
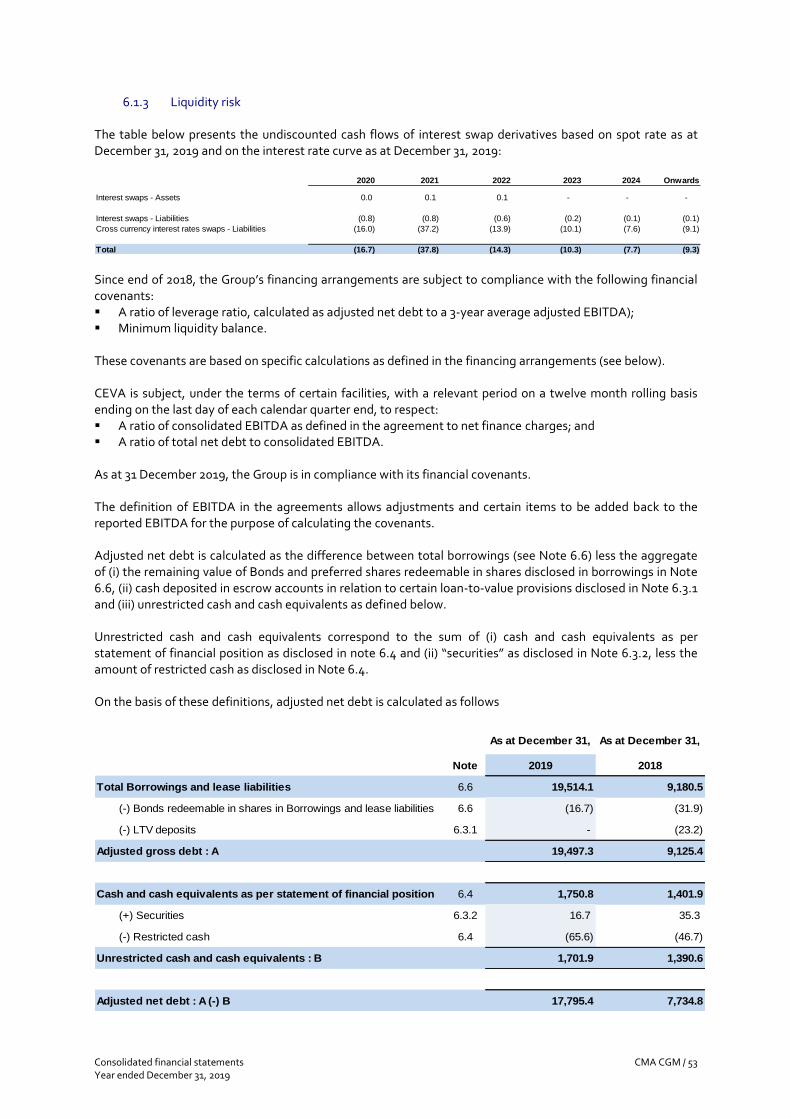
Consolidated financial statements CMA CGM / 53 Year ended December 31, 2019
6.1.3 Liquidity risk The table below presents the undiscounted cash flows of interest swap derivatives based on spot rate as at December 31, 2019 and on the interest rate curve as at December 31, 2019:
2020 2021 2022 2023 2024 Onwards
Interest swaps - Assets 0.0 0.1 0.1 - - -
Interest swaps - Liabilities (0.8) (0.8) (0.6) (0.2) (0.1) (0.1)
Cross currency interest rates swaps - Liabilities (16.0) (37.2) (13.9) (10.1) (7.6) (9.1)
Total (16.7) (37.8) (14.3) (10.3) (7.7) (9.3) Since end of 2018, the Group’s financing arrangements are subject to compliance with the following financial covenants: ▪ A ratio of leverage ratio, calculated as adjusted net debt to a 3-year average adjusted EBITDA); ▪ Minimum liquidity balance. These covenants are based on specific calculations as defined in the financing arrangements (see below). CEVA is subject, under the terms of certain facilities, with a relevant period on a twelve month rolling basis ending on the last day of each calendar quarter end, to respect: ▪ A ratio of consolidated EBITDA as defined in the agreement to net finance charges; and ▪ A ratio of total net debt to consolidated EBITDA. As at 31 December 2019, the Group is in compliance with its financial covenants. The definition of EBITDA in the agreements allows adjustments and certain items to be added back to the reported EBITDA for the purpose of calculating the covenants. Adjusted net debt is calculated as the difference between total borrowings (see Note 6.6) less the aggregate of (i) the remaining value of Bonds and preferred shares redeemable in shares disclosed in borrowings in Note 6.6, (ii) cash deposited in escrow accounts in relation to certain loan-to-value provisions disclosed in Note 6.3.1 and (iii) unrestricted cash and cash equivalents as defined below. Unrestricted cash and cash equivalents correspond to the sum of (i) cash and cash equivalents as per statement of financial position as disclosed in note 6.4 and (ii) “securities” as disclosed in Note 6.3.2, less the amount of restricted cash as disclosed in Note 6.4. On the basis of these definitions, adjusted net debt is calculated as follows
As at December 31, As at December 31,
Note 2019 2018
Total Borrowings and lease liabilities 6.6 19,514.1 9,180.5
(-) Bonds redeemable in shares in Borrowings and lease liabilities 6.6 (16.7) (31.9)
(-) LTV deposits 6.3.1 - (23.2)
Adjusted gross debt : A 19,497.3 9,125.4
Cash and cash equivalents as per statement of financial position 6.4 1,750.8 1,401.9
(+) Securities 6.3.2 16.7 35.3
(-) Restricted cash 6.4 (65.6) (46.7)
Unrestricted cash and cash equivalents : B 1,701.9 1,390.6
Adjusted net debt : A (-) B 17,795.4 7,734.8
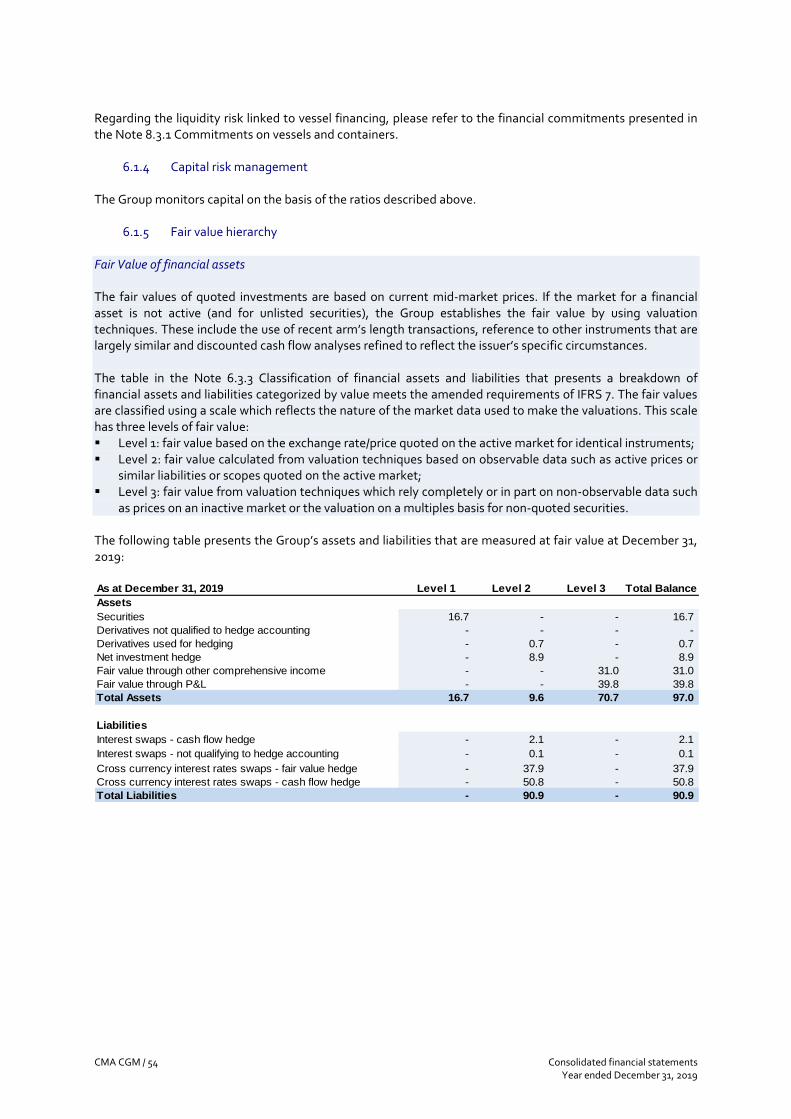
CMA CGM / 54 Consolidated financial statements Year ended December 31, 2019
Regarding the liquidity risk linked to vessel financing, please refer to the financial commitments presented in the Note 8.3.1 Commitments on vessels and containers.
6.1.4 Capital risk management The Group monitors capital on the basis of the ratios described above.
6.1.5 Fair value hierarchy Fair Value of financial assets The fair values of quoted investments are based on current mid-market prices. If the market for a financial asset is not active (and for unlisted securities), the Group establishes the fair value by using valuation techniques. These include the use of recent arm’s length transactions, reference to other instruments that are largely similar and discounted cash flow analyses refined to reflect the issuer’s specific circumstances. The table in the Note 6.3.3 Classification of financial assets and liabilities that presents a breakdown of financial assets and liabilities categorized by value meets the amended requirements of IFRS 7. The fair values are classified using a scale which reflects the nature of the market data used to make the valuations. This scale has three levels of fair value: ▪ Level 1: fair value based on the exchange rate/price quoted on the active market for identical instruments; ▪ Level 2: fair value calculated from valuation techniques based on observable data such as active prices or
similar liabilities or scopes quoted on the active market; ▪ Level 3: fair value from valuation techniques which rely completely or in part on non-observable data such
as prices on an inactive market or the valuation on a multiples basis for non-quoted securities. The following table presents the Group’s assets and liabilities that are measured at fair value at December 31, 2019: As at December 31, 2019 Level 1 Level 2 Level 3 Total Balance
Assets
Securities 16.7 - - 16.7
Derivatives not qualified to hedge accounting - - - -
Derivatives used for hedging - 0.7 - 0.7
Net investment hedge - 8.9 - 8.9
Fair value through other comprehensive income - - 31.0 31.0
Fair value through P&L - - 39.8 39.8
Total Assets 16.7 9.6 70.7 97.0
Liabilities
Interest swaps - cash flow hedge - 2.1 - 2.1
Interest swaps - not qualifying to hedge accounting - 0.1 - 0.1
Cross currency interest rates swaps - fair value hedge - 37.9 - 37.9
Cross currency interest rates swaps - cash flow hedge - 50.8 - 50.8
Total Liabilities - 90.9 - 90.9
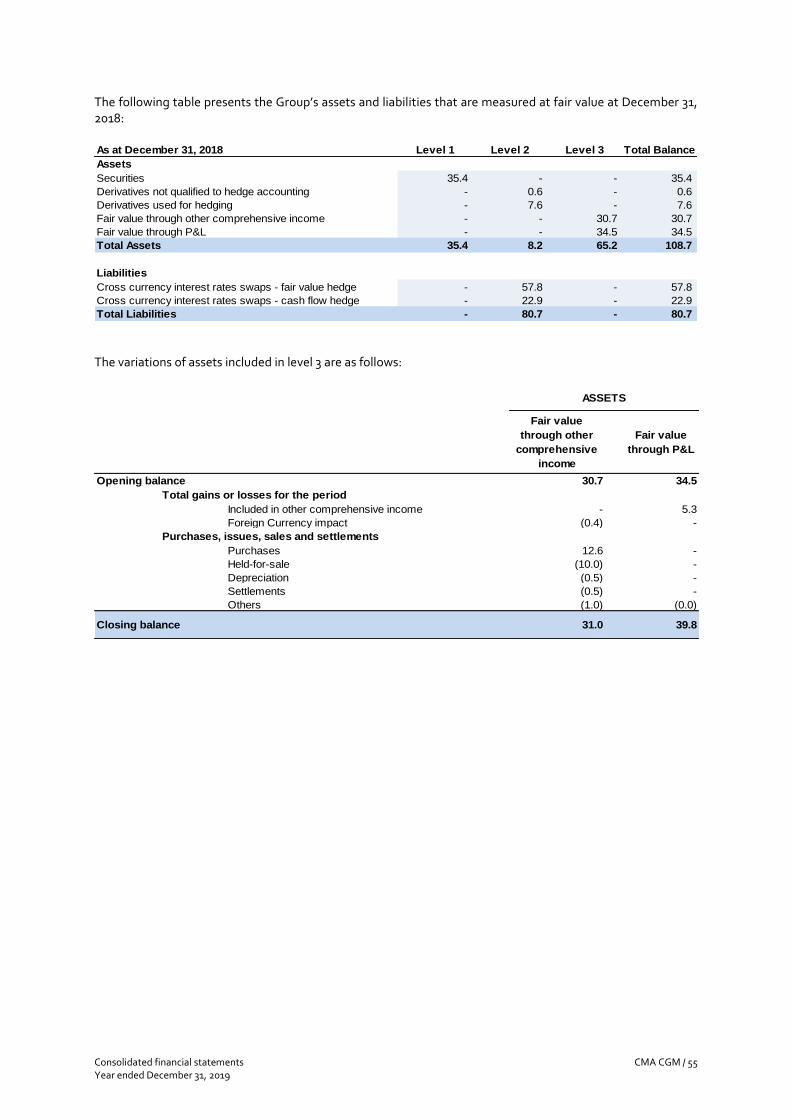
Consolidated financial statements CMA CGM / 55 Year ended December 31, 2019
The following table presents the Group’s assets and liabilities that are measured at fair value at December 31, 2018: As at December 31, 2018 Level 1 Level 2 Level 3 Total Balance
Assets
Securities 35.4 - - 35.4
Derivatives not qualified to hedge accounting - 0.6 - 0.6
Derivatives used for hedging - 7.6 - 7.6
Fair value through other comprehensive income - - 30.7 30.7
Fair value through P&L - - 34.5 34.5
Total Assets 35.4 8.2 65.2 108.7
Liabilities
Cross currency interest rates swaps - fair value hedge - 57.8 - 57.8
Cross currency interest rates swaps - cash flow hedge - 22.9 - 22.9
Total Liabilities - 80.7 - 80.7 The variations of assets included in level 3 are as follows:
Fair value
through other
comprehensive
income
Fair value
through P&L
30.7 34.5
Included in other comprehensive income - 5.3
Foreign Currency impact (0.4) -
Purchases 12.6 -
Held-for-sale (10.0) -
Depreciation (0.5) -
Settlements (0.5) -
Others (1.0) (0.0)
Closing balance 31.0 39.8
Total gains or losses for the period
Purchases, issues, sales and settlements
ASSETS
Opening balance
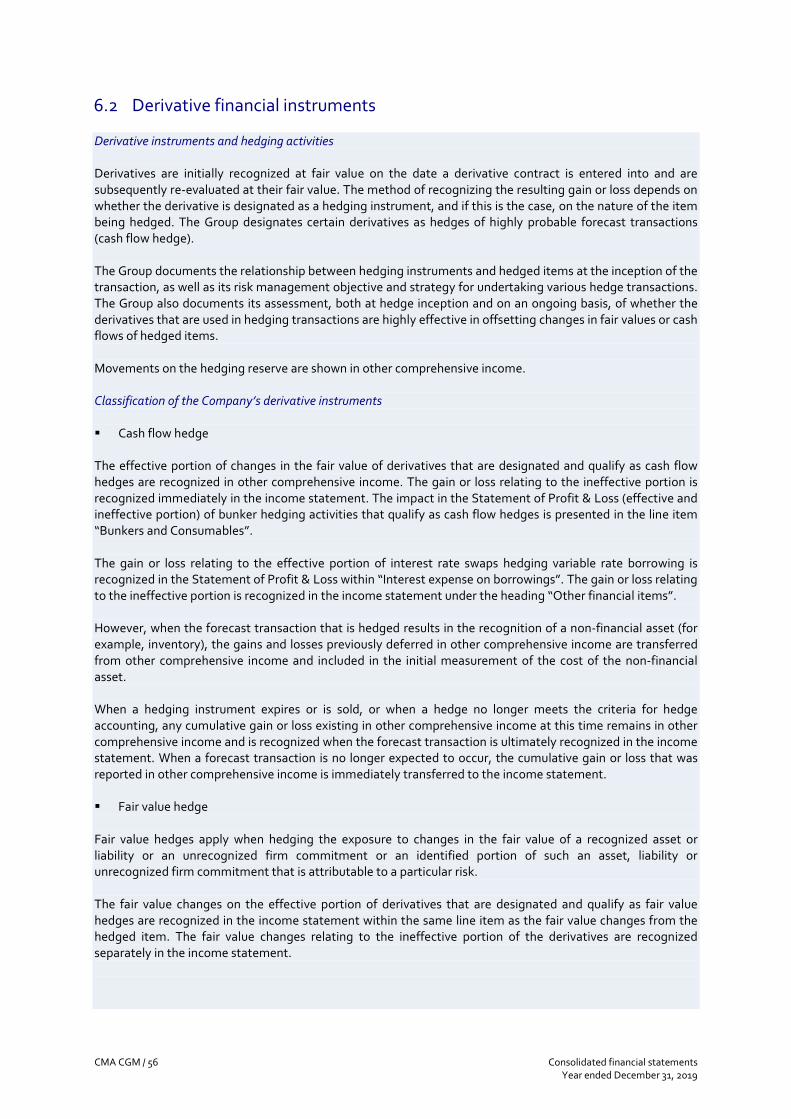
CMA CGM / 56 Consolidated financial statements Year ended December 31, 2019
6.2 Derivative financial instruments Derivative instruments and hedging activities Derivatives are initially recognized at fair value on the date a derivative contract is entered into and are subsequently re-evaluated at their fair value. The method of recognizing the resulting gain or loss depends on whether the derivative is designated as a hedging instrument, and if this is the case, on the nature of the item being hedged. The Group designates certain derivatives as hedges of highly probable forecast transactions (cash flow hedge). The Group documents the relationship between hedging instruments and hedged items at the inception of the transaction, as well as its risk management objective and strategy for undertaking various hedge transactions. The Group also documents its assessment, both at hedge inception and on an ongoing basis, of whether the derivatives that are used in hedging transactions are highly effective in offsetting changes in fair values or cash flows of hedged items. Movements on the hedging reserve are shown in other comprehensive income. Classification of the Company’s derivative instruments ▪ Cash flow hedge The effective portion of changes in the fair value of derivatives that are designated and qualify as cash flow hedges are recognized in other comprehensive income. The gain or loss relating to the ineffective portion is recognized immediately in the income statement. The impact in the Statement of Profit & Loss (effective and ineffective portion) of bunker hedging activities that qualify as cash flow hedges is presented in the line item “Bunkers and Consumables”. The gain or loss relating to the effective portion of interest rate swaps hedging variable rate borrowing is recognized in the Statement of Profit & Loss within “Interest expense on borrowings”. The gain or loss relating to the ineffective portion is recognized in the income statement under the heading “Other financial items”. However, when the forecast transaction that is hedged results in the recognition of a non-financial asset (for example, inventory), the gains and losses previously deferred in other comprehensive income are transferred from other comprehensive income and included in the initial measurement of the cost of the non-financial asset. When a hedging instrument expires or is sold, or when a hedge no longer meets the criteria for hedge accounting, any cumulative gain or loss existing in other comprehensive income at this time remains in other comprehensive income and is recognized when the forecast transaction is ultimately recognized in the income statement. When a forecast transaction is no longer expected to occur, the cumulative gain or loss that was reported in other comprehensive income is immediately transferred to the income statement. ▪ Fair value hedge Fair value hedges apply when hedging the exposure to changes in the fair value of a recognized asset or liability or an unrecognized firm commitment or an identified portion of such an asset, liability or unrecognized firm commitment that is attributable to a particular risk. The fair value changes on the effective portion of derivatives that are designated and qualify as fair value hedges are recognized in the income statement within the same line item as the fair value changes from the hedged item. The fair value changes relating to the ineffective portion of the derivatives are recognized separately in the income statement.

Consolidated financial statements CMA CGM / 57 Year ended December 31, 2019
▪ Derivatives that do not qualify for hedge accounting Certain derivative instruments do not qualify for hedge accounting. Such derivatives are classified as assets or liabilities at fair value through profit and loss, and changes in the fair value of any derivative instruments that do not qualify for hedge accounting are recognized immediately in the income statement. The impact in the Statement of Profit & Loss of such derivatives is presented in the line item “Other financial items”. ▪ Net investment hedge Hedges of net investments in foreign operations are accounted for similarly to cash flow hedges. Any gain or loss on the hedging instrument relating to the effective portion of the hedge is recognized in other comprehensive income; the gain or loss relating to the ineffective portion is recognized immediately in the income statement. Gains and losses accumulated in other comprehensive income are included in the income statement when the foreign operation is disposed of.
6.2.1 Derivative financial instruments Derivative financial instruments can be analyzed as follows :
Assets Liabilities Assets Liabilities
Interest swaps - cash flow hedge 0.7 2.1 7.6 -
Interest swaps - not qualifying to hedge accounting - 0.1 0.6 -
Bunker hedge - cash flow hedge - - - 1.7
Cross currency interest rates swaps - fair value hedge - 37.9 - 57.8
Cross currency interest rates swaps - cash flow hedge - 50.8 - 22.9
Net Investment hedge 8.9 - - -
Currency forward contracts - not qualifying to hedge
accounting- - 3.4 0.8
FX Forward Contracts - Cashflow Hedges 3.5 - - -
Total derivative financial instruments 13.1 90.9 11.6 83.3
of which non-current portion (greater than 1 year) 0.7 62.1 6.0 80.7
of which current portion (less than 1 year) 12.4 28.8 5.6 2.6
As at December 31,
2018
As at December 31,
2019
As at December 31, 2019 and December 31, 2018, the Company did not record any transfer between derivative financial instruments’ categories.
6.2.2 Net investment hedge A foreign currency exposure arises from the Group’s net investment in certain subsidiaries, associates or joint ventures with a euro functional currency. The risk arises from the fluctuation in spot exchange rates between the Euro and the US Dollar, which causes the amount of the net investment to vary. The hedged risk in the net investment hedge is the risk of a weakening euro against the US dollar that will result in a reduction in the carrying amount of the Group’s net investment in the euro investees. To assess hedge effectiveness, the Group determines the economic relationship between the hedging instrument and the hedged item by comparing changes in the carrying amount of the debt that is attributable to a change in the spot rate with changes in the investment in the foreign operation due to movements in the spot rate.
CMA CGM / 58 Consolidated financial statements Year ended December 31, 2019
Part of the Group’s net investment in its euro investees is hedged by certain Euro denominated senior notes, which mitigates the foreign currency exposure arising from the investee’s net assets. A portion of the euro loan has been designated as a hedging instrument for the changes in the value of the net investment that is attributable to changes in the EUR/USD exchange rates. The amount of the change in the value of the Senior Notes that has been recognized in OCI to offset the currency translation adjustment of the foreign operation amounts to USD (12.3) million for the year ended December 31, 2019 (USD 21.3 million for the year ended December 31, 2018). In addition, FX derivatives have been recognized as NIH instruments within CEVA, for an amount of USD 8.9 million.
6.3 Other non-current financial assets - Securities and other current financial assets
The Group classifies its financial assets in the following categories, depending on their nature (i.e. their contractual cash flow characteristics) and how they are managed (i.e. the Group business model used for managing these financial assets): Financial assets subsequently measured at amortized cost
These financial assets are initially recognized at fair value plus directly attributable costs. They are classified as subsequently measured at amortised cost if they meet both of the following criteria: ▪ The asset is held within a business model whose objective is to hold the financial asset in order to collect
contractual cash flows; and ▪ The contractual terms of the financial asset give rise to cash flows that are solely payments of principal
and interest (SPPI) on the principal amount outstanding on a specified date. Amortized cost is determined using the effective interest method, less impairment. Financial assets subsequently measured at fair value through other comprehensive income These financial assets are initially recognized at fair value plus directly attributable costs. They are classified as subsequently measured at fair value through other comprehensive income (FVOCI) if they meet both of the following criteria: ▪ The asset is held within a business model whose objective is achieved by both holding the financial asset
in order to collect contractual cash flows and selling the financial asset; and ▪ The contractual terms of the financial asset give rise on specified dates to cash flows that are solely
payments of principal and interest(SPPI) on the principal amount outstanding. The business model mentioned as first criteria involves greater frequency and volume of sales than the business model used for financial assets measured at amortized cost. Integral to this business model is an intention to sell the instrument before the investment matures. Financial assets subsequently measured at fair value through profit or loss These financial assets are initially recognized at fair value excluding directly attributable costs that are immediately recognized in profit and loss. These financial assets are classified and measured at Fair value through profit or loss (FVTPL) if: ▪ The asset is held within a business model that does not correspond to the business model used to classify
financial assets at amortized cost or at fair value through other comprehensive income; and
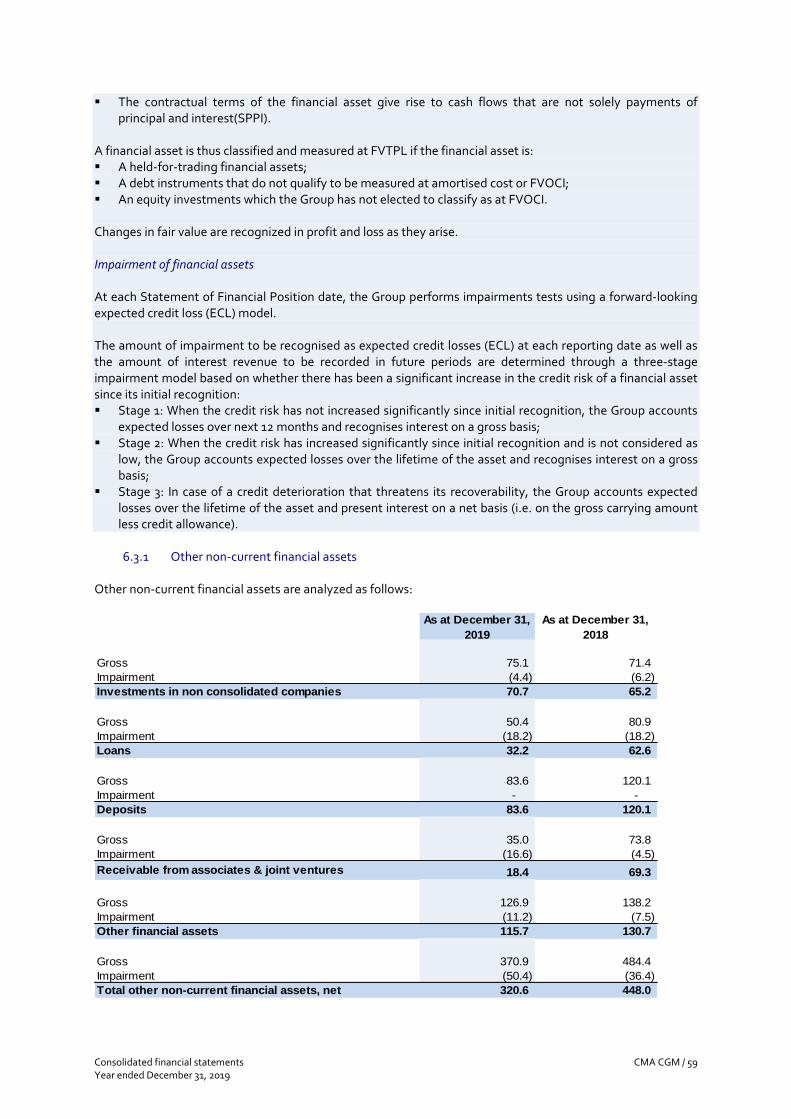
Consolidated financial statements CMA CGM / 59 Year ended December 31, 2019
▪ The contractual terms of the financial asset give rise to cash flows that are not solely payments of principal and interest(SPPI).
A financial asset is thus classified and measured at FVTPL if the financial asset is: ▪ A held-for-trading financial assets; ▪ A debt instruments that do not qualify to be measured at amortised cost or FVOCI; ▪ An equity investments which the Group has not elected to classify as at FVOCI. Changes in fair value are recognized in profit and loss as they arise. Impairment of financial assets At each Statement of Financial Position date, the Group performs impairments tests using a forward-looking expected credit loss (ECL) model. The amount of impairment to be recognised as expected credit losses (ECL) at each reporting date as well as the amount of interest revenue to be recorded in future periods are determined through a three-stage impairment model based on whether there has been a significant increase in the credit risk of a financial asset since its initial recognition: ▪ Stage 1: When the credit risk has not increased significantly since initial recognition, the Group accounts
expected losses over next 12 months and recognises interest on a gross basis; ▪ Stage 2: When the credit risk has increased significantly since initial recognition and is not considered as
low, the Group accounts expected losses over the lifetime of the asset and recognises interest on a gross basis;
▪ Stage 3: In case of a credit deterioration that threatens its recoverability, the Group accounts expected losses over the lifetime of the asset and present interest on a net basis (i.e. on the gross carrying amount less credit allowance).
6.3.1 Other non-current financial assets
Other non-current financial assets are analyzed as follows:
As at December 31,
2019
As at December 31,
2018
Gross 75.1 71.4
Impairment (4.4) (6.2)
Investments in non consolidated companies 70.7 65.2
Gross 50.4 80.9
Impairment (18.2) (18.2)
Loans 32.2 62.6
Gross 83.6 120.1
Impairment - -
Deposits 83.6 120.1
Gross 35.0 73.8
Impairment (16.6) (4.5)
Receivable from associates & joint ventures 18.4 69.3
Gross 126.9 138.2
Impairment (11.2) (7.5)
Other financial assets 115.7 130.7
Gross 370.9 484.4
Impairment (50.4) (36.4)
Total other non-current financial assets, net 320.6 448.0

CMA CGM / 60 Consolidated financial statements Year ended December 31, 2019
Change in other non-current financial assets is presented within “Cash flow resulting from other financial assets” in the consolidated statement of cash flows. Investments in non-consolidated companies “Investments in non-consolidated companies” mainly relate to various stakes individually not significant, classified either as assets at fair value through P&L or as assets at fair value through OCI (see Note 6.1.5). Loans and receivables from associates and joint ventures “Loans” and “receivables from associates and joint ventures” mainly relate to funds borrowed by certain terminal joint ventures. Deposits
“Deposits” correspond to USD 83.6 million of cash deposits which do not qualify as cash and cash equivalents as at December 31, 2019 (USD 120.1 million as at December 31, 2018).
Other financial assets As at December 31, 2019, “Other financial assets” mainly include USD 115.7 million (USD 130.7 million as at December 31, 2018) of financial tax benefit to be received at the maturity of the tax financing period.
6.3.2 Securities and other current financial assets “Securities and other current financial assets” as at December 31, 2019 include securities at fair value for an amount of USD 16.7 million (USD 35.3 million as at December 31, 2018). As part of the freight securitization program, an amount of USD 21.9 million is deposited as a collateral of the amount drawn under the facility. Apart from the above, other current financial assets mainly include (i) the current portion of the financial assets, (ii) some short term loans to joint-ventures or associates, (iii) as well as certain cash deposits which do not qualify as cash and cash equivalents since their inception.
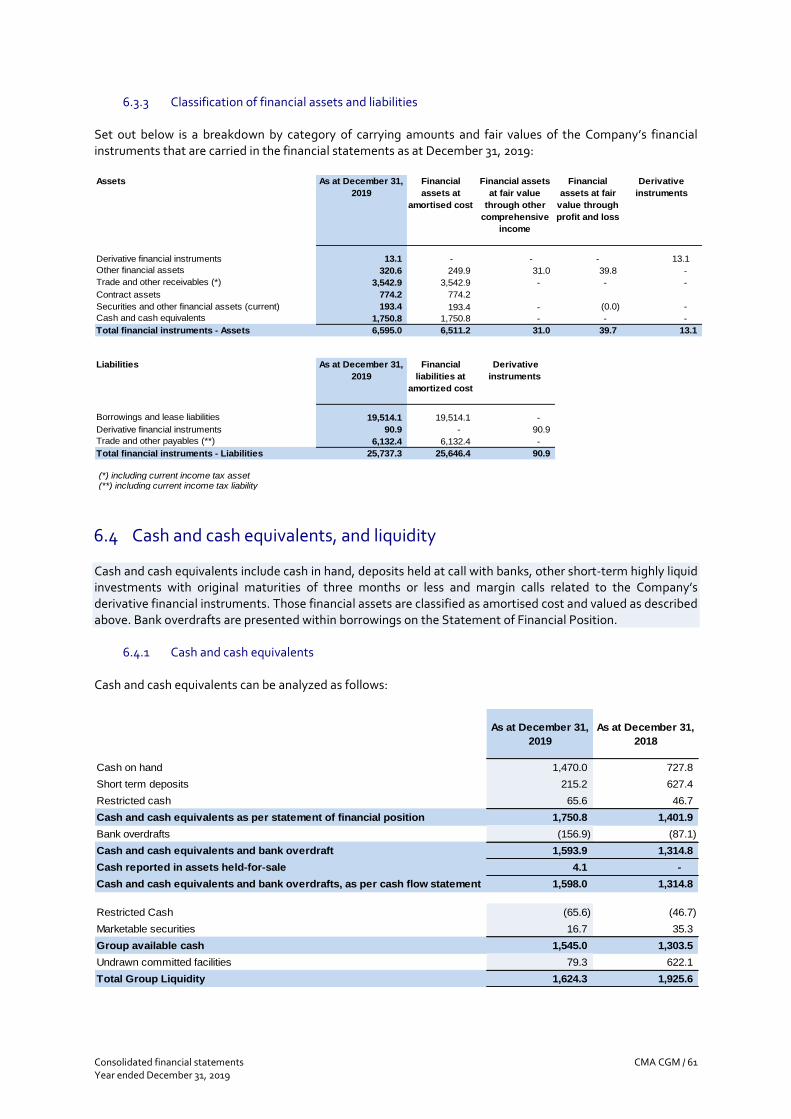
Consolidated financial statements CMA CGM / 61 Year ended December 31, 2019
6.3.3 Classification of financial assets and liabilities Set out below is a breakdown by category of carrying amounts and fair values of the Company’s financial instruments that are carried in the financial statements as at December 31, 2019: Assets As at December 31,
2019
Financial
assets at
amortised cost
Financial assets
at fair value
through other
comprehensive
income
Financial
assets at fair
value through
profit and loss
Derivative
instruments
Derivative financial instruments 13.1 - - - 13.1
Other financial assets 320.6 249.9 31.0 39.8 -
Trade and other receivables (*) 3,542.9 3,542.9 - - -
Contract assets 774.2 774.2
Securities and other financial assets (current) 193.4 193.4 - (0.0) -
Cash and cash equivalents 1,750.8 1,750.8 - - -
Total financial instruments - Assets 6,595.0 6,511.2 31.0 39.7 13.1
Liabilities As at December 31,
2019
Financial
liabilities at
amortized cost
Derivative
instruments
Borrowings and lease liabilities 19,514.1 19,514.1 -
Derivative financial instruments 90.9 - 90.9
Trade and other payables (**) 6,132.4 6,132.4 -
Total financial instruments - Liabilities 25,737.3 25,646.4 90.9
(*) including current income tax asset (**) including current income tax liability
6.4 Cash and cash equivalents, and liquidity Cash and cash equivalents include cash in hand, deposits held at call with banks, other short-term highly liquid investments with original maturities of three months or less and margin calls related to the Company’s derivative financial instruments. Those financial assets are classified as amortised cost and valued as described above. Bank overdrafts are presented within borrowings on the Statement of Financial Position.
6.4.1 Cash and cash equivalents Cash and cash equivalents can be analyzed as follows:
As at December 31,
2019
As at December 31,
2018
Cash on hand 1,470.0 727.8
Short term deposits 215.2 627.4
Restricted cash 65.6 46.7
Cash and cash equivalents as per statement of financial position 1,750.8 1,401.9
Bank overdrafts (156.9) (87.1)
Cash and cash equivalents and bank overdraft 1,593.9 1,314.8
Cash reported in assets held-for-sale 4.1 -
Cash and cash equivalents and bank overdrafts, as per cash flow statement 1,598.0 1,314.8
Restricted Cash (65.6) (46.7)
Marketable securities 16.7 35.3
Group available cash 1,545.0 1,303.5
Undrawn committed facilities 79.3 622.1
Total Group Liquidity 1,624.3 1,925.6
CMA CGM / 62 Consolidated financial statements Year ended December 31, 2019
6.4.2 Undrawn committed credit facilities and liquidity position As at December 31, 2019, the Group has access to undrawn committed credit facilities amounting to USD 79.3 million (USD 622.1 million as at December 31, 2018) granted by various financial institutions. As at December 31, 2019, CEVA contributes to cash and cash equivalents and Group liquidity position for USD 664.0 million and USD 685.5 million, respectively.
6.5 Share capital, other reserves and earnings per share Share capital and other reserves Incremental costs directly attributable to the issue of new shares are presented in equity as a deduction from the proceeds, net of tax. The share capital is constituted of (i) 10,578,355 ordinary shares held by MERIT Corporation, its shareholders and related persons, (ii) 3,626,865 ordinary shares held by Yildirim and (iii) 1 preference share held by the Banque Publique d’Investissement (Bpifrance formerly FSI) for a total of 14,205,221 shares. In 2011 and 2013, Yildirim subscribed for USD 600 million to bonds mandatorily redeemable in the Company’s preferred shares as at December 31, 2015. As at December 31, 2015, the bonds have been redeemed in preferred shares and as at December 31, 2017 into ordinary shares as per their terms and conditions. Since then, Yildirim holds 24% of the Company’s ordinary shares on a fully diluted basis. In June 2013, Bpifrance subscribed for USD 150 million to bonds mandatorily redeemable in the Company’s ordinary shares as at December 31, 2020, representing 6% of the Company’s ordinary shares upon conversion on a fully diluted basis. No other share option plans or dilutive equity instruments have been issued. The fully diluted share capital can be presented as follows:
Fully diluted share capitalNumber of
shares
% of share
capital
Number of
voting rights
% of voting
rights
Outstanding shares as of December 31, 2019 14,205,221 94% 14,205,221 94%
Shares resulting from the conversion of bonds
redeemable in shares subscribed by BPI in 2013906,717 6% 906,717 6%
Total 15,111,938 100% 15,111,938 100%
Fully diluted share capital
Other comprehensive income / (Loss) reclassifiable to profit and loss break down as follows:
Consolidated financial statements CMA CGM / 63 Year ended December 31, 2019
As at
December 31,
2019
As at
December 31,
2018
Cash flow hedge (0.2) 15.3
Share of other comprehensive income / (Loss) of
associates and joint ventures4.2 5.7
Deferred tax on reserve 1.4 1.4
Net investment hedge (17.0) (29.3)
Currency translation adjustments (124.4) (142.9)
Total Other Comprehensive Income / (Loss) (136.0) (149.8)
Earnings per share Basic and diluted earnings per share are calculated by dividing the profit attributable to equity holders of the Company by the weighted average number of ordinary shares in issue during the year. Except in cases where the result of the year is a loss, basic earnings per share also take into account the impact of the bonds mandatorily redeemable into common shares from the date that the contract is entered into. Basic and diluted earnings per share are similar due to the fact that there is no potentially dilutive instrument.
6.6 Borrowings and lease liabilities
Financial liabilities Financial liabilities within the scope of IFRS 9 “Financial instruments and related amendments” are classified as financial liabilities at amortised cost or at fair value through profit and loss (when they are held for trading). The Group determines the classification of its financial liabilities at initial recognition. The Group does not hold over the period presented financial liabilities at fair value through profit and loss except derivative instruments. Financial liabilities are recognized initially at fair value, less directly attributable costs in case of liabilities that are not measured at fair value through profit and loss. The Group’s financial liabilities include trade and other payables, bank overdrafts, loans and borrowings and derivatives. Except for obligations recognized under IFRS16, borrowings are recognized initially at fair value, net of transaction costs incurred. Borrowings are subsequently stated at amortised cost; any difference between the proceeds (net of transaction costs) and the redemption value is recognized in the Statement of Profit & Loss over the period of the borrowings using the effective interest method. Borrowings also comprise obligations recognized under IFRS16. Lease liabilities under IFRS 16 IFRS 16 requires to recognize a lease liability (and a right-of-use) representing its obligation to make lease payments for leases. At the commencement date, the lease liability should be measured at the present value of the lease payments that are not paid at date. Under IFRS 16, the amount recognized as lease liabilities relating to leases contracts largely depends on assumptions used in terms of discount rates and lease terms. Renewal, extension and early termination options are also taken into consideration when calculating the lease liability if the lessee is reasonably certain to exercise those options.
As previously disclosed, Management reassessed the substance of certain transactions having the legal form of a lease and concluded that, due to the fact that the tax incentive was the primarily objective of the lease

CMA CGM / 64 Consolidated financial statements Year ended December 31, 2019
arrangement or due to the “in-substance purchase” nature of certain leases, such contracts should not be considered as lease arrangements. Hence, the corresponding assets are presented as owned assets and the related liabilities as bank borrowings.
6.6.1 Maturity schedule, variations and detail of borrowings
Borrowings and lease liabilities are presented below and include bank overdrafts, long-term bank borrowings, lease liabilities (including ex finance leases and similar arrangements) and have the following maturities:
As at December
31, 2019
2021 2022 2023 2024 Onwards
Senior notes 2,864.2 173.9 2,690.3 1,021.4 723.5 (4.6) 107.6 842.4
Bonds and preferred shares redeemable in shares 16.7 16.7 - - - - - -
Bank borrowings - Credit facilities and acquisition facilities2,516.8 1,011.7 1,505.1 53.4 107.8 456.9 108.3 778.7
Bank borrowings - Other 3,138.2 409.9 2,728.3 402.3 475.0 385.3 312.1 1,153.6
Bank overdrafts 156.9 156.9 - - - - - -
Securitization programs 1,926.5 222.4 1,704.1 1,531.0 173.0 - - -
Other borrowings 284.7 261.8 22.9 7.9 4.9 4.9 5.0 0.3
Total excluding lease liabilities 10,904.0 2,253.3 8,650.7 3,016.0 1,484.3 842.5 532.9 2,775.0
Lease liabilities under IFRS16 8,610.0 1,802.1 6,807.9 1,535.6 1,282.7 1,175.8 797.2 2,016.6
Total including lease liabilities 19,514.1 4,055.5 15,458.6 4,551.6 2,767.0 2,018.4 1,330.1 4,791.5
Maturity schedule : December 31,Non current
portion
Current
portion
Leases previously treated under finance leases are now included within “Lease liabilities under IFRS16”. Current portion of borrowings, excluding lease liabilities, amounts to USD 2,253.3 million but includes a number of items that should be considered as specific or non-current:
▪ USD 192.8 million related to the bridge acquisition facility, initially amounting to USD 725.0 million, put in place to finance the acquisition of CEVA, for which the Group (i) has the ability to extend the maturity until September 2020 and (ii) is about to finalize its refinancing (see Note 6.6.3 and 8.4);
▪ Accrued interests amounting to USD 111.0 million; ▪ Overdrafts amounting to USD 156.9 million, with an opposite impact in cash; ▪ Securitization programs for USD 222.4 million (CEVA program) which are generally rolled-over (see
Note 6.6.3); ▪ Other uncommitted facilities for which the Group generally obtains a rollover for USD 141.4 million.
Variations in borrowings and lease liabilities can be analyzed as follows:
Senior notes
Bonds and
preferred
shares
redeemable
in shares
Bank
borrowings
Lease
liabilities
under
IFRS16 (*)
Bank
overdrafts
Securitization
programs
Other
borrowingsTotal
Balance as at January 1, 2019 (*) 2,943.7 31.9 3,487.0 763.6 87.1 1,682.5 184.8 9,180.5
Proceeds from new borrowings, net of issuance costs - - 2,566.7 - - - 446.4 3,013.2
IFRS 16 first time application (see Note 2.2.1) - - (250.5) 7,163.1 - - - 6,912.6
Repayment of financial borrowings (394.8) (15.2) (1,691.9) (1,878.2) - (160.7) (363.0) (4,504.0)
Other increase/decrease in borrowings and lease
liabilities20.2 - 265.1 1,385.3 49.1 (15.7) 5.2 1,709.1
Accrued interests and fees amortization 6.1 - 30.7 81.5 - (2.8) (0.5) 115.0
Reclassification to liabilities associated with assets
held for sale- - (259.6) (116.4) - - - (376.0)
Refinancing of assets, net of issuance costs - - 770.0 - - - - 770.0
Acquisition of subsidiaries (see Note 3.1) 336.9 - 729.1 1,217.8 22.1 433.8 11.2 2,750.9
Foreign currency translation adjustments (47.9) - 8.5 (6.5) (1.4) (10.5) 0.6 (57.3)
Balance as at December 31, 2019 2,864.2 16.7 5,655.0 8,610.0 156.9 1,926.5 284.7 19,514.1
* Opening balance of finance leases under IAS 17 presented as lease liabilities The line item “Other increase / decrease in borrowings” mainly corresponds to variation in borrowings and lease liabilities which did not have any cash impact for the Group either because (i) the asset is financed through a lease contract under IFRS16, (ii) the drawdown was directly made by the bank to the benefit of the shipyard or (iii) variation in overdraft has an opposite impact in cash and cash equivalents.
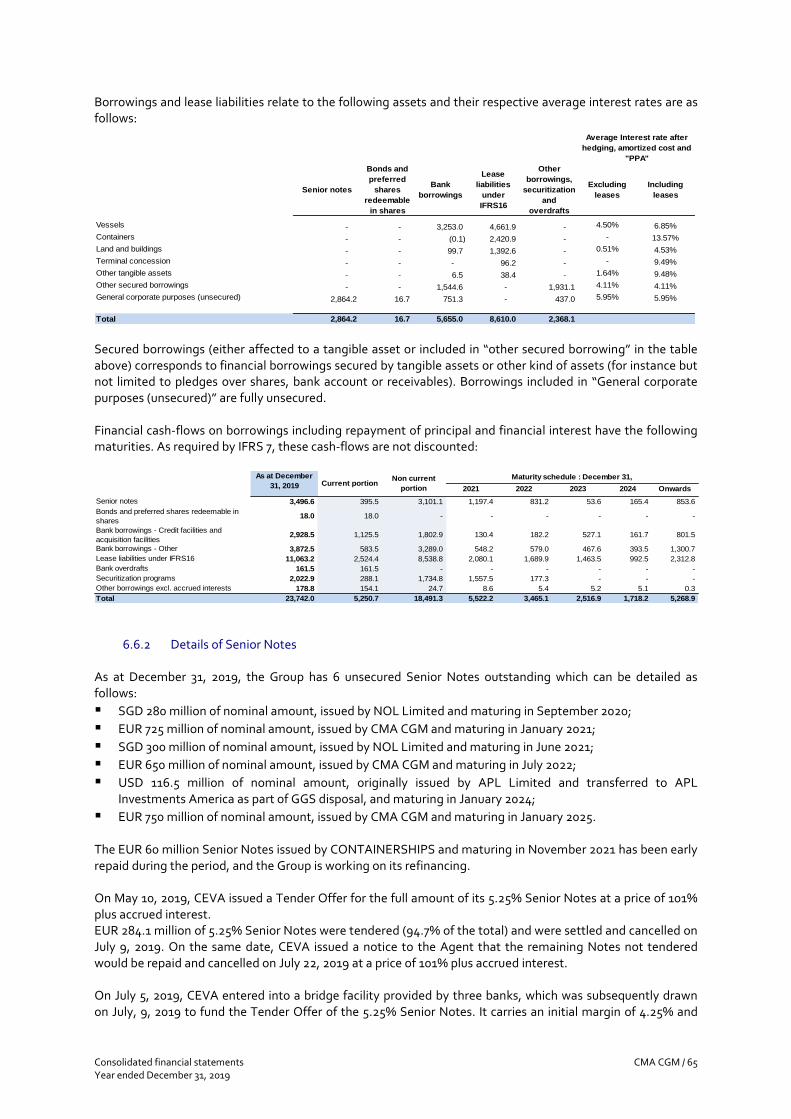
Consolidated financial statements CMA CGM / 65 Year ended December 31, 2019
Borrowings and lease liabilities relate to the following assets and their respective average interest rates are as follows:
Senior notes
Bonds and
preferred
shares
redeemable
in shares
Bank
borrowings
Lease
liabilities
under
IFRS16
Other
borrowings,
securitization
and
overdrafts
Excluding
leases
Including
leases
Vessels - - 3,253.0 4,661.9 - 4.50% 6.85%
Containers - - (0.1) 2,420.9 - - 13.57%
Land and buildings - - 99.7 1,392.6 - 0.51% 4.53%
Terminal concession - - - 96.2 - - 9.49%
Other tangible assets - - 6.5 38.4 - 1.64% 9.48%
Other secured borrowings - - 1,544.6 - 1,931.1 4.11% 4.11%
General corporate purposes (unsecured) 2,864.2 16.7 751.3 - 437.0 5.95% 5.95%
Total 2,864.2 16.7 5,655.0 8,610.0 2,368.1
Average Interest rate after
hedging, amortized cost and
"PPA"
Secured borrowings (either affected to a tangible asset or included in “other secured borrowing” in the table above) corresponds to financial borrowings secured by tangible assets or other kind of assets (for instance but not limited to pledges over shares, bank account or receivables). Borrowings included in “General corporate purposes (unsecured)” are fully unsecured. Financial cash-flows on borrowings including repayment of principal and financial interest have the following maturities. As required by IFRS 7, these cash-flows are not discounted:
2021 2022 2023 2024 Onwards
Senior notes 3,496.6 395.5 3,101.1 1,197.4 831.2 53.6 165.4 853.6
Bonds and preferred shares redeemable in
shares18.0 18.0 - - - - - -
Bank borrowings - Credit facilities and
acquisition facilities2,928.5 1,125.5 1,802.9 130.4 182.2 527.1 161.7 801.5
Bank borrowings - Other 3,872.5 583.5 3,289.0 548.2 579.0 467.6 393.5 1,300.7
Lease liabilities under IFRS16 11,063.2 2,524.4 8,538.8 2,080.1 1,689.9 1,463.5 992.5 2,312.8
Bank overdrafts 161.5 161.5 - - - - - -
Securitization programs 2,022.9 288.1 1,734.8 1,557.5 177.3 - - -
Other borrowings excl. accrued interests 178.8 154.1 24.7 8.6 5.4 5.2 5.1 0.3
Total 23,742.0 5,250.7 18,491.3 5,522.2 3,465.1 2,516.9 1,718.2 5,268.9
As at December
31, 2019
Maturity schedule : December 31,Current portion
Non current
portion
6.6.2 Details of Senior Notes As at December 31, 2019, the Group has 6 unsecured Senior Notes outstanding which can be detailed as follows:
▪ SGD 280 million of nominal amount, issued by NOL Limited and maturing in September 2020;
▪ EUR 725 million of nominal amount, issued by CMA CGM and maturing in January 2021;
▪ SGD 300 million of nominal amount, issued by NOL Limited and maturing in June 2021;
▪ EUR 650 million of nominal amount, issued by CMA CGM and maturing in July 2022;
▪ USD 116.5 million of nominal amount, originally issued by APL Limited and transferred to APL Investments America as part of GGS disposal, and maturing in January 2024;
▪ EUR 750 million of nominal amount, issued by CMA CGM and maturing in January 2025. The EUR 60 million Senior Notes issued by CONTAINERSHIPS and maturing in November 2021 has been early repaid during the period, and the Group is working on its refinancing. On May 10, 2019, CEVA issued a Tender Offer for the full amount of its 5.25% Senior Notes at a price of 101% plus accrued interest. EUR 284.1 million of 5.25% Senior Notes were tendered (94.7% of the total) and were settled and cancelled on July 9, 2019. On the same date, CEVA issued a notice to the Agent that the remaining Notes not tendered would be repaid and cancelled on July 22, 2019 at a price of 101% plus accrued interest. On July 5, 2019, CEVA entered into a bridge facility provided by three banks, which was subsequently drawn on July, 9, 2019 to fund the Tender Offer of the 5.25% Senior Notes. It carries an initial margin of 4.25% and
CMA CGM / 66 Consolidated financial statements Year ended December 31, 2019
the initial maturity is 12 months. In the event that the Bridge Facility is not refinanced within 12 months, the borrowing will be converted into term loans with a maturity no earlier than August 3, 2025 as part of the backstop facility mentioned in Note 6.6.3
6.6.3 Acquisition of subsidiaries (CEVA borrowings and lease liabilities) and CEVA acquisition facility CEVA and its subsidiaries’ main borrowings are as follows as at December 31, 2019:
▪ EUR 293.1 million Bridge loan; ▪ USD 457.2 million Term Loan B ▪ USD 372.7 million revolving credit facility; ▪ USD 394.8 million securitization programs ▪ USD 1,256 million of lease liabilities.
Some of CEVA financings were subject to early redemption as a consequence of the change of control and hence the Company negotiated a backstop facility amounting to USD 825 million whose objective was to refinance the borrowings should the change of control clause be exercised. On 24 April 2019, CEVA prepaid the outstanding principal balance of its existing term loan B in the amount of USD 473 million and issued a new term loan B in the amount of USD 475 million under the above-mentioned backstop, maturing August 3, 2025. On November 22, 2019, the Company closed a USD 460 million trade receivables securitization facility (“the CEVA Global Securitization Program”) with a three years renewable commitment from six banks. This program has fully refinanced the existing European Securitization and will refinance the US ABL facility and the Australian Receivables Facility both maturing in 2020. As of December 31, 2019, the outstanding drawn amount under the facility was USD 174 million, while USD 224 million were still drawn under historical programs. In April 2019, the Group financed the CEVA acquisition through a bridge acquisition facility amounting to USD 725 million which has already been significantly refinanced as follows:
▪ The refinancing operations consisted in sale and leaseback transactions of 12 vessels over 8 years, closed between June and December for USD 769.7 million, and permitted the refinancing of a portion of the acquisition facility. Such sale-and-leaseback transactions have not been recognized as a sale to the lessor in accordance with IFRS 15 criteria because of the absence of commercial substance (repurchase options reasonably certain to be exercised). Therefore and in accordance with IFRS 16, these transactions assimilated to financing operations have resulted in the recognition of a financial liability treated under IFRS 9.
▪ Other similar operations are ongoing in order to refinance the remaining portion of the acquisition facility amounting to USD 192.8 million as at December 31, 2019 (see Note 8.4).
6.6.4 Securitization program
During the year ended December 31, 2019, the securitization programs decreased by USD 160.7 million.
6.6.5 Bonds and preferred shares redeemable in shares The balance of the bonds as at December 31, 2019, amounting to USD 16.7 million, represents the interests payable till maturity as a remuneration of the bonds redeemable in shares held by BPI. As a consequence of the interests payments on bonds and preferred shares redeemable in ordinary shares, the Company records:
▪ A financial expense based on the market rate used to determine the liability component of these instruments; and
▪ A reduction in borrowings for the residual amount paid corresponding to the interest portion initially recorded in borrowings.

Consolidated financial statements CMA CGM / 67 Year ended December 31, 2019
6.6.6 Other borrowings As at December 31, 2019, other borrowings include USD 111.0 million of accrued interests (USD 102.8 million as at December 31, 2018).
6.7 Cash flow from financing activities Cash flow from financing activities amounts to USD (2,004.6) million for the year ended December 31, 2019. The financing cash flows mainly consisted in drawdown of borrowings for USD 3,012 million, balanced by the repayment of borrowings for USD (2,625.7) million, the payment of financial interests for USD (546.1) million and cash payments related to IFRS 16 leases : principal portion of leases for USD (1,834.8) million and interests portion for USD (692.2) million. The financing cash flow has also been impacted by the refinancing of certain vessels under sale and leaseback operations for an amount of USD 769.7 million. Cash flow from financing activities has been negatively impacted by IFRS 16 application as lease payments are now regarded as financing cash flows while it used to be reported as operating cash flows under IAS 17. The bridge from the previous to the new presentation is presented in Note 3.1.

CMA CGM / 68 Consolidated financial statements Year ended December 31, 2019
Note 7 - Scope of consolidation
7.1 Accounting principles and judgments used in determining the scope of consolidation
The control analysis, as defined by IFRS 10 “Consolidated Financial Statements”, involves judgment as certain situations are not obviously conclusive. Management has based its conclusion based on the following principles and on all the facts and circumstances, as well as existing contractual agreements. Subsidiaries Subsidiaries are all entities (including special purpose entities) over which the Company has control. The control over an entity is effective only if the following elements are reached: ▪ Power, i.e. the investor has existing rights that give it the ability to direct the relevant activities (the
activities that significantly affect the investee's returns); ▪ Exposure, or rights, to variable returns from its involvement with the entity; ▪ The ability to use its power over the entity to affect the amount of the investor's returns. Subsidiaries are fully consolidated from the date of acquisition, being the date on which the Group obtains control, and continue to be consolidated until the date that such control ceases. All intra-group balances, income and expenses and unrealized gains or losses resulting from intra-group transactions are fully eliminated. The financial statements of subsidiaries have been prepared for the same reporting period as the parent company, using consistent accounting policies. Non-controlling interests represent the portion of profit and loss and net assets that is not held by the Group. They are presented within equity and in the income statement, respectively separately from Group shareholders’ equity and Group profit for the year.
Transactions with non-controlling interests When purchasing non-controlling interests, the difference between any consideration paid and the relevant share acquired of the carrying value of net assets of the subsidiary is recorded in equity. Gains or losses on disposals to non-controlling interests are also recorded in equity. When the Group ceases to have control or significant influence, any retained interest in the entity is remeasured to its fair value, with the change in carrying amount recognized in consolidated income statement. The fair value subsequently represents the initial carrying amount of the retained interest as an associate, joint venture or financial asset. Interests in joint-venture & significant influence Companies on which the Group has no control alone can be part of a joint arrangement. A joint arrangement is defined as an arrangement of which two or more parties have joint control. Joint control exists when decisions about the relevant activities require the unanimous consent of the parties that collectively control the arrangement. The requirement for unanimous consent means that any party with joint control of the arrangement can prevent any of the other parties, or a group of the parties, from making unilateral decisions (about the relevant activities) without its consent.
Consolidated financial statements CMA CGM / 69 Year ended December 31, 2019
A joint venture is an arrangement whereby the parties that have joint control of the arrangement have rights to the net assets of the arrangement. A joint venturer recognises its interest in a joint venture as an investment and shall account for that investment using the equity method (in accordance with IAS 28 Investments in Associates and Joint Ventures). The significant influence is the power to participate in the financial and operating policy decisions of the investee without granting control or joint control on the investee:
• A party that participates in, but does not have joint control of a joint venture, accounts for its interest in the arrangement in accordance with IFRS 9,
• Unless it has significant influence over the joint venture, in which case it accounts for it in accordance with IAS 28.
Under the equity method, equity interests are accounted for at cost, adjusted for by the post-acquisition changes in the investor’s share of net assets of the associate, and reduced by any distributions (dividends). The carrying amount of these equity interests is presented in the line item "Investments in associates and joint ventures" on the Statement of Financial Position (see Note 7.3.2). “Share of profit of associates and joint ventures” is presented within EBIT as it was concluded that the business of these entities forms part of the Company’s ongoing operating activities and that such entities cannot be considered as financial investments. This line item includes impairment of goodwill, financial income and expense and income tax related to associates and joint ventures. An associate’s losses exceeding the value of the Group's interest in this entity are not accounted for, unless the Group has a legal or constructive obligation to cover the losses or if the Group has made payments on the associate’s behalf. Any surplus of the investment cost over the Group's share in the fair value of the identifiable assets and liabilities of the associate company on the date of acquisition is accounted for as goodwill and included in the carrying amount of the investment. Any remaining investment in which the Group has ceased to exercise significant influence or joint control is no longer accounted for under the equity method and is valued at fair value.
7.2 Judgments linked to structured entities Freight securitization The Group entered in late 2013 into a securitization program with certain financial institutions and also implemented in 2016 the same kind of structure to finance NOL receivables. As part of these programs, 2 structured entities named CMA CGM & ANL Securities BV and APL Securities S.A R.L. have been dedicated to purchase the trade receivables of certain shipping carriers. The entities are structured in such a manner that the significant risks (e.g. Forex risk, late payment risk, credit risk, etc.) remain with the sellers. As consequence, both entities have been consolidated since inception. In terms of liquidity risk management, see Note 6.1.3 for Group policies and Note 6.6.1 for financial liabilities maturity schedules. Asset financing As part of certain lease arrangements, the Company may be partly involved with structured entities owning the asset. The control over these entities is assessed based on all facts and circumstances. Since the implementation of IFRS 16 and, in particular, the cancellation of the distinction between operating lease and financial lease, these assessments have been modified. Indeed, lease arrangements accounted according to IFRS 16 are no longer concerned. Only tax lease transactions and “in-substance purchase” transactions are
CMA CGM / 70 Consolidated financial statements Year ended December 31, 2019
concerned. For this kind of transaction, an asset and a financial liability are recognized in the CFS of the Group as if they were owned, i.e. as if the entity was consolidated (see Note 5.2 and Note 6.6).
7.3 Investments in associates and joint ventures
7.3.1 Significant judgments and assumptions made in determining the nature of the interests in significant associates and joint ventures
Global Ship Lease (“GSL”) – accounted as an associate under equity method The analysis is based on the participation to the decision making process (power of the shareholders and the management board) upon GSL’s relevant activities. Despite the merger occurred end of 2018 and some subsequent capital operations, diluting the Group from 44.4% to 9.98%, Management believes its still exercises a significant influence over this investee, mainly due to the designation of one Board member and the proposal of another one to GSL Board. As a consequence, the accounting of this investment under equity method is appropriate under IFRS 10 “Consolidated Financial Statements” and IFRS 11 “Joint Arrangements”. Terminal Link SA and its subsidiaries (“TL”) – accounted as a joint venture Since June 2013, TL is 51% owned by CMA CGM (through CMA Terminals Holding (“CMATH”) 100% owned by CMA CGM) and 49% owned by China Merchants Holding International (“CMHI”). The contractual arrangement between CMHI and CMA CGM over TL results in accounting joint control whereby the power to govern the financial and operational policies of the company is jointly shared. Indeed, the shareholders’ agreement stipulates that any major decision requires the unanimous consent of the shareholders. CMHI also has substantive rights on TL. The parties have no direct rights to the assets or obligations for the liabilities. As a result, the investment in Terminal Link is accounted for under the equity method under IFRS 11 “Joint Arrangements”.
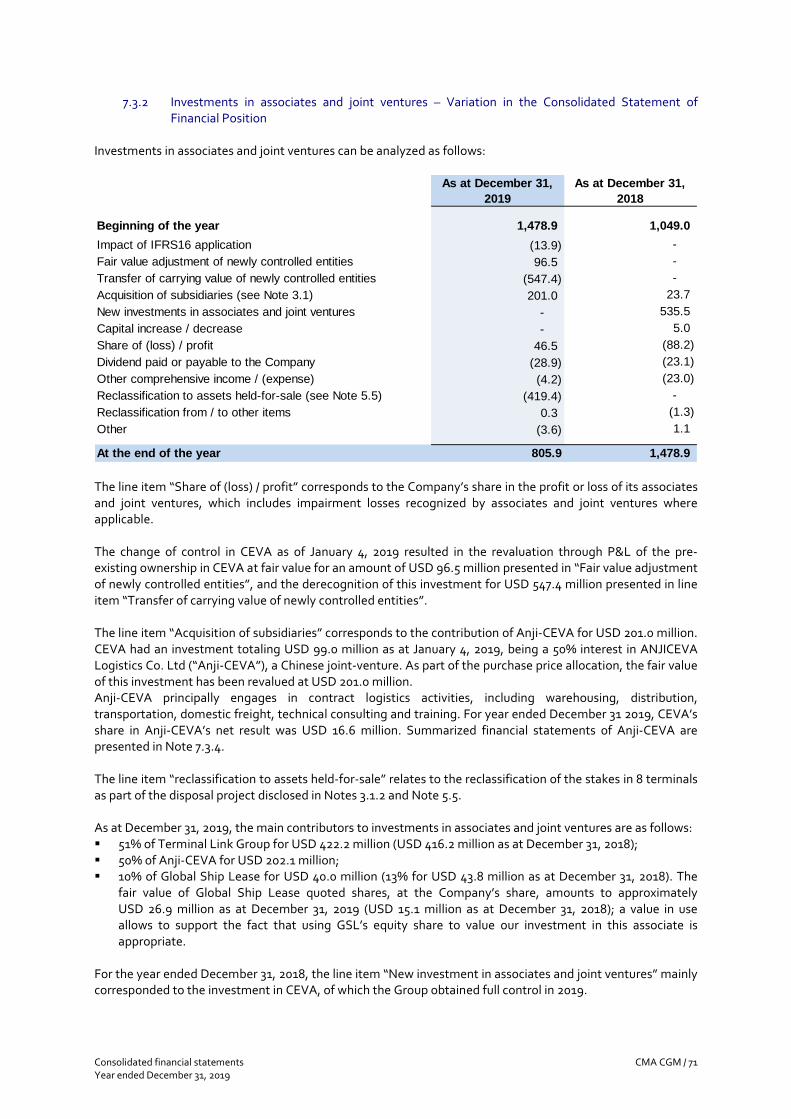
Consolidated financial statements CMA CGM / 71 Year ended December 31, 2019
7.3.2 Investments in associates and joint ventures – Variation in the Consolidated Statement of Financial Position
Investments in associates and joint ventures can be analyzed as follows:
As at December 31,
2019
As at December 31,
2018
Beginning of the year 1,478.9 1,049.0
Impact of IFRS16 application (13.9) -
Fair value adjustment of newly controlled entities 96.5 -
Transfer of carrying value of newly controlled entities (547.4) -
Acquisition of subsidiaries (see Note 3.1) 201.0 23.7
New investments in associates and joint ventures - 535.5
Capital increase / decrease - 5.0
Share of (loss) / profit 46.5 (88.2)
Dividend paid or payable to the Company (28.9) (23.1)
Other comprehensive income / (expense) (4.2) (23.0)
Reclassification to assets held-for-sale (see Note 5.5) (419.4) -
Reclassification from / to other items 0.3 (1.3)
Other (3.6) 1.1
At the end of the year 805.9 1,478.9 The line item “Share of (loss) / profit” corresponds to the Company’s share in the profit or loss of its associates and joint ventures, which includes impairment losses recognized by associates and joint ventures where applicable. The change of control in CEVA as of January 4, 2019 resulted in the revaluation through P&L of the pre-existing ownership in CEVA at fair value for an amount of USD 96.5 million presented in “Fair value adjustment of newly controlled entities”, and the derecognition of this investment for USD 547.4 million presented in line item “Transfer of carrying value of newly controlled entities”. The line item “Acquisition of subsidiaries” corresponds to the contribution of Anji-CEVA for USD 201.0 million. CEVA had an investment totaling USD 99.0 million as at January 4, 2019, being a 50% interest in ANJICEVA Logistics Co. Ltd (“Anji-CEVA”), a Chinese joint-venture. As part of the purchase price allocation, the fair value of this investment has been revalued at USD 201.0 million. Anji-CEVA principally engages in contract logistics activities, including warehousing, distribution, transportation, domestic freight, technical consulting and training. For year ended December 31 2019, CEVA’s share in Anji-CEVA’s net result was USD 16.6 million. Summarized financial statements of Anji-CEVA are presented in Note 7.3.4. The line item “reclassification to assets held-for-sale” relates to the reclassification of the stakes in 8 terminals as part of the disposal project disclosed in Notes 3.1.2 and Note 5.5. As at December 31, 2019, the main contributors to investments in associates and joint ventures are as follows: ▪ 51% of Terminal Link Group for USD 422.2 million (USD 416.2 million as at December 31, 2018); ▪ 50% of Anji-CEVA for USD 202.1 million; ▪ 10% of Global Ship Lease for USD 40.0 million (13% for USD 43.8 million as at December 31, 2018). The
fair value of Global Ship Lease quoted shares, at the Company’s share, amounts to approximately USD 26.9 million as at December 31, 2019 (USD 15.1 million as at December 31, 2018); a value in use allows to support the fact that using GSL’s equity share to value our investment in this associate is appropriate.
For the year ended December 31, 2018, the line item “New investment in associates and joint ventures” mainly corresponded to the investment in CEVA, of which the Group obtained full control in 2019.
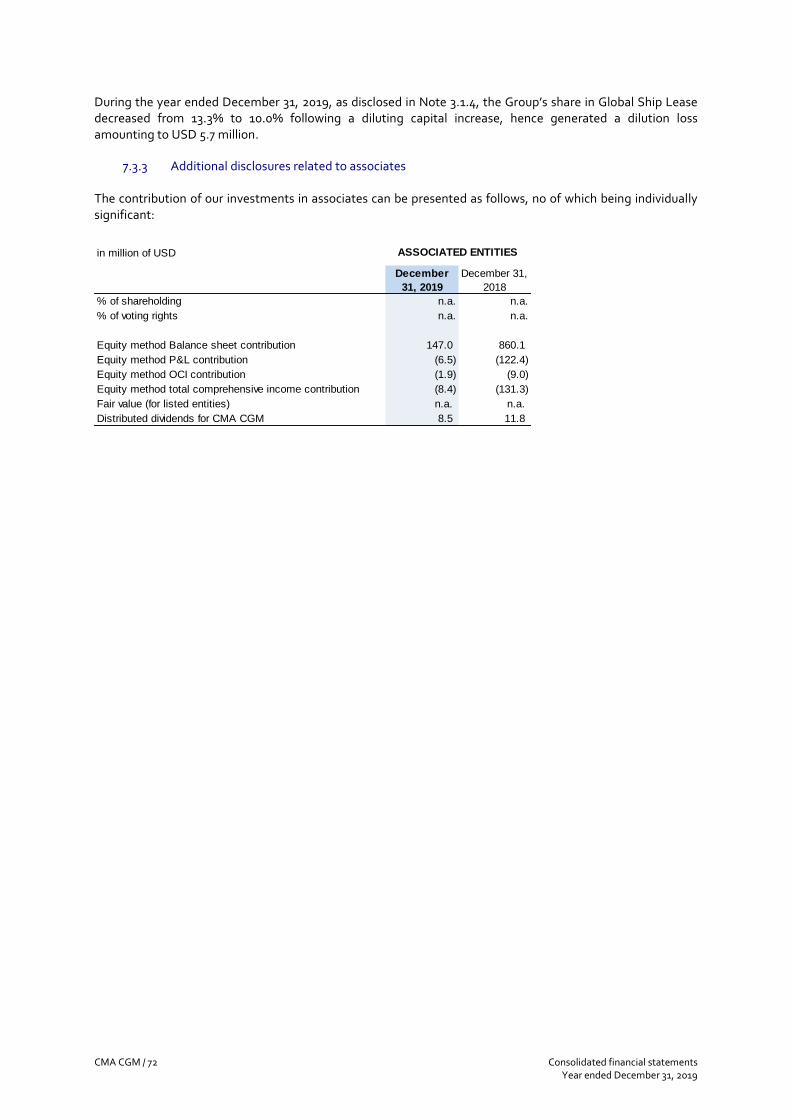
CMA CGM / 72 Consolidated financial statements Year ended December 31, 2019
During the year ended December 31, 2019, as disclosed in Note 3.1.4, the Group’s share in Global Ship Lease decreased from 13.3% to 10.0% following a diluting capital increase, hence generated a dilution loss amounting to USD 5.7 million.
7.3.3 Additional disclosures related to associates The contribution of our investments in associates can be presented as follows, no of which being individually significant:
in million of USD
December
31, 2019
December 31,
2018
% of shareholding n.a. n.a.
% of voting rights n.a. n.a.
Equity method Balance sheet contribution 147.0 860.1
Equity method P&L contribution (6.5) (122.4)
Equity method OCI contribution (1.9) (9.0)
Equity method total comprehensive income contribution (8.4) (131.3)
Fair value (for listed entities) n.a. n.a.
Distributed dividends for CMA CGM 8.5 11.8
ASSOCIATED ENTITIES
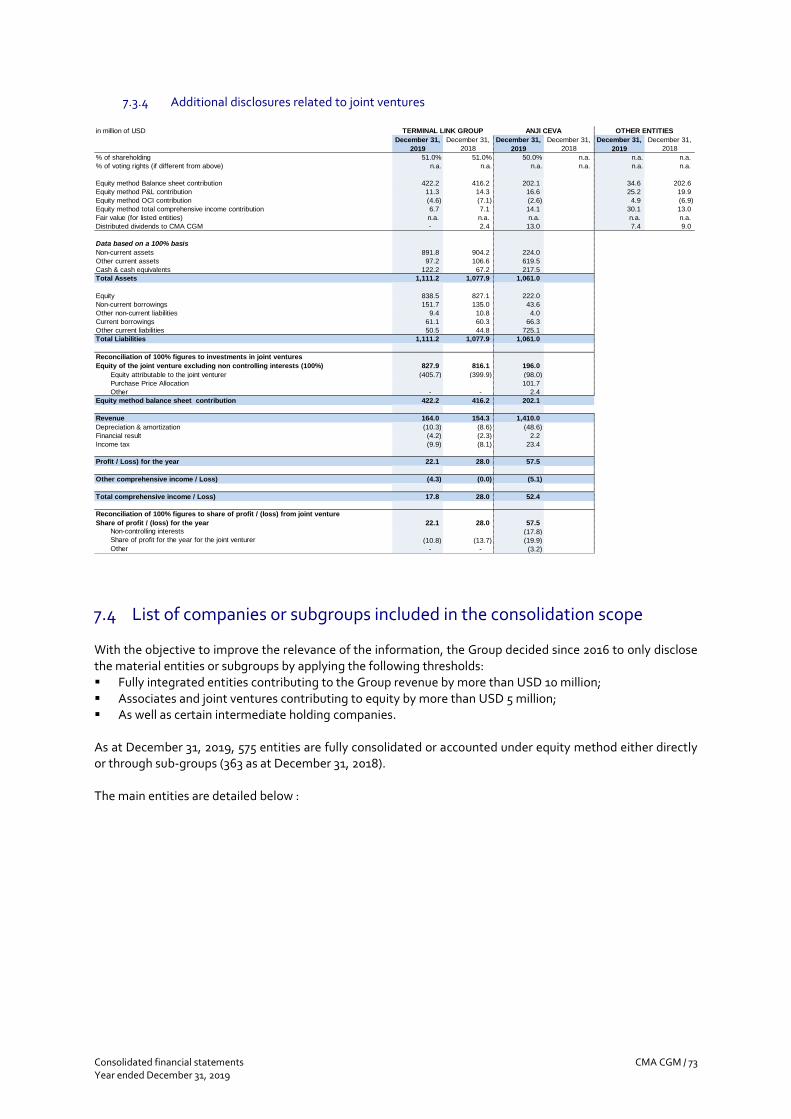
Consolidated financial statements CMA CGM / 73 Year ended December 31, 2019
7.3.4 Additional disclosures related to joint ventures in million of USD
December 31,
2019
December 31,
2018
December 31,
2019
December 31,
2018
December 31,
2019
December 31,
2018
% of shareholding 51.0% 51.0% 50.0% n.a. n.a. n.a.
% of voting rights (if different from above) n.a. n.a. n.a. n.a. n.a. n.a.
Equity method Balance sheet contribution 422.2 416.2 202.1 34.6 202.6
Equity method P&L contribution 11.3 14.3 16.6 25.2 19.9
Equity method OCI contribution (4.6) (7.1) (2.6) 4.9 (6.9)
Equity method total comprehensive income contribution 6.7 7.1 14.1 30.1 13.0
Fair value (for listed entities) n.a. n.a. n.a. n.a. n.a.
Distributed dividends to CMA CGM - 2.4 13.0 7.4 9.0
Data based on a 100% basis
Non-current assets 891.8 904.2 224.0
Other current assets 97.2 106.6 619.5
Cash & cash equivalents 122.2 67.2 217.5
Total Assets 1,111.2 1,077.9 1,061.0
Equity 838.5 827.1 222.0
Non-current borrowings 151.7 135.0 43.6
Other non-current liabilities 9.4 10.8 4.0
Current borrowings 61.1 60.3 66.3
Other current liabilities 50.5 44.8 725.1
Total Liabilities 1,111.2 1,077.9 1,061.0
Reconciliation of 100% figures to investments in joint ventures
Equity of the joint venture excluding non controlling interests (100%) 827.9 816.1 196.0
Equity attributable to the joint venturer (405.7) (399.9) (98.0)
Purchase Price Allocation 101.7
Other - - 2.4
Equity method balance sheet contribution 422.2 416.2 202.1
Revenue 164.0 154.3 1,410.0
Depreciation & amortization (10.3) (8.6) (48.6)
Financial result (4.2) (2.3) 2.2
Income tax (9.9) (8.1) 23.4
Profit / Loss) for the year 22.1 28.0 57.5
Other comprehensive income / Loss) (4.3) (0.0) (5.1)
Total comprehensive income / Loss) 17.8 28.0 52.4
Reconciliation of 100% figures to share of profit / (loss) from joint venture
Share of profit / (loss) for the year 22.1 28.0 57.5
Non-controlling interests (17.8) Share of profit for the year for the joint venturer (10.8) (13.7) (19.9)
Other - - (3.2)
TERMINAL LINK GROUP ANJI CEVA OTHER ENTITIES
7.4 List of companies or subgroups included in the consolidation scope With the objective to improve the relevance of the information, the Group decided since 2016 to only disclose the material entities or subgroups by applying the following thresholds: ▪ Fully integrated entities contributing to the Group revenue by more than USD 10 million; ▪ Associates and joint ventures contributing to equity by more than USD 5 million; ▪ As well as certain intermediate holding companies.
As at December 31, 2019, 575 entities are fully consolidated or accounted under equity method either directly or through sub-groups (363 as at December 31, 2018). The main entities are detailed below :

CMA CGM / 74 Consolidated financial statements Year ended December 31, 2019
Legal Entity CountryDirect and indirect
percentage of interest
CMA CGM SA (parent company) France
Consolidation method - Full
ANL CONTAINER LINE LTD Australia 100.00%
MERCOSUL Line Navegacao LTD Brazil 100.00%
CONTAINERSHIPS Group Finland 100.00%
CMA SHIPS SAS France 100.00%
CONTAINERSHIPS - CMA CGM Germany 100.00%
CNC LINE LTD Hong Kong 100.00%
COMANAV Morocco 99.92%
CMA CGM INTERNATIONAL SHIPPING PTE LTD Singapore 100.00%
ANL SINGAPORE Singapore 100.00%
NOL LINER (PTE.) LIMITED Singapore 100.00%
APL CO. PTE LIMITED Singapore 100.00%
CHENG LIE NAVIGATION CO, LTD Taiwan 100.00%
COASTAL NAVIGATION CO LTD Taiwan 25.00%
CMA CGM UK SHIPPING United Kingdom 100.00%
AMERICAN PRESIDENT LINES LTD United States of America 100.00%
CMA CGM ALGERIE Algeria 79.80%
CMA CGM AUSTRALIA Australia 100.00%
CMA CGM CANADA Canada 100.00%
CMA CGM CHINA China 100.00%
CMA CGM AGENCES France France 100.00%
CMA CGM DEUTSCHLAND Germany 100.00%
CMA CGM AGENCIES INDIA India 100.00%
CMA CGM KOREA South Korea 100.00%
CMA CGM MAROC Morocco 100.00%
CMA CGM SOUTH AFRICA South Africa 100.00%
CMA CGM HOLLAND The Netherlands 100.00%
CMA CGM DENIZ ACENTELIGI A.S Turkey 95.00%
CMA CGM SHIPPING AGENCIES UKRAINE Ukraine 100.00%
CMA CGM VIETNAM Viet Nam 100.00%
CMA CGM MALAYSIA SDN BHD Malaysia 100.00%
CMA CGM ANL DUBAI United Arab Emirates 65.00%
CMA CGM AMERICA United States of America 100.00%
INTRAMAR SA France 100.00%
MARSEILLE MANUTENTION France 100.00%
SOMARIG France (Guyane) 100.00%
GMM France (Martinique) 100.00%
SOCIETE D'ACCONAGE ET DE MANUTENTION DE LA REUNION France (Réunion) 69.99%
KINGSTON FREEPORT TERMINAL LTD Jamaica 100.00%
LATTAKIA INT. CONT. TERMINAL LLC Syria 51.00%
ANL CONTAINER HIRE AND SALES PTY LTD Australia 100.00%
PROGECO France France 100.00%
CEVA LOGISTICS Switzerland 100.00%
CMA CGM Transit SARL Ivory Coast 75.00%
CC TERMINAL CONTENEURS DAKAR (TCD) Senegal 100.00%
ALTERCO Algeria 58.98%
CMA CGM AGENCIES WORLDWIDE France 100.00%
CMA TERMINALS HOLDING France 100.00%
CMA TERMINALS France 100.00%
NEPTUNE ORIENT LINES LIMITED Singapore 100.00%
EAGLE MARINE TERMINAL HOLDINGS PTE. LTD Singapore 100.00%
Consolidation method - Equity
QINGDAO QIANWAN UNITED ADVANCE CONTAINER TERMINAL CO., LTD China 24.00%
OTHL Cyprus 50.00%
ANJI CEVA China 50.00%
TERMINAL LINK GROUP France 51.00%
CMA MUNDRA TERMINAL Pvt Ltd India 50.00%
AMEYA LOGISTICS PRIVATE LTD India 50.00%
GLOBAL SHIP LEASE Marshall Islands 9.98%
CMA CGM PSA LION TERMINAL Singapore 49.00%
ROTTERDAM WORLD GATEWAY BV The Netherlands 30.00%
PACIFIC MARITIME SERVICE United States of America 10.00%
LOGOPER LLC Russia 50.00%
GEMALINK Viet Nam 25.00%
FIRST LOGISTICS DEVELOPMENT (JV) COMPANY Viet Nam 47.00%
Associates and joint ventures are disclosed in the table below
SHIPPING
AGENCIES
HANDLING
CONTAINERS (MAINTENANCE & REPAIRS)
LOGISTICS & SUPPLY CHAIN
FINANCIAL HOLDING

Consolidated financial statements CMA CGM / 75 Year ended December 31, 2019
7.5 Related party transactions For the purposes of this note, the following group of related parties have been identified: ▪ Terminal activities handled through associates and joint ventures which mainly include Terminal Link and
its subsidiaries, as well as other terminals under associates and joint ventures (Rotterdam World Gateway, Global Gateway South, Kribi, Mundra, Brooklyn Kiev Port, Laem Chabang International Terminal Co., Qingdao Qianwan United Advance Container Terminal and First Logistics Development (JV) Company.
▪ Global Ship Lease, Inc. (“GSL”) a ship-owner listed in the U.S. currently owning a fleet of 38 vessels of
which 17 time chartered to CMA CGM under agreements ranging from January 2020 till October 2025. ▪ Shipping agencies which mainly include CMA CGM Kuwait, an associate Company. ▪ Management and / or shareholder’s related entities which mainly include:
Merit Corporation, incorporated in Lebanon, whose ultimate shareholders are the Saadé family and members of his immediate family, who owns a large part of the ordinary shares of the Company;
Certain subsidiaries of Merit Corporation, including Merit SAL, a service company providing CMA CGM with cost and revenue control and internal audit support, CMA Liban, a shipping agent and Investment and Financing Corp. Ltd, a container leasing company;
Yildirim, incorporated in Turkey, a Company with whom the Company signed two significant transactions in 2011 and 2013 regarding the issuance of bonds, then converted into ordinary shares as at December 31, 2017 (see Note 6.5), and another agreement in 2011 regarding the sale of 50% of its shareholding in Malta Freeport Terminals Limited for a cash amount of EUR 200.0 million (USD 289.0 million at that time);
The Banque Publique d’Investissement (Bpifrance formerly FSI), an investment fund established by the French Government in 2008 whose main mission is to consolidate the French companies share capital who need to find stable investors to finance their development projects. Bpifrance subscribed in 2013 to bonds mandatorily redeemable in 2020 in ordinary shares issued by the Company (see Note 6.5);
A non-profit foundation “Fondation d’Entreprise CMA CGM” which promotes certain cultural activities.
▪ Others activities which mainly include the following TRAXENS, which is developing a breakthrough
technology for “smart” containers in which CMA holds 29.6% ownership.
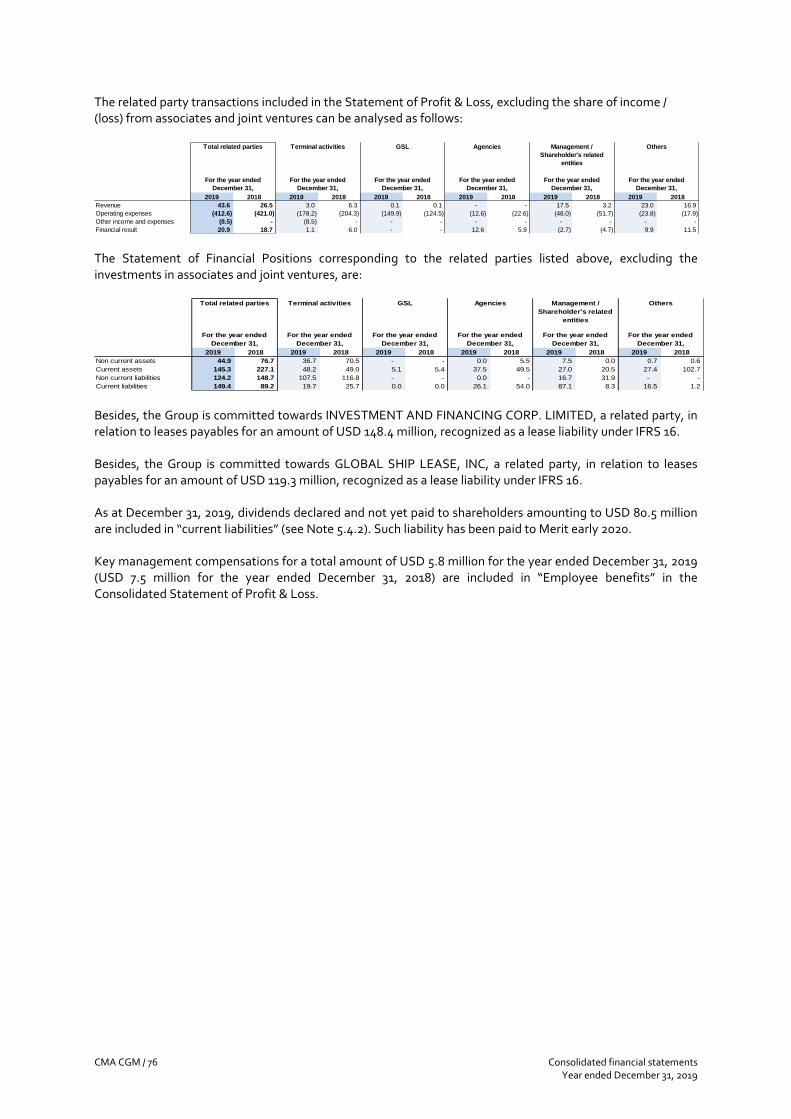
CMA CGM / 76 Consolidated financial statements Year ended December 31, 2019
The related party transactions included in the Statement of Profit & Loss, excluding the share of income / (loss) from associates and joint ventures can be analysed as follows:
2019 2018 2019 2018 2019 2018 2019 2018 2019 2018 2019 2018
Revenue 43.6 26.5 3.0 6.3 0.1 0.1 - - 17.5 3.2 23.0 16.9
Operating expenses (412.6) (421.0) (178.2) (204.3) (149.9) (124.5) (12.6) (22.6) (48.0) (51.7) (23.8) (17.9)
Other income and expenses (8.5) - (8.5) - - - - - - - - -
Financial result 20.9 18.7 1.1 6.0 - - 12.6 5.9 (2.7) (4.7) 9.9 11.5
GSL
For the year ended
December 31,
Total related parties
For the year ended
December 31,
Terminal activities
For the year ended
December 31,
Agencies
For the year ended
December 31,
Management /
Shareholder's related
entities
For the year ended
December 31,
Others
For the year ended
December 31,
The Statement of Financial Positions corresponding to the related parties listed above, excluding the investments in associates and joint ventures, are:
2019 2018 2019 2018 2019 2018 2019 2018 2019 2018 2019 2018
Non current assets 44.9 76.7 36.7 70.5 - - 0.0 5.5 7.5 0.0 0.7 0.6
Current assets 145.3 227.1 48.2 49.0 5.1 5.4 37.5 49.5 27.0 20.5 27.4 102.7
Non current liabilities 124.2 148.7 107.5 116.8 - - 0.0 - 16.7 31.9 - -
Current liabilities 149.4 89.2 19.7 25.7 0.0 0.0 26.1 54.0 87.1 8.3 16.5 1.2
For the year ended
December 31,
Total related parties Terminal activities GSL Agencies Management /
Shareholder's related
entities
Others
For the year ended
December 31,
For the year ended
December 31,
For the year ended
December 31,
For the year ended
December 31,
For the year ended
December 31,
Besides, the Group is committed towards INVESTMENT AND FINANCING CORP. LIMITED, a related party, in relation to leases payables for an amount of USD 148.4 million, recognized as a lease liability under IFRS 16. Besides, the Group is committed towards GLOBAL SHIP LEASE, INC, a related party, in relation to leases payables for an amount of USD 119.3 million, recognized as a lease liability under IFRS 16. As at December 31, 2019, dividends declared and not yet paid to shareholders amounting to USD 80.5 million are included in “current liabilities” (see Note 5.4.2). Such liability has been paid to Merit early 2020. Key management compensations for a total amount of USD 5.8 million for the year ended December 31, 2019 (USD 7.5 million for the year ended December 31, 2018) are included in “Employee benefits” in the Consolidated Statement of Profit & Loss.

Consolidated financial statements CMA CGM / 77 Year ended December 31, 2019
Note 8 - Other Notes
8.1 Provisions, employee benefits and contingent liabilities The Group recognizes provisions when: ▪ It has a present legal or constructive obligation as a result of past events; ▪ It is more likely than not that an outflow of resources will be required to settle the obligation; and ▪ The amount can be reliably estimated. Judgments and estimates made in determining the risk related to cargo and corporate claims and related accounting provisions: The Group evaluates provisions based on facts and events known at the closing date, from its past experience and to the best of its knowledge. Certain provisions may also be adjusted as a consequence of a post Statement of Financial Position adjusting event. Provisions mainly cover litigation with third parties such as shipyards, restructuring and cargo claims. Certain provision may require a certain level of judgment and estimates (see below disclosures). Provisions can be analyzed as follows:
Litigation
Other risks
and
obligations
Provisionsnon current
portion
current
portion
Employee
benefits non current
portion
current
portion
As at January 1, 2018 139.8 263.7 403.5 326.6 76.9 190.2 188.0 2.2
Additions for the period 42.9 30.9 73.8 21.6
Reversals during the period (unused) (28.9) (5.1) (34.0) (2.3)
Reversals during the period (used) (6.7) (39.6) (46.3) (19.3)
Disposal of subsidiaries - - - (4.2)
Reclassification (0.2) 0.2 (0.0) (1.3)
Acquisition of subsidiaries - 18.6 18.6 -
Actuarial (gain) / loss recognized in the OCI - - - 3.8
Foreign currency translation adjustment (1.8) (9.0) (10.8) (3.8)
As at December 31, 2018 145.2 259.5 404.7 332.7 72.0 184.6 182.4 2.2
Additions for the period 34.4 107.0 141.3 31.1
Reversals during the period (unused) (3.6) (3.0) (6.6) (0.2)
Reversals during the period (used) (82.3) (112.5) (194.8) (31.4)
Impact of IFRS16 application - 23.6 23.6 -
Reclassification 7.4 (112.3) (105.0) (0.4)
Acquisition of subsidiaries 58.9 142.3 201.2 97.4
Actuarial (gain) / loss recognized in the OCI - - - 11.7
Foreign currency translation adjustment (1.8) (3.0) (4.7) (2.3)
As at December 31, 2019 158.2 301.5 459.7 304.8 154.9 290.5 289.2 1.3
of which of which
8.1.1 Provisions for litigation and other risks and obligations Litigation Provisions for litigation as at December 31, 2019 corresponds to cargo related and other claims incurred in the normal course of business, including for CEVA (same as at December 31, 2018). None of these claims taken individually represents a significant amount. While the outcome of these legal proceedings is uncertain, the Company believes that it has provided for all probable and estimable liabilities arising from the normal course of business, and therefore does not expect any un-provisioned liability arising from any of these legal proceedings to have a material impact on the results of operations, liquidity, capital resources or the statement of financial position.
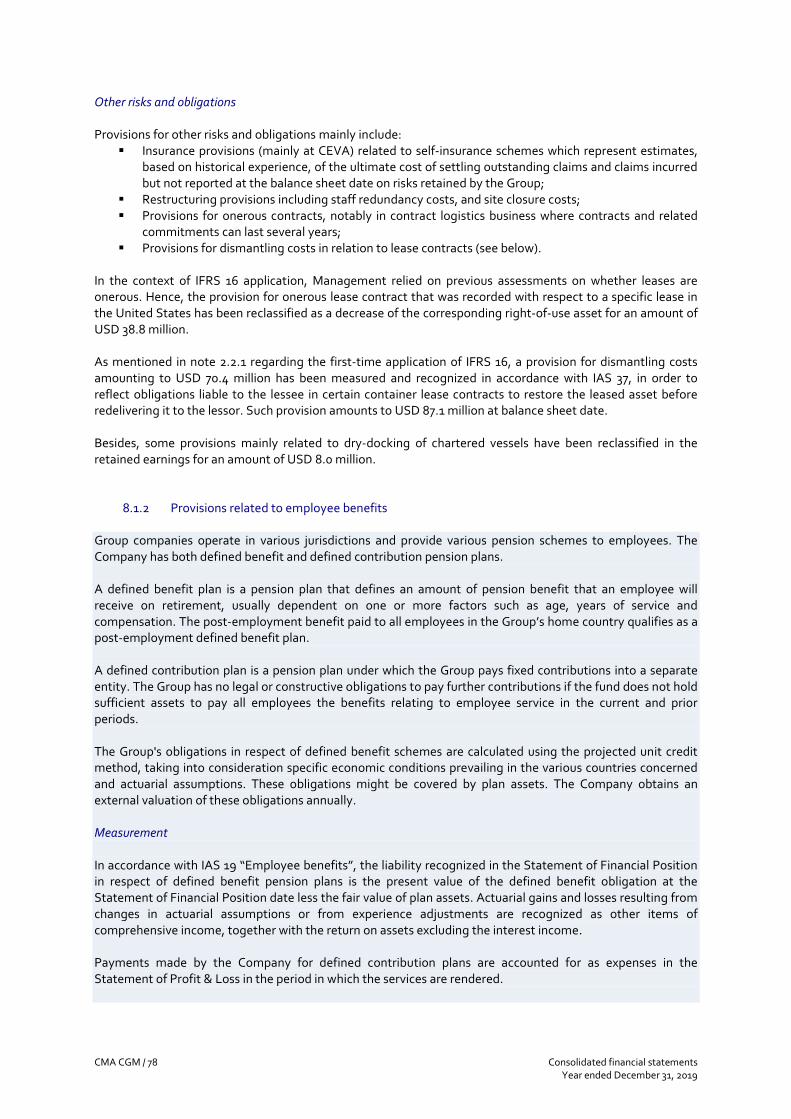
CMA CGM / 78 Consolidated financial statements Year ended December 31, 2019
Other risks and obligations Provisions for other risks and obligations mainly include:
▪ Insurance provisions (mainly at CEVA) related to self-insurance schemes which represent estimates, based on historical experience, of the ultimate cost of settling outstanding claims and claims incurred but not reported at the balance sheet date on risks retained by the Group;
▪ Restructuring provisions including staff redundancy costs, and site closure costs; ▪ Provisions for onerous contracts, notably in contract logistics business where contracts and related
commitments can last several years; ▪ Provisions for dismantling costs in relation to lease contracts (see below).
In the context of IFRS 16 application, Management relied on previous assessments on whether leases are onerous. Hence, the provision for onerous lease contract that was recorded with respect to a specific lease in the United States has been reclassified as a decrease of the corresponding right-of-use asset for an amount of USD 38.8 million. As mentioned in note 2.2.1 regarding the first-time application of IFRS 16, a provision for dismantling costs amounting to USD 70.4 million has been measured and recognized in accordance with IAS 37, in order to reflect obligations liable to the lessee in certain container lease contracts to restore the leased asset before redelivering it to the lessor. Such provision amounts to USD 87.1 million at balance sheet date. Besides, some provisions mainly related to dry-docking of chartered vessels have been reclassified in the retained earnings for an amount of USD 8.0 million.
8.1.2 Provisions related to employee benefits Group companies operate in various jurisdictions and provide various pension schemes to employees. The Company has both defined benefit and defined contribution pension plans. A defined benefit plan is a pension plan that defines an amount of pension benefit that an employee will receive on retirement, usually dependent on one or more factors such as age, years of service and compensation. The post-employment benefit paid to all employees in the Group’s home country qualifies as a post-employment defined benefit plan. A defined contribution plan is a pension plan under which the Group pays fixed contributions into a separate entity. The Group has no legal or constructive obligations to pay further contributions if the fund does not hold sufficient assets to pay all employees the benefits relating to employee service in the current and prior periods. The Group's obligations in respect of defined benefit schemes are calculated using the projected unit credit method, taking into consideration specific economic conditions prevailing in the various countries concerned and actuarial assumptions. These obligations might be covered by plan assets. The Company obtains an external valuation of these obligations annually. Measurement In accordance with IAS 19 “Employee benefits”, the liability recognized in the Statement of Financial Position in respect of defined benefit pension plans is the present value of the defined benefit obligation at the Statement of Financial Position date less the fair value of plan assets. Actuarial gains and losses resulting from changes in actuarial assumptions or from experience adjustments are recognized as other items of comprehensive income, together with the return on assets excluding the interest income. Payments made by the Company for defined contribution plans are accounted for as expenses in the Statement of Profit & Loss in the period in which the services are rendered.
Consolidated financial statements CMA CGM / 79 Year ended December 31, 2019
The service cost of the periodic pension cost is presented in employee benefits included in operating expenses. The interest component is presented within other financial income and expenses, net. Past service costs are recognized immediately in the consolidated income statement. In France, certain companies operating in terminal activities, as part of collective bargaining agreements, participate together with other enterprises – so called multi-employer plans – in the funding of plans deemed to cover pension obligations and asbestos programs. These plans are by their nature difficult to value as they require detailed information which is only available at the beneficiary’s request and for their individual pension calculation. In addition, the regime brings together the assets of several employers and the individual obligation of each employer in the plan is therefore difficult to precisely determine as it varies from one year to another based on activity levels. As per IAS 19 paragraph 34, where sufficient information is not available to use defined benefit accounting for defined benefit multi-employer plans, the plans are treated as defined contribution plans. Description of the Company’s plans The Company’s employees are generally entitled to pension benefits, in accordance with local regulations: ▪ Retirement and medical benefits, paid by the Company on retirement (defined benefit plan); and ▪ Pension payments from outside institutions, financed by contributions from employers and employees
(defined contribution plan). In accordance with the regulatory environment and collective agreements, the Group has established both defined contribution and defined benefit pension plans (company or multi-employer) to provide such benefit to employees.
Defined contribution plans Defined contribution plans are funded through independent pension funds or similar organizations. Contributions are fixed (e.g. based on salary) and are paid to these outside institutions. These institutions are responsible for maintaining and distributing employee benefits. The Company has no legal or constructive obligation to pay further contributions if any of the funds does not hold sufficient assets to pay all employees the benefits relating to contributions in the current and prior financial years. The employer contributions are recognised as employee benefit expense in the financial year to which they relate. Certain subsidiaries of CMA CGM, NOL and CEVA also contribute to a number of collectively bargained, multi-employer plans that provide pension benefits to certain union-represented employees. These plans are treated as defined contribution plans in accordance with IAS 19.34. The Group contributed USD 62.9million to its defined contribution plans in 2019 (USD 13.7 million in 2018).
Defined benefit plans Major defined benefit plans can be described as follows: Retirement Indemnities (France) French retirement indemnity plans provide a lump sum benefit paid by the company to the employees when they retire. The amount of this benefit depends on the length of service of the employee and salary at the retirement date and is prescribed by collective bargaining agreements (“CBA”). Those agreements are negotiated by Union representatives of the employer and of the employees, by sector of activity and at a national level. Their application is compulsory. The retirement indemnities are not linked to other standard French retirement benefits, such as pensions provided by Social Security or complementary funds (ARRCO and AGIRC).

CMA CGM / 80 Consolidated financial statements Year ended December 31, 2019
Article 23 (France) The benefits consist of an annuity payable to a closed group of beneficiaries. All the beneficiaries are retired. This plan has been partially funded through a contribution to an insurer, but the annuities are currently directly paid by the employer. Pensions are indexed each year based on the general salary increase of the company. The surviving spouse of a retiree is entitled to a pension equal to 60% of the pension benefit paid at time of death. Jubilee Awards (France) The benefits consist of a lump sum payable to employees when they reach various service anniversaries. Asbestos/hardness indemnities (France) In Terminal activities operated by certain of the Group’s subsidiaries in France, employees having spent the required number of years under hardness qualifying extreme work conditions and/or having been exposed to asbestos while working at the terminal are eligible to early retire 2 to 5 years ahead of normal retirement age. The early retirement pensions are financed through state program (asbestos) and/or multi-employer program. As mentioned above, where sufficient information is not available to use defined benefit accounting for defined benefit multi-employer plans, the plans are treated as defined contribution plans. Nevertheless, at early retirement leave, the indemnity lump sum payable by the employer differs from the retirement indemnity, and have been set by a local collective bargaining agreement. These specific lump sum indemnities are taken into account to value the appropriate retirement indemnity of employees concerned. Retirement Indemnities (Morocco) Retirement indemnity benefits in our subsidiaries in Morocco are lump sums paid by the company to the employees when they retire. The amount of this benefit depends on the length of service of the employee and salary at the retirement date and is prescribed by collective bargaining agreements. Medical insurance (Morocco) The benefits provide continuous medical coverage to retirees and their dependent subject to conditions. The program is a top up plan supplementing the Assurance Maladie Obligatoire reimbursements and is insured through an insurance contract with a local insurer. This estimated yearly reimbursment cost is indexed by 2.5% per year in order to reflect the medical consumption and cost inflation. Retirement Indemnities (The Netherlands) Retirement indemnity benefits at Company subsidiaries in Netherlands are lump sums paid by the Company to the employees when they retire. The amount of this benefit depends on the length of service of the employee and salary at the retirement date and is prescribed by a collective bargaining agreements. Superannuation Plan (Australia) Retirement indemnity benefits at Company subsidiaries in Australia are lump sums paid by the Company to the employees when they retire or resignate from the Company. The amount of this benefit depends on the length of service of the employee and salary at the retirement or resignation. This plan is closed to new members. Annual leave plans and long service leave plans (Australia) These unfunded plans provide a right to annual leave to employees depending of the length of service.
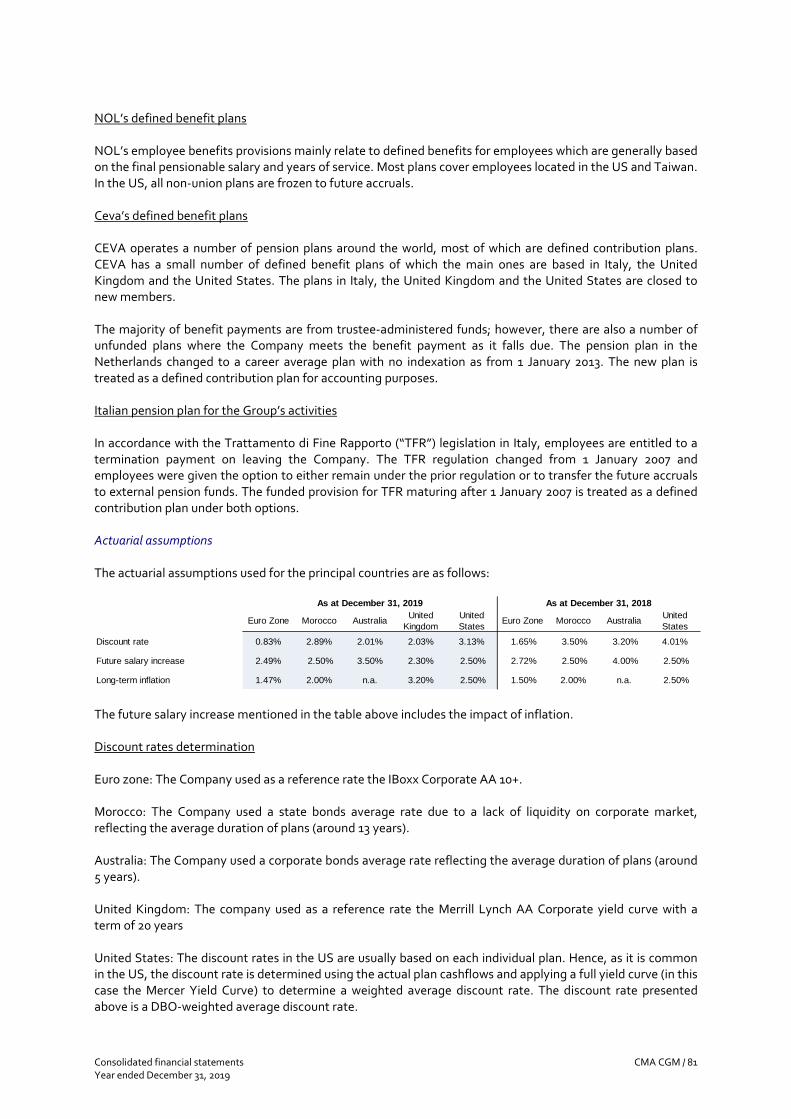
Consolidated financial statements CMA CGM / 81 Year ended December 31, 2019
NOL’s defined benefit plans NOL’s employee benefits provisions mainly relate to defined benefits for employees which are generally based on the final pensionable salary and years of service. Most plans cover employees located in the US and Taiwan. In the US, all non-union plans are frozen to future accruals. Ceva’s defined benefit plans CEVA operates a number of pension plans around the world, most of which are defined contribution plans. CEVA has a small number of defined benefit plans of which the main ones are based in Italy, the United Kingdom and the United States. The plans in Italy, the United Kingdom and the United States are closed to new members. The majority of benefit payments are from trustee-administered funds; however, there are also a number of unfunded plans where the Company meets the benefit payment as it falls due. The pension plan in the Netherlands changed to a career average plan with no indexation as from 1 January 2013. The new plan is treated as a defined contribution plan for accounting purposes. Italian pension plan for the Group’s activities In accordance with the Trattamento di Fine Rapporto (“TFR”) legislation in Italy, employees are entitled to a termination payment on leaving the Company. The TFR regulation changed from 1 January 2007 and employees were given the option to either remain under the prior regulation or to transfer the future accruals to external pension funds. The funded provision for TFR maturing after 1 January 2007 is treated as a defined contribution plan under both options. Actuarial assumptions The actuarial assumptions used for the principal countries are as follows:
Euro Zone Morocco AustraliaUnited
Kingdom
United
StatesEuro Zone Morocco Australia
United
States
Discount rate 0.83% 2.89% 2.01% 2.03% 3.13% 1.65% 3.50% 3.20% 4.01%
Future salary increase 2.49% 2.50% 3.50% 2.30% 2.50% 2.72% 2.50% 4.00% 2.50%
Long-term inflation 1.47% 2.00% n.a. 3.20% 2.50% 1.50% 2.00% n.a. 2.50%
As at December 31, 2018As at December 31, 2019
The future salary increase mentioned in the table above includes the impact of inflation. Discount rates determination Euro zone: The Company used as a reference rate the IBoxx Corporate AA 10+. Morocco: The Company used a state bonds average rate due to a lack of liquidity on corporate market, reflecting the average duration of plans (around 13 years). Australia: The Company used a corporate bonds average rate reflecting the average duration of plans (around 5 years). United Kingdom: The company used as a reference rate the Merrill Lynch AA Corporate yield curve with a term of 20 years United States: The discount rates in the US are usually based on each individual plan. Hence, as it is common in the US, the discount rate is determined using the actual plan cashflows and applying a full yield curve (in this case the Mercer Yield Curve) to determine a weighted average discount rate. The discount rate presented above is a DBO-weighted average discount rate.

CMA CGM / 82 Consolidated financial statements Year ended December 31, 2019
Evolution of rates Due to the decrease of interest rates in Europe, the discount rate being used to evaluate the Company’s liability regarding pension and employee benefits were down in most countries from December 31, 2019 compared to December 31, 2018. Taking into account all the impact recognized in OCI, the overall negative impact of remeasurement of defined pension and medical plans recorded in other comprehensive income amounts to USD 11.7 million. Variation of obligations, plan assets and provisions The net liability recognized in the Statement of Financial Position breaks down as follows:
As at December 31,
2019
As at December 31,
2018
Liabilities (576.2) (351.7)
Assets 285.7 167.1
Net liability (290.5) (184.6)
As at December 31,
2019
As at December 31,
2018
Present value of unfunded obligations (182.1) (144.5)
Present value of funded obligations (394.1) (207.2)
Fair value of plan assets 285.7 167.1
Net present value of obligations (290.5) (184.6) Variations in the defined benefit obligations over the year are as follows:
As at December 31,
2019
As at December 31,
2018
Beginning of year 351.7 380.0
Plan amendment - past service cost 0.2 (0.1)
Service cost 21.4 16.9
Interest cost 14.9 9.6
Actuarial losses/(gains) 45.2 (7.5)
Benefits paid (36.8) (31.9)
Employee contributions (0.1) (2.1)
Expenses Paid (0.0) (0.0)
Taxes paid (0.0) (0.1)
Premiums paid (0.0) (0.0)
Reclassification of liabilities - -
Acquisition / disposal of subsidiaries and other 181.9 (5.6)
Plan curtailments - -
Exchange differences (2.1) (7.5)
End of year 576.2 351.7 Plan assets vary as follows:
As at December 31,
2019
As at December 31,
2018
Beginning of year 167.1 189.8
Interest on assets 7.8 5.5
Actuarial (losses)/gains 32.1 (11.3)
Benefits paid and interest income (17.4) (17.9)
Employer contributions 11.9 5.4
Employee contributions 0.1 0.2
Acquisition of subsidiaries and other 84.9 0.5
Expenses paid (1.1) (1.2)
Taxes paid (0.0) (0.1)
Premiums paid (0.0) (0.0)
Exchange differences 0.2 (3.7)
End of the year 285.7 167.1 The plan assets are invested as follows:
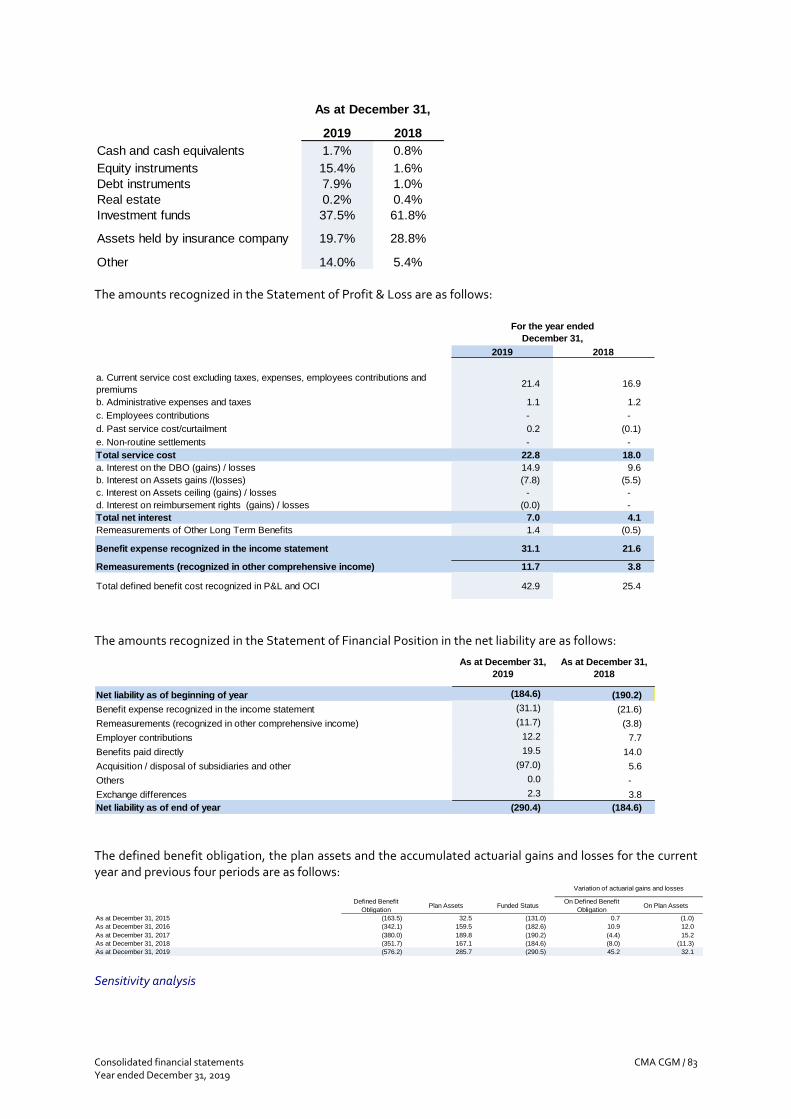
Consolidated financial statements CMA CGM / 83 Year ended December 31, 2019
2019 2018
Cash and cash equivalents 1.7% 0.8%
Equity instruments 15.4% 1.6%
Debt instruments 7.9% 1.0%
Real estate 0.2% 0.4%
Investment funds 37.5% 61.8%
Assets held by insurance company 19.7% 28.8%
Other 14.0% 5.4%
As at December 31,
The amounts recognized in the Statement of Profit & Loss are as follows:
2019 2018
a. Current service cost excluding taxes, expenses, employees contributions and
premiums21.4 16.9
b. Administrative expenses and taxes 1.1 1.2
c. Employees contributions - -
d. Past service cost/curtailment 0.2 (0.1)
e. Non-routine settlements - -
Total service cost 22.8 18.0
a. Interest on the DBO (gains) / losses 14.9 9.6
b. Interest on Assets gains /(losses) (7.8) (5.5)
c. Interest on Assets ceiling (gains) / losses - -
d. Interest on reimbursement rights (gains) / losses (0.0) -
Total net interest 7.0 4.1
Remeasurements of Other Long Term Benefits 1.4 (0.5)
Benefit expense recognized in the income statement 31.1 21.6
Remeasurements (recognized in other comprehensive income) 11.7 3.8
Total defined benefit cost recognized in P&L and OCI 42.9 25.4
For the year ended
December 31,
The amounts recognized in the Statement of Financial Position in the net liability are as follows:
As at December 31,
2019
As at December 31,
2018
Net liability as of beginning of year (184.6) (190.2)
Benefit expense recognized in the income statement (31.1) (21.6)
Remeasurements (recognized in other comprehensive income) (11.7) (3.8)
Employer contributions 12.2 7.7
Benefits paid directly 19.5 14.0
Acquisition / disposal of subsidiaries and other (97.0) 5.6
Others 0.0 -
Exchange differences 2.3 3.8
Net liability as of end of year (290.4) (184.6) The defined benefit obligation, the plan assets and the accumulated actuarial gains and losses for the current year and previous four periods are as follows:
Defined Benefit
ObligationPlan Assets Funded Status
On Defined Benefit
ObligationOn Plan Assets
As at December 31, 2015 (163.5) 32.5 (131.0) 0.7 (1.0)
As at December 31, 2016 (342.1) 159.5 (182.6) 10.9 12.0
As at December 31, 2017 (380.0) 189.8 (190.2) (4.4) 15.2
As at December 31, 2018 (351.7) 167.1 (184.6) (8.0) (11.3)
As at December 31, 2019 (576.2) 285.7 (290.5) 45.2 32.1
Variation of actuarial gains and losses
Sensitivity analysis
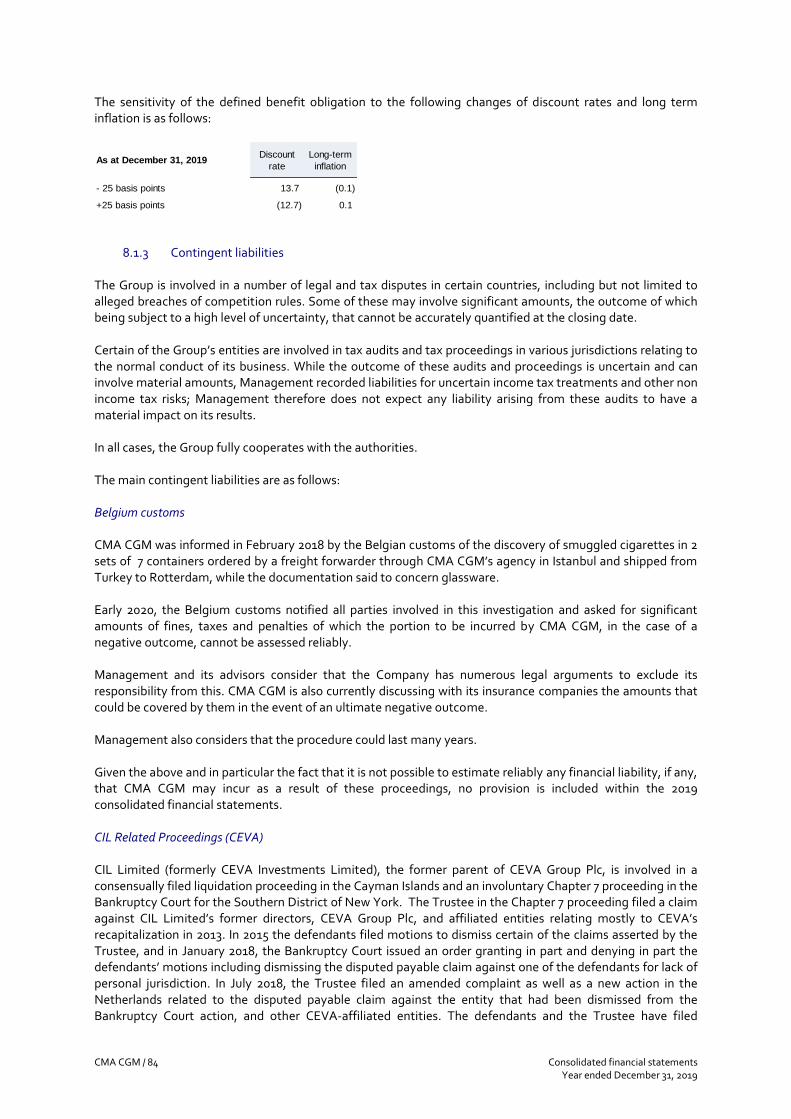
CMA CGM / 84 Consolidated financial statements Year ended December 31, 2019
The sensitivity of the defined benefit obligation to the following changes of discount rates and long term inflation is as follows:
As at December 31, 2019Discount
rate
Long-term
inflation
- 25 basis points 13.7 (0.1)
+25 basis points (12.7) 0.1
8.1.3 Contingent liabilities The Group is involved in a number of legal and tax disputes in certain countries, including but not limited to alleged breaches of competition rules. Some of these may involve significant amounts, the outcome of which being subject to a high level of uncertainty, that cannot be accurately quantified at the closing date. Certain of the Group’s entities are involved in tax audits and tax proceedings in various jurisdictions relating to the normal conduct of its business. While the outcome of these audits and proceedings is uncertain and can involve material amounts, Management recorded liabilities for uncertain income tax treatments and other non income tax risks; Management therefore does not expect any liability arising from these audits to have a material impact on its results. In all cases, the Group fully cooperates with the authorities. The main contingent liabilities are as follows: Belgium customs CMA CGM was informed in February 2018 by the Belgian customs of the discovery of smuggled cigarettes in 2 sets of 7 containers ordered by a freight forwarder through CMA CGM’s agency in Istanbul and shipped from Turkey to Rotterdam, while the documentation said to concern glassware. Early 2020, the Belgium customs notified all parties involved in this investigation and asked for significant amounts of fines, taxes and penalties of which the portion to be incurred by CMA CGM, in the case of a negative outcome, cannot be assessed reliably. Management and its advisors consider that the Company has numerous legal arguments to exclude its responsibility from this. CMA CGM is also currently discussing with its insurance companies the amounts that could be covered by them in the event of an ultimate negative outcome. Management also considers that the procedure could last many years. Given the above and in particular the fact that it is not possible to estimate reliably any financial liability, if any, that CMA CGM may incur as a result of these proceedings, no provision is included within the 2019 consolidated financial statements. CIL Related Proceedings (CEVA) CIL Limited (formerly CEVA Investments Limited), the former parent of CEVA Group Plc, is involved in a consensually filed liquidation proceeding in the Cayman Islands and an involuntary Chapter 7 proceeding in the Bankruptcy Court for the Southern District of New York. The Trustee in the Chapter 7 proceeding filed a claim against CIL Limited’s former directors, CEVA Group Plc, and affiliated entities relating mostly to CEVA’s recapitalization in 2013. In 2015 the defendants filed motions to dismiss certain of the claims asserted by the Trustee, and in January 2018, the Bankruptcy Court issued an order granting in part and denying in part the defendants’ motions including dismissing the disputed payable claim against one of the defendants for lack of personal jurisdiction. In July 2018, the Trustee filed an amended complaint as well as a new action in the Netherlands related to the disputed payable claim against the entity that had been dismissed from the Bankruptcy Court action, and other CEVA-affiliated entities. The defendants and the Trustee have filed
Consolidated financial statements CMA CGM / 85 Year ended December 31, 2019
motions for summary judgment in the Bankruptcy Court action, which have been fully briefed and argued to the court. One of the creditors in the bankruptcy proceeding has also filed a claim against CEVA Logistics AG in New York state court related to CEVA’s 2013 recapitalization. The Company cannot provide assurances regarding the outcome of these matters and it is possible that if the Trustee or the creditor were to prevail on their claims, the Company could incur a material loss in connection with those matters, including the payment of substantial damages and/or with regard to the matter in the bankruptcy court, the unwinding of the recapitalization in 2013. However, the Company believes the claims are without merit and intends to vigorously defend itself. A former CEVA employee and CIL shareholder has asserted a putative class action against CEVA Group Plc, among others, in a U.S. District Court in the Middle District of Florida. Plaintiff claims that CEVA Group should have treated him differently in connection with the 2013 recapitalization. In January 2019, CEVA Group filed a motion to dismiss. The court has converted the motion to dismiss to a summary judgment motion and ordered the parties to proceed with summary judgment practice. While CEVA cannot provide assurances with respect to the outcome of this matter and it is possible that CEVA could incur a material loss, CEVA believes the claim is without merit and intends to vigorously defend itself. At December 31, 2019, the Group (through CEVA) reports a net payable to CIL Limited, amounting to USD 14 million. This mainly relates to intercompany cash pooling arrangements and is included within trade and other payables in the Consolidated Statement of Financial Position.
8.2 Other current liabilities This line item includes the liability corresponding to the future cash-outflows in relation to the minimum dividend guaranteed to CMHI as part of the disposal of the 49% stake in Terminal Link in June 2013. This liability amounts to USD 107.7 million (USD 116.6 million as at December 31, 2018), down USD 8.9 million mainly as a consequence of the reassessment of Terminal Link dividend distribution capacity which is now almost certain as the period covered by this agreement ends with 2019 financial year. The timing of the payment of such liability is not known to date.
8.3 Commitments
8.3.1 Commitments on assets Lease commitments The Group applied IFRS 16 Leases from January 1, 2019. Under IFRS 16, the Group recognizes right-of-use assets and lease liabilities for most of these leases, except where the lease term is below one year or where the leased asset is not made available for use to the lessee. Previously, the Group classified leases as operating leases under IAS 17, until December 31, 2018. The Group leases vessels, containers, terminal premises, various offices and warehouses under non-cancellable operating lease agreements. The Group also leases various motor vehicles, trailers and equipment under operating lease agreements. The total amount of operating lease expenses related to leased assets outside the scope of IFRS 16 was USD 1,153.3 million in 2019 (USD 2,737.8 million in 2018 before IFRS 16 application). Besides, the service component related to leased assets within the scope of IFRS 16, mainly related to running costs, amounted to USD 219.6 million.
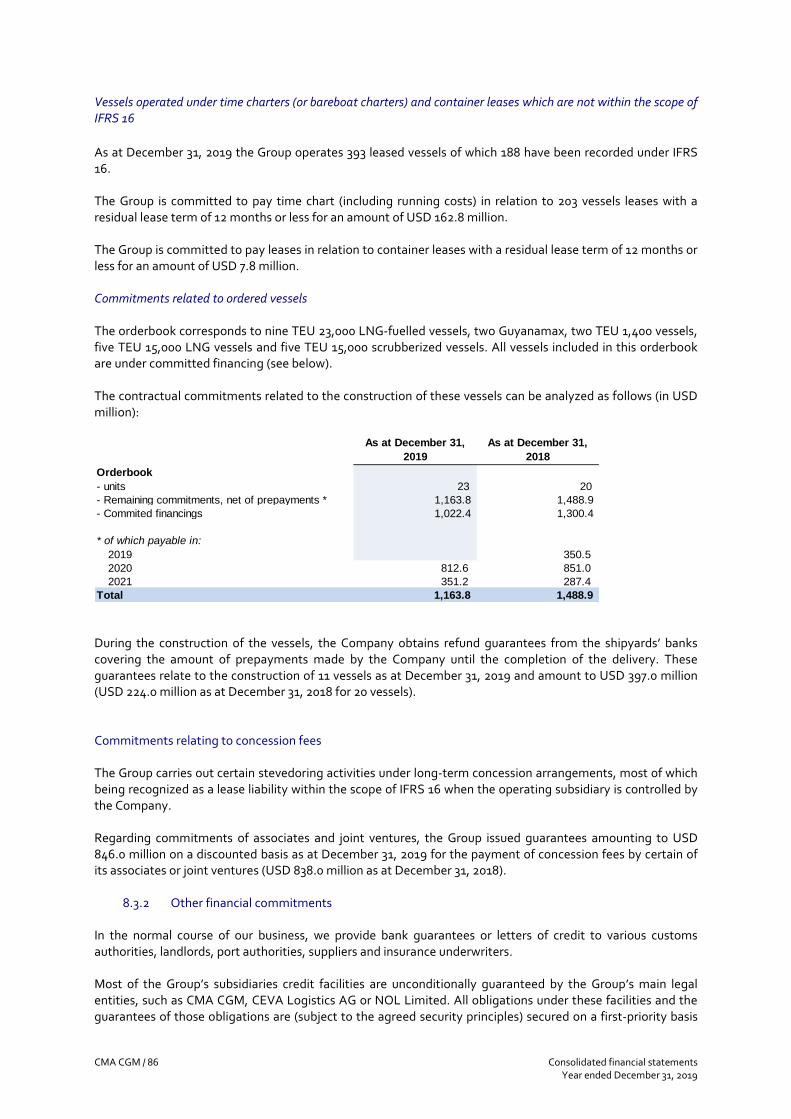
CMA CGM / 86 Consolidated financial statements Year ended December 31, 2019
Vessels operated under time charters (or bareboat charters) and container leases which are not within the scope of IFRS 16
As at December 31, 2019 the Group operates 393 leased vessels of which 188 have been recorded under IFRS 16. The Group is committed to pay time chart (including running costs) in relation to 203 vessels leases with a residual lease term of 12 months or less for an amount of USD 162.8 million. The Group is committed to pay leases in relation to container leases with a residual lease term of 12 months or less for an amount of USD 7.8 million. Commitments related to ordered vessels The orderbook corresponds to nine TEU 23,000 LNG-fuelled vessels, two Guyanamax, two TEU 1,400 vessels, five TEU 15,000 LNG vessels and five TEU 15,000 scrubberized vessels. All vessels included in this orderbook are under committed financing (see below). The contractual commitments related to the construction of these vessels can be analyzed as follows (in USD million):
As at December 31,
2019
As at December 31,
2018
Orderbook
- units 23 20
- Remaining commitments, net of prepayments * 1,163.8 1,488.9
- Commited financings 1,022.4 1,300.4
* of which payable in:
2019 350.5
2020 812.6 851.0
2021 351.2 287.4
Total 1,163.8 1,488.9 During the construction of the vessels, the Company obtains refund guarantees from the shipyards’ banks covering the amount of prepayments made by the Company until the completion of the delivery. These guarantees relate to the construction of 11 vessels as at December 31, 2019 and amount to USD 397.0 million (USD 224.0 million as at December 31, 2018 for 20 vessels). Commitments relating to concession fees The Group carries out certain stevedoring activities under long-term concession arrangements, most of which being recognized as a lease liability within the scope of IFRS 16 when the operating subsidiary is controlled by the Company. Regarding commitments of associates and joint ventures, the Group issued guarantees amounting to USD 846.0 million on a discounted basis as at December 31, 2019 for the payment of concession fees by certain of its associates or joint ventures (USD 838.0 million as at December 31, 2018).
8.3.2 Other financial commitments In the normal course of our business, we provide bank guarantees or letters of credit to various customs authorities, landlords, port authorities, suppliers and insurance underwriters. Most of the Group’s subsidiaries credit facilities are unconditionally guaranteed by the Group’s main legal entities, such as CMA CGM, CEVA Logistics AG or NOL Limited. All obligations under these facilities and the guarantees of those obligations are (subject to the agreed security principles) secured on a first-priority basis
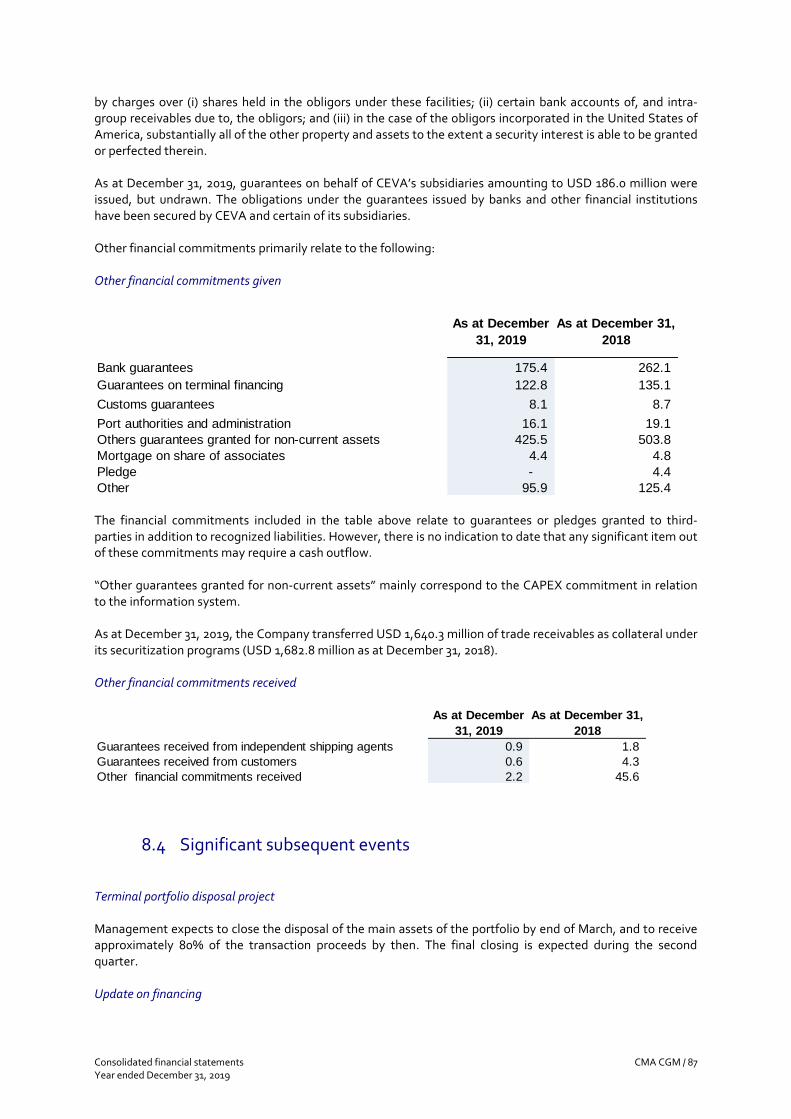
Consolidated financial statements CMA CGM / 87 Year ended December 31, 2019
by charges over (i) shares held in the obligors under these facilities; (ii) certain bank accounts of, and intra-group receivables due to, the obligors; and (iii) in the case of the obligors incorporated in the United States of America, substantially all of the other property and assets to the extent a security interest is able to be granted or perfected therein. As at December 31, 2019, guarantees on behalf of CEVA’s subsidiaries amounting to USD 186.0 million were issued, but undrawn. The obligations under the guarantees issued by banks and other financial institutions have been secured by CEVA and certain of its subsidiaries. Other financial commitments primarily relate to the following: Other financial commitments given
As at December
31, 2019
As at December 31,
2018
Bank guarantees 175.4 262.1
Guarantees on terminal financing 122.8 135.1
Customs guarantees 8.1 8.7
Port authorities and administration 16.1 19.1
Others guarantees granted for non-current assets 425.5 503.8
Mortgage on share of associates 4.4 4.8
Pledge - 4.4
Other 95.9 125.4 The financial commitments included in the table above relate to guarantees or pledges granted to third-parties in addition to recognized liabilities. However, there is no indication to date that any significant item out of these commitments may require a cash outflow. “Other guarantees granted for non-current assets” mainly correspond to the CAPEX commitment in relation to the information system. As at December 31, 2019, the Company transferred USD 1,640.3 million of trade receivables as collateral under its securitization programs (USD 1,682.8 million as at December 31, 2018). Other financial commitments received
As at December
31, 2019
As at December 31,
2018
Guarantees received from independent shipping agents 0.9 1.8
Guarantees received from customers 0.6 4.3
Other financial commitments received 2.2 45.6
8.4 Significant subsequent events Terminal portfolio disposal project Management expects to close the disposal of the main assets of the portfolio by end of March, and to receive approximately 80% of the transaction proceeds by then. The final closing is expected during the second quarter. Update on financing
CMA CGM / 88 Consolidated financial statements Year ended December 31, 2019
As part of the global refinancing and liquidity enhancement program, the Group obtained agreements to rollover 2020 bank debt maturities amounting to USD 535 million. The outstanding amount on the CEVA acquisition facility stands at USD 143 million, after repayment of USD 50 million after the balance sheet date. The residual amount is expected to be fully refinanced by end of March. Situation in Lebanon As at December 31, 2019, the group holds USD 225 million deposited in a number of Lebanese banks as short term dollar denominated deposit accounts and reported in cash equivalents. The recent evolution of the political and economic environment in Lebanon is closely monitored and the situation will be reassessed as at March 31, 2020 if need be. Implementation of IMO 2020 On 1st January 2020, the IMO 2020 regulation came into effect. CMA CGM fleet is fully compliant with this new regulation. From January onwards, CMA CGM has implemented a full pass-through pricing policy in order to ensure full compensation of the additional costs from its client. COVID-19 In the recent weeks, China enacted protection measures against Covid-19, with a significant impact on the production and transportation of goods in the country and beyond. The evolution of the Covid-19 as well as its impact on the global economy and more specifically on the group is hard to predict at this stage as the current slow activity might be followed by a sharp rebound at a later stage. The Group is monitoring the situation on a daily basis to ensure the safety of its staff as well as to adapt its deployed capacity.

Consolidated financial statements CMA CGM / 89 Year ended December 31, 2019
Note 9 - Glossary BAF “Bunker Adjustment Factor” is a surcharge assessed by carrier which is applied to freight rates and invoiced to customers in order to compensate unexpected fuel oil price variations. CGU A “Cash-Generating Unit” is the smallest identifiable group of assets that generates cash inflows that are largely independent of the cash inflows from other assets or group of assets. EBIT - Core EBIT EBIT, as presented in the consolidated statement of Profit & Loss, means “Earning Before Interests and Taxes” and corresponds to Operating profit. Core EBIT, as presented in the consolidated statement of Profit & Loss, corresponds to EBIT, as defined above, less certain unallocated items as defined in Note 4.1 Operating segments. EBITDA EBITDA, as presented in the consolidated statement of Profit & Loss, means “Earning Before Interests, Taxes, Depreciation and Amortization” and corresponds to revenue less operating expenses. IASB “International Accounting Standards Board” is the principal body within the IFRS foundation and is in charge of establishing (i.e. develop and issue) IFRS as defined below. IFRIC or IFRS Interpretations Committee (IFRS IC) The Interpretations Committee’s responsibilities are to interpret the application of the IFRS, report to the IASB and obtain IASB approval for final interpretations. IFRS & IAS “International Financial Reporting Standards” & “International Accounting Standards” are designed as a single set of accounting standards, developed and maintained by the IASB with the intention of those standards being capable of being applied on a globally consistent basis by developed, emerging and developing economies, thus providing investors and other users of financial statements with the ability to compare the financial performance of publicly listed companies on a like-for-like basis with their international peers. LIBOR “London Inter-Bank Offer Rate” is used as a reference rate for many financial instruments in both financial markets and commercial fields. NPV “Net Present Value” is the worth at the present date of an expected cash flow of an asset or a liability, determined by applying a discount rate to these cash flows. WACC The “Weighted Average Cost of Capital” is a calculation of a firm's cost of capital in which each category of capital is proportionately weighted. All sources of capital, including common stock, preferred stock, bonds and any other long-term debt, are included in a WACC calculation.


