68
Consolidated Financial Statements for the Fiscal Year Ended March 31, 2021
Consolidated Financial Statements for the Fiscal Year Ended March 31, 2021

- 1 -
Consolidated Statements of Financial Position as of March 31, 2020 and 2021
JPY (millions) Notes 2020 2021
Assets
Current assets
Cash and cash equivalents 16 359,252 523,345
Trade and other receivables 15 737,484 740,448
Contract assets 26 247,625 270,322
Inventories 14 199,326 185,548
Other financial assets 31 5,584 9,573
Other current assets 17 108,436 131,596
Subtotal 1,657,707 1,860,832
Assets held for sale 18 41,210 -
Total current assets 1,698,917 1,860,832
Non-current assets
Property, plant and equipment, net 8, 10 558,077 553,171
Goodwill 9, 10 182,334 300,530
Intangible assets, net 9, 10 199,093 368,858
Investments accounted for using the equity method 12 74,092 73,316
Other financial assets 31 219,326 210,427
Deferred tax assets 13 165,183 133,881
Other non-current assets 10, 17 26,232 167,549
Total non-current assets 1,424,337 1,807,732
Total assets 3,123,254 3,668,564

- 2 -
JPY (millions)
Notes 2020 2021
Liabilities and equity
Liabilities
Current liabilities
Trade and other payables 24 460,881 467,638
Contract liabilities 26 195,152 250,011
Bonds and borrowings 21 154,992 51,510
Accruals 191,440 215,965
Lease liabilities 31 47,085 47,480
Other financial liabilities 31 14,995 19,670
Accrued income taxes 12,624 28,147
Provisions 23 59,412 55,381
Other current liabilities 25 55,153 61,721
Subtotal 1,191,734 1,197,523 Liabilities directly associated with assets held for sale 18 30,133
-
Total current liabilities 1,221,867 1,197,523
Non-current liabilities
Bonds and borrowings 21 364,828 488,739
Lease liabilities 31 108,514 115,127
Other financial liabilities 31 42,402 34,974
Net defined benefit liabilities 22 224,469 191,907
Provisions 23 12,369 20,421
Other non-current liabilities 25 34,282 58,047
Total non-current liabilities 786,864 909,215
Total liabilities 2,008,731 2,106,738
Equity
Share capital 19 397,199 427,831
Share premium 19 139,735 168,965
Retained earnings 19 436,361 564,660
Treasury shares 19 (4,157) (1,578)
Other components of equity 19 (58,464) 148,273
Total equity attributable to owners of the parent 910,674 1,308,151
Non-controlling interests 11 203,849 253,675
Total equity 1,114,523 1,561,826
Total liabilities and equity 3,123,254 3,668,564
See accompanying notes to consolidated financial statements.
- 3 -
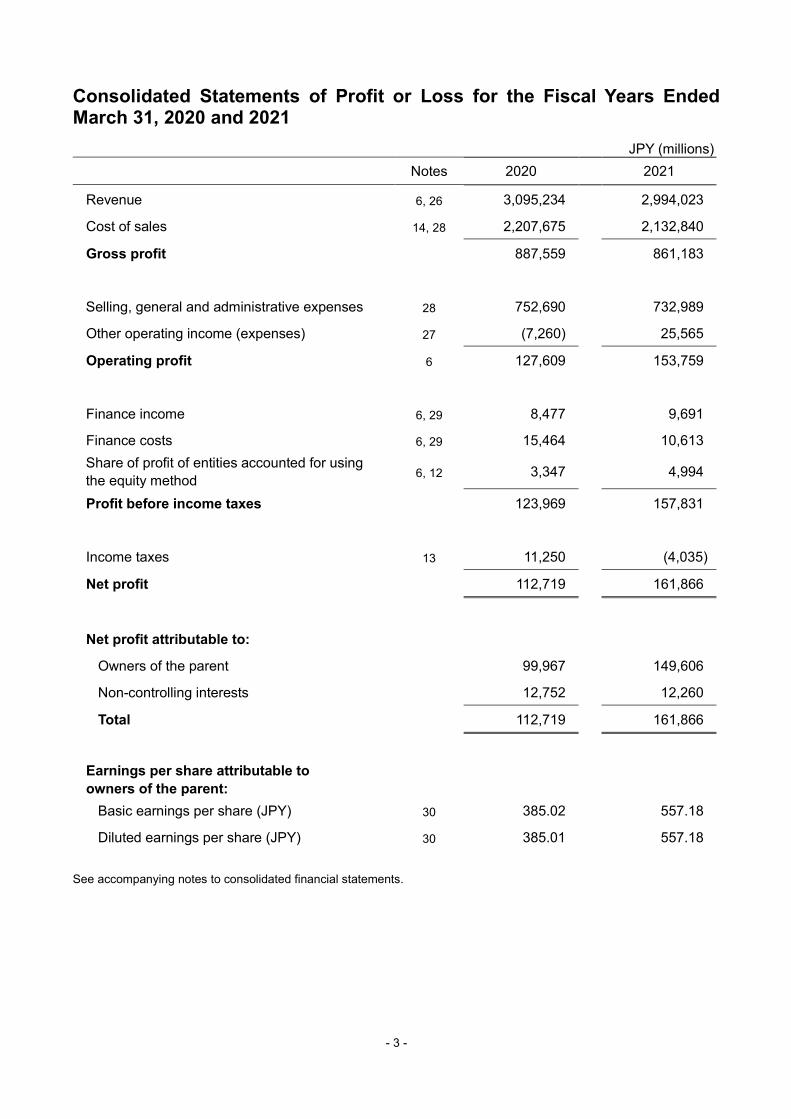
Consolidated Statements of Profit or Loss for the Fiscal Years Ended March 31, 2020 and 2021
JPY (millions) Notes 2020 2021
Revenue 6, 26 3,095,234 2,994,023
Cost of sales 14, 28 2,207,675 2,132,840
Gross profit 887,559 861,183
Selling, general and administrative expenses 28 752,690 732,989
Other operating income (expenses) 27 (7,260) 25,565
Operating profit 6 127,609 153,759
Finance income 6, 29 8,477 9,691
Finance costs 6, 29 15,464 10,613 Share of profit of entities accounted for using the equity method 6, 12 3,347 4,994
Profit before income taxes 123,969 157,831
Income taxes 13 11,250 (4,035)
Net profit 112,719 161,866
Net profit attributable to:
Owners of the parent 99,967 149,606
Non-controlling interests 12,752 12,260
Total 112,719 161,866
Earnings per share attributable to owners of the parent:
Basic earnings per share (JPY) 30 385.02 557.18
Diluted earnings per share (JPY) 30 385.01 557.18 See accompanying notes to consolidated financial statements.
- 4 -
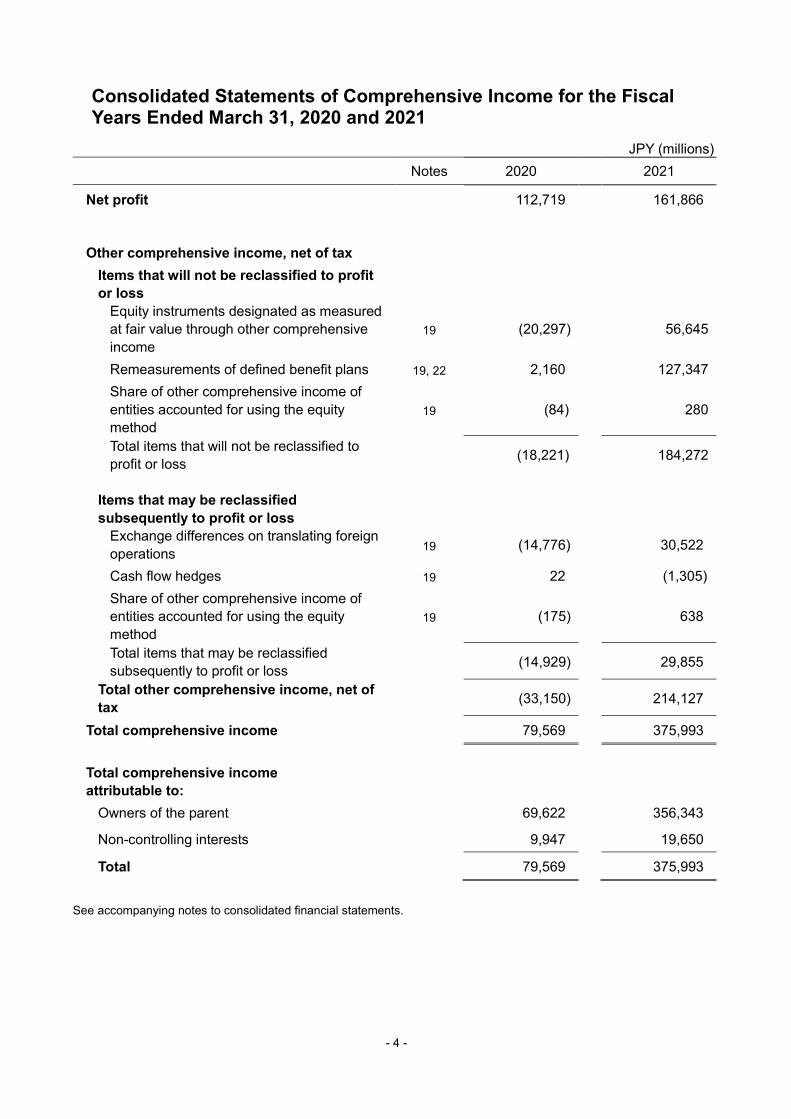
Consolidated Statements of Comprehensive Income for the Fiscal Years Ended March 31, 2020 and 2021
JPY (millions) Notes 2020 2021
Net profit 112,719 161,866
Other comprehensive income, net of tax Items that will not be reclassified to profit or loss
Equity instruments designated as measured at fair value through other comprehensive income
19 (20,297) 56,645
Remeasurements of defined benefit plans 19, 22 2,160 127,347 Share of other comprehensive income of entities accounted for using the equity method
19 (84) 280
Total items that will not be reclassified to profit or loss (18,221) 184,272
Items that may be reclassified subsequently to profit or loss
Exchange differences on translating foreign operations 19 (14,776) 30,522
Cash flow hedges 19 22 (1,305) Share of other comprehensive income of entities accounted for using the equity method
19 (175) 638
Total items that may be reclassified subsequently to profit or loss (14,929) 29,855
Total other comprehensive income, net of tax (33,150) 214,127
Total comprehensive income 79,569 375,993
Total comprehensive income attributable to:
Owners of the parent 69,622 356,343
Non-controlling interests 9,947 19,650
Total 79,569 375,993
See accompanying notes to consolidated financial statements.

- 5 -
Consolidated Statements of Changes in Equity for the Fiscal Years Ended March 31, 2020 and 2021
JPY (millions)
Notes
Equity attributable to owners of the parent Non-
controlling interests
Total
equity Share capital Share
premium Retained earnings Treasury
shares Other
components of equity
Total
As of April 1, 2019 397,199 138,824 354,582 (3,547) (28,119) 858,939 200,742 1,059,681
Net profit – – 99,967 – – 99,967 12,752 112,719
Other comprehensive income 19 – – – – (30,345) (30,345) (2,805) (33,150)
Comprehensive income – – 99,967 – (30,345) 69,622 9,947 79,569
Purchase of treasury shares 19 – – – (674) – (674) – (674)
Sale of treasury shares 19 – (0) – 63 – 63 – 63
Cash dividends 20 – – (18,188) – – (18,188) (4,941) (23,129)
Put option, written over shares held by a non-controlling interest shareholder
– 912 –
– – 912 – 912
Changes in interests in subsidiaries 11 – 0 –
– – 0 (1,899) (1,899)
Total transactions with owners – 912 (18,188) (611) – (17,887) (6,840) (24,727)
As of March 31, 2020 397,199 139,735 436,361 (4,157) (58,464) 910,674 203,849 1,114,523
JPY (millions)
Notes
Equity attributable to owners of the parent Non- controlling interests
Total
equity Share capital Share
premium Retained earnings Treasury
shares Other
components of equity
Total
As of April 1, 2020 397,199 139,735 436,361 (4,157) (58,464) 910,674 203,849 1,114,523
Net profit – – 149,606 – – 149,606 12,260 161,866
Other comprehensive income 19 – – – – 206,737 206,737 7,390 214,127
Comprehensive income – – 149,606 – 206,737 356,343 19,650 375,993
Issuance of common shares 19 30,632 30,374 – – – 61,006 – 61,006
Purchase of treasury shares 19 – – – (640) – (640) – (640)
Sale of treasury shares 19 – 20 – 3,219 – 3,239 – 3,239
Cash dividends 20 – – (21,307) – – (21,307) (5,400) (26,707)
Changes in interests in subsidiaries 11 – (1,164) –
– – (1,164) 35,576 34,412
Total transactions with owners 30,632 29,230 (21,307) 2,579 – 41,134 30,176 71,310
As of March 31, 2021 427,831 168,965 564,660 (1,578) 148,273 1,308,151 253,675 1,561,826
See accompanying notes to consolidated financial statements.

- 6 -
Consolidated Statements of Cash Flows for the Fiscal Years Ended March 31, 2020 and 2021
JPY (millions) Notes 2020 2021
Cash flows from operating activities
Profit before income taxes 123,969 157,831
Depreciation and amortization 6 166,360 167,613
Impairment loss 6,10 6,384 4,035
(Decrease) in provisions (5,639) (5,749)
Finance income 29 (8,477) (9,691)
Finance costs 29 15,464 10,613 Share of profit of entities accounted for using the equity method (3,347) (4,994)
(Increase) decrease in trade and other receivables (26,263) 4,120
Decrease (increase) in contract assets 11,911 (20,139)
Decrease in inventories 11,430 19,249
Increase in trade and other payables 1,653 4,926
Increase in contract liabilities 11,536 24,652
Other, net (20,517) (50,443)
Subtotal 284,464 302,023
Interest and dividends received 6,947 5,161
Interest paid (9,052) (7,813)
Income taxes paid (20,496) (24,464)
Net cash provided by operating activities 261,863 274,907
Cash flows from investing activities
Purchases of property, plant and equipment (72,825) (59,307)
Proceeds from sales of property, plant and equipment 6,903 41,761
Acquisitions of intangible assets (16,372) (11,629) Purchase of equity instruments designated as measured at fair value through other comprehensive income (1,820) (2,620) Proceeds from sales of equity instruments designated as measured at fair value through other comprehensive income 12,279 97,107
Purchase of shares of newly consolidated subsidiaries 7 (6,935) (202,588) Increase in cash flows resulting in change in scope of consolidation, net of consideration transferred 7 52 100
Proceeds from sales of shares of subsidiaries 18 – 8,444 Disbursements for sales of shares of subsidiaries (220) (2,969)
Purchases of investments in associates or joint ventures (376) (230) Proceeds from sales of investments in associates or joint ventures 18 2,098 8,448
Other, net (6,807) 992
Net cash used in investing activities (84,023) (122,491)

- 7 -
JPY (millions) Notes 2020 2021
Cash flows from financing activities
(Decrease) in short-term borrowings, net 21 (4,349) (47,333)
Proceeds from long-term borrowings 21 37,879 99,181
Repayments of long-term borrowings 21 (48,723) (44,009)
Proceeds from issuance of bonds 21 – 35,000
Redemption of bonds 21 – (55,000)
Payments of lease liabilities 32 (53,620) (57,530)
Proceeds from issuance of common shares 19 – 60,893 Proceeds from sales of interests in subsidiaries to non-controlling interests – 35,000
Dividends paid 20 (18,177) (21,296)
Dividends paid to non-controlling interests (4,939) (5,396)
Proceeds from sale of treasury shares 63 3,239
Other, net 119 (1,355)
Net cash (used in) provided by financing activities (91,747) 1,394 Effect of exchange rate changes on cash and cash equivalents (4,496) 6,122
Net increase in cash and cash equivalents 81,597 159,932
Cash and cash equivalents, at the beginning of the year 278,314 359,252 (Decrease) increase in cash and cash equivalents
resulting from transfer to assets held for sale 18 (659) 4,161
Cash and cash equivalents, at the end of the year 16 359,252 523,345
See accompanying notes to consolidated financial statements.

- 8 -
Notes to Consolidated Financial Statements
1. Reporting Entity NEC Corporation (the “Company” or “NEC”) is a public company incorporated in Japan. NEC and its subsidiaries (collectively, the “NEC Group”) has five segments: Public Solutions business, Public Infrastructure business, Enterprise business, Network Services business and Global business, all of which are operating segments. For further information regarding these businesses, see Note 6. “Segment Information.” The NEC Group’s principal operating bases are located mainly in Japan and other countries as disclosed in Note 11. “Subsidiaries.”
2. Basis of Preparation Compliance with International Financial Reporting Standards The Company fulfills the requirements of a “specified company of designated International Financial Reporting Standards” as provided in Article 1-2 of the “Ordinance on Terminology, Forms, and Preparation Methods of Consolidated Financial Statements” (Ordinance of the Ministry of Finance No. 28 of 1976, the “Ordinance on Consolidated Financial Statements”). Therefore, in accordance with the provisions of Article 93 of the Ordinance on Consolidated Financial Statements, the Company’s consolidated financial statements are prepared in conformity with International Financial Reporting Standards (“IFRS”), as issued by the International Accounting Standards Board (“IASB”). The term “IFRS” also includes International Accounting Standards (“IAS”) and the related interpretations of the Standard Interpretations Committee (“SIC”) and IFRS Interpretations Committee (“IFRIC”). Approval of Financial Statements The consolidated financial statements were approved by Takayuki Morita, President and CEO, and Osamu Fujikawa, Executive Vice president and CFO, on June 22, 2021.
Basis of Measurement The consolidated financial statements have been prepared on historical cost, except for certain assets and liabilities separately stated in Note 3. “Significant Accounting Policies.”
Functional and Presentation Currency The consolidated financial statements are presented in Japanese yen (“JPY”), which is the functional currency of the Company. All financial information presented in JPY has been rounded to the nearest million JPY, except when otherwise indicated. 3. Significant Accounting Policies Unless otherwise stated, accounting policies set out below have been applied consistently to all periods presented in the consolidated financial statements. Basis of Consolidation Subsidiaries The consolidated financial statements include the accounts of the Company and its subsidiaries. All significant intercompany balances and transactions have been eliminated in consolidation. Subsidiaries are entities that are directly or indirectly controlled by the Company. The NEC Group controls an entity when the NEC Group is exposed or has rights to variable returns from involvement with the entity and has the ability to affect those returns by using its power, which is the current ability to direct the relevant activities, over the entity. To determine whether or not the NEC Group controls an entity, status of voting rights or similar rights, contractual agreements, and other relevant factors are considered. The financial statements of the subsidiaries are included in the consolidated financial statements from the date when the control is obtained until the date when the control is lost. The financial statements of subsidiaries have been adjusted in order to conform to the accounting policies adopted by the Company as necessary.

- 9 -
Changes in the Company’s ownership interests in subsidiaries that do not result in a loss of control are accounted for as equity transactions. Any differences between the adjustment to non-controlling interest and fair value of consideration transferred or received are recognized directly in equity attributable to owners of the Company.
When control over a subsidiary is lost, the investment retained after the loss of control is re-measured at fair value as of the date when control is lost, and any gain or loss on such re-measurement and disposal of the interest sold is recognized in profit or loss. Investments in Associates and Joint Arrangements Associates are entities over which the NEC Group has significant influence over the decisions on financial and operating policies, but does not have control or joint control. Joint arrangements are arrangements of which two or more parties have joint control. Joint control is the contractually agreed sharing of control of an arrangement, which exists only when decisions about the relevant activities require the unanimous consent of the parties sharing control. The NEC Group classifies joint arrangements into either joint ventures or joint operations. The classification of a joint arrangement as a joint venture or a joint operation depends upon the rights and obligations of the parties to the arrangement. Joint venture is a joint arrangement whereby the parties that have joint control of the arrangement have rights to the net assets of the arrangement. Joint operation is a joint arrangement whereby the parties that have joint control of the arrangement have rights to the assets and obligations for the liabilities, relating to the arrangement. There are no joint operations that are considered material to the NEC Group. Investment in associates and joint ventures are accounted for using the equity method and recognized at cost on the acquisition date. The carrying amount is subsequently increased or decreased to recognize the NEC Group’s share of profit or loss and other comprehensive income of the associates and joint ventures after the date of initial recognition. The financial statements of associates and joint ventures have been adjusted in order to conform to the accounting policies adopted by the Company in applying the equity method, as necessary. Impairment of an investment in associates and joint ventures is measured by comparing the recoverable amount and the carrying amount of the investment. The impairment loss is recognized in profit or loss. If there has been a change in the estimates used to determine the recoverable amount and the recoverable amount increases, the impairment loss is reversed.
Business Combinations Business combinations are accounted for using the acquisition method. The consideration transferred for the acquisition of a subsidiary is measured at fair value of the assets transferred, the liabilities incurred to former owners of the acquiree, and the equity interests issued by the NEC Group. The consideration for certain acquisitions includes payments that are contingent upon future events, such as the achievement of milestones and sales targets. Identifiable assets acquired and liabilities and certain contingent liabilities assumed are measured at the fair values at the acquisition date. Non-controlling interests are initially measured either at fair value or at the non-controlling interests’ proportionate share of the recognized amount of the acquiree's identifiable net assets on a transaction-by-transaction basis. Goodwill is measured as the excess of the sum of the fair value of consideration transferred, the amount of any non-controlling interests in the acquiree, and the fair value of the acquirer’s previously held equity interest less the fair value of identifiable assets acquired, net of liabilities assumed at the acquisition date.
Acquisition related costs, such as agency, legal, and other professional, or consulting fees are recognized as expenses in the period they are incurred.
Foreign Currency Translation Foreign Currency Transactions Transactions in foreign currencies are translated into the respective functional currencies of the NEC Group companies using the exchange rate at the dates of the transactions. Monetary assets and liabilities denominated in foreign currencies are translated into the functional currency using the exchange rate at the end of each reporting period. Non-monetary assets

- 10 -
and liabilities denominated in foreign currencies that are measured at historical cost are translated into the functional currency using the exchange rate at the transaction date. Non-monetary assets and liabilities denominated in foreign currencies that are measured at fair value are translated into the functional currency using the historical exchange rates at the date when the fair value was determined. Exchange differences arising from the settlement or translation of monetary items are recognized in profit or loss except for exchange differences arising from financial assets measured at fair value through other comprehensive income and qualifying hedging instruments in cash flow hedges to the extent that the hedges are effective, which are recognized in other comprehensive income. Foreign Operations The assets and liabilities of foreign operations are translated into Japanese yen using the exchange rate prevailing at the reporting date and their income and expenses are translated into Japanese yen using the average exchange rate for the period, unless the exchange rate fluctuates significantly. The foreign exchange differences arising on translation are recognized in other comprehensive income. In cases foreign operations are disposed of, the cumulative amount of other comprehensive income relating to that particular foreign operation is reclassified to profit or loss as part of gains and losses on the disposal. Financial Instruments Non-derivative Financial Assets The NEC Group classifies non-derivative financial assets into financial assets measured at amortized cost, financial assets measured at fair value through other comprehensive income, or financial assets measured at fair value through profit or loss. The NEC Group has irrevocably elected to designate all equity instruments, except for those in the form of venture capital investments, in principle as financial assets measured at fair value through other comprehensive income. The NEC Group initially recognizes financial assets measured at amortized cost on the date they originated. All other financial assets are initially recognized in the consolidated statements of financial position when the NEC Group becomes a party to the contractual provisions of the financial instruments. The NEC Group derecognizes financial assets when the contractual rights to the cash flows from the asset expire, or when the NEC Group transfers the contractual rights to the cash flows from the asset, as well as substantially all the risks and rewards of ownership of the financial asset. Separate assets or liabilities are recognized when the NEC Group derecognizes financial assets, but still retains an interest that does not result in the retention of control over the financial asset. Financial assets held by the NEC Group are measured at amortized cost when both of the following conditions are met: - The financial asset is held within a business model whose objective is to hold financial assets in order to collect
contractual cash flows; and - The contractual terms of the financial asset give rise on specified dates to cash flows that are solely payments of principal
and interest on the principal amount outstanding. Financial assets measured at amortized cost are initially measured at fair value, plus any directly attributable transaction costs. Trade receivables that do not contain a significant financing component are measured at their transaction price. After initial recognition, the carrying amounts of financial assets measured at amortized cost are recognized using the effective interest method, less impairment loss. Amortization using the effective interest method and gains and losses on derecognition are recognized in profit or loss for the period.
The NEC Group has in principle elected to present subsequent changes in fair value of certain equity instruments in other comprehensive income except for those in the form of venture capital investments. These equity instruments are initially measured at fair value, plus any directly attributable transaction costs and measured at fair value in subsequent periods. Changes in fair value are included in other comprehensive income and never reclassified to profit or loss and the NEC Group never reclassifies accumulated other comprehensive income to retained earnings subsequently. Dividends from equity instruments designated as measured at fair value through other comprehensive income are recognized as finance income in profit or loss, unless the dividends clearly represent a recovery of part of the cost of the investment. Financial assets other than financial assets measured at amortized cost or equity instruments designated as measured at fair value through other comprehensive income are classified as financial instruments measured at fair value through profit or loss. These financial assets are measured at fair value after initial recognition, and changes in their fair value are recognized in profit or loss. Gains and losses on financial instruments measured at fair value through profit or loss are

- 11 -
recognized in profit or loss.
Impairment of Financial Assets As for impairments on financial assets measured at amortized costs, the NEC Group recognizes allowances for expected credit losses by assessing whether the credit risk on the financial assets has increased significantly at each reporting date since initial recognition. Allowances are measured based on the estimated credit loss arising from the possible defaults during the 12 months after the reporting date (12-month expected credit loss) when the credit risk associated with the financial assets has not significantly increased since initial recognition. When the credit risk associated with the financial assets has significantly increased since initial recognition or the financial assets are credit-impaired, an allowance for expected credit loss is calculated based on the estimated credit loss arising from all possible defaults over the estimated remaining period of the financial instruments (life-time expected credit loss). Notwithstanding the above, an allowance for expected credit loss on trade receivables and contract assets is always calculated based on the estimated credit loss over the entire period. Significant increase in credit risk is determined based on changes in risks of a default occurring and the changes in such risks are determined considering significant financial difficulty, breach of contract, or increase in probability where the borrower will enter bankruptcy or other financial reorganization. Changes in allowances are recognized in profit and loss. Non-derivative Financial Liabilities The NEC Group classifies non-derivative financial liabilities into financial liabilities measured at amortized cost. The NEC Group recognizes debt securities on the date of issuance. All other financial liabilities are initially recognized on the date when the NEC Group becomes a party to contractual provisions. The NEC Group derecognizes a financial liability when its contractual obligations are discharged, canceled, or expired. These financial liabilities are measured initially at fair value less any directly attributable transaction costs and subsequently measured at amortized cost using the effective interest method. Amortization amounts are recognized as finance costs in profit or loss.
Derivative Financial Instruments The NEC Group holds derivative financial instruments, such as forward exchange contracts, interest rate swaps, and currency options, to hedge foreign currency exposure and interest rate exposures. Derivatives are measured at fair value at the inception and subsequent periods. At the inception of a hedge relationship, derivatives designated as hedging instruments are classified as either cash flow hedge, fair value hedge, or hedge of a net investment. For derivatives that are not designated as hedging instruments, any changes in the fair value of the derivative are recognized in profit or loss. For derivatives that are designated as hedging instruments, the NEC Group documents the relationship between the hedging instrument and hedged item, risk management objectives and strategy in undertaking the hedge transaction and the hedged risk at the inception of the hedges. The NEC Group initially and continually assesses whether the hedging instruments are highly effective in offsetting changes in the fair value or the cash flows of the respective hedged items. The NEC Group does not currently have derivatives that are designated as hedging instruments in a fair value hedge nor net investment hedge relationship. Cash Flow Hedges The effective portion of changes in the fair value of derivatives is recognized in other comprehensive income and any ineffective portion of changes in the fair value is immediately recognized in profit or loss. The amount accumulated in other components of equity is reclassified to profit or loss in the same period during which the cash flows of the hedged item affect profit or loss. Hedge accounting is discontinued prospectively when the hedging instrument expires, is sold, terminated, exercised, when no longer meets the criteria for hedge accounting, a forecast transaction is no longer highly probable, or the designation is revoked. In addition, the NEC Group has selected the option to continue to apply hedge accounting of IAS 39. Cash and Cash Equivalents Cash and cash equivalents consist of cash on hand, demand deposits, and short-term highly liquid investments that are readily convertible to known amounts of cash and subject to insignificant risk of changes in value, and redeemable in three months or less from each acquisition date.

- 12 -
Property, Plant and Equipment Property, plant and equipment are measured at cost less accumulated depreciation and accumulated impairment losses. Cost includes expenses directly attributable to acquisition of the asset, costs of dismantling and removing the assets, costs of restoring the site, and borrowing costs to be capitalized. When significant components of property, plant and equipment have different useful lives, they are accounted for as separate items (by major components) of property, plant and equipment. Gains or losses on disposals of property, plant and equipment are recognized in profit or loss. Except for assets that are not subject to depreciation, such as land and construction in progress, assets are depreciated mainly using the straight-line method over the estimated useful lives of assets. The residual value is generally estimated at zero, except for the cases where the selling price, after deducting the costs of disposal, at the end of the useful lives is estimable.
The estimated useful lives of major property, plant and equipment are as follows:
Buildings and structures 7–60 years Machinery and equipment 2–22 years Tools, furniture and fixtures 2–20 years
Depreciation methods, useful lives, and residual values of assets are reviewed at the end of each reporting period and revised, as necessary. Goodwill An asset representing the future economic benefits arising together with other assets through the acquisition of a subsidiary that are not individually identifiable is recognized as Goodwill. Goodwill is not amortized, but is tested for impairment at least annually or more frequently whenever there is any indication of impairment for a cash-generating unit (“CGU”) to which goodwill is allocated. The NEC Group initially measures goodwill at the acquisition date as the excess of the aggregate of consideration transferred, amount of any non-controlling interest in the acquired entity, and acquisition-date fair value of any previous equity interest in the acquired entity, less the net recognized amount of the identifiable assets acquired and liabilities assumed. If those amounts are less than the fair value of the net identifiable assets of the business acquired, the difference is recognized directly in profit or loss as a bargain purchase gain. Intangible Assets Development expenditures on software for sale and software for internal use are recognized as intangible assets, if all of the following criteria of capitalization are met: - the technical feasibility of completing the intangible asset so that it will be available for use or sale; - its intention to complete the intangible asset and use or sell it; - its ability to use or sell the intangible asset; - how the intangible asset will generate probable future economic benefits; - the availability of adequate technical, financial, and other resources to complete the development and to use or sell the
intangible asset; and - its ability to measure reliably the expenditure attributable to the intangible asset during its development. Other intangible assets, such as patents and licenses, are recognized at cost when acquired. Intangible assets acquired in business combinations and recognized separately from goodwill, including acquired capitalized development costs, are recognized at fair value at the acquisition date. Intangible assets with definite useful lives are amortized mainly on a straight-line basis over their estimated useful lives from the date when the assets are available for use. Amortization of intangible assets is included in cost of sales and selling, general and administrative expenses. Customer related intangible assets are amortized on a straight-line basis over the estimated useful lives. Software for sale is amortized based on the expected sales volume over the expected effective period unless such amortization method does not reflect the pattern of consumption of the expected future benefits from the asset. In such cases, software for sale is amortized on a straight-line basis over the remaining useful life. Software for internal use is amortized on a straight-line basis over the estimated useful lives. Other intangible assets, such as patents and licenses, are amortized from the date when the asset is available for use over the estimated useful lives, such as a contract period, using the method that reflects the pattern of consumption of the future economic benefits by the NEC Group.

- 13 -
The estimated useful lives of major intangible assets are as follows:
Software for sale 1–9 years Software for internal use 3–5 years Customer related intangible assets 3–19 years Acquired capitalized development costs 7–17 years Others 2–10 years
Amortization methods, useful lives, and residual values of intangible assets with definite useful lives are reviewed at the end of each reporting period and revised as necessary. Leases At inception of a contract, the NEC Group assesses whether the contract is, or contains, a lease. The NEC Group determines a contract is, or contains, a lease if the contract conveys the right to control the use of an identified asset for a period of time in exchange for consideration. In addition, the NEC Group elected not to recognize right-of-use assets and lease liabilities for either short-term leases with a lease term of 12 months or less or leases for which the underlying assets are of low value. The NEC Group recognizes the lease payments associated with those leases as an expense on a straight-line basis over their lease term. As a lessee At the commencement date of a lease, the NEC Group recognizes right-of-use assets that represent the right to use an underlying asset and a lease liability that represents its obligation to make lease payments. The lease liabilities are measured at the present value of the lease payments that are not paid at the commencement date. The lease payments are discounted using the interest rate implicit in the lease, if it is readily determinable, or otherwise, the lessee's incremental borrowing rate. Lease payments included in the measurement of the lease liability comprise the following:
- fixed payments, including in-substance fixed payments; - variable lease payments that depend on an index or a rate, initially measured using the index or rate at the
commencement date; - amounts expected to be payable under a residual value guarantee; - the exercise price under a purchase option that the NEC Group is reasonably certain to exercise; and - penalties for early termination of a lease unless the NEC Group is reasonably certain not to terminate the lease
early. The lease liability is subsequently measured at amortized cost using the effective interest method, and is remeasured under certain circumstances, such as when there is a change in future lease payments arising from a change in an index or a rate, if there is a change in the NEC Group’s estimate of the amount expected to be payable under a residual value guarantee, or if the NEC Group changes its assessment of whether it will exercise a purchase, extension or termination option. The right-of-use assets are initially measured at the initial measurement amount of the lease liabilities adjusted for any prepaid lease payments before the commencement date and certain other items and are subsequently depreciated using the straight-line method from the commencement date to the earlier of the end of the useful life of the underlying asset or the end of the lease term. The estimated useful lives of the underlying assets are determined on the same basis as those of property, plant and equipment. In addition, after the commencement date, the right-of-use asset is measured at cost less accumulated depreciation and accumulated impairment losses, and is adjusted for remeasurements of the lease liability. The right-of-use assets are presented as part of property, plant, and equipment, net. Inventories Inventories are measured at the lower of cost and net realizable value. The cost of inventories that are interchangeable is determined by using the first-in first-out method or the periodic average method, whereas the cost of inventories that are not interchangeable is determined by using the specific identification of their individual cost. Cost of inventories comprises all costs of purchase, costs of production, costs of conversion, and other costs incurred in bringing the inventories to their

- 14 -
present location and condition. Costs of finished goods and work in process include an allocation of production overheads that are based on the normal capacity of the production facilities. Net realizable value is the estimated selling price in the ordinary course of business, less the estimated costs of completion and the estimated costs necessary to make the sale. Impairment of Non-Financial Assets Non-financial assets other than inventories, deferred tax assets, assets held for sale, assets arising from employee benefits and contract assets and assets recognized from costs to obtain a contract with a customer are assessed for indications of impairment at the end of each reporting period. This assessment is performed for an asset or a CGU, which is the smallest identifiable group of assets that generates cash inflows that are largely independent of the cash inflows from other assets or groups of assets. An impairment loss is recognized in profit or loss and the carrying amount is reduced to the recoverable amount. The recoverable amount is determined for an individual asset, or a CGU when the individual asset does not generate cash inflows that are largely independent of those from other assets or groups of assets. The NEC Group’s corporate assets do not generate independent cash inflows. If there is any indication that corporate assets may be impaired, the recoverable amount is estimated for the CGU to which the corporate assets belong. Corporate assets are assets other than goodwill that contribute to the future cash flows of both the CGU to which the corporate assets belong and other CGUs, and include land or buildings held by administrative departments. The recoverable amount is the higher of the fair value of an asset or a CGU, less costs of disposal and its value in use. Value in use is calculated as the present value of the estimated future cash flows associated with the asset or CGU. In assessing value in use, the future cash flows are estimated by using the growth rate which is determined based on the conditions of the respective countries and industries to which the CGU belongs, and are discounted to the present value using a pre-tax discount rate, which reflects current market assessments of the time value of money and any risks specific to the asset or the CGU. For goodwill and intangible assets with indefinite useful lives, the recoverable amount is estimated at the same time each year for the level of a CGU to which goodwill and intangible assets with indefinite lives have been allocated, and they are also tested for impairment whenever there is any indication of impairment. An impairment loss recognized in prior periods for an asset other than goodwill is reversed if there is any indications that the loss recognized for the asset may no longer exist or may have decreased, and if, and only if, there has been a change in the estimates used to determine the asset’s recoverable amount since the last impairment loss was recognized. Impairment losses are reversed only to the extent that the asset’s carrying amount does not exceed the carrying amount that would have been determined, net of depreciation or amortization, had no impairment loss been recognized. Impairment losses on goodwill are not reversed. Assets Held for Sale A non-current asset or disposal group is classified as held for sale if its carrying amount will be recovered through a sale transaction rather than through its continuing use. The condition above is met only when the asset is available for immediate sale in its present condition and its sale is highly probable. If the NEC Group commits to a sale plan involving loss of control of a subsidiary, it classifies all the assets and liabilities of the subsidiary as held for sale when the criteria set out above are met, regardless of whether it will retain a non-controlling interest in its former subsidiary after the sale. Non-current assets or disposal groups classified as held for sale are measured at the lower of their carrying amount and fair value less costs to sell. Property, plant and equipment and intangible assets classified as held for sale are not depreciated or amortized. Employee Benefits Defined Benefit Plans The NEC Group’s defined benefit plans consist of defined benefit pension plans and lump-sum severance payment plans. For defined benefit plans, the present value of defined benefit obligations, less the fair value of plan assets is recognized as either liability or asset. Defined benefit obligations are measured separately for each plan by discounting estimated amount of future benefits employees have earned in return for their services in the current and prior periods to its present value. The discount rate is the yield at the reporting date on high-quality corporate bonds that is consistent with the currency and estimated terms of the NEC Group’s post-employment benefit obligations. The NEC Group uses the projected unit credit method to determine the present value of defined benefit obligations, service cost, and the past service cost for each defined benefit obligation. Past service costs arising from a plan amendment or curtailment are recognized in profit or loss

- 15 -
upon occurrence of the plan amendment or curtailment. Remeasurement of net defined benefit plans is recognized in full as other comprehensive income and not reclassified to retained earnings in subsequent periods.
Defined Contribution Pension Plans Defined contribution pension plans are post-employment benefit plans under which the NEC Group pays fixed contributions to a separate entity (fund) and has no legal or constructive obligations to pay further amounts. Contributions to defined contribution pension plans are recognized as expense in profit or loss when the employees render related services. Provisions Provisions are recognized when the NEC Group has present legal or constructive obligations as a result of past events, it is probable that outflows of resources embodying economic benefits will be required to settle the obligations and reliable estimates can be made of the amount of the obligations.
Revenue In accordance with IFRS 15, the following five-step approach is applied to recognize revenue, except for interest and dividend income within the scope of IFRS 9 and lease payments within the scope of IFRS 16.
Step 1: Identify the contract with a customer Step 2: Identify performance obligations in the contract Step 3: Determine the transaction price Step 4: Allocate the transaction price to each performance obligation in the contract Step 5: Recognize revenue when (or as) each performance obligation is satisfied
Identifying Distinct Performance Obligations in Contracts with Customers The NEC Group recognizes revenue from contracts with customers for contracts for hardware and packaged software deployments, for services to customers and for system integrations and equipment constructions. The NEC Group identifies distinct promised goods or services (i.e., performance obligations) within these contracts and accounts for revenue in accordance with their performance obligations. The NEC Group separately accounts for the good or service, if a promised good or service is distinct where the NEC Group’s promise to transfer the good or service to the customer is separately identifiable from other promises in the contracts, and a customer can benefit from the good or service either on its own or together with other resources that are readily available to the customer.
Determining the Transaction Price The NEC Group considers the effects of variable consideration, constraining estimates of variable consideration, the existence of a significant financing component in the contract, non-cash consideration, and consideration payable to a customer when determining the transaction price. The NEC Group recognizes a variable consideration, which consists primarily of sales incentives that are offered to wholesalers and retailers as part of the NEC Group’s sales promotion activities. When there is a possibility of subsequent variability in the consideration receivable from these customers, the variable consideration is estimated and included in revenue to the extent that it is highly probable that its inclusion will not result in a significant reversal in the amount of cumulative revenue recognized when the uncertainty has been subsequently resolved. When estimating the sales incentives, NEC Group uses the expected value method considering the historical experience of sales by customers and products. In assessing whether a contract contains a financing component and whether that financing component is significant to the contract, the NEC Group considers the difference, if any, between the amount of promised consideration and the cash selling price of the promised goods or services. The NEC Group also considers the combined effect of the expected length of time between when it transfers the promised goods or services to the customer and when the customer pays for those goods or services and the prevailing interest rates in the relevant market.
Allocating the Transaction Price to Performance Obligation The NEC Group allocates the transaction price to each performance obligation (or distinct good or service) in an amount that depicts the amount of consideration to which it expects to be entitled in exchange for transferring the promised goods or services to the customer. To allocate the transaction price to each performance obligation on a relative stand-alone selling price basis, the stand-alone selling price at contract inception of the distinct good or service underlying each performance obligation in the contract is determined and the transaction price is allocated in proportion to those stand-alone selling prices.

- 16 -
A stand-alone selling price is estimated if it is not directly observable. For contracts for hardware and packaged software deployments, the NEC Group estimates stand-alone selling prices mainly based on adjusted market assessment approach. For contracts for services to customers and for system integrations and equipment constructions, the NEC Group estimates stand-alone selling price mainly based on expected cost plus a margin approach.
Satisfaction of Performance Obligation The NEC Group recognizes revenue when or as the NEC Group satisfies a performance obligation at a point in time or over time by transferring promised goods or services to a customer. The NEC Group recognizes revenue over time if one of the following criteria is met; i) the customer simultaneously receives and consumes the benefits provided by the NEC Group’s performance as the NEC Group performs, ii) the NEC Group’s performance creates or enhances an asset that the customer controls as the asset is created or enhanced, or iii) the NEC Group’s performance does not create an asset with an alternative use to the NEC Group and it has an enforceable right to payment for performance completed to date. If none of the above is met, the NEC Group recognizes revenue at a point in time when it is determined that control of an asset is transferred to a customer. Performance Obligations and Revenue Measurement Methods by Type of Goods or Services Contracts for Hardware and Packaged Software Deployments The major transactions regarding revenue from contracts for hardware and packaged software deployments are hardware (servers, mainframes, supercomputers, storage, business PCs, POS, ATMs, control equipment, wireless LAN routers), software (integrated operation management, application servers, security, database software), enterprise network solutions (IP telephony systems, WAN/wireless access equipment, LAN products), and network infrastructure (core network, mobile phone base stations, optical transmission systems, routers / switches, wireless backhaul). The NEC Group recognizes revenue when control over goods is transferred to customers. To determine the point in time at which the control is transferred to the customer, the NEC Group considers whether or not a) the NEC Group has a present right to payment for the asset; b) the customer has legal title to the asset; c) the NEC Group has transferred physical possession of the asset; d) the customer has the significant risks and rewards related to the ownership of the asset; and e) the customer has accepted the asset. This transfer generally corresponds to the date of the inspection by the customer. Revenue on Hardware requiring significant services, including installation, such as servers and network products, is in principle recognized upon the customer’s acceptance. Revenue on standard Hardware, such as personal computers and electronic devices, is recognized in principle upon delivery, where the control of the Hardware is transferred to the customer.
Contracts for Services to Customers (Including Maintenance and Outsourcing)/Contracts for System Integrations and Equipment Constructions The major transactions regarding revenue from contracts for services to customers/system integrations and equipment constructions are systems integration (systems implementation, consulting), safer city (public safety, digital government and digital finance), software & services for service providers (Operation Support System (OSS)/ Business Support System (BSS)), services & management (OSS/BSS, and service solutions), network infrastructure (submarine systems), outsourcing/cloud services and maintenance and support. Supply of the above services usually corresponds to any of the following criteria: a) the customer simultaneously receives and consumes all of the benefits provided by the NEC Group as the NEC Group performs; b) the NEC Group’s performance creates or enhances an asset that the customer controls as the asset is created; or c) the NEC Group’s performance does not create an asset with an alternative use to the NEC Group and the NEC Group has an enforceable right to payment for performance completed to date and, therefore, is a performance obligation that is satisfied over time. If the progress toward complete satisfaction of the performance obligation can be reasonably measured, revenue from a service is recognized by measuring the progress. If the progress cannot be reasonably measured, revenue from a service is recognized only to the extent of the costs incurred if the NEC Group expects to recover the costs until such time that the outcome of the performance obligation can be reasonably measured. Revenue for fixed price service contracts, including construction contracts is in principle recognized by the method of measuring the progress based on the costs incurred to date as a percentage of the total estimated project costs. When milestones for the obligations to be performed by the NEC Group are defined at contract inception, revenue is recognized based on completion of the contractual milestones. Revenue on ongoing service contracts is recognized by measuring the progress based on the period of services already

- 17 -
provided over the entire service period. Where outsourcing services are charged on a per unit basis, such as data usage, revenue is recognized when the service is provided. Where services are charged on a time period basis, revenue is recognized evenly over the period of the service contract. For maintenance, in principle revenue is recognized over the period in which the services are provided; however, where the contracts are charged on a time basis, revenue is recognized on a time and materials basis.
Where changes occur in the initial estimates of revenues, measure of progress, and costs incurred for a contract, the cumulative impact arising from a change of estimates is recognized in profit or loss in the period in which the changes become certain and possible to be estimated. Contracts with Multiple Performance Obligations Contracts with multiple performance obligations represent one contract that consists of several types of goods or services, such as supply of Hardware and related services or supply of software sales and support services. Goods or services promised to a customer are identified as a distinct performance obligation if the customer can benefit from the good or service either on its own or together with other resources that are readily available to the customer (i.e., the good or service is capable of being distinct); and the NEC Group’s promise to transfer the goods or service to the customer is separately identifiable from other promises in the contract (i.e., the promise to transfer the good or service is distinct within the context of the contract). The transaction price is allocated to each performance obligation on a relative stand-alone selling price basis, as mentioned above.
Methods for Measuring Progress When revenue is recognized over time, the NEC Group measures the progress to depict the performance in transferring control of goods or services promised to a customer. Revenue is recognized for a performance obligation satisfied over time only if the progress can be reasonably measured. When the progress cannot be measured reasonably, revenue is recognized only to the extent of the costs incurred.
Product Warranty The NEC Group repairs or exchanges products for free of charge to honor warranty within the warranty period after the sale of products or delivery of developed software based on contracts. Product warranty liabilities are recognized for individually estimated future warranty costs using the historical ratio of warranty costs to net sales or other relevant factors, considering the additional incremental costs that are expected to be incurred. If a product warranty is purchased separately or purchased in addition to the standard warranty by a customer, the product warranty is identified as a separate performance obligation. The transaction price is allocated to the performance obligation and revenue is recognized for the allocated amount over a warranty period.
Contract Asset and Contract Liability Contract asset is an entity’s right to consideration in exchange for goods or services that the entity has transferred to a customer when that right is conditioned on something other than the passage of time (i.e., the entity’s future performance) and contract liability is an entity’s obligation to transfer goods or services to a customer for which the entity has received consideration or the amount is due from the customer. Advances received from construction contracts are recorded as “contract liabilities” in the consolidated statements of financial position.
Contract Costs An asset is recognized for the incremental costs of obtaining a contract with a customer and costs to fulfill a contract if those costs are expected to be recovered. The costs are amortized on a systematic basis that is consistent with the transfer to the customer of the goods or services to which the asset relates. Income Taxes Income tax expenses comprise current and deferred taxes, both of which are recognized in profit or loss, except for the tax arising from transactions which are recognized either directly in equity or other comprehensive income. Current tax is the expected tax payable or receivable on taxable profit or tax losses for the reporting period, using tax rates and tax laws enacted or substantively enacted at the end of the reporting period. Deferred taxes are calculated based on the temporary differences between the carrying amount of assets and liabilities for

- 18 -
financial reporting purposes and the amounts used for taxation purposes, and unused tax losses carryforward at the end of the reporting period.
Deferred tax assets and liabilities are not recognized for the following temporary differences: - Temporary differences on the initial recognition of an asset or liability in a transaction which is not a business combination
and that affects neither accounting nor taxable profit nor loss; - Temporary differences arising from investments in subsidiaries, associates, and joint arrangements to the extent that it
is probable that the temporary difference will not reverse in the foreseeable future; and - Taxable temporary differences arising on the initial recognition of goodwill.
Deferred tax assets and liabilities are measured using the tax rates that are expected to apply to the period in which the temporary differences are expected to reverse based on the tax rates and tax laws that have been enacted or substantively enacted at the end of the reporting period.
Deferred tax assets and liabilities are offset when there is a legally enforceable right to offset current tax assets against current tax liabilities and the deferred tax assets and liabilities are for those related to income taxes levied by the same taxation authority on the same taxable entity.
A deferred tax asset is recognized for the carryforward of unused tax losses, and deductible temporary differences to the extent that it is probable that future taxable profit will be available against which they can be utilized. The amount of deferred tax assets is reduced to the extent that it is no longer probable that future taxable income would be sufficient to allow the benefit of part or all of the deferred tax asset to be utilized.
Share Capital Ordinary shares are classified as equity. Incremental costs directly attributable to the issuance of ordinary shares are recognized as a deduction from equity.
Treasury shares are measured at cost and deducted from equity. When NEC Group sells the treasury shares subsequently, the difference between the carrying amount and the consideration received is recognized in share premium. Additional costs directly related to repurchase or sale of treasury shares are deducted from equity. 4. Use of Accounting Estimates and Judgments The preparation of consolidated financial statements in accordance with IFRS requires management to make certain judgments, estimates, and assumptions that affect the application of policies and reported amounts of assets, liabilities, revenues, and expenses. These estimates and assumptions may differ from the actual results.
These estimates and underlying assumptions are reviewed by management on a continuous basis. Changes in these accounting estimates are recognized in the period in which the estimates are revised and in any future periods affected. The NEC Group has assessed the impact of significant uncertainty introduced by the COVID-19 pandemic on its accounting estimates and judgments based upon the information currently available. The area for which the estimate of potential effects of the COVID-19 and various governments’ counter-measures on future macroeconomic conditions was of particular importance as of March 31, 2021, is the recoverability of deferred tax assets. While the NEC Group’s operating results may be temporarily adversely impacted, management has determined that the impact of the COVID-19 pandemic on the NEC Group's long-term operating results would not be significant, considering the business environment in the ICT industry in which the NEC Group operates, where the management of the NEC Group expects a strong demand for investments in IT infrastructures, such as DX (Digital Transformation) in response to coming changes in society after the COVID-19 crisis. While there was not a material impact to the consolidated financial statements as of and for the fiscal year ended March 31, 2021, as events continue to evolve and additional information becomes available, actual results and outcomes in future reporting periods may differ materially from the managements of the NEC Group’s estimates. Information about judgments and estimates that have been made in the process of applying accounting policies and that have significant effects on the amounts reported in the consolidated financial statements, and information about accounting estimates and assumptions that have significant effects on the amounts reported in the consolidated financial statements, are as follows:
- Fair Value of Financial Instruments (Note 31) - Recoverable Amount in Impairment Test of Non-financial Assets (Note 10)

- 19 -
- Actuarial Assumptions of Post-retirement Benefits (Note 22) - Recognition and Measurement of Provisions (Note 23) - Revenue Recognition (Note 26) - Recoverability of Deferred Tax Assets (Note 13) - Identification of Lease and Determination of Lease Term (Note 32) - Measurement of Fair Value in Business Combinations (Note 7)
5. New Accounting Standards and Interpretations Issued and Not Yet Adopted
Of the new or amendments to IFRS standards that have been issued but are not effective as of the date of the approval of the consolidated financial statements of the NEC Group, none is expected to have material effects on the NEC Group's financial position or results of operations. 6. Segment Information The NEC Group has five reportable segments: Public Solutions business, Public Infrastructure business, Enterprise business, Network Services business and Global business, all of which are operating segments. Operating segments are defined as the components of the NEC Group for which separate financial information is available that is evaluated regularly by the board of directors of the Company, which is the NEC Group’s chief operating decision maker in deciding how to allocate resource and in assessing performance. The NEC Group’s various operations are classified into the following five operating segments and other business activities based primarily on the characteristics of the customers served. Public Solutions business provides Systems Integration including Systems Implementation and Consulting, Maintenance and Support, Outsourcing / Cloud Services, and System Equipment, mainly to Public, Healthcare, and Regional industries.
Public Infrastructure business provides Systems Integration including Systems Implementation and Consulting, Maintenance and Support, Outsourcing / Cloud Services, and System Equipment, mainly to Government and Media industry.
Enterprise business provides Systems Integration including Systems Implementation and Consulting, Maintenance and Support, Outsourcing / Cloud Services, and System Equipment, mainly to Manufacturing, Retail and Services, and Finance industries.
Network Services business provides Network Infrastructure including Core Network, Mobile Phone Base Stations, Optical Transmission Systems and Routers / Switches, Systems Integration including Systems Implementation and Consulting, and Services & Management including Operation Support System (“OSS”) / Business Support System (“BSS”), and Service Solutions mainly to telecom market in Japan.
Global business provides Safer Cities including Public Safety, Digital Government and Digital Finance, Software Services for Service Providers including OSS/BSS, Network Infrastructure including Submarine Systems and Wireless Backhaul, System Devices including Display and Projectors, and Energy Storage System.
Changes to reportable segments and matters related to measurement for segment profit or loss Effective as of April 1, 2020, the NEC Group's descriptions of the reportable segments have been revised based on a new performance management system and a new organization structure. Under the former organization structure, among the products and services provided by each business unit to customers, products and services managed by other business units were recorded as revenue in the segment to which the business unit managing the products and services belonged. However, sales revenue of products and services are now recorded in the business unit providing products and services to customers. Along with this, the “System Platform” segment is no longer an operating segment, and, excluding revenue recorded in other operating segments, revenue previously recorded in the “System Platform” segment, is now included in “Others”. The NEC Group also made segment changes due to organizational reforms and changes in the management system of subsidiaries that have been implemented to accelerate business development related to digital transformation (DX) and strengthen business execution capabilities by integrating businesses with compatibility. In connection with this revision, segment information for the fiscal year ended March 31, 2020 has been reclassified to conform to the presentation of the revised segments for the fiscal year ended March 31, 2021. Segment profit (loss) is measured by deducting amortization of intangible assets recognized as a result of M&A and expenses for acquisition of companies (financial advisory fees and other fees) from operating profit (loss). This segment profit (loss) is an indicator for measuring underlying profitability in order to clarify the contribution of acquired companies to the NEC Group's

- 20 -
overall earnings. Intersegment revenues are made at amount that approximates arm’s-length prices. Segment information on revenue, profit or loss and other metrics by reportable segment for the fiscal years ended March 31, 2020 and 2021, are as follows: Fiscal year ended March 31, 2020
JPY (millions) Reportable segments
Others
Reconciling
items
Consolidated
total Public Solutions
Public Infrastructure Enterprise
Network Services Global Total
Revenue: External customers 478,352 678,767 549,796 482,692 493,073 2,682,680 412,554 – 3,095,234 Intersegment 15,556 4,241 44,417 9,498 524 74,236 12,605 (86,841) –
Total 493,908 683,008 594,213 492,190 493,597 2,756,916 425,159 (86,841) 3,095,234 Segment profit (loss) 34,236 64,198 52,080 30,566 (3,167) 177,913 24,388 (56,503) 145,798 Amortization of acquisition-related intangible assets
(16,968) M&A related expenses (1,221) Operating profit 127,609 Finance income 8,477 Finance costs (15,464) Share of profit of entities accounted for using
the equity method
3,347 Profit before income taxes 123,969 Other items:
Depreciation and amortization 3,814 40,059 31,586 9,295 28,396 113,150 35,080 18,130 166,360 Impairment loss 752 10 53 1,789 2,811 5,415 968 1 6,384 Reversal of impairment loss – – (150) – – (150) – – (150) Capital expenditures 6,378 45,684 19,181 16,946 58,420 146,609 43,584 19,246 209,439
Fiscal year ended March 31, 2021
JPY (millions) Reportable segments
Others
Reconciling
items
Consolidated
total Public Solutions
Public Infrastructure Enterprise
Network Services Global Total
Revenue: External customers 425,060 692,876 503,074 538,810 449,988 2,609,808 384,215 – 2,994,023 Intersegment 13,472 3,829 38,431 8,543 674 64,949 6,709 (71,658) –
Total 438,532 696,705 541,505 547,353 450,662 2,674,757 390,924 (71,658) 2,994,023 Segment profit (loss) 39,361 59,399 48,210 41,204 7,495 195,669 7,695 (25,128) 178,236 Amortization of acquisition-related intangible assets
(22,769) M&A related expenses (1,708) Operating profit 153,759 Finance income 9,691 Finance costs (10,613) Share of profit of entities accounted for using
the equity method
4,994 Profit before income taxes 157,831 Other items:
Depreciation and amortization 3,741 37,251 31,048 10,293 33,437 115,770 32,209 19,634 167,613 Impairment loss 155 13 28 – 3,345 3,541 494 – 4,035 Reversal of impairment loss – – – – – – – (873) (873) Capital expenditures 6,980 31,348 35,334 14,287 15,518 103,467 36,164 21,626 161,257
“Others” mainly includes businesses such as business consulting and package solution services for the fiscal years ended March 31, 2020 and 2021. “Reconciling items” in segment profit (loss) includes amounts not allocated to each reportable segment that consist principally of corporate expenses of 60,769 million JPY, and 26,400 million JPY for the fiscal years ended March 31, 2020 and 2021, respectively. Corporate expenses are mainly general and administrative expenses and research and development expenses incurred at the headquarters of the Company. Also, these reconciling items include the gain on sales of the land of Sagamihara Plant recorded during the fiscal year ended March 31, 2021.
- 21 -
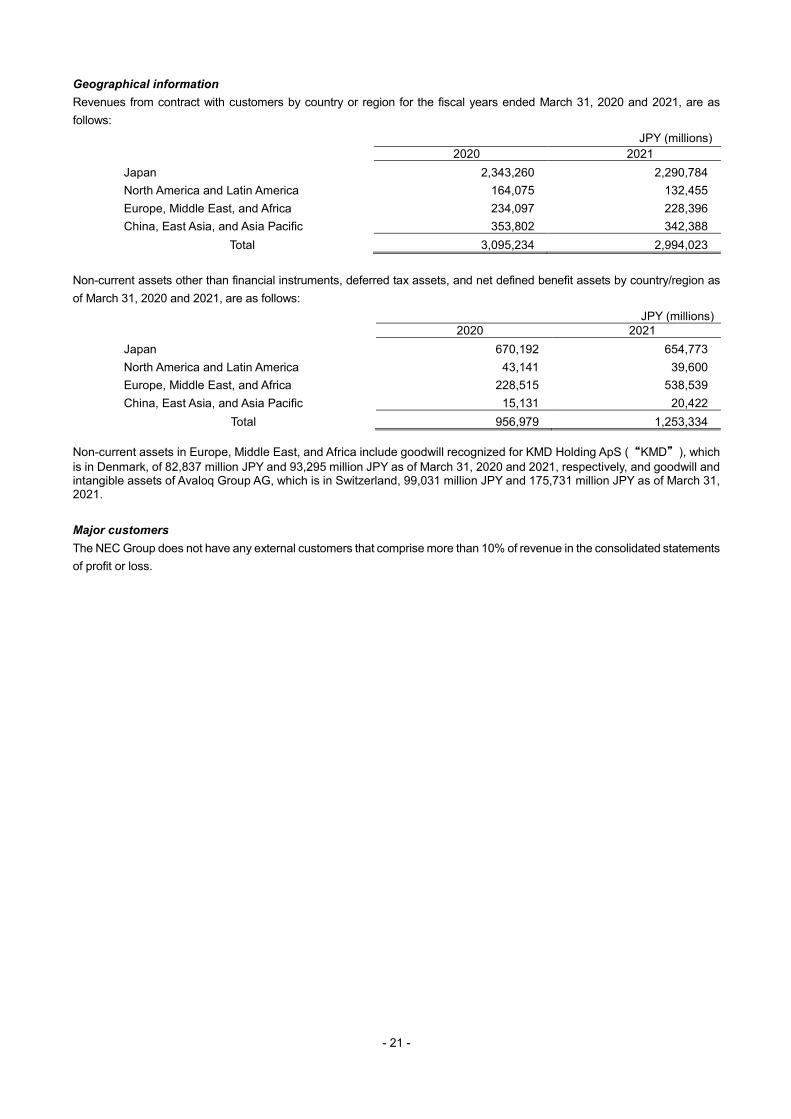
Geographical information Revenues from contract with customers by country or region for the fiscal years ended March 31, 2020 and 2021, are as follows:
JPY (millions) 2020 2021
Japan 2,343,260 2,290,784 North America and Latin America 164,075 132,455 Europe, Middle East, and Africa 234,097 228,396 China, East Asia, and Asia Pacific 353,802 342,388
Total 3,095,234 2,994,023
Non-current assets other than financial instruments, deferred tax assets, and net defined benefit assets by country/region as of March 31, 2020 and 2021, are as follows:
JPY (millions) 2020 2021
Japan 670,192 654,773 North America and Latin America 43,141 39,600 Europe, Middle East, and Africa 228,515 538,539 China, East Asia, and Asia Pacific 15,131 20,422
Total 956,979 1,253,334 Non-current assets in Europe, Middle East, and Africa include goodwill recognized for KMD Holding ApS (“KMD”), which is in Denmark, of 82,837 million JPY and 93,295 million JPY as of March 31, 2020 and 2021, respectively, and goodwill and intangible assets of Avaloq Group AG, which is in Switzerland, 99,031 million JPY and 175,731 million JPY as of March 31, 2021. Major customers The NEC Group does not have any external customers that comprise more than 10% of revenue in the consolidated statements of profit or loss.
- 22 -
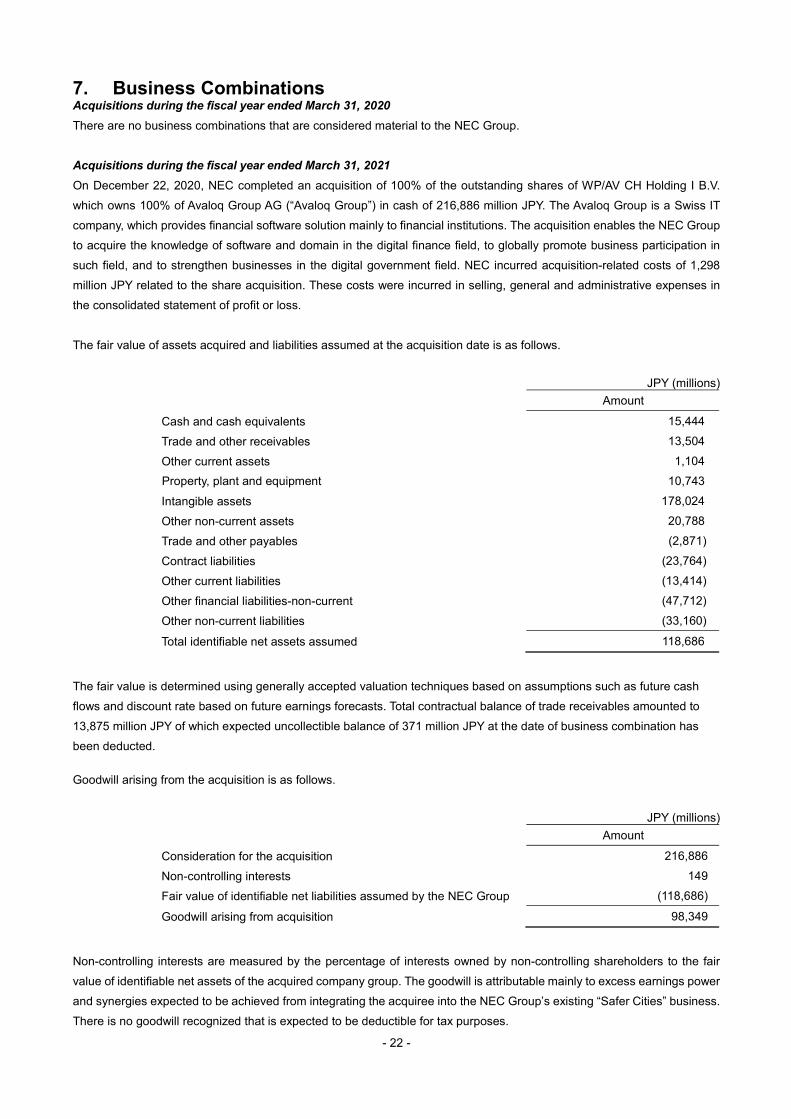
7. Business Combinations Acquisitions during the fiscal year ended March 31, 2020 There are no business combinations that are considered material to the NEC Group. Acquisitions during the fiscal year ended March 31, 2021 On December 22, 2020, NEC completed an acquisition of 100% of the outstanding shares of WP/AV CH Holding I B.V. which owns 100% of Avaloq Group AG (“Avaloq Group”) in cash of 216,886 million JPY. The Avaloq Group is a Swiss IT company, which provides financial software solution mainly to financial institutions. The acquisition enables the NEC Group to acquire the knowledge of software and domain in the digital finance field, to globally promote business participation in such field, and to strengthen businesses in the digital government field. NEC incurred acquisition-related costs of 1,298 million JPY related to the share acquisition. These costs were incurred in selling, general and administrative expenses in the consolidated statement of profit or loss. The fair value of assets acquired and liabilities assumed at the acquisition date is as follows.
JPY (millions) Amount
Cash and cash equivalents 15,444 Trade and other receivables 13,504 Other current assets 1,104 Property, plant and equipment 10,743 Intangible assets 178,024 Other non-current assets 20,788 Trade and other payables (2,871) Contract liabilities (23,764) Other current liabilities (13,414) Other financial liabilities-non-current (47,712) Other non-current liabilities (33,160)
Total identifiable net assets assumed 118,686
The fair value is determined using generally accepted valuation techniques based on assumptions such as future cash flows and discount rate based on future earnings forecasts. Total contractual balance of trade receivables amounted to 13,875 million JPY of which expected uncollectible balance of 371 million JPY at the date of business combination has been deducted. Goodwill arising from the acquisition is as follows.
JPY (millions) Amount
Consideration for the acquisition 216,886 Non-controlling interests 149 Fair value of identifiable net liabilities assumed by the NEC Group (118,686)
Goodwill arising from acquisition 98,349
Non-controlling interests are measured by the percentage of interests owned by non-controlling shareholders to the fair value of identifiable net assets of the acquired company group. The goodwill is attributable mainly to excess earnings power and synergies expected to be achieved from integrating the acquiree into the NEC Group’s existing “Safer Cities” business. There is no goodwill recognized that is expected to be deductible for tax purposes.

- 23 -
Since the acquisition date, Avaloq contributed revenue of 16,415 million JPY and net profit of 662 million JPY to the NEC Group’s results for the year ended March 31, 2021. Had the acquisition occurred on April 1, 2020, consolidated revenue would have been 3,042,864 million JPY, and consolidated net profit would have been 163,915 million JPY (information outside the scope of the audit). 8. Property, Plant and Equipment Reconciliation of the carrying amounts of property, plant and equipment for the fiscal years ended March 31, 2020 and 2021, is as follows:
JPY (millions)
Carrying amounts Buildings
and structures
Machinery and
equipment
Tools, furniture and
fixtures Land Construction
in progress Right-of-use
assets Total
As of April 1, 2019 177,610 45,764 89,344 66,970 29,133 – 408,821 Impact of changes in accounting policies (772) (126) (3,221) – – 179,818 175,699 Beginning balance as adjusted 176,838 45,638 86,123 66,970 29,133 179,818 584,520
Acquisitions 3,338 3,239 8,145 175 52,528 31,000 98,425 Reclassifications 25,191 10,058 38,642 (923) (54,084) – 18,884 Depreciation (15,439) (12,228) (41,766) – – (53,917) (123,350) Impairment losses (918) (23) (687) (982) (132) (559) (3,301) Reversal of impairment loss – – – 150 – – 150 Disposals (629) (553) (1,301) (273) (4,738) (3,410) (10,904) Transfer to assets held for sale (425) (1,072) (513) (725) (111) (1,089) (3,935) Foreign currency translation adjustments (270) (342) (516) (28) (95) (1,161) (2,412) As of March 31, 2020 187,686 44,717 88,127 64,364 22,501 150,682 558,077 Acquisitions 3,300 3,819 7,544 3 42,955 42,074 99,695 Acquisitions through business combinations – – 3,224 – – 8,649 11,873 Reclassifications 15,637 10,440 32,792 24 (43,901) – 14,992 Depreciation (15,002) (13,349) (38,148) – – (56,341) (122,840) Impairment losses (59) (11) (192) (1) (177) – (440) Reversal of impairment loss – – – 873 – – 873 Disposals (1,048) (621) (1,171) (1,885) (3,150) (4,339) (12,214) Foreign currency translation adjustments 329 335 449 31 149 1,862 3,155 As of March 31, 2021 190,843 45,330 92,625 63,409 18,377 142,587 553,171
JPY (millions)
Cost Buildings
and structures
Machinery and
equipment
Tools, furniture and
fixtures Land Construction
in progress Right-of-use
assets Total
As of April 1, 2019 550,115 249,618 427,384 75,373 29,133 – 1,331,623 As of March 31, 2020 558,814 241,499 420,597 72,768 22,608 206,338 1,522,624 As of March 31, 2021 540,798 249,579 428,405 70,925 18,402 245,721 1,553,830
JPY (millions)
Accumulated Depreciation and Accumulated impairment losses
Buildings and
structures
Machinery and
equipment
Tools, furniture and
fixtures Land Construction
in progress Right-of-use
assets Total
As of April 1, 2019 372,505 203,854 338,040 8,403 – – 922,802 As of March 31, 2020 371,128 196,782 332,470 8,404 107 55,656 964,547 As of March 31, 2021 349,955 204,249 335,780 7,516 25 103,134 1,000,659
The “Reclassifications” in the table above for the fiscal years ended March 31, 2020 and 2021, includes the transfer from inventories under current assets.

- 24 -
Pledged assets as of March 31, 2020 and 2021, were as follows:
JPY (millions)
2020 2021
Land 128 128 Others 666 701
Total 794 829 Impairment losses Impairment losses are included in other operating expenses in the consolidated statements of profit or loss. The aggregate amount of impairment losses is disclosed in Note 10 “Impairment Losses of Non-Financial Assets.” During the fiscal year ended March 31, 2020, the NEC Group recorded impairment losses of 1,788 million JPY mainly over buildings and structures, tools, furniture and fixtures, and land in training facilities. The losses are allocated to Network Services segment. The recoverable amount was measured based on the fair value less costs of disposal. As the assets were measured using the significant unobservable inputs such as discount rate, terminal capitalization rate, and average rent growth rate, their fair value measurements are classified as Level 3 in the fair value hierarchy.

- 25 -
9. Intangible Assets including Goodwill Reconciliation of the carrying amounts of intangible assets including goodwill for the fiscal years ended March 31, 2020 and 2021, is as follows:
JPY (millions)
Carrying amount Goodwill Software for sale
Software for internal use
Customer related
intangible assets
Acquired capitalized
development costs
Other Total
As of April 1, 2019 188,183 50,280 53,357 68,783 25,391 20,770 406,764 Acquisitions – 9,244 13,057 – – 1,010 23,311 Acquisitions through business combinations
5,788 – – – 881 – 6,669
Reclassifications – 13,670 12,931 – – 1,608 28,209 Amortization – (24,250) (23,198) (11,899) (4,116) (2,171) (65,634) Impairment losses (611) (87) (1,773) – – (94) (2,565) Disposals – (264) (542) – – (109) (915) Foreign currency translation adjustments
(10,340) (775) (165) (2,447) (1,047) (466) (15,240)
Other (686) 358 1,308 – – (152) 828 As of March 31, 2020 182,334 48,176 54,975 54,437 21,109 20,396 381,427 Acquisitions – 11,636 10,824 – – 807 23,267 Acquisitions through business combinations
101,595 42,211 4,010 133,549 – – 281,365
Reclassifications – 19,401 14,067 – – 720 34,188 Amortization – (25,253) (21,533) (15,274) (4,092) (2,235) (68,387) Impairment losses – (3,027) (499) – – – (3,526) Disposals – (544) (1,879) – – (306) (2,729) Foreign currency translation adjustments
16,601 2,904 208 4,778 1,369 (785) 25,075
Other – 196 1,605 – – (3,093) (1,292) As of March 31, 2021 300,530 95,700 61,778 177,490 18,386 15,504 669,388
JPY (millions)
Cost Goodwill Software for sale
Software for internal use
Customer related
intangible assets
Acquired capitalized
development costs
Other Total
As of April 1, 2019 199,444 132,119 133,575 84,648 34,788 37,202 621,776 As of March 31, 2020 194,206 136,813 134,887 81,701 34,205 35,792 617,604 As of March 31, 2021 312,402 200,711 139,320 221,736 36,433 27,241 937,843
JPY (millions)
Accumulated amortization and accumulated impairment losses
Goodwill Software for sale
Software for internal use
Customer related
intangible assets
Acquired capitalized
development costs
Other Total
As of April 1, 2019 11,261 81,839 80,218 15,865 9,397 16,432 215,012 As of March 31, 2020 11,872 88,637 79,912 27,264 13,096 15,396 236,177 As of March 31, 2021 11,872 105,011 77,542 44,246 18,047 11,737 268,455
The “Reclassifications” in the table above for the fiscal years ended March 31, 2020 and 2021, includes the transfer from inventories under current assets. Internally generated intangible assets mainly consist of software for sale and software for internal use. Amortization is recognized either as selling, general and administrative expenses or as cost of sales when the amortization expenses have been allocated to the cost of inventories and those inventories are sold. The NEC Group recognizes research and developments costs as expenses except items that meet criteria for capitalization. Research and development costs

- 26 -
recognized as expenses during the fiscal years ended March 31, 2020 and 2021, are 109,787 million JPY and 114,625 million JPY, respectively. The Company acquired Avaloq Group AG on December 22, 2020 and recognized goodwill and intangible assets in the total amount of 276,373 million JPY. Individually a significant intangible asset is “Customer relationship” in the total amount 115,819 million JPY for the fiscal year ended March 31, 2021. This intangible asset is amortized on a straight-line basis. The remaining amortization period of this intangible asset is 18 years. During the fiscal year ended March 31, 2021, the NEC Group recorded impairment losses of 3,027 million JPY over Software for sale, mainly in foreign IT subsidiaries. The losses are allocated mainly to Global segment. The recoverable amount of the assets was calculated based on the value in use. Value in use is calculated by discounting the estimated future cash flows expected to be derived from the assets to the present value. The discount rate used to calculate the recoverable amount was 7.1%. The carrying amounts of goodwill allocated to each operating segment as of March 31, 2020 and 2021, are as follows:
JPY (millions)
2020 2021
Public Infrastructure 6,150 6,150 Enterprise – – Network Services 551 551 Global 137,921 254,606 Others 37,712 39,223
Total 182,334 300,530
The CGUs to which significant amounts of goodwill are allocated as of March 31, 2020 and 2021, are as follows: JPY (millions)
CGUs 2020 2021
Avaloq Group – 99,031 KMD 82,387 93,295 NPS 39,051 44,657 Others 60,896 63,547 Total 182,334 300,530
The NEC Group recognized impairment losses due to the lower profitability than initially expected for certain goodwill and intangible assets. Impairment losses are included in other operating expenses in the consolidated statements of profit or loss. The aggregate amount of impairment losses is disclosed in Note 10. “Impairment Losses of Non-Financial Assets.” Avaloq Group, KMD and NPS were newly acquired in recent years, and based on its assessment of their profitability compared with the initially developed business plans, management considers there is no significant impairment risk associated with goodwill allocated to Avaloq Group, KMD and NPS. For goodwill and intangible assets with indefinite useful lives, the recoverable amount was calculated mainly based on the value in use. Value in use is calculated by discounting the estimated future cash flows based on future business plan and the terminal value to the present value. The growth rate used for estimating the terminal value of each CGU is determined by considering the status of the respective country and industry that the CGU belongs to, and it does not exceed the long-term average growth rate of the industry of the CGU.
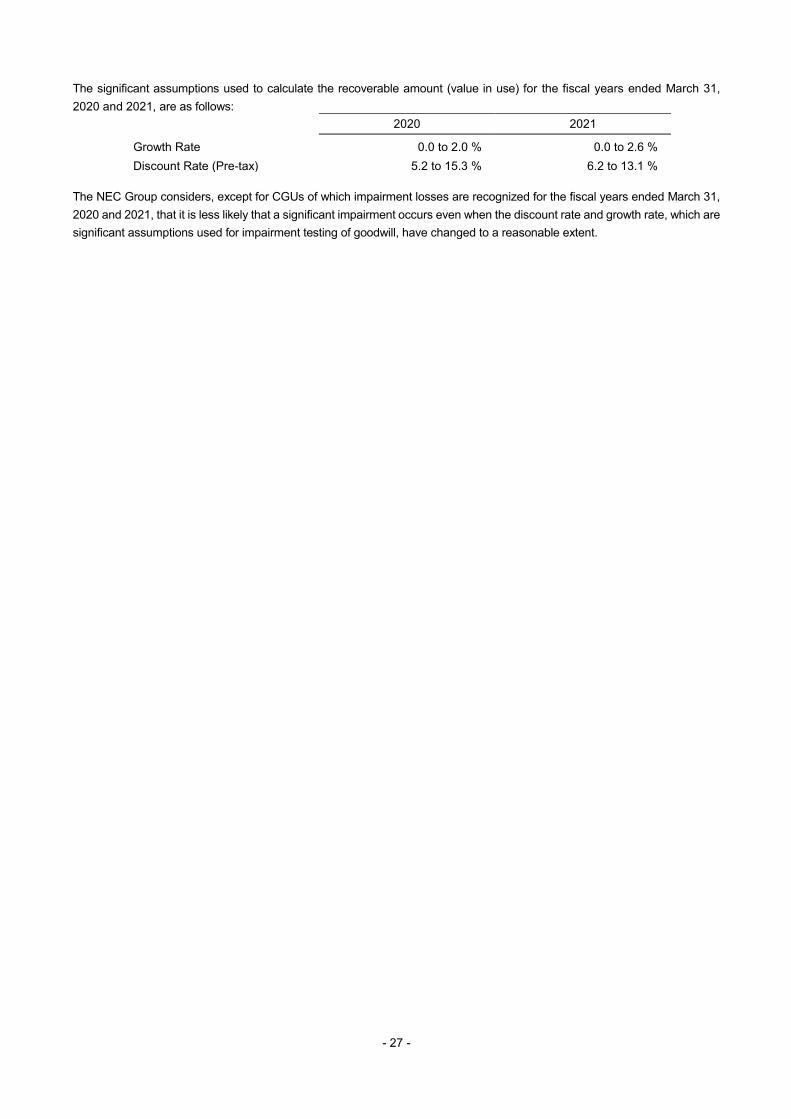
- 27 -
The significant assumptions used to calculate the recoverable amount (value in use) for the fiscal years ended March 31, 2020 and 2021, are as follows:
2020 2021
Growth Rate 0.0 to 2.0 % 0.0 to 2.6 % Discount Rate (Pre-tax) 5.2 to 15.3 % 6.2 to 13.1 %
The NEC Group considers, except for CGUs of which impairment losses are recognized for the fiscal years ended March 31, 2020 and 2021, that it is less likely that a significant impairment occurs even when the discount rate and growth rate, which are significant assumptions used for impairment testing of goodwill, have changed to a reasonable extent.

- 28 -
10. Impairment Losses of Non-Financial Assets A breakdown of impairment losses and subsequent reversals by asset class for the fiscal years ended March 31, 2020 and 2021, is as follows:
JPY (millions) 2020 2021
Impairment loss Reversal Impairment loss Reversal
Property, plant and equipment Buildings and structures 918 – 59 – Machinery and equipment 23 – 11 – Tools, furniture and fixtures 687 – 192 – Land 982 (150) 1 (873) Construction in progress 132 – 177 – Right-of-use assets 559 – – –
Goodwill 611 – – – Intangible asset
Software for internal use 1,773 – 499 – Software for sale 87 – 3,027 –
Others 612 – 69 –
Total 6,384 (150) 4,035 (873)
Impairment losses and reversal of impairment loss are included in other operating expenses in the consolidated statements of profit or loss. Details of impairment losses are described in Note 8. “Property, Plant and Equipment” for property, plant and equipment, and Note 9. “Intangible Assets including Goodwill” for goodwill and intangible assets.

- 29 -
11. Subsidiaries Material subsidiaries The number of consolidated subsidiaries increased by 37 in the fiscal year ended March 31, 2021, primary due to establishments and acquisitions and decreased by 36 primarily due to divestitures. Major consolidated subsidiaries as of March 31, 2021, are as follows:
Name of entity Country of incorporation
Ownership of voting rights
(%) Principal activities
NEC Platforms, Ltd. Japan 100.0
Development, manufacturing, sale and maintenance of information and communications systems, equipment, and provision of system integration services
NEC Fielding, Ltd. Japan 100.0 Installation and maintenance of computers and network systems
NEC Solution Innovators, Ltd. Japan 100.0 Software development and provision of system
integration services
NEC Networks & System Integration Corporation Japan 51.4
Design, construction and maintenance of information and communications systems, installation of telecommunications systems, and sale of information and communications equipment
Japan Aviation Electronics Industry, Limited
Japan 50.9
Manufacturing and sale of connectors and electronic devices for aircraft, satellites and spacecraft
NEC Corporation of America U.S.A. 100.0
Regional representative and supervising operations in North America, sale of computer-related equipment and communications equipment, and provision of system integration services
NEC Europe Ltd. U.K. 100.0 Regional representative and supervising operations in Europe
Avaloq Group AG Switzerland 100.0 Provision of software for financial institutions
KMD A/S Denmark 100.0 Software development and IT services
NEC Asia Pacific Pte. Ltd. Singapore 100.0
Regional representative and supervising operations in Asia, sale of computer-related equipment and communications equipment, and provision of system integration services
NEC (China) Co., Ltd. China 100.0 Regional representative and supervising operations in Greater China
NEC Latin America S.A. Brazil 100.0
Regional representative and supervising operations in Latin America, sale of communications equipment, and provision of system integration services

- 30 -
Subsidiaries that have non-controlling interests material to the NEC Group NEC Networks & System Integration Corporation NEC Networks & System Integration Corporation is a subsidiary that has non-controlling interests material to the NEC Group. Proportion of ownership interests held by non-controlling interests as of March 31, 2020 and 2021 were 61.4% and 61.5%, respectively, which is inclusive of the interest in the subsidiary held in the retirement benefit trust acting as an agent of the Company. Proportion of voting rights held by non-controlling interests as of March 31, 2020 and 2021 were 48.5% and 48.6%, respectively. Summarized financial information before eliminating inter-company transactions as of March 31, 2020 and 2021, is as follows:
JPY (millions)
2020 2021
Current assets 192,501 212,519 Non-current assets 46,735 48,732 Current liabilities 82,325 94,430 Non-current liabilities 47,308 41,716 Net assets 109,603 125,105 Carrying amount of non-controlling interests 67,024 76,345
Summarized financial information before eliminating inter-company transactions for the fiscal years ended March 31, 2020 and 2021, is as follows:
JPY (millions) 2020 2021
Revenue 302,253 338,053 Net profit 11,805 17,780 Other comprehensive income 339 3,151 Comprehensive income 12,144 20,931 Net profit allocated to non-controlling interests 6,898 11,351 Dividends paid to non-controlling interests 2,460 2,565
Cash flows from operating activities 14,939 20,388 Cash flows from investing activities (6,726) (4,821) Cash flows from financing activities (4,304) (5,393) Effect of exchange rate changes on cash and cash equivalents 58 (69)
Net increase in cash and cash equivalents 3,967 10,105 Cash and cash equivalents, at the end of reporting period 58,321 68,426

- 31 -
Japan Aviation Electronics Industry, Limited Japan Aviation Electronics Industry, Limited (“JAE”) is a subsidiary that has non-controlling interests material to the NEC Group. Proportion of ownership interests held by non-controlling interests as of March 31, 2020 and 2021 were 64.3%, which is inclusive of the interest in the subsidiary held in the retirement benefit trust acting as an agent of the Company. Proportion of voting rights held by non-controlling interests as of March 31, 2020 and 2021 were 49.1%. Summarized financial information before eliminating inter-company transactions as of March 31, 2020 and 2021, is as follows:
JPY (millions) 2020 2021
Current assets 113,559 141,430 Non-current assets 123,374 118,300 Current liabilities 52,647 61,239 Non-current liabilities 18,206 27,255 Net assets 166,080 171,236 Carrying amount of non-controlling interests 107,030 110,450
Summarized financial information before eliminating inter-company transactions for the fiscal years ended March 31, 2020 and 2021, is as follows:
JPY (millions) 2020 2021
Revenue 208,237 209,640 Net profit 11,255 5,169 Other comprehensive income (3,314) 5,699 Comprehensive income 7,941 10,868 Net profit allocated to non-controlling interests 6,290 2,418 Dividends paid to non-controlling interests 2,337 1,754
Cash flows from operating activities 29,685 30,007 Cash flows from investing activities (24,536) (18,802) Cash flows from financing activities (7,565) 14,497 Effect of exchange rate changes on cash and cash equivalents (389) 26
Net (decrease) increase in cash and cash equivalents (2,805) 25,728 Cash and cash equivalents, at the end of reporting period 44,802 70,530

- 32 -
12. Investments Accounted for Using the Equity Method Investments in associates and joint ventures are accounted for using the equity method. The number of associates accounted for using the equity method increased by five in the fiscal year ended March 31, 2021, primarily due to new investments and decreased by four primarily due to divestiture. There is no change in the number of joint ventures accounted for using the equity methods for the fiscal year ended March 31, 2021.
Associates Material associates NEC Capital Solutions Limited is an associate, which is material to the NEC Group as of March 31, 2021. NEC Capital Solutions Limited engages in leasing various types of equipment, facilities, and products in Japan. The Company owns 37.7% of the voting rights as of March 31, 2020 and 2021. Summarized financial information as of March 31, 2020 and 2021, is as follows:
JPY (millions)
2020 2021
Current assets 870,638 918,326 Non-current assets 152,196 171,369 Current liabilities 444,073 469,816 Non-current liabilities 468,188 499,486 Total equity 110,573 120,393
Summarized financial information for the fiscal years ended March 31, 2020 and 2021, is as follows:
JPY (millions) 2020 2021
Revenue 64,531 71,303 Net profit 5,449 5,865 Other comprehensive income (28) 60 Comprehensive income 5,421 5,925 Dividends received from the associate 486 487
Reconciliation between the summarized financial information and the carrying amount of interests in associates as of March 31, 2020 and 2021, is as follows:
JPY (millions)
2020 2021
Equity attributable to owners of the investee 97,280 100,616 Proportion of ownership interest 37.7% 37.7%
Equity attributable to the NEC Group 36,645 37,902
Elimination of unrealized profit on inter-company transactions (25) (48)
Carrying amount of the associate in the consolidated financial statements 36,620 37,854
Fair value of the associate 14,922 16,431

- 33 -
Aggregate information of associates that are not individually material for the fiscal years ended March 31, 2020 and 2021, is as follows:
JPY (millions) 2020 2021 Aggregate carrying amount of individually immaterial associates in the consolidated financial statements 36,085 34,129
Aggregate amounts of the NEC Group’s share of those associates:
Net profit 1,553 2,461 Other comprehensive income (254) 897 Comprehensive income 1,299 3,358
Unrecognized share of losses of associates accounted for using the equity method which the Company has stopped recognizing its share of losses for the fiscal years ended March 31, 2020 and 2021, was as follows:
JPY (millions) 2020 2021
Unrecognized share of losses of associates for the period
– –
Accumulated unrecognized share of losses of associates
538 514
Joint ventures None of joint ventures are material to the NEC Group. Aggregate information of joint ventures that are not individually material for the fiscal years ended March 31, 2020 and 2021, is as follows:
JPY (millions) 2020 2021 Aggregate carrying amount of individually immaterial joint ventures in the consolidated financial statements 1,387 1,333
Aggregate amounts of the NEC Group’s share of those joint ventures:
Net profit (loss) (75) (15) Other comprehensive income – – Comprehensive income (75) (15)
Unrecognized share of losses of joint ventures that the Company has stopped recognizing its share of losses in applying the equity method for the fiscal years ended March 31, 2020 and 2021, was as follows:
JPY (millions) 2020 2021
Unrecognized share of losses of joint ventures for the period
– –
Accumulated unrecognized share of losses of joint ventures
– –

- 34 -
13. Income Taxes Current and deferred tax expenses The components of income tax expenses for the fiscal years ended March 31, 2020 and 2021, are as follows:
JPY (millions) 2020 2021
Current tax expense Current year 25,839 39,317 Adjustments for current tax of prior periods (420) (1,060)
Subtotal 25,419 38,257
Deferred tax expense Origination and reversal of temporary differences 10,286 (13,007)
(Recognition of previously unrecognized) / derecognition of previously recognized tax losses
9,825 1,075
(Recognition of previously unrecognized) / derecognition of previously recognized deductible temporary differences
(34,280) (30,360)
Subtotal (14,169) (42,292)
Income taxes 11,250 (4,035)
The Company and its subsidiaries in Japan are mainly subject to Japanese national and local income taxes, inhabitant tax, and enterprise tax. The statutory tax rates in Japan for the fiscal years ended March 31, 2020 and 2021, are 30.5%. The foreign subsidiaries are subject to taxes based on income at rates ranging from 0.0% to 34.0%.
Reconciliation between the Japanese statutory income tax rate and the effective tax rate of the Company for the fiscal years ended March 31, 2020 and 2021, is as follows:
(%) 2020 2021
Statutory tax rate 30.5 30.5
Movement in tax rate Effects of undistributed profits 0.3 0.7
Effects of investments accounted for using the equity method
(0.9) (0.8)
Non-deductible expenses 1.3 0.4 Differences in tax rates applied to foreign subsidiaries 1.3 0.1 Income tax credits (2.5) (5.4)
Derecognition of previously recognized tax losses / (Recognition or use of previously unrecognized) 4.0 (7.5)
(Recognition of previously unrecognized) / derecognition of previously recognized deductible temporary differences (30.0) (19.6)
Others 5.1 (1.0)
Effective tax rate 9.1 (2.6)
As a result of the assessment of the recoverability of deferred tax assets, due to an improved long-term prospect of its ability to generate future taxable profit which is reflected in the improvement in the NEC Group’s operating results for the fiscal year ended March 31, 2021, despite the adverse impact of significant uncertainty caused by the COVID-19 pandemic, the effective tax rate for the fiscal year ended March 31, 2021 became lower than the statutory tax rate. The decrease in the effective tax rate was mainly due to the recognition of deferred tax assets for previously unrecognized deductible temporary differences.

- 35 -
Deferred taxes Major components of deferred tax assets and liabilities as of March 31, 2020 and 2021, are as follows:
JPY (millions)
As of April
1, 2019
Recognized through profit
or loss
Recognized in other
comprehensive income
Acquisitions through business
combinations
Transfer to assets held for
sale
As of March 31,
2020
Deferred tax assets:
Accrued expenses and product warranty liabilities
33,784 550 – – (722) 33,612
Write-off of inventories 22,558 (764) – – (721) 21,073
Depreciation 13,682 (1,170) – – (6) 12,506
Elimination of unrealized profit from intercompany transactions among consolidated companies
6,779 1,259 –
– (344) 7,694
Investments in associates 1,924 (453) 16 – (21) 1,466
Provision for retirement benefits 74,044 16,216 (679) – (174) 89,407
Tax losses carried forward 34,986 (12,263) – – – 22,723
Others 25,106 4,218 – – (347) 28,977
Total deferred tax assets 212,863 7,593 (663) – (2,335) 217,458
Offset with deferred tax liabilities (62,352) (52,275)
Total deferred tax assets, net 150,511 165,183
Deferred tax liabilities:
Valuation differences due to equity instruments measured at fair value through other comprehensive income
(32,018) 515 7,358 – – (24,145)
Undistributed earnings (16,657) (553) 172 – – (17,038)
Gain on contribution of securities to the retirement benefit trust
(11,945) 724 – – – (11,221)
Valuation differences due to business combination
(24,579) 4,005 – (430) – (21,004)
Others (3,165) 594 – – 171 (2,400)
Total deferred tax liabilities (88,364) 5,285 7,530 (430) 171 (75,808)
Offset with deferred tax asset 62,352 52,275
Total deferred tax liabilities, net (26,012) (23,533)
Net deferred tax asset 124,499 141,650

- 36 -
JPY (millions)
As of April 1,
2020
Recognized through profit or
loss
Recognized in other
comprehensive income
Acquisitions through business
combinations
As of March 31, 2021
Deferred tax assets:
Accrued expenses and product warranty liabilities
33,612 2,605 – 34 36,251
Write-off of inventories 21,073 (2,360) – – 18,713
Depreciation 12,506 (2,594) – (925) 8,987
Elimination of unrealized profit from intercompany transactions among consolidated companies
7,694 (154) – – 7,540
Investments in associates 1,466 (409) 359 – 1,416
Provision for retirement benefits 89,407 31,716 (43,045) 685 78,763
Tax losses carried forward 22,723 (16,665) – 3,282 9,340
Others 28,977 1,094 – (115) 29,956
Total deferred tax assets 217,458 13,233 (42,686) 2,961 190,966
Offset with deferred tax liabilities (52,275) (57,085)
Total deferred tax assets, net 165,183 133,881
Deferred tax liabilities:
Valuation differences due to equity instruments measured at fair value through other comprehensive income
(24,145) 75 (3,927) – (27,997)
Undistributed earnings (17,038) (766) – – (17,804)
Gain on contribution of securities to the retirement benefit trust
(11,221) – – – (11,221)
Valuation differences due to business combination
(21,004) 4,956 – (28,671) (44,719)
Others (2,400) 762 – – (1,638)
Total deferred tax liabilities (75,808) 5,027 (3,927) (28,671) (103,379)
Offset with deferred tax asset 52,275 57,085
Total deferred tax liabilities, net (23,533) (46,294)
Net deferred tax asset 141,650 87,587
A majority of deferred tax assets of the NEC Group were recognized by the Company and certain domestic consolidated subsidiaries that file a consolidated tax return. The NEC Group considers the probability that a portion, or all of future deductible temporary differences or unused tax losses can be utilized against future taxable profits in the recognition of deferred tax assets. In assessing recoverability of deferred tax assets, the NEC Group considers the scheduled reversal of taxable temporary differences, projected future taxable profits and tax planning strategies. Based on the level of historical taxable profits and projected future taxable profits, reversal of taxable temporary differences and tax planning during the periods in which the temporary differences become deductible, the NEC Group believes that it is probable that tax benefits of recognized deferred tax assets as of March 31, 2021, can be utilized.

- 37 -
The tax effect by applicable tax rates of deductible temporary differences and tax losses carried forward for which deferred tax assets were not recognized as of March 31, 2020 and 2021, are as follows:
JPY (millions) 2020 2021
Deductible temporary differences 134,788 116,938 Unused tax losses carried forward 75,761 66,492
Total 210,549 183,430
The tax effect by applicable tax rates of unused tax losses as of March 31, 2020 and 2021, for which deferred tax assets were not recognized will expire as follows:
JPY (millions) 2020 2021 The 1st year 1,501 270 The 2nd year 1,099 310 The 3rd year 394 481 The 4th year 519 3,349 The 5th year and thereafter 72,248 62,082
Total 75,761 66,492
The aggregate amounts of temporary differences relating to investments in subsidiaries for which no deferred tax liabilities were recognized were 145,707 million JPY and 199,400 million JPY as of March 31, 2020 and 2021, respectively. 14. Inventories Components of inventories as of March 31, 2020 and 2021, are as follows:
JPY (millions)
2020 2021
Merchandise and finished goods 53,682 46,919 Work in process 92,020 84,149 Raw materials and supplies 53,624 54,480
Total 199,326 185,548
The amount of inventories recognized as an expense during the period was included within cost of sales. Inventory write-down to net realizable value recognized as cost of sales for the fiscal years ended March 31, 2020 and 2021, was 7,693 million JPY and 7,298 million JPY, respectively. There was no material reversal of write-downs during the fiscal years presented. 15. Trade and Other Receivables Components of trade and other receivables as of March 31, 2020 and 2021, are as follows:
JPY (millions)
2020 2021
Notes receivable 16,937 16,714 Accounts receivable 679,496 688,786 Other receivables 41,051 34,948
Total 737,484 740,448
The amounts of trade and other receivables to be collected after 12 months as of March 31, 2020 and 2021, are 806 million JPY and 416 million JPY, respectively.

- 38 -
16. Cash and Cash Equivalents Components of cash and cash equivalents as of March 31, 2020 and 2021, are as follows:
JPY (millions) 2020 2021
Cash and deposits 217,049 342,167 Certificates of deposits 142,203 181,178
Total 359,252 523,345 17. Other Assets Components of other current assets and other non-current assets as of March 31, 2020 and 2021, are as follows:
JPY (millions)
2020 2021
Advance payments 44,558 49,752 Prepaid expenses 44,665 59,945 Others 19,213 21,899 Other current assets 108,436 131,596 Net defined benefit assets 8,757 136,774 Long-term prepaid expenses 17,471 30,735 Others 4 40 Other non-current assets 26,232 167,549

- 39 -
18. Assets Held for Sale Major components of assets held for sale and liabilities directly associated with assets held for sale as of March 31, 2020 and 2021, are as follows:
JPY (millions)
2020 2021
Cash and cash equivalents 4,161 –
Trade and other receivables 12,349 –
Inventories 16,496 –
Other assets 8,204 –
Assets held for sale 41,210 –
JPY (millions)
2020 2021
Trade and other payables 11,786 –
Other liabilities 18,347 –
Liabilities directly associated with assets held for sale 30,133 –
The assets held for sale as of March 31, 2020, consisted of groups of assets and liabilities relating to two subsidiaries, NEC Display Solutions, Ltd. (“NDS”) and Showa Optronics Co., Ltd. NDS used to belong to the “Global” segment, and the sale of its 66% share was completed on November 1, 2020. Along with this transfer of stock, NDS became an associate accounted for using the equity method of the Company and changed its company name to Sharp NEC Display Solutions, Ltd.. There are no assets held for sale as of March 31, 2021. 19. Equity Changes in ordinary shares for the fiscal years ended March 31, 2020 and 2021, are as follows:
(Thousands of shares)
2020 2021
Total number of authorized shares: End of the year
750,000 750,000
Total number of issued shares: Beginning of the year 260,473 260,473 Changes during the year – 12,377
End of the year 260,473 272,850
Note: The number of shares is rounded to the nearest thousand. The shares issued by the Company are ordinary shares with no par value that have no restrictions on any rights. The board of directors of the Company passed a resolution as of June 25, 2020, to issue 12,376,600 new shares and dispose of 647,000 treasury shares (a total of 13,023,600 shares) at a price of 4,950 JPY per share, or 64,467 million JPY in total, to NTT Corporation by way of third-party allotment. The board of directors also passed a resolution as of the same date, to execute a capital and business alliance agreement with NTT Corporation, and executed the agreement on the same date. The payment for the shares has completed on July 10, 2020.
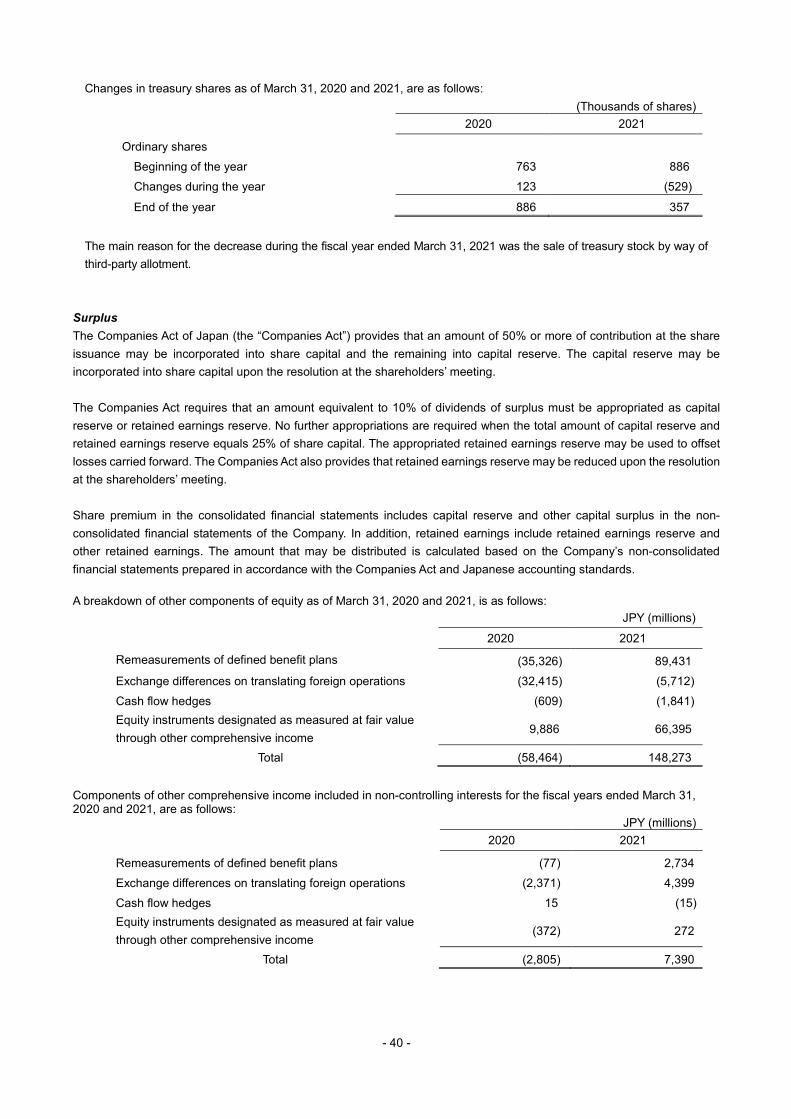
- 40 -
Changes in treasury shares as of March 31, 2020 and 2021, are as follows: (Thousands of shares)
2020 2021
Ordinary shares Beginning of the year 763 886 Changes during the year 123 (529)
End of the year 886 357
The main reason for the decrease during the fiscal year ended March 31, 2021 was the sale of treasury stock by way of third-party allotment.
Surplus The Companies Act of Japan (the “Companies Act”) provides that an amount of 50% or more of contribution at the share issuance may be incorporated into share capital and the remaining into capital reserve. The capital reserve may be incorporated into share capital upon the resolution at the shareholders’ meeting.
The Companies Act requires that an amount equivalent to 10% of dividends of surplus must be appropriated as capital reserve or retained earnings reserve. No further appropriations are required when the total amount of capital reserve and retained earnings reserve equals 25% of share capital. The appropriated retained earnings reserve may be used to offset losses carried forward. The Companies Act also provides that retained earnings reserve may be reduced upon the resolution at the shareholders’ meeting. Share premium in the consolidated financial statements includes capital reserve and other capital surplus in the non-consolidated financial statements of the Company. In addition, retained earnings include retained earnings reserve and other retained earnings. The amount that may be distributed is calculated based on the Company’s non-consolidated financial statements prepared in accordance with the Companies Act and Japanese accounting standards.
A breakdown of other components of equity as of March 31, 2020 and 2021, is as follows:
JPY (millions)
2020 2021
Remeasurements of defined benefit plans (35,326) 89,431 Exchange differences on translating foreign operations (32,415) (5,712) Cash flow hedges (609) (1,841) Equity instruments designated as measured at fair value through other comprehensive income
9,886 66,395
Total (58,464) 148,273
Components of other comprehensive income included in non-controlling interests for the fiscal years ended March 31, 2020 and 2021, are as follows:
JPY (millions) 2020 2021
Remeasurements of defined benefit plans (77) 2,734 Exchange differences on translating foreign operations (2,371) 4,399 Cash flow hedges 15 (15) Equity instruments designated as measured at fair value through other comprehensive income
(372) 272
Total (2,805) 7,390

- 41 -
Other comprehensive income The components of other comprehensive income and related tax expense and tax benefit for the fiscal years ended March 31, 2020 and 2021, are as follows:
JPY (millions) 2020 2021
Items that will not be reclassified to profit or loss Equity instruments designated as measured at fair value through other comprehensive income
(Decrease) increase during the year (25,696) 82,827
Tax benefit (expense) 5,399 (26,182)
Subtotal, net of tax (20,297) 56,645
Remeasurements of defined benefit plans Increase (decrease) during the year 2,839 170,392 Tax (expense) benefit (679) (43,045)
Subtotal, net of tax 2,160 127,347 Share of other comprehensive income of entities accounted for using the equity method
(Decrease) increase during the year (84) 280
Subtotal (84) 280
Items that may be reclassified subsequently to profit or loss Exchange differences on translating foreign operations (Decrease) increase during the year (17,014) 29,125 Reclassification adjustments 2,001 1,019
Subtotal, before tax (15,013) 30,144 Tax benefit (expense) 237 378
Sub-total, net of tax (14,776) 30,522
Cash flow hedges Increase (decrease) during the year 87 (14) Reclassification adjustments (29) (1,738)
Subtotal, before tax 58 (1,752) Tax (expense) benefit (36) 447
Sub-total, net of tax 22 (1,305) Share of other comprehensive income of entities accounted for using the equity method
(Decrease) increase during the year (175) 671 Reclassification adjustments – (33)
Subtotal, net of tax (175) 638
Total other comprehensive income, net of tax (33,150) 214,127

- 42 -
20. Dividends Dividends declared for which the effective date falls in the fiscal years ended March 31, 2020 and 2021, are as follows: Fiscal year ended March 31, 2020
Resolution Board of directors on April 26, 2019 Type of shares Ordinary shares Total dividends JPY (millions) 10,393 Source of dividends Retained earnings Dividends per share (JPY) 40 Record date March 31, 2019 Effective date June 3, 2019
Resolution Board of directors on October 29, 2019 Type of shares Ordinary shares Total dividends JPY (millions) 7,795 Source of dividends Retained earnings Dividends per share (JPY) 30 Record date September 30, 2019 Effective date December 2, 2019
Fiscal year ended March 31, 2021
Resolution Board of directors on May 12, 2020 Type of shares Ordinary shares Total dividends JPY (millions) 10,393 Source of dividends Retained earnings Dividends per share (JPY) 40 Record date March 31, 2020 Effective date June 1, 2020
Resolution Board of directors on October 29, 2020 Type of shares Ordinary shares Total dividends JPY (millions) 10,914 Source of dividends Retained earnings Dividends per share (JPY) 40 Record date September 30, 2020 Effective date December 1, 2020
Dividends declared for which the record date is in the fiscal year ended March 31, 2021, but the effective date falls in the following fiscal year are as follows:
Resolution Board of directors on May 12, 2021 Type of shares Ordinary shares Total dividends JPY (millions) 13,642 Source of dividends Retained earnings Dividends per share (JPY) 50 Record date March 31, 2021 Effective date June 1, 2021

- 43 -
21. Bonds and Borrowings A breakdown of bonds and borrowings and interest rates as of March 31, 2020 and 2021, is as follows:
JPY (millions) Average
interest rate (%)
Maturity 2020 2021
Short-term borrowings 96,976 40,969 1.36 – Current portion of long-term borrowings 3,029 10,541 0.38 –
Current portion of bonds 54,987 – – – Long-term borrowings (excluding the current portion)
220,219 309,156 0.78 September 20,
2022 to October 5, 2076
Bonds (excluding the current portion) 144,609 179,583 – –
Total 519,820 540,249
Current 154,992 51,510 Non-current 364,828 488,739
Total 519,820 540,249
A detail by issue of bonds, excluding the current portion, as of March 31, 2020 and 2021, are as follows:
Company name Series Issued
date
JPY (millions) Interest rate (%)
Maturity 2020 2021
NEC The 48th July 17, 2015 19,971 19,984 0.658 July 15, 2022 NEC The 50th June 15, 2017 34,933 34,964 0.290 June 15, 2022 NEC The 51st June 15, 2017 24,934 24,950 0.360 June 14, 2024 NEC The 52nd June 15, 2017 14,944 14,952 0.455 June 15, 2027
NEC The 53rd September 21, 2018
29,909 29,935 0.260 September 21, 2023
NEC The 54th September 21, 2018
9,963 9,970 0.360 September 19, 2025
NEC The 55th September 21, 2018
9,955 9,960 0.500 September 21, 2028
NEC The 56th April 23, 2020 – 9,972 0.280 April 21, 2023 NEC The 57th April 23, 2020 – 14,945 0.400 April 23, 2025 NEC The 58th April 23, 2020 – 9,951 0.540 April 23, 2030
Total 144,609 179,583 – –

- 44 -
Commitment line agreements The NEC Group has entered into commitment line agreements for short-term borrowings with 18 financial institutions for the purpose of securing stable and flexible short-term funding. The unused commitment line of credit based on such agreements for short-term borrowings as of March 31, 2020 and 2021, is as follows:
JPY (millions)
2020 2021 Aggregate amount of commitment line contracts
328,000 328,000
Amount used 2,000 2,000
Unused balance 326,000 326,000 Reconciliation of liabilities arising from financing activities for the fiscal years ended March 31, 2020 and 2021, is as follows:
JPY (millions)
As of
April 1, 2019
Adjusted by changes in accounting
policies
Changes arising
from cash flows
Changes not arising from cash flows
As of March 31,
2020
Business combinations
/disposals
Foreign currency
translation differences
Lease liabilities resulting from new
lease
Others
Short-term borrowings 110,634 – (4,349) (2,270) (7,039) – – 96,976 Long-term borrowings 242,444 (5,713) (10,844) (3,030) (17) – 408 223,248 Lease liabilities – 180,831 (53,620) (1,154) (1,202) 31,000 (256) 155,599 Bonds 199,441 – – – – – 155 199,596
Total 552,519 175,118 (68,813) (6,454) (8,258) 31,000 307 675,419
JPY (millions)
As of
April 1, 2020
Changes arising
from cash flows
Changes not arising from cash flows
As of March 31,
2021
Business combinations
/disposals
Foreign currency
translation differences
Lease liabilities resulting from new
lease
Others
Short-term borrowings 96,976 (47,333) (13,320) 4,646 – – 40,969 Long-term borrowings 223,248 55,172 40,968 – – 309 319,697 Lease liabilities 155,599 (57,530) 8,134 2,053 57,764 (3,413) 162,607 Bonds 199,596 (20,000) – – – (13) 179,583
Total 675,419 (69,691) 35,782 6,699 57,764 (3,117) 702,856
Short-term borrowings comprise primarily of bank borrowings and commercial papers.

- 45 -
22. Employee Benefits Employee benefit plans The Company and its domestic subsidiaries provide cash balance pension plans, other defined benefit pension plans, lump-sum severance payment plans, and the defined contribution pension plans in accordance with the Defined-Benefit Corporate Pension Act and the Defined Contribution Pension Act of Japan. The Company’s defined benefit pension plans are administered by the Pension fund of NEC Corporation (the “Fund”) which is legally independent of the Company. The Director of the Fund has the fiduciary duty to comply with laws, the directives by the Minister of Health, Labour and Welfare and the Director-Generals of Regional Bureaus of Health and Welfare made pursuant to those laws, and the by-laws of the Fund and the decisions made by the Board of Representatives of the Fund. The Company is required to make contributions to the Fund and obligated to make contributions in the amount stipulated by the Fund. Contributions are also regularly reviewed and adjusted as necessary to the extent permitted by laws and regulations. In addition, the Company and its certain domestic consolidated subsidiaries have shifted from defined benefit pension plans to defined contribution pension plans for the portion funded after October 1, 2020. Certain of its foreign subsidiaries have various types of defined benefit plans and defined contribution plans, covering substantially all of their employees. However, these plans are not considered material in aggregate to the NEC Group’s employee benefit arrangements. The defined benefit plans of the NEC Group are exposed to the following risks:
Investment risks The present value of defined benefit obligations is calculated using a discount rate by reference to market yields at the end of the reporting period on high quality corporate bonds. When the yield on plan assets falls below the discount rate, there is a risk of reduction in equity due to deterioration of the funding status. In short-term, plan assets may be exposed to fluctuations in the investment performance. The portfolio of plan assets is reviewed on a regular basis in order to secure sufficient income streams over the long term for pension and severance payments in the future to meet the investment objective. Interest rate risks When a discount rate is adjusted downwards in line with the fallen market yields on high quality corporate bonds, the present value of defined benefit obligations may increase and cause deterioration of the funding status, exposing the NEC Group to a risk of reduction in equity.

- 46 -
Defined benefit obligations and plan assets The changes in present value of defined benefit obligations and fair value of plan assets of the NEC Group for the fiscal years ended March 31, 2020 and 2021, are as follows:
JPY (millions) 2020 2021
Present value of defined benefit obligations Balance at the beginning of the year 1,036,768 966,563 Current service cost 32,140 23,238 Interest cost 5,604 6,193 Remeasurements:
Actuarial (gains) losses arising from changes in demographic assumptions (6,939) 2,940
Actuarial (gains) losses arising from changes in financial assumptions (8,996) (606)
Past service cost and gains on settlements (449) 152 Benefits paid (63,512) (56,537) Effects of business combinations and disposals (13,094) 46,527 Settlements of defined benefit pension plans (8,303) – Foreign currency translation differences (3,221) 5,322 Transfer to liabilities directly associated with assets held for sale (4,197) 7,771
Others 762 4,271 Balance at the end of the year 966,563 1,005,834
Fair value of plan assets
Balance at the beginning of the year 814,902 750,851 Interest income 4,823 6,165 Remeasurement: Actual (losses) gains on plan assets (13,096) 172,726
Employer contributions 10,583 7,791 Benefits paid (53,282) (44,893) Effects of business combinations and disposals (8,377) 46,654 Foreign currency translation differences (3,435) 5,478 Transfer to liabilities directly associated with assets held for sale (1,983) 2,343
Others 716 3,586 Balance at the end of the year 750,851 950,701
Defined benefit liabilities 224,469 191,907 Defined benefit assets (8,757) (136,774)
Net defined benefit liabilities recognized in the consolidated statements of financial position 215,712 55,133
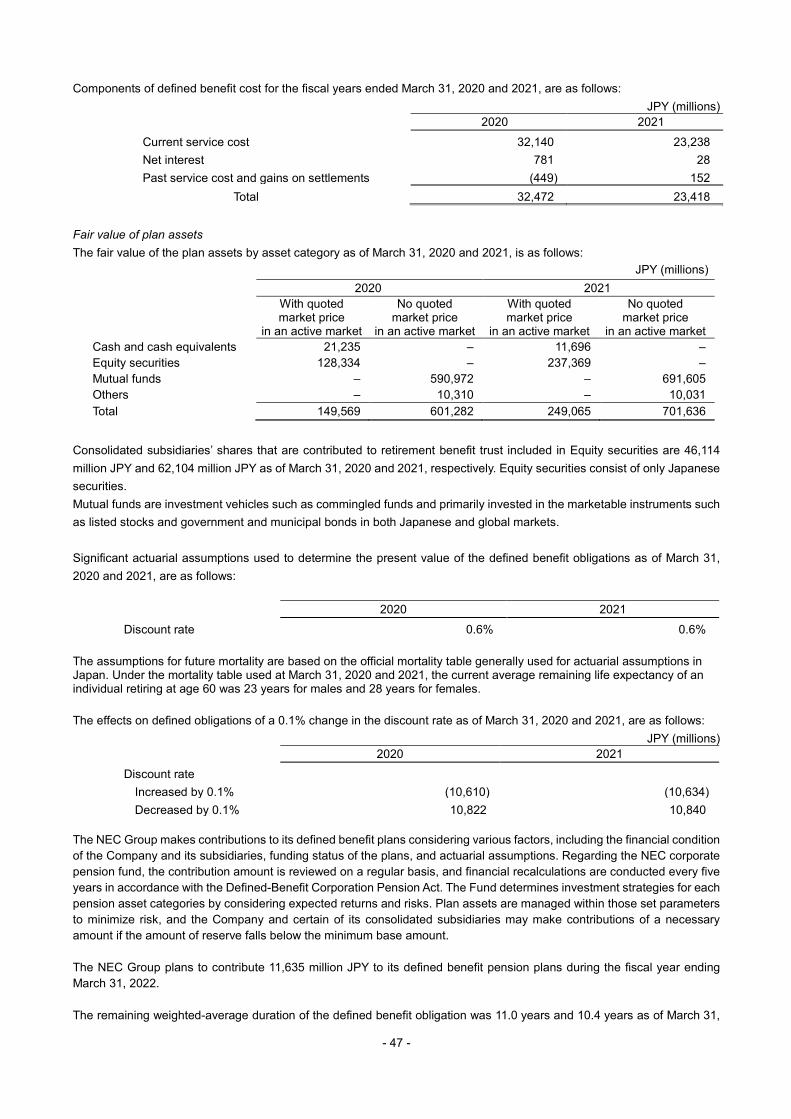
- 47 -
Components of defined benefit cost for the fiscal years ended March 31, 2020 and 2021, are as follows: JPY (millions)
2020 2021 Current service cost 32,140 23,238 Net interest 781 28 Past service cost and gains on settlements (449) 152
Total 32,472 23,418 Fair value of plan assets The fair value of the plan assets by asset category as of March 31, 2020 and 2021, is as follows:
JPY (millions) 2020 2021
With quoted market price
in an active market
No quoted market price
in an active market
With quoted market price
in an active market
No quoted market price
in an active market Cash and cash equivalents 21,235 – 11,696 – Equity securities 128,334 – 237,369 – Mutual funds – 590,972 – 691,605 Others – 10,310 – 10,031 Total 149,569 601,282 249,065 701,636
Consolidated subsidiaries’ shares that are contributed to retirement benefit trust included in Equity securities are 46,114 million JPY and 62,104 million JPY as of March 31, 2020 and 2021, respectively. Equity securities consist of only Japanese securities. Mutual funds are investment vehicles such as commingled funds and primarily invested in the marketable instruments such as listed stocks and government and municipal bonds in both Japanese and global markets. Significant actuarial assumptions used to determine the present value of the defined benefit obligations as of March 31, 2020 and 2021, are as follows:
2020 2021 Discount rate 0.6% 0.6%
The assumptions for future mortality are based on the official mortality table generally used for actuarial assumptions in Japan. Under the mortality table used at March 31, 2020 and 2021, the current average remaining life expectancy of an individual retiring at age 60 was 23 years for males and 28 years for females. The effects on defined obligations of a 0.1% change in the discount rate as of March 31, 2020 and 2021, are as follows:
JPY (millions) 2020 2021
Discount rate Increased by 0.1% (10,610) (10,634) Decreased by 0.1% 10,822 10,840
The NEC Group makes contributions to its defined benefit plans considering various factors, including the financial condition of the Company and its subsidiaries, funding status of the plans, and actuarial assumptions. Regarding the NEC corporate pension fund, the contribution amount is reviewed on a regular basis, and financial recalculations are conducted every five years in accordance with the Defined-Benefit Corporation Pension Act. The Fund determines investment strategies for each pension asset categories by considering expected returns and risks. Plan assets are managed within those set parameters to minimize risk, and the Company and certain of its consolidated subsidiaries may make contributions of a necessary amount if the amount of reserve falls below the minimum base amount.
The NEC Group plans to contribute 11,635 million JPY to its defined benefit pension plans during the fiscal year ending March 31, 2022.
The remaining weighted-average duration of the defined benefit obligation was 11.0 years and 10.4 years as of March 31,

- 48 -
2020 and 2021, respectively. Contribution to the defined contribution plans The Company and certain of its subsidiaries provide defined contribution benefit plans. The contributions made by the NEC Group recorded as retirement benefit expenses were 57,542 million JPY, and 63,238 million JPY for the years ended March 31, 2020 and 2021, respectively. The amount includes the payment of premiums by employer in welfare pension insurance premiums.

- 49 -
23. Provisions A roll forward of provisions by major component for the fiscal year ended March 31, 2021, is as follows:
JPY (millions)
Product warranty liabilities
Provision for business structure
improvement
Asset
retirement obligations
Provision for loss on
construction contracts
and others
Provision for Commercial
Disputes and
Litigation
Other Total
Balance as of April 1, 2020 15,655 3,995 4,342 20,315 18,862 8,612 71,781
Increase 11,401 1,223 9,398 10,861 2,702 2,633 38,218 Decrease (used during the year) (10,873) (1,695) (303) (10,874) (3,279) (3,179) (30,203)
Decrease (reversed during the year) (1,396) (1,198) – (751) (384) – (3,729)
Other 270 (93) 243 (149) 371 (907) (265) Balance as of March 31, 2021 15,057 2,232 13,680 19,402 18,272 7,159 75,802
Balance as of April 1, 2020 15,655 3,995 4,342 20,315 18,862 8,612 71,781
Balance as of April 1, 2020 – Current
11,362 2,531 701 20,315
17,616 6,887 59,412
Balance as of April 1, 2020 – Non-current
4,293 1,464 3,641 –
1,246 1,725 12,369
Balance as of March 31, 2021 15,057 2,232 13,680 19,402 18,272 7,159 75,802
Balance as of March 31, 2021 – Current
10,920 2,232 1,185 19,402
16,714 4,928 55,381
Balance as of March 31, 2021 – Non-current
4,137 – 12,495 –
1,558 2,231 20,421
Product Warranty Liabilities The NEC Group sells products that are repaired or exchanged for free of charge within the warranty period after the sale of products or delivery of developed software, based on contracts. Product warranty liabilities are recognized for individually estimated future warranty costs using the historical ratio of warranty costs to net sales or other relevant factors, considering the additional incremental costs that are expected to be incurred. Most of these costs are expected to be incurred in the following fiscal year and the rest to be incurred within approximately two years after the end of the reporting period. Provision for Business Structure Improvement The provision is recognized for the estimated expenses and losses in connection with restructuring activities. Most of this provision is expected to be utilized in the next year and the rest to be utilized within approximately two years from the end of the reporting period. Asset Retirement Obligations The provision is made mainly for the expenses in association with scrap, removal and retirement of long-lived assets, and restoring the site based on past experience. These expenses are added to the carrying amount of the related assets. The expenses and discount rate are reviewed every year. Most of these costs are expected to be incurred by 2050.
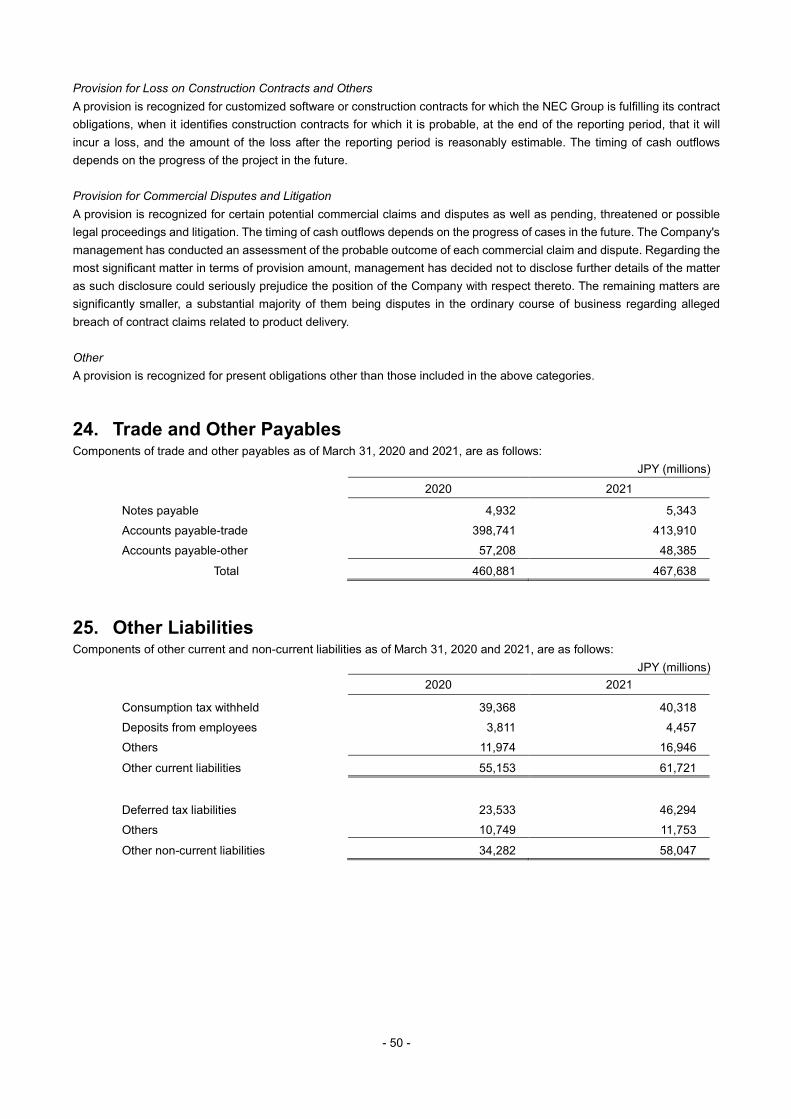
- 50 -
Provision for Loss on Construction Contracts and Others A provision is recognized for customized software or construction contracts for which the NEC Group is fulfilling its contract obligations, when it identifies construction contracts for which it is probable, at the end of the reporting period, that it will incur a loss, and the amount of the loss after the reporting period is reasonably estimable. The timing of cash outflows depends on the progress of the project in the future. Provision for Commercial Disputes and Litigation A provision is recognized for certain potential commercial claims and disputes as well as pending, threatened or possible legal proceedings and litigation. The timing of cash outflows depends on the progress of cases in the future. The Company's management has conducted an assessment of the probable outcome of each commercial claim and dispute. Regarding the most significant matter in terms of provision amount, management has decided not to disclose further details of the matter as such disclosure could seriously prejudice the position of the Company with respect thereto. The remaining matters are significantly smaller, a substantial majority of them being disputes in the ordinary course of business regarding alleged breach of contract claims related to product delivery. Other A provision is recognized for present obligations other than those included in the above categories.
24. Trade and Other Payables Components of trade and other payables as of March 31, 2020 and 2021, are as follows:
JPY (millions) 2020 2021
Notes payable 4,932 5,343 Accounts payable-trade 398,741 413,910 Accounts payable-other 57,208 48,385
Total 460,881 467,638
25. Other Liabilities Components of other current and non-current liabilities as of March 31, 2020 and 2021, are as follows:
JPY (millions) 2020 2021
Consumption tax withheld 39,368 40,318 Deposits from employees 3,811 4,457 Others 11,974 16,946
Other current liabilities 55,153 61,721
Deferred tax liabilities 23,533 46,294 Others 10,749 11,753
Other non-current liabilities 34,282 58,047

- 51 -
26. Revenue Disaggregation of revenue The NEC Group has five reportable segments: Public Solutions, Public Infrastructure, Enterprise, Network Services and Global. Revenue consists of the following three categories; “Contracts for hardware and packaged software deployments”, “Contracts for services to customers (including maintenance and outsourcing)”, and “Contracts for system integrations and equipment constructions”. The revenue in three categories for the fiscal years ended March 31, 2020 and 2021, are as follows: Fiscal year ended March 31, 2020
JPY (millions) Reportable segments
Others Consolidated Total Public
Solutions Public
Infrastructure Enterprise Network Services Global Total
Contracts for hardware and packaged software deployments 175,048 289,026 137,261 140,702 161,130 903,167 194,825 1,097,992
Contracts for services to customers (including maintenance and outsourcing) 151,791 115,564 228,224 206,520 195,658 897,757 127,583 1,025,340
Contracts for system integrations and equipment constructions 151,513 274,177 184,311 135,470 136,285 881,756 90,146 971,902
Total 478,352 678,767 549,796 482,692 493,073 2,682,680 412,554 3,095,234
Fiscal year ended March 31, 2021
JPY (millions) Reportable segments
Others Consolidated Total Public
Solutions Public
Infrastructure Enterprise Network Services Global Total
Contracts for hardware and packaged software deployments 128,613 310,683 119,012 153,871 102,708 814,887 166,490 981,377
Contracts for services to customers (including maintenance and outsourcing) 148,135 128,655 226,931 221,977 186,932 912,630 127,132 1,039,762
Contracts for system integrations and equipment constructions 148,312 253,538 157,131 162,962 160,348 882,291 90,593 972,884
Total 425,060 692,876 503,074 538,810 449,988 2,609,808 384,215 2,994,023
The above disaggregated revenue information for the fiscal year ended March 31, 2020 has been restated to conform to the current segment composition reflecting the organizational changes effective April 1, 2020. Contract balances There are no significant changes to contract assets during the fiscal years ended March 31, 2020 and 2021. The amounts of revenue recognized for the fiscal years ended March 31, 2020 and 2021, that were included in the contract liability balances at the beginning of the years are 124,758 million JPY and 113,635 million JPY, respectively.

- 52 -
Remaining performance obligations The revenue expected to be recognized in the future related to performance obligations that are unsatisfied (or partially unsatisfied) as of March 31, 2020 and 2021, is as follows:
JPY (millions) 2020 2021 Timing of recognition in revenue
One year or less 527,020 637,653 More than one year 785,843 1,042,741
Remaining performance obligations 1,312,863 1,680,394 The table above does not include the remaining performance obligations that have original expected durations of one year or less.

- 53 -
27. Other Operating Income (Expenses) Components of other operating income (expenses) for the fiscal years ended March 31, 2020 and 2021, are as follows:
JPY (millions) 2020 2021
Other operating income
Gain on sales of land 1,656 16,073 Gain on sales of subsidiaries’ stocks 245 11,540 Insurance recovery 2,735 4,773 Indemnification received 1,514 815 Gain on loss of control of subsidiaries 1,684 102 Other 5,476 9,168
Subtotal 13,310 42,471
Other operating expenses Impairment loss (6,384) (4,035) Loss on disposal of property, plant and equipment (3,280) (3,746) Provision for contingent loss (2,242) (1,186) Other (8,664) (7,939)
Subtotal (20,570) (16,906)
Other operating expenses, net (7,260) 25,565
“Gain on sales of land” for the fiscal year ended March 31, 2021, mainly represents a gain on sale and leaseback transactions. “Gain on sales of subsidiaries’ stocks” for the fiscal year ended March 31, 2021, mainly represents a gain on sale of shares of Showa Optronics. For “Impairment loss,” please refer to Note 10. “Impairment Losses of Non-Financial Assets.” 28. Expenses by Nature Major components of expenses by nature included in “Cost of sales” and “Selling, general and administrative expenses” for the fiscal years ended March 31, 2020 and 2021, are as follows:
JPY (millions) 2020 2021
Material costs 998,644 959,267 Personnel expenses 891,123 885,457 Outsourcing and subcontracting fees 588,727 568,306 Depreciation and amortization 188,984 191,227
Components of personnel expenses for the fiscal years ended March 31, 2020 and 2021, are as follows:
JPY (millions) 2020 2021
Salaries and bonuses 709,281 713,084 Retirement benefit expenses 94,665 91,674 Social security expense 60,957 59,319 Other 26,220 21,380
Total 891,123 885,457

- 54 -
29. Finance Income and Finance Costs Components of finance income and finance costs for the fiscal years ended March 31, 2020 and 2021, are as follows:
JPY (millions) 2020 2021 Finance income
Interest income 1,994 1,037 Dividend income 5,148 4,162 Gain on sales of associates 135 3,365 Foreign exchange gains, net – 758 Other 1,200 369
Total 8,477 9,691 JPY (millions)
2020 2021 Finance costs
Interest expenses 9,844 8,527 Foreign exchange losses, net 3,560 – Other 2,060 2,086
Total 15,464 10,613 Interest income arises from financial assets measured at amortized cost. Dividend income arises from equity instruments designated as measured at fair value through other comprehensive income. In addition, interest expenses arise from financial liabilities measured at amortized cost and lease liabilities. "Gain on sales of associates" in the fiscal year ended March 31, 2021, is mainly from the sale of shares of SINCERE Corporation. 30. Earnings Per Share The calculation of basic earnings per share (“EPS”) and diluted EPS has been based on the following profit attributable to ordinary shareholders of the parent company for the fiscal years ended March 31, 2020 and 2021:
JPY (millions) 2020 2021 Net profit attributable to owners of the Parent 99,967 149,606 Net profit attributable to ordinary shareholders of the parent to calculate basic EPS 99,967 149,606
Net profit attributable to ordinary shareholders of the Parent after adjustment for the effects of dilutive potential ordinary shares
99,967 149,606
Weighted-average number of ordinary shares to calculate basic EPS (in thousands of shares) 259,644 268,504
Weighted-average number of ordinary shares (diluted) (in thousands of shares) 259,644 268,504
Basic EPS (JPY) 385.02 557.18 Diluted EPS (JPY) 385.01 557.18
Net Profit attributable to ordinary shareholders of the Parent after adjustment for the effects of dilutive potential ordinary
shares includes the effect of share options issued by Japan Aviation Electronics Industry, Limited, a subsidiary of the
Company.

- 55 -
31. Financial Instruments Capital management The NEC Group focuses on the business operation for emphasizing capital efficiency, invests to growth sectors, and enhances capital base to create long-term corporate value of the NEC Group. The NEC Group manages net debt-equity ratio for enhancing capital base. Total assets, total liabilities, and total equity are as follows: Condensed Consolidated Statement of Financial Position as of March 31, 2020 and 2021
JPY (billions) YoY Change 2020 2021 2021/2020
Total Assets 3,123.3 3,668.6 545.3 Total liabilities 2,008.7 2,106.7 98.0 Total equity 1,114.5 1,561.8 447.3 Interest-bearing debt 675.4 702.9 27.4 Net interest-bearing debt 316.2 179.5 (136.7) Equity attributable to owners of the parent 910.7 1,308.2 397.5 Ratio of equity attributable to owners of the parent 29.2% 35.7% 6.5 Debt equity ratio 0.74 times 0.54 times (0.20) Net debt-equity ratio 0.35 times 0.14 times (0.21)
* Net debt-equity ratio = (Interest-bearing debt – Cash and cash equivalents) / Equity attributable to owners of the parent Financial risk management The NEC Group operates its business in various countries and jurisdictions, and as such, it has exposure to credit risk, liquidity risk, and market risk (mainly represented by interest rate risk and currency risk). The NEC Group conducts appropriate risk management activities to minimize the effect of these financial risks on its financial position and performance.
Credit risk Credit risk is a risk of financial loss to the NEC Group if a customer or a counterparty to a financial instrument fails to meet its obligations and arises principally from the NEC Group’s receivables from customers and investments in debt securities. The NEC Group is monitoring the financial position and past due balances of customers in order to minimize the risk of default resulting from deterioration of customers' financial position. Further, if necessary, preventative measures are taken by holding collateral or through other means. Financial institutions with high credit capabilities are selected as counterparties while dealing in derivative transactions, deposit transactions, and the purchase of financial assets for short-term investments in order to reduce the counterparty risk. The NEC Group guarantees its employees and its suppliers’ borrowings from financial institutions. The total amounts of financial guarantee were 574 million JPY and 14 million JPY as of March 31, 2020 and 2021, respectively. The maximum exposure to credit risk, without taking into account of any collateral held at the end of the reporting period, is represented by the total amount of financial guarantee and carrying amount of the financial instruments which is exposed to credit risk in the consolidated statement of financial position. Credit risk exposure relating to trade and other receivables and contract assets The trade and other receivables are mainly from Japanese customers. An allowance for expected credit losses for trade and other receivables and contract assets is measured at an amount equal to the lifetime expected credit losses. The assets are grouped by each asset with similar characteristics of credit risks and expected credit losses are calculated based on historical default rates, concerning the current conditions and future economic environment. Expected credit losses for credit-impaired financial assets are calculated by each asset.
The NEC Group determines whether credit risk of financial assets has increased significantly since initial recognition by considering reasonable and supportable information. This information includes past information, external ratings, past due information, as well as forward-looking information.

- 56 -
The NEC Group determines that credit risk has increased significantly since initial recognition when, for example, a borrower falls under any of the following conditions: - The external rating of the borrower is deemed ineligible for investment. - The delinquency period exceeds 30 days.
The NEC Group defines that a default has occurred when a borrower falls under any of the following conditions: - It is judged that there is almost no possibility that the borrower pays obligations to the NEC Group without executing the
security interest. - The delinquency period exceeds 90 days.
The NEC Group determines that a financial asset has been credit impaired when any of the following situations is confirmed: - Significant financial difficulty of the issuer or borrower. - A breach of contract, such as a default or past due event. - The lender(s) of the borrower, for economic or contractual reasons relating to the borrower’s financial difficulty, having
granted to the borrower a concession(s) that the lender(s) would not otherwise consider. - It is becoming probable that the borrower will enter bankruptcy or other financial reorganization. - The disappearance of an active market for that financial asset because of financial difficulties.
Credit risk exposure relating to trade receivables The NEC Group’s credit risk exposure relating to trade receivables as of March 31, 2020 and 2021, is as follows:
JPY (millions)
Gross carrying amount of a financial asset
Allowance for expected credit losses
Carrying amount, net of allowance for
expected credit losses March 31, 2020 686,839 (7,343) 679,496 March 31, 2021 694,578 (5,792) 688,786
In determining whether the financial assets are credit-impaired, the NEC Group uses reasonable and substantiated information which is available without undue cost or effort. The NEC Group considers that the financial assets are not credit-impaired if the information provides counterevidence. Expected credit losses from other receivables, contract assets, other financial assets, and financial guarantee contracts are not significant and the table above does not include them. The changes in allowance for expected credit losses on trade receivables for the fiscal years ended March 31, 2020 and 2021, are as follows:
JPY (millions)
2020 2021
Beginning balance 8,366 7,343
Increase 1,144 2,282
Decrease (written off) (978) (1,105)
Decrease (reversal) (660) (2,813)
Others (529) 85
Ending balance 7,343 5,792 Liquidity risk Liquidity risk is the risk that the NEC Group encounters difficulty in meeting the obligations associated with its financial liabilities that are settled by delivering cash or another financial asset. The NEC Group’s approach of managing liquidity is to ensure that it has sufficient liquidity to meet its liabilities when they are due. The NEC Group periodically updates forecasts of its future cash flows aiming to maintain the level of its cash and cash equivalents and the unused balance of commitment line of credit at an amount in excess of expected cash outflows on financial liabilities required for conducting its business.

- 57 -
The following are the remaining contractual maturities of financial liabilities as of March 31, 2020 and 2021. The amounts below include contractual interest payments and exclude the impact of netting agreements. As of March 31, 2020
JPY (millions)
Carrying amount Contractual
cash flows Within one year
Between one and
two years
Between two and
three years
Between three
and four years
Between four and
five years
More than five
years
Non-derivative financial liabilities:
Trade and other payables 460,881 460,881 460,881 – – – – –
Accruals 56,795 56,795 56,795 – – – – – Short-term borrowings 96,976 99,474 99,474 – – – – –
Long-term borrowings 223,248 332,170 6,051 6,741 44,501 43,678 3,864 227,335
Bonds 199,596 202,242 55,631 555 55,438 30,283 25,199 35,136 Lease liabilities 155,599 162,261 49,777 38,093 29,729 17,464 12,348 14,850 Derivative financial liabilities:
Forward exchange contracts 1,058 1,058 828 210 5 9 6 –
Total 1,194,153 1,314,881 729,437 45,599 129,673 91,434 41,417 277,321
As of March 31, 2021
JPY (millions)
Carrying amount Contractual
cash flows Within one year
Between one and
two years
Between two and
three years
Between three
and four years
Between four
and five years
More than five
years
Non-derivative financial liabilities:
Trade and other payables 467,638 467,638 467,638 – – – – –
Accruals 63,908 63,908 63,908 – – – – – Short-term borrowings 40,969 41,504 41,504 – – – – –
Long-term borrowings 319,697 427,062 12,981 51,745 48,703 36,693 51,039 225,901
Bonds 179,583 182,652 697 55,580 40,411 25,313 25,220 35,431 Lease liabilities 162,607 169,924 52,226 39,809 22,790 17,315 10,863 26,921
Derivative financial liabilities:
Forward exchange contracts 7,454 7,454 5,738 1,133 261 84 88 150
Total 1,241,856 1,360,142 644,692 148,267 112,165 79,405 87,210 288,403
It is not expected that the contractual cash flows included in the maturity analysis disclosed above could occur significantly earlier or at significantly different amounts. However, certain long-term borrowings with an aggregate principal amount of 130,000 million JPY contain a covenant for early repayment, under which the NEC Group is able to make an early repayment of all (or part) of the principal during or after 2021, provided that certain conditions are met.

- 58 -
Market risk Interest rate risk Interest-bearing debts with floating interest rates, including long-term borrowings, are exposed to interest rate risk. The NEC Group may use interest rate swaps as hedges of the variability in cash flows attributable to interest rate risk.
The following table shows the floating-rate financial liabilities of the NEC Group as of March 31, 2020 and 2021. Interest-bearing debts with floating rates that are fixed rates in substance under interest rate swap contracts are excluded from the amounts.
JPY (millions) 2020 2021
Carrying amount Carrying amount
Long-term borrowings (floating rates) 65,671 65,500 Sensitivity analysis for financial instruments with floating rates An increase of 1% in interest rates on the financial instruments with floating rates at the end of the reporting period would have decreased profit before income taxes by the amounts shown below. The amounts are calculated by multiplying the balance of financial liabilities with the floating rate held by the NEC Group at the end of the reporting period (except for those with floating rates that are fixed rates in substance under interest rate swap contracts) by 1% and assuming that all other variables, in particular foreign current exchange rates, remain constant. The analysis applies the same assumptions in each fiscal year.
JPY (millions) 2020 2021
Profit before income taxes (657) (655)
Foreign currency risk The NEC Group operates its business globally and is exposed to the risk of fluctuation in foreign exchange rates. The NEC Group mitigates foreign currency risk exposures to an extent possible by offsetting trade receivables and payables denominated in the same foreign currencies and conducting hedge transactions mainly on the remaining net exposures and net forecast transaction exposures using forward exchange contracts. The NEC Group’s exposure to foreign currency risk as of March 31, 2020 and 2021, is as follows:
(Thousands of U.S. dollars and euros) 2020 2021
U.S. dollars Euros U.S. dollars Euros
Trade receivables 310,704 5,883 231,040 5,522 Trade payables (290,909) (9,025) (302,572) (8,567) Forward exchange contracts
(337,754) (22,349) (380,655) (10,665)
Net exposure (317,959) (25,491) (452,187) (13,710)

- 59 -
Sensitivity analysis for foreign exchange rates Strengthening of the JPY by 1% against the U.S. dollar and euro at the end of the reporting period would have increased or decreased profit before income taxes by the amounts shown below. This analysis assumes that all other variables, such as interest rates, remain constant.
JPY (millions) 2020
2021
Profit before income taxes Profit before income taxes U.S. dollars (1% strengthening of the JPY)
346 501
Euros (1% strengthening of the JPY)
30 18
Equity price risk The NEC Group holds listed equity instruments of parties with which the NEC Group has a business relationship, and, therefore, is exposed to the risk of fluctuation in prices of equity instruments. The equity instruments are held for if the NEC Group determines that it will contribute to the increase of the mid- to long-term corporate value of the NEC Group after comprehensive consideration of its management strategy, the relationships with business partners and other circumstances.
Sensitivity analysis for fluctuation in equity prices An increase or decrease of 1% in equity prices based on the price risk of equity instruments at the end of the reporting period would have increased or decreased other components of equity (before tax) by the amounts shown below.
JPY (millions)
2020
2021
Increase or decrease of 1% in equity prices 943 761 Fair value measurement Fair value hierarchy Hierarchy and classification used for the fair value measurement for financial assets and liabilities measured at fair value are as follows:
Level 1: Quoted prices in active markets for identical assets or liabilities Level 2: Inputs other than quoted prices classified into Level 1 that are observable for the financial asset or liability, either directly or indirectly Level 3: Unobservable inputs that are not based on observable market data
The NEC Group recognizes transfers between levels of the fair value hierarchy when a triggering event of the change has occurred. Basis of the fair value measurement for financial instruments Cash and cash equivalents, trade and other receivables, trade and other payables, and accruals: The fair value is determined as equal or close to the carrying amount since they are to be settled in a short term.
The fair value of loans is measured by discounting estimated future cash flows to the present value based on an interest rate that takes into account the remaining period to the maturity date and credit risk.
Of equity instruments designated as measured at fair value through other comprehensive income and financial assets measured at fair value through profit or loss, the fair value of listed equity instruments is determined using a quoted market price at an exchange. The fair value of equity securities with no active market is measured mainly by using the comparable company valuation method or other appropriate valuation methods. Price book-value ratio (PBR) of a comparable company is used as a significant unobservable input in the fair value measurement of the equity securities with no active market. The fair value increases (decreases) as the PBR of a comparable company rises (declines).

- 60 -
For derivative assets and liabilities, the fair value of forward exchange contracts is calculated based on the quoted forward exchange rates at the end of the fiscal year, while the fair value of interest rate swaps is calculated as the present value of the estimated future cash flows based on the interest rate at the end of the reporting period.
The fair values of short-term borrowings and long-term borrowings (current portion) are determined as the carrying amount, as the carrying amount is a reasonable estimate of fair value due to the relatively short period of maturity of these instruments. The fair value of long-term borrowings (excluding the current portion) is calculated as the present value of the estimated future cash flows, based on the expected interest rate at which a similar new borrowing was made. The fair value of bonds is determined based on the quoted market price in a non-active market. The carrying amounts and fair values of financial assets and liabilities as of March 31, 2020 and 2021, are as follows:
JPY (millions) 2020 2021
Carrying amount Fair value Carrying amount Fair value
Financial assets measured at amortized cost:
Cash and cash equivalents 359,252 359,252 523,345 523,345 Trade and other receivables 737,484 737,484 740,448 740,448 Others 45,576 45,576 47,565 47,565 Financial liabilities measured at amortized cost:
Trade and other payables 460,881 460,881 467,638 467,638 Short-term borrowings 96,976 96,976 40,969 40,969
Current portion of long-term borrowings
3,029 3,029 10,541 10,541
Bonds 199,596 200,425 179,583 180,475 Long-term borrowings 220,219 220,879 309,156 309,536 Accruals 56,795 56,795 63,908 63,908 Others 12,412 12,412 11,543 11,543
Regarding the fair value hierarchy of assets and liabilities (except for those whose fair value is determined as equal or close to the carrying amount) presented in the table above, bonds are categorized as Level 2 and long-term borrowings are categorized as Level 3. Additionally, accruals that are categorized as financial instruments do not include accruals for employee benefit and accruals by statutory requirements.

- 61 -
Financial assets and liabilities measured at fair value on a recurring basis by fair value category as of March 31, 2020 and 2021, are as follows:
As of March 31, 2020 JPY (millions)
Level 1 Level 2 Level 3 Total Financial assets measured at fair value through profit or loss – 1,578 10,531 12,109
Equity instruments designated as measured at fair value through other comprehensive income
94,273 – 72,952 167,225
Financial liabilities measured at fair value through profit or loss – 1,058 – 1,058
As of March 31, 2021 JPY (millions)
Level 1 Level 2 Level 3 Total Financial assets measured at fair value through profit or loss – 3,295 12,855 16,150
Equity instruments designated as measured at fair value through other comprehensive income
76,159 – 80,126 156,285
Financial liabilities measured at fair value through profit or loss – 7,454 – 7,454
There were no significant financial assets or liabilities that were transferred between levels during the fiscal years ended March 31, 2020 and 2021. Level 3 fair value Financial assets classified into Level 3 mainly consist of unquoted equity instruments. The fair value of significant unquoted equity instruments is measured by using comparable company valuation multiples and other appropriate valuation techniques. For the financial assets classified into Level 3, changes of unobservable inputs to reasonably possible alternative assumptions are not expected to cause significant changes in the fair value of those financial assets. Further, fair value measurements of financial assets and liabilities classified into Level 3 are reviewed and approved by the personnel responsible in the accounting department based on relating internal regulations. The significant changes in Level 3 assets measured at fair value on a recurring basis for the fiscal year ended March 31, 2020 are mainly due to purchase of equity instruments measured at fair value through profit or loss. There are no significant changes during the fiscal year ended March 31, 2021. Equity instruments designated as financial assets measured at fair value through other comprehensive income The NEC Group designates long-term stock holdings for the purpose of maintaining and strengthening relationship with its business partners and expanding its revenue base as equity instruments measured at fair value through other comprehensive income. The NEC Group, in principle, makes an irrevocable election to present in other comprehensive income subsequent changes in the fair value of an investment in equity instruments, except those in the form of venture capital investment. The fair value and dividend income of equity instruments designated as measured at fair value through other comprehensive income and recognized in other financial assets are 167,225 million JPY and 4,426 million JPY, respectively, for the fiscal year ended March 31, 2020, and 156,285 million JPY and 3,602 million JPY, respectively, for the fiscal year ended March 31, 2021. The NEC Group attempts to review the strategic stockholding by evaluating whether the purpose of holdings is appropriate, benefits and risks from holdings are balanced with capital costs of holdings, and existence of future risk when selling, etc., from both of quantitative and qualitative aspects. When the stockholdings are deemed unnecessary, they will be sold promptly. The fair value at the time of derecognition and the cumulative gains or losses which were recognized as other comprehensive income are 12,279 million JPY and 5,455 million JPY, respectively, for the fiscal year ended March 31, 2020, and 97,107 million JPY and 71,210 million JPY, respectively, for the fiscal year ended March 31, 2021.

- 62 -
Equity instruments designated as measured at fair value through other comprehensive income classified as Level 1 in the fair value hierarchy as of March 31, 2020 and 2021, include the following:
JPY (millions) 2020 2021
Sumitomo Electric Industries, Ltd. 7,869 11,464 TBS HOLDINGS, INC. 3,623 5,233 DAIKIN INDUSTRIES, LTD. 3,007 5,096 Sumitomo Mitsui Trust Holdings, Inc. 4,088 5,050 MEIDENSHA CORPORATION 2,832 4,203 MS&AD Insurance Group Holdings, Inc. 3,325 3,572 Sumitomo Forestry Co., Ltd. 1,988 3,425 Sumitomo Realty & Development Co., Ltd. 2,040 3,024 Seven Bank, Ltd. 2,790 2,530
Equity instruments designated as measured at fair value through other comprehensive income classified as Level 3 in the fair value hierarchy as of March 31, 2020 and 2021, include the following:
JPY (millions) 2020 2021
JECC Corporation 36,788 37,110 Dalian Hi-Think Computer Technology Corp. 11,211 16,462 BostonGene Corporation 5,986 5,690
Hedge accounting There were no significant transactions to which hedge accounting was applied. Other financial assets and other financial liabilities A breakdown of other financial assets and other financial liabilities as of March 31, 2020 and 2021, is as follows:
JPY (millions) 2020 2021
Financial assets measured at amortized cost:
Deposits 496 596 Others 45,080 46,969
Financial assets measured at fair value through other comprehensive income:
Equity instruments 167,225 156,285 Financial assets measured at fair value through profit or loss:
Equity instruments 10,531 12,855 Others 1,578 3,295
Total 224,910 220,000
Other financial assets-current 5,584 9,573 Other financial assets-non-current 219,326 210,427
Total 224,910 220,000

- 63 -
Financial liabilities measured at amortized cost:
Deposits received 5,636 6,077 Long-term accounts payable 39,793 29,855 Others 10,910 11,258
Financial liabilities measured at fair value through profit or loss:
Others 1,058 7,454 Total 57,397 54,644
Other financial liabilities-current 14,995 19,670 Other financial liabilities-non-current 42,402 34,974
Total 57,397 54,644

- 64 -
32. Leases The nature of the leasing activities The NEC Group, as a lessee, leases mainly buildings and land (“property”) for its office space and vehicles for its administrative and sales functions. Certain of these property leases include options to extend the lease term after the end of the lease period exercisable by the NEC Group to obtain operational flexibility. There are no significant restrictions or covenants, such as those restricting additional debts and further leasing, imposed by leases. The vast majority of the building lease contracts, especially for those entered into for the use in the domestic businesses, contain extension options exercisable at the discretion of the NEC Group, and only lease payments for the duration of the lease term that is a period covered by the options which the NEC Group is reasonably certain to exercise are included in measuring the lease liability. Expenses, and cash outflows related to lease arrangements for the fiscal year ended March 31, 2020 and 2021, are as follows: JPY (millions) 2020 2021 Depreciation expense for right-of-use assets by the class of underlying asset
Property 50,366 52,211 Machinery and equipment 1,076 1,346 Tools, furniture and fixtures 2,475 2,784
Total 53,917 56,341 Interest expense on lease liabilities 2,375 2,316 Expense relating to short-term leases 4,578 4,446 Expense relating to leases of low-value assets 4,934 5,700 Total cash outflow for leases 65,339 69,970
The carrying amount of right-of-use assets by class of underlying asset as of March 31, 2020 and 2021, are as follows:
JPY (millions) 2020 2021
Property 141,092 133,758 Machinery and equipment 1,950 1,369 Tools, furniture and fixtures 7,640 7,460
Total 150,682 142,587 Additions to right-of-use assets amounted to 31,000 million JPY and 42,074 million JPY for the fiscal year ended March 31, 2020 and 2021 respectively. The future cash outflows to which the NEC Group is potentially exposed that are not reflected in the measurement of lease liabilities, arising from leases not yet commenced to which the NEC Group is committed, as of March 31, 2020 and 2021, are 7,712 million JPY and 8,130 million JPY, respectively . Maturity analysis of lease liabilities is disclosed in Note 31, “Financial Instruments”.

- 65 -
33. Related Parties In the ordinary course of business, the NEC Group purchases from and sells to its related parties materials, supplies, and services. Such related parties include associates and joint ventures accounted for using the equity method.
Transactions with related parties Other than those purchase and sales transaction entered into in the ordinary course of business that are summarized in the table below, there were no significant transactions between the NEC Group and its related parties for the fiscal years ended March 31, 2020 and 2021. Purchases from and sales to related parties for the fiscal years ended March 31, 2020 and 2021 are as follows:
JPY (millions) 2020 2021
Purchases 147,255 132,094 Sales 150,591 149,046
Balances of trade and other receivables due from related parties and trade and other payables due to related parties as of March 31, 2020 and 2021, are as follows:
JPY (millions) 2020 2021
Trade and other receivables 25,270 29,758 Trade and other payables 39,545 51,503
Key management personnel compensation Key management personnel are defined as the Company’s board of directors and members of the audit and supervisory board. The compensation for the key management personnel for the fiscal years ended March 31, 2020 and 2021, is as follows:
JPY (millions) 2020 2021
Basic compensation 402 400 Bonuses 217 184 Stock compensation 375 167
Total 994 751

- 66 -
34. Commitments The amounts of contractual commitments for the purchases of property, plant and equipment as of March 31, 2020 and 2021, are 1,856 million JPY and 1,690 million JPY, respectively. The amounts of contractual commitments for the purchases of intangible assets as of March 31, 2020 and 2021, are 552
million JPY and 1,308 million JPY, respectively. 35. Contingencies The Company and certain of its subsidiaries are subject to legal proceedings, including civil litigations related to trade, tax, products, or intellectual properties, and governmental investigations. The Company has been dealing with the various litigations and investigations. Depending upon the outcome of these proceedings, the Company and certain of its subsidiaries may be subject to fines, and accordingly, the Company has accrued for certain probable and reasonable estimated amounts for the fines as it has a present obligation as a result of a past event, it is probable that an outflow of resources embodying economic benefits will be required to settle the obligation, and a reliable estimate can be made of the amount of the obligation.
There are a number of legal actions against the Company and certain subsidiaries. Management is of the opinion that damages, if any, resulting from these actions will not have a material effect on the Company’s consolidated financial statements.
It is difficult to predict the outcome of these actions and proceedings, given that certain of the investigations and legal proceedings are still at an early stage and present novel legal theories, involving a large number of parties or taking place in jurisdictions outside of Japan where the laws are complex or unclear. Accordingly, the Company is unable to estimate the losses or range of losses for the actions and proceedings where there is only a reasonable possibility that a loss exceeding the amounts already recognized may have been incurred.

- 67 -
36. Subsequent Events There are no significant subsequent events.


