85
Manulife Financial Corporation Consolidated Financial Statements For the year ended December 31, 2020

Manulife Financial CorporationConsolidated Financial Statements
For the year ended December 31, 2020
Responsibility for Financial ReportingThe accompanying consolidated financial statements of Manulife Financial Corporation are the responsibility of management and havebeen approved by the Board of Directors. It is also the responsibility of management to ensure that all information in the annual report toshareholders is consistent with these consolidated financial statements.
The consolidated financial statements have been prepared by management in accordance with International Financial Reporting Standardsand the accounting requirements of the Office of the Superintendent of Financial Institutions, Canada. When alternative accountingmethods exist, or when estimates and judgment are required, management has selected those amounts that present the Company’sfinancial position and results of operations in a manner most appropriate to the circumstances.
Appropriate systems of internal control, policies and procedures have been maintained to ensure that financial information is both relevantand reliable. The systems of internal control are assessed on an ongoing basis by management and the Company’s internal auditdepartment.
The actuary appointed by the Board of Directors (the “Appointed Actuary”) is responsible for ensuring that assumptions and methods usedin the determination of policy liabilities are appropriate to the circumstances and that reserves will be adequate to meet the Company’sfuture obligations under insurance and annuity contracts.
The Board of Directors is responsible for ensuring that management fulfills its responsibility for financial reporting and is ultimatelyresponsible for reviewing and approving the consolidated financial statements. These responsibilities are carried out primarily through anAudit Committee of unrelated and independent directors appointed by the Board of Directors.
The Audit Committee meets periodically with management, the internal auditors, the peer reviewers, the external auditors and theAppointed Actuary to discuss internal control over the financial reporting process, auditing matters and financial reporting issues. TheAudit Committee reviews the consolidated financial statements prepared by management and then recommends them to the Board ofDirectors for approval. The Audit Committee also recommends to the Board of Directors and shareholders the appointment of externalauditors and approval of their fees.
The consolidated financial statements have been audited by the Company’s external auditors, Ernst & Young LLP, in accordance withCanadian generally accepted auditing standards and the standards of the Public Company Accounting Oversight Board (United States).Ernst & Young LLP has full and free access to management and the Audit Committee.
Roy GoriPresident and Chief Executive Officer
Philip WitheringtonChief Financial Officer
Toronto, CanadaFebruary 10, 2021
Appointed Actuary’s Report to the ShareholdersI have valued the policy liabilities and reinsurance recoverables of Manulife Financial Corporation for its Consolidated Statements ofFinancial Position as at December 31, 2020 and 2019 and their change in the Consolidated Statements of Income for the years then endedin accordance with actuarial practice generally accepted in Canada, including selection of appropriate assumptions and methods.
In my opinion, the amount of policy liabilities net of reinsurance recoverables makes appropriate provision for all policyholder obligationsand the consolidated financial statements fairly present the results of the valuation.
Steven FinchAppointed Actuary
Toronto, CanadaFebruary 10, 2021
103

Report of Independent Registered Public Accounting Firm
To the Shareholders and Board of Directors of Manulife Financial Corporation
Opinion on the Consolidated Financial StatementsWe have audited the consolidated financial statements of Manulife Financial Corporation (the “Company”), which comprise theConsolidated Statements of Financial Position as at December 31, 2020 and 2019, and the Consolidated Statements of Income,Consolidated Statements of Comprehensive Income, Consolidated Statements of Changes in Equity and Consolidated Statements of CashFlows for the years then ended, and notes to the consolidated financial statements, including a summary of significant accounting policies.
In our opinion, the accompanying consolidated financial statements present fairly, in all material respects, the consolidated financialposition of the Company as at December 31, 2020 and 2019, and its consolidated financial performance and its consolidated cash flowsfor the years then ended in accordance with International Financial Reporting Standards as issued by the International AccountingStandards Board.
Basis for OpinionWe conducted our audit in accordance with Canadian generally accepted auditing standards. Our responsibilities under those standardsare further described in the Auditor’s Responsibilities for the Audit of the Consolidated Financial Statements section of our report. We areindependent of the Company in accordance with the ethical requirements that are relevant to our audit of the consolidated financialstatements in Canada, and we have fulfilled our other ethical responsibilities in accordance with these requirements. We believe that theaudit evidence we have obtained is sufficient and appropriate to provide a basis for our opinion.
Key Audit MattersKey audit matters are those matters that, in our professional judgment, were of most significance in our audit of the consolidated financialstatements of the current period. These matters were addressed in the context of the audit of the consolidated financial statements as awhole, and in forming our opinion thereon, and we do not provide a separate opinion on these matters. For each matter below, ourdescription of how our audit addressed the matter is provided in that context.
We have fulfilled the responsibilities described in the Auditor’s Responsibilities for the Audit of the Consolidated Financial Statementssection of our report, including in relation to these matters. Accordingly, our audit included the performance of procedures designed torespond to our assessment of the risks of material misstatement of the consolidated financial statements. The results of our auditprocedures, including the procedures performed to address the matters below, provide the basis for our audit opinion on theaccompanying consolidated financial statements.
Valuation of Insurance Contract Liabilities
Key AuditMatter
The Company recorded insurance contract liabilities of $385.6 billion at December 31, 2020 on its consolidated statement offinancial position. Insurance contract liabilities are reported gross of reinsurance ceded and represent management’s estimate of theamount which, together with estimated future premiums and net investment income, will be sufficient to pay estimated futurebenefits, policyholder dividends and refunds, taxes (other than income taxes) and expenses on insurance policies in-force. Insurancecontract liabilities are determined using the Canadian Asset Liability Method (CALM), as required by the Canadian Institute ofActuaries (CIA). The valuation of insurance contract liabilities is based on an explicit projection of cash flows using currentassumptions for each material cash flow item. Cash flows related to insurance contract liabilities have two major components: a bestestimate assumption and a provision for adverse deviation. Best estimates are made with respect to key assumptions includingmortality, morbidity, investment returns, policy termination rates, premium persistency, expenses, and taxes. A provision for adversedeviation is recorded to reflect the inherent uncertainty related to the timing and amount of the best estimate assumptions and isdetermined by including a margin of conservatism for each assumption. Disclosures on this matter are found in Note 1 ‘Nature ofOperations and Significant Accounting Policies’ and Note 6 ‘Insurance Contract Liabilities and Reinsurance Assets’ of theconsolidated financial statements.
Auditing the valuation of insurance contract liabilities was complex and required the application of significant auditor judgement dueto the complexity of the cash flow models, the selection and use of assumptions, and the interrelationship of these variables inmeasuring insurance contract liabilities. The audit effort involved professionals with specialized skill and knowledge to assist inevaluating the audit evidence obtained.
104 | 2020 Annual Report | Consolidated Financial Statements

Valuation of Insurance Contract Liabilities
How Our AuditAddressed theKey AuditMatter
We obtained an understanding, evaluated the design, and tested the operating effectiveness of management’s controls over thevaluation of insurance contract liabilities. The controls we tested related to, among other areas, actuarial methodology, integrity ofdata used, controls over relevant information technology, and the assumption setting and implementation processes used bymanagement.
To test the valuation of insurance contract liabilities, our audit procedures included, among other procedures, involving our actuarialspecialists to assess the methodology and assumptions with respect to compliance with the Company’s policies. We performed auditprocedures over key assumptions, including the implementation of those assumptions into the models. These procedures includedtesting underlying support and documentation, including reviewing a sample of experience studies supporting specific assumptions,challenging the nature, timing, and completeness of changes recorded, assessing whether individual changes were errors orrefinements of estimates, and comparing the level of margins for adverse deviation to suggested ranges established by the CIA. Wealso performed independent recalculation procedures on a sample of insurance policies to evaluate management’s recordedreserves. In addition, we assessed the adequacy of the disclosures provided in the notes to the consolidated financial statements.
Valuation of Invested Assets with Significant Non-Observable Market Inputs
Key AuditMatter
The Company recorded invested assets of $17.5 billion at December 31, 2020 on its consolidated statement of financial positionwhich are both (a) measured at fair value and (b) subject to a valuation estimate that includes significant non-observable marketinputs. These invested assets are classified as level 3 within the Company’s hierarchy of fair value measurements and include realestate, timber and agriculture, high estimation uncertainty bonds, and private equities which are valued using internal models. Thereis increased measurement uncertainty associated with these invested assets due to market disruption associated with COVID-19.These assets are valued based on internal models or third-party pricing sources that incorporate assumptions with a high-level ofsubjectivity. Examples of such assumptions include interest rates, yield curves, credit ratings and related spreads, expected futurecash flows and transaction prices of comparable assets. Disclosures on this matter are found in Note 1 ‘Nature of Operations andSignificant Accounting Policies’ and Note 3 ‘Invested Assets and Investment Income’ of the consolidated financial statements.
Auditing the valuation of these invested assets was complex and required the application of significant auditor judgment in assessingthe valuation methodologies and non-observable inputs used. The valuation of these assets is sensitive to the significantnon-observable market inputs described above, which are inherently forward-looking and could be affected by future economic andmarket conditions. The audit effort involved professionals with specialized skill and knowledge to assist in evaluating the auditevidence obtained.
How Our AuditAddressed theKey AuditMatter
We obtained an understanding, evaluated the design, and tested the operating effectiveness of management’s controls over theinvestment valuation process. The controls we tested related to, among other areas, management’s determination and approval ofassumptions and methodologies used in model-based valuations and management’s review of valuations provided by third-partypricing sources.
To test the valuation of these invested assets, our audit procedures included, among other procedures, involving our valuationspecialists to assess the methodologies and significant assumptions used by management. These procedures included assessing thevaluation methodologies used with respect to the Company’s policies, valuation guidelines, and industry practice and comparing asample of valuation assumptions used against benchmarks, including comparable transactions and independent pricing sourceswhere available. We also performed independent investment valuations on a sample of investments with high estimation uncertaintyto evaluate management’s recorded values. In addition, we assessed the adequacy of the disclosures provided in the notes to theconsolidated financial statements.
Other InformationManagement is responsible for the other information. The other information comprises:
• Management’s Discussion and Analysis; and• The information, other than the consolidated financial statements and our auditor’s report thereon, in the 2020 Annual Report.
Our opinion on the consolidated financial statements does not cover the other information and we do not express any form of assuranceconclusion thereon.
In connection with our audit of the consolidated financial statements, our responsibility is to read the other information, and in doing so,consider whether the other information is materially inconsistent with the consolidated financial statements or our knowledge obtained inthe audit or otherwise appears to be materially misstated.
We obtained Management’s Discussion and Analysis prior to the date of this auditor’s report. If, based on the work we have performed, weconclude that there is a material misstatement of this other information, we are required to report that fact in this auditor’s report. We havenothing to report in this regard.
The 2020 Annual Report is expected to be made available to us after the date of the auditor’s report. If based on the work we will performon this other information, we conclude there is a material misstatement of other information, we are required to report that fact to thosecharged with governance.
105

Responsibilities of Management and Those Charged with Governance for the ConsolidatedFinancial StatementsManagement is responsible for the preparation and fair presentation of the consolidated financial statements in accordance withInternational Financial Reporting Standards, and for such internal control as management determines is necessary to enable thepreparation of consolidated financial statements that are free from material misstatement, whether due to fraud or error.
In preparing the consolidated financial statements, management is responsible for assessing the Company’s ability to continue as a goingconcern, disclosing, as applicable, matters related to going concern and using the going concern basis of accounting unless managementeither intends to liquidate the Company or to cease operations, or has no realistic alternative but to do so.
Those charged with governance are responsible for overseeing the Company’s financial reporting process.
Auditor’s Responsibilities for the Audit of the Consolidated Financial StatementsOur objectives are to obtain reasonable assurance about whether the consolidated financial statements as a whole are free from materialmisstatement, whether due to fraud or error, and to issue an auditor’s report that includes our opinion. Reasonable assurance is a highlevel of assurance, but is not a guarantee that an audit conducted in accordance with Canadian generally accepted auditing standards willalways detect a material misstatement when it exists. Misstatements can arise from fraud or error and are considered material if,individually or in the aggregate, they could reasonably be expected to influence the economic decisions of users taken on the basis ofthese consolidated financial statements.
As part of an audit in accordance with Canadian generally accepted auditing standards, we exercise professional judgment and maintainprofessional skepticism throughout the audit. We also:
• Identify and assess the risks of material misstatement of the consolidated financial statements, whether due to fraud or error, designand perform audit procedures responsive to those risks, and obtain audit evidence that is sufficient and appropriate to provide a basisfor our opinion. The risk of not detecting a material misstatement resulting from fraud is higher than for one resulting from error, asfraud may involve collusion, forgery, intentional omissions, misrepresentations, or the override of internal control.
• Obtain an understanding of internal control relevant to the audit in order to design audit procedures that are appropriate in thecircumstances, but not for the purpose of expressing an opinion on the effectiveness of the Company’s internal control.
• Evaluate the appropriateness of accounting policies used and the reasonableness of accounting estimates and related disclosuresmade by management.
• Conclude on the appropriateness of management’s use of the going concern basis of accounting and, based on the audit evidenceobtained, whether a material uncertainty exists related to events or conditions that may cast significant doubt on the Company’s abilityto continue as a going concern. If we conclude that a material uncertainty exists, we are required to draw attention in our auditor’sreport to the related disclosures in the consolidated financial statements or, if such disclosures are inadequate, to modify our opinion.Our conclusions are based on the audit evidence obtained up to the date of our auditor’s report. However, future events or conditionsmay cause the Company to cease to continue as a going concern.
• Evaluate the overall presentation, structure and content of the consolidated financial statements, including the disclosures, and whetherthe consolidated financial statements represent the underlying transactions and events in a manner that achieves fair presentation.
• Obtain sufficient appropriate audit evidence regarding the financial information of the entities or business activities within the Companyto express an opinion on the consolidated financial statements. We are responsible for the direction, supervision and performance ofthe group audit. We remain solely responsible for our audit opinion.
We communicate with those charged with governance regarding, among other matters, the planned scope and timing of the audit andsignificant audit findings, including any significant deficiencies in internal control that we identify during our audit.
We also provide those charged with governance with a statement that we have complied with relevant ethical requirements regardingindependence, and to communicate with them all relationships and other matters that may reasonably be thought to bear on ourindependence, and where applicable, related safeguards.
From the matters communicated with those charged with governance, we determine those matters that were of most significance in theaudit of the consolidated financial statements of the current period and are therefore the key audit matters. We describe these matters inour report of independent registered public accounting firm unless law or regulation precludes public disclosure about the matter or when,in extremely rare circumstances, we determine that a matter should not be communicated in our report because the adverseconsequences of doing so would reasonably be expected to outweigh the public interest benefits of such communication.
The engagement partner on the audit resulting in this report of independent registered public accounting firm is Sean Musselman.
Chartered Professional AccountantsLicensed Public Accountants
Toronto, Canada
February 10, 2021
106 | 2020 Annual Report | Consolidated Financial Statements
Report of Independent Registered Public Accounting Firm
To the Shareholders and Board of Directors of Manulife Financial Corporation
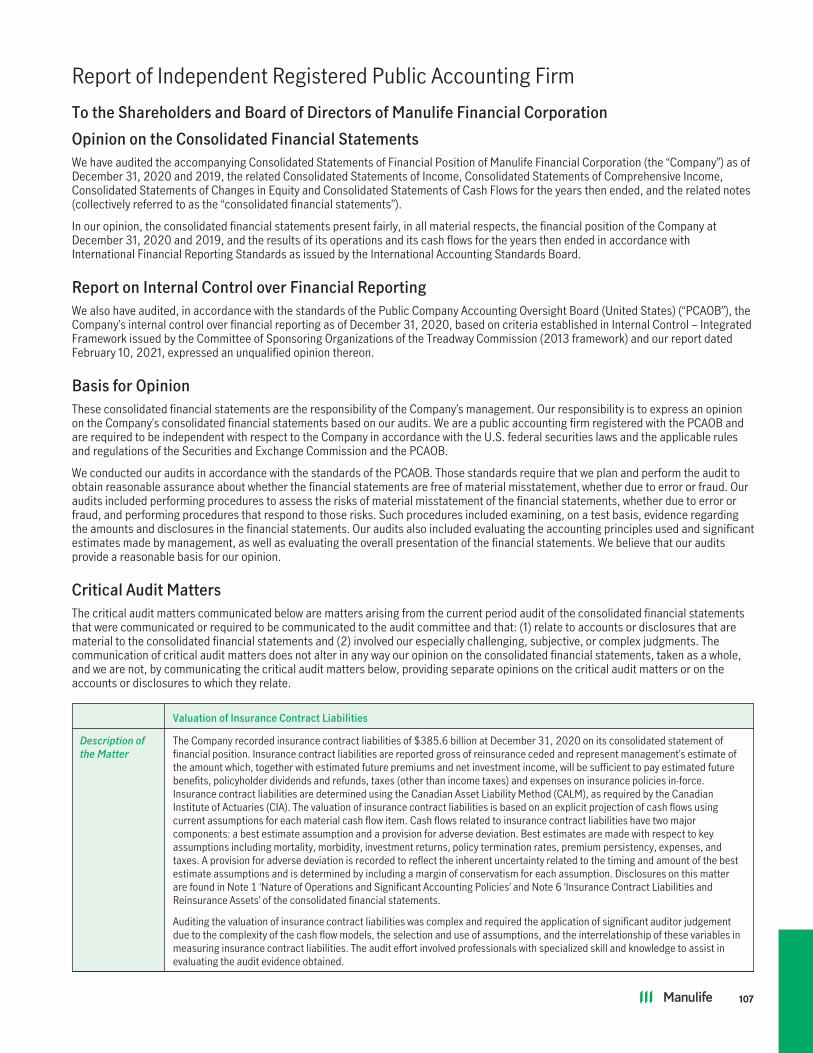
Opinion on the Consolidated Financial StatementsWe have audited the accompanying Consolidated Statements of Financial Position of Manulife Financial Corporation (the “Company”) as ofDecember 31, 2020 and 2019, the related Consolidated Statements of Income, Consolidated Statements of Comprehensive Income,Consolidated Statements of Changes in Equity and Consolidated Statements of Cash Flows for the years then ended, and the related notes(collectively referred to as the “consolidated financial statements”).
In our opinion, the consolidated financial statements present fairly, in all material respects, the financial position of the Company atDecember 31, 2020 and 2019, and the results of its operations and its cash flows for the years then ended in accordance withInternational Financial Reporting Standards as issued by the International Accounting Standards Board.
Report on Internal Control over Financial ReportingWe also have audited, in accordance with the standards of the Public Company Accounting Oversight Board (United States) (“PCAOB”), theCompany’s internal control over financial reporting as of December 31, 2020, based on criteria established in Internal Control – IntegratedFramework issued by the Committee of Sponsoring Organizations of the Treadway Commission (2013 framework) and our report datedFebruary 10, 2021, expressed an unqualified opinion thereon.
Basis for OpinionThese consolidated financial statements are the responsibility of the Company’s management. Our responsibility is to express an opinionon the Company’s consolidated financial statements based on our audits. We are a public accounting firm registered with the PCAOB andare required to be independent with respect to the Company in accordance with the U.S. federal securities laws and the applicable rulesand regulations of the Securities and Exchange Commission and the PCAOB.
We conducted our audits in accordance with the standards of the PCAOB. Those standards require that we plan and perform the audit toobtain reasonable assurance about whether the financial statements are free of material misstatement, whether due to error or fraud. Ouraudits included performing procedures to assess the risks of material misstatement of the financial statements, whether due to error orfraud, and performing procedures that respond to those risks. Such procedures included examining, on a test basis, evidence regardingthe amounts and disclosures in the financial statements. Our audits also included evaluating the accounting principles used and significantestimates made by management, as well as evaluating the overall presentation of the financial statements. We believe that our auditsprovide a reasonable basis for our opinion.
Critical Audit MattersThe critical audit matters communicated below are matters arising from the current period audit of the consolidated financial statementsthat were communicated or required to be communicated to the audit committee and that: (1) relate to accounts or disclosures that arematerial to the consolidated financial statements and (2) involved our especially challenging, subjective, or complex judgments. Thecommunication of critical audit matters does not alter in any way our opinion on the consolidated financial statements, taken as a whole,and we are not, by communicating the critical audit matters below, providing separate opinions on the critical audit matters or on theaccounts or disclosures to which they relate.
Valuation of Insurance Contract Liabilities
Description ofthe Matter
The Company recorded insurance contract liabilities of $385.6 billion at December 31, 2020 on its consolidated statement offinancial position. Insurance contract liabilities are reported gross of reinsurance ceded and represent management’s estimate ofthe amount which, together with estimated future premiums and net investment income, will be sufficient to pay estimated futurebenefits, policyholder dividends and refunds, taxes (other than income taxes) and expenses on insurance policies in-force.Insurance contract liabilities are determined using the Canadian Asset Liability Method (CALM), as required by the CanadianInstitute of Actuaries (CIA). The valuation of insurance contract liabilities is based on an explicit projection of cash flows usingcurrent assumptions for each material cash flow item. Cash flows related to insurance contract liabilities have two majorcomponents: a best estimate assumption and a provision for adverse deviation. Best estimates are made with respect to keyassumptions including mortality, morbidity, investment returns, policy termination rates, premium persistency, expenses, andtaxes. A provision for adverse deviation is recorded to reflect the inherent uncertainty related to the timing and amount of the bestestimate assumptions and is determined by including a margin of conservatism for each assumption. Disclosures on this matterare found in Note 1 ‘Nature of Operations and Significant Accounting Policies’ and Note 6 ‘Insurance Contract Liabilities andReinsurance Assets’ of the consolidated financial statements.
Auditing the valuation of insurance contract liabilities was complex and required the application of significant auditor judgementdue to the complexity of the cash flow models, the selection and use of assumptions, and the interrelationship of these variables inmeasuring insurance contract liabilities. The audit effort involved professionals with specialized skill and knowledge to assist inevaluating the audit evidence obtained.
107

Valuation of Insurance Contract Liabilities
How WeAddressed theMatter in OurAudit
We obtained an understanding, evaluated the design, and tested the operating effectiveness of management’s controls over thevaluation of insurance contract liabilities. The controls we tested related to, among other areas, actuarial methodology, integrity ofdata used, controls over relevant information technology, and the assumption setting and implementation processes used bymanagement.
To test the valuation of insurance contract liabilities, our audit procedures included, among other procedures, involving ouractuarial specialists to assess the methodology and assumptions with respect to compliance with the Company’s policies. Weperformed audit procedures over key assumptions, including the implementation of those assumptions into the models. Theseprocedures included testing underlying support and documentation, including reviewing a sample of experience studies supportingspecific assumptions, challenging the nature, timing, and completeness of changes recorded, assessing whether individualchanges were errors or refinements of estimates, and comparing the level of margins for adverse deviation to suggested rangesestablished by the CIA. We also performed independent recalculation procedures on a sample of insurance policies to evaluatemanagement’s recorded reserves. In addition, we assessed the adequacy of the disclosures provided in the notes to theconsolidated financial statements.
Valuation of Invested Assets with Significant Non-Observable Market Inputs
Description ofthe Matter
The Company recorded invested assets of $17.5 billion at December 31, 2020 on its consolidated statement of financial positionwhich are both (a) measured at fair value and (b) subject to a valuation estimate that includes significant non-observable marketinputs. These invested assets are classified as level 3 within the Company’s hierarchy of fair value measurements and include realestate, timber and agriculture, high estimation uncertainty bonds, and private equities which are valued using internal models.There is increased measurement uncertainty associated with these invested assets due to market disruption associated withCOVID-19. These assets are valued based on internal models or third-party pricing sources that incorporate assumptions with ahigh-level of subjectivity. Examples of such assumptions include interest rates, yield curves, credit ratings and related spreads,expected future cash flows and transaction prices of comparable assets. Disclosures on this matter are found in Note 1 ‘Nature ofOperations and Significant Accounting Policies’ and Note 3 ‘Invested Assets and Investment Income’ of the consolidated financialstatements.
Auditing the valuation of these invested assets was complex and required the application of significant auditor judgment inassessing the valuation methodologies and non-observable inputs used. The valuation of these assets is sensitive to the significantnon-observable market inputs described above, which are inherently forward-looking and could be affected by future economic andmarket conditions. The audit effort involved professionals with specialized skill and knowledge to assist in evaluating the auditevidence obtained.
How WeAddressed theMatter in OurAudit
We obtained an understanding, evaluated the design, and tested the operating effectiveness of management’s controls over theinvestment valuation process. The controls we tested related to, among other areas, management’s determination and approval ofassumptions and methodologies used in model-based valuations and management’s review of valuations provided by third-partypricing sources.
To test the valuation of these invested assets, our audit procedures included, among other procedures, involving our valuationspecialists to assess the methodologies and significant assumptions used by management. These procedures included assessingthe valuation methodologies used with respect to the Company’s policies, valuation guidelines, and industry practice andcomparing a sample of valuation assumptions used against benchmarks, including comparable transactions and independentpricing sources where available. We also performed independent investment valuations on a sample of investments with highestimation uncertainty to evaluate management’s recorded values. In addition, we assessed the adequacy of the disclosuresprovided in the notes to the consolidated financial statements.
Chartered Professional AccountantsLicensed Public Accountants
We have served as Manulife Financial Corporation’s auditors since 1905.
Toronto, Canada
February 10, 2021
108 | 2020 Annual Report | Consolidated Financial Statements
Report of Independent Registered Public Accounting Firm
To the Shareholders and Board of Directors of Manulife Financial Corporation
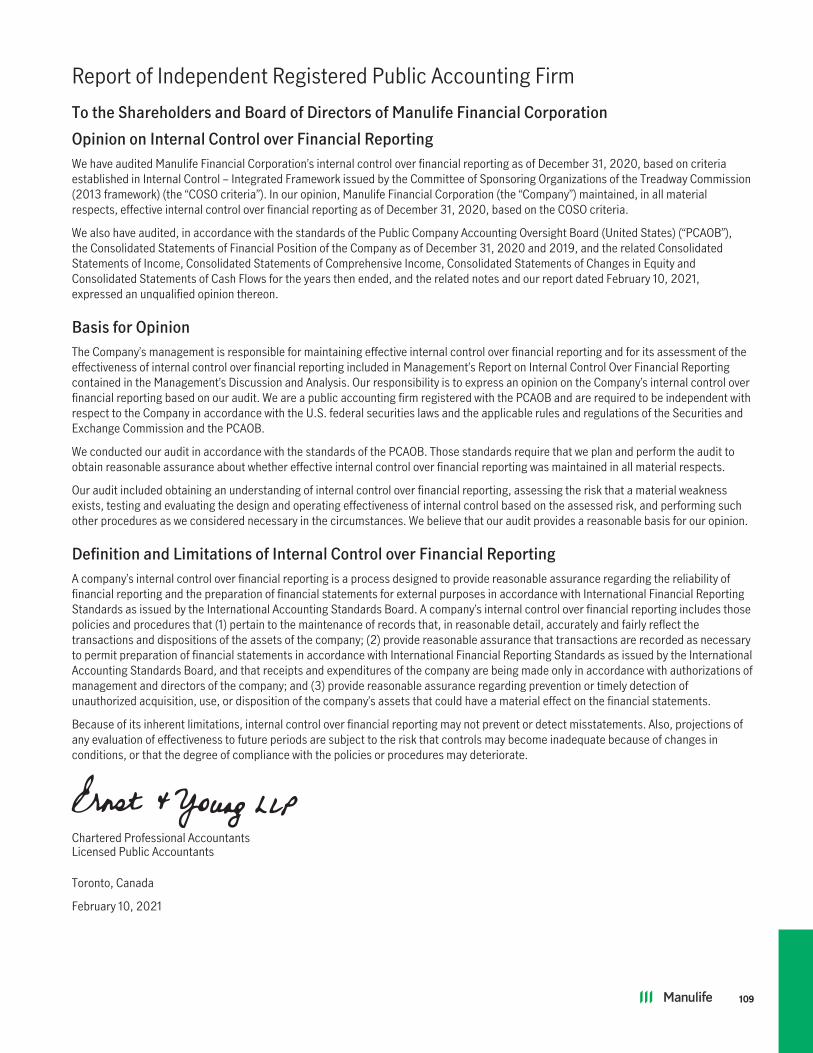
Opinion on Internal Control over Financial ReportingWe have audited Manulife Financial Corporation’s internal control over financial reporting as of December 31, 2020, based on criteriaestablished in Internal Control – Integrated Framework issued by the Committee of Sponsoring Organizations of the Treadway Commission(2013 framework) (the “COSO criteria”). In our opinion, Manulife Financial Corporation (the “Company”) maintained, in all materialrespects, effective internal control over financial reporting as of December 31, 2020, based on the COSO criteria.
We also have audited, in accordance with the standards of the Public Company Accounting Oversight Board (United States) (“PCAOB”),the Consolidated Statements of Financial Position of the Company as of December 31, 2020 and 2019, and the related ConsolidatedStatements of Income, Consolidated Statements of Comprehensive Income, Consolidated Statements of Changes in Equity andConsolidated Statements of Cash Flows for the years then ended, and the related notes and our report dated February 10, 2021,expressed an unqualified opinion thereon.
Basis for OpinionThe Company’s management is responsible for maintaining effective internal control over financial reporting and for its assessment of theeffectiveness of internal control over financial reporting included in Management’s Report on Internal Control Over Financial Reportingcontained in the Management’s Discussion and Analysis. Our responsibility is to express an opinion on the Company’s internal control overfinancial reporting based on our audit. We are a public accounting firm registered with the PCAOB and are required to be independent withrespect to the Company in accordance with the U.S. federal securities laws and the applicable rules and regulations of the Securities andExchange Commission and the PCAOB.
We conducted our audit in accordance with the standards of the PCAOB. Those standards require that we plan and perform the audit toobtain reasonable assurance about whether effective internal control over financial reporting was maintained in all material respects.
Our audit included obtaining an understanding of internal control over financial reporting, assessing the risk that a material weaknessexists, testing and evaluating the design and operating effectiveness of internal control based on the assessed risk, and performing suchother procedures as we considered necessary in the circumstances. We believe that our audit provides a reasonable basis for our opinion.
Definition and Limitations of Internal Control over Financial ReportingA company’s internal control over financial reporting is a process designed to provide reasonable assurance regarding the reliability offinancial reporting and the preparation of financial statements for external purposes in accordance with International Financial ReportingStandards as issued by the International Accounting Standards Board. A company’s internal control over financial reporting includes thosepolicies and procedures that (1) pertain to the maintenance of records that, in reasonable detail, accurately and fairly reflect thetransactions and dispositions of the assets of the company; (2) provide reasonable assurance that transactions are recorded as necessaryto permit preparation of financial statements in accordance with International Financial Reporting Standards as issued by the InternationalAccounting Standards Board, and that receipts and expenditures of the company are being made only in accordance with authorizations ofmanagement and directors of the company; and (3) provide reasonable assurance regarding prevention or timely detection ofunauthorized acquisition, use, or disposition of the company’s assets that could have a material effect on the financial statements.
Because of its inherent limitations, internal control over financial reporting may not prevent or detect misstatements. Also, projections ofany evaluation of effectiveness to future periods are subject to the risk that controls may become inadequate because of changes inconditions, or that the degree of compliance with the policies or procedures may deteriorate.
Chartered Professional AccountantsLicensed Public Accountants
Toronto, Canada
February 10, 2021
109

Consolidated Statements of Financial PositionAs at December 31,(Canadian $ in millions) 2020 2019
AssetsCash and short-term securities $ 26,167 $ 20,300Debt securities 218,724 198,122Public equities 23,722 22,851Mortgages 50,207 49,376Private placements 40,756 37,979Policy loans 6,398 6,471Loans to bank clients 1,976 1,740Real estate 12,832 12,928Other invested assets 30,195 28,760Total invested assets (note 3) 410,977 378,527Other assetsAccrued investment income 2,523 2,416Outstanding premiums 1,444 1,385Derivatives (note 4) 27,793 19,449Reinsurance assets (notes 6 and 7) 45,836 41,446Deferred tax assets (note 16) 4,842 4,574Goodwill and intangible assets (note 5) 9,929 9,975Miscellaneous 9,569 8,250Total other assets 101,936 87,495Segregated funds net assets (note 22) 367,436 343,108Total assets $ 880,349 $ 809,130Liabilities and EquityLiabilitiesInsurance contract liabilities (note 6) $ 385,554 $ 351,161Investment contract liabilities (note 7) 3,288 3,104Deposits from bank clients 20,889 21,488Derivatives (note 4) 14,962 10,284Deferred tax liabilities (note 16) 2,614 1,972Other liabilities 18,607 16,244
445,914 404,253Long-term debt (note 9) 6,164 4,543Capital instruments (note 10) 7,829 7,120Segregated funds net liabilities (note 22) 367,436 343,108Total liabilities 827,343 759,024EquityPreferred shares (note 11) 3,822 3,822Common shares (note 11) 23,042 23,127Contributed surplus 261 254Shareholders’ retained earnings 18,887 15,488Shareholders’ accumulated other comprehensive income (loss):
Pension and other post-employment plans (313) (350)Available-for-sale securities 1,838 1,511Cash flow hedges (229) (143)Real estate revaluation reserve 34 31Translation of foreign operations 4,993 5,398
Total shareholders’ equity 52,335 49,138Participating policyholders’ equity (784) (243)Non-controlling interests 1,455 1,211Total equity 53,006 50,106Total liabilities and equity $ 880,349 $ 809,130
The accompanying notes are an integral part of these Consolidated Financial Statements.
Roy GoriPresident and Chief Executive Officer
John CassadayChairman of the Board of Directors
110 | 2020 Annual Report | Consolidated Financial Statements

Consolidated Statements of IncomeFor the years ended December 31,(Canadian $ in millions except per share amounts) 2020 2019
RevenuePremium income
Gross premiums $ 41,408 $ 41,059Premiums ceded to reinsurers (8,491) (5,481)
Net premiums 32,917 35,578Investment income (note 3)
Investment income 16,433 15,393Realized and unrealized gains (losses) on assets supporting insurance and investment contract liabilities and on the
macro hedge program 18,967 18,200Net investment income 35,400 33,593Other revenue (note 13) 10,591 10,399Total revenue 78,908 79,570Contract benefits and expensesTo contract holders and beneficiaries
Gross claims and benefits (note 6) 30,133 28,660Increase (decrease) in insurance contract liabilities (note 6) 36,982 33,727Increase (decrease) in investment contract liabilities (note 7) 178 170Benefits and expenses ceded to reinsurers (6,795) (5,373)(Increase) decrease in reinsurance assets (note 6) (5,263) (1,269)
Net benefits and claims 55,235 55,915General expenses 7,510 7,686Investment expenses (note 3) 1,787 1,748Commissions 6,043 6,293Interest expense 1,181 1,319Net premium taxes 381 389Total contract benefits and expenses 72,137 73,350Income before income taxes 6,771 6,220Income tax expense (note 16) (1,195) (718)Net income $ 5,576 $ 5,502Net income (loss) attributed to:
Non-controlling interests $ 250 $ 233Participating policyholders (545) (333)Shareholders 5,871 5,602
$ 5,576 $ 5,502Net income attributed to shareholders 5,871 5,602Preferred share dividends (171) (172)Common shareholders’ net income $ 5,700 $ 5,430Earnings per sharea
Basic earnings per common share (note 11) $ 2.94 $ 2.77Diluted earnings per common share (note 11) 2.93 2.77
Dividends per common share 1.12 1.00
The accompanying notes are an integral part of these Consolidated Financial Statements.
111

Consolidated Statements of Comprehensive IncomeFor the years ended December 31,(Canadian $ in millions) 2020 2019
Net income $ 5,576 $ 5,502Other comprehensive income (loss) (“OCI”), net of tax:Items that may be subsequently reclassified to net income:Foreign exchange gains (losses) on:
Translation of foreign operations (505) (1,933)Net investment hedges 100 320
Available-for-sale financial securities:Unrealized gains (losses) arising during the year 2,506 2,212Reclassification of net realized (gains) losses and impairments to net income (2,175) (433)
Cash flow hedges:Unrealized gains (losses) arising during the year (81) (28)Reclassification of realized losses to net income (5) 12
Share of other comprehensive income (losses) of associates 2 1Total items that may be subsequently reclassified to net income (158) 151Items that will not be reclassified to net income:
Change in pension and other post-employment plans 37 76Real estate revaluation reserve 5 11
Total items that will not be reclassified to net income 42 87Other comprehensive income (loss), net of tax (116) 238Total comprehensive income (loss), net of tax $ 5,460 $ 5,740Total comprehensive income (loss) attributed to:
Non-controlling interests $ 254 $ 237Participating policyholders (541) (334)Shareholders 5,747 5,837
Income Taxes included in Other Comprehensive IncomeFor the years ended December 31,(Canadian $ in millions) 2020 2019
Income tax expense (recovery) on:Unrealized gains/losses on available-for-sale financial securities $ 574 $ 558Reclassification of realized gains/losses and recoveries/impairments to net income on available-for-sale financial securities (576) (140)Unrealized gains/losses on cash flow hedges (19) (20)Reclassification of realized gains/losses to net income on cash flow hedges (2) 4Unrealized foreign exchange gains/losses on translation of foreign operations – (1)Unrealized foreign exchange gains/losses on net investment hedges 8 39Change in pension and other post-employment plans 9 18Real estate revaluation reserve 2 –Share of other comprehensive income (loss) of associates (1) –Total income tax expense (recovery) $ (5) $ 458
The accompanying notes are an integral part of these Consolidated Financial Statements.
112 | 2020 Annual Report | Consolidated Financial Statements

Consolidated Statements of Changes in EquityFor the years ended December 31,(Canadian $ in millions) 2020 2019
Preferred sharesBalance, beginning of year $ 3,822 $ 3,822Balance, end of year 3,822 3,822Common sharesBalance, beginning of year 23,127 22,961Repurchased (note 11) (121) (677)Issued on exercise of stock options and deferred share units 36 104Issued under dividend reinvestment and share purchase plans – 739Balance, end of year 23,042 23,127Contributed surplusBalance, beginning of year 254 265Exercise of stock options and deferred share units (7) (20)Stock option expense 14 11Impact of deferred tax asset rate change – (2)Balance, end of year 261 254Shareholders’ retained earningsBalance, beginning of year 15,488 12,704Opening adjustment at adoption of IFRS 16 – (19)Net income attributed to shareholders 5,871 5,602Common shares repurchased (note 11) (132) (662)Preferred share dividends (171) (172)Common share dividends (2,169) (1,965)Balance, end of year 18,887 15,488Shareholders’ accumulated other comprehensive income (loss) (“AOCI”)Balance, beginning of year 6,447 6,212Change in unrealized foreign exchange gains (losses) of net foreign operations (405) (1,612)Change in actuarial gains (losses) on pension and other post-employment plans 37 76Change in unrealized gains (losses) on available-for-sale financial securities 325 1,775Change in unrealized gains (losses) on derivative instruments designated as cash flow hedges (86) (16)Change in real estate revaluation reserve 3 11Share of other comprehensive income (losses) of associates 2 1Balance, end of year 6,323 6,447Total shareholders’ equity, end of year 52,335 49,138Participating policyholders’ equityBalance, beginning of year (243) 94Opening adjustment at adoption of IFRS 16 – (3)Net income (loss) attributed to participating policyholders (545) (333)Other comprehensive income attributed to policyholders 4 (1)Balance, end of year (784) (243)Non-controlling interestsBalance, beginning of year 1,211 1,093Net income attributed to non-controlling interests 250 233Other comprehensive income (loss) attributed to non-controlling interests 4 4Contributions (distributions/disposal), net (10) (119)Balance, end of year 1,455 1,211Total equity, end of year $ 53,006 $ 50,106
The accompanying notes are an integral part of these Consolidated Financial Statements.
113
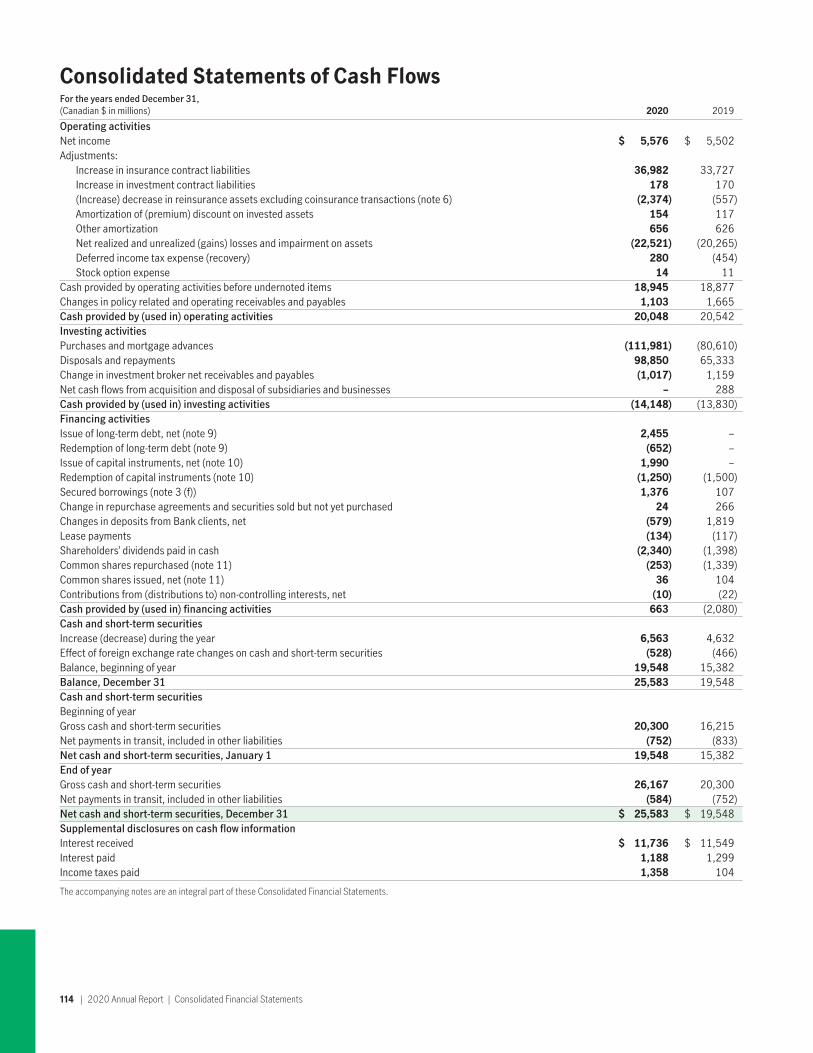
Consolidated Statements of Cash FlowsFor the years ended December 31,(Canadian $ in millions) 2020 2019
Operating activitiesNet income $ 5,576 $ 5,502Adjustments:
Increase in insurance contract liabilities 36,982 33,727Increase in investment contract liabilities 178 170(Increase) decrease in reinsurance assets excluding coinsurance transactions (note 6) (2,374) (557)Amortization of (premium) discount on invested assets 154 117Other amortization 656 626Net realized and unrealized (gains) losses and impairment on assets (22,521) (20,265)Deferred income tax expense (recovery) 280 (454)Stock option expense 14 11
Cash provided by operating activities before undernoted items 18,945 18,877Changes in policy related and operating receivables and payables 1,103 1,665Cash provided by (used in) operating activities 20,048 20,542Investing activitiesPurchases and mortgage advances (111,981) (80,610)Disposals and repayments 98,850 65,333Change in investment broker net receivables and payables (1,017) 1,159Net cash flows from acquisition and disposal of subsidiaries and businesses – 288Cash provided by (used in) investing activities (14,148) (13,830)Financing activitiesIssue of long-term debt, net (note 9) 2,455 –Redemption of long-term debt (note 9) (652) –Issue of capital instruments, net (note 10) 1,990 –Redemption of capital instruments (note 10) (1,250) (1,500)Secured borrowings (note 3 (f)) 1,376 107Change in repurchase agreements and securities sold but not yet purchased 24 266Changes in deposits from Bank clients, net (579) 1,819Lease payments (134) (117)Shareholders’ dividends paid in cash (2,340) (1,398)Common shares repurchased (note 11) (253) (1,339)Common shares issued, net (note 11) 36 104Contributions from (distributions to) non-controlling interests, net (10) (22)Cash provided by (used in) financing activities 663 (2,080)Cash and short-term securitiesIncrease (decrease) during the year 6,563 4,632Effect of foreign exchange rate changes on cash and short-term securities (528) (466)Balance, beginning of year 19,548 15,382Balance, December 31 25,583 19,548Cash and short-term securitiesBeginning of yearGross cash and short-term securities 20,300 16,215Net payments in transit, included in other liabilities (752) (833)Net cash and short-term securities, January 1 19,548 15,382End of yearGross cash and short-term securities 26,167 20,300Net payments in transit, included in other liabilities (584) (752)Net cash and short-term securities, December 31 $ 25,583 $ 19,548Supplemental disclosures on cash flow informationInterest received $ 11,736 $ 11,549Interest paid 1,188 1,299Income taxes paid 1,358 104
The accompanying notes are an integral part of these Consolidated Financial Statements.
114 | 2020 Annual Report | Consolidated Financial Statements

Notes to Consolidated Financial StatementsPage Number Note
116 Note 1 Nature of Operations and Significant Accounting Policies124 Note 2 Accounting and Reporting Changes125 Note 3 Invested Assets and Investment Income133 Note 4 Derivative and Hedging Instruments139 Note 5 Goodwill and Intangible Assets141 Note 6 Insurance Contract Liabilities and Reinsurance Assets150 Note 7 Investment Contract Liabilities151 Note 8 Risk Management158 Note 9 Long-Term Debt159 Note 10 Capital Instruments160 Note 11 Share Capital and Earnings Per Share162 Note 12 Capital Management162 Note 13 Revenue from Service Contracts163 Note 14 Stock-Based Compensation165 Note 15 Employee Future Benefits169 Note 16 Income Taxes171 Note 17 Interests in Structured Entities173 Note 18 Commitments and Contingencies175 Note 19 Segmented Information177 Note 20 Related Parties177 Note 21 Subsidiaries179 Note 22 Segregated Funds180 Note 23 Information Provided in Connection with Investments in Deferred Annuity Contracts and SignatureNotes Issued or
Assumed by John Hancock Life Insurance Company (U.S.A.)186 Note 24 Comparatives
115

Notes to Consolidated Financial Statements(Canadian $ in millions except per share amounts or unless otherwise stated)
Note 1 Nature of Operations and Significant Accounting Policies(a) Reporting entityManulife Financial Corporation (“MFC”) is a publicly traded company and the holding company of The Manufacturers Life InsuranceCompany (“MLI”), a Canadian life insurance company. MFC and its subsidiaries (collectively, “Manulife” or the “Company”) is a leadingfinancial services group with principal operations in Asia, Canada and the United States. Manulife’s international network of employees,agents and distribution partners offers financial protection and wealth management products and services to personal and businessclients as well as asset management services to institutional customers. The Company operates as Manulife in Canada and Asia and asJohn Hancock in the United States.
MFC is domiciled in Canada and incorporated under the Insurance Companies Act (Canada) (“ICA”). These Consolidated FinancialStatements have been prepared in accordance with International Financial Reporting Standards (“IFRS”) as issued by the InternationalAccounting Standards Board (“IASB”).
These Consolidated Financial Statements should be read in conjunction with “Risk Management” in the 2020 Management’s Discussionand Analysis (“MD&A”) dealing with IFRS 7 “Financial Instruments: Disclosures” as the discussion on market risk and liquidity risk includescertain disclosures that are considered an integral part of these Consolidated Financial Statements.
These Consolidated Financial Statements as at and for the year ended December 31, 2020 were authorized for issue by MFC’s Board ofDirectors on February 10, 2021.
(b) Basis of preparationThe preparation of Consolidated Financial Statements in conformity with IFRS requires management to make judgments, estimates andassumptions that affect the application of accounting policies and the reported amounts of assets and liabilities, and the disclosure ofcontingent assets and liabilities as at the date of the Consolidated Financial Statements, and the reported amounts of revenue andexpenses during the reporting periods. Actual results may differ from these estimates. The most significant estimation processes relate toevaluating assumptions used in measuring insurance and investment contract liabilities, assessing assets for impairment, determiningpension and other post-employment benefit obligation and expense assumptions, determining income taxes and uncertain tax positions,and estimating fair values of certain invested assets. Estimates and underlying assumptions are reviewed on an ongoing basis. Revisions toaccounting estimates are recognized in the year in which the estimates are revised and in any future years affected. Although somevariability is inherent in these estimates, management believes that the amounts recorded are appropriate. The significant accountingpolicies used and the most significant judgments made by management in applying these accounting policies in the preparation of theseConsolidated Financial Statements are summarized below.
The Company’s results and operations have been and may continue to be adversely impacted by the COVID -19 pandemic and the recenteconomic downturn. The adverse effects include but are not limited to significant volatility in equity markets, decline in interest rates,increase in credit risk, strain on commodity markets and alternative long duration asset prices, foreign currency exchange rate volatility,increases in insurance claims, persistency and redemptions, and disruption of business operations. The breadth and depth of these eventsand their duration contribute additional uncertainty around estimates used in determining the carrying value of certain assets andliabilities included in these Consolidated Financial Statements.
The uncertainty regarding key inputs used in establishing the carrying amounts of certain invested assets are outlined in the notes to theseConsolidated Financial Statements. The Company has applied appropriate measurement techniques using reasonable judgment andestimates from the perspective of a market participant to reflect current economic conditions. The impact of these techniques has beenreflected in these Financial Statements. Changes in the inputs used could materially impact the respective carrying values.
(c) Fair valuemeasurementFair value is defined as the price that would be received to sell an asset or paid to transfer a liability in an orderly transaction (not a forcedliquidation or distress sale) between market participants at the measurement date; fair value is an exit value.
When available, quoted market prices are used to determine fair value. If quoted market prices are not available, fair value is typicallybased upon alternative valuation techniques such as discounted cash flows, matrix pricing, consensus pricing services and othertechniques. Broker quotes are generally used when external public vendor prices are not available.
The Company has a valuation process in place that includes a review of price movements relative to the market, a comparison of pricesbetween vendors, and a comparison to internal matrix pricing which uses predominately external observable data. Judgment is applied inadjusting external observable data for items including liquidity and credit factors.
116 | 2020 Annual Report | Notes to Consolidated Financial Statements

The Company categorizes its fair value measurement results according to a three-level hierarchy. The hierarchy prioritizes the inputs usedby the Company’s valuation techniques based on their reliability. A level is assigned to each fair value measurement based on the lowestlevel input significant to the fair value measurement in its entirety. The three levels of the fair value hierarchy are defined as follows:
Level 1 – Fair value measurements that reflect unadjusted, quoted prices in active markets for identical assets and liabilities that theCompany can access at the measurement date, reflecting market transactions.
Level 2 – Fair value measurements using inputs other than quoted prices included within Level 1 that are observable for the asset orliability, either directly or indirectly. These include quoted prices for similar assets and liabilities in active markets, quoted prices foridentical or similar assets and liabilities in inactive markets, inputs that are observable that are not prices (such as interest rates, creditrisks, etc.) and inputs that are derived from or corroborated by observable market data. Most debt securities are classified within Level 2.Also, included in the Level 2 category are derivative instruments that are priced using models with observable market inputs, includinginterest rate swaps, equity swaps, credit default swaps and foreign currency forward contracts.
Level 3 – Fair value measurements using significant non-market observable inputs. These include valuations for assets and liabilities thatare derived using data, some or all of which is not market observable, including assumptions about risk. Level 3 security valuations includeless liquid securities such as real estate investment property, other invested assets, timber investments held within segregated funds,certain long-duration bonds and other securities that have little or no price transparency. Certain derivative financial instrument valuationsare also included in Level 3.
(d) Basis of consolidationMFC consolidates the financial statements of all entities it controls, including certain structured entities. Subsidiaries are entitiescontrolled by the Company. The Company has control over an entity when the Company has the power to govern the financial andoperating policies of the entity, and is exposed to variable returns from its activities which are significant in relation to the total variablereturns of the entity and the Company is able to use its power over the entity to affect its share of variable returns. In assessing control,significant judgment is applied while considering all relevant facts and circumstances. When assessing decision-making power, theCompany considers the extent of its rights relative to the management of an entity, the level of voting rights held in an entity which arepotentially or presently exercisable, the existence of any contractual management agreements which may provide the Company with powerover an entity’s financial and operating policies, and to the extent of other parties’ ownership in an entity, if any, the possibility for de factocontrol being present. When assessing variable returns, the Company considers the significance of direct and indirect financial andnon-financial variable returns to the Company from an entity’s activities in addition to the proportionate significance of such returns. TheCompany also considers the degree to which its interests are aligned with those of other parties investing in an entity and the degree towhich it may act in its own interest.
The financial statements of subsidiaries are included in MFC’s consolidated results from the date control is established and are excludedfrom consolidation from the date control ceases. The initial control assessment is performed at inception of the Company’s involvementwith the entity and is reconsidered if the Company acquires or loses power over key operating and financial policies of the entity; acquiresadditional interests or disposes of interests in the entity; the contractual arrangements of the entity are amended such that the Company’sproportionate exposure to variable returns changes; or if the Company’s ability to use its power to affect its variable returns from the entitychanges.
The Company’s Consolidated Financial Statements have been prepared using uniform accounting policies for like transactions and eventsin similar circumstances. Intercompany balances, and income and expenses arising from intercompany transactions, have beeneliminated in preparing the Consolidated Financial Statements.
Non-controlling interests are interests of other parties in the equity of MFC’s subsidiaries and are presented within total equity, separatefrom the equity of MFC’s participating policyholders and shareholders. Non-controlling interests in the net income and othercomprehensive income (“OCI”) of MFC’s subsidiaries are included in total net income and total OCI, respectively. An exception to thisoccurs where the subsidiary’s shares are either puttable by the shareholder or required to be redeemed for cash on a fixed or determinabledate, in which case other parties’ interests in the subsidiary’s capital are presented as liabilities of the Company and other parties’ interestsin the subsidiary’s net income and OCI are recorded as expenses of the Company.
The equity method of accounting is used to account for entities over which the Company has significant influence or joint control(“associates” or “joint ventures”), whereby the Company records its share of the associate’s or joint venture’s net assets and financialresults using uniform accounting policies for similar transactions and events. Significant judgment is used to determine whether votingrights, contractual management rights and other relationships with the entity, if any, provide the Company with significant influence orjoint control over the entity. Gains and losses on the sale of associates or joint ventures are included in income when realized, whileimpairment losses are recognized immediately when there is objective evidence of impairment. Gains and losses on commercialtransactions with associates or joint ventures are eliminated to the extent of the Company’s interest in the associate or joint venture.Investments in associates or joint ventures are included in other invested assets on the Company’s Consolidated Statements of FinancialPosition.
117

(e) Invested assetsInvested assets that are considered financial instruments are classified as fair value through profit or loss (“FVTPL”), loans and receivables,or as available-for-sale (“AFS”) financial assets. The Company determines the classification of its financial assets at initial recognition.Invested assets are recognized initially at fair value plus, in the case of investments not at FVTPL, directly attributable transaction costs.Invested assets are classified as financial instruments at FVTPL if they are held for trading, if they are designated by management underthe fair value option, or if they are designated by management when they include one or more embedded derivatives. Invested assetsclassified as AFS are non-derivative financial assets that do not fall into any of the other categories described above.
Valuation methods for the Company’s invested assets are described above. All fair value valuations are performed in accordance with IFRS13 “Fair Value Measurement”. Disclosure of financial instruments carried at fair value within the three levels of the fair value hierarchy anddisclosure of the fair value for financial instruments not carried at fair value on the Consolidated Statements of Financial Position arepresented in note 3. Fair value valuations are performed by the Company and by third-party service providers. When third-party serviceproviders are engaged, the Company performs a variety of procedures to corroborate pricing information. These procedures may include,but are not limited to, inquiry and review of valuation techniques, inputs to the valuation and vendor controls reports.
Cash and short-term securities comprise of cash, current operating accounts, overnight bank and term deposits, and fixed incomesecurities held for meeting short-term cash commitments. Short-term securities are carried at fair value. Short-term securities arecomprised of investments due to mature within one year of the date of purchase. Commercial paper and discount notes are classified asLevel 2 because these securities are typically not actively traded. Net payments in transit and overdraft bank balances are included inother liabilities.
Debt securities are carried at fair value. Debt securities are generally valued by independent pricing vendors using proprietary pricingmodels incorporating current market inputs for similar instruments with comparable terms and credit quality (matrix pricing). Thesignificant inputs include, but are not limited to, yield curves, credit risks and spreads, prepayment rates and volatility of these inputs.These debt securities are classified as Level 2 but can be Level 3 if significant inputs are market unobservable. Realized gains and losseson sale of debt securities and unrealized gains and losses on debt securities designated as FVTPL are recognized in investment incomeimmediately. Unrealized gains and losses on AFS debt securities are recorded in OCI, except for unrealized gains and losses on foreigncurrency translation which are included in income. Impairment losses on AFS debt securities are recognized in income on an individualsecurity basis when there is objective evidence of impairment. Impairment is considered to have occurred, based on management’sjudgment, when it is deemed probable that the Company will not be able to collect all amounts due according to the debt security’scontractual terms.
Public equities are comprised of common and preferred equities and are carried at fair value. Public equities are generally classified asLevel 1, as fair values are normally based on quoted market prices. Realized gains and losses on sale of equities and unrealized gains andlosses on equities designated as FVTPL are recognized in investment income immediately. Unrealized gains and losses on AFS equities arerecorded in OCI. Impairment losses on AFS equities are recognized in income on an individual security basis when there is objectiveevidence of impairment. Impairment is considered to have occurred when fair value has declined below cost by a significant amount or fora prolonged period. Significant judgment is applied in determining whether the decline is significant or prolonged.
Mortgages are carried at amortized cost and are classified as Level 3 for fair value purposes due to the lack of market observability ofcertain significant valuation inputs. Realized gains and losses are recorded in investment income immediately. Impairment losses arerecorded on mortgages when there is no longer reasonable assurance as to the timely collection of the full amount of principal and interestand are measured based on the discounted value of expected future cash flows at the original effective interest rates inherent in themortgage. Expected future cash flows of impaired mortgages are typically determined with reference to the fair value of collateral securityunderlying the mortgage, net of expected costs of realization and including any applicable insurance recoveries. Significant judgment isapplied in the determination of impairment including the timing and amount of future collections.
The Company accounts for insured and uninsured mortgage securitizations as secured financing transactions since the criteria for saleaccounting are not met. For these transactions, the Company continues to recognize the mortgages and records a liability in otherliabilities for the amounts owed at maturity. Interest income from these mortgages and interest expense on the borrowings are recordedusing the effective interest rate method.
Private placements, which include corporate loans for which there is no active market, are carried at amortized cost and are generallyclassified as Level 2 for fair value disclosure purposes or as Level 3 if significant inputs are market unobservable. Realized gains andlosses are recorded in income immediately. Impairment losses are recorded on private placements when there is no longer assurance asto the timely collection of the full amount of principal and interest. Impairment is measured based on the discounted value of expectedfuture cash flows at the original effective interest rate inherent in the loan. Significant judgment is applied in the determination ofimpairment including the timing and amount of future collections.
Policy loans are carried at an amount equal to their unpaid balances and are classified as Level 2 for fair value disclosure purposes. Policyloans are fully collateralized by the cash surrender value of the underlying policies.
Loans to Manulife Bank of Canada (“Manulife Bank” or “Bank”) clients are carried at amortized cost and are classified as Level 2 for fairvalue disclosure purposes. A loan to a Bank client is considered impaired when there is objective evidence of impairment because of one ormore loss events that have occurred after initial recognition, with a negative impact on the estimated future cash flows of the loan.
118 | 2020 Annual Report | Notes to Consolidated Financial Statements

Once established, allowances for impairment of mortgages, private placements and loans to Bank clients are reversed only if theconditions that caused the impairment no longer exist. Reversals of impairment charges on AFS debt securities are only recognized inincome to the extent that increases in fair value can be attributed to events after the impairment loss being recorded. Impairment lossesfor AFS equity instruments are not reversed through income. On disposition of an impaired asset, any allowance for impairment isreleased.
In addition to impairments and provisions for loan losses (recoveries) reported in investment income, the measurement of insurancecontract liabilities, via investment return assumptions, includes expected future credit losses on fixed income investments. Refer tonote 6(d).
Interest income is recognized on debt securities, mortgages, private placements, policy loans and loans to Bank clients as it accrues and iscalculated using the effective interest rate method. Premiums, discounts and transaction costs are amortized over the life of theunderlying investment using the effective yield method for all debt securities as well as mortgages and private placements.
The Company records purchases and sales of invested assets on a trade date basis. Loans originated by the Company are recognized on asettlement date basis.
Real estate consists of both own use and investment property. Own use property is carried at cost less accumulated depreciation and anyaccumulated impairment losses. Depreciation is calculated based on the cost of an asset less its residual value and is recognized inincome on a straight-line basis over the estimated useful life ranging from 30 to 60 years. Impairment losses are recorded in income to theextent the recoverable amount is less than the carrying amount. Where own use property is included in assets backing insurance contractliabilities, the fair value of the property is used in the valuation of insurance contract liabilities. Own use property is classified as Level 3 forfair value disclosure purposes.
An investment property is a property held to earn rental income, for capital appreciation, or both. Investment properties are measured atfair value, with changes in fair value recognized in income. Fair value is determined using external appraisals that are based on the highestand best use of the property. The valuation techniques include discounted cash flows, the direct capitalization method as well ascomparable sales analysis and include both observable and unobservable inputs. Inputs include existing and assumed tenancies, marketdata from recent comparable transactions, future economic outlook and market risk assumptions, capitalization rates and internal rates ofreturn. Investment properties are classified as Level 3 for fair value disclosure purposes.
When a property changes from own use to investment property, any gain or loss arising on the remeasurement of the property to fair valueat the date of transfer is recognized in OCI, to the extent that it is not reversing a previous impairment loss. Reversals of impairment lossesare recognized in income.
Other invested assets include private equity and property investments held in infrastructure and timber, as well as in agriculture and oiland gas sectors. Private equity investments are accounted for as associates or joint ventures using the equity method (as described in note1(d) above) or are classified as FVTPL or AFS and carried at fair value. Investments in oil and gas exploration and evaluation activities aremeasured on the cost basis using the “successful efforts” method. Timber and agriculture properties are measured at fair value withchanges in fair value recognized in income, except for buildings, equipment and bearer plants which are measured at amortized cost. Thefair value of other invested assets is determined using a variety of valuation techniques as described in note 3. Other invested assets thatare measured or disclosed at fair value are classified as Level 3.
Other invested assets also include investments in leveraged leases, which are accounted for using the equity method. The carrying valueunder the equity method reflects the amortized cost of the lease receivable and related non-recourse debt using the effective yield method.
(f) Goodwill and intangible assetsGoodwill represents the difference between the fair value of purchase consideration of an acquired business and the Company’sproportionate share of the net identifiable assets acquired. It is initially recorded at cost and subsequently measured at cost less anyaccumulated impairment.
Goodwill is tested for impairment at least annually and whenever events or changes in circumstances indicate that the carrying amountsmay not be recoverable at the cash generating unit (“CGU”) or group of CGUs level. The Company allocates goodwill to CGUs or groups ofCGUs for impairment testing at the lowest level within the entity where the goodwill is monitored for internal management purposes. Theallocation is made to those CGUs or groups of CGUs that are expected to benefit from the business combination in which the goodwillarose. Any potential impairment of goodwill is identified by comparing the recoverable amount with the carrying value of a CGU or group ofCGUs. Goodwill is reduced by the amount of deficiency, if any. If the deficiency exceeds the carrying amount of goodwill, the carryingvalues of the remaining assets in the CGU or group of CGUs are subject to being reduced by the excess on a pro-rata basis.
The recoverable amount of a CGU is the higher of the estimated fair value less costs to sell or the value-in-use of the CGU. In assessingvalue-in-use, estimated future cash flows are discounted using a pre-tax discount rate that reflects current market assessments of the timevalue of money and the risks specific to the CGU. In some cases, the most recent detailed calculation made in a prior period of therecoverable amount of a CGU is used in the testing of impairment of goodwill in the current period. This is the case only if there are nosignificant changes to the CGU, the likelihood of impairment is remote based on the analysis of current events and circumstances, and themost recently calculated recoverable amount substantially exceeds the current carrying amount of the CGU.
119

Intangible assets with indefinite useful lives include the John Hancock brand name, certain investment management contracts andagricultural water rights. The indefinite useful life assessment for the John Hancock brand name is based on the brand name beingprotected by indefinitely renewable trademarks in markets where branded products are sold, and for certain investment managementcontracts based on the ability to renew these contracts indefinitely. In addition, there are no legal, regulatory or contractual provisions thatlimit the useful lives of these intangible assets. An intangible asset with an indefinite useful life is not amortized but is subject to an annualimpairment test which is performed more frequently if an indication that it is not recoverable arises.
Intangible assets with finite useful lives include acquired distribution networks, customer relationships, capitalized software, and certaininvestment management contracts and other contractual rights. Distribution networks, customer relationships, and other finite lifeintangible assets are amortized over their estimated useful lives, six to 68 years, either based on straight-line or in relation to other assetconsumption metrics. Software intangible assets are amortized on a straight-line basis over their estimated useful lives of three to 10years. Finite life intangible assets are assessed for indicators of impairment at each reporting period. If any indication of impairmentarises, these assets are tested for impairment.
(g) Miscellaneous assetsMiscellaneous assets include assets held in a rabbi trust with respect to unfunded defined benefit obligations, defined benefit assets, ifany, deferred acquisition costs and capital assets. Rabbi trust assets are carried at fair value. Defined benefit assets carrying value isexplained in note 1(o). Deferred acquisition costs are carried at cost less accumulated amortization and are amortized over the periodredemption fees may be charged or over the period revenue is earned. Capital assets are carried at cost less accumulated amortizationcomputed on a straight-line basis over their estimated useful lives, which vary from two to 10 years.
(h) Segregated fundsThe Company manages segregated funds on behalf of policyholders. The investment returns on these funds are passed directly topolicyholders. In some cases, the Company has provided guarantees associated with these funds.
Segregated funds net assets are measured at fair value and include investments in mutual funds, debt securities, equities, cash, short-term investments and other investments. With respect to the consolidation requirement of IFRS, in assessing the Company’s degree ofcontrol over the underlying investments, the Company considers the scope of its decision-making rights, the rights held by other parties,its remuneration as an investment manager and its exposure to variability of returns from the investments. The Company has determinedthat it does not have control over the underlying investments as it acts as an agent on behalf of segregated fund policyholders.
The methodology applied to determine the fair value of investments held in segregated funds is consistent with that applied to investedassets held by the general fund, as described above in note 1(e). Segregated funds liabilities are measured based on the value of thesegregated funds net assets. Investment returns on segregated funds assets belong to policyholders and the Company does not bear therisk associated with these assets outside of guarantees offered on certain variable life and annuity products, for which the underlyinginvestments are held within segregated funds. Accordingly, investment income earned by segregated funds and expenses incurred bysegregated funds are offset and are not separately presented in the Consolidated Statements of Income. Fee income earned by theCompany for managing the segregated funds is included in other revenue.
Liabilities related to guarantees associated with certain segregated funds, as a result of certain variable life and annuity contracts, arerecorded within the Company’s insurance contract liabilities. The Company holds assets supporting these guarantees in the general fund,which are included in invested assets according to their investment type.
(i) Insurance and investment contract liabilitiesMost contracts issued by the Company are considered insurance, investment or service contracts. Contracts under which the Companyaccepts significant insurance risk from a policyholder are classified as insurance contracts in the Consolidated Financial Statements. Acontract is considered to have significant insurance risk if, and only if, an insured event could cause an insurer to make significantadditional payments in any scenario, excluding scenarios that lack commercial substance at the inception of the contract. Contracts underwhich the Company does not accept significant insurance risk are either classified as investment contracts or considered service contractsand are accounted for in accordance with IAS 39 “Financial Instruments: Recognition and Measurement” or IFRS 15 “Revenue fromContracts with Customers”, respectively.
Once a contract has been classified as an insurance contract it remains an insurance contract even if the insurance risk reducessignificantly. Investment contracts can be reclassified as insurance contracts if insurance risk subsequently becomes significant.
Insurance contract liabilities, net of reinsurance assets, represent the amount which, together with estimated future premiums and netinvestment income, will be sufficient to pay estimated future benefits, policyholder dividends and refunds, taxes (other than income taxes)and expenses on policies in-force. Insurance contract liabilities are presented gross of reinsurance assets on the Consolidated Statementsof Financial Position. The Company’s Appointed Actuary is responsible for determining the amount of insurance contract liabilities inaccordance with standards established by the Canadian Institute of Actuaries. Insurance contract liabilities, net of reinsurance assets,have been determined using the Canadian Asset Liability Method (“CALM”) as permitted by IFRS 4 “Insurance Contracts”. Refer to note 6.
120 | 2020 Annual Report | Notes to Consolidated Financial Statements

Investment contract liabilities include contracts issued to retail and institutional investors that do not contain significant insurance risk.Investment contract liabilities and deposits are measured at amortized cost or at FVTPL by election. The election reduces accountingmismatches between FVTPL assets supporting these contracts and the related contract liabilities. Investment contract liabilities arederecognized when the contract expires, is discharged or is cancelled.
Derivatives embedded within insurance contracts are separately accounted for as derivatives if they are not considered to be closelyrelated to the host insurance contract and do not meet the definition of an insurance contract. These embedded derivatives are presentedseparately in other assets or other liabilities and are measured at FVTPL.
(j) Reinsurance assetsThe Company uses reinsurance in the normal course of business to manage its risk exposure. Insurance ceded to a reinsurer does notrelieve the Company from its obligations to policyholders. The Company remains liable to its policyholders for the portion reinsured to theextent that any reinsurer does not meet its obligations for reinsurance ceded to it under a reinsurance agreement.
Reinsurance assets represent the benefit derived from reinsurance agreements in-force at the reporting date, considering the financialcondition of the reinsurer. Amounts recoverable from reinsurers are estimated in accordance with the terms of the relevant reinsurancecontract.
Gains or losses on reinsurance transactions are recognized in income immediately on the transaction date and are not amortized.Premiums ceded and claims reimbursed are presented on a gross basis on the Consolidated Statements of Income. Reinsurance assetsare not offset against the related insurance contract liabilities and are presented separately on the Consolidated Statements of FinancialPosition. Refer to note 6(a).
(k) Other financial instruments accounted for as liabilitiesThe Company issues a variety of other financial instruments classified as liabilities, including notes payable, term notes, senior notes,senior debentures, subordinated notes, surplus notes and preferred shares. These financial liabilities are measured at amortized cost, withissuance costs deferred and amortized using the effective interest rate method.
(l) Income taxesThe provision for income taxes is calculated based on income tax laws and income tax rates substantively enacted as at the date of theConsolidated Statements of Financial Position. The income tax provision is comprised of current income taxes and deferred income taxes.Current and deferred income taxes relating to items recognized in OCI and directly in equity are similarly recognized in OCI and directly inequity, respectively.
Current income taxes are amounts expected to be payable or recoverable for the current year and any adjustments to taxes payable inrespect of previous years.
Deferred income taxes are provided for using the liability method and result from temporary differences between the carrying values ofassets and liabilities and their respective tax bases. Deferred income taxes are measured at the substantively enacted tax rates that areexpected to be applied to temporary differences when they reverse.
A deferred tax asset is recognized to the extent that future realization of the tax benefit is probable. Deferred tax assets are reviewed ateach reporting date and are reduced to the extent that it is no longer probable that the tax benefit will be realized. Deferred tax assets andliabilities are offset if there is a legally enforceable right to offset current tax assets and liabilities and they relate to income taxes levied bythe same tax authority on the same taxable entity.
Deferred tax liabilities are recognized for all taxable temporary differences, except in respect of taxable temporary differences associatedwith investments in subsidiaries, associates and joint ventures, where the timing of the reversal of the temporary differences can becontrolled and it is probable that the temporary differences will not reverse in the foreseeable future.
The Company records liabilities for uncertain tax positions if it is probable that the Company will make a payment on tax positions due toexaminations by tax authorities. These provisions are measured at the Company’s best estimate of the amount expected to be paid.Provisions are reversed to income in the period in which management assesses they are no longer required or determined by statute.
The Company is subject to income tax laws in various jurisdictions. Tax laws are complex and potentially subject to different interpretationsby the taxpayer and the relevant tax authority. The provision for current income taxes and deferred income taxes representsmanagement’s interpretation of the relevant tax laws and its estimate of current and future income tax implications of the transactions andevents during the year. The Company may be required to change its provision for income taxes or deferred income tax balances when theultimate deductibility of certain items is successfully challenged by taxing authorities, or if estimates used in determining the amount ofdeferred tax balances to recognize change significantly, or when receipt of new information indicates the need for adjustment in theamount of deferred income taxes to be recognized. Additionally, future events, such as changes in tax laws, tax regulations, orinterpretations of such laws or regulations, could have an impact on the provision for income taxes, deferred tax balances and the effectivetax rate. Any such changes could materially affect the amounts reported in the Consolidated Financial Statements in the period thesechanges occur.
121

(m) Foreign currency translationItems included in the financial statements of each of the Company’s subsidiaries, joint ventures and associates are measured by eachentity using the currency of the primary economic environment in which the entity operates (the “functional currency”). If their functionalcurrency is other than Canadian dollar, these entities are foreign operations of the Company.
Transactions in a foreign currency are translated to the functional currency at the exchange rate prevailing at the date of the transaction.Assets and liabilities denominated in foreign currencies are translated to the functional currency at the exchange rate in effect at thereporting date. Revenue and expenses denominated in foreign currencies are translated at the average exchange rate prevailing during thequarter reported. Exchange gains and losses are recognized in income except for translation of net investments in foreign operations andthe results of hedging these positions, and for non-monetary items designated as AFS. These foreign exchange gains and losses arerecognized in OCI until such time that the foreign operation or non-monetary item is disposed of or control or significant influence over it islost.
The Consolidated Financial Statements are presented in Canadian dollars. The financial statements of the Company’s foreign operationsare translated from their functional currencies to Canadian dollars; assets and liabilities are translated at the exchange rate at thereporting date, and revenue and expenses are translated using the average exchange rates for the period. Foreign exchange gains andlosses on these translations are recognized in OCI, subject to reclassification to income upon disposal of a foreign operation.
(n) Stock-based compensationThe Company provides stock-based compensation to certain employees and directors as described in note 14. Compensation expense ofequity instruments granted is accrued based on the best estimate of the number of instruments expected to vest, with revisions made tothat estimate if subsequent information indicates that actual forfeitures are likely to differ from initial forfeiture estimates, unlessforfeitures are due to market-based conditions.
Stock options are expensed with a corresponding increase in contributed surplus. Restricted share units and deferred share units areexpensed with a corresponding liability accrued based on the market value of MFC’s common shares at the end of each quarter.Performance share units are expensed with a corresponding liability accrued based on specific performance conditions and the marketvalue of MFC’s common shares at the end of each quarter. The change in the value of the awards resulting from changes in the marketvalue of MFC’s common shares or changes in the specific performance conditions and credited dividends is recognized in income, offset bythe impact of total return swaps used to manage the variability of the related liabilities.
Stock-based compensation cost is recognized over the applicable vesting period, unless the employee is eligible to retire at the time ofgrant or will be eligible to retire during the vesting period. Compensation costs attributable to stock options, restricted share units, andperformance share units granted to employees who are eligible to retire on the grant date or who will become eligible to retire during thevesting period, are recognized at the grant date or over the period from the grant date to the date of retirement eligibility, respectively.
The Company’s contributions to the Global Share Ownership Plan (“GSOP”) (refer to note 14(d)), are expensed as incurred. Under theGSOP, subject to certain conditions, the Company will match a percentage of an employee’s eligible contributions to certain maximums. Allcontributions are used by the plan’s trustee to purchase MFC common shares in the open market.
(o) Employee future benefitsThe Company maintains defined contribution and defined benefit pension plans and other post-employment plans for employees andagents including registered (tax qualified) pension plans that are typically funded as well as supplemental non-registered (non-qualified)pension plans for executives, retiree and disability welfare plans that are typically not funded.
The Company’s obligation in respect of defined benefit pension and other post-employment benefits is calculated for each plan as theestimated present value of future benefits that eligible employees have earned in return for their service up to the reporting date using theprojected benefit method. The discount rate used is based on the yield, as at the reporting date, of high-quality corporate debt securitiesthat have approximately the same term as the benefit obligations and that are denominated in the same currency in which the benefits areexpected to be paid.
To determine the Company’s net defined benefit asset or liability, the fair value of plan assets is deducted from the defined benefitobligations. When this calculation results in a surplus, the asset that can be recognized is limited to the present value of future economicbenefit available in the form of future refunds from the plan or reductions in future contributions to the plan (the asset limit). Definedbenefit assets are included in other assets and defined benefit liabilities are included in other liabilities.
Changes in the net defined benefit asset or liability due to re-measurement of pension and retiree welfare plans are recorded in OCI in theperiod in which they occur and are not reclassified to income in subsequent periods. They consist of actuarial gains and losses, the impactof the asset limit, if any, and the return on plan assets, excluding amounts included in net interest income or expense. Changes in the netdefined benefit asset or liability due to re-measurement of disability welfare plans are recorded in income in the period in which they occur.
The cost of defined benefit pension plans is recognized over the employee’s years of service to retirement while the cost of retiree welfareplans is recognized over the employee’s years of service to their date of full eligibility. The net benefit cost for the year is recorded inincome and is calculated as the sum of the service cost in respect of the fiscal year, the net interest income or expense and any applicable
122 | 2020 Annual Report | Notes to Consolidated Financial Statements

administration expenses, plus past service costs or credits resulting from plan amendments or curtailments. The net interest income orexpense is determined by applying the discount rate to the net defined benefit asset or liability. The current year cost of disability welfareplans is the year-over-year change in the defined benefit obligation, including any actuarial gains or losses.
The cost of defined contribution plans is the contribution provided by the Company and is recorded in income in the periods during whichservices are rendered by employees.
(p) Derivative and hedging instrumentsThe Company uses derivative financial instruments (“derivatives”) including swaps, forward and futures agreements, and options tomanage current and anticipated exposures to changes in interest rates, foreign exchange rates, commodity prices and equity marketprices, and to replicate permissible investments. Derivatives embedded in other financial instruments are separately recorded asderivatives when their economic characteristics and risks are not closely related to those of the host instrument, the terms of theembedded derivative are the same as those of a standalone derivative and the host instrument itself is not recorded at FVTPL. Derivativeswhich are separate financial instruments are recorded at fair value, and those with unrealized gains reported as derivative assets and thosewith unrealized losses reported as derivative liabilities.
A determination is made for each derivative as to whether to apply hedge accounting. Where hedge accounting is not applied, changes inthe fair value of derivatives are recorded in investment income. Refer to note 3(c).
Where the Company has elected to apply hedge accounting, a hedging relationship is designated and documented at inception. Hedgeeffectiveness is evaluated at inception and throughout the term of the hedge. Hedge accounting is only applied when the Company expectsthat the hedging relationship will be highly effective in achieving offsetting changes in fair value or changes in cash flows attributable to therisk being hedged. The assessment of hedge effectiveness is performed at the end of each reporting period both prospectively andretrospectively. When it is determined that a hedging relationship is no longer effective, or the hedging instrument or the hedged item hasbeen sold or terminated, the Company discontinues hedge accounting prospectively. In such cases, if the derivatives are not sold orterminated, any subsequent changes in fair value of the derivatives are recognized in investment income.
For derivatives that are designated as hedging instruments, changes in fair value are recorded according to the nature of the risks beinghedged, as discussed below.
In a fair value hedging relationship, changes in fair value of the hedging instruments are recorded in investment income, offsettingchanges in fair value of the hedged items, which would otherwise not be carried at fair value. Hedge ineffectiveness is recognized ininvestment income and arises from differences between changes in the fair values of hedging instruments and hedged items. When hedgeaccounting is discontinued, the carrying value of the hedged item is no longer adjusted and the cumulative fair value adjustments areamortized to investment income over the remaining term of the hedged item unless the hedged item is sold, at which time the balance isrecognized immediately in investment income.
In a cash flow hedging relationship, the effective portion of the change in the fair value of the hedging instrument is recorded in OCI whilethe ineffective portion is recognized in investment income. Gains and losses in accumulated other comprehensive income (“AOCI”) arerecognized in income during the same periods that the variability in the hedged cash flows or the hedged forecasted transactions arerecognized in income. The reclassifications from AOCI are made to investment income, except for total return swaps that hedge stock-based compensation awards, which are reclassified to general expenses.
Gains and losses on cash flow hedges in AOCI are reclassified immediately to investment income when the hedged item is sold, or theforecasted transaction is no longer expected to occur. When a hedge is discontinued, but the hedged forecasted transaction is expected tooccur, the amounts in AOCI are reclassified to investment income in the periods during which variability in the cash flows hedged or thehedged forecasted transaction is recognized in income.
In a net investment in foreign operations hedging relationship, gains and losses relating to the effective portion of the hedge are recordedin OCI. Gains and losses in AOCI are recognized in income during the periods when gains or losses on the underlying hedged netinvestment in foreign operations are recognized in income upon disposal of the foreign operation.
(q) Premium income and related expensesGross premiums for all types of insurance contracts, and contracts with limited mortality or morbidity risk, are generally recognized asrevenue when due. Premiums are reported gross of reinsurance ceded (refer to note 6).
(r) Revenue from service contractsThe Company recognizes revenue from service contracts in accordance with IFRS 15. The Company’s service contracts generally imposesingle performance obligations, each consisting of a series of similar related services for each customer. Revenue is recorded asperformance obligations are satisfied over time because the customers simultaneously receive and consume the benefits of the servicesrendered, measured using an output method. Revenue for variable consideration is recognized to the extent that it is highly probable that asignificant reversal in the amount of cumulative revenue recognized will not occur when the uncertainty is subsequently resolved. Refer tonote 13.
123
Note 2 Accounting and Reporting Changes(a) Changes in accounting and reporting policy
(i) Amendments to IFRS 3 “Business Combinations”Amendments to IFRS 3 “Business Combinations” were issued in October 2018 and are effective for business combinations occurring on orafter January 1, 2020, with earlier application permitted. The amendments revise the definition of a business and permit a simplifiedassessment of whether an acquired set of activities and assets qualifies as a business. Application of the amendments are expected toresult in fewer acquisitions qualifying as business combinations. Adoption of these amendments did not have a significant impact on theCompany’s Consolidated Financial Statements.
(ii) Amendments to IAS 1 “Presentation of Financial Statements” and IAS 8 “Accounting Policies, Changes in Accounting Estimatesand Errors”Amendments to IAS 1 “Presentation of Financial Statements” and IAS 8 “Accounting Policies, Changes in Accounting Estimates and Errors”were issued in October 2018. The amendments are effective for annual periods beginning on or after January 1, 2020 and are to beapplied prospectively. The amendments update the definition of material. Adoption of these amendments did not have a significant impacton the Company’s Consolidated Financial Statements.
(iii) Interest Rate Benchmark Reform Amendments to IFRS 9, IAS 39 and IFRS 7Amendments to IFRS 9, IAS 39 and IFRS 7 were issued in September 2019 related to interest rate benchmark reform and are effectiveretrospectively for annual periods beginning on or after January 1, 2020. The amendments provide temporary relief for hedge accountingto continue during the period of uncertainty before replacement of an existing interest rate benchmark with an alternative risk-free rate.The amendments apply to all hedge accounting relationships that are affected by the interest rate benchmark reform. The IASB has issuedfurther guidance addressing various accounting issues that will arise when the existing interest rate benchmark has been replaced (referto note 2(b)). Adoption of these amendments did not have a significant impact on the Company’s Consolidated Financial Statements.
(b) Future accounting and reporting changes
(i) IFRS 17 “Insurance Contracts” and IFRS 9 “Financial Instruments”Amendments to IFRS 17 “Insurance Contracts” were issued in June 2020 and include a two-year deferral of the effective date along withother changes targeted to address implementation concerns and challenges raised by stakeholders. Amendments include changes to lossrecovery components for reinsurance contracts held, services related to investment activities and the allocation of acquisition cash flows.IFRS 17 as amended, is effective for years beginning on January 1, 2023, to be applied retrospectively. If full retrospective application to agroup of contracts is impractical, the modified retrospective or fair value methods may be used.
In conjunction with the amendments to IFRS 17, the IASB also amended IFRS 4 “Insurance Contracts” to permit eligible insurers to applyIFRS 9 effective January 1, 2023, alongside IFRS 17.
The Company continues its assessment of the implications of this standard and expects that it will have a significant impact on theCompany’s Consolidated Financial Statements. The establishment of a Contractual Service Margin on the Company’s in-force business isexpected to lead to an increase in insurance contract liabilities and corresponding decrease in equity upon transition. The ContractualService Margin represents unearned profits that are expected to amortize into income as services are provided. The Company continues toevaluate the potential impacts of all other changes including available accounting policy choices under IFRS 17 on the measurement of itsinsurance contract liabilities.
(ii) Annual Improvements 2018–2020 CycleAnnual Improvements 2018–2020 Cycle was issued in May 2020 and is effective on or after January 1, 2022. The IASB issued four minoramendments to different standards as part of the Annual Improvements process, to be applied prospectively. Adoption of theseamendments is not expected to have a significant impact on the Company’s Consolidated Financial Statements.
(iii) Amendments to IFRS 3 “Business Combinations”Amendments to IFRS 3 “Business Combinations” were issued in May 2020, and are effective on or after January 1, 2022, with earlierapplication permitted. The amendments update references within IFRS 3 to the 2018 Conceptual Framework and require that theprinciples in IAS 37 “Provisions, Contingent Liabilities and Contingent Assets” be used to identify liabilities and contingent assets arisingfrom a business combination. Adoption of these amendments is not expected to have a significant impact on the Company’s ConsolidatedFinancial Statements.
(iv) Amendments to IAS 37 “Provisions, Contingent Liabilities and Contingent Assets”Amendments to IAS 37 “Provisions, Contingent Liabilities and Contingent Assets” were issued in May 2020, and are effective on or afterJanuary 1, 2022, with earlier application permitted. The amendments address identifying onerous contracts and specify the cost offulfilling a contract which includes all costs directly relate to the contract. These include incremental direct costs and allocations of othercosts that relate directly to fulfilling the contract. Adoption of these amendments is not expected to have a significant impact on theCompany’s Consolidated Financial Statements.
124 | 2020 Annual Report | Notes to Consolidated Financial Statements
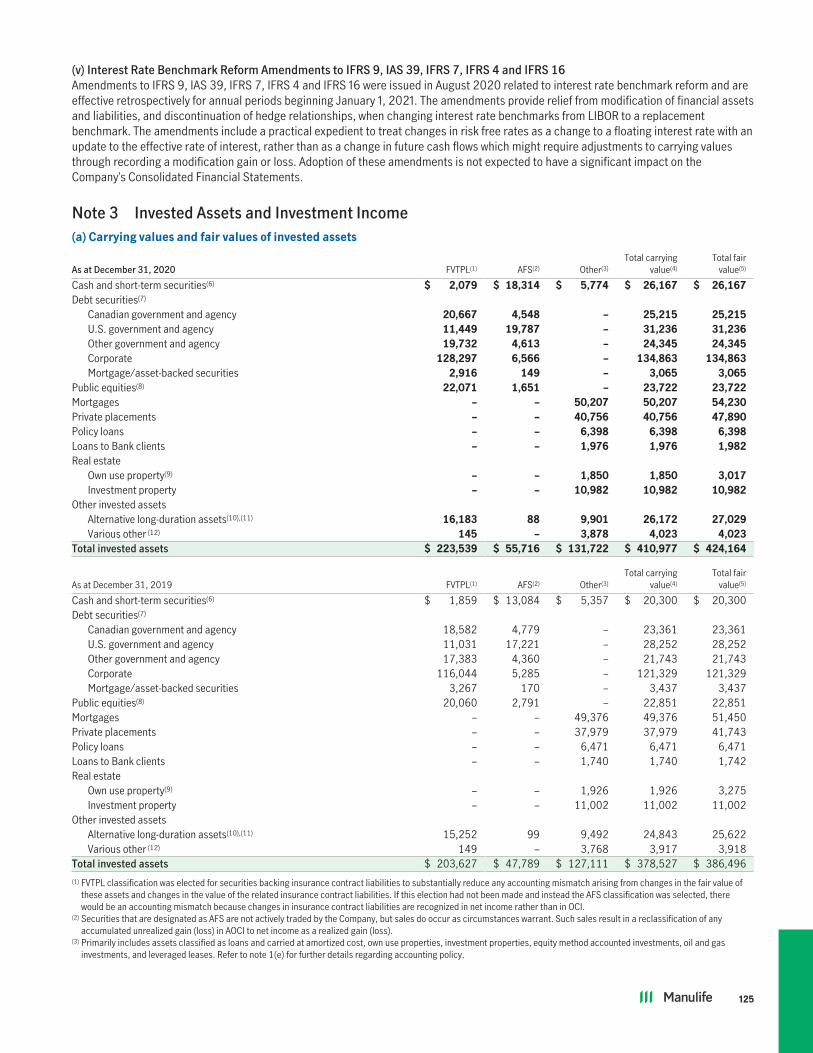
(v) Interest Rate Benchmark Reform Amendments to IFRS 9, IAS 39, IFRS 7, IFRS 4 and IFRS 16Amendments to IFRS 9, IAS 39, IFRS 7, IFRS 4 and IFRS 16 were issued in August 2020 related to interest rate benchmark reform and areeffective retrospectively for annual periods beginning January 1, 2021. The amendments provide relief from modification of financial assetsand liabilities, and discontinuation of hedge relationships, when changing interest rate benchmarks from LIBOR to a replacementbenchmark. The amendments include a practical expedient to treat changes in risk free rates as a change to a floating interest rate with anupdate to the effective rate of interest, rather than as a change in future cash flows which might require adjustments to carrying valuesthrough recording a modification gain or loss. Adoption of these amendments is not expected to have a significant impact on theCompany’s Consolidated Financial Statements.
Note 3 Invested Assets and Investment Income(a) Carrying values and fair values of invested assets
As at December 31, 2020 FVTPL(1) AFS(2) Other(3)Total carrying
value(4)Total fair
value(5)
Cash and short-term securities(6) $ 2,079 $ 18,314 $ 5,774 $ 26,167 $ 26,167Debt securities(7)
Canadian government and agency 20,667 4,548 – 25,215 25,215U.S. government and agency 11,449 19,787 – 31,236 31,236Other government and agency 19,732 4,613 – 24,345 24,345Corporate 128,297 6,566 – 134,863 134,863Mortgage/asset-backed securities 2,916 149 – 3,065 3,065
Public equities(8) 22,071 1,651 – 23,722 23,722Mortgages – – 50,207 50,207 54,230Private placements – – 40,756 40,756 47,890Policy loans – – 6,398 6,398 6,398Loans to Bank clients – – 1,976 1,976 1,982Real estate
Own use property(9) – – 1,850 1,850 3,017Investment property – – 10,982 10,982 10,982
Other invested assetsAlternative long-duration assets(10),(11) 16,183 88 9,901 26,172 27,029Various other (12) 145 – 3,878 4,023 4,023
Total invested assets $ 223,539 $ 55,716 $ 131,722 $ 410,977 $ 424,164
As at December 31, 2019 FVTPL(1) AFS(2) Other(3)Total carrying
value(4)Total fair
value(5)
Cash and short-term securities(6) $ 1,859 $ 13,084 $ 5,357 $ 20,300 $ 20,300Debt securities(7)
Canadian government and agency 18,582 4,779 – 23,361 23,361U.S. government and agency 11,031 17,221 – 28,252 28,252Other government and agency 17,383 4,360 – 21,743 21,743Corporate 116,044 5,285 – 121,329 121,329Mortgage/asset-backed securities 3,267 170 – 3,437 3,437
Public equities(8) 20,060 2,791 – 22,851 22,851Mortgages – – 49,376 49,376 51,450Private placements – – 37,979 37,979 41,743Policy loans – – 6,471 6,471 6,471Loans to Bank clients – – 1,740 1,740 1,742Real estate
Own use property(9) – – 1,926 1,926 3,275Investment property – – 11,002 11,002 11,002
Other invested assetsAlternative long-duration assets(10),(11) 15,252 99 9,492 24,843 25,622Various other (12) 149 – 3,768 3,917 3,918
Total invested assets $ 203,627 $ 47,789 $ 127,111 $ 378,527 $ 386,496(1) FVTPL classification was elected for securities backing insurance contract liabilities to substantially reduce any accounting mismatch arising from changes in the fair value of
these assets and changes in the value of the related insurance contract liabilities. If this election had not been made and instead the AFS classification was selected, therewould be an accounting mismatch because changes in insurance contract liabilities are recognized in net income rather than in OCI.
(2) Securities that are designated as AFS are not actively traded by the Company, but sales do occur as circumstances warrant. Such sales result in a reclassification of anyaccumulated unrealized gain (loss) in AOCI to net income as a realized gain (loss).
(3) Primarily includes assets classified as loans and carried at amortized cost, own use properties, investment properties, equity method accounted investments, oil and gasinvestments, and leveraged leases. Refer to note 1(e) for further details regarding accounting policy.
125

(4) Fixed income invested assets above include debt securities, mortgages, private placements and approximately $246 (2019 – $179) of other invested assets, which primarilyhave contractual cash flows that qualify as Solely Payment of Principal and Interest (“SPPI”). Fixed income invested assets which do not have SPPI qualifying cash flows as atDecember 31, 2020 include debt securities, private placements and other invested assets with fair values of $94, $211 and $380, respectively (2019 – $98, $257 and$373). The change in the fair value of these invested assets during the year was $44 (2019 – $71).
(5) The methodologies used in determining fair values of invested assets are described in note 1(c) and note 3(g).(6) Includes short-term securities with maturities of less than one year at acquisition amounting to $7,062 (2019 – $3,806), cash equivalents with maturities of less than 90 days
at acquisition amounting to $13,331 (2019 – $11,136) and cash of $5,774 (2019 – $5,358).(7) Debt securities include securities which were acquired with maturities of less than one year and less than 90 days of $1,971 and $129, respectively (2019 – $537 and $69).(8) Includes $229 (2019 – $12) of public equities that are managed in conjunction with the Company’s alternative long duration asset (“ALDA”) strategy.(9) Includes accumulated depreciation of $376 (2019 – $414).(10) Includes investments in private equity of $7,954, infrastructure of $9,127, oil and gas of $2,296, timber and agriculture of $4,819 and various other invested assets of
$1,976 (2019 – $6,396, $8,854, $3,245, $4,669 and $1,679, respectively). In 2019, a group of investments in hydro-electric power of $418 was sold.(11) In 2019, the Company sold $1,112 of North American Private Equity investments to Manulife Private Equity Partners, L.P, a closed-end pooled fund of funds. The Company
provides management services to the fund.(12) Includes $3,371 (2019 – $3,371) of leveraged leases. Refer to note 1(e) regarding accounting policy.
(b) Equity method accounted invested assetsOther invested assets include investments in associates and joint ventures which are accounted for using the equity method of accountingas presented in the following table.
2020 2019
As at December 31,Carrying
value % of totalCarrying
value % of total
Leveraged leases $ 3,371 40 $ 3,371 43Timber and agriculture 694 8 668 9Real estate 1,187 14 1,031 13Other 3,222 38 2,716 35Total $ 8,474 100 $ 7,786 100
The Company’s share of profit and dividends from these investments for the year ended December 31, 2020 were $315 and $2,respectively (2019 – $369 and $2).
126 | 2020 Annual Report | Notes to Consolidated Financial Statements

(c) Investment income
For the year ended December 31, 2020 FVTPL AFS Other(1) Total
Cash and short-term securitiesInterest income $ 24 $ 145 $ – $ 169Gains (losses)(2) (24) (112) – (136)
Debt securitiesInterest income 5,805 692 – 6,497Gains (losses)(2) 10,739 2,785 – 13,524Impairment loss, net (113) (6) – (119)
Public equitiesDividend income 517 38 – 555Gains (losses)(2) 2,020 21 – 2,041Impairment loss, net – (54) – (54)
MortgagesInterest income – – 1,837 1,837Gains (losses)(2) – – 86 86Provision, net – – (18) (18)
Private placementsInterest income – – 1,883 1,883Gains (losses)(2) – – (18) (18)Impairment loss, net – – (88) (88)
Policy loans – – 390 390Loans to Bank clients
Interest income – – 72 72Provision, net – – (2) (2)
Real estateRental income, net of depreciation(3) – – 468 468Gains (losses)(2) – – (18) (18)
DerivativesInterest income, net 924 – (31) 893Gains (losses)(2) 6,501 – 28 6,529
Other invested assetsInterest income – – 72 72Oil and gas, timber, agriculture and other income – – 1,435 1,435Gains (losses)(2) (210) 1 32 (177)Impairment loss, net (9) (16) (396) (421)
Total investment income $ 26,174 $ 3,494 $ 5,732 $ 35,400Investment income
Interest income $ 6,753 $ 837 $ 4,223 $ 11,813Dividend, rental and other income 517 38 1,903 2,458Impairments, provisions and recoveries, net (123) (76) (504) (703)Other 241 2,685 (61) 2,865
7,388 3,484 5,561 16,433Realized and unrealized gains (losses) on assets supporting insurance and investment contract
liabilities and on macro equity hedgesDebt securities 10,747 1 – 10,748Public equities 1,908 9 – 1,917Mortgages – – 86 86Private placements – – (47) (47)Real estate – – 1 1Other invested assets (318) – 103 (215)Derivatives, including macro equity hedging program 6,449 – 28 6,477
18,786 10 171 18,967Total investment income $ 26,174 $ 3,494 $ 5,732 $ 35,400
127

For the year ended December 31, 2019 FVTPL AFS Other(1) Total
Cash and short-term securitiesInterest income $ 32 $ 281 $ – $ 313Gains (losses)(2) 11 (29) – (18)
Debt securitiesInterest income 5,557 783 – 6,340Gains (losses)(2) 11,525 472 – 11,997Recovery (impairment loss), net (9) 1 – (8)
Public equitiesDividend income 551 69 – 620Gains (losses)(2) 3,079 109 – 3,188Impairment loss, net – (24) – (24)
MortgagesInterest income – – 1,951 1,951Gains (losses)(2) – – 26 26Provision, net – – 31 31
Private placementsInterest income – – 1,782 1,782Gains (losses)(2) – – (62) (62)Impairment loss, net – – (35) (35)
Policy loans – – 391 391Loans to Bank clients
Interest income – – 87 87Provision, net – – (1) (1)
Real estateRental income, net of depreciation(3) – – 505 505Gains (losses)(2) – – 508 508
DerivativesInterest income, net 579 – (24) 555Gains (losses)(2) 2,653 – (6) 2,647
Other invested assetsInterest income – – 69 69Oil and gas, timber, agriculture and other income – – 1,862 1,862Gains (losses)(2) 742 (1) 35 776Recovery, net – – 93 93
Total investment income $ 24,720 $ 1,661 $ 7,212 $ 33,593Investment income
Interest income $ 6,168 $ 1,064 $ 4,256 $ 11,488Dividend, rental and other income 552 69 2,367 2,988Impairments, provisions and recoveries, net (9) (23) 88 56Other 265 539 57 861
6,976 1,649 6,768 15,393Realized and unrealized gains (losses) on assets supporting insurance and investment contract
liabilities and on macro equity hedgesDebt securities 11,521 7 – 11,528Public equities 2,865 5 – 2,870Mortgages – – 26 26Private placements – – (62) (62)Real estate – – 514 514Other invested assets 776 – (28) 748Derivatives, including macro equity hedging program 2,582 – (6) 2,576
17,744 12 444 18,200Total investment income $ 24,720 $ 1,661 $ 7,212 $ 33,593(1) Primarily includes investment income on loans carried at amortized cost, own use properties, investment properties, derivative and hedging instruments in cash flow hedging
relationships, equity method accounted investments, oil and gas investments, and leveraged leases.(2) Includes net realized and unrealized gains (losses) for financial instruments at FVTPL, real estate investment properties, and other invested assets measured at fair value. Also
includes net realized gains (losses) for financial instruments at AFS and other invested assets carried at amortized cost.(3) Rental income from investment properties is net of direct operating expenses.
128 | 2020 Annual Report | Notes to Consolidated Financial Statements
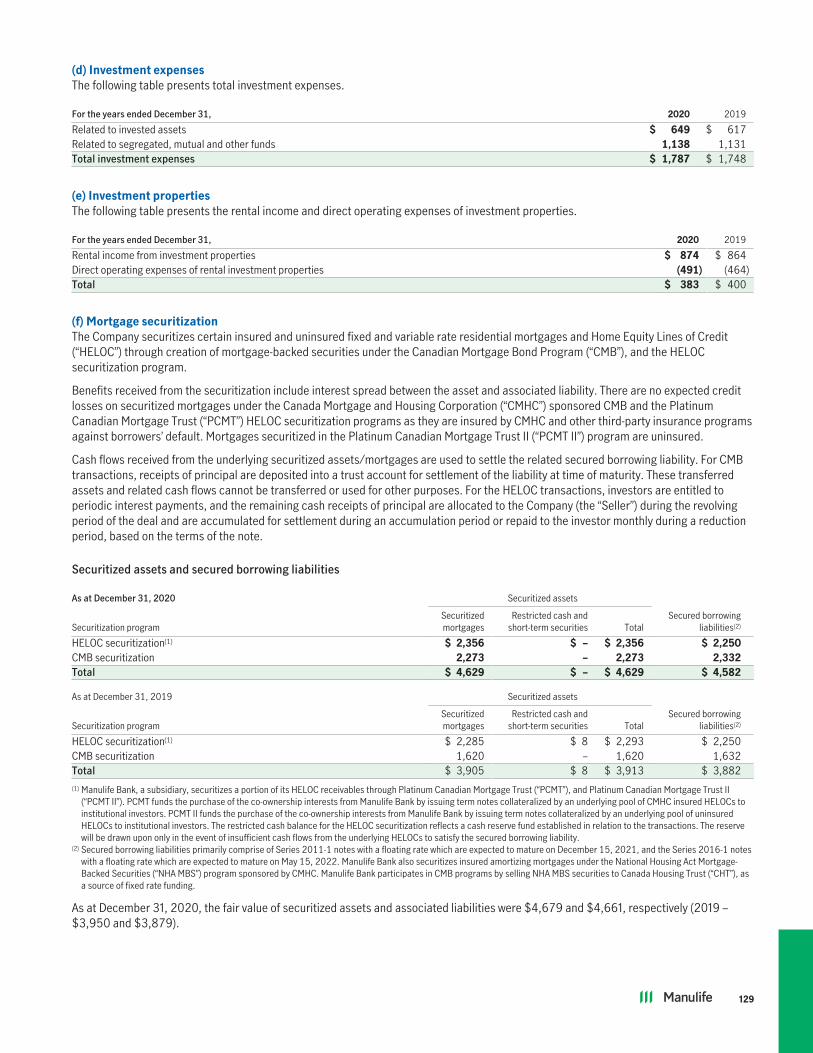
(d) Investment expensesThe following table presents total investment expenses.
For the years ended December 31, 2020 2019
Related to invested assets $ 649 $ 617Related to segregated, mutual and other funds 1,138 1,131Total investment expenses $ 1,787 $ 1,748
(e) Investment propertiesThe following table presents the rental income and direct operating expenses of investment properties.
For the years ended December 31, 2020 2019
Rental income from investment properties $ 874 $ 864Direct operating expenses of rental investment properties (491) (464)Total $ 383 $ 400
(f) Mortgage securitizationThe Company securitizes certain insured and uninsured fixed and variable rate residential mortgages and Home Equity Lines of Credit(“HELOC”) through creation of mortgage-backed securities under the Canadian Mortgage Bond Program (“CMB”), and the HELOCsecuritization program.
Benefits received from the securitization include interest spread between the asset and associated liability. There are no expected creditlosses on securitized mortgages under the Canada Mortgage and Housing Corporation (“CMHC”) sponsored CMB and the PlatinumCanadian Mortgage Trust (“PCMT”) HELOC securitization programs as they are insured by CMHC and other third-party insurance programsagainst borrowers’ default. Mortgages securitized in the Platinum Canadian Mortgage Trust II (“PCMT II”) program are uninsured.
Cash flows received from the underlying securitized assets/mortgages are used to settle the related secured borrowing liability. For CMBtransactions, receipts of principal are deposited into a trust account for settlement of the liability at time of maturity. These transferredassets and related cash flows cannot be transferred or used for other purposes. For the HELOC transactions, investors are entitled toperiodic interest payments, and the remaining cash receipts of principal are allocated to the Company (the “Seller”) during the revolvingperiod of the deal and are accumulated for settlement during an accumulation period or repaid to the investor monthly during a reductionperiod, based on the terms of the note.
Securitized assets and secured borrowing liabilities
As at December 31, 2020 Securitized assets
Securitization programSecuritizedmortgages
Restricted cash andshort-term securities Total
Secured borrowingliabilities(2)
HELOC securitization(1) $ 2,356 $ – $ 2,356 $ 2,250CMB securitization 2,273 – 2,273 2,332Total $ 4,629 $ – $ 4,629 $ 4,582
As at December 31, 2019 Securitized assets
Securitization programSecuritizedmortgages
Restricted cash andshort-term securities Total
Secured borrowingliabilities(2)
HELOC securitization(1) $ 2,285 $ 8 $ 2,293 $ 2,250CMB securitization 1,620 – 1,620 1,632Total $ 3,905 $ 8 $ 3,913 $ 3,882(1) Manulife Bank, a subsidiary, securitizes a portion of its HELOC receivables through Platinum Canadian Mortgage Trust (“PCMT”), and Platinum Canadian Mortgage Trust II
(“PCMT II”). PCMT funds the purchase of the co-ownership interests from Manulife Bank by issuing term notes collateralized by an underlying pool of CMHC insured HELOCs toinstitutional investors. PCMT II funds the purchase of the co-ownership interests from Manulife Bank by issuing term notes collateralized by an underlying pool of uninsuredHELOCs to institutional investors. The restricted cash balance for the HELOC securitization reflects a cash reserve fund established in relation to the transactions. The reservewill be drawn upon only in the event of insufficient cash flows from the underlying HELOCs to satisfy the secured borrowing liability.
(2) Secured borrowing liabilities primarily comprise of Series 2011-1 notes with a floating rate which are expected to mature on December 15, 2021, and the Series 2016-1 noteswith a floating rate which are expected to mature on May 15, 2022. Manulife Bank also securitizes insured amortizing mortgages under the National Housing Act Mortgage-Backed Securities (“NHA MBS”) program sponsored by CMHC. Manulife Bank participates in CMB programs by selling NHA MBS securities to Canada Housing Trust (“CHT”), asa source of fixed rate funding.
As at December 31, 2020, the fair value of securitized assets and associated liabilities were $4,679 and $4,661, respectively (2019 –$3,950 and $3,879).
129

(g) Fair valuemeasurementThe following table presents the fair values of invested assets and segregated funds net assets measured at fair value categorized by thefair value hierarchy.
As at December 31, 2020 Total fair value Level 1 Level 2 Level 3Cash and short-term securities
FVTPL $ 2,079 $ – $ 2,079 $ –AFS 18,314 – 18,314 –Other 5,774 5,774 – –
Debt securitiesFVTPL
Canadian government and agency 20,667 – 20,667 –U.S. government and agency 11,449 – 11,449 –Other government and agency 19,732 – 19,732 –Corporate 128,297 – 127,787 510Residential mortgage-backed securities 9 – 9 –Commercial mortgage-backed securities 1,172 – 1,172 –Other asset-backed securities 1,735 – 1,690 45
AFSCanadian government and agency 4,548 – 4,548 –U.S. government and agency 19,787 – 19,787 –Other government and agency 4,613 – 4,613 –Corporate 6,566 – 6,563 3Residential mortgage-backed securities 1 – 1 –Commercial mortgage-backed securities 93 – 93 –Other asset-backed securities 55 – 55 –
Public equitiesFVTPL 22,071 22,071 – –AFS 1,651 1,651 – –
Real estate – investment property(1) 10,982 – – 10,982Other invested assets(2) 19,149 100 – 19,049Segregated funds net assets(3) 367,436 327,437 35,797 4,202Total $ 666,180 $ 357,033 $ 274,356 $ 34,791
As at December 31, 2019 Total fair value Level 1 Level 2 Level 3Cash and short-term securities
FVTPL $ 1,859 $ – $ 1,859 $ –AFS 13,084 – 13,084 –Other 5,357 5,357 – –
Debt securitiesFVTPL
Canadian government and agency 18,582 – 18,582 –U.S. government and agency 11,031 – 11,031 –Other government and agency 17,383 – 17,383 –Corporate 116,044 – 115,411 633Residential mortgage-backed securities 13 – 13 –Commercial mortgage-backed securities 1,271 – 1,271 –Other asset-backed securities 1,983 – 1,983 –
AFSCanadian government and agency 4,779 – 4,779 –U.S. government and agency 17,221 – 17,221 –Other government and agency 4,360 – 4,360 –Corporate 5,285 – 5,270 15Residential mortgage-backed securities 1 – 1 –Commercial mortgage-backed securities 102 – 102 –Other asset-backed securities 67 – 67 –
Public equitiesFVTPL 20,060 20,060 – –AFS 2,791 2,788 3 –
Real estate – investment property(1) 11,002 – – 11,002Other invested assets(2) 18,194 91 – 18,103Segregated funds net assets(3) 343,108 303,567 35,029 4,512Total $ 613,577 $ 331,863 $ 247,449 $ 34,265(1) For investment properties, the significant unobservable inputs are capitalization rates (ranging from 2.75% to 8.50% during the year and ranging from 2.75% to 8.75% during
2019) and terminal capitalization rates (ranging from 3.25% to 9.25% during the year and ranging from 3.80% to 9.25% during 2019). Holding other factors constant, a lowercapitalization or terminal capitalization rate will tend to increase the fair value of an investment property. Changes in fair value based on variations in unobservable inputsgenerally cannot be extrapolated because the relationship between the directional changes of each input is not usually linear.
130 | 2020 Annual Report | Notes to Consolidated Financial Statements

(2) Other invested assets measured at fair value are held primarily in infrastructure and timber sectors. The significant inputs used in the valuation of the Company’s infrastructureinvestments are primarily future distributable cash flows, terminal values and discount rates. Holding other factors constant, an increase to future distributable cash flows orterminal values would tend to increase the fair value of an infrastructure investment, while an increase in the discount rate would have the opposite effect. Discount rates duringthe year ranged from 7.00% to 15.6% (2019 – ranged from 7.00% to 16.5%). Disclosure of distributable cash flow and terminal value ranges are not meaningful given thedisparity in estimates by project. The significant inputs used in the valuation of the Company’s investments in timberland are timber prices and discount rates. Holding otherfactors constant, an increase to timber prices would tend to increase the fair value of a timberland investment, while an increase in the discount rates would have the oppositeeffect. Discount rates during the year ranged from 5.0% to 7.0% (2019 – ranged from 5.0% to 7.0%). A range of prices for timber is not meaningful as the market price dependson factors such as property location and proximity to markets and export yards.
(3) Segregated funds net assets are measured at fair value. The Company’s Level 3 segregated funds assets are predominantly in investment properties and timberland propertiesvalued as described above.
The following table presents fair value of invested assets not measured at fair value by the fair value hierarchy.
As at December 31, 2020 Carrying value Fair value Level 1 Level 2 Level 3
Mortgages(1) $ 50,207 $ 54,230 $ – $ – $ 54,230Private placements(2) 40,756 47,890 – 41,398 6,492Policy loans(3) 6,398 6,398 – 6,398 –Loans to Bank clients(4) 1,976 1,982 – 1,982 –Real estate–own use property(5) 1,850 3,017 – – 3,017Other invested assets(6) 11,046 11,903 128 – 11,775Total invested assets disclosed at fair value $ 112,233 $ 125,420 $ 128 $ 49,778 $ 75,514
As at December 31, 2019 Carrying value Fair value Level 1 Level 2 Level 3
Mortgages(1) $ 49,376 $ 51,450 $ – $ – $ 51,450Private placements(2) 37,979 41,743 – 36,234 5,509Policy loans(3) 6,471 6,471 – 6,471 –Loans to Bank clients(4) 1,740 1,742 – 1,742 –Real estate–own use property(5) 1,926 3,275 – – 3,275Other invested assets(6) 10,566 11,346 165 – 11,181Total invested assets disclosed at fair value $ 108,058 $ 116,027 $ 165 $ 44,447 $ 71,415(1) Fair value of commercial mortgages is determined through an internal valuation methodology using both observable and unobservable inputs. Unobservable inputs include
credit assumptions and liquidity spread adjustments. Fair value of fixed-rate residential mortgages is determined using the discounted cash flow method. Inputs used forvaluation are primarily comprised of prevailing interest rates and prepayment rates, if applicable. Fair value of variable-rate residential mortgages is assumed to be theircarrying value.
(2) Fair value of private placements is determined through an internal valuation methodology using both observable and unobservable inputs. Unobservable inputs include creditassumptions and liquidity spread adjustments. Private placements are classified within Level 2 unless the liquidity adjustment constitutes a significant price impact, in whichcase the securities are classified as Level 3.
(3) Fair value of policy loans is equal to their unpaid principal balances.(4) Fair value of fixed-rate loans to Bank clients is determined using the discounted cash flow method. Inputs used for valuation are primarily comprised of current interest rates.
Fair value of variable-rate loans is assumed to be their carrying value.(5) Fair value of own use real estate and the fair value hierarchy are determined in accordance with the methodologies described for real estate – investment property in note 1.(6) Primarily include leveraged leases, oil and gas properties and equity method accounted other invested assets. Fair value of leveraged leases is disclosed at their carrying values
as fair value is not routinely calculated on these investments. Fair value for oil and gas properties is determined using external appraisals based on discounted cash flowmethodology. Inputs used in valuation are primarily comprised of forecasted price curves, planned production, as well as capital expenditures, and operating costs. Fair value ofequity method accounted other invested assets is determined using a variety of valuation techniques including discounted cash flows and market comparable approaches.Inputs vary based on the specific investment.
As a result of COVID-19 and the recent economic downturn, significant measurement uncertainty exists in determining the fair value of realestate and other invested assets. For the year ended December 31, 2020, the Company has recognized a reduction in the carrying value ofoil and gas investments of $837 based on reasonable estimates and assumptions reflecting both the nature of the assets and currentlyavailable information which was subject to significant judgment. For the methodologies used in determining carrying values of the investedassets, refer to note 1.
Transfers between Level 1 and Level 2The Company records transfers of assets and liabilities between Level 1 and Level 2 at their fair values as at the end of each reportingperiod. Assets are transferred out of Level 1 when they are no longer transacted with sufficient frequency and volume in an active market.Conversely, assets are transferred from Level 2 to Level 1 when transaction volume and frequency are indicative of an active market. TheCompany had $nil of assets transferred between Level 1 and Level 2 during the years ended December 31, 2020 and 2019.
For segregated funds net assets, the Company had $nil transfers from Level 1 to Level 2 for the year ended December 31, 2020 (2019 –$nil). The Company had $15 transfers from Level 2 to Level 1 for the year ended December 31, 2020 (2019 – $nil).
Invested assets and segregated funds net assets measured at fair value using significant unobservable inputs (Level 3)The Company classifies fair values of invested assets and segregated funds net assets as Level 3 if there are no observable markets forthese assets or, in the absence of active markets, most of the inputs used to determine fair value are based on the Company’s ownassumptions about market participant assumptions. The Company prioritizes the use of market-based inputs over entity-basedassumptions in determining Level 3 fair values. The gains and losses in the table below includes the changes in fair value due to bothobservable and unobservable factors.
131

The following table presents a roll forward for invested assets, derivatives and segregated funds net assets measured at fair value usingsignificant unobservable inputs (Level 3) for the years ended December 31, 2020 and 2019.
For the year endedDecember 31, 2020
Balance,January 1,
2020
Totalgains
(losses)included
in netincome(1)
Totalgains
(losses)included
in AOCI(2) Purchases Sales SettlementsTransfer
in(3),(4)Transferout(3),(4)
Currencymovement
Balance,December 31,
2020
Change inunrealized
gains(losses) onassets still
held
Debt securitiesFVTPLCorporate $ 633 $ 4 $ – $ 54 $ (272) $ (1) $ 151 $ (50) $ (9) $ 510 $ 105Other securitized assets – (8) – – – (1) 55 – (1) 45 –AFSCorporate 15 (6) 2 – – – 5 (13) – 3 –Real estate – investment
property 11,002 (255) – 572 (318) – 47 – (66) 10,982 (300)Other invested assets 18,103 (401) (49) 3,162 (1,076) (638) 92 (3) (141) 19,049 (902)Total invested assets 29,753 (666) (47) 3,788 (1,666) (640) 350 (66) (217) 30,589 (1,097)Derivatives 1,456 2,953 (18) 12 – (1,165) – 342 (137) 3,443 2,033Segregated funds net
assets 4,512 (6) – (84) (149) (26) 2 (3) (44) 4,202 45Total $ 35,721 $ 2,281 $ (65) $ 3,716 $ (1,815) $ (1,831) $ 352 $ 273 $ (398) $ 38,234 $ 981
For the year endedDecember 31, 2019
Balance,January 1,
2019
Totalgains
(losses)included
in netincome(1)
Totalgains
(losses)included
in AOCI(2) Purchases Sales SettlementsTransfer
in(3),(4)Transferout(3),(4)
Currencymovement
Balance,December 31,
2019
Change inunrealized
gains(losses)
on assetsstill held
Debt securitiesFVTPLOther government &
agency $ 180 $ 1 $ – $ 16 $ (18) $ – $ – $ (178) $ (1) $ – $ –Corporate 784 35 – 43 (88) (18) 514 (604) (33) 633 47Residential mortgage-
backed securities 7 – – – (1) – – (6) – – –AFSOther government &
agency 37 1 – 5 (12) – – (31) – – –Corporate 122 1 – 13 (21) (4) – (94) (2) 15 –Commercial mortgage-
backed securities – – – 37 – – – (37) – – –Public equitiesFVTPL 3 1,739 – – (1,679) – – – (63) – 1,510Real estate – investment
property 10,761 506 – 440 (457) – 15 – (263) 11,002 468Other invested assets 17,562 (1,028) 2 3,401 (144) (1,031) 2 – (661) 18,103 (923)Total invested assets 29,456 1,255 2 3,955 (2,420) (1,053) 531 (950) (1,023) 29,753 1,102Derivatives 106 1,884 44 42 – (685) 135 (34) (36) 1,456 1,423Segregated funds net
assets 4,447 148 – 193 (140) (30) – – (106) 4,512 111Total $ 34,009 $ 3,287 $ 46 $ 4,190 $ (2,560) $ (1,768) $ 666 $ (984) $ (1,165) $ 35,721 $ 2,636
132 | 2020 Annual Report | Notes to Consolidated Financial Statements

(1) These amounts are included in net investment income on the Consolidated Statements of Income except for the amount related to segregated funds net assets, where theamount is recorded in changes in segregated funds net assets, refer to note 22.
(2) These amounts are included in AOCI on the Consolidated Statements of Financial Position.(3) The Company uses fair values of the assets at the beginning of the year for assets transferred into and out of Level 3 except for derivatives, refer to footnote 4 below.(4) For derivatives transfer into or out of Level 3, the Company uses fair value at the end of the year and at the beginning of the year, respectively.
Transfers into Level 3 primarily result from securities that were impaired during the year or securities where a lack of observable marketdata (versus the previous period) resulted in reclassifying assets into Level 3. Transfers from Level 3 primarily result from observablemarket data now being available for the entire term structure of the debt security.
Note 4 Derivative and Hedging InstrumentsDerivatives are financial contracts, the value of which is derived from underlying interest rates, foreign exchange rates, other financialinstruments, commodity prices or indices. The Company uses derivatives including swaps, forward and futures agreements, and options tomanage current and anticipated exposures to changes in interest rates, foreign exchange rates, commodity prices and equity marketprices, and to replicate permissible investments.
Swaps are over-the-counter (“OTC”) contractual agreements between the Company and a third party to exchange a series of cash flowsbased upon rates applied to a notional amount. For interest rate swaps, counterparties generally exchange fixed or floating interest ratepayments based on a notional value in a single currency. Cross currency swaps involve the exchange of principal amounts between partiesas well as the exchange of interest payments in one currency for the receipt of interest payments in another currency. Total return swapsare contracts that involve the exchange of payments based on changes in the values of a reference asset, including any returns such asinterest earned on these assets, in return for amounts based on reference rates specified in the contract.
Forward and futures agreements are contractual obligations to buy or sell a financial instrument, foreign currency or other underlyingcommodity on a predetermined future date at a specified price. Forward contracts are OTC contracts negotiated between counterparties,whereas futures agreements are contracts with standard amounts and settlement dates that are traded on regulated exchanges.
Options are contractual agreements whereby the holder has the right, but not the obligation, to buy (call option) or sell (put option) asecurity, exchange rate, interest rate, or other financial instrument at a predetermined price/rate within a specified time.
See variable annuity dynamic hedging strategy in the “Risk Management” section of the Company’s 2020 MD&A for an explanation of theCompany’s dynamic hedging strategy for its variable annuity product guarantees.
(a) Fair value of derivativesThe pricing models used to value OTC derivatives are based on market standard valuation methodologies and the inputs to these modelsare consistent with what a market participant would use when pricing the instruments. Derivative valuations can be affected by changes ininterest rates, currency exchange rates, financial indices, credit spreads, default risk (including the counterparties to the contract), andmarket volatility. The significant inputs to the pricing models for most OTC derivatives are inputs that are observable or can becorroborated by observable market data and are classified as Level 2. Inputs that are observable generally include interest rates, foreigncurrency exchange rates and interest rate curves. However, certain OTC derivatives may rely on inputs that are significant to the fair valuethat are not observable in the market or cannot be derived principally from, or corroborated by, observable market data and thesederivatives are classified as Level 3. Inputs that are unobservable generally include broker quoted prices, volatilities and inputs that areoutside of the observable portion of the interest rate curve or other relevant market measures. These unobservable inputs may involvesignificant management judgment or estimation. Even though unobservable, these inputs are based on assumptions deemed appropriategiven the circumstances and consistent with what market participants would use when pricing such instruments. The Company’s use ofunobservable inputs is limited and the impact on derivative fair values does not represent a material amount as evidenced by the limitedamount of Level 3 derivatives. The credit risk of both the counterparty and the Company are considered in determining the fair value for allOTC derivatives after considering the effects of netting agreements and collateral arrangements.
133

The following table presents gross notional amount and fair value of derivative instruments by the underlying risk exposure.
As at December 31, 2020 2019
Notionalamount
Fair value Notionalamount
Fair value
Type of hedge Instrument type Assets Liabilities Assets Liabilities
Qualifying hedge accounting relationshipsFair value hedges Interest rate swaps $ 82 $ 1 $ – $ 350 $ – $ 5
Foreign currency swaps 57 – 4 86 3 1Cash flow hedges Foreign currency swaps 1,756 24 468 1,790 39 407
Equity contracts 127 6 – 132 16 –Net investment hedges Forward contracts 628 1 10 2,822 7 22Total derivatives in qualifying hedge accounting relationships 2,650 32 482 5,180 65 435Derivatives not designated in qualifying hedge accounting
relationshipsInterest rate swaps 287,182 21,332 12,190 283,172 15,159 8,140Interest rate futures 16,750 – – 13,069 – –Interest rate options 11,622 663 – 12,248 423 –Foreign currency swaps 31,491 838 1,659 26,329 606 1,399Currency rate futures 3,467 – – 3,387 – –Forward contracts 38,853 3,833 565 33,432 2,337 273Equity contracts 15,738 1,092 66 14,582 853 37Credit default swaps 241 3 – 502 6 –Equity futures 10,984 – – 10,576 – –
Total derivatives not designated in qualifying hedge accountingrelationships 416,328 27,761 14,480 397,297 19,384 9,849
Total derivatives $ 418,978 $ 27,793 $ 14,962 $ 402,477 $ 19,449 $ 10,284
The following table presents fair values of derivative instruments by the remaining term to maturity. The fair values disclosed below do notincorporate the impact of master netting agreements. Refer to note 8.
Remaining term to maturity
As at December 31, 2020Less than
1 year1 to 3years
3 to 5years
Over 5years Total
Derivative assets $ 1,656 $ 3,524 $ 1,228 $ 21,385 $ 27,793Derivative liabilities 386 250 555 13,771 14,962
Remaining term to maturity
As at December 31, 2019Less than
1 year1 to 3years
3 to 5years
Over 5years Total
Derivative assets $ 1,248 $ 1,659 $ 1,309 $ 15,233 $ 19,449Derivative liabilities 332 145 218 9,589 10,284
134 | 2020 Annual Report | Notes to Consolidated Financial Statements

The following table presents gross notional amount by the remaining term to maturity, total fair value (including accrued interest), creditrisk equivalent and risk-weighted amount by contract type.
Remaining term to maturity (notional amounts) Fair value Risk-weightedamount(2)As at December 31, 2020
Under 1year 1 to 5 years Over 5 years Total Positive Negative Net
Credit riskequivalent(1)
Interest rate contractsOTC swap contracts $ 7,567 $ 20,852 $ 110,166 $ 138,585 $ 21,803 $ (12,816) $ 8,987 $ 8,773 $ 1,181Cleared swap contracts 2,314 18,784 127,581 148,679 432 (424) 8 – –Forward contracts 11,092 18,355 1,259 30,706 3,739 (462) 3,277 603 80Futures 16,750 – – 16,750 – – – – –Options purchased 1,572 3,922 6,128 11,622 664 – 664 665 93
Subtotal 39,295 61,913 245,134 346,342 26,638 (13,702) 12,936 10,041 1,354Foreign exchange
Swap contracts 1,670 8,490 23,144 33,304 855 (2,195) (1,340) 2,979 327Forward contracts 8,741 34 – 8,775 95 (113) (18) 160 18Futures 3,467 – – 3,467 – – – – –
Credit derivatives 192 49 – 241 3 – 3 – –Equity contracts
Swap contracts 1,227 289 – 1,516 43 (51) (8) 384 46Futures 10,984 – – 10,984 – – – – –Options purchased 8,168 6,181 – 14,349 1,051 (15) 1,036 5,116 664
Subtotal including accruedinterest 73,744 76,956 268,278 418,978 28,685 (16,076) 12,609 18,680 2,409
Less accrued interest – – – – 892 (1,114) (222) – –Total $ 73,744 $ 76,956 $ 268,278 $ 418,978 $ 27,793 $ (14,962) $ 12,831 $ 18,680 $ 2,409
Remaining term to maturity (notional amounts) Fair value Risk-weightedamount(2)As at December 31, 2019
Under 1year 1 to 5 years Over 5 years Total Positive Negative Net
Credit riskequivalent(1)
Interest rate contractsOTC swap contracts $ 5,105 $ 22,288 $ 112,863 $ 140,256 $ 15,627 $ (8,910) $ 6,717 $ 6,891 $ 957Cleared swap contracts 3,932 11,499 127,835 143,266 238 (240) (2) – –Forward contracts 11,709 15,089 1,283 28,081 2,312 (253) 2,059 398 53Futures 13,069 – – 13,069 – – – – –Options purchased 1,266 4,454 6,528 12,248 423 – 423 560 77
Subtotal 35,081 53,330 248,509 336,920 18,600 (9,403) 9,197 7,849 1,087Foreign exchange
Swap contracts 998 7,519 19,688 28,205 642 (1,864) (1,222) 2,515 279Forward contracts 8,173 – – 8,173 32 (42) (10) 138 16Futures 3,387 – – 3,387 – – – – –
Credit derivatives 275 227 – 502 6 – 6 – –Equity contracts
Swap contracts 1,233 164 – 1,397 43 (16) 27 236 29Futures 10,576 – – 10,576 – – – – –Options purchased 6,604 6,633 80 13,317 821 (20) 801 3,418 448
Subtotal including accruedinterest 66,327 67,873 268,277 402,477 20,144 (11,345) 8,799 14,156 1,859
Less accrued interest – – – – 695 (1,061) (366) – –Total $ 66,327 $ 67,873 $ 268,277 $ 402,477 $ 19,449 $ (10,284) $ 9,165 $ 14,156 $ 1,859(1) Credit risk equivalent is the sum of replacement cost and the potential future credit exposure. Replacement cost represents the current cost of replacing all contracts with a
positive fair value. The amounts take into consideration legal contracts that permit offsetting of positions. The potential future credit exposure is calculated based on a formulaprescribed by OSFI.
(2) Risk-weighted amount represents the credit risk equivalent, weighted according to the creditworthiness of the counterparty, as prescribed by OSFI.
The total notional amount of $419 billion (2019 – $402 billion) includes $183 billion (2019 – $128 billion) related to derivatives utilized inthe Company’s variable annuity guarantee dynamic hedging and macro equity risk hedging programs. Due to the Company’s variableannuity hedging practices, a large number of trades are in offsetting positions, resulting in materially lower net fair value exposure to theCompany than what the gross notional amount would suggest.
135

Fair value and the fair value hierarchy of derivative instruments
As at December 31, 2020 Fair value Level 1 Level 2 Level 3
Derivative assetsInterest rate contracts $ 25,735 $ – $ 21,902 $ 3,833Foreign exchange contracts 957 – 957 –Equity contracts 1,098 – 1,051 47Credit default swaps 3 – 3 –
Total derivative assets $ 27,793 $ – $ 23,913 $ 3,880Derivative liabilities
Interest rate contracts $ 12,652 $ – $ 12,271 $ 381Foreign exchange contracts 2,244 – 2,239 5Equity contracts 66 – 15 51
Total derivative liabilities $ 14,962 $ – $ 14,525 $ 437
As at December 31, 2019 Fair value Level 1 Level 2 Level 3
Derivative assetsInterest rate contracts $ 17,894 $ – $ 15,801 $ 2,093Foreign exchange contracts 680 – 680 –Equity contracts 869 – 821 48Credit default swaps 6 – 6 –
Total derivative assets $ 19,449 $ – $ 17,308 $ 2,141Derivative liabilities
Interest rate contracts $ 8,397 $ – $ 7,730 $ 667Foreign exchange contracts 1,850 – 1,849 1Equity contracts 37 – 20 17
Total derivative liabilities $ 10,284 $ – $ 9,599 $ 685
Level 3 roll forward information for net derivative contracts measured using significant unobservable inputs is disclosed in note 3(g).
(b) Hedging relationshipsThe Company uses derivatives for economic hedging purposes. In certain circumstances, these hedges also meet the requirements ofhedge accounting. Risk management strategies eligible for hedge accounting are designated as fair value hedges, cash flow hedges or netinvestment hedges, as described below.
Fair value hedgesThe Company uses interest rate swaps to manage its exposure to changes in the fair value of fixed rate financial instruments due tochanges in interest rates. The Company also uses cross currency swaps to manage its exposure to foreign exchange rate fluctuations,interest rate fluctuations, or both.
The Company recognizes gains and losses on derivatives and the related hedged items in fair value hedges in investment income. Theseinvestment gains (losses) are shown in the following table.
For the year ended December 31, 2020
Hedged items in qualifyingfair value hedgingrelationships
Gains (losses)recognized on
derivatives
Gains (losses)recognized forhedged items
Ineffectivenessrecognized in
investmentincome
Interest rate swaps Fixed rate liabilities $ 4 $ (2) $ 2Foreign currency swaps Fixed rate assets (2) 3 1Total $ 2 $ 1 $ 3
For the year ended December 31, 2019
Hedged items in qualifyingfair value hedgingrelationships
Gains (losses)recognized on
derivatives
Gains (losses)recognized forhedged items
Ineffectivenessrecognized in
investmentincome
Interest rate swaps Fixed rate liabilities $ 8 $ (6) $ 2Foreign currency swaps Fixed rate assets (1) 2 1Total $ 7 $ (4) $ 3
Cash flow hedgesThe Company uses interest rate swaps to hedge the variability in cash flows from variable rate financial instruments and forecastedtransactions. The Company also uses cross currency swaps and foreign currency forward contracts to hedge the variability from foreigncurrency financial instruments and foreign currency expenses. Total return swaps are used to hedge the variability in cash flows
136 | 2020 Annual Report | Notes to Consolidated Financial Statements

associated with certain stock-based compensation awards. Inflation swaps are used to reduce inflation risk generated from inflation-indexed liabilities.
The effects of derivatives in cash flow hedging relationships on the Consolidated Statements of Income and the Consolidated Statementsof Comprehensive Income are shown in the following table.
For the year ended December 31, 2020
Hedged items in qualifyingcash flow hedgingrelationships
Gains (losses)deferred in
AOCI onderivatives
Gains (losses)reclassified
from AOCI intoinvestment
income
Ineffectivenessrecognized in
investmentincome
Foreign currency swaps Fixed rate assets $ 1 $ – $ –Floating rate liabilities (64) 14 –Fixed rate liabilities (14) (2) –
Equity contracts Stock-based compensation (2) 16 –Total $ (79) $ 28 $ –
For the year ended December 31, 2019
Hedged items in qualifyingcash flow hedgingrelationships
Gains (losses)deferred in
AOCI onderivatives
Gains (losses)reclassified
from AOCI intoinvestment
income
Ineffectivenessrecognized in
investmentincome
Foreign currency swaps Fixed rate assets $ (2) $ 1 $ –Floating rate liabilities (40) 37 –Fixed rate liabilities (41) (35) –
Forward contracts Forecasted expenses – (9) –Equity contracts Stock-based compensation 35 (9) –Total $ (48) $ (15) $ –
The Company anticipates that net losses of approximately $11 will be reclassified from AOCI to net income within the next 12 months. Themaximum time frame for which variable cash flows are hedged is 16 years.
Hedges of net investments in foreign operationsThe Company primarily uses forward currency contracts, cross currency swaps and non-functional currency denominated debt to manageits foreign currency exposures to net investments in foreign operations.
The effects of net investment hedging relationships on the Consolidated Statements of Income and the Consolidated Statements of OtherComprehensive Income are shown in the following table.
For the year ended December 31, 2020Gains (losses)
deferred in AOCI
Gains (losses)reclassified from
AOCI intoinvestment income
Ineffectivenessrecognized in
investmentincome
Non-functional currency denominated debt $ 161 $ – $ –Forward contracts (53) – –Total $ 108 $ – $ –
For the year ended December 31, 2019Gains (losses)
deferred in AOCI
Gains (losses)reclassified from
AOCI intoinvestment income
Ineffectivenessrecognized in
investmentincome
Non-functional currency denominated debt $ 279 $ – $ –Forward contracts 80 – –Total $ 359 $ – $ –
(c) Derivatives not designated in qualifying hedge accounting relationshipsDerivatives used in portfolios supporting insurance contract liabilities are generally not designated in qualifying hedge accountingrelationships because the change in the value of the insurance contract liabilities economically hedged by these derivatives is recordedthrough net income. Since changes in fair value of these derivatives and related hedged risks are recognized in investment income as theyoccur, they generally offset the change in hedged risk to the extent the hedges are economically effective. Interest rate and cross currencyswaps are used in the portfolios supporting insurance contract liabilities to manage duration and currency risks.
137
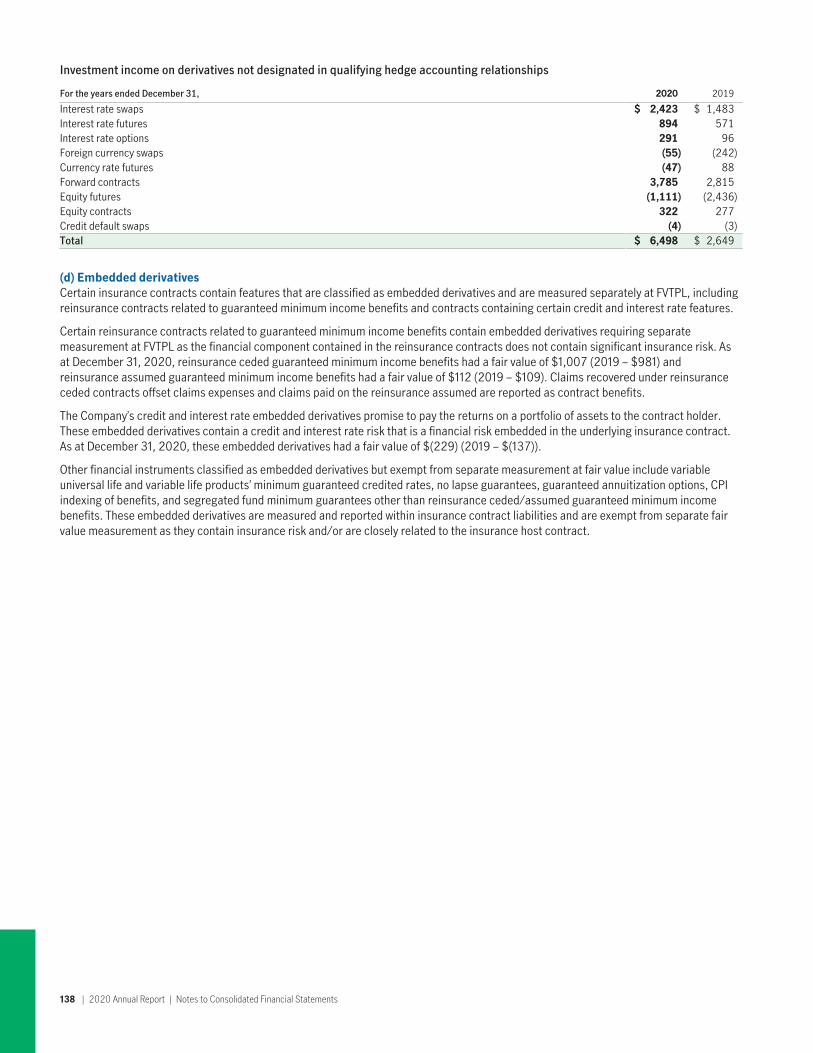
Investment income on derivatives not designated in qualifying hedge accounting relationships
For the years ended December 31, 2020 2019
Interest rate swaps $ 2,423 $ 1,483Interest rate futures 894 571Interest rate options 291 96Foreign currency swaps (55) (242)Currency rate futures (47) 88Forward contracts 3,785 2,815Equity futures (1,111) (2,436)Equity contracts 322 277Credit default swaps (4) (3)Total $ 6,498 $ 2,649
(d) Embedded derivativesCertain insurance contracts contain features that are classified as embedded derivatives and are measured separately at FVTPL, includingreinsurance contracts related to guaranteed minimum income benefits and contracts containing certain credit and interest rate features.
Certain reinsurance contracts related to guaranteed minimum income benefits contain embedded derivatives requiring separatemeasurement at FVTPL as the financial component contained in the reinsurance contracts does not contain significant insurance risk. Asat December 31, 2020, reinsurance ceded guaranteed minimum income benefits had a fair value of $1,007 (2019 – $981) andreinsurance assumed guaranteed minimum income benefits had a fair value of $112 (2019 – $109). Claims recovered under reinsuranceceded contracts offset claims expenses and claims paid on the reinsurance assumed are reported as contract benefits.
The Company’s credit and interest rate embedded derivatives promise to pay the returns on a portfolio of assets to the contract holder.These embedded derivatives contain a credit and interest rate risk that is a financial risk embedded in the underlying insurance contract.As at December 31, 2020, these embedded derivatives had a fair value of $(229) (2019 – $(137)).
Other financial instruments classified as embedded derivatives but exempt from separate measurement at fair value include variableuniversal life and variable life products’ minimum guaranteed credited rates, no lapse guarantees, guaranteed annuitization options, CPIindexing of benefits, and segregated fund minimum guarantees other than reinsurance ceded/assumed guaranteed minimum incomebenefits. These embedded derivatives are measured and reported within insurance contract liabilities and are exempt from separate fairvalue measurement as they contain insurance risk and/or are closely related to the insurance host contract.
138 | 2020 Annual Report | Notes to Consolidated Financial Statements

Note 5 Goodwill and Intangible Assets(a) Change in the carrying value of goodwill and intangible assetsThe following table presents the change in carrying value of goodwill and intangible assets.
As at December 31, 2020Balance,
January 1Net additions/
(disposals)Amortization
expense
Effect of changesin foreign
exchange ratesBalance,
December 31
Goodwill $ 5,743 $ (5) $ n/a $ (24) $ 5,714Indefinite life intangible assets
Brand 779 – n/a (15) 764Fund management contracts and other(1) 805 (2) n/a (7) 796
1,584 (2) n/a (22) 1,560Finite life intangible assets(2)
Distribution networks 801 59 42 (12) 806Customer relationships 795 – 54 (3) 738Software 991 262 189 (5) 1,059Other 61 (9) 4 4 52
2,648 312 289 (16) 2,655Total intangible assets 4,232 310 289 (38) 4,215Total goodwill and intangible assets $ 9,975 $ 305 $ 289 $ (62) $ 9,929
As at December 31, 2019Balance,
January 1Net additions/
(disposals)Amortization
expense
Effect of changesin foreign
exchange ratesBalance,
December 31
Goodwill $ 5,864 $ (6) $ n/a $ (115) $ 5,743Indefinite life intangible assets
Brand 819 – n/a (40) 779Fund management contracts and other(1) 798 32 n/a (25) 805
1,617 32 n/a (65) 1,584Finite life intangible assets(2)
Distribution networks 868 6 44 (29) 801Customer relationships 860 (2) 54 (9) 795Software 821 357 168 (19) 991Other 67 – 5 (1) 61
2,616 361 271 (58) 2,648Total intangible assets 4,233 393 271 (123) 4,232Total goodwill and intangible assets $ 10,097 $ 387 $ 271 $ (238) $ 9,975(1) Fund management contracts were mostly allocated to Canada WAM and U.S. WAM CGUs with the carrying values of $273 (2019 – $273) and $373 (2019 – $380),
respectively.(2) Gross carrying amount of finite life intangible assets was $1,332 for distribution networks, $1,130 for customer relationships, $2,310 for software and $123 for other (2019 –
$1,292, $1,133, $2,239 and $130), respectively.
(b) Goodwill impairment testingThe Company completed its annual goodwill impairment testing in the fourth quarter of 2020 by determining the recoverable amounts ofits businesses using valuation techniques discussed below (refer to notes 1(f) and 5(c)). The review indicated that there was no impairmentof goodwill in 2020 (2019 – $nil).
139

The following tables present the carrying value of goodwill by CGU or group of CGUs.
As at December 31, 2020CGU or group of CGUs
Balance,January 1,
Net additions/(disposals)
Effect ofchanges in
foreignexchange
ratesBalance,
December 31,
AsiaAsia Insurance (excluding Japan) $ 159 $ – $ – $ 159Japan Insurance 420 – 13 433
Canada Insurance 1,957 – (2) 1,955U.S. Insurance 349 (5) (6) 338Global Wealth and Asset Management
Asia WAM 187 – (2) 185Canada WAM 1,436 – – 1,436U.S. WAM 1,235 – (27) 1,208
Total $ 5,743 $ (5) $ (24) $ 5,714
As at December 31, 2019CGU or group of CGUs
Balance,January 1,
Net additions/(disposals)
Effect ofchanges in
foreignexchange
ratesBalance,
December 31,
AsiaAsia Insurance (excluding Japan) $ 165 $ – $ (6) $ 159Japan Insurance 435 – (15) 420
Canada Insurance 1,962 – (5) 1,957U.S. Insurance 367 – (18) 349Global Wealth and Asset Management
Asia WAM 196 – (9) 187Canada WAM 1,436 – – 1,436U.S. WAM 1,303 (6) (62) 1,235
Total $ 5,864 $ (6) $ (115) $ 5,743
The valuation techniques, significant assumptions and sensitivities, where applicable, applied in the goodwill impairment testing aredescribed below.
(c) Valuation techniquesWhen determining if a CGU is impaired, the Company compares its recoverable amount to the allocated capital for that unit, which isaligned with the Company’s internal reporting practices. The recoverable amounts were based on fair value less costs to sell (“FVLCS”) forAsia Insurance (excluding Japan) and Asia WAM. For other CGUs, value-in-use (“VIU”) was used.
Under the FVLCS approach, the Company determines the fair value of the CGU or group of CGUs using an earnings-based approach whichincorporates forecasted earnings, excluding interest and equity market impacts and normalized new business expenses multiplied by anearnings-multiple derived from the observable price-to-earnings multiples of comparable financial institutions. The price-to-earningsmultiple used by the Company for testing was 10.7 (2019 – 10.3). These FVLCS valuations are categorized as Level 3 of the fair valuehierarchy (2019 – Level 3).
Under the VIU approach, used for CGUs with insurance business, an embedded appraisal value is determined from a projection of futuredistributable earnings derived from both the in-force business and new business expected to be sold in the future, and therefore, reflectsthe economic value for each CGU’s or group of CGUs’ profit potential under a set of assumptions. This approach requires assumptionsincluding sales and revenue growth rates, capital requirements, interest rates, equity returns, mortality, morbidity, policyholder behaviour,tax rates and discount rates. For non-insurance CGUs, the VIU is based on discounted cash flow analysis which incorporates relevantaspects of the embedded appraisal value approach.
(d) Significant assumptionsTo calculate embedded appraisal value, the Company discounted projected earnings from in-force contracts and valued 20 years of newbusiness growing at expected plan levels, consistent with the periods used for forecasting long-term businesses such as insurance. Inarriving at its projections, the Company considered past experience, economic trends such as interest rates, equity returns and productmix as well as industry and market trends. Where growth rate assumptions for new business cash flows were used in the embeddedappraisal value calculations, they ranged from zero per cent to 10 per cent (2019 – zero per cent to 20 per cent).
Interest rate assumptions are based on prevailing market rates at the valuation date.
140 | 2020 Annual Report | Notes to Consolidated Financial Statements

Tax rates applied to the projections include the impact of internal reinsurance treaties and amounted to 28.0 per cent, 26.5 per cent and21.0 per cent (2019 – 28.0 per cent, 26.5 per cent and 21.0 per cent) for the Japan, Canada and U.S. jurisdictions, respectively. Taxassumptions are sensitive to changes in tax laws as well as assumptions about the jurisdictions in which profits are earned. It is possiblethat actual tax rates could differ from those assumed.
Discount rates assumed in determining the value-in-use for applicable CGUs or group of CGUs ranged from 8.0 per cent to 10.0 per centon an after-tax basis or 10.0 per cent to 12.5 per cent on a pre-tax basis (2019 – 7.5 per cent to 10.0 per cent on an after-tax basis or9.4 per cent to 12.5 per cent on a pre-tax basis).
Key assumptions may change as economic and market conditions change, which may lead to impairment charges in the future. Adversechanges in discount rates (including from decline in interest rates) and growth rate assumptions for new business cash flow projectionsused in the determination of embedded appraisal values or reductions in market-based earnings multiples calculations may result inimpairment charges in the future which could be material.
Note 6 Insurance Contract Liabilities and Reinsurance Assets(a) Insurance contract liabilities and reinsurance assetsInsurance contract liabilities are reported gross of reinsurance ceded and the ceded liabilities are reported separately as reinsuranceassets. Insurance contract liabilities include actuarial liabilities, benefits payable, provision for unreported claims and policyholderamounts on deposit. The components of gross and net insurance contract liabilities are shown below.As at December 31, 2020 2019
Insurance contract liabilities $ 369,230 $ 336,156Benefits payable and provision for unreported claims 4,837 4,229Policyholder amounts on deposit 11,487 10,776Gross insurance contract liabilities 385,554 351,161Reinsurance assets(1) (45,769) (41,353)Net insurance contract liabilities $ 339,785 $ 309,808(1) Reinsurance assets of $67 (2019 – $93) are related to investment contract liabilities, refer to note 7(b).
Net insurance contract liabilities represent the amount which, together with estimated future premiums and net investment income, will besufficient to pay estimated future benefits, policyholder dividends and refunds, taxes (other than income taxes) and expenses on policiesin-force net of reinsurance premiums and recoveries.
Net insurance contract liabilities are determined using CALM, as required by the Canadian Institute of Actuaries.
The determination of net insurance contract liabilities is based on an explicit projection of cash flows using current assumptions for eachmaterial cash flow item. Investment returns are projected using the current asset portfolios and projected reinvestment strategies.
Each assumption is based on the best estimate, adjusted by a margin for adverse deviation. For fixed income returns, this margin isestablished by scenario testing a range of prescribed and company-developed scenarios consistent with Canadian Actuarial Standards ofPractice. For all other assumptions, this margin is established by directly adjusting the best estimate assumption.
Cash flows used in the net insurance contract liabilities valuation adjust the gross policy cash flows to reflect projected cash flows fromceded reinsurance. The cash flow impact of ceded reinsurance varies depending upon the amount of reinsurance, the structure ofreinsurance treaties, the expected economic benefit from treaty cash flows and the impact of margins for adverse deviation. Grossinsurance contract liabilities are determined by discounting gross policy cash flows using the same discount rate as the net CALM modeldiscount rate.
The reinsurance asset is determined by taking the difference between the gross insurance contract liabilities and the net insurancecontract liabilities. The reinsurance asset represents the benefit derived from reinsurance arrangements in force at the date of theConsolidated Statements of Financial Position.
The period used for the projection of cash flows is the policy lifetime for most individual insurance contracts. For other types of contracts, ashorter projection period may be used, with the contract generally ending at the earlier of the first renewal date on or after theConsolidated Statements of Financial Position date where the Company can exercise discretion in renewing its contractual obligations orterms of those obligations and the renewal or adjustment date that maximizes the insurance contract liabilities. For segregated fundproducts with guarantees, the projection period is generally set as the period that leads to the largest insurance contract liability. Wherethe projection period is less than the policy lifetime, insurance contract liabilities may be reduced by an allowance for acquisition expensesexpected to be recovered from policy cash flows beyond the projection period used for the liabilities. Such allowances are tested forrecoverability using assumptions that are consistent with other components of the actuarial valuation.
141

(b) CompositionThe composition of insurance contract liabilities and reinsurance assets by the line of business and reporting segment is as follows.
Gross insurance contract liabilities
Individual insurance Annuitiesand
pensions
Otherinsurance
contractliabilities(1)
Total, net ofreinsurance
ceded
Totalreinsurance
ceded
Total,gross of
reinsurancecededAs at December 31, 2020 Participating
Non-participating
Asia $ 55,262 $ 36,930 $ 7,114 $ 3,652 $ 102,958 $ 2,127 $ 105,085Canada 12,796 44,468 18,462 14,620 90,346 443 90,789U.S. 8,422 68,001 16,292 54,224 146,939 42,875 189,814Corporate and Other – (684) 34 192 (458) 324 (134)Total, net of reinsurance ceded 76,480 148,715 41,902 72,688 339,785 $ 45,769 $ 385,554Total reinsurance ceded 8,780 19,944 16,065 980 45,769Total, gross of reinsurance ceded $ 85,260 $ 168,659 $ 57,967 $ 73,668 $ 385,554
Individual insurance Annuitiesand
pensions
Otherinsurance
contractliabilities(1)
Total, net ofreinsurance
ceded
Totalreinsurance
ceded
Total,gross of
reinsurancecededAs at December 31, 2019 Participating
Non-participating
Asia $ 46,071 $ 32,887 $ 5,915 $ 3,064 $ 87,937 $ 1,432 $ 89,369Canada 12,012 39,655 17,871 13,759 83,297 286 83,583U.S. 8,734 66,163 14,763 49,199 138,859 39,411 178,270Corporate and Other – (609) 36 288 (285) 224 (61)Total, net of reinsurance ceded 66,817 138,096 38,585 66,310 309,808 $ 41,353 $ 351,161Total reinsurance ceded 9,869 13,588 16,850 1,046 41,353Total, gross of reinsurance ceded $ 76,686 $ 151,684 $ 55,435 $ 67,356 $ 351,161(1) Other insurance contract liabilities include group insurance and individual and group health including long-term care insurance.
Separate sub-accounts were established for participating policies in-force at the demutualization of MLI and John Hancock Mutual LifeInsurance Company. These sub-accounts permit this participating business to be operated as separate “closed blocks” of participatingpolicies. As at December 31, 2020, $29,480 (2019 – $29,402) of both reinsurance assets and insurance contract liabilities were relatedto these closed blocks of participating policies.
(c) Assets backing insurance contract liabilities, other liabilities and capitalAssets are segmented and matched to liabilities with similar underlying characteristics by product line and major currency. The Companyhas established target investment strategies and asset mixes for each asset segment supporting insurance contract liabilities whichconsider the risk attributes of the liabilities supported by the assets and expectations of market performance. Liabilities with rate and termguarantees are predominantly backed by fixed-rate instruments on a cash flow matching basis for a targeted duration horizon. Longerduration cash flows on these liabilities as well as on adjustable products such as participating life insurance are backed by a broader rangeof asset classes, including equity and alternative long-duration investments. The Company’s capital is invested in a range of debt andequity investments, both public and private.
Changes in the fair value of assets backing net insurance contract liabilities, that the Company considers to be other than temporary,would have a limited impact on the Company’s net income wherever there is an effective matching of assets and liabilities, as thesechanges would be substantially offset by corresponding changes in the value of net insurance contract liabilities. The fair value of assetsbacking net insurance contract liabilities as at December 31, 2020, excluding reinsurance assets, was estimated at $350,264(2019 – $315,952).
As at December 31, 2020, the fair value of assets backing capital and other liabilities was estimated at $543,273 (2019 – $501,147).
142 | 2020 Annual Report | Notes to Consolidated Financial Statements

The following table presents the carrying value of assets backing net insurance contract liabilities, other liabilities and capital.
Individual insurance
Annuitiesand pensions
Other insurancecontract
liabilities(1)Other
liabilities(2) Capital(3) TotalAs at December 31, 2020 ParticipatingNon-
participating
AssetsDebt securities $ 39,523 $ 81,548 $ 20,936 $ 34,725 $ 8,872 $ 33,121 $ 218,725Public equities 12,365 6,971 461 310 402 3,213 23,722Mortgages 3,069 12,536 4,923 8,315 21,338 26 50,207Private placements 5,549 17,276 7,499 9,439 817 176 40,756Real estate 3,385 6,466 1,027 1,697 57 200 12,832Other 12,589 23,918 7,056 18,202 448,014 24,328 534,107Total $ 76,480 $ 148,715 $ 41,902 $ 72,688 $ 479,500 $ 61,064 $ 880,349
Individual insurance
Annuitiesand pensions
Other insurancecontract
liabilities(1)Other
liabilities(2) Capital(3) TotalAs at December 31, 2019 ParticipatingNon-
participating
AssetsDebt securities $ 34,169 $ 74,113 $ 19,865 $ 31,620 $ 8,828 $ 29,527 $ 198,122Public equities 10,907 6,453 204 253 381 4,653 22,851Mortgages 2,921 12,140 5,203 7,916 21,165 31 49,376Private placements 4,658 16,020 6,957 9,122 1,090 132 37,979Real estate 3,336 6,446 1,082 1,731 113 220 12,928Other 10,826 22,924 5,274 15,668 410,376 22,806 487,874Total $ 66,817 $ 138,096 $ 38,585 $ 66,310 $ 441,953 $ 57,369 $ 809,130(1) Other insurance contract liabilities include group insurance and individual and group health including long-term care insurance.(2) Other liabilities are non-insurance contract liabilities which include segregated funds, bank deposits, long-term debt, deferred tax liabilities, derivatives, investment contracts,
embedded derivatives and other miscellaneous liabilities.(3) Capital is defined in note 12.
(d) Significant insurance contract liability valuation assumptionsThe determination of insurance contract liabilities involves the use of estimates and assumptions. Insurance contract liabilities have twomajor components: a best estimate amount and a provision for adverse deviation.
Best estimate assumptionsBest estimate assumptions are made with respect to mortality and morbidity, investment returns, rates of policy termination, operatingexpenses and certain taxes. Actual experience is monitored to ensure that assumptions remain appropriate and assumptions are changedas warranted. Assumptions are discussed in more detail in the following table.
Nature of factor and assumption methodology Risk management
Mortalityandmorbidity
Mortality relates to the occurrence of death. Mortality is a keyassumption for life insurance and certain forms of annuities.Mortality assumptions are based on the Company’s internalexperience as well as past and emerging industry experience.Assumptions are differentiated by sex, underwriting class, policytype and geographic market. Assumptions are made for futuremortality improvements.
Morbidity relates to the occurrence of accidents and sicknessfor insured risks. Morbidity is a key assumption for long-termcare insurance, disability insurance, critical illness and otherforms of individual and group health benefits. Morbidityassumptions are based on the Company’s internal experience aswell as past and emerging industry experience and areestablished for each type of morbidity risk and geographicmarket. Assumptions are made for future morbidityimprovements.
The Company maintains underwriting standards to determinethe insurability of applicants. Claim trends are monitored on anongoing basis. Exposure to large claims is managed byestablishing policy retention limits, which vary by market andgeographic location. Policies in excess of the limits arereinsured with other companies.
Mortality is monitored monthly and the overall 2020 experiencewas unfavourable (2019 – unfavourable) when compared to theCompany’s assumptions. Morbidity is also monitored monthlyand the overall 2020 experience was favourable (2019 –unfavourable) when compared to the Company’s assumptions.
143

Nature of factor and assumption methodology Risk management
Investmentreturns
The Company segments assets to support liabilities by businesssegment and geographic market and establishes investmentstrategies for each liability segment. Projected cash flows fromthese assets are combined with projected cash flows from futureasset purchases/sales to determine expected rates of return onthese assets for future years. Investment strategies are basedon the target investment policies for each segment and thereinvestment returns are derived from current and projectedmarket rates for fixed income investments and a projectedoutlook for other alternative long-duration assets.
Investment return assumptions include expected future assetcredit losses on fixed income investments. Credit losses areprojected based on past experience of the Company andindustry as well as specific reviews of the current investmentportfolio.
Investment return assumptions for each asset class andgeographic market also incorporate expected investmentmanagement expenses that are derived from internal coststudies. The costs are attributed to each asset class to developunitized assumptions per dollar of asset for each asset class andgeographic market.
The Company’s policy of closely matching asset cash flows withthose of the corresponding liabilities is designed to mitigate theCompany’s exposure to future changes in interest rates. Theinterest rate risk positions in business segments are monitoredon an ongoing basis. Under CALM, the reinvestment rate isdeveloped using interest rate scenario testing and reflects theinterest rate risk positions.
In 2020, the movement in interest rates negatively (2019 –negatively) impacted the Company’s net income. This negativeimpact was driven by decreases in risk free interest rates andcorporate spreads, as well the impact of swap spreads on policyliabilities.
The exposure to credit losses is managed against policies thatlimit concentrations by issuer, corporate connections, ratings,sectors and geographic regions. On participating policies andsome non-participating policies, credit loss experience ispassed back to policyholders through the investment returncrediting formula. For other policies, premiums and benefitsreflect the Company’s assumed level of future credit losses atcontract inception or most recent contract adjustment date. TheCompany holds explicit provisions in actuarial liabilities forcredit risk including provisions for adverse deviation.
In 2020, credit loss experience on debt securities andmortgages was unfavourable (2019 – favourable) whencompared to the Company’s assumptions.
Equities, real estate and other alternative long-duration assetsare used to support liabilities where investment returnexperience is passed back to policyholders through dividends orcredited investment return adjustments. Equities, real estate, oiland gas and other alternative long-duration assets are also usedto support long-dated obligations in the Company’s annuity andpension businesses and for long-dated insurance obligations oncontracts where the investment return risk is borne by theCompany.
In 2020, investment experience on alternative long-durationassets backing policyholder liabilities was unfavourable (2019 –favourable) primarily due to losses in real estate properties, andprivate equities, timber and agriculture properties as well as inoil and gas properties. In 2020, alternative long-duration assetorigination did not exceed (2019 – exceeded) valuationrequirements.
In 2020, for the business that is dynamically hedged,segregated fund guarantee experience on residual,non-dynamically hedged market risks were unfavourable (2019– favourable). For the business that is not dynamically hedged,experience on segregated fund guarantees due to changes inthe market value of assets under management was alsounfavourable (2019 – favourable). This excludes the experienceon the macro equity hedges.
In 2020, investment expense experience was unfavourable(2019 – unfavourable) when compared to the Company’sassumptions.
144 | 2020 Annual Report | Notes to Consolidated Financial Statements
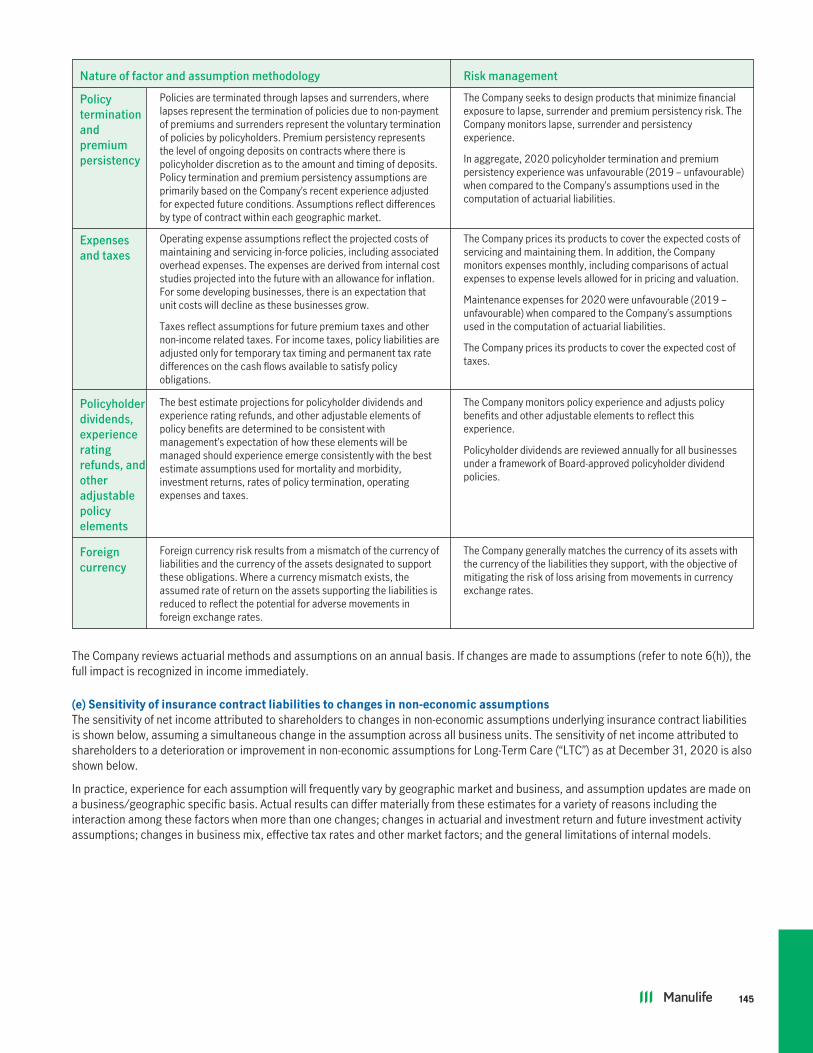
Nature of factor and assumption methodology Risk management
Policyterminationandpremiumpersistency
Policies are terminated through lapses and surrenders, wherelapses represent the termination of policies due to non-paymentof premiums and surrenders represent the voluntary terminationof policies by policyholders. Premium persistency representsthe level of ongoing deposits on contracts where there ispolicyholder discretion as to the amount and timing of deposits.Policy termination and premium persistency assumptions areprimarily based on the Company’s recent experience adjustedfor expected future conditions. Assumptions reflect differencesby type of contract within each geographic market.
The Company seeks to design products that minimize financialexposure to lapse, surrender and premium persistency risk. TheCompany monitors lapse, surrender and persistencyexperience.
In aggregate, 2020 policyholder termination and premiumpersistency experience was unfavourable (2019 – unfavourable)when compared to the Company’s assumptions used in thecomputation of actuarial liabilities.
Expensesand taxes
Operating expense assumptions reflect the projected costs ofmaintaining and servicing in-force policies, including associatedoverhead expenses. The expenses are derived from internal coststudies projected into the future with an allowance for inflation.For some developing businesses, there is an expectation thatunit costs will decline as these businesses grow.
Taxes reflect assumptions for future premium taxes and othernon-income related taxes. For income taxes, policy liabilities areadjusted only for temporary tax timing and permanent tax ratedifferences on the cash flows available to satisfy policyobligations.
The Company prices its products to cover the expected costs ofservicing and maintaining them. In addition, the Companymonitors expenses monthly, including comparisons of actualexpenses to expense levels allowed for in pricing and valuation.
Maintenance expenses for 2020 were unfavourable (2019 –unfavourable) when compared to the Company’s assumptionsused in the computation of actuarial liabilities.
The Company prices its products to cover the expected cost oftaxes.
Policyholderdividends,experienceratingrefunds, andotheradjustablepolicyelements
The best estimate projections for policyholder dividends andexperience rating refunds, and other adjustable elements ofpolicy benefits are determined to be consistent withmanagement’s expectation of how these elements will bemanaged should experience emerge consistently with the bestestimate assumptions used for mortality and morbidity,investment returns, rates of policy termination, operatingexpenses and taxes.
The Company monitors policy experience and adjusts policybenefits and other adjustable elements to reflect thisexperience.
Policyholder dividends are reviewed annually for all businessesunder a framework of Board-approved policyholder dividendpolicies.
Foreigncurrency
Foreign currency risk results from a mismatch of the currency ofliabilities and the currency of the assets designated to supportthese obligations. Where a currency mismatch exists, theassumed rate of return on the assets supporting the liabilities isreduced to reflect the potential for adverse movements inforeign exchange rates.
The Company generally matches the currency of its assets withthe currency of the liabilities they support, with the objective ofmitigating the risk of loss arising from movements in currencyexchange rates.
The Company reviews actuarial methods and assumptions on an annual basis. If changes are made to assumptions (refer to note 6(h)), thefull impact is recognized in income immediately.
(e) Sensitivity of insurance contract liabilities to changes in non-economic assumptionsThe sensitivity of net income attributed to shareholders to changes in non-economic assumptions underlying insurance contract liabilitiesis shown below, assuming a simultaneous change in the assumption across all business units. The sensitivity of net income attributed toshareholders to a deterioration or improvement in non-economic assumptions for Long-Term Care (“LTC”) as at December 31, 2020 is alsoshown below.
In practice, experience for each assumption will frequently vary by geographic market and business, and assumption updates are made ona business/geographic specific basis. Actual results can differ materially from these estimates for a variety of reasons including theinteraction among these factors when more than one changes; changes in actuarial and investment return and future investment activityassumptions; changes in business mix, effective tax rates and other market factors; and the general limitations of internal models.
145

Potential impact on net income attributed to shareholders arising from changes to non-economic assumptions(1)
As at December 31,
Decrease in net incomeattributed to shareholders
2020 2019
Policy related assumptions2% adverse change in future mortality rates(2),(4)
Products where an increase in rates increases insurance contract liabilities $ (500) $ (500)Products where a decrease in rates increases insurance contract liabilities (600) (500)
5% adverse change in future morbidity rates (incidence and termination)(3),(4),(5) (5,700) (5,100)10% adverse change in future policy termination rates(4) (2,600) (2,400)5% increase in future expense levels (600) (600)(1) The participating policy funds are largely self-supporting and generate no material impact on net income attributed to shareholders as a result of changes in non-economic
assumptions. Experience gains or losses would generally result in changes to future dividends, with no direct impact to shareholders.(2) An increase in mortality rates will generally increase policy liabilities for life insurance contracts whereas a decrease in mortality rates will generally increase policy liabilities for
policies with longevity risk such as payout annuities.(3) No amounts related to morbidity risk are included for policies where the policy liability provides only for claims costs expected over a short period, generally less than one year,
such as Group Life and Health.(4) The impacts of the adverse sensitivities on LTC for morbidity, mortality and lapse do not assume any partial offsets from the Company’s ability to contractually raise premium
rates in such events, subject to state regulatory approval. In practice, the Company would plan to file for rate increases equal to the amount of deterioration resulting from thesensitivities.
(5) 5% deterioration in incidence rates and 5% deterioration in claim termination rates.
Potential impact on net income attributed to shareholders arising from changes to non-economic assumptions for Long-Term Careincluded in the above table(1),(2)
As at December 31,
Decrease in net incomeattributed to shareholders
2020 2019
Policy related assumptions2% adverse change in future mortality rates $ (300) $ (300)5% adverse change in future morbidity incidence rates(3) (2,100) (1,900)5% adverse change in future morbidity claims termination rates(3) (3,100) (2,800)10% adverse change in future policy termination rates (400) (400)5% increase in future expense levels (100) (100)(1) The impacts of the adverse sensitivities on LTC for morbidity, mortality and lapse do not assume any partial offsets from the Company’s ability to contractually raise premium
rates in such events, subject to state regulatory approval. In practice, the Company would plan to file for rate increases equal to the amount of deterioration resulting from thesensitivities.
(2) The impact of favourable changes to all the sensitivities is relatively symmetrical.(3) The comparatives for 2019 have been updated to reflect refinements between incidence and termination impacts implemented in 2020.
(f) Provision for adverse deviation assumptionsThe assumptions made in establishing insurance contract liabilities reflect expected best estimates of future experience. To recognize theuncertainty in these best estimate assumptions, to allow for possible misestimation of and deterioration in experience and to provide agreater degree of assurance that the insurance contract liabilities are adequate to pay future benefits, the Appointed Actuary is required toinclude a margin in each assumption.
Margins are released into future earnings as the policy is released from risk. Margins for interest rate risk are included by testing a numberof scenarios of future interest rates. The margin can be established by testing a limited number of scenarios, some of which are prescribedby the Canadian Actuarial Standards of Practice, and determining the liability based on the worst outcome. Alternatively, the margin canbe set by testing many scenarios, which are developed according to actuarial guidance. Under this approach the liability would be theaverage of the outcomes above a percentile in the range prescribed by the Canadian Actuarial Standards of Practice.
Specific guidance is also provided for other risks such as market, credit, mortality and morbidity risks. For other risks which are notspecifically addressed by the Canadian Institute of Actuaries, a range is provided of five per cent to 20 per cent of the expected experienceassumption. The Company uses assumptions within the permissible ranges, with the determination of the level set considering the riskprofile of the business. On occasion, in specific circumstances for additional prudence, a margin may exceed the high end of the range,which is permissible under the Canadian Actuarial Standards of Practice. This additional margin would be released if the specificcircumstances which led to it being established were to change.
Each margin is reviewed annually for continued appropriateness.
146 | 2020 Annual Report | Notes to Consolidated Financial Statements

(g) Change in insurance contract liabilitiesThe change in insurance contract liabilities was a result of the following business activities and changes in actuarial estimates.
For the year ended December 31, 2020Net actuarial
liabilities
Otherinsurance
contractliabilities(1)
Netinsurance
contractliabilities
Reinsuranceassets
Grossinsurance
contractliabilities
Balance, January 1 $ 296,589 $ 13,219 $ 309,808 $ 41,353 $ 351,161New policies(2) 3,166 – 3,166 481 3,647Normal in-force movement(2) 32,340 1,312 33,652 (3,030) 30,622Changes in methods and assumptions(2) 563 – 563 4,559 5,122Reinsurance transactions(3) (3,360) – (3,360) 3,360 –Impact of changes in foreign exchange rates (3,890) (154) (4,044) (954) (4,998)Balance, December 31 $ 325,408 $ 14,377 $ 339,785 $ 45,769 $ 385,554
For the year ended December 31, 2019Net actuarial
liabilities
Otherinsurance
contractliabilities(1)
Netinsurance
contractliabilities
Reinsuranceassets
Grossinsurance
contractliabilities
Balance, January 1 $ 272,761 $ 12,968 $ 285,729 $ 42,925 $ 328,654New policies(4) 3,251 – 3,251 521 3,772Normal in-force movement(4) 30,171 750 30,921 (972) 29,949Changes in methods and assumptions(4) 74 – 74 927 1,001Impact of changes in foreign exchange rates (9,668) (499) (10,167) (2,048) (12,215)Balance, December 31 $ 296,589 $ 13,219 $ 309,808 $ 41,353 $ 351,161(1) Other insurance contract liabilities are comprised of benefits payable and provisions for unreported claims and policyholder amounts on deposit.(2) In 2020, the $36,982 increase reported as the change in insurance contract liabilities on the Consolidated Statements of Income primarily consists of changes due to normal
in-force movement, new policies, associated embedded derivatives and changes in methods and assumptions. These three items in the gross insurance contract liabilities werenetted off by an increase of $39,391, of which $37,876 is included in the Consolidated Statements of Income increase in insurance contract liabilities and $1,515 is includedin gross claims and benefits. The Consolidated Statements of Income change in insurance contract liabilities also includes the change in embedded derivatives associated withinsurance contracts; however, these embedded derivatives are included in other liabilities on the Consolidated Statements of Financial Position.
(3) On September 30, 2020, the Company, through its subsidiary John Hancock Life Insurance Company (U.S.A.), entered into a reinsurance agreement with Global AtlanticFinancial Group Ltd to reinsure a block of legacy U.S. bank owned life insurance (“BOLI”). Under the terms of the transaction, the Company will maintain responsibility forservicing the policies with no expected impact to the BOLI policyholders. The transaction was structured such that the Company ceded policyholder contract liabilities andtransferred invested assets backing these liabilities.
(4) In 2019, the $33,727 increase reported as the change in insurance contract liabilities on the Consolidated Statements of Income primarily consists of changes due to normalin-force movement, new policies, associated embedded derivatives and changes in methods and assumptions. These three items in the gross insurance contract liabilities werenetted off by an increase of $34,721, of which $34,056 is included in the Consolidated Statements of Income increase in insurance contract liabilities and $665 is included ingross claims and benefits. The Consolidated Statements of Income change in insurance contract liabilities also includes the change in embedded derivatives associated withinsurance contracts; however, these embedded derivatives are included in other liabilities on the Consolidated Statements of Financial Position.
(h) Actuarial methods and assumptionsA comprehensive review of valuation assumptions and methods is performed annually. The review reduces the Company’s exposure touncertainty by ensuring assumptions for both asset and liability risks remain appropriate. This is accomplished by monitoring experienceand updating assumptions which represent a best estimate of expected future experience, and margins that are appropriate for the risksassumed. While the assumptions selected represent the Company’s current best estimates and assessment of risk, the ongoing monitoringof experience and the changes in economic environment are likely to result in future changes to the actuarial assumptions, which couldmaterially impact the insurance contract liabilities.
Annual review 2020The completion of the 2020 annual review of actuarial methods and assumptions resulted in an increase in insurance contract liabilities of$563, net of reinsurance, and a decrease in net income attributed to shareholders of $198 post-tax.
Change in insurance contract liabilities,net of reinsurance
For the year ended December 31, 2020 Total
Attributed toparticipating
policyholders’account(1)
Attributed toshareholders’
account
Change in netincome attributed
to shareholders(post-tax)
Canada variable annuity product review $ (42) $ – $ (42) $ 31Mortality and morbidity updates (304) (1) (303) 232Lapses and policyholder behaviour 893 – 893 (682)Investment related updates (212) (153) (59) 31Other updates 228 455 (227) 190Net impact $ 563 $ 301 $ 262 $ (198)(1) The change in insurance contract liabilities, net of reinsurance, attributable to the participating policyholders’ account was driven by refinements to the Company’s valuation
models, primarily due to annual updates to reflect market movements in the first half of 2020.
147

Canada variable annuity product reviewThe review of the Company’s variable annuity product in Canada resulted in a $31 post-tax gain to net income attributed to shareholders.
The gain was driven by refinements to the segregated fund guaranteed minimum withdrawal benefit valuation models, partially offset byupdates to lapse assumptions to reflect emerging experience.
Updates to mortality and morbidityMortality and morbidity updates resulted in a $232 post-tax gain to net income attributed to shareholders.
The gain was primarily driven by a review of the Company’s reinsurance arrangements and mortality margins for preferred risk classes inCanada Individual Insurance business, as well as updates to the morbidity assumptions on certain products in Japan. This was partiallyoffset by a charge from the review of mortality assumptions in the U.S. Insurance business, where emerging experience showed highermortality at older attained ages.
Other updates to mortality and morbidity assumptions were made across several products, largely in Canada, to reflect recent experienceresulting in a net post-tax gain to net income attributable to shareholders.
Updates to lapses and policyholder behaviourUpdates to lapses and policyholder behaviour assumptions resulted in a $682 post-tax charge to net income attributed to shareholders.
The Company completed a detailed review of the lapse assumptions for universal life policies in Canada, including both yearly renewableterm, and level cost of insurance products. The Company lowered the ultimate lapse assumptions due to the emergence of more recentdata, which resulted in a post-tax charge of $504 to net income attributed to shareholders, primarily driven by adverse experience on largepolicies.
Other updates to lapse and policyholder behaviour assumptions were made across several products to reflect recent experience resultingin a net post-tax charge to net income attributable to shareholders. The primary driver of the charge was adverse lapse experience fromretail policies in Japan.
Investment related updatesUpdates to investment return assumptions resulted in a $31 post-tax gain to net income attributed to shareholders.
Other updatesOther updates resulted in a $190 post-tax gain to net income attributed to shareholders. This incorporated several positive items includingupdates to the Company’s U.S. segregated fund guaranteed minimum withdrawal benefit valuation models, as well as updates to theprojection of the tax and liability cash flows in the U.S. to align with updated U.S. tax and statutory reporting standard changes, partiallyoffset by refinements to the valuation models, primarily driven by annual updates to reflect market movements in the first half of 2020.
Annual review 2019The 2019 annual review of actuarial methods and assumptions resulted in an increase in insurance contract liabilities of $74, net ofreinsurance, and a decrease in net income attributed to shareholders of $21 post-tax.
Change in insurance contract liabilities,net of reinsurance
For the year ended December 31, 2019 Total
Attributed toparticipating
policyholders’account
Attributed toshareholders’
account
Change in netincome attributed
to shareholders(post-tax)
Long-term care triennial review $ 11 $ – $ 11 $ (8)Mortality and morbidity updates 25 47 (22) 14Lapses and policyholder behaviour 135 17 118 (75)Investment return assumptions 12 81 (69) 70Other updates (109) (163) 54 (22)Net impact $ 74 $ (18) $ 92 $ (21)
Long-term care triennial reviewU.S. Insurance completed a comprehensive long-term care (“LTC”) experience study in 2019. The review included all aspects of claimassumptions, the impact of policyholder benefit reductions as well as the progress on future premium rate increases and a review ofmargins on the business. The impact of the LTC review was approximately net neutral to net income attributed to shareholders.
The experience study showed lower termination rates than expected during the elimination or “qualifying” period (which is the periodbetween when a claim is filed and when benefit payments begin), and favourable incidence as policyholders are filing claims at a lower ratethan expected. In addition, policyholders are electing to reduce their benefits in lieu of paying increased premiums. The overall claimsexperience review led to a post-tax charge to net income attributed to shareholders of approximately $1.9 billion, which includes a gain ofapproximately $0.2 billion for the impact of benefit reductions.
148 | 2020 Annual Report | Notes to Consolidated Financial Statements
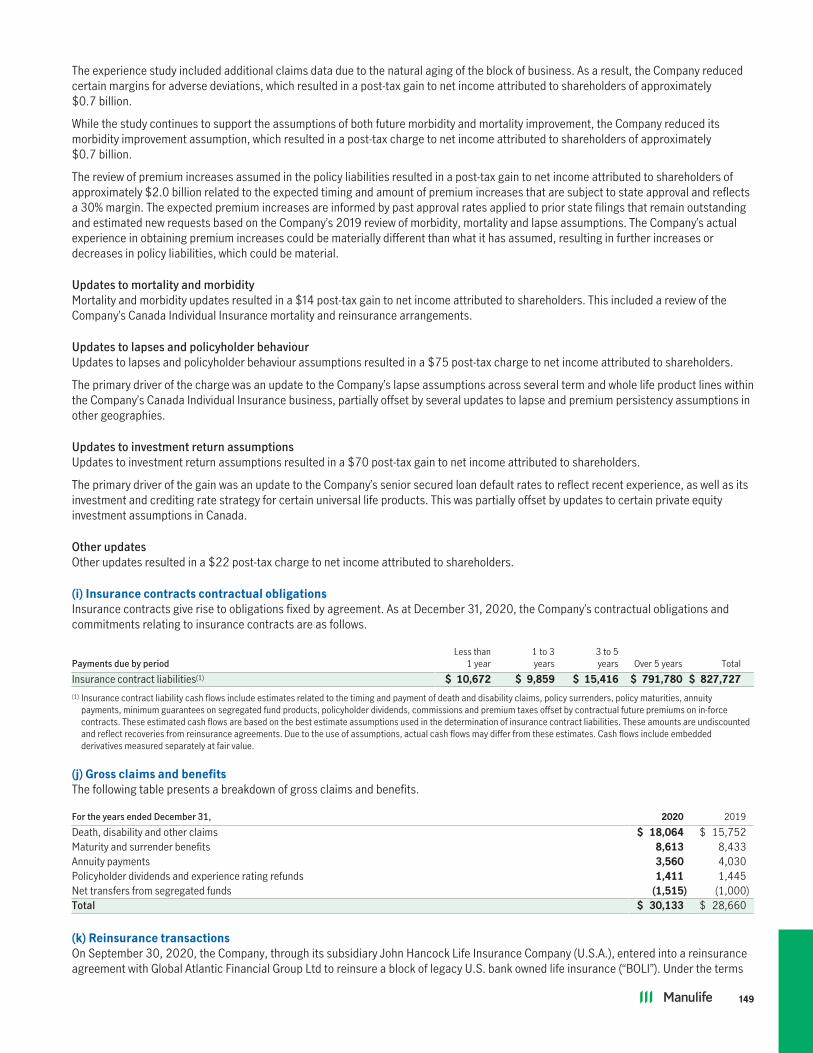
The experience study included additional claims data due to the natural aging of the block of business. As a result, the Company reducedcertain margins for adverse deviations, which resulted in a post-tax gain to net income attributed to shareholders of approximately$0.7 billion.
While the study continues to support the assumptions of both future morbidity and mortality improvement, the Company reduced itsmorbidity improvement assumption, which resulted in a post-tax charge to net income attributed to shareholders of approximately$0.7 billion.
The review of premium increases assumed in the policy liabilities resulted in a post-tax gain to net income attributed to shareholders ofapproximately $2.0 billion related to the expected timing and amount of premium increases that are subject to state approval and reflectsa 30% margin. The expected premium increases are informed by past approval rates applied to prior state filings that remain outstandingand estimated new requests based on the Company’s 2019 review of morbidity, mortality and lapse assumptions. The Company’s actualexperience in obtaining premium increases could be materially different than what it has assumed, resulting in further increases ordecreases in policy liabilities, which could be material.
Updates to mortality and morbidityMortality and morbidity updates resulted in a $14 post-tax gain to net income attributed to shareholders. This included a review of theCompany’s Canada Individual Insurance mortality and reinsurance arrangements.
Updates to lapses and policyholder behaviourUpdates to lapses and policyholder behaviour assumptions resulted in a $75 post-tax charge to net income attributed to shareholders.
The primary driver of the charge was an update to the Company’s lapse assumptions across several term and whole life product lines withinthe Company’s Canada Individual Insurance business, partially offset by several updates to lapse and premium persistency assumptions inother geographies.
Updates to investment return assumptionsUpdates to investment return assumptions resulted in a $70 post-tax gain to net income attributed to shareholders.
The primary driver of the gain was an update to the Company’s senior secured loan default rates to reflect recent experience, as well as itsinvestment and crediting rate strategy for certain universal life products. This was partially offset by updates to certain private equityinvestment assumptions in Canada.
Other updatesOther updates resulted in a $22 post-tax charge to net income attributed to shareholders.
(i) Insurance contracts contractual obligationsInsurance contracts give rise to obligations fixed by agreement. As at December 31, 2020, the Company’s contractual obligations andcommitments relating to insurance contracts are as follows.
Payments due by periodLess than
1 year1 to 3years
3 to 5years Over 5 years Total
Insurance contract liabilities(1) $ 10,672 $ 9,859 $ 15,416 $ 791,780 $ 827,727(1) Insurance contract liability cash flows include estimates related to the timing and payment of death and disability claims, policy surrenders, policy maturities, annuity
payments, minimum guarantees on segregated fund products, policyholder dividends, commissions and premium taxes offset by contractual future premiums on in-forcecontracts. These estimated cash flows are based on the best estimate assumptions used in the determination of insurance contract liabilities. These amounts are undiscountedand reflect recoveries from reinsurance agreements. Due to the use of assumptions, actual cash flows may differ from these estimates. Cash flows include embeddedderivatives measured separately at fair value.
(j) Gross claims and benefitsThe following table presents a breakdown of gross claims and benefits.
For the years ended December 31, 2020 2019
Death, disability and other claims $ 18,064 $ 15,752Maturity and surrender benefits 8,613 8,433Annuity payments 3,560 4,030Policyholder dividends and experience rating refunds 1,411 1,445Net transfers from segregated funds (1,515) (1,000)Total $ 30,133 $ 28,660
(k) Reinsurance transactionsOn September 30, 2020, the Company, through its subsidiary John Hancock Life Insurance Company (U.S.A.), entered into a reinsuranceagreement with Global Atlantic Financial Group Ltd to reinsure a block of legacy U.S. bank owned life insurance (“BOLI”). Under the terms
149

of the transaction, the Company will maintain responsibility for servicing the policies with no expected impact to the BOLI policyholders.The transaction was structured such that the Company ceded policyholder contract liabilities and transferred invested assets backingthese liabilities.
The transaction closed with an effective date of July 1, 2020. The Company recorded an after-tax gain of $262, which includes an increasein reinsurance assets and ceded premiums of $3.4 billion and $3.3 billion, respectively, on the Consolidated Statements of Income.
On September 26, 2018, the Company entered into coinsurance agreements with Reinsurance Group of America (“RGA”) to reinsure ablock of legacy U.S. individual pay-out annuities business from John Hancock Life Insurance Company (U.S.A.) (“JHUSA”) with a 100%quota share and John Hancock Life Insurance Company of New York (“JHNY”) with a 90% quota share. Under the terms of the agreements,the Company will maintain responsibility for servicing the policies. The transaction was structured such that the Company cededpolicyholder contract liabilities and transferred invested assets backing these liabilities. The JHUSA transaction closed in 2018. The JHNYtransaction closed with an effective date of January 1, 2019. The Company recorded an after-tax gain of $18, which includes an increase inreinsurance assets of $132 and ceded premiums of $131 in the Consolidated Statements of Income in 2019.
On October 31, 2018, the Company entered into coinsurance agreements with Jackson National Life Insurance Company (“Jackson”), awholly owned subsidiary of Prudential plc, to reinsure a block of legacy U.S. group pay-out annuities business from JHUSA with a 100%quota share and from JHNY with a 90% quota share. Under the terms of the agreements, the Company will maintain responsibility forservicing the policies. The transaction was structured such that the Company ceded policyholder contract liabilities and transferredrelated invested assets backing these liabilities. The JHUSA transaction closed in 2018. The JHNY transaction closed with an effective dateof January 1, 2019. The Company recorded an after-tax gain of $31 in 2019, which includes an increase in reinsurance assets of $621, aceding commission paid of $35 and ceded premiums of $581 in the Consolidated Statements of Income.
Note 7 Investment Contract LiabilitiesInvestment contract liabilities are contractual obligations that do not contain significant insurance risk. Those contracts are measuredeither at fair value or at amortized cost.
(a) Investment contract liabilities measured at fair valueInvestment contract liabilities measured at fair value include certain investment savings and pension products sold primarily in Hong Kongand mainland China. The following table presents the movement in investment contract liabilities measured at fair value.
For the years ended December 31, 2020 2019
Balance, January 1 $ 789 $ 782New policies 180 66Changes in market conditions 90 62Redemptions, surrenders and maturities (108) (86)Impact of changes in foreign exchange rates (19) (35)Balance, December 31 $ 932 $ 789
(b) Investment contract liabilities measured at amortized costInvestment contract liabilities measured at amortized cost include several fixed annuity products sold in the U.S. and Canada that provideguaranteed income payments for a contractually determined period and are not contingent on survivorship.
The following table presents carrying and fair values of investment contract liabilities measured at amortized cost.
2020 2019
As at December 31,
Amortizedcost, gross of
reinsuranceceded(1) Fair value
Amortizedcost, gross of
reinsuranceceded(1) Fair value
U.S. fixed annuity products $ 1,361 $ 1,680 $ 1,248 $ 1,482Canadian fixed annuity products 995 1,086 1,067 1,158Investment contract liabilities $ 2,356 $ 2,766 $ 2,315 $ 2,640(1) As at December 31, 2020, investment contract liabilities with carrying value and fair value of $67 and $76, respectively (2019 – $93 and $103, respectively), were reinsured
by the Company. The net carrying value and fair value of investment contract liabilities were $2,289 and $2,690 (2019 – $2,222 and $2,537), respectively.
150 | 2020 Annual Report | Notes to Consolidated Financial Statements

The changes in investment contract liabilities measured at amortized cost was a result of the following business activities.
For the years ended December 31, 2020 2019
Balance, January 1 $ 2,315 $ 2,483Policy deposits 202 2Interest 61 62Withdrawals (194) (182)Fees (1) (3)Other – 17Impact of changes in foreign exchange rates (27) (64)Balance, December 31 $ 2,356 $ 2,315
Carrying value of fixed annuity products is amortized at a rate that exactly discounts the projected actual cash flows to the net carryingamount of the liability at the date of issue.
Fair value of fixed annuity products is determined by projecting cash flows according to the contract terms and discounting the cash flowsat current market rates adjusted for the Company’s own credit standing. As at December 31, 2020 and 2019, fair value of all investmentcontract liabilities was determined using Level 2 valuation techniques.
(c) Investment contracts contractual obligationsAs at December 31, 2020, the Company’s contractual obligations and commitments relating to the investment contracts are as follows.
Payments due by periodLess than
1 year1 to 3years
3 to 5years
Over 5years Total
Investment contract liabilities(1) $ 297 $ 514 $ 520 $ 4,220 $ 5,551(1) Due to the nature of the products, the timing of net cash flows may be before contract maturity. Cash flows are undiscounted.
Note 8 Risk ManagementThe Company’s policies and procedures for managing risks of financial instruments are disclosed in denoted components of the “RiskManagement and Risk Factors” section of the MD&A for the year ended December 31, 2020. These disclosures are in accordance withIFRS 7 “Financial Instruments: Disclosures” and an integral part of these Consolidated Financial Statements.
(a) Credit riskCredit risk is the risk of loss due to inability or unwillingness of a borrower, or counterparty, to fulfill its payment obligations. Worseningregional and global economic conditions, segment or industry sector challenges, or company specific factors could result in defaults ordowngrades and could lead to increased provisions or impairments related to the Company’s general fund invested assets, derivativefinancial instruments and reinsurance assets and an increase in provisions for future credit impairments that are included in actuarialliabilities.
The Company’s exposure to credit risk is managed through risk management policies and procedures which include a defined creditevaluation and adjudication process, delegated credit approval authorities and established exposure limits by borrower, corporateconnection, credit rating, industry and geographic region. The Company measures derivative counterparty exposure as net potential creditexposure, which takes into consideration mark-to-market values of all transactions with each counterparty, net of any collateral held, andan allowance to reflect future potential exposure. Reinsurance counterparty exposure is measured reflecting the level of ceded liabilities.
The Company also ensures where warranted, that mortgages, private placements and loans to Bank clients are secured by collateral, thenature of which depends on the credit risk of the counterparty.
An allowance for losses on loans is established when a loan becomes impaired. Allowances for loan losses are calculated to reduce thecarrying value of the loans to estimated net realizable value. The establishment of such allowances takes into consideration normalhistorical credit loss levels and future expectations, with an allowance for adverse deviations. In addition, policy liabilities include generalprovisions for credit losses from future asset impairments. Impairments are identified through regular monitoring of all credit relatedexposures, considering such information as general market conditions, industry and borrower specific credit events and any other relevanttrends or conditions. Allowances for losses on reinsurance contracts are established when a reinsurance counterparty becomes unable orunwilling to fulfill its contractual obligations. The allowance for loss is based on current recoverable amounts and ceded policy liabilities.
Credit risk associated with derivative counterparties is discussed in note 8(d) and credit risk associated with reinsurance counterparties isdiscussed in note 8(i).
151

(i) Credit exposureThe following table presents the gross carrying amount of financial instruments subject to credit exposure, without considering anycollateral held or other credit enhancements.
As at December 31, 2020 2019
Debt securitiesFVTPL $ 183,061 $ 166,307AFS 35,663 31,815
Mortgages 50,207 49,376Private placements 40,756 37,979Policy loans 6,398 6,471Loans to Bank clients 1,976 1,740Derivative assets 27,793 19,449Accrued investment income 2,523 2,416Reinsurance assets 45,836 41,446Other financial assets 6,156 5,628Total $ 400,369 $ 362,627
As at December 31, 2020, 97% (2019 – 99%) of debt securities were investment grade-rated with ratings ranging between AAA to BBB.
(ii) Credit qualityCredit quality of commercial mortgages and private placementsCredit quality of commercial mortgages and private placements is assessed at least annually by using an internal rating based on regularmonitoring of credit-related exposures, considering both qualitative and quantitative factors.
A provision is recorded when the internal risk ratings indicate that a loss represents the most likely outcome. These assets are designatedas non-accrual and an allowance is established based on an analysis of the security and repayment sources.
The following table presents the credit quality of commercial mortgages and private placements.
As at December 31, 2020 AAA AA A BBB BB B and lower Total
Commercial mortgagesRetail $ 110 $ 1,339 $ 4,761 $ 2,242 $ 168 $ 1 $ 8,621Office 66 1,297 5,948 1,174 164 20 8,669Multi-family residential 613 1,675 2,896 582 33 – 5,799Industrial 25 320 2,353 259 3 – 2,960Other 238 966 914 984 355 7 3,464
Total commercial mortgages 1,052 5,597 16,872 5,241 723 28 29,513Agricultural mortgages – – 127 77 106 – 310Private placements 1,061 4,829 15,585 15,825 1,206 2,250 40,756Total $ 2,113 $ 10,426 $ 32,584 $ 21,143 $ 2,035 $ 2,278 $ 70,579
As at December 31, 2019 AAA AA A BBB BB B and lower Total
Commercial mortgagesRetail $ 132 $ 1,374 $ 5,285 $ 2,039 $ 10 $ – $ 8,840Office 77 1,540 5,808 1,402 26 18 8,871Multi-family residential 640 1,585 2,397 714 35 – 5,371Industrial 38 364 1,820 237 10 – 2,469Other 260 739 976 1,290 – 8 3,273
Total commercial mortgages 1,147 5,602 16,286 5,682 81 26 28,824Agricultural mortgages – 27 137 312 – – 476Private placements 1,098 5,513 14,311 14,139 823 2,095 37,979Total $ 2,245 $ 11,142 $ 30,734 $ 20,133 $ 904 $ 2,121 $ 67,279
Credit quality of residential mortgages and loans to Bank clientsCredit quality of residential mortgages and loans to Bank clients is assessed at least annually with the loan being performing ornon-performing as the key credit quality indicator.
Full or partial write-offs of loans are recorded when management believes that there is no realistic prospect of full recovery. Write-offs, netof recoveries, are deducted from the allowance for credit losses. All impairments are captured in the allowance for credit losses.
152 | 2020 Annual Report | Notes to Consolidated Financial Statements

The following table presents credit quality of residential mortgages and loans to Bank clients.
2020 2019
As at December 31, Insured Uninsured Total Insured Uninsured Total
Residential mortgagesPerforming $ 6,349 $ 13,980 $ 20,329 $ 6,613 $ 13,411 $ 20,024Non-performing(1) 9 46 55 25 27 52
Loans to Bank clientsPerforming n/a 1,976 1,976 n/a 1,740 1,740Non-performing(1) n/a – – n/a – –
Total $ 6,358 $ 16,002 $ 22,360 $ 6,638 $ 15,178 $ 21,816(1) Non-performing refers to assets that are 90 days or more past due.
The carrying value of government-insured mortgages was 13% of the total mortgage portfolio as at December 31, 2020 (2019 – 14%). Mostof these insured mortgages are residential loans as classified in the table above.
(iii) Past due or credit impaired financial assetsThe Company provides for credit risk by establishing allowances against the carrying value of impaired loans and recognizing impairmentlosses on AFS debt securities. In addition, the Company reports as impairment losses certain declines in the fair value of debt securitiesdesignated as FVTPL which it deems represent an impairment due to non-recoverability of due amount.
The following table presents past due but not impaired and impaired financial assets.
Past due but not impaired
As at December 31, 2020Less than
90 days90 days
and greater TotalTotal
impaired
Debt securitiesFVTPL $ – $ – $ – $ 54AFS – – – 1
Private placements 30 – 30 170Mortgages and loans to Bank clients 66 – 66 69Other financial assets 56 58 114 2Total $ 152 $ 58 $ 210 $ 296
Past due but not impaired
As at December 31, 2019Less than
90 days90 days
and greater TotalTotal
impaired
Debt securitiesFVTPL $ 11 $ – $ 11 $ 167AFS 4 1 5 –
Private placements 215 – 215 7Mortgages and loans to Bank clients 61 – 61 59Other financial assets 60 42 102 1Total $ 351 $ 43 $ 394 $ 234
The following table presents gross carrying value and allowances for loan losses for impaired loans.
As at December 31, 2020Gross
carrying valueAllowances
for loan lossesNet carrying
value
Private placements $ 249 $ 79 $ 170Mortgages and loans to Bank clients 97 28 69Total $ 346 $ 107 $ 239
As at December 31, 2019Gross
carrying valueAllowances
for loan lossesNet carrying
value
Private placements $ 11 $ 4 $ 7Mortgages and loans to Bank clients 75 16 59Total $ 86 $ 20 $ 66
153

The following table presents movement of allowance for loan losses during the year.
2020 2019
For the years ended December 31,Private
placements
Mortgagesand loans toBank clients Total
Privateplacements
Mortgagesand loans toBank clients Total
Balance, January 1 $ 4 $ 16 $ 20 $ 43 $ 52 $ 95Provisions 94 31 125 35 15 50Recoveries (6) (6) (12) – (46) (46)Write-offs(1) (13) (13) (26) (74) (5) (79)Balance, December 31 $ 79 $ 28 $ 107 $ 4 $ 16 $ 20(1) Includes disposals and impact of changes in foreign exchange rates.
(b) Securities lending, repurchase and reverse repurchase transactionsThe Company engages in securities lending to generate fee income. Collateral exceeding the market value of the loaned securities isretained by the Company until the underlying security has been returned to the Company. The market value of the loaned securities ismonitored daily and additional collateral is obtained or refunded as the market value of the underlying loaned securities fluctuates. As atDecember 31, 2020, the Company had loaned securities (which are included in invested assets) with a market value of $889 (2019 –$558). The Company holds collateral with a current market value that exceeds the value of securities lent in all cases.
The Company engages in reverse repurchase transactions to generate fee income, to take possession of securities to cover short positionsin similar instruments and to meet short-term funding requirements. As at December 31, 2020, the Company had engaged in reverserepurchase transactions of $716 (2019 – $990) which are recorded as short-term receivables. In addition, the Company had engaged inrepurchase transactions of $353 as at December 31, 2020 (2019 – $333) which are recorded as payables.
(c) Credit default swapsThe Company replicates exposure to specific issuers by selling credit protection via credit default swaps (“CDS”) to complement its cashdebt securities investing. The Company does not write CDS protection more than its government bond holdings. A CDS is a derivativeinstrument representing an agreement between two parties to exchange the credit risk of a single specified entity or an index based on thecredit risk of a group of entities (all commonly referred to as the “reference entity” or a portfolio of “reference entities”), in return for aperiodic premium. CDS contracts typically have a five-year term.
The following table presents details of the credit default swap protection sold by type of contract and external agency rating for theunderlying reference security.
As at December 31, 2020Notional
amount(1) Fair value
Weightedaverage maturity
(in years)(2)
Single name CDS(3) – Corporate debtA $ 136 $ 2 1BBB 105 1 2
Total single name CDS $ 241 $ 3 1Total CDS protection sold $ 241 $ 3 1
As at December 31, 2019Notional
amount(1) Fair value
Weightedaveragematurity
(in years)(2)
Single name CDS(3) – Corporate debtAA $ 24 $ – 1A 371 5 1BBB 107 1 2
Total single name CDS $ 502 $ 6 1Total CDS protection sold $ 502 $ 6 1(1) Notional amounts represent the maximum future payments the Company would have to pay its counterparties assuming a default of the underlying credit and zero recovery on
the underlying issuer obligation.(2) The weighted average maturity of the CDS is weighted based on notional amounts.(3) Standard & Poor’s assigned credit ratings are used where available followed by Moody’s, DBRS, and Fitch. If no external rating is available, an internally developed rating is
used.
The Company held no purchased credit protection as at December 31, 2020 and 2019.
154 | 2020 Annual Report | Notes to Consolidated Financial Statements

(d) DerivativesThe Company’s point-in-time exposure to losses related to credit risk of a derivative counterparty is limited to the amount of any net gainsthat may have accrued with a counterparty. Gross derivative counterparty exposure is measured as the total fair value (including accruedinterest) of all outstanding contracts in a gain position excluding any offsetting contracts in a loss position and the impact of collateral onhand. The Company limits the risk of credit losses from derivative counterparties by: using investment grade counterparties; entering intomaster netting arrangements which permit the offsetting of contracts in a loss position in the case of a counterparty default; and enteringinto Credit Support Annex agreements, whereby collateral must be provided when the exposure exceeds a certain threshold. All contractsare held with counterparties rated BBB+ or higher. As at December 31, 2020, the percentage of the Company’s derivative exposure withcounterparties rated AA- or higher was 20 per cent (2019 – 23 per cent). The Company’s exposure to credit risk was mitigated by $16,696fair value of collateral held as security as at December 31, 2020 (2019 – $12,038).
As at December 31, 2020, the largest single counterparty exposure, without considering the impact of master netting agreements or thebenefit of collateral held, was $4,110 (2019 – $3,047). The net exposure to this counterparty, after considering master nettingagreements and the fair value of collateral held, was $nil (2019 – $nil). As at December 31, 2020, the total maximum credit exposurerelated to derivatives across all counterparties, without considering the impact of master netting agreements and the benefit of collateralheld, was $28,685 (2019 – $20,144).
(e) Offsetting financial assets and financial liabilitiesCertain derivatives, securities lent and repurchase agreements have conditional offset rights. The Company does not offset these financialinstruments in the Consolidated Statements of Financial Position, as the rights of offset are conditional.
In the case of derivatives, collateral is collected from and pledged to counterparties and clearing houses to manage credit risk exposure inaccordance with Credit Support Annexes to swap agreements and clearing agreements. Under master netting agreements, the Companyhas a right of offset in the event of default, insolvency, bankruptcy or other early termination.
In the case of reverse repurchase and repurchase transactions, additional collateral may be collected from or pledged to counterparties tomanage credit exposure according to bilateral reverse repurchase or repurchase agreements. In the event of default by a counterparty, theCompany is entitled to liquidate the collateral held to offset against the same counterparty’s obligation.
155

The following table presents the effect of conditional master netting and similar arrangements. Similar arrangements may include globalmaster repurchase agreements, global master securities lending agreements, and any related rights to financial collateral.
Related amounts not set off in theConsolidated Statements of
Financial Position
As at December 31, 2020Gross amounts of
financial instruments(1)
Amounts subject toan enforceablemaster netting
arrangement orsimilar agreements
Financialand cashcollateral
pledged(received)(2)
Netamount
includingfinancingentities(3)
Netamounts
excludingfinancing
entities
Financial assetsDerivative assets $ 28,685 $ (13,243) $ (15,323) $ 119 $ 119Securities lending 889 – (889) – –Reverse repurchase agreements 716 – (715) 1 1Total financial assets $ 30,290 $ (13,243) $ (16,927) $ 120 $ 120Financial liabilitiesDerivative liabilities $ (16,076) $ 13,243 $ 2,482 $ (351) $ (71)Repurchase agreements (353) – 353 – –Total financial liabilities $ (16,429) $ 13,243 $ 2,835 $ (351) $ (71)
Related amounts not set off in theConsolidated Statements of
Financial Position
As at December 31, 2019Gross amounts of
financial instruments(1)
Amounts subject toan enforceablemaster netting
arrangement orsimilar agreements
Financialand cashcollateral
pledged(received)(2)
Netamount
includingfinancingentities(3)
Netamounts
excludingfinancing
entities
Financial assetsDerivative assets $ 20,144 $ (9,188) $ (10,889) $ 67 $ 67Securities lending 558 – (558) – –Reverse repurchase agreements 990 – (989) 1 1Total financial assets $ 21,692 $ (9,188) $ (12,436) $ 68 $ 68Financial liabilitiesDerivative liabilities $ (11,345) $ 9,188 $ 1,903 $ (254) $ (53)Repurchase agreements (333) – 330 (3) (3)Total financial liabilities $ (11,678) $ 9,188 $ 2,233 $ (257) $ (56)(1) Financial assets and liabilities include accrued interest of $892 and $1,114, respectively (2019 – $696 and $1,061, respectively).(2) Financial and cash collateral exclude over-collateralization. As at December 31, 2020, the Company was over-collateralized on OTC derivative assets, OTC derivative liabilities,
securities lending and reverse purchase agreements and repurchase agreements in the amounts of $1,373, $627, $74 and $nil, respectively (2019 – $1,149, $526, $44 and$nil, respectively). As at December 31, 2020, collateral pledged (received) does not include collateral-in-transit on OTC instruments or initial margin on exchange tradedcontracts or cleared contracts.
(3) Includes derivative contracts entered between the Company and its financing trusts which it does not consolidate. The Company does not exchange collateral on derivativecontracts entered with these trusts. Refer to note 17.
The Company has certain credit linked note assets and variable surplus note liabilities which have unconditional offset rights. Under thenetting agreements, the Company has rights of offset including in the event of the Company’s default, insolvency, or bankruptcy. Thesefinancial instruments are offset in the Consolidated Statements of Financial Position.
A credit linked note is a security that allows the issuer to transfer a specific credit risk to the buyer. A surplus note is a subordinated debtobligation that often qualifies as surplus (the U.S. statutory equivalent of equity) by some U.S. state insurance regulators. Interestpayments on surplus notes are made after all other contractual payments are made. The following table presents the effect ofunconditional netting.
As at December 31, 2020Gross amounts of
financial instruments
Amounts subject toan enforceable
netting arrangementNet amounts of
financial instruments
Credit linked note(1) $ 932 $ (932) $ –Variable surplus note (932) 932 –
As at December 31, 2019Gross amounts of
financial instruments
Amounts subject toan enforceable
netting arrangementNet amounts of
financial instruments
Credit linked note(1) $ 782 $ (782) $ –Variable surplus note (782) 782 –(1) As at December 31, 2020 and 2019, the Company had no fixed surplus notes outstanding, refer to note 18(g).
156 | 2020 Annual Report | Notes to Consolidated Financial Statements
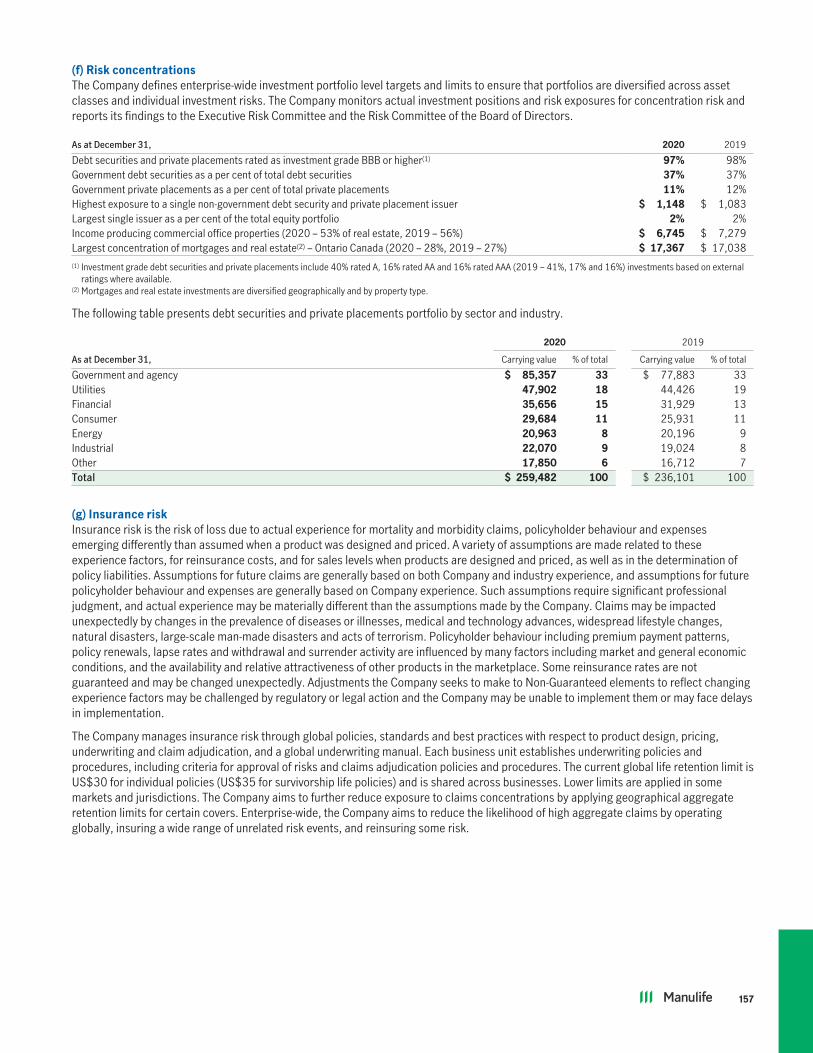
(f) Risk concentrationsThe Company defines enterprise-wide investment portfolio level targets and limits to ensure that portfolios are diversified across assetclasses and individual investment risks. The Company monitors actual investment positions and risk exposures for concentration risk andreports its findings to the Executive Risk Committee and the Risk Committee of the Board of Directors.
As at December 31, 2020 2019
Debt securities and private placements rated as investment grade BBB or higher(1) 97% 98%Government debt securities as a per cent of total debt securities 37% 37%Government private placements as a per cent of total private placements 11% 12%Highest exposure to a single non-government debt security and private placement issuer $ 1,148 $ 1,083Largest single issuer as a per cent of the total equity portfolio 2% 2%Income producing commercial office properties (2020 – 53% of real estate, 2019 – 56%) $ 6,745 $ 7,279Largest concentration of mortgages and real estate(2) – Ontario Canada (2020 – 28%, 2019 – 27%) $ 17,367 $ 17,038(1) Investment grade debt securities and private placements include 40% rated A, 16% rated AA and 16% rated AAA (2019 – 41%, 17% and 16%) investments based on external
ratings where available.(2) Mortgages and real estate investments are diversified geographically and by property type.
The following table presents debt securities and private placements portfolio by sector and industry.
2020 2019
As at December 31, Carrying value % of total Carrying value % of total
Government and agency $ 85,357 33 $ 77,883 33Utilities 47,902 18 44,426 19Financial 35,656 15 31,929 13Consumer 29,684 11 25,931 11Energy 20,963 8 20,196 9Industrial 22,070 9 19,024 8Other 17,850 6 16,712 7Total $ 259,482 100 $ 236,101 100
(g) Insurance riskInsurance risk is the risk of loss due to actual experience for mortality and morbidity claims, policyholder behaviour and expensesemerging differently than assumed when a product was designed and priced. A variety of assumptions are made related to theseexperience factors, for reinsurance costs, and for sales levels when products are designed and priced, as well as in the determination ofpolicy liabilities. Assumptions for future claims are generally based on both Company and industry experience, and assumptions for futurepolicyholder behaviour and expenses are generally based on Company experience. Such assumptions require significant professionaljudgment, and actual experience may be materially different than the assumptions made by the Company. Claims may be impactedunexpectedly by changes in the prevalence of diseases or illnesses, medical and technology advances, widespread lifestyle changes,natural disasters, large-scale man-made disasters and acts of terrorism. Policyholder behaviour including premium payment patterns,policy renewals, lapse rates and withdrawal and surrender activity are influenced by many factors including market and general economicconditions, and the availability and relative attractiveness of other products in the marketplace. Some reinsurance rates are notguaranteed and may be changed unexpectedly. Adjustments the Company seeks to make to Non-Guaranteed elements to reflect changingexperience factors may be challenged by regulatory or legal action and the Company may be unable to implement them or may face delaysin implementation.
The Company manages insurance risk through global policies, standards and best practices with respect to product design, pricing,underwriting and claim adjudication, and a global underwriting manual. Each business unit establishes underwriting policies andprocedures, including criteria for approval of risks and claims adjudication policies and procedures. The current global life retention limit isUS$30 for individual policies (US$35 for survivorship life policies) and is shared across businesses. Lower limits are applied in somemarkets and jurisdictions. The Company aims to further reduce exposure to claims concentrations by applying geographical aggregateretention limits for certain covers. Enterprise-wide, the Company aims to reduce the likelihood of high aggregate claims by operatingglobally, insuring a wide range of unrelated risk events, and reinsuring some risk.
157

(h) Concentration riskThe geographic concentration of the Company’s insurance and investment contract liabilities, including embedded derivatives, is shownbelow. The disclosure is based on the countries in which the business is written.
As at December 31, 2020Gross
liabilitiesReinsurance
assets Net liabilities
U.S. and Canada $ 273,848 $ (44,645) $ 229,203Asia and Other 114,878 (1,191) 113,687Total $ 388,726 $ (45,836) $ 342,890
As at December 31, 2019Gross
liabilitiesReinsurance
assets Net liabilities
U.S. and Canada $ 255,999 $ (40,944) $ 215,055Asia and Other 98,237 (502) 97,735Total $ 354,236 $ (41,446) $ 312,790
(i) Reinsurance riskIn the normal course of business, the Company limits the amount of loss on any one policy by reinsuring certain levels of risk with otherinsurers. In addition, the Company accepts reinsurance from other reinsurers. Reinsurance ceded does not discharge the Company’sliability as the primary insurer. Failure of reinsurers to honour their obligations could result in losses to the Company; consequently,allowances are established for amounts deemed uncollectible. To minimize losses from reinsurer insolvency, the Company monitors theconcentration of credit risk both geographically and with any one reinsurer. In addition, the Company selects reinsurers with high creditratings.
As at December 31, 2020, the Company had $45,836 (2019 – $41,446) of reinsurance assets. Of this, 94 per cent (2019 – 94 per cent)were ceded to reinsurers with Standard and Poor’s ratings of A- or above. The Company’s exposure to credit risk was mitigated by $27,360fair value of collateral held as security as at December 31, 2020 (2019 – $26,638). Net exposure after considering offsetting agreementsand the benefit of the fair value of collateral held was $18,476 as at December 31, 2020 (2019 – $14,808).
Note 9 Long-Term Debt(a) Carrying value of long-term debt instruments
As at December 31, Issue date Maturity date Par value 2020 2019
3.050% Senior notes(1),(2) August 27, 2020 August 27, 2060 US$ 1,155 $ 1,460 $ –4.70% Senior notes(1) June 23, 2016 June 23, 2046 US$ 1,000 1,265 1,2905.375% Senior notes(1) March 4, 2016 March 4, 2046 US$ 750 943 9622.396% Senior notes(3) June 1, 2020 June 1, 2027 US$ 200 254 –2.484% Senior notes(1),(3) May 19, 2020 May 19, 2027 US$ 500 632 –3.527% Senior notes(1) December 2, 2016 December 2, 2026 US$ 270 343 3504.150% Senior notes(1) March 4, 2016 March 4, 2026 US$ 1,000 1,267 1,2924.90% Senior notes(4) September 17, 2010 September 17, 2020 US$ 500 – 649Total $ 6,164 $ 4,543(1) These U.S. dollar senior notes have been designated as hedges of the Company’s net investment in its U.S. operations which reduces the earnings volatility that would otherwise
arise from the re-measurement of these senior notes into Canadian dollars.(2) Issued by MFC during the year, interest is payable semi-annually. The senior notes may be redeemed at the option of MFC in whole, but not in part, on August 27, 2025, and
thereafter on every August 27 at a redemption price equal to par, together with accrued and unpaid interest.(3) Issued by MFC during the year, interest is payable semi-annually. The senior notes may be redeemed in whole or in part at the option of MFC at any time, at a redemption price
equal to the greater of par and a price based on the yield of a corresponding U.S. Treasury bond plus 30 basis points.(4) The 4.90% senior notes matured on September 17, 2020.
The cash amount of interest paid on long-term debt during the year ended December 31, 2020 was $229 (2019 – $216). Issue costs areamortized over the term of the debt.
(b) Fair valuemeasurementFair value of long-term debt instruments is determined using the following hierarchy:
Level 1 – Fair value is determined using quoted market prices where available.
Level 2 – When quoted market prices are not available, fair value is determined with reference to quoted prices of similar debt instrumentsor estimated using discounted cash flows based on observable market rates.
The Company measures long-term debt at amortized cost in the Consolidated Statements of Financial Position. As at December 31, 2020,the fair value of long-term debt was $7,042 (2019 – $5,078). Fair value of long-term debt was determined using Level 2 valuationtechniques (2019 – Level 2).
158 | 2020 Annual Report | Notes to Consolidated Financial Statements

(c) Aggregatematurities of long-term debt
As at December 31Less than
1 year1 to 3years
3 to 5years
Over 5years Total
2020 $ – $ – $ – $ 6,164 $ 6,1642019 649 – – 3,894 4,543
Note 10 Capital Instruments(a) Carrying value of capital instruments
As at December 31, Issuance dateEarliest parredemption date Maturity date Par value 2020 2019
JHFC Subordinated notes(1) December 14, 2006 n/a December 15, 2036 $ 650 $ 647 $ 6472.818% MFC Subordinated debentures(2) May 12, 2020 May 13, 2030 May 13, 2035 $ 1,000 995 –4.061% MFC Subordinated notes(3),(4) February 24, 2017 February 24, 2027 February 24, 2032 US$ 750 951 9692.237% MFC Subordinated debentures(5) May 12, 2020 May 12, 2025 May 12, 2030 $ 1,000 996 –3.00% MFC Subordinated notes(6) November 21, 2017 November 21, 2024 November 21, 2029 S$ 500 480 4813.049% MFC Subordinated debentures(7) August 18, 2017 August 20, 2024 August 20, 2029 $ 750 748 7473.317% MFC Subordinated debentures(7) May 9, 2018 May 9, 2023 May 9, 2028 $ 600 598 5983.181% MLI Subordinated debentures(8) November 20, 2015 November 22, 2022 November 22, 2027 $ 1,000 999 9983.85% MFC Subordinated notes(6) May 25, 2016 May 25, 2021 May 25, 2026 S$ 500 481 4822.389% MLI Subordinated debentures(8),(9) June 1, 2015 January 5, 2021 January 5, 2026 $ 350 350 3502.10% MLI Subordinated debentures(10) March 10, 2015 June 1, 2020 June 1, 2025 $ 750 – 7502.64% MLI Subordinated debentures(11) December 1, 2014 January 15, 2020 January 15, 2025 $ 500 – 5007.375% JHUSA Surplus notes(12) February 25, 1994 n/a February 15, 2024 US$ 450 584 598Total $ 7,829 $ 7,120(1) Issued by Manulife Holdings (Delaware) LLC (“MHDLL”), now John Hancock Financial Corporation (“JHFC”), a wholly owned subsidiary of MFC, to Manulife Finance (Delaware)
LLC (“MFLLC”), a subsidiary of Manulife Finance (Delaware) L.P. (“MFLP”). MFLP and its subsidiaries are wholly owned unconsolidated related parties to the Company. The notebears interest at a floating rate equal to the 90-day Bankers’ Acceptance rate plus 0.72%. With regulatory approval, JHFC may redeem the note, in whole or in part, at any time,at par, together with accrued and unpaid interest. Refer to note 17.
(2) Issued by MFC during the year, interest is payable semi-annually. After May 13, 2030, the interest rate will reset to equal the 90-day Bankers’ Acceptance rate plus 1.82%.With regulatory approval, MFC may redeem the debentures, in whole, or in part, on or after May 13, 2025, at a redemption price together with accrued and unpaid interest. Ifthe redemption date is on or after May 13, 2025, but prior to May 13, 2030, the redemption price shall be the greater of: (i) the Canada yield price as defined in theprospectus; and (ii) par. If the redemption date is on or after May 13, 2030, the redemption price shall be equal to par.
(3) On the earliest par redemption date, the interest rate will reset to equal the 5-Year US Dollar Mid-Swap Rate plus 1.647%. With regulatory approval, MFC may redeem thedebentures, in whole, but not in part, on the earliest par redemption date, at a redemption price equal to par, together with accrued and unpaid interest.
(4) Designated as a hedge of the Company’s net investment in its U.S. operations which reduces the earnings volatility that would otherwise arise from the re-measurement of thesubordinated notes into Canadian dollars.
(5) Issued by MFC during the year, interest is payable semi-annually. After May 12, 2025, the interest rate will reset to equal the 90-day Bankers’ Acceptance rate plus 1.49%.With regulatory approval, MFC may redeem the debentures, in whole, or in part, on or after May 12, 2025, at a redemption price equal to par, together with accrued andunpaid interest.
(6) On the earliest par redemption date, the interest rate will reset to equal the 5-Year Singapore Dollar Swap Rate plus a specified number of basis points. The specified number ofbasis points is as follows: 3.00% – 83.2 bps, 3.85% – 197 bps. With regulatory approval, MFC may redeem the debentures, in whole, but not in part, on the earliest parredemption date and thereafter on each interest payment date, at a redemption price equal to par, together with accrued and unpaid interest.
(7) Interest is fixed for the period up to the earliest par redemption date, thereafter, the interest rate will reset to a floating rate equal to the 90-day Bankers’ Acceptance rate plusa specified number of basis points. The specified number of basis points is as follows: 3.049% – 105 bps, 3.317% – 78 bps. With regulatory approval, MFC may redeem thedebentures, in whole or in part, on or after the earliest par redemption date, at a redemption price equal to par, together with accrued and unpaid interest.
(8) Interest is fixed for the period up to the earliest par redemption date, thereafter the interest rate will reset to a floating rate equal to the 90-day Bankers’ Acceptance rate plus aspecified number of basis points. The specified number of basis points is as follows: 3.181% – 157 bps, 2.389% – 83 bps. With regulatory approval, MLI may redeem thedebentures, in whole or in part, on or after the earliest par redemption date, at a redemption price equal to par, together with accrued and unpaid interest.
(9) MLI redeemed in full the 2.389% subordinated debentures at par, on January 5, 2021, the earliest par redemption date.(10) MLI redeemed in full the 2.10% subordinated debentures at par, on June 1, 2020, the earliest par redemption date.(11) MLI redeemed in full the 2.64% subordinated debentures at par, on January 15, 2020, the earliest par redemption date.(12) Issued by John Hancock Mutual Life Insurance Company, now John Hancock Life Insurance Company (U.S.A.). Any payment of interest or principal on the surplus notes
requires prior approval from the Department of Insurance and Financial Services of the State of Michigan. The carrying value of the surplus notes reflects an unamortized fairvalue increment of US$13 (2019 – US$17), which arose as a result of the acquisition of John Hancock Financial Services, Inc. The amortization of the fair value adjustment isrecorded in interest expense.
(b) Fair valuemeasurementFair value of capital instruments is determined using the following hierarchy:
Level 1 – Fair value is determined using quoted market prices where available.
Level 2 – When quoted market prices are not available, fair value is determined with reference to quoted prices of similar debt instrumentsor estimated using discounted cash flows based on observable market rates.
159
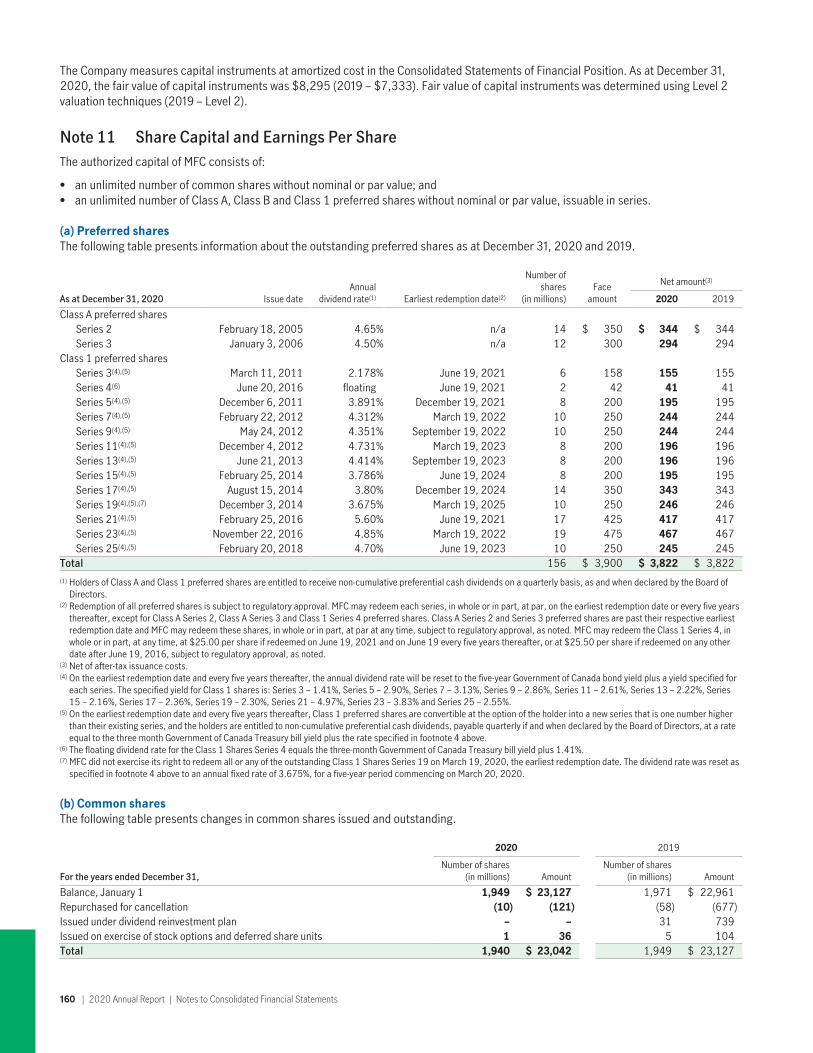
The Company measures capital instruments at amortized cost in the Consolidated Statements of Financial Position. As at December 31,2020, the fair value of capital instruments was $8,295 (2019 – $7,333). Fair value of capital instruments was determined using Level 2valuation techniques (2019 – Level 2).
Note 11 Share Capital and Earnings Per ShareThe authorized capital of MFC consists of:
• an unlimited number of common shares without nominal or par value; and• an unlimited number of Class A, Class B and Class 1 preferred shares without nominal or par value, issuable in series.
(a) Preferred sharesThe following table presents information about the outstanding preferred shares as at December 31, 2020 and 2019.
As at December 31, 2020 Issue dateAnnual
dividend rate(1) Earliest redemption date(2)
Number ofshares
(in millions)Face
amount
Net amount(3)
2020 2019
Class A preferred sharesSeries 2 February 18, 2005 4.65% n/a 14 $ 350 $ 344 $ 344Series 3 January 3, 2006 4.50% n/a 12 300 294 294
Class 1 preferred sharesSeries 3(4),(5) March 11, 2011 2.178% June 19, 2021 6 158 155 155Series 4(6) June 20, 2016 floating June 19, 2021 2 42 41 41Series 5(4),(5) December 6, 2011 3.891% December 19, 2021 8 200 195 195Series 7(4),(5) February 22, 2012 4.312% March 19, 2022 10 250 244 244Series 9(4),(5) May 24, 2012 4.351% September 19, 2022 10 250 244 244Series 11(4),(5) December 4, 2012 4.731% March 19, 2023 8 200 196 196Series 13(4),(5) June 21, 2013 4.414% September 19, 2023 8 200 196 196Series 15(4),(5) February 25, 2014 3.786% June 19, 2024 8 200 195 195Series 17(4),(5) August 15, 2014 3.80% December 19, 2024 14 350 343 343Series 19(4),(5),(7) December 3, 2014 3.675% March 19, 2025 10 250 246 246Series 21(4),(5) February 25, 2016 5.60% June 19, 2021 17 425 417 417Series 23(4),(5) November 22, 2016 4.85% March 19, 2022 19 475 467 467Series 25(4),(5) February 20, 2018 4.70% June 19, 2023 10 250 245 245
Total 156 $ 3,900 $ 3,822 $ 3,822(1) Holders of Class A and Class 1 preferred shares are entitled to receive non-cumulative preferential cash dividends on a quarterly basis, as and when declared by the Board of
Directors.(2) Redemption of all preferred shares is subject to regulatory approval. MFC may redeem each series, in whole or in part, at par, on the earliest redemption date or every five years
thereafter, except for Class A Series 2, Class A Series 3 and Class 1 Series 4 preferred shares. Class A Series 2 and Series 3 preferred shares are past their respective earliestredemption date and MFC may redeem these shares, in whole or in part, at par at any time, subject to regulatory approval, as noted. MFC may redeem the Class 1 Series 4, inwhole or in part, at any time, at $25.00 per share if redeemed on June 19, 2021 and on June 19 every five years thereafter, or at $25.50 per share if redeemed on any otherdate after June 19, 2016, subject to regulatory approval, as noted.
(3) Net of after-tax issuance costs.(4) On the earliest redemption date and every five years thereafter, the annual dividend rate will be reset to the five-year Government of Canada bond yield plus a yield specified for
each series. The specified yield for Class 1 shares is: Series 3 – 1.41%, Series 5 – 2.90%, Series 7 – 3.13%, Series 9 – 2.86%, Series 11 – 2.61%, Series 13 – 2.22%, Series15 – 2.16%, Series 17 – 2.36%, Series 19 – 2.30%, Series 21 – 4.97%, Series 23 – 3.83% and Series 25 – 2.55%.
(5) On the earliest redemption date and every five years thereafter, Class 1 preferred shares are convertible at the option of the holder into a new series that is one number higherthan their existing series, and the holders are entitled to non-cumulative preferential cash dividends, payable quarterly if and when declared by the Board of Directors, at a rateequal to the three month Government of Canada Treasury bill yield plus the rate specified in footnote 4 above.
(6) The floating dividend rate for the Class 1 Shares Series 4 equals the three-month Government of Canada Treasury bill yield plus 1.41%.(7) MFC did not exercise its right to redeem all or any of the outstanding Class 1 Shares Series 19 on March 19, 2020, the earliest redemption date. The dividend rate was reset as
specified in footnote 4 above to an annual fixed rate of 3.675%, for a five-year period commencing on March 20, 2020.
(b) Common sharesThe following table presents changes in common shares issued and outstanding.
2020 2019
For the years ended December 31,Number of shares
(in millions) AmountNumber of shares
(in millions) Amount
Balance, January 1 1,949 $ 23,127 1,971 $ 22,961Repurchased for cancellation (10) (121) (58) (677)Issued under dividend reinvestment plan – – 31 739Issued on exercise of stock options and deferred share units 1 36 5 104Total 1,940 $ 23,042 1,949 $ 23,127
160 | 2020 Annual Report | Notes to Consolidated Financial Statements
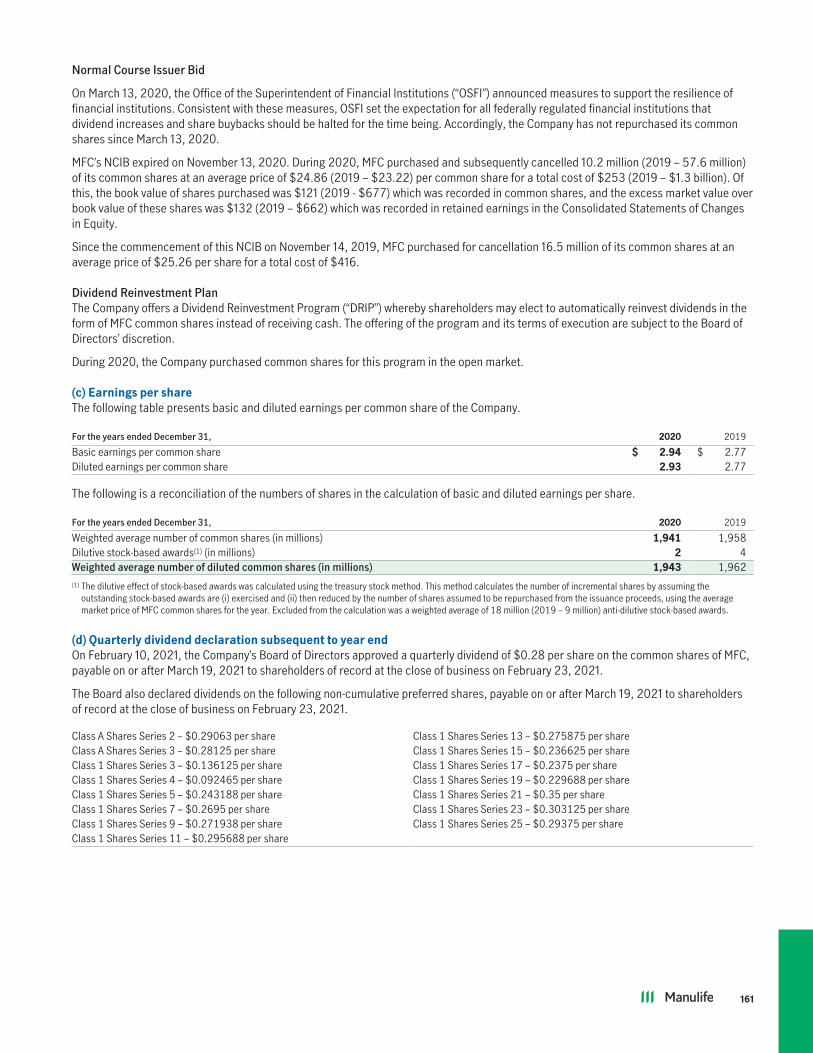
Normal Course Issuer Bid
On March 13, 2020, the Office of the Superintendent of Financial Institutions (“OSFI”) announced measures to support the resilience offinancial institutions. Consistent with these measures, OSFI set the expectation for all federally regulated financial institutions thatdividend increases and share buybacks should be halted for the time being. Accordingly, the Company has not repurchased its commonshares since March 13, 2020.
MFC’s NCIB expired on November 13, 2020. During 2020, MFC purchased and subsequently cancelled 10.2 million (2019 – 57.6 million)of its common shares at an average price of $24.86 (2019 – $23.22) per common share for a total cost of $253 (2019 – $1.3 billion). Ofthis, the book value of shares purchased was $121 (2019 - $677) which was recorded in common shares, and the excess market value overbook value of these shares was $132 (2019 – $662) which was recorded in retained earnings in the Consolidated Statements of Changesin Equity.
Since the commencement of this NCIB on November 14, 2019, MFC purchased for cancellation 16.5 million of its common shares at anaverage price of $25.26 per share for a total cost of $416.
Dividend Reinvestment PlanThe Company offers a Dividend Reinvestment Program (“DRIP”) whereby shareholders may elect to automatically reinvest dividends in theform of MFC common shares instead of receiving cash. The offering of the program and its terms of execution are subject to the Board ofDirectors’ discretion.
During 2020, the Company purchased common shares for this program in the open market.
(c) Earnings per shareThe following table presents basic and diluted earnings per common share of the Company.
For the years ended December 31, 2020 2019
Basic earnings per common share $ 2.94 $ 2.77Diluted earnings per common share 2.93 2.77
The following is a reconciliation of the numbers of shares in the calculation of basic and diluted earnings per share.
For the years ended December 31, 2020 2019
Weighted average number of common shares (in millions) 1,941 1,958Dilutive stock-based awards(1) (in millions) 2 4Weighted average number of diluted common shares (in millions) 1,943 1,962(1) The dilutive effect of stock-based awards was calculated using the treasury stock method. This method calculates the number of incremental shares by assuming the
outstanding stock-based awards are (i) exercised and (ii) then reduced by the number of shares assumed to be repurchased from the issuance proceeds, using the averagemarket price of MFC common shares for the year. Excluded from the calculation was a weighted average of 18 million (2019 – 9 million) anti-dilutive stock-based awards.
(d) Quarterly dividend declaration subsequent to year endOn February 10, 2021, the Company’s Board of Directors approved a quarterly dividend of $0.28 per share on the common shares of MFC,payable on or after March 19, 2021 to shareholders of record at the close of business on February 23, 2021.
The Board also declared dividends on the following non-cumulative preferred shares, payable on or after March 19, 2021 to shareholdersof record at the close of business on February 23, 2021.
Class A Shares Series 2 – $0.29063 per share Class 1 Shares Series 13 – $0.275875 per shareClass A Shares Series 3 – $0.28125 per share Class 1 Shares Series 15 – $0.236625 per shareClass 1 Shares Series 3 – $0.136125 per share Class 1 Shares Series 17 – $0.2375 per shareClass 1 Shares Series 4 – $0.092465 per share Class 1 Shares Series 19 – $0.229688 per shareClass 1 Shares Series 5 – $0.243188 per share Class 1 Shares Series 21 – $0.35 per shareClass 1 Shares Series 7 – $0.2695 per share Class 1 Shares Series 23 – $0.303125 per shareClass 1 Shares Series 9 – $0.271938 per share Class 1 Shares Series 25 – $0.29375 per shareClass 1 Shares Series 11 – $0.295688 per share
161

Note 12 Capital Management(a) Capital managementThe Company monitors and manages its consolidated capital in compliance with the Life Insurance Capital Adequacy Test (“LICAT”)guideline, the capital framework issued by the Office of the Superintendent of Financial Institutions (“OSFI”). Under the capital framework,the Company’s consolidated capital resources, including available capital, surplus allowance, and eligible deposits, are measured againstthe base solvency buffer, which is the risk-based capital requirement determined in accordance with the guideline.The Company’s operating activities are primarily conducted within MLI and its subsidiaries. MLI is also regulated by OSFI and is thereforesubject to consolidated risk-based capital requirements using the OSFI LICAT framework.The Company seeks to manage its capital with the objectives of:• Operating with sufficient capital to be able to honour all commitments to its policyholders and creditors with a high degree of
confidence;• Retaining the ongoing confidence of regulators, policyholders, rating agencies, investors and other creditors in order to ensure access
to capital markets; and• Optimizing return on capital to meet shareholders’ expectations subject to constraints and considerations of adequate levels of capital
established to meet the first two objectives.Capital is managed and monitored in accordance with the Capital Management Policy. The policy is reviewed and approved by the Board ofDirectors annually and is integrated with the Company’s risk and financial management frameworks. It establishes guidelines regarding thequantity and quality of capital, internal capital mobility, and proactive management of ongoing and future capital requirements.The capital management framework considers the requirements of the Company as a whole as well as the needs of each of the Company’ssubsidiaries. Internal capital targets are set above the regulatory requirements, and consider a number of factors, including expectationsof regulators and rating agencies, results of sensitivity and stress testing and the Company’s own risk assessments. The Companymonitors against these internal targets and initiates actions appropriate to achieving its business objectives.Consolidated capital, based on accounting standards, is presented in the table below for MFC. For regulatory reporting purposes, LICATavailable capital is based on consolidated capital with adjustments for certain deductions, limits and restrictions, as mandated by theLICAT guideline.
Consolidated capitalAs at December 31, 2020 2019
Total equity $ 53,006 $ 50,106Adjusted for AOCI loss on cash flow hedges (229) (143)Total equity excluding AOCI on cash flow hedges 53,235 50,249Qualifying capital instruments 7,829 7,120Consolidated capital $ 61,064 $ 57,369
(b) Restrictions on dividends and capital distributionsDividends and capital distributions are restricted under the Insurance Companies Act (“ICA”). These restrictions apply to both MFC and itsprimary operating subsidiary MLI. The ICA prohibits the declaration or payment of any dividend on shares of an insurance company if thereare reasonable grounds for believing a company does not have adequate capital and adequate and appropriate forms of liquidity or thedeclaration or the payment of the dividend would cause the company to be in contravention of any regulation made under the ICArespecting the maintenance of adequate capital and adequate and appropriate forms of liquidity, or of any direction made to the companyby OSFI. The ICA also requires an insurance company to notify OSFI of the declaration of a dividend at least 15 days prior to the date fixedfor its payment. Similarly, the ICA prohibits the purchase for cancellation of any shares issued by an insurance company or the redemptionof any redeemable shares or other similar capital transactions, if there are reasonable grounds for believing that the company does nothave adequate capital and adequate and appropriate forms of liquidity or the payment would cause the company to be in contravention ofany regulation made under the ICA respecting the maintenance of adequate capital and adequate and appropriate forms of liquidity, or anydirection made to the company by OSFI. These latter transactions would require the prior approval of OSFI.The ICA requires Canadian insurance companies to maintain adequate levels of capital at all times.Since MFC is a holding company that conducts all of its operations through regulated insurance subsidiaries (or companies owned directlyor indirectly by these subsidiaries), its ability to pay future dividends will depend on the receipt of sufficient funds from its regulatedinsurance subsidiaries. These subsidiaries are also subject to certain regulatory restrictions under laws in Canada, the United States andcertain other countries that may limit their ability to pay dividends or make other upstream distributions.On March 13, 2020, OSFI set the expectation for all federally regulated financial institutions that dividend increases and share buybacksshould be halted for the time being. Refer to note 11(b).
Note 13 Revenue from Service ContractsThe Company provides investment management services, administrative services, distribution and related services to proprietary andthird-party investment funds, retirement plans, group benefit plans and other arrangements. The Company also provides real estatemanagement services to tenants of the Company’s investment properties.
162 | 2020 Annual Report | Notes to Consolidated Financial Statements

The Company’s service contracts generally impose single performance obligations, each consisting of a series of similar related servicesfor each customer.
The Company’s performance obligations within service arrangements are generally satisfied over time as the customer simultaneouslyreceives and consumes the benefits of the services rendered, measured using an output method. Fees typically include variableconsideration and the related revenue is recognized to the extent that it is highly probable that a significant reversal in the amount ofcumulative revenue recognized will not occur when the uncertainty is subsequently resolved.
Asset-based fees vary with asset values of accounts under management, subject to market conditions and investor behaviors beyond theCompany’s control. Transaction processing and administrative fees vary with activity volume, also beyond the Company’s control. Somefees, including distribution fees, are based on account balances and transaction volumes. Fees related to account balances andtransaction volumes are measured daily. Real estate management service fees include fixed portions plus recovery of variable costs ofservices rendered to tenants. Fees related to services provided are generally recognized as services are rendered, which is when itbecomes highly probable that no significant reversal of cumulative revenue recognized will occur. The Company has determined that itsservice contracts have no significant financing components as fees are collected monthly. The Company has no significant contract assetsor contract liabilities.
The following tables present revenue from service contracts by service lines and reporting segments as disclosed in note 19.
For the year ended December 31, 2020 Asia Canada U.S.Global
WAMCorporateand Other Total
Investment management and other related fees $ 171 $ 202 $ 514 $ 2,770 $ (201) $ 3,456Transaction processing, administration, and service fees 239 814 15 2,215 2 3,285Distribution fees and other 227 16 67 718 (52) 976Total included in other revenue 637 1,032 596 5,703 (251) 7,717Revenue from non-service lines 709 (19) 2,115 7 62 2,874Total other revenue $ 1,346 $ 1,013 $ 2,711 $ 5,710 $ (189) $ 10,591Real estate management services included in net investment income $ 37 $ 144 $ 143 $ – $ 8 $ 332
For the year ended December 31, 2019 Asia Canada U.S.Global
WAMCorporateand Other Total
Investment management and other related fees $ 164 $ 161 $ 542 $ 2,773 $ (198) $ 3,442Transaction processing, administration, and service fees 223 827 17 2,048 – 3,115Distribution fees and other 199 52 72 741 (44) 1,020Total included in other revenue 586 1,040 631 5,562 (242) 7,577Revenue from non-service lines 629 48 2,023 – 122 2,822Total other revenue $ 1,215 $ 1,088 $ 2,654 $ 5,562 $ (120) $ 10,399Real estate management services included in net investment income $ 36 $ 160 $ 137 $ – $ 9 $ 342
Note 14 Stock-Based Compensation(a) Stock optionsThe Company grants stock options under its Executive Stock Option Plan (“ESOP”) to selected individuals. The options provide the holderthe right to purchase MFC common shares at an exercise price equal to the higher of the prior day, prior five-day or prior ten-day averageclosing market price of the shares on the Toronto Stock Exchange on the date the options are granted. The options vest over a period notexceeding four years and expire not more than 10 years from the grant date. Effective with the 2015 grant, options may only be exercisedafter the fifth-year anniversary. A total of 73,600,000 common shares have been reserved for issuance under the ESOP.
Options outstanding
2020 2019
For the years ended December 31,
Number ofoptions
(in millions)
Weightedaverage
exercise price
Number ofoptions
(in millions)
Weightedaverage
exercise price
Outstanding, January 1 21 $ 20.91 23 $ 20.29Granted 5 24.38 3 22.62Exercised (2) 18.17 (4) 18.79Expired – 24.27 – 18.88Forfeited – 23.73 (1) 23.41Outstanding, December 31 24 $ 21.74 21 $ 20.91Exercisable, December 31 6 $ 19.52 5 $ 17.56
163
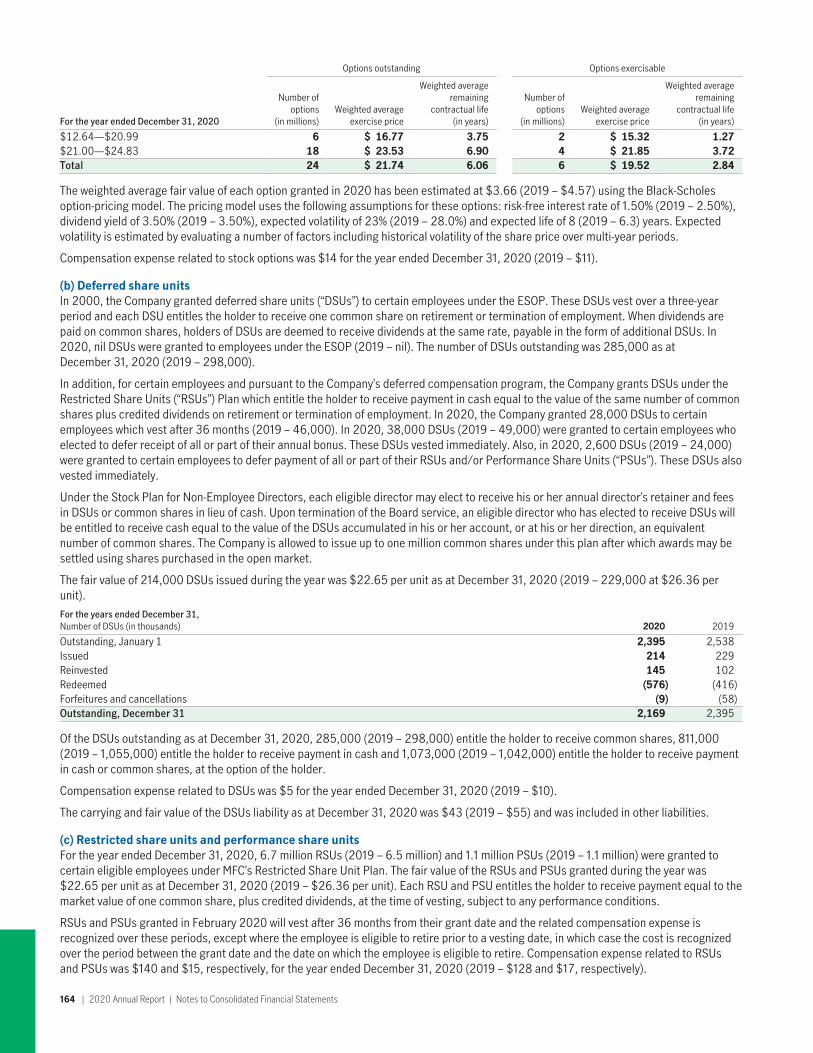
Options outstanding Options exercisable
For the year ended December 31, 2020
Number ofoptions
(in millions)Weighted average
exercise price
Weighted averageremaining
contractual life(in years)
Number ofoptions
(in millions)Weighted average
exercise price
Weighted averageremaining
contractual life(in years)
$12.64—$20.99 6 $ 16.77 3.75 2 $ 15.32 1.27$21.00—$24.83 18 $ 23.53 6.90 4 $ 21.85 3.72Total 24 $ 21.74 6.06 6 $ 19.52 2.84
The weighted average fair value of each option granted in 2020 has been estimated at $3.66 (2019 – $4.57) using the Black-Scholesoption-pricing model. The pricing model uses the following assumptions for these options: risk-free interest rate of 1.50% (2019 – 2.50%),dividend yield of 3.50% (2019 – 3.50%), expected volatility of 23% (2019 – 28.0%) and expected life of 8 (2019 – 6.3) years. Expectedvolatility is estimated by evaluating a number of factors including historical volatility of the share price over multi-year periods.
Compensation expense related to stock options was $14 for the year ended December 31, 2020 (2019 – $11).
(b) Deferred share unitsIn 2000, the Company granted deferred share units (“DSUs”) to certain employees under the ESOP. These DSUs vest over a three-yearperiod and each DSU entitles the holder to receive one common share on retirement or termination of employment. When dividends arepaid on common shares, holders of DSUs are deemed to receive dividends at the same rate, payable in the form of additional DSUs. In2020, nil DSUs were granted to employees under the ESOP (2019 – nil). The number of DSUs outstanding was 285,000 as atDecember 31, 2020 (2019 – 298,000).
In addition, for certain employees and pursuant to the Company’s deferred compensation program, the Company grants DSUs under theRestricted Share Units (“RSUs”) Plan which entitle the holder to receive payment in cash equal to the value of the same number of commonshares plus credited dividends on retirement or termination of employment. In 2020, the Company granted 28,000 DSUs to certainemployees which vest after 36 months (2019 – 46,000). In 2020, 38,000 DSUs (2019 – 49,000) were granted to certain employees whoelected to defer receipt of all or part of their annual bonus. These DSUs vested immediately. Also, in 2020, 2,600 DSUs (2019 – 24,000)were granted to certain employees to defer payment of all or part of their RSUs and/or Performance Share Units (“PSUs”). These DSUs alsovested immediately.
Under the Stock Plan for Non-Employee Directors, each eligible director may elect to receive his or her annual director’s retainer and feesin DSUs or common shares in lieu of cash. Upon termination of the Board service, an eligible director who has elected to receive DSUs willbe entitled to receive cash equal to the value of the DSUs accumulated in his or her account, or at his or her direction, an equivalentnumber of common shares. The Company is allowed to issue up to one million common shares under this plan after which awards may besettled using shares purchased in the open market.
The fair value of 214,000 DSUs issued during the year was $22.65 per unit as at December 31, 2020 (2019 – 229,000 at $26.36 perunit).For the years ended December 31,Number of DSUs (in thousands) 2020 2019
Outstanding, January 1 2,395 2,538Issued 214 229Reinvested 145 102Redeemed (576) (416)Forfeitures and cancellations (9) (58)Outstanding, December 31 2,169 2,395
Of the DSUs outstanding as at December 31, 2020, 285,000 (2019 – 298,000) entitle the holder to receive common shares, 811,000(2019 – 1,055,000) entitle the holder to receive payment in cash and 1,073,000 (2019 – 1,042,000) entitle the holder to receive paymentin cash or common shares, at the option of the holder.
Compensation expense related to DSUs was $5 for the year ended December 31, 2020 (2019 – $10).
The carrying and fair value of the DSUs liability as at December 31, 2020 was $43 (2019 – $55) and was included in other liabilities.
(c) Restricted share units and performance share unitsFor the year ended December 31, 2020, 6.7 million RSUs (2019 – 6.5 million) and 1.1 million PSUs (2019 – 1.1 million) were granted tocertain eligible employees under MFC’s Restricted Share Unit Plan. The fair value of the RSUs and PSUs granted during the year was$22.65 per unit as at December 31, 2020 (2019 – $26.36 per unit). Each RSU and PSU entitles the holder to receive payment equal to themarket value of one common share, plus credited dividends, at the time of vesting, subject to any performance conditions.
RSUs and PSUs granted in February 2020 will vest after 36 months from their grant date and the related compensation expense isrecognized over these periods, except where the employee is eligible to retire prior to a vesting date, in which case the cost is recognizedover the period between the grant date and the date on which the employee is eligible to retire. Compensation expense related to RSUsand PSUs was $140 and $15, respectively, for the year ended December 31, 2020 (2019 – $128 and $17, respectively).
164 | 2020 Annual Report | Notes to Consolidated Financial Statements

The carrying and fair value of the RSUs and PSUs liability as at December 31, 2020 was $194 (2019 – $205) and was included in otherliabilities.
(d) Global share ownership planThe Company’s Global Share Ownership Plan allows qualifying employees to apply up to five per cent of their annual base earnings towardthe purchase of common shares. The Company matches a percentage of the employee’s eligible contributions up to a maximum amount.The Company’s contributions vest immediately. All contributions are used to purchase common shares in the open market.
Note 15 Employee Future BenefitsThe Company maintains defined contribution and defined benefit pension plans and other post-employment plans for employees andagents including registered (tax-qualified) pension plans that are typically funded, as well as supplemental non-registered (non-qualified)pension plans for executives, retiree welfare plans and disability welfare plans that are typically not funded.
(a) Plan characteristicsThe Company’s final average pay defined benefit pension plans and retiree welfare plans are closed to new members. All employees mayparticipate in capital accumulation plans including defined benefit cash balance plans, 401(k) plans and/or defined contribution plans,depending on the country of employment.
All pension arrangements are governed by local pension committees or management, but significant plan changes require approval fromthe Company’s Board of Directors.
The Company’s funding policy for defined benefit pension plans is to make the minimum annual contributions required by regulations in thecountries in which the plans are offered. Assumptions and methods prescribed for regulatory funding purposes typically differ from thoseused for accounting purposes.
The Company’s remaining defined benefit pension and/or retiree welfare plans are in the U.S., Canada, Japan and Taiwan (China). Thereare also disability welfare plans in the U.S. and Canada.
The largest defined benefit pension and retiree welfare plans are the primary plans for employees in the U.S. and Canada. These are thematerial plans that are discussed in the balance of this note. The Company measures its defined benefit obligations and fair value of planassets for accounting purposes as at December 31 each year.
U.S. defined benefit pension and retiree welfare plansThe Company operates a qualified cash balance plan that is open to new members, a closed non-qualified cash balance plan, and a closedretiree welfare plan.
Actuarial valuations to determine the Company’s minimum funding contributions for the qualified cash balance plan are required annually.Deficits revealed in the funding valuations must generally be funded over a period of up to seven years. It is expected that there will be norequired funding for this plan in 2020. There are no plan assets set aside for the non-qualified cash balance plan.
The retiree welfare plan subsidizes the cost of life insurance and medical benefits. The majority of those who retired after 1991 receive afixed-dollar subsidy from the Company based on service. The plan was closed to all employees hired after 2004. While assets have beenset aside in a qualified trust to pay future retiree welfare benefits, this funding is optional. Retiree welfare benefits offered under the plancoordinate with the U.S. Medicare program to make optimal use of available federal financial support.
The qualified pension and retiree welfare plans are governed by the U.S. Benefits Committee, while the non-qualified pension plan isgoverned by the U.S. Non-Qualified Plans Subcommittee.
Canadian defined benefit pension and retiree welfare plansThe Company’s defined benefit plans in Canada include two registered final average pay pension plans, a non-registered supplemental finalaverage pay pension plan and a retiree welfare plan, all of which have been closed to new members.
Actuarial valuations to determine the Company’s minimum funding contributions for the registered pension plans are required at leastonce every three years. Deficits revealed in the funding valuation must generally be funded over a period of ten years. For 2021, therequired funding for these plans is expected to be $2. The non-registered supplemental pension plan is not funded.
The retiree welfare plan subsidizes the cost of life insurance, medical and dental benefits. These subsidies are a fixed-dollar amount forthose who retired after April 30, 2013 and have been eliminated for those who retire after 2019. There are no assets set aside for this plan.
The registered pension plans are governed by Pension Committees, while the supplemental non-registered plan is governed by the Boardof Directors. The retiree welfare plan is governed by management.
165

(b) RisksIn final average pay pension plans and retiree welfare plans, the Company generally bears the material risks which include interest rate,investment, longevity and health care cost inflation risks. In defined contribution plans, these risks are typically borne by the employee. Incash balance plans, the interest rate, investment and longevity risks are partially transferred to the employee.
Material sources of risk to the Company for all plans include:
• A decline in discount rates that increases the defined benefit obligations by more than the change in value of plan assets;• Lower than expected rates of mortality; and• For retiree welfare plans, higher than expected health care costs.
The Company has managed these risks through plan design and eligibility changes that have limited the size and growth of the definedbenefit obligations. Investment risks for funded plans are managed by investing significantly in asset classes which are highly correlatedwith the plans’ liabilities.
In the U.S., delegated committee representatives and management review the financial status of the qualified defined benefit pension planat least monthly, and steps are taken in accordance with an established dynamic investment policy to increase the plan’s allocation toasset classes which are highly correlated with the plan’s liabilities and reduce investment risk as the funded status improves. As atDecember 31, 2020, the target asset allocation for the plan was 27% return-seeking assets and 73% liability-hedging assets.
In Canada, internal committees and management review the financial status of the registered defined benefit pension plans on at least aquarterly basis. As at December 31, 2020, the target asset allocation for the plans was 20% return-seeking assets and 80% liability-hedging assets.
(c) Pension and retiree welfare plans
Pension plans Retiree welfare plans
For the years ended December 31, 2020 2019 2020 2019
Changes in defined benefit obligation:Opening balance $ 4,817 $ 4,675 $ 645 $ 640Current service cost 41 40 – –Interest cost 150 182 20 25Plan participants’ contributions – 1 3 3Actuarial losses (gains) due to:
Experience 2 8 (14) (10)Demographic assumption changes (67) – (12) –Economic assumption changes 333 413 49 56
Benefits paid (318) (358) (45) (46)Impact of changes in foreign exchange rates (57) (144) (8) (23)Defined benefit obligation, December 31 $ 4,901 $ 4,817 $ 638 $ 645
Pension plans Retiree welfare plans
For the years ended December 31, 2020 2019 2020 2019
Change in plan assets:Fair value of plan assets, opening balance $ 4,453 $ 4,187 $ 598 $ 610Interest income 140 164 19 25Return on plan assets (excluding interest income) 310 529 33 25Employer contributions 71 75 11 12Plan participants’ contributions – 1 3 3Benefits paid (318) (358) (45) (46)Administration costs (7) (9) (2) (2)Impact of changes in foreign exchange rates (54) (136) (11) (29)Fair value of plan assets, December 31 $ 4,595 $ 4,453 $ 606 $ 598
166 | 2020 Annual Report | Notes to Consolidated Financial Statements

(d) Amounts recognized in the Consolidated Statements of Financial Position
Pension plans Retiree welfare plans
As at December 31, 2020 2019 2020 2019
Development of net defined benefit liabilityDefined benefit obligation $ 4,901 $ 4,817 $ 638 $ 645Fair value of plan assets 4,595 4,453 606 598Deficit 306 364 32 47Effect of asset limit(1) – 4 – –Deficit (surplus) and net defined benefit liability (asset) 306 368 32 47Deficit is comprised of:Funded or partially funded plans (446) (391) (134) (120)Unfunded plans 752 759 166 167Deficit (surplus) and net defined benefit liability (asset) $ 306 $ 368 $ 32 $ 47(1) In 2019, the Company recognized an impairment of $4 on the net defined benefit asset for one of its registered pension plans in Canada.
(e) Disaggregation of defined benefit obligation
U.S. plans Canadian plans
Pension plans Retiree welfare plans Pension plans Retiree welfare plans
As at December 31, 2020 2019 2020 2019 2020 2019 2020 2019
Active members $ 551 $ 550 $ 27 $ 31 $ 211 $ 301 $ – $ 25Inactive and retired members 2,528 2,529 445 447 1,611 1,437 166 142Total $ 3,079 $ 3,079 $ 472 $ 478 $ 1,822 $ 1,738 $ 166 $ 167
(f) Fair valuemeasurementsThe major categories of plan assets and the allocation to each category are as follows.
U.S. plans(1) Canadian plans(2)
Pension plans Retiree welfare plans Pension plans Retiree welfare plans
As at December 31, 2020 Fair value % of total Fair value % of total Fair value % of total Fair value % of total
Cash and cash equivalents $ 17 1% $ 30 5% $ 10 1% $ – –Equity securities(3) 612 20% 49 8% 339 22% – –Debt securities 2,175 71% 520 86% 1,186 77% – –Other investments(4) 254 8% 7 1% 2 0% – –Total $ 3,058 100% $ 606 100% $ 1,537 100% $ – –
U.S. plans(1) Canadian plans(2)
Pension plans Retiree welfare plans Pension plans Retiree welfare plans
As at December 31, 2019 Fair value % of total Fair value % of total Fair value % of total Fair value % of total
Cash and cash equivalents $ 32 1% $ 35 6% $ 12 1% $ – –Equity securities(3) 563 19% 45 8% 311 21% – –Debt securities 2,155 72% 511 85% 1,123 78% – –Other investments(4) 255 8% 7 1% 2 0% – –Total $ 3,005 100% $ 598 100% $ 1,448 100% $ – –(1) All the U.S. pension and retiree welfare plan assets have daily quoted prices in active markets, except for the private equity, timber and agriculture assets. In the aggregate, the
latter assets represent approximately 7% of all U.S. pension and retiree welfare plan assets as at December 31, 2020 (2019 – 7%).(2) All the Canadian pension plan assets have daily quoted prices in active markets, except for the group annuity contract assets that represent approximately 0.1% of all Canadian
pension plan assets as at December 31, 2020 (2019 – 0.1%).(3) Equity securities include direct investments in MFC common shares of $1.1 (2019 – $1.3) in the U.S. retiree welfare plan and $nil (2019 – $nil) in Canada.(4) Other U.S. plan assets include investment in private equity, timberland and agriculture, and managed futures. Other Canadian pension plan assets include investment in the
group annuity contract.
167

(g) Net benefit cost recognized in the Consolidated Statements of IncomeComponents of the net benefit cost for the pension plans and retiree welfare plans were as follows.
Pension plansRetiree welfare
plans
For the years ended December 31, 2020 2019 2020 2019
Defined benefit current service cost $ 41 $ 40 $ – $ –Defined benefit administrative expenses 7 9 2 2Service cost 48 49 2 2Interest on net defined benefit (asset) liability 10 18 1 –Defined benefit cost 58 67 3 2Defined contribution cost 84 80 – –Net benefit cost $ 142 $ 147 $ 3 $ 2
(h) Re-measurement effects recognized in Other Comprehensive Income
Pension plans Retiree welfare plans
For the years ended December 31, 2020 2019 2020 2019
Actuarial gains (losses) on defined benefit obligations due to:Experience $ (2) $ (8) $ 14 $ 10Demographic assumption changes 67 – 12 –Economic assumption changes (333) (413) (49) (56)
Return on plan assets (excluding interest income) 310 529 33 25Change in effect of asset limit 5 5 – –Total re-measurement effects $ 47 $ 113 $ 10 $ (21)
(i) AssumptionsThe key assumptions used by the Company to determine the defined benefit obligation and net benefit cost for the defined benefit pensionplans and retiree welfare plans were as follows.
U.S. Plans Canadian Plans
Pension plans Retiree welfare plans Pension plans Retiree welfare plans
For the years ended December 31, 2020 2019 2020 2019 2020 2019 2020 2019
To determine the defined benefit obligation at end of year(1):Discount rate 2.4% 3.2% 2.4% 3.2% 2.5% 3.1% 2.6% 3.1%Initial health care cost trend rate(2) n/a n/a 7.3% 7.5% n/a n/a 5.5% 5.6%
To determine the defined benefit cost for the year(1):Discount rate 3.2% 4.3% 3.2% 4.3% 3.1% 3.8% 3.1% 3.8%Initial health care cost trend rate(2) n/a n/a 7.5% 7.8% n/a n/a 5.6% 5.7%
(1) Inflation and salary increase assumptions are not shown as they do not materially affect obligations and cost.(2) The health care cost trend rate used to measure the U.S. based retiree welfare obligation was 7.3% grading to 4.5% for 2032 and years thereafter (2019 – 7.5% grading to
4.5% for 2032) and to measure the net benefit cost was 7.5% grading to 4.5% for 2032 and years thereafter (2019 – 7.8% grading to 5.0% for 2030). In Canada, the rate usedto measure the retiree welfare obligation was 5.5% grading to 4.8% for 2026 and years thereafter (2019 – 5.6% grading to 4.8% for 2026) and to measure the net benefit costwas 5.6% grading to 4.8% for 2026 and years thereafter (2019 – 5.7% grading to 4.8% for 2026).
Assumptions regarding future mortality are based on published statistics and mortality tables. The current life expectancies underlying thevalues of the obligations in the defined benefit pension and retiree welfare plans are as follows.
As at December 31, 2020 U.S. Canada
Life expectancy (in years) for those currently age 65Males 21.9 23.8Females 23.4 25.6
Life expectancy (in years) at age 65 for those currently age 45Males 23.3 24.7Females 24.8 26.5
168 | 2020 Annual Report | Notes to Consolidated Financial Statements

(j) Sensitivity of assumptions on obligationsAssumptions used can have a significant effect on the obligations reported for defined benefit pension and retiree welfare plans. Thepotential impact on the obligations arising from changes in the key assumptions is set out in the following table. The sensitivities assumeall other assumptions are held constant. In actuality, inter-relationships with other assumptions may exist.
As at December 31, 2020 Pension plans Retiree welfare plans
Discount rate:Impact of a 1% increase $ (467) $ (67)Impact of a 1% decrease 554 82
Health care cost trend rate:Impact of a 1% increase n/a 20Impact of a 1% decrease n/a (17)
Mortality rates(1)
Impact of a 10% decrease 143 16(1) If the actuarial estimates of mortality are adjusted in the future to reflect unexpected decreases in mortality, the effect of a 10% decrease in mortality rates at each future age
would be an increase in life expectancy at age 65 of 0.8 years for U.S. males and females and 0.7 years and 0.8 years for Canadian males and females, respectively.
(k) Maturity profileThe weighted average duration (in years) of the defined benefit obligations is as follows.
Pension plans Retiree welfare plans
As at December 31, 2020 2019 2020 2019
U.S. plans 9.9 9.3 9.8 9.7Canadian plans 12.5 12.3 14.7 14.3
(l) Cash flows – contributionsTotal cash payments for all employee future benefits, comprised of cash contributed by the Company to funded defined benefit pensionand retiree welfare plans, cash payments directly to beneficiaries in respect of unfunded pension and retiree welfare plans, and cashcontributed to defined contribution pension plans, are as follows.
Pension plans Retiree welfare plans
For the years ended December 31, 2020 2019 2020 2019
Defined benefit plans $ 71 $ 75 $ 11 $ 12Defined contribution plans 84 80 – –Total $ 155 $ 155 $ 11 $ 12
The Company’s best estimate of expected cash payments for employee future benefits for the year ending December 31, 2021 is $65 fordefined benefit pension plans, $85 for defined contribution pension plans and $13 for retiree welfare plans.
Note 16 Income Taxes(a) Income tax expenseThe following table presents income tax expense (recovery) recognized in the Consolidated Statements of Income.
For the years ended December 31, 2020 2019
Current taxCurrent year $ 998 $ 1,246Adjustments related to prior years (83) (74)Total current tax 915 1,172Deferred taxChange related to temporary differences 253 (454)Effects of changes in tax rates 27 –Total deferred tax 280 (454)Income tax expense $ 1,195 $ 718
169
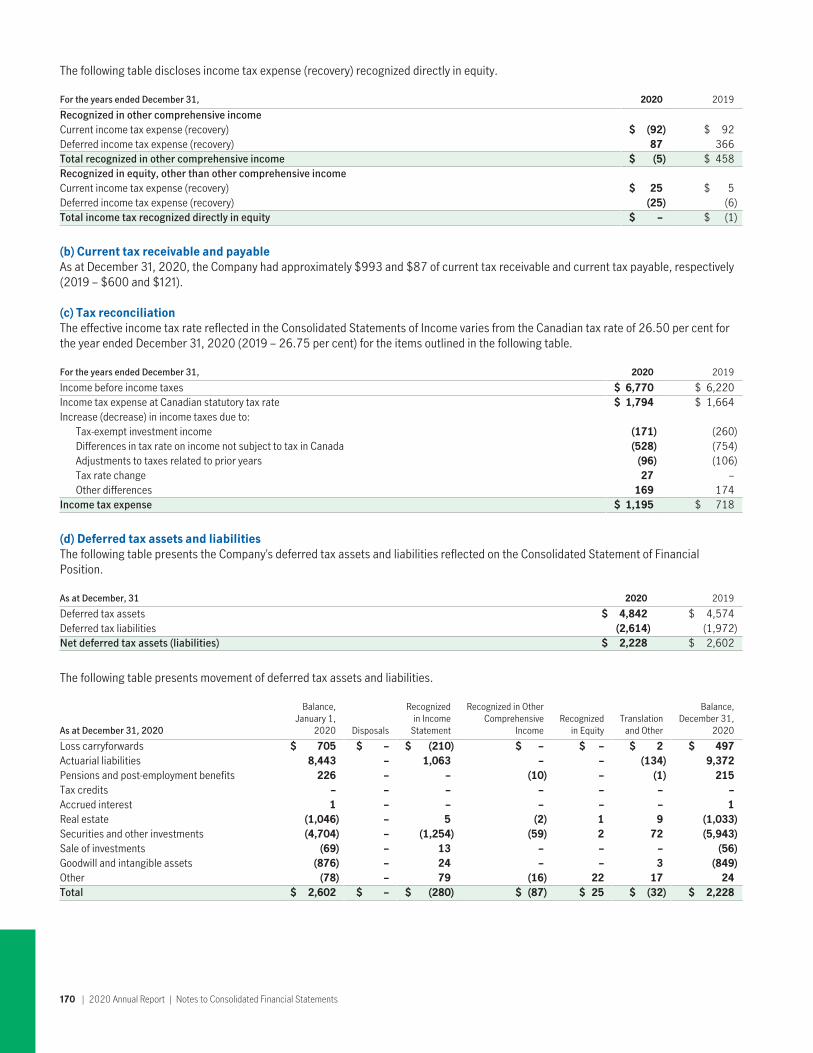
The following table discloses income tax expense (recovery) recognized directly in equity.
For the years ended December 31, 2020 2019
Recognized in other comprehensive incomeCurrent income tax expense (recovery) $ (92) $ 92Deferred income tax expense (recovery) 87 366Total recognized in other comprehensive income $ (5) $ 458Recognized in equity, other than other comprehensive incomeCurrent income tax expense (recovery) $ 25 $ 5Deferred income tax expense (recovery) (25) (6)Total income tax recognized directly in equity $ – $ (1)
(b) Current tax receivable and payableAs at December 31, 2020, the Company had approximately $993 and $87 of current tax receivable and current tax payable, respectively(2019 – $600 and $121).
(c) Tax reconciliationThe effective income tax rate reflected in the Consolidated Statements of Income varies from the Canadian tax rate of 26.50 per cent forthe year ended December 31, 2020 (2019 – 26.75 per cent) for the items outlined in the following table.
For the years ended December 31, 2020 2019
Income before income taxes $ 6,770 $ 6,220Income tax expense at Canadian statutory tax rate $ 1,794 $ 1,664Increase (decrease) in income taxes due to:
Tax-exempt investment income (171) (260)Differences in tax rate on income not subject to tax in Canada (528) (754)Adjustments to taxes related to prior years (96) (106)Tax rate change 27 –Other differences 169 174
Income tax expense $ 1,195 $ 718
(d) Deferred tax assets and liabilitiesThe following table presents the Company’s deferred tax assets and liabilities reflected on the Consolidated Statement of FinancialPosition.
As at December, 31 2020 2019
Deferred tax assets $ 4,842 $ 4,574Deferred tax liabilities (2,614) (1,972)Net deferred tax assets (liabilities) $ 2,228 $ 2,602
The following table presents movement of deferred tax assets and liabilities.
As at December 31, 2020
Balance,January 1,
2020 Disposals
Recognizedin Income
Statement
Recognized in OtherComprehensive
IncomeRecognized
in EquityTranslation
and Other
Balance,December 31,
2020
Loss carryforwards $ 705 $ – $ (210) $ – $ – $ 2 $ 497Actuarial liabilities 8,443 – 1,063 – – (134) 9,372Pensions and post-employment benefits 226 – – (10) – (1) 215Tax credits – – – – – – –Accrued interest 1 – – – – – 1Real estate (1,046) – 5 (2) 1 9 (1,033)Securities and other investments (4,704) – (1,254) (59) 2 72 (5,943)Sale of investments (69) – 13 – – – (56)Goodwill and intangible assets (876) – 24 – – 3 (849)Other (78) – 79 (16) 22 17 24Total $ 2,602 $ – $ (280) $ (87) $ 25 $ (32) $ 2,228
170 | 2020 Annual Report | Notes to Consolidated Financial Statements

As at December 31, 2019
Balance,January 1,
2019 Disposals
Recognizedin Income
Statement
Recognized inOther
ComprehensiveIncome
Recognizedin Equity
Translationand Other
Balance,December 31,
2019
Loss carryforwards $ 1,019 $ (18) $ (278) $ – $ (1) $ (17) $ 705Actuarial liabilities 5,466 – 3,093 – (1) (115) 8,443Pensions and post-employment benefits 242 – 4 (20) – – 226Tax credits 261 – (253) – – (8) –Accrued interest 1 – – – – – 1Real estate (959) – (110) – – 23 (1,046)Securities and other investments (2,689) – (1,863) (347) 39 156 (4,704)Sale of investments (87) – 17 – – 1 (69)Goodwill and intangible assets (847) – (49) – – 20 (876)Other 97 (37) (107) 1 (31) (1) (78)Total $ 2,504 $ (55) $ 454 $ (366) $ 6 $ 59 $ 2,602
The total deferred tax assets as at December 31, 2020 of $4,842 (2019 – $4,574) includes $1,005 (2019 – $98) where the Company hassuffered losses in either the current or preceding year and where the recognition is dependent on future taxable profits in the relevantjurisdictions and feasible management actions.
As at December 31, 2020, tax loss carryforwards available were approximately $2,479 (2019 – $3,440) of which $2,321 expire betweenthe years 2022 and 2040 while $137 have no expiry date, and capital loss carryforwards available were approximately $21 (2019 – $31)and have no expiry date. A $497 (2019 – $705) tax benefit related to these tax loss carryforwards has been recognized as a deferred taxasset as at December 31, 2020, and a benefit of $99 (2019 – $93) has not been recognized. In addition, the Company has approximately$154 (2019 – $157) of tax credit carryforwards which will expire between the years 2027 and 2029 of which a benefit of $154 (2019 –$157) has not been recognized.
The total deferred tax liability as at December 31, 2020 was $2,614 (2019 – $1,972). This amount includes the deferred tax liability ofconsolidated entities. The aggregate amount of taxable temporary differences associated with the Company’s own investments insubsidiaries is not included in the Consolidated Financial Statements and was $22,782 (2019 – $19,623).
Note 17 Interests in Structured EntitiesThe Company is involved with both consolidated and unconsolidated structured entities (“SEs”) which are established to generateinvestment and fee income. The Company is also involved with SEs that are used to facilitate financing for the Company. These entities mayhave some or all the following features: control is not readily identified based on voting rights; restricted activities designed to achieve anarrow objective; high amount of leverage; and/or highly structured capital.
The Company only discloses its involvement in significant consolidated and unconsolidated SEs. In assessing the significance, theCompany considers the nature of its involvement with the SE, including whether it is sponsored by the Company (i.e. initially organized andmanaged by the Company). Other factors considered include the Company’s investment in the SE as compared to total investments, itsreturns from the SE as compared to total net investment income, the SE’s size as compared to total funds under management, and itsexposure to any other risks from its involvement with the SE.
The Company does not provide financial or other support to its SEs, when it does not have a contractual obligation to do so.
(a) Consolidated SEs
Investment SEsThe Company acts as an investment manager of timberlands and timber companies. The Company’s general fund and segregated fundsinvest in many of these companies. The Company has control over one timberland company which it manages, Hancock VictoriaPlantations Holdings PTY Limited (“HVPH”). HVPH is a SE primarily because the Company’s employees exercise voting rights over it onbehalf of other investors. As at December 31, 2020, the Company’s consolidated timber assets relating to HVPH were $949 (2019 –$936). The Company does not provide guarantees to other parties against the risk of loss from HVPH.
Financing SEsThe Company securitizes certain insured and variable rate commercial and residential mortgages and HELOC. This activity is facilitated byconsolidated entities that are SEs because their operations are limited to issuing and servicing the Company’s funding. Further informationregarding the Company’s mortgage securitization program is included in note 3.
(b) Unconsolidated SEs
Investment SEsThe following table presents the Company’s investments and maximum exposure to loss from significant unconsolidated investment SEs,some of which are sponsored by the Company. The Company does not provide guarantees to other parties against the risk of loss fromthese SEs.
171

Company’s investment(1)Company’s maximum
exposure to loss(2)
As at December 31, 2020 2019 2020 2019
Leveraged leases(3) $ 3,371 $ 3,371 $ 3,371 $ 3,371Timberland companies(4) 776 752 776 765Real estate companies(5) 497 541 497 541Total $ 4,644 $ 4,664 $ 4,644 $ 4,677(1) The Company’s investments in these unconsolidated SEs are included in invested assets and the Company’s returns from them are included in net investment income and AOCI.(2) The Company’s maximum exposure to loss from each SE is limited to amounts invested in each, plus unfunded capital commitments, if any. The Company’s investment
commitments are disclosed in note 18. The maximum loss is expected to occur only upon the entity’s bankruptcy/liquidation, or in case a natural disaster in the case of thetimber companies.
(3) These entities are statutory business trusts which use capital provided by the Company and senior debt provided by other parties to finance the acquisition of assets. Theseassets are leased to third-party lessees under long-term leases. The Company owns equity capital in these business trusts. The Company does not consolidate any of the truststhat are party to the lease arrangements because the Company does not have decision-making power over them.
(4) These entities own and operate timberlands. The Company invests in their equity and debt. The Company’s returns include investment income, investment advisory fees, forestrymanagement fees and performance advisory fees. The Company does not control these entities because it either does not have the power to govern their financial and operatingpolicies or does not have significant variable returns from them, or both.
(5) These entities, which include the Manulife U.S. REIT, own and manage commercial real estate. The Company invests in their equity. The Company’s returns include investmentincome, investment management fees, property management fees, acquisition/disposition fees and leasing fees. The Company does not control these entities because it eitherdoes not have the power to govern their financial and operating policies or does not have significant variable returns from them, or both.
Financing SEsThe Company’s interests and maximum exposure to loss from significant unconsolidated financing SEs are as follows.
Company’s interests(1)
As at December 31, 2020 2019
Manulife Finance (Delaware), L.P.(2) $ 931 $ 852Manulife Financial Capital Trust II(3) – 1Total $ 931 $ 853(1) The Company’s interests include amounts borrowed from the SEs and the Company’s investment in their subordinated capital, and foreign currency and interest swaps with
them, if any.(2) This entity is a wholly owned partnership used to facilitate the Company’s financing. Refer to notes 10 and 18.(3) This entity is an open-ended trust that was used to facilitate the Company’s financing. The Company redeemed all outstanding $1billion principal amount of MFCT II Senior
debenture notes, at par, on December 30, 2019. Using these proceeds, the trust redeemed MFCT II Series 1 held by third parties, at par, on December 31, 2019.
(i) Other invested assetsThe Company has investment relationships with a variety of other entities, which result from its direct investment in their debt and/orequity and which have been assessed for control. These other entities’ investments include but are not limited to investments in power andinfrastructure, oil and gas, private equity, real estate and agriculture, organized as limited partnerships and limited liability companies.Most of these other entities are not sponsored by the Company. The Company’s involvement with these other entities is not individuallysignificant. As such, the Company neither provides summary financial data for these entities nor individually assesses whether they areSEs. The Company’s maximum exposure to losses because of its involvement with these other entities is limited to its investment in themand amounts committed to be invested but not yet funded. The Company records its income from these entities in net investment incomeand AOCI. The Company does not provide guarantees to other parties against the risk of loss from these other entities.
(ii) Interest in securitized assetsThe Company invests in mortgage/asset-backed securities issued by securitization vehicles sponsored by other parties, including privateissuers and government sponsored issuers, to generate investment income. The Company does not own a controlling financial interest inany of the issuers. These securitization vehicles are SEs based on their narrow scope of activities and highly leveraged capital structures.Investments in mortgage/asset-backed securities are reported on the Consolidated Statements of Financial Position as debt securities andprivate placements, and their fair value and carrying value are disclosed in note 3. The Company’s maximum loss from these investments islimited to amounts invested.
Commercial mortgage-backed securities (“CMBS”) are secured by commercial mortgages and residential mortgage-backed securities(“RMBS”) are secured by residential mortgages. Asset-backed securities (“ABS”) may be secured by various underlying assets includingcredit card receivables, automobile loans and aviation leases. The mortgage/asset-backed securities that the Company invests in primarilyoriginate in North America.
172 | 2020 Annual Report | Notes to Consolidated Financial Statements

The following table presents investments in securitized holdings by the type and asset quality.
2020 2019
As at December 31, CMBS RMBS ABS Total Total
AAA $ 1,438 $ 7 $ 1,020 $ 2,465 $ 2,805AA – – 32 32 648A 53 3 605 661 372BBB – – 208 208 63BB and below – – 76 76 –Total company exposure $ 1,491 $ 10 $ 1,941 $ 3,442 $ 3,888
(iii) Mutual fundsThe Company sponsors and may invest in a range of public mutual funds with a broad range of investment styles. As sponsor, the Companyorganizes mutual funds that implement investment strategies on behalf of current and future investors. The Company earns fees which areat market rates for providing advisory and administrative services to these mutual funds. Generally, the Company does not control itssponsored mutual funds because either the Company does not have power to govern their financial and operating policies, or its returns inthe form of fees and ownership interests are not significant, or both. Certain mutual funds are SEs because their decision-making rightsare not vested in voting equity interests and their investors are provided with redemption rights.
The Company’s relationships with these mutual funds are not individually significant. As such, the Company neither provides summaryfinancial data for these mutual funds nor individually assesses whether they are SEs. The Company’s interest in mutual funds is limited toits investment and fees earned, if any. The Company’s investments in mutual funds are recorded as part of its investment in public equitieswithin the Consolidated Statements of Financial Position. For information regarding the Company’s invested assets, refer to note 3. TheCompany does not provide guarantees to other parties against the risk of loss from these mutual funds.
As sponsor, the Company’s investment in (“seed”) startup capital of mutual funds as at December 31, 2020 was $1,428 (2019 – $1,576).The Company’s retail mutual fund assets under management as at December 31, 2020 were $238,068 (2019 – $217,015).
Note 18 Commitments and Contingencies(a) Legal proceedingsThe Company is regularly involved in legal actions, both as a defendant and as a plaintiff. The legal actions where the Company is a partyordinarily relate to its activities as a provider of insurance protection or wealth management products, reinsurance, or in its capacity as aninvestment adviser, employer, or taxpayer. Other life insurers and asset managers, operating in the jurisdictions in which the Companydoes business, have been subject to a wide variety of other types of actions, some of which resulted in substantial judgments orsettlements against the defendants; it is possible that the Company may become involved in similar actions in the future. In addition,government and regulatory bodies in Canada, the United States, Asia and other jurisdictions where the Company conducts businessregularly make inquiries and, from time to time, require the production of information or conduct examinations concerning the Company’scompliance with, among other things, insurance laws, securities laws, and laws governing the activities of broker-dealers.
In June 2018, a class action was initiated against John Hancock Life Insurance Company (U.S.A.) (“JHUSA”) and John Hancock LifeInsurance Company of New York (“JHNY”) in the U.S. District Court for the Southern District of New York on behalf of owners ofapproximately 1,500 Performance Universal Life (“UL”) policies issued between 2003 and 2009 whose policies were subject to a Cost ofInsurance (“COI”) increase announced in 2018. In October 2018, a second and almost identical class action was initiated against JHUSAand JHNY in the U.S. District Court for the Southern District of New York. The two cases were determined to be related, and they wereconsolidated and assigned to the same judge. Discovery has commenced in these cases. No hearings on substantive matters have beenscheduled. It is too early to assess the range of potential outcomes for these two related lawsuits. In addition to the consolidated classaction, there are seven non-class lawsuits opposing the Performance UL COI increases that also have been filed. Each of the lawsuits,except one, is brought by plaintiffs owning multiple policies and by entities managing them for investment purposes. Two of the non-classlawsuits are pending in New York state court; two of the lawsuits are pending in the U.S. District Court for the Southern District of NewYork; and three lawsuits are pending in the U.S. District Court for the Central District of California. Whether individually or on a combinedbasis, it remains premature, given the procedural status of these cases, as well as the relatively early development of parties’ respectivelegal theories, to suggest a reliable estimate of potential outcomes.
(b) Investment commitmentsIn the normal course of business, various investment commitments are outstanding which are not reflected in the Consolidated FinancialStatements. There were $9,937 (2019 – $8,682) of outstanding investment commitments as at December 31, 2020, of which $638(2019 – $411) mature in 30 days, $2,634 (2019 – $2,507) mature in 31 to 365 days and $6,665 (2019 – $5,764) mature after one year.
173

(c) Letters of creditIn the normal course of business, third-party relationship banks issue letters of credit on the Company’s behalf. The Company’s businessesutilize letters of credit for which third parties are the beneficiaries, as well as for affiliate reinsurance transactions between its subsidiaries.As at December 31, 2020, letters of credit for which third parties are beneficiary, in the amount of $103 (2019 – $57), were outstanding.
(d) Guarantees
(i) Guarantees regarding Manulife Finance (Delaware), L.P. (“MFLP”)MFC has guaranteed the payment of amounts on the $650 subordinated debentures due on December 15, 2041 issued by MFLP, a whollyowned unconsolidated partnership.
(ii) Guarantees regarding The Manufacturers Life Insurance CompanyMFC has provided a subordinated guarantee on the day of issuance for the following subordinated debentures issued by MLI: $350 issuedon June 1, 2015; and $1,000 issued on November 20, 2015.
The following table presents certain condensed consolidated financial information for MFC and MFLP.
Condensed Consolidated Statements of Income Information
For the year ended December 31, 2020MFC
(Guarantor)MLI
consolidated
Othersubsidiaries of
MFC on acombined basis
Consolidationadjustments
Totalconsolidated
amounts MFLP
Total revenue $ 547 $ 78,929 $ 520 $ (1,088) $ 78,908 $ 32Net income (loss) attributed to shareholders 5,871 6,179 (500) (5,679) 5,871 (1)
For the year ended December 31, 2019MFC
(Guarantor)MLI
consolidated
Othersubsidiaries of
MFC on acombined basis
Consolidationadjustments
Totalconsolidated
amounts MFLP
Total revenue $ 371 $ 79,711 $ 417 $ (929) $ 79,570 $ 32Net income (loss) attributed to shareholders 5,602 5,963 (401) (5,562) 5,602 (1)
Condensed Consolidated Statements of Financial Position
As at December 31, 2020MFC
(Guarantor)MLI
consolidated
Othersubsidiaries of
MFC on acombined basis
Consolidationadjustments
Totalconsolidated
amounts MFLP
Invested assets $ 47 $ 410,919 $ 11 $ – $ 410,977 $ 5Total other assets 64,419 102,439 3 (64,925) 101,936 1,166Segregated funds net assets – 367,436 – – 367,436 –Insurance contract liabilities – 385,554 – – 385,554 –Investment contract liabilities – 3,288 – – 3,288 –Segregated funds net liabilities – 367,436 – – 367,436 –Total other liabilities 12,131 59,683 – (749) 71,065 936
As at December 31, 2019MFC
(Guarantor)MLI
consolidated
Othersubsidiaries of
MFC on acombined basis
Consolidationadjustments
Totalconsolidated
amounts MFLP
Invested assets $ 21 $ 378,496 $ 10 $ – $ 378,527 $ 6Total other assets 57,474 87,774 3 (57,756) 87,495 1,088Segregated funds net assets – 343,108 – – 343,108 –Insurance contract liabilities – 351,161 – – 351,161 –Investment contract liabilities – 3,104 – – 3,104 –Segregated funds net liabilities – 343,108 – – 343,108 –Total other liabilities 8,357 53,998 – (704) 61,651 858
(iii) Guarantees regarding John Hancock Life Insurance Company (U.S.A.) (“JHUSA”)Details of guarantees regarding certain securities issued or to be issued by JHUSA are outlined in note 23.
174 | 2020 Annual Report | Notes to Consolidated Financial Statements

(e) Pledged assetsIn the normal course of business, the Company pledges its assets in respect of liabilities incurred, strictly for providing collateral to thecounterparty. In the event of the Company’s default, the counterparty is entitled to apply the collateral to settle the liability. The pledgedassets are returned to the Company if the underlying transaction is terminated or, in the case of derivatives, if there is a decrease in the netexposure due to market value changes.
The amounts pledged are as follows.
2020 2019
As at December 31, Debt securities Other Debt securities Other
In respect of:Derivatives $ 5,924 $ 35 $ 4,257 $ 17Secured borrowings(1) – 2,790 – –Regulatory requirements 452 80 433 67Repurchase agreements 353 – 330 –Non-registered retirement plans in trust – 424 – 407Other 2 302 3 331
Total $ 6,731 $ 3,631 $ 5,023 $ 822(1) During the year, the Company pledged its mortgage loans with the Federal Home Loan Bank of Indianapolis (“FHLBI”). Of this amount, $937 is required collateral for the
US$500 outstanding borrowing to JHUSA under the FHLBI facility; and $1,853 is excess collateral that can be called back by JHUSA at any time.
(f) Participating businessIn some territories where the Company maintains participating accounts, there are regulatory restrictions on the amounts of profit that canbe transferred to shareholders. Where applicable, these restrictions generally take the form of a fixed percentage of policyholderdividends. For participating businesses operating as separate “closed blocks”, transfers are governed by the terms of MLI’s and JohnHancock Mutual Life Insurance Company’s plans of demutualization.
(g) Fixed surplus notesA third party contractually provides standby financing arrangements for the Company’s U.S. operations under which, in certaincircumstances, funds may be provided in exchange for the issuance of fixed surplus notes. As at December 31, 2020, the Company had nofixed surplus notes outstanding.
Note 19 Segmented InformationThe Company’s reporting segments are Asia, Canada, U.S., Global WAM and Corporate and Other. Each reporting segment is responsiblefor managing its operating results, developing products, defining strategies for services and distribution based on the profile and needs ofits business and market. The Company’s significant product and service offerings by the reporting segments are mentioned below.
Wealth and asset management businesses (Global WAM) – include mutual funds and exchange-traded funds, group retirement andsavings products, and institutional asset management services across all major asset classes. These products and services are distributedthrough multiple distribution channels, including agents and brokers affiliated with the Company, independent securities brokerage firmsand financial advisors pension plan consultants and banks.
Insurance and annuity products (Asia, Canada and U.S.) – includes a variety of individual life insurance, individual and group long-termcare insurance and guaranteed and partially guaranteed annuity products. Products are distributed through multiple distribution channels,including insurance agents, brokers, banks, financial planners and direct marketing. Manulife Bank of Canada offers a variety of depositand credit products to Canadian customers.
Corporate and Other Segment – comprised of investment performance on assets backing capital, net of amounts allocated to operatingsegments; costs incurred by the corporate office related to shareholder activities (not allocated to operating segments); financing costs;Property and Casualty (“P&C”) Reinsurance Business; and run-off reinsurance operations including variable annuities and accident andhealth.
175

Reporting segments
As at and for the year ended December 31, 2020 Asia Canada U.S. Global WAMCorporateand Other Total
RevenueLife and health insurance $ 17,983 $ 8,833 $ 3,011 $ – $ 140 $ 29,967Annuities and pensions 2,496 334 120 – – 2,950Net premium income 20,479 9,167 3,131 – 140 32,917Net investment income (loss) 6,630 8,458 17,519 39 2,754 35,400Other revenue 1,346 1,013 2,711 5,710 (189) 10,591Total revenue 28,455 18,638 23,361 5,749 2,705 78,908Contract benefits and expensesLife and health insurance 17,997 10,385 16,099 – (131) 44,350Annuities and pensions 3,430 4,380 2,929 146 – 10,885Net benefits and claims 21,427 14,765 19,028 146 (131) 55,235Interest expense 269 342 54 2 514 1,181Other expenses 5,123 3,141 2,714 4,329 414 15,721Total contract benefits and expenses 26,819 18,248 21,796 4,477 797 72,137Income (loss) before income taxes 1,636 390 1,565 1,272 1,908 6,771Income tax recovery (expense) (233) (131) (296) (172) (363) (1,195)Net income (loss) 1,403 259 1,269 1,100 1,545 5,576Less net income (loss) attributed to:
Non-controlling interests 250 – – – – 250Participating policyholders (609) 64 – – – (545)
Net income (loss) attributed to shareholders $ 1,762 $ 195 $ 1,269 $ 1,100 $ 1,545 $ 5,871Total assets $ 145,801 $ 167,236 $ 288,814 $ 236,593 $ 41,905 $ 880,349
The following table presents results by reportingsegments.
As at and for the year ended December 31, 2019 Asia Canada U.S. Global WAMCorporateand Other Total
RevenueLife and health insurance $ 17,107 $ 8,714 $ 6,522 $ – $ 112 $ 32,455Annuities and pensions 2,900 361 (138) – – 3,123Net premium income 20,007 9,075 6,384 – 112 35,578Net investment income (loss) 7,451 9,446 15,556 33 1,107 33,593Other revenue 1,215 1,088 2,654 5,562 (120) 10,399Total revenue 28,673 19,609 24,594 5,595 1,099 79,570Contract benefits and expensesLife and health insurance 17,975 10,572 19,320 – (36) 47,831Annuities and pensions 3,090 4,312 599 83 – 8,084Net benefits and claims 21,065 14,884 19,919 83 (36) 55,915Interest expense 236 508 43 6 526 1,319Other expenses 5,148 3,237 2,944 4,362 425 16,116Total contract benefits and expenses 26,449 18,629 22,906 4,451 915 73,350Income (loss) before income taxes 2,224 980 1,688 1,144 184 6,220Income tax recovery (expense) (277) 25 (260) (122) (84) (718)Net income (loss) 1,947 1,005 1,428 1,022 100 5,502Less net income (loss) attributed to:
Non-controlling interests 228 – – – 5 233Participating policyholders (216) (117) – – – (333)
Net income (loss) attributed to shareholders $ 1,935 $ 1,122 $ 1,428 $ 1,022 $ 95 $ 5,602Total assets $ 127,367 $ 159,042 $ 274,993 $ 216,348 $ 31,380 $ 809,130
Geographical locationThe results of the Company’s reporting segments differ from its geographical location primarily due to the allocation of Global WAM andCorporate and Other segments into the geographical location to which its businesses relate.
176 | 2020 Annual Report | Notes to Consolidated Financial Statements
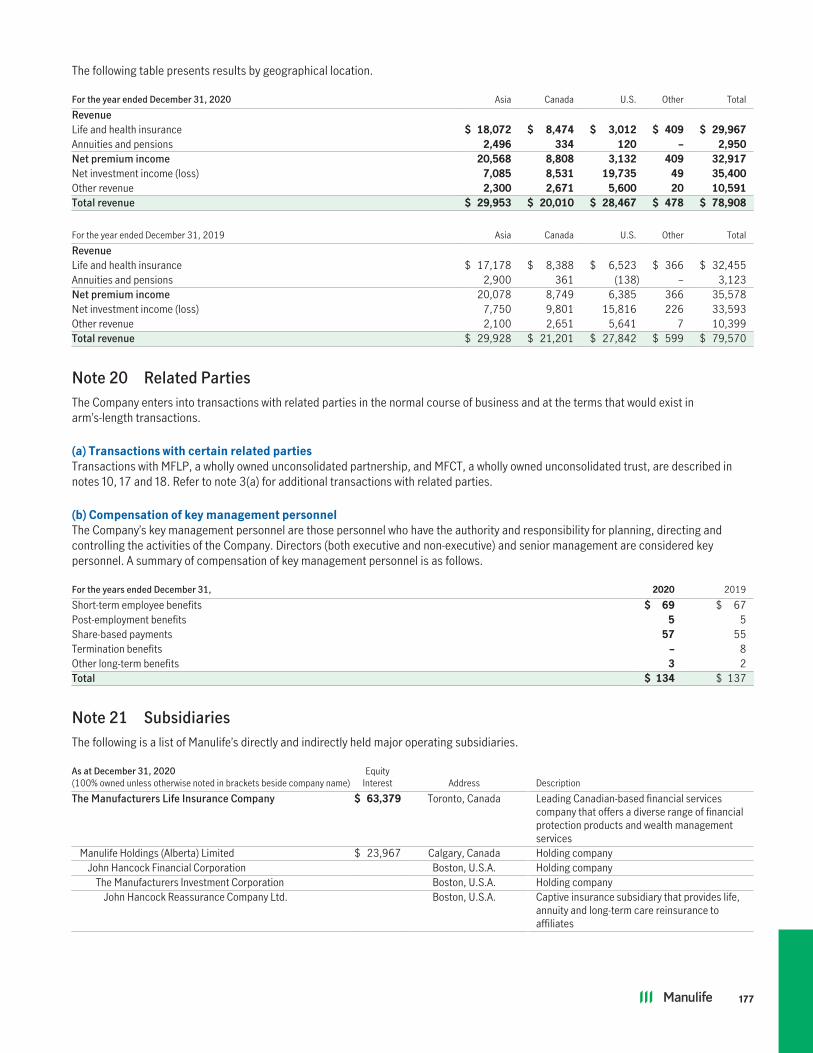
The following table presents results by geographical location.
For the year ended December 31, 2020 Asia Canada U.S. Other Total
RevenueLife and health insurance $ 18,072 $ 8,474 $ 3,012 $ 409 $ 29,967Annuities and pensions 2,496 334 120 – 2,950Net premium income 20,568 8,808 3,132 409 32,917Net investment income (loss) 7,085 8,531 19,735 49 35,400Other revenue 2,300 2,671 5,600 20 10,591Total revenue $ 29,953 $ 20,010 $ 28,467 $ 478 $ 78,908
For the year ended December 31, 2019 Asia Canada U.S. Other Total
RevenueLife and health insurance $ 17,178 $ 8,388 $ 6,523 $ 366 $ 32,455Annuities and pensions 2,900 361 (138) – 3,123Net premium income 20,078 8,749 6,385 366 35,578Net investment income (loss) 7,750 9,801 15,816 226 33,593Other revenue 2,100 2,651 5,641 7 10,399Total revenue $ 29,928 $ 21,201 $ 27,842 $ 599 $ 79,570
Note 20 Related PartiesThe Company enters into transactions with related parties in the normal course of business and at the terms that would exist inarm’s-length transactions.
(a) Transactions with certain related partiesTransactions with MFLP, a wholly owned unconsolidated partnership, and MFCT, a wholly owned unconsolidated trust, are described innotes 10, 17 and 18. Refer to note 3(a) for additional transactions with related parties.
(b) Compensation of key management personnelThe Company’s key management personnel are those personnel who have the authority and responsibility for planning, directing andcontrolling the activities of the Company. Directors (both executive and non-executive) and senior management are considered keypersonnel. A summary of compensation of key management personnel is as follows.
For the years ended December 31, 2020 2019
Short-term employee benefits $ 69 $ 67Post-employment benefits 5 5Share-based payments 57 55Termination benefits – 8Other long-term benefits 3 2Total $ 134 $ 137
Note 21 SubsidiariesThe following is a list of Manulife’s directly and indirectly held major operating subsidiaries.
As at December 31, 2020(100% owned unless otherwise noted in brackets beside company name)
EquityInterest Address Description
The Manufacturers Life Insurance Company $ 63,379 Toronto, Canada Leading Canadian-based financial servicescompany that offers a diverse range of financialprotection products and wealth managementservices
Manulife Holdings (Alberta) Limited $ 23,967 Calgary, Canada Holding companyJohn Hancock Financial Corporation Boston, U.S.A. Holding company
The Manufacturers Investment Corporation Boston, U.S.A. Holding companyJohn Hancock Reassurance Company Ltd. Boston, U.S.A. Captive insurance subsidiary that provides life,
annuity and long-term care reinsurance toaffiliates
177
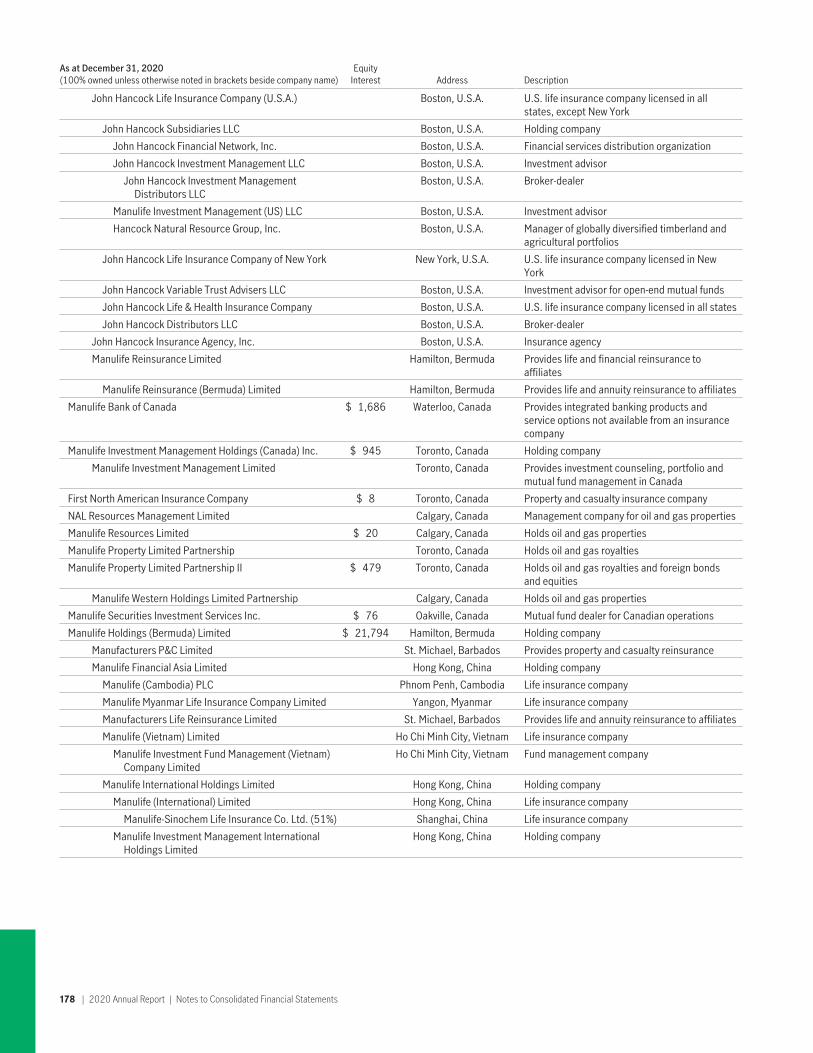
As at December 31, 2020(100% owned unless otherwise noted in brackets beside company name)
EquityInterest Address Description
John Hancock Life Insurance Company (U.S.A.) Boston, U.S.A. U.S. life insurance company licensed in allstates, except New York
John Hancock Subsidiaries LLC Boston, U.S.A. Holding company
John Hancock Financial Network, Inc. Boston, U.S.A. Financial services distribution organization
John Hancock Investment Management LLC Boston, U.S.A. Investment advisor
John Hancock Investment ManagementDistributors LLC
Boston, U.S.A. Broker-dealer
Manulife Investment Management (US) LLC Boston, U.S.A. Investment advisor
Hancock Natural Resource Group, Inc. Boston, U.S.A. Manager of globally diversified timberland andagricultural portfolios
John Hancock Life Insurance Company of New York New York, U.S.A. U.S. life insurance company licensed in NewYork
John Hancock Variable Trust Advisers LLC Boston, U.S.A. Investment advisor for open-end mutual funds
John Hancock Life & Health Insurance Company Boston, U.S.A. U.S. life insurance company licensed in all states
John Hancock Distributors LLC Boston, U.S.A. Broker-dealer
John Hancock Insurance Agency, Inc. Boston, U.S.A. Insurance agency
Manulife Reinsurance Limited Hamilton, Bermuda Provides life and financial reinsurance toaffiliates
Manulife Reinsurance (Bermuda) Limited Hamilton, Bermuda Provides life and annuity reinsurance to affiliates
Manulife Bank of Canada $ 1,686 Waterloo, Canada Provides integrated banking products andservice options not available from an insurancecompany
Manulife Investment Management Holdings (Canada) Inc. $ 945 Toronto, Canada Holding company
Manulife Investment Management Limited Toronto, Canada Provides investment counseling, portfolio andmutual fund management in Canada
First North American Insurance Company $ 8 Toronto, Canada Property and casualty insurance company
NAL Resources Management Limited Calgary, Canada Management company for oil and gas properties
Manulife Resources Limited $ 20 Calgary, Canada Holds oil and gas properties
Manulife Property Limited Partnership Toronto, Canada Holds oil and gas royalties
Manulife Property Limited Partnership II $ 479 Toronto, Canada Holds oil and gas royalties and foreign bondsand equities
Manulife Western Holdings Limited Partnership Calgary, Canada Holds oil and gas properties
Manulife Securities Investment Services Inc. $ 76 Oakville, Canada Mutual fund dealer for Canadian operations
Manulife Holdings (Bermuda) Limited $ 21,794 Hamilton, Bermuda Holding company
Manufacturers P&C Limited St. Michael, Barbados Provides property and casualty reinsurance
Manulife Financial Asia Limited Hong Kong, China Holding company
Manulife (Cambodia) PLC Phnom Penh, Cambodia Life insurance company
Manulife Myanmar Life Insurance Company Limited Yangon, Myanmar Life insurance company
Manufacturers Life Reinsurance Limited St. Michael, Barbados Provides life and annuity reinsurance to affiliates
Manulife (Vietnam) Limited Ho Chi Minh City, Vietnam Life insurance company
Manulife Investment Fund Management (Vietnam)Company Limited
Ho Chi Minh City, Vietnam Fund management company
Manulife International Holdings Limited Hong Kong, China Holding company
Manulife (International) Limited Hong Kong, China Life insurance company
Manulife-Sinochem Life Insurance Co. Ltd. (51%) Shanghai, China Life insurance company
Manulife Investment Management InternationalHoldings Limited
Hong Kong, China Holding company
178 | 2020 Annual Report | Notes to Consolidated Financial Statements
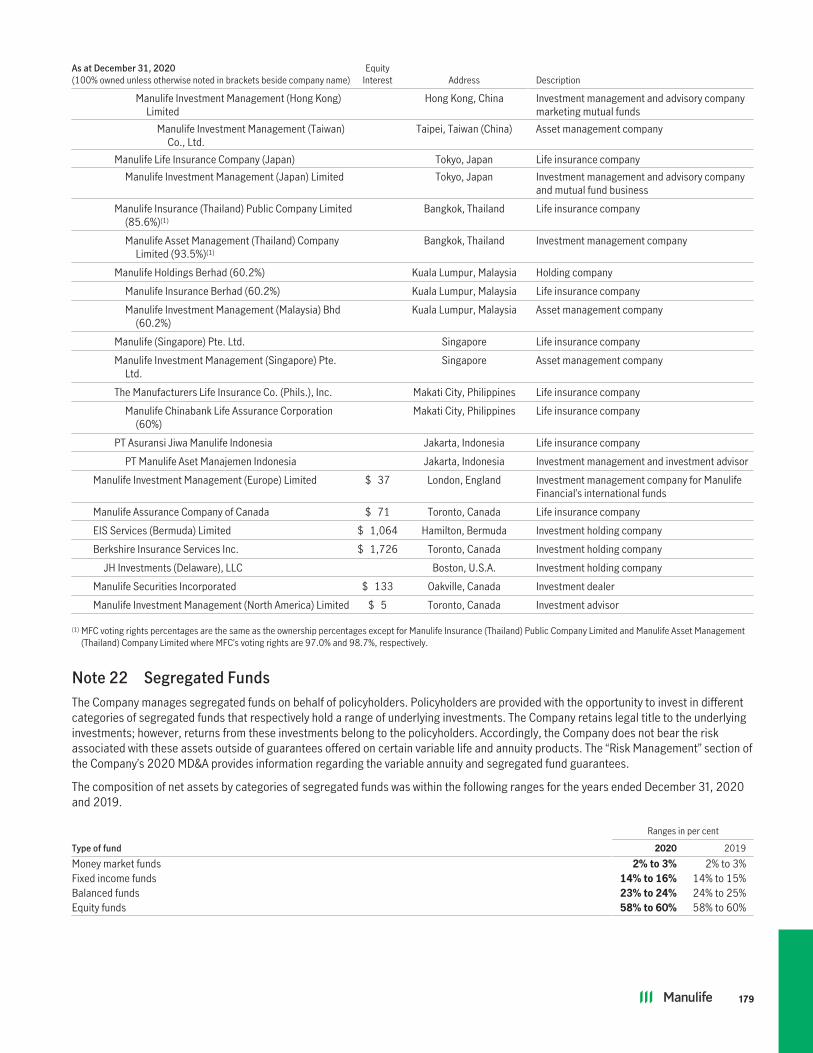
As at December 31, 2020(100% owned unless otherwise noted in brackets beside company name)
EquityInterest Address Description
Manulife Investment Management (Hong Kong)Limited
Hong Kong, China Investment management and advisory companymarketing mutual funds
Manulife Investment Management (Taiwan)Co., Ltd.
Taipei, Taiwan (China) Asset management company
Manulife Life Insurance Company (Japan) Tokyo, Japan Life insurance company
Manulife Investment Management (Japan) Limited Tokyo, Japan Investment management and advisory companyand mutual fund business
Manulife Insurance (Thailand) Public Company Limited(85.6%)(1)
Bangkok, Thailand Life insurance company
Manulife Asset Management (Thailand) CompanyLimited (93.5%)(1)
Bangkok, Thailand Investment management company
Manulife Holdings Berhad (60.2%) Kuala Lumpur, Malaysia Holding company
Manulife Insurance Berhad (60.2%) Kuala Lumpur, Malaysia Life insurance company
Manulife Investment Management (Malaysia) Bhd(60.2%)
Kuala Lumpur, Malaysia Asset management company
Manulife (Singapore) Pte. Ltd. Singapore Life insurance company
Manulife Investment Management (Singapore) Pte.Ltd.
Singapore Asset management company
The Manufacturers Life Insurance Co. (Phils.), Inc. Makati City, Philippines Life insurance company
Manulife Chinabank Life Assurance Corporation(60%)
Makati City, Philippines Life insurance company
PT Asuransi Jiwa Manulife Indonesia Jakarta, Indonesia Life insurance company
PT Manulife Aset Manajemen Indonesia Jakarta, Indonesia Investment management and investment advisor
Manulife Investment Management (Europe) Limited $ 37 London, England Investment management company for ManulifeFinancial’s international funds
Manulife Assurance Company of Canada $ 71 Toronto, Canada Life insurance company
EIS Services (Bermuda) Limited $ 1,064 Hamilton, Bermuda Investment holding company
Berkshire Insurance Services Inc. $ 1,726 Toronto, Canada Investment holding company
JH Investments (Delaware), LLC Boston, U.S.A. Investment holding company
Manulife Securities Incorporated $ 133 Oakville, Canada Investment dealer
Manulife Investment Management (North America) Limited $ 5 Toronto, Canada Investment advisor
(1) MFC voting rights percentages are the same as the ownership percentages except for Manulife Insurance (Thailand) Public Company Limited and Manulife Asset Management(Thailand) Company Limited where MFC’s voting rights are 97.0% and 98.7%, respectively.
Note 22 Segregated FundsThe Company manages segregated funds on behalf of policyholders. Policyholders are provided with the opportunity to invest in differentcategories of segregated funds that respectively hold a range of underlying investments. The Company retains legal title to the underlyinginvestments; however, returns from these investments belong to the policyholders. Accordingly, the Company does not bear the riskassociated with these assets outside of guarantees offered on certain variable life and annuity products. The “Risk Management” section ofthe Company’s 2020 MD&A provides information regarding the variable annuity and segregated fund guarantees.
The composition of net assets by categories of segregated funds was within the following ranges for the years ended December 31, 2020and 2019.
Ranges in per cent
Type of fund 2020 2019
Money market funds 2% to 3% 2% to 3%Fixed income funds 14% to 16% 14% to 15%Balanced funds 23% to 24% 24% to 25%Equity funds 58% to 60% 58% to 60%
179

Money market funds consist of investments that have a term to maturity of less than one year. Fixed income funds primarily consist ofinvestments in fixed grade income securities and may contain smaller investments in diversified equities or high-yield bonds. Relative tofixed income funds, balanced funds consist of fixed income securities and a larger equity investment component. The types of equity fundsavailable to policyholders range from low volatility equity funds to aggressive equity funds. Equity funds invest in a varying mix of Canadian,U.S. and global equities.
The underlying investments of the segregated funds consist of both individual securities and mutual funds (collectively “net assets”), someof which may be structured entities. The carrying value and change in segregated funds net assets are as follows. Fair value relatedinformation of segregated funds is disclosed in note 3(g).
Segregated funds net assets
As at December 31, 2020 2019
Investments at market valueCash and short-term securities $ 4,054 $ 3,364Debt securities 17,913 16,883Equities 14,227 12,989Mutual funds 326,889 304,753Other investments 4,599 4,785
Accrued investment income 1,670 1,678Other assets and liabilities, net (1,543) (975)Total segregated funds net assets $ 367,809 $ 343,477Composition of segregated funds net assetsHeld by policyholders $ 367,436 $ 343,108Held by the Company 373 369Total segregated funds net assets $ 367,809 $ 343,477
Changes in segregated funds net assets
For the years ended December 31, 2020 2019
Net policyholder cash flowDeposits from policyholders $ 38,898 $ 38,561Net transfers to general fund (1,515) (1,000)Payments to policyholders (44,818) (49,372)
(7,435) (11,811)Investment relatedInterest and dividends 16,775 18,872Net realized and unrealized investment gains (losses) 24,514 37,643
41,289 56,515OtherManagement and administration fees (3,942) (3,926)Impact of changes in foreign exchange rates (5,580) (10,897)
(9,522) (14,823)Net additions 24,332 29,881Segregated funds net assets, beginning of year 343,477 313,596Segregated funds net assets, end of year $ 367,809 $ 343,477
Segregated funds assets may be exposed to a variety of financial and other risks. These risks are primarily mitigated by investmentguidelines that are actively monitored by professional and experienced portfolio advisors. The Company is not exposed to these risksbeyond the liabilities related to guarantees associated with certain variable life and annuity products. Accordingly, the Company’sexposure to loss from segregated fund products is limited to the value of these guarantees.
These guarantees are recorded within the Company’s insurance contract liabilities. Assets supporting these guarantees are recognized ininvested assets according to their investment type.
Note 23 Information Provided in Connection with Investments in Deferred Annuity Contracts andSignatureNotes Issued or Assumed by John Hancock Life Insurance Company (U.S.A.)The following condensed consolidated financial information, presented in accordance with IFRS, and the related disclosure have beenincluded in these Consolidated Financial Statements with respect to JHUSA in compliance with Regulation S-X and Rule 12h-5 of the UnitedStates Securities and Exchange Commission (the “Commission”). These financial statements are incorporated by reference in the MFC andits subsidiaries registration statements that are described below and which relate to MFC’s guarantee of certain securities to be issued byits subsidiaries.
180 | 2020 Annual Report | Notes to Consolidated Financial Statements

JHUSA maintains a book of deferred annuity contracts that feature a market value adjustment, some of which are registered with theCommission. The deferred annuity contracts may contain variable investment options along with fixed investment period options, or mayoffer only fixed investment period options. The fixed investment period options enable the participant to invest fixed amounts of money forfixed terms at fixed interest rates, subject to a market value adjustment if the participant desires to terminate a fixed investment periodbefore its maturity date. The annuity contract provides for the market value adjustment to keep the parties whole with respect to the fixedinterest bargain for the entire fixed investment period. These fixed investment period options that contain a market value adjustmentfeature are referred to as “MVAs”.
JHUSA may also sell medium-term notes to retail investors under its SignatureNotes program.
Effective December 31, 2009, John Hancock Variable Life Insurance Company (the “Variable Company”) and John Hancock Life InsuranceCompany (the “Life Company”) merged with and into JHUSA. In connection with the mergers, JHUSA assumed the Variable Company’srights and obligations with respect to the MVAs issued by the Variable Company and the Life Company’s rights and obligations with respectto the SignatureNotes issued by the Life Company.
MFC fully and unconditionally guaranteed the payment of JHUSA’s obligations under the MVAs and under the SignatureNotes (includingthe MVAs and SignatureNotes assumed by JHUSA in the merger), and such MVAs and the SignatureNotes were registered with theCommission. The SignatureNotes and MVAs assumed or issued by JHUSA are collectively referred to in this note as the “GuaranteedSecurities”. JHUSA is, and each of the Variable Company and the Life Company was, a wholly owned subsidiary of MFC.
MFC’s guarantees of the Guaranteed Securities are unsecured obligations of MFC and are subordinated in right of payment to the priorpayment in full of all other obligations of MFC, except for other guarantees or obligations of MFC which by their terms are designated asranking equally in right of payment with or subordinate to MFC’s guarantees of the Guaranteed Securities.
The laws of the State of New York govern MFC’s guarantees of the SignatureNotes issued or assumed by JHUSA and the laws of theCommonwealth of Massachusetts govern MFC’s guarantees of the MVAs issued or assumed by JHUSA. MFC has consented to thejurisdiction of the courts of New York and Massachusetts. However, because a substantial portion of MFC’s assets are located outside theUnited States, the assets of MFC located in the United States may not be sufficient to satisfy a judgment given by a federal or state court inthe United States to enforce the subordinate guarantees. In general, the federal laws of Canada and the laws of the Province of Ontario,where MFC’s principal executive offices are located, permit an action to be brought in Ontario to enforce such a judgment provided thatsuch judgment is subsisting and unsatisfied for a fixed sum of money and not void or voidable in the United States and a Canadian courtwill render a judgment against MFC in a certain dollar amount, expressed in Canadian dollars, subject to customary qualificationsregarding fraud, violations of public policy, laws limiting the enforcement of creditor’s rights and applicable statutes of limitations onjudgments. There is currently no public policy in effect in the Province of Ontario that would support avoiding the recognition andenforcement in Ontario of a judgment of a New York or Massachusetts court on MFC’s guarantees of the SignatureNotes issued orassumed by JHUSA or a Massachusetts court on guarantees of the MVAs issued or assumed by JHUSA.
MFC is a holding company. MFC’s assets primarily consist of investments in its subsidiaries. MFC’s cash flows primarily consist of dividendsand interest payments from its operating subsidiaries, offset by expenses and shareholder dividends and MFC stock repurchases. As aholding company, MFC’s ability to meet its cash requirements, including, but not limited to, paying any amounts due under its guarantees,substantially depends upon dividends from its operating subsidiaries.
These subsidiaries are subject to certain regulatory restrictions under laws in Canada, the United States and certain other countries, whichmay limit their ability to pay dividends or make contributions or loans to MFC. For example, some of MFC’s subsidiaries are subject torestrictions prescribed by the ICA on their ability to declare and pay dividends. The restrictions related to dividends imposed by the ICA aredescribed in note 12.
In the United States, insurance laws in Michigan, New York, and Massachusetts, the jurisdictions in which certain of MFC’s U.S. insurancecompany subsidiaries are domiciled, impose general limitations on the payment of dividends and other upstream distributions or loans bythese insurance subsidiaries. These limitations are described in note 12.
In Asia, the insurance laws of the jurisdictions in which MFC operates either provide for specific restrictions on the payment of dividends orother distributions or loans by subsidiaries or impose solvency or other financial tests, which could affect the ability of subsidiaries to paydividends in certain circumstances.
There can be no assurance that any current or future regulatory restrictions in Canada, the United States or Asia will not impair MFC’sability to meet its cash requirements, including, but not limited to, paying any amounts due under its guarantees.
The following condensed consolidated financial information, presented in accordance with IFRS, reflects the effects of the mergers and isprovided in compliance with Regulation S-X and in accordance with Rule 12h-5 of the Commission.
181

Condensed Consolidated Statement of Financial Position
As at December 31, 2020MFC
(Guarantor)JHUSA
(Issuer)Other
subsidiariesConsolidation
adjustmentsConsolidated
MFC
AssetsInvested assets $ 47 $ 112,735 $ 298,524 $ (329) $ 410,977Investments in unconsolidated subsidiaries 64,209 8,078 17,194 (89,481) –Reinsurance assets – 65,731 11,172 (31,067) 45,836Other assets 210 25,489 52,648 (22,247) 56,100Segregated funds net assets – 191,955 178,224 (2,743) 367,436Total assets $ 64,466 $ 403,988 $ 557,762 $ (145,867) $ 880,349Liabilities and equityInsurance contract liabilities $ – $ 167,453 $ 249,909 $ (31,808) $ 385,554Investment contract liabilities – 1,208 2,081 (1) 3,288Other liabilities 718 25,594 52,761 (22,001) 57,072Long-term debt 6,164 – – – 6,164Capital instruments 5,249 584 1,996 – 7,829Segregated funds net liabilities – 191,955 178,224 (2,743) 367,436Shareholders’ equity 52,335 17,194 72,120 (89,314) 52,335Participating policyholders’ equity – – (784) – (784)Non-controlling interests – – 1,455 – 1,455Total liabilities and equity $ 64,466 $ 403,988 $ 557,762 $ (145,867) $ 880,349
Condensed Consolidated Statement of Financial Position
As at December 31, 2019MFC
(Guarantor)JHUSA
(Issuer)Other
subsidiariesConsolidation
adjustmentsConsolidated
MFC
AssetsInvested assets $ 21 $ 107,746 $ 271,100 $ (340) $ 378,527Investments in unconsolidated subsidiaries 57,068 7,467 16,983 (81,518) –Reinsurance assets – 61,310 10,080 (29,944) 41,446Other assets 406 20,859 45,111 (20,327) 46,049Segregated funds net assets – 181,982 162,845 (1,719) 343,108Total assets $ 57,495 $ 379,364 $ 506,119 $ (133,848) $ 809,130Liabilities and equityInsurance contract liabilities $ – $ 157,398 $ 224,378 $ (30,615) $ 351,161Investment contract liabilities – 1,091 2,014 (1) 3,104Other liabilities 537 21,311 48,226 (20,086) 49,988Long-term debt 4,543 – – – 4,543Capital instruments 3,277 599 3,244 – 7,120Segregated funds net liabilities – 181,982 162,845 (1,719) 343,108Shareholders’ equity 49,138 16,983 64,444 (81,427) 49,138Participating policyholders’ equity – – (243) – (243)Non-controlling interests – – 1,211 – 1,211Total liabilities and equity $ 57,495 $ 379,364 $ 506,119 $ (133,848) $ 809,130
182 | 2020 Annual Report | Notes to Consolidated Financial Statements

Condensed Consolidated Statement of Income
For the year ended December 31, 2020MFC
(Guarantor)JHUSA
(Issuer)Other
subsidiariesConsolidation
adjustmentsConsolidated
MFC
RevenueGross premiums $ – $ 8,057 $ 34,459 $ (1,108) $ 41,408Premiums ceded to reinsurers – (6,585) (3,014) 1,108 (8,491)
Net premium income – 1,472 31,445 – 32,917Net investment income (loss) 542 14,204 21,727 (1,073) 35,400Net other revenue 5 2,869 12,884 (5,167) 10,591Total revenue 547 18,545 66,056 (6,240) 78,908Contract benefits and expensesNet benefits and claims – 14,804 44,293 (3,862) 55,235Commissions, investment and general expenses 17 3,146 13,573 (1,396) 15,340Other expenses 434 230 1,880 (982) 1,562Total contract benefits and expenses 451 18,180 59,746 (6,240) 72,137Income (loss) before income taxes 96 365 6,310 – 6,771Income tax (expense) recovery (26) 54 (1,223) – (1,195)Income (loss) after income taxes 70 419 5,087 – 5,576Equity in net income (loss) of unconsolidated subsidiaries 5,801 1,344 1,763 (8,908) –Net income (loss) $ 5,871 $ 1,763 $ 6,850 $ (8,908) $ 5,576Net income (loss) attributed to:
Non-controlling interests $ – $ – $ 250 $ – $ 250Participating policyholders – – (545) – (545)Shareholders 5,871 1,763 7,145 (8,908) 5,871
$ 5,871 $ 1,763 $ 6,850 $ (8,908) $ 5,576
Condensed Consolidated Statement of Income
For the year ended December 31, 2019MFC
(Guarantor)JHUSA
(Issuer)Other
subsidiariesConsolidation
adjustmentsConsolidated
MFC
RevenueGross premiums $ – $ 8,599 $ 33,620 $ (1,160) $ 41,059Premiums ceded to reinsurers – (3,575) (3,066) 1,160 (5,481)
Net premium income – 5,024 30,554 – 35,578Net investment income (loss) 355 12,128 22,108 (998) 33,593Net other revenue 16 2,866 11,447 (3,930) 10,399Total revenue 371 20,018 64,109 (4,928) 79,570Contract benefits and expensesNet benefits and claims – 17,133 41,220 (2,438) 55,915Commissions, investment and general expenses 20 3,299 13,938 (1,530) 15,727Other expenses 421 206 2,041 (960) 1,708Total contract benefits and expenses 441 20,638 57,199 (4,928) 73,350Income (loss) before income taxes (70) (620) 6,910 – 6,220Income tax (expense) recovery 18 347 (1,083) – (718)Income (loss) after income taxes (52) (273) 5,827 – 5,502Equity in net income (loss) of unconsolidated subsidiaries 5,654 772 499 (6,925) –Net income (loss) $ 5,602 $ 499 $ 6,326 $ (6,925) $ 5,502Net income (loss) attributed to:
Non-controlling interests $ – $ – $ 233 $ – $ 233Participating policyholders – 2 (333) (2) (333)Shareholders 5,602 497 6,426 (6,923) 5,602
$ 5,602 $ 499 $ 6,326 $ (6,925) $ 5,502
183

Consolidated Statement of Cash Flows
For the year ended December 31, 2020MFC
(Guarantor)JHUSA
(Issuer)Other
subsidiariesConsolidation
adjustmentsConsolidated
MFCOperating activitiesNet income (loss) $ 5,871 $ 1,763 $ 6,850 $ (8,908) $ 5,576Adjustments:
Equity in net income of unconsolidated subsidiaries (5,801) (1,344) (1,763) 8,908 –Increase (decrease) in insurance contract liabilities – 11,937 25,045 – 36,982Increase (decrease) in investment contract liabilities – 48 130 – 178(Increase) decrease in reinsurance assets excluding coinsurance
transactions – (3,133) 759 – (2,374)Amortization of (premium) discount on invested assets – 54 100 – 154Other amortization 7 145 504 – 656Net realized and unrealized (gains) losses and impairment on assets 1 (9,420) (13,102) – (22,521)Deferred income tax expense (recovery) 25 (784) 1,039 – 280Stock option expense – 3 11 – 14
Cash provided by (used in) operating activities before undernoted items 103 (731) 19,573 – 18,945Dividends from unconsolidated subsidiary 3,000 411 1,270 (4,681) –Changes in policy related and operating receivables and payables 91 8,459 (7,447) – 1,103Cash provided by (used in) operating activities 3,194 8,139 13,396 (4,681) 20,048Investing activitiesPurchases and mortgage advances – (34,392) (77,589) – (111,981)Disposals and repayments – 29,635 69,215 – 98,850Changes in investment broker net receivables and payables – (431) (586) – (1,017)Investment in common shares of subsidiaries (4,483) – – 4,483 –Capital contribution to unconsolidated subsidiaries – (1) – 1 –Return of capital from unconsolidated subsidiaries – 22 – (22) –Notes receivable from parent – – 1,501 (1,501) –Notes receivable from subsidiaries 1,494 – – (1,494) –Cash provided by (used in) investing activities (2,989) (5,167) (7,459) 1,467 (14,148)Financing activitiesIssue of long-term debt, net 2,455 – – – 2,455Redemption of long-term debt (652) – – – (652)Issue of capital instruments, net 1,990 – – – 1,990Redemption of capital instruments – – (1,250) – (1,250)Secured borrowings – 709 667 – 1,376Change in repurchase agreements and securities sold but not yet purchased – – 24 – 24Changes in deposits from Bank clients, net – – (579) – (579)Lease payments – (9) (125) – (134)Shareholders’ dividends paid in cash (2,340) – – – (2,340)Dividends paid to parent – (1,270) (3,411) 4,681 –Common shares repurchased (253) – – – (253)Common shares issued, net 36 – 4,483 (4,483) 36Contributions from (distributions to) non-controlling interests, net – – (10) – (10)Capital contributions by parent – – 1 (1) –Return of capital to parent – – (22) 22 –Notes payable to parent – – (1,494) 1,494 –Notes payable to subsidiaries (1,501) – – 1,501 –Cash provided by (used in) financing activities (265) (570) (1,716) 3,214 663Cash and short-term securitiesIncrease (decrease) during the year (60) 2,402 4,221 – 6,563Effect of foreign exchange rate changes on cash and short-term securities 85 (59) (554) – (528)Balance, beginning of year 22 2,564 16,962 – 19,548Balance, end of year 47 4,907 20,629 – 25,583Cash and short-term securitiesBeginning of yearGross cash and short-term securities 22 3,058 17,220 – 20,300Net payments in transit, included in other liabilities – (494) (258) – (752)Net cash and short-term securities, beginning of year 22 2,564 16,962 – 19,548End of yearGross cash and short-term securities 47 5,213 20,907 – 26,167Net payments in transit, included in other liabilities – (306) (278) – (584)Net cash and short-term securities, end of year $ 47 $ 4,907 $ 20,629 $ – $ 25,583Supplemental disclosures on cash flow information:Interest received $ 522 $ 4,334 $ 7,992 $ (1,112) $ 11,736Interest paid 426 109 1,765 (1,112) 1,188Income taxes paid (refund) (2) 721 639 – 1,358
184 | 2020 Annual Report | Notes to Consolidated Financial Statements

Consolidated Statement of Cash Flows
For the year ended December 31, 2019MFC
(Guarantor)JHUSA
(Issuer)Other
subsidiariesConsolidation
adjustmentsConsolidated
MFCOperating activitiesNet income (loss) $ 5,602 $ 499 $ 6,326 $ (6,925) $ 5,502Adjustments:
Equity in net income of unconsolidated subsidiaries (5,654) (772) (499) 6,925 –Increase (decrease) in insurance contract liabilities – 11,381 22,346 – 33,727Increase (decrease) in investment contract liabilities – 51 119 – 170(Increase) decrease in reinsurance assets excluding coinsurance
transactions – (1,236) 679 – (557)Amortization of (premium) discount on invested assets – 40 77 – 117Other amortization 5 118 503 – 626Net realized and unrealized (gains) losses and impairment on assets (12) (7,105) (13,148) – (20,265)Deferred income tax expense (recovery) (18) (192) (244) – (454)Stock option expense – (1) 12 – 11
Cash provided by (used in) operating activities before undernoted items (77) 2,783 16,171 – 18,877Dividends from unconsolidated subsidiary 3,000 623 1,123 (4,746) –Changes in policy related and operating receivables and payables (39) (146) 1,850 – 1,665Cash provided by (used in) operating activities 2,884 3,260 19,144 (4,746) 20,542Investing activitiesPurchases and mortgage advances – (24,898) (55,712) – (80,610)Disposals and repayments – 22,324 43,009 – 65,333Changes in investment broker net receivables and payables – 631 528 – 1,159Investment in common shares of subsidiaries (404) – – 404 –Net cash flows from acquisition and disposal of subsidiaries and businesses – – 288 – 288Capital contribution to unconsolidated subsidiaries – (1) – 1 –Return of capital from unconsolidated subsidiaries – 177 – (177) –Notes receivable from parent – – (157) 157 –Notes receivable from subsidiaries (1) 13 – (12) –Cash provided by (used in) investing activities (405) (1,754) (12,044) 373 (13,830)Financing activitiesChange in repurchase agreements and securities sold but not yet purchased – – 266 – 266Redemption of capital instruments – – (1,500) – (1,500)Secured borrowings – – 107 – 107Changes in deposits from Bank clients, net – – 1,819 – 1,819Lease payments – (8) (109) – (117)Shareholders’ dividends paid in cash (1,398) – – – (1,398)Contributions from (distributions to) non-controlling interests, net – – (22) – (22)Common shares repurchased (1,339) – – – (1,339)Common shares issued, net 104 – 404 (404) 104Dividends paid to parent – (1,123) (3,623) 4,746 –Capital contributions by parent – – 1 (1) –Return of capital to parent – – (177) 177 –Notes payable to parent – – (12) 12 –Notes payable to subsidiaries 157 – – (157) –Cash provided by (used in) financing activities (2,476) (1,131) (2,846) 4,373 (2,080)Cash and short-term securitiesIncrease (decrease) during the year 3 375 4,254 – 4,632Effect of foreign exchange rate changes on cash and short-term securities (2) (128) (336) – (466)Balance, beginning of year 21 2,317 13,044 – 15,382Balance, end of year 22 2,564 16,962 – 19,548Cash and short-term securitiesBeginning of yearGross cash and short-term securities 21 2,783 13,411 – 16,215Net payments in transit, included in other liabilities – (466) (367) – (833)Net cash and short-term securities, beginning of year 21 2,317 13,044 – 15,382End of yearGross cash and short-term securities 22 3,058 17,220 – 20,300Net payments in transit, included in other liabilities – (494) (258) – (752)Net cash and short-term securities, end of year $ 22 $ 2,564 $ 16,962 $ – $ 19,548Supplemental disclosures on cash flow information:Interest received $ 422 $ 4,252 $ 7,823 $ (948) $ 11,549Interest paid 423 83 1,741 (948) 1,299Income taxes paid (refund) – (788) 892 – 104
185

Note 24 ComparativesCertain comparative amounts have been reclassified to conform to the current year’s presentation.
186 | 2020 Annual Report | Notes to Consolidated Financial Statements


