CONSOLIDATED FINANCIAL STATEMENTS OF SAMSUNG ELECTRONICS CO., LTD. AND ITS SUBSIDIARIES INDEX TO FINANCIAL STATEMENTS Page Independent Auditor’s Report................................................................................................. 1-2 Consolidated Financial Statements Consolidated Statements of Financial Position........................................................................... 3-5 Consolidated Statements of Profit or Loss.................................................................................. 6 Consolidated Statements of Comprehensive Income.................................................................. 7 Consolidated Statements of Changes in Equity.......................................................................... 8 - 11 Consolidated Statements of Cash Flows.................................................................................... 12 - 13 Notes to the Consolidated Financial Statements …................................................................... 14 - 101
Transcript
CONSOLIDATED FINANCIAL STATEMENTS OF
SAMSUNG ELECTRONICS CO., LTD. AND ITS SUBSIDIARIES
Consolidated Statements of Financial Position........................................................................... 3 - 5
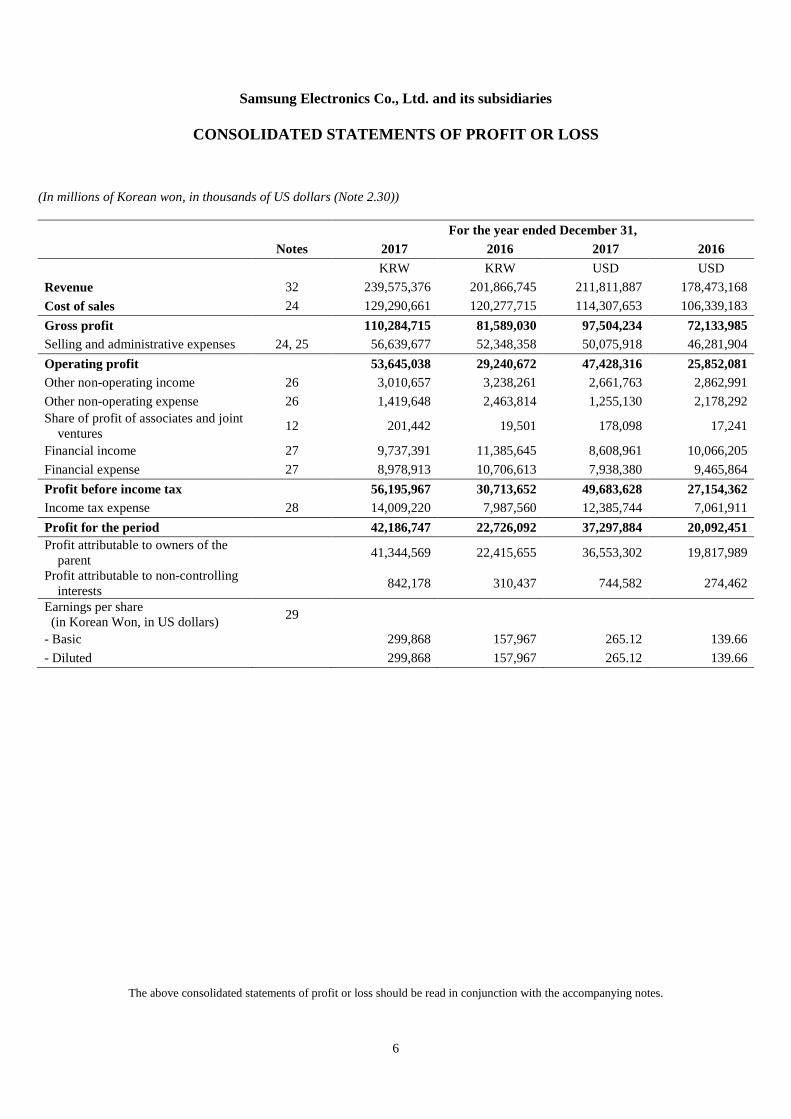
Consolidated Statements of Profit or Loss.................................................................................. 6
Consolidated Statements of Comprehensive Income.................................................................. 7
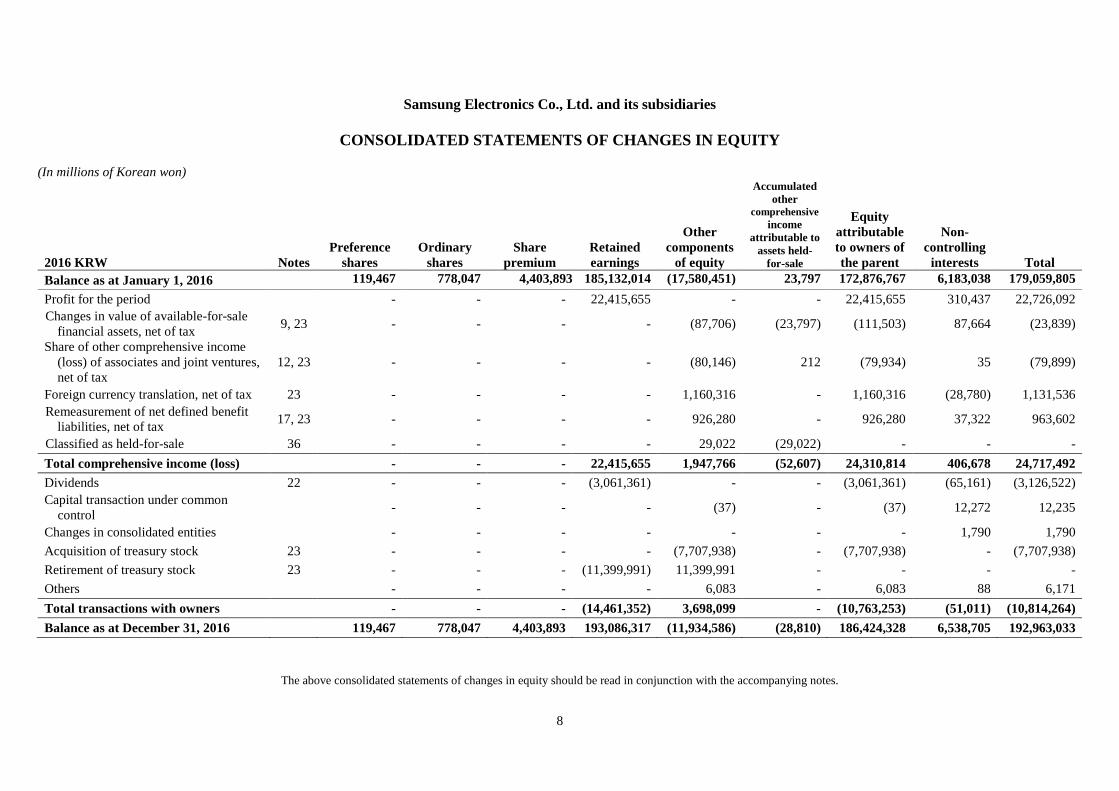
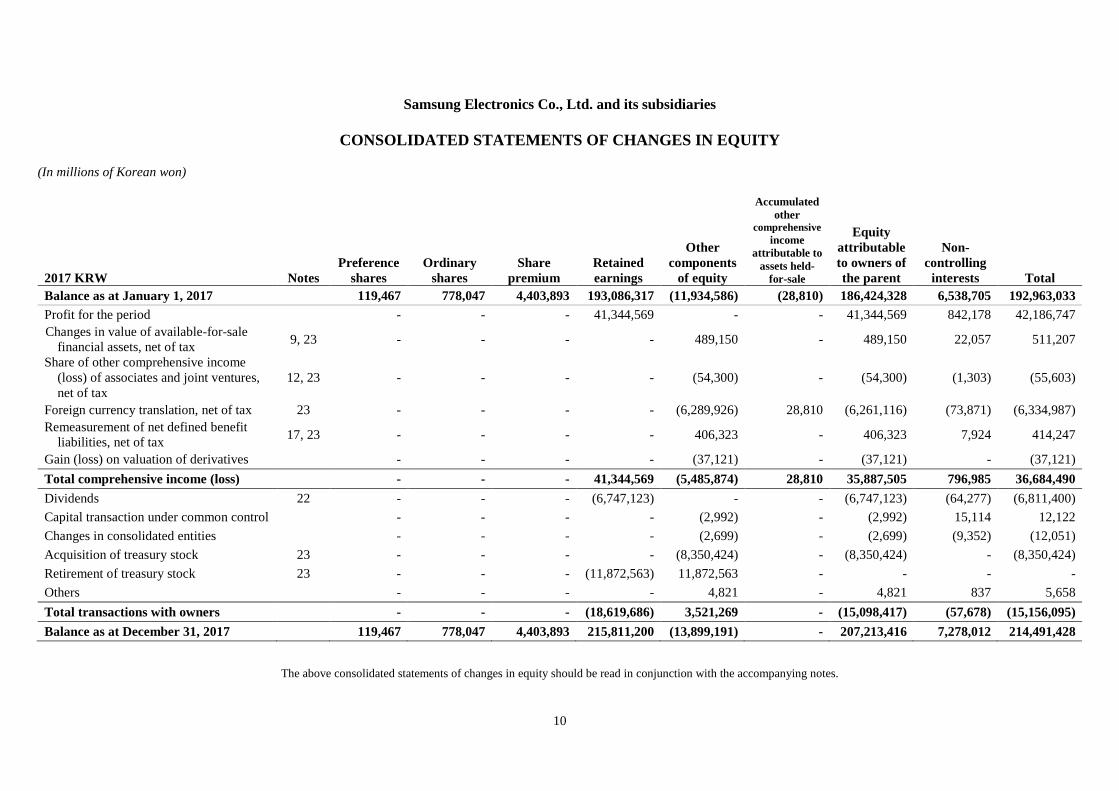
Consolidated Statements of Changes in Equity.......................................................................... 8 - 11
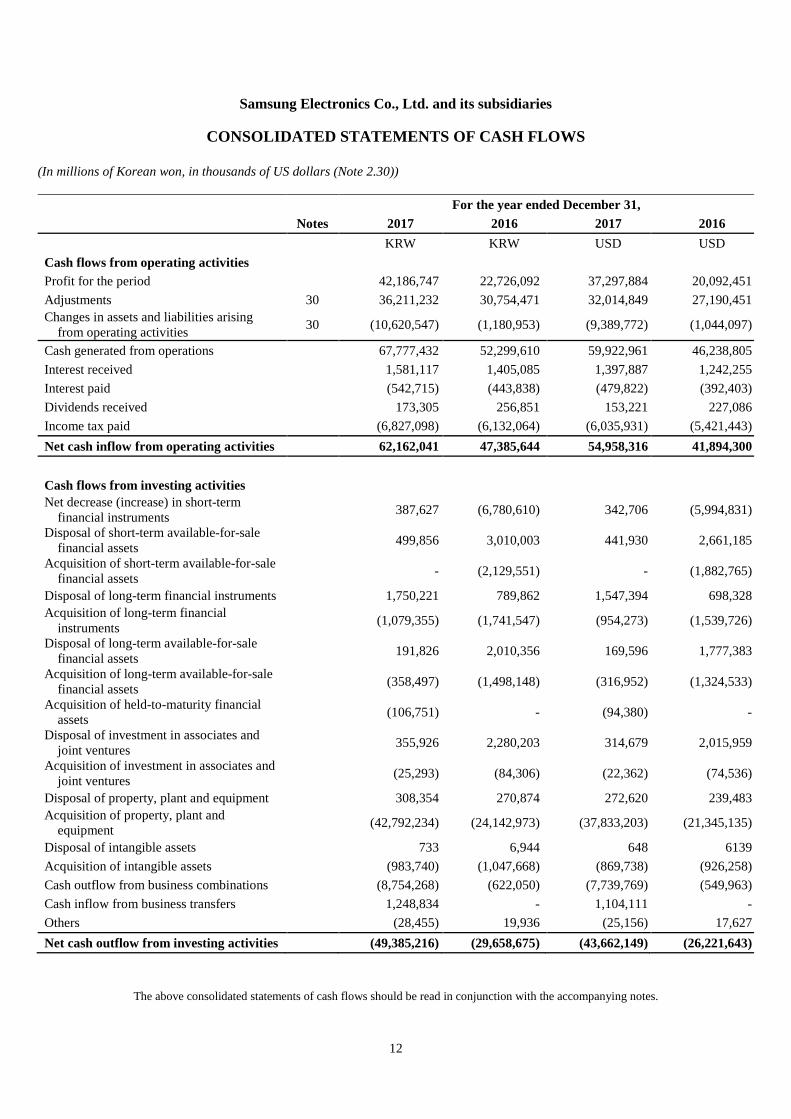
Consolidated Statements of Cash Flows.................................................................................... 12 - 13
Notes to the Consolidated Financial Statements …................................................................... 14 - 101
1
Independent Auditor’s Report
(English Translation of a Report Originally Issued in Korean)
To the Board of Directors and Shareholders of
Samsung Electronics Co., Ltd.
We have audited the accompanying consolidated financial statements of Samsung Electronics Co., Ltd.
and its subsidiaries (collectively referred to as the "Company"), which comprise the consolidated
statements of financial position as at December 31, 2017 and 2016, and the consolidated statements of
comprehensive income and profit or loss, consolidated statements of changes in equity and consolidated
statements of cash flows for the years then ended, and notes to the consolidated financial statements,
including a summary of significant accounting policies and other explanatory information, expressed in
Korean Won.
Management’s Responsibility for the Financial Statements
Management is responsible for the preparation and fair presentation of the consolidated financial
statements in accordance with International Financial Reporting Standards as adopted by the Republic
of Korea (“Korean IFRS”), and for such internal control as management determines is necessary to
enable the preparation of financial statements that are free from material misstatement, whether due to
fraud or error.
Auditor’s Responsibility
Our responsibility is to express an opinion on the consolidated financial statements based on our audits.
We conducted our audits in accordance with Korean Standards on Auditing. Those standards require
that we comply with ethical requirements, and plan and perform the audit to obtain reasonable assurance
about whether the consolidated financial statements are free from material misstatement.
An audit involves performing procedures to obtain audit evidence about the amounts and disclosures in
the consolidated financial statements. The procedures selected depend on the auditor's judgment,
including the assessment of the risks of material misstatement of the consolidated financial statements,
whether due to fraud or error. In making those risk assessments, the auditor considers internal control
relevant to the entity's preparation and fair presentation of the consolidated financial statements in order
to design audit procedures that are appropriate in the circumstances, but not for the purpose of
expressing an opinion on the effectiveness of the entity's internal control. An audit also includes
evaluating the appropriateness of accounting policies used and the reasonableness of significant
accounting estimates made by management, as well as evaluating the overall presentation of the
consolidated financial statements.
2
We believe that the audit evidence we have obtained is sufficient and appropriate to provide a basis for
our audit opinion.
Opinion
In our opinion, the accompanying consolidated financial statements present fairly, in all material
respects, the consolidated financial position of the Company as at December 31, 2017 and 2016, and its
consolidated financial performance and its consolidated cash flows for the years then ended in
accordance with Korean IFRS.
Auditing standards and their application in practice vary among countries. The procedures and practices
used in the Republic of Korea to audit such financial statements may differ from those generally
accepted and applied in other countries.
February 27, 2018
Seoul, Korea
This report is effective as of February 27, 2018, the audit report date. Certain subsequent events orcircumstances, which may occur between the audit report date and the time of reading this report, could have amaterial impact on the accompanying consolidated financial statements and notes thereto. Accordingly, thereaders of the audit report should understand that there is a possibility that the above audit report may have tobe revised to reflect the impact of such subsequent events or circumstances, if any.
3
Samsung Electronics Co., Ltd. and its subsidiaries
CONSOLIDATED STATEMENTS OF FINANCIAL POSITION
(In millions of Korean won, in thousands of US dollars (Note 2.30))
December 31, December 31, December 31, December 31,
1 TowerSec merged into Harman International Industries, Inc., a subsidiary of the Company, in May 2017.2 Kngine merged into Samsung Research America (SRA), a subsidiary of the Company, in October 2017.3 Samsung Electronics Rus (SER) merged into Samsung R&D Institute Rus (SRR), a subsidiary of the Company, in January
2017.
(2) Subsidiaries newly included in the consolidation for the year ended December 31, 2017:
Area Subsidiary Description
Domestic
Growth type private equity trust specialized in semiconductors Incorporation
Harman International Korea Acquisition of shares
Red Bend Software Korea Acquisition of shares
Samsung Venture Capital Union #37 Incorporation
America
Kngine Acquisition of shares
AMX Holding Corporation Acquisition of shares
AMX LLC Acquisition of shares
Harman Becker Automotive Systems Acquisition of shares
Harman Connected Services Engineering Acquisition of shares
Harman Connected Services Holding Acquisition of shares
Harman Connected Services Acquisition of shares
Harman Connected Services South America Acquisition of shares
Harman da Amazonia Industria Electronica e Participacoes Acquisition of shares
Harman de Mexico S. de R.L. de C.V. Acquisition of shares
Harman do Brasil Industria Electronica e Participacoes. Acquisition of shares
Harman Financial Group Acquisition of shares
Samsung Electronics Co., Ltd. and its Subsidiaries
NOTES TO THE CONSOLIDATED FINANCIAL STATEMENTS
25
Area Subsidiary Description
America
Harman International Industries Canada Acquisition of shares
Harman International Industries, Inc. Acquisition of shares
Harman International Mexico S de RL de CV Acquisition of shares
Harman Investment Group, LLC Acquisition of shares
Harman KG Holding, LLC Acquisition of shares
Harman Professional Acquisition of shares
Red Bend Software Acquisition of shares
S1NN USA Acquisition of shares
Southern Vision Systems Acquisition of shares
TowerSec Acquisition of shares
Triple Play Integration Acquisition of shares
Samsung Electronics Home Appliances America(SEHA) Incorporation
China Materialia Incorporation
Europe/CIS
AMX LLC (Russia) Acquisition of shares
Harman Connected Services OOO Acquisition of shares
Harman RUS CIS LLC Acquisition of shares
Aditi Technologies Europe Acquisition of shares
AKG Acoustics Acquisition of shares
AMX (Germany) Acquisition of shares
AMX UK Acquisition of shares
Duran Audio B.V. Acquisition of shares
Duran Audio Iberia Espana Acquisition of shares
Endeleo Acquisition of shares
Harman Automotive UK Acquisition of shares
Harman Becker Automotive Systems (Germany) Acquisition of shares
Harman Becker Automotive Systems Italy Acquisition of shares
Harman Becker Automotive Systems Manufacturing Kft Acquisition of shares
Harman Belgium Acquisition of shares
Harman Connected Services AB. Acquisition of shares
Harman Connected Services Finland OY Acquisition of shares
Harman Connected Services (Germany) Acquisition of shares
Harman Connected Services Acquisition of shares
Harman Connected Services Poland Sp.zoo Acquisition of shares
Harman Connected Services UK Acquisition of shares
Harman Consumer Division Nordic A/S Acquisition of shares
Harman Consumer Finland OY Acquisition of shares
Harman Consumer Nederland B.V. Acquisition of shares
Harman Deutschland Acquisition of shares
Harman Finance International GP S.a.r.l Acquisition of shares
Harman Finance International SCA Acquisition of shares
Harman France SNC Acquisition of shares
Harman Holding & Co. KG Acquisition of shares
Harman Hungary Financing Acquisition of shares
Harman Inc. & Co. KG Acquisition of shares
Harman International Estonia OU Acquisition of shares
Harman International Industries (UK) Acquisition of shares
Harman International Romania SRL Acquisition of shares
Harman International s.r.o Acquisition of shares
Harman International SNC Acquisition of shares
Samsung Electronics Co., Ltd. and its Subsidiaries
NOTES TO THE CONSOLIDATED FINANCIAL STATEMENTS
26
Area Subsidiary Description
Europe/CIS
Harman Management Acquisition of shares
Harman Professional Kft Acquisition of shares
Inspiration Matters Acquisition of shares
Knight Image Acquisition of shares
Martin Manufacturing (UK) Acquisition of shares
Harman Professional Denmark ApS (formerly Martin Professional ApS) Acquisition of shares
Harman Professional France SAS (formerly Martin Professional France) Acquisition of shares
Harman Professional Germany GmbH (formerly Martin ProfessionalGmbH)
Acquisition of shares
Martin Professional Acquisition of shares
R&D International Acquisition of shares
Red Bend Software (UK) Acquisition of shares
Red Bend Software SAS Acquisition of shares
Samsung Electronics Air Conditioner Europe B.V. (SEACE) Incorporation
Studer Professional Audio Acquisition of shares
Surfkitchen Acquisition of shares
Innoetics E.P.E. Acquisition of shares
ARCAM Acquisition of shares
A&R Cambridge Acquisition of shares
Middle East andAfrica
Broadsense Acquisition of shares
Global Symphony Technology Group Acquisition of shares
Harman Connected Services Morocco Acquisition of shares
Harman Industries Holdings Mauritius Acquisition of shares
iOnRoad Acquisition of shares
iOnRoad Technologies Acquisition of shares
Red Bend Acquisition of shares
TowerSec (Israel) Acquisition of shares
Asia(Except China)
AMX Products and Solutions Private Acquisition of shares
Harman Connected Services India Acquisition of shares
Harman Connected Services Technologies Acquisition of shares
Harman International (India) Private Acquisition of shares
Harman International Industries PTY Acquisition of shares
Harman International Singapore Acquisition of shares
Harman Malaysia Sdn. Bhd. Acquisition of shares
Harman Professional Singapore Pte. Acquisition of shares
I.P.S.G. International Product Solution Group PTY. Acquisition of shares
INSP India Software Development Pvt. Acquisition of shares
Martin Professional Pte. Acquisition of shares
VFX Systems PTY Acquisition of shares
Harman Connected Services Japan Acquisition of shares
Harman International Japan Acquisition of shares
Red Bend Software Japan Acquisition of shares
Studer Japan Acquisition of shares
Samsung Nepal Services (SNSL) Incorporation
China
Harman (China) Technologies Acquisition of shares
Harman (Suzhou) Audio and Infotainment Systems Acquisition of shares
Harman Automotive Electronic Systems (Suzhou) Acquisition of shares
Harman Commercial (Shanghai) Acquisition of shares
Harman Connected Services Taiwan Acquisition of shares
Samsung Electronics Co., Ltd. and its Subsidiaries
NOTES TO THE CONSOLIDATED FINANCIAL STATEMENTS
27
Area Subsidiary Description
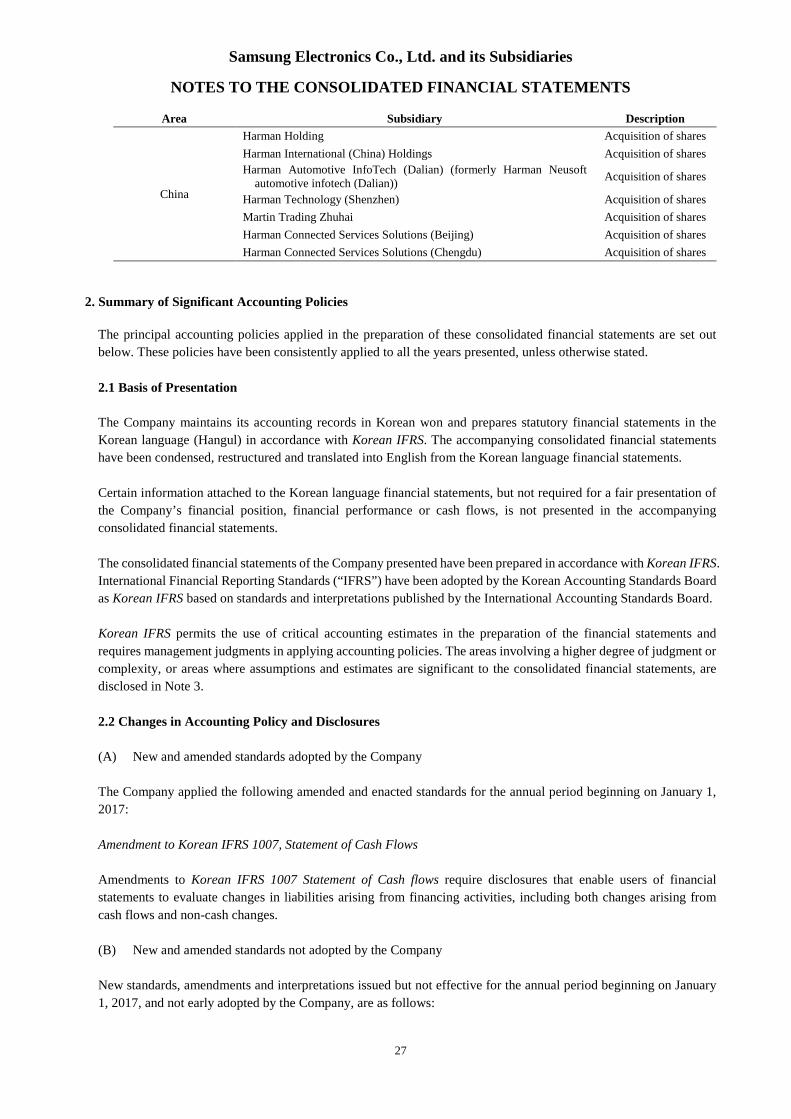
China
Harman Holding Acquisition of shares
Harman International (China) Holdings Acquisition of shares
Harman Technology (Shenzhen) Acquisition of shares
Martin Trading Zhuhai Acquisition of shares
Harman Connected Services Solutions (Beijing) Acquisition of shares
Harman Connected Services Solutions (Chengdu) Acquisition of shares
2. Summary of Significant Accounting Policies
The principal accounting policies applied in the preparation of these consolidated financial statements are set out
below. These policies have been consistently applied to all the years presented, unless otherwise stated.
2.1 Basis of Presentation
The Company maintains its accounting records in Korean won and prepares statutory financial statements in the
Korean language (Hangul) in accordance with Korean IFRS. The accompanying consolidated financial statements
have been condensed, restructured and translated into English from the Korean language financial statements.
Certain information attached to the Korean language financial statements, but not required for a fair presentation of
the Company’s financial position, financial performance or cash flows, is not presented in the accompanying
consolidated financial statements.
The consolidated financial statements of the Company presented have been prepared in accordance with Korean IFRS.
International Financial Reporting Standards (“IFRS”) have been adopted by the Korean Accounting Standards Board
as Korean IFRS based on standards and interpretations published by the International Accounting Standards Board.
Korean IFRS permits the use of critical accounting estimates in the preparation of the financial statements and
requires management judgments in applying accounting policies. The areas involving a higher degree of judgment or
complexity, or areas where assumptions and estimates are significant to the consolidated financial statements, are
disclosed in Note 3.
2.2 Changes in Accounting Policy and Disclosures
(A) New and amended standards adopted by the Company
The Company applied the following amended and enacted standards for the annual period beginning on January 1,
2017:
Amendment to Korean IFRS 1007, Statement of Cash Flows
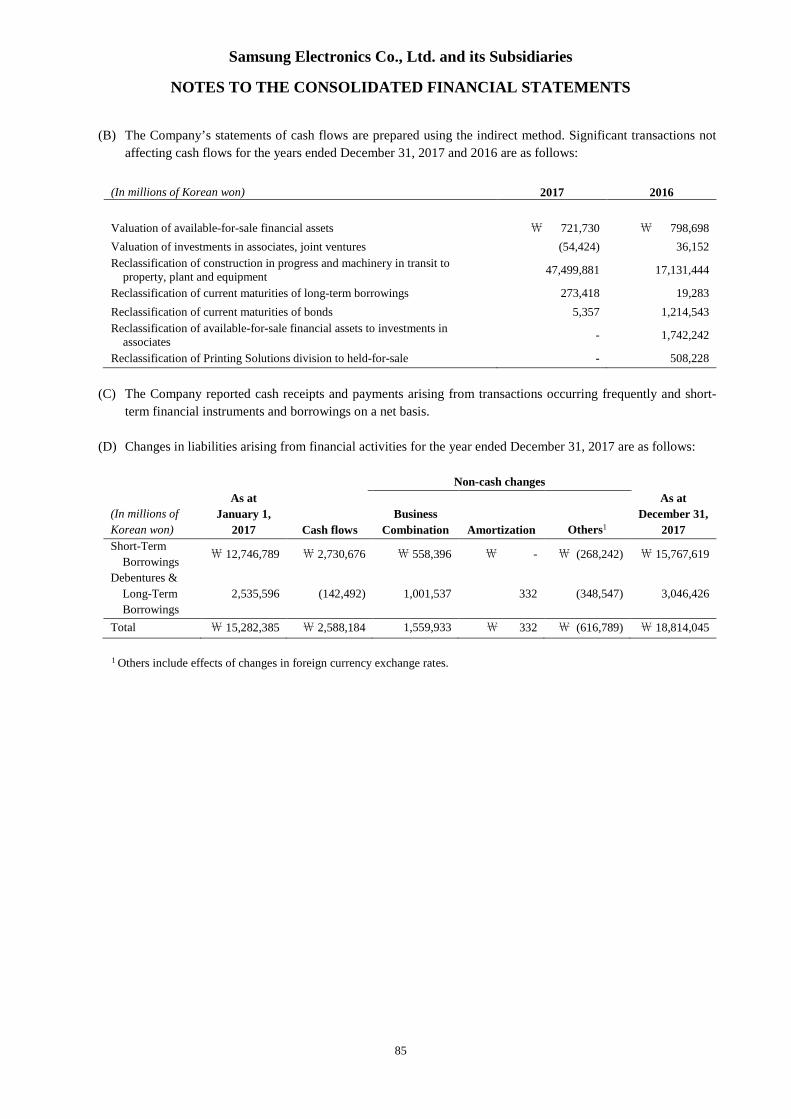
Amendments to Korean IFRS 1007 Statement of Cash flows require disclosures that enable users of financial
statements to evaluate changes in liabilities arising from financing activities, including both changes arising from
cash flows and non-cash changes.
(B) New and amended standards not adopted by the Company
New standards, amendments and interpretations issued but not effective for the annual period beginning on January
1, 2017, and not early adopted by the Company, are as follows:
Samsung Electronics Co., Ltd. and its Subsidiaries
NOTES TO THE CONSOLIDATED FINANCIAL STATEMENTS
28
Korean IFRIC 2122, Foreign Currency Transaction and Advance Consideration
According to these enactments, the date of the transaction for the purpose of determining the exchange rate to use on
initial recognition of the related asset, expense or income (or part of it) is the date on which an entity initially
recognizes the non-monetary asset or non-monetary liability arising from the payment or receipt of advance
consideration. If there are multiple payments or receipts in advance, the entity shall determine a date of the transaction
for each payment or receipt of advance consideration. These enactments will be effective for annual periods beginning
on or after January 1, 2018, with early adoption permitted. The Company does not expect the enactments to have a
significant impact on the financial statements.
Korean IFRS 1109, Financial Instruments
The new standard for financial instruments issued on September 25, 2015 is effective for annual periods beginning
on or after January 1, 2018 with early application permitted. This standard will replace Korean IFRS 1039 Financial
Instruments: Recognition and Measurement. The Company will apply the standard for the annual periods beginning
on or after January 1, 2018.
The standard requires retrospective application with some exceptions. For example, the entity is not required to restate
prior periods in relation to classification, measurement and impairment of financial instruments. The standard requires
prospective application of its hedge accounting requirements for all hedging relationships except the accounting for
time value of options and other exceptions.
Korean IFRS 1109 Financial Instruments requires all financial assets to be classified and measured on the basis of
the entity’s business model for managing financial assets and the contractual cash flow characteristics of the financial
assets. A new impairment model, an expected credit loss model, is introduced and any subsequent changes in expected
credit losses will be recognized in profit or loss. Also, hedge accounting rules were amended to extend the hedging
relationship, which consists only of eligible hedging instruments and hedged items, for determining what qualifies
for hedge accounting.
An effective implementation of Korean IFRS 1109 requires preparation processes including financial impact
assessment, accounting policy establishment, accounting system development and system stabilization. The impact
on the Company’s financial statements due to the application of the standard is dependent on judgements made in
applying the standard, financial instruments held by the Company and macroeconomic variables.
With the implementation of Korea IFRS 1109, the Company prepared for changes to internal management processes
and completed modification of its accounting system for financial instruments reporting. The Company performed
an impact assessment to identify potential financial impacts of applying Korean IFRS 1109. The assessment was
performed based on available information as at December 31, 2017, and the results of the assessment are explained
as below.
(a) Classification and Measurement of Financial Assets
When implementing Korean IFRS 1109, the classification of financial assets will be driven by the Company’s
business model for managing the financial assets and contractual terms of cash flow. The following table shows the
classification of financial assets measured subsequently at amortized cost, at fair value through other comprehensive
income and at fair value through profit or loss. If a hybrid contract contains a host that is a financial asset, the
classification of the hybrid contract shall be determined for the entire contract without separating the embedded
derivative.
Samsung Electronics Co., Ltd. and its Subsidiaries
NOTES TO THE CONSOLIDATED FINANCIAL STATEMENTS
29
Business model for thecontractual cash flows
characteristicsSolely represent payments of
principal and interest All other
Hold the financial asset for thecollection of the contractualcash flows
Measured at amortized cost1
Recognized at fair value throughprofit or loss 2Hold the financial asset for the
collection of the contractualcash flows and trading
Recognized at fair value throughother comprehensive income 1
Hold the financial asset fortrading
Recognized at fair value throughprofit or loss
1 A designation at fair value through profit or loss is allowed only if such designation mitigates an accounting mismatch
(irrevocable).2 A designation at fair value through other comprehensive income is allowed only if the financial instrument is an equity
investment not held for trading (irrevocable).
With the implementation of Korean IFRS 1109, the criteria to classify the financial assets at amortized cost or at fair
value through other comprehensive income are more strictly applied than the criteria applied with Korean IFRS 1039.
Accordingly, the financial assets at fair value through profit or loss may increase by implementing Korean IFRS 1109
and may result an extended fluctuation in profit or loss.
As at December 31, 2017, the Company owns loan and trade receivables amounting to \113,901,548 million,
financial assets held-to-maturity amounting to \106,751 million, and financial assets available-for-sale amounting
to\10,943,555 million.
According to Korean IFRS 1109, debt investments are measured at amortized cost if: a) the objective of the business
model is to hold the financial asset for the collection of the contractual cash flows, and b) the contractual terms of
cash flows solely represent payments of principal and interest. As at December 31, 2017, the Company measured
loan and trade receivables amounting to \113,901,548 million and financial assets held-to-maturity amounting to
\106,751 million at amortized costs.
When applying Korean IFRS 1109 to the above financial assets as at December 31, 2017, as most of the financial
assets are held within a business model with the objective to hold the financial assets in order to collect contractual
cash flows and the contractual terms of the financial asset give rise on specified dates to cash flows that are solely
payments of principal and interest on the principal amount outstanding, the Company shall classify the financial
assets as subsequently measured at amortized cost. It is expected that the financial impact of this change on the
financial statements will be immaterial.
Korean IFRS 1109 measures debt investments at fair value through other comprehensive income for which terms of
cash flows solely represent payment of the principal and interest on a due date, where the purpose of holding the debt
investment is to collect contractual cash flows and trade. As at December 31, 2017, the Company has debt investments
classified as available-for-sale financial assets amounting to\3,305,850 million
As at December 31, 2017, based on the result from the impact assessment of Korean IFRS 1109, it is expected that
the financial impact on the financial statements will be immaterial, because debt instruments classified as available-
for-sale financial assets will be classified as amortized cost.
Samsung Electronics Co., Ltd. and its Subsidiaries
NOTES TO THE CONSOLIDATED FINANCIAL STATEMENTS
30
According to Korean IFRS 1109, equity investments not being held for trading may be given an irrevocable election
to be classified as financial instruments measured at fair value through other comprehensive income at initial
recognition and the cumulative gain or loss previously recognized in other comprehensive income is not subsequently
recycled from equity to profit or loss as a reclassification adjustment. As at December 31, 2017, the Company's equity
investments classified as available-for-sale financial assets amount to \7,637,705 million and the cumulative
unrealized profit or loss on available-for-sale equity investments amounting to \3,199 million was recycled from
equity to profit or loss as a reclassification adjustment for the year ended December 31, 2017.
The Company plans to designate long-term equity instruments held for long-term investment purposes, which account
for most of the available-for-sale equity instruments, as financial instruments measured at fair value through other
comprehensive income. Therefore, the Company expects the application of Korean IFRS 1109 on these financial
assets will not have a material impact on the financial statements. However, the Company has identified that some
available-for-sale equity instruments will have increased profit or loss variability, as they are classified as fair value
through profit or loss.
According to Korean IFRS 1109, debt investments for which the contractual terms of cash flows are not solely
representing payments of principal and interest, or which are held for trading, are classified as fair value through
profit or loss. Equity investments not designated at fair value through comprehensive income are also measured at
fair value through profit or loss. As at December 31, 2017, the Company did not have debt or equity investments
classified as financial instruments at fair value through profit or loss.
(b) Classification and Measurement of Financial Liabilities
Korean IFRS 1109 requires the change in the liability’s fair value attributable to changes in the credit risk to be
recognized in other comprehensive income, unless this treatment of the credit risk component creates or enlarges a
measurement mismatch. Amounts presented in other comprehensive income are not subsequently transferred to profit
or loss.
Under Korean IFRS 1039, all the fair value movements for financial liabilities designated to be measured at fair value
through profit or loss, were recognized through profit or loss. However, under Korean IFRS 1109, certain fair value
movements will be recognized in other comprehensive income thus profit or loss from fair value movements may
decrease.
As at December 31, 2017, total financial liabilities account for\52,705,258 million of which\525,579 million are
designated to be measured at fair value through profit or loss.
According to the result of the impact assessment, financial liabilities measured at fair value through profit and loss
for the current terms as at December 31, 2017 have mostly short maturities and the credit risk fluctuation of financial
liabilities is insignificant. Therefore, it is expected that the impact of adopting Korean IFRS 1109 will not be
significant.
(c) Impairment: Financial Assets and Contract Assets
The new impairment model requires the recognition of impairment provisions based on expected credit losses (ECL)
rather than only incurred credit losses as is the case under Korean IFRS 1039. It applies to financial assets classified
at amortized cost, debt instruments measured at fair value through other comprehensive income, lease receivables,
contract assets, loan commitments and certain financial guarantee contracts.
Under Korean IFRS 1109, a credit event (or impairment ‘trigger’) no longer has to occur before credit losses are
recognized. The Company will always recognize (at a minimum) 12-month expected credit losses in profit or loss.
Lifetime expected credit losses will be recognized on assets for which there is a significant increase in credit risk
Samsung Electronics Co., Ltd. and its Subsidiaries
NOTES TO THE CONSOLIDATED FINANCIAL STATEMENTS
31
after initial recognition.
Stage1 Loss allowance
1No significant increase in credit riskafter initial recognition2
12-month expected credit losses (expected credit losses thatresult from those default events on the financial instrumentsthat are possible within 12 months after the reporting date)
2Significant increase in credit risk afterinitial recognition Lifetime expected credit losses (expected credit losses that
result from all possible default events over the life of thefinancial instruments)
3 Objective evidence of credit-impaired
1 The Company shall measure the loss allowance at an amount equal to Lifetime expected credit losses for contract assets or
trade receivables under the standard, Korean IFRS 1115 Revenue from Contracts with Customers, which do not contain a
significant financing component. However, the Company can elect to measure the loss allowance at an amount equal to Lifetime
expected credit losses for all contract assets or all trade receivables which contain a significant financing component in
accordance with Korean IFRS 1115. The Company can also elect to measure the loss allowance at an amount equal to Lifetime
expected credit losses for lease receivables.2 If the financial instrument has low credit risk at the reporting date, the Company may assume that the credit risk has not
increased significantly since initial recognition.
Under Korean IFRS 1109, an asset that is credit-impaired at initial recognition would recognize all changes in lifetime
expected credit losses since the initial recognition as a loss allowance with any changes recognized in profit or loss.
As at December 31, 2017, the Company owns debt investments measured at amortized cost of\114,673,402 million
(loans and receivables of \114,566,651 million, financial assets held-to-maturity of \106,751 million), which is
classified as available-for-sale and measured at fair value through other comprehensive income, of \3,305,850
million. The Company has recognized a loss allowance of\665,103 million for these assets.
When applying Korean IFRS 1109, the Company will measure the loss allowance at an amount equal to lifetime
expected credit losses for trade receivables which contain a significant financing component, contract assets, and
lease receivables, and the Company may use a simplified approach which assumes the credit risk on a financial
instrument has not increased significantly since initial recognition if the financial instrument is determined to have
low credit risk at the reporting date. It is expected that the impact of adopting Korean IFRS 1109 will not be significant.
(d) Hedge Accounting
Hedge accounting mechanics (fair value hedges, cash flow hedges and hedges of net investments in foreign operations)
required by Korean IFRS 1039 remains unchanged in Korean IFRS 1109, however, the new hedge accounting rules
will align the accounting for hedging instruments more closely with the Company’s risk management practices. As a
general rule, more hedge relationships may be eligible for hedge accounting, as the standard introduces a more
principles-based approach. Korean IFRS 1109 allows more hedging instruments and hedged items to qualify for
hedge accounting, and relaxes the hedge accounting requirement by removing two hedge effectiveness tests: the
prospective test to ensure that the hedging relationship is expected to be highly effective and the quantitative
retrospective test (within range of 80~125%) to ensure that the hedging relationship has been highly effective
throughout the reporting period.
With the implementation of Korean IFRS 1109, volatility in profit or loss may be reduced as some items that were
not eligible as hedged items or hedging instruments under Korean IFRS 1039 are now eligible under Korean IFRS
1109.
When the Company first applies Korean IFRS 1109, it may choose its accounting policy to continue to apply all of
Samsung Electronics Co., Ltd. and its Subsidiaries
NOTES TO THE CONSOLIDATED FINANCIAL STATEMENTS
32
the hedge accounting requirements of Korean IFRS 1039 instead of the requirements of Korean IFRS 1109.
With the implementation of Korean IFRS 1109, the Company has aligned the application of hedge accounting
requirements more closely with risk management practices. It is expected that the impact of adopting Korean IFRS
1109 will not be significant.
Korean IFRS 1115, Revenue from Contracts with Customers
Korean IFRS 1115, Revenue from Contracts with Customers issued on November 6, 2015 is effective for annual
periods beginning on or after January 1, 2018 with early adoption permitted. This standard replaces Korean IFRS
1018 Revenue, Korean IFRS 1011 Construction Contracts, Interpretation 2031 Revenue-Barter Transactions
the Construction of Real Estate and Interpretation 2118 Transfers of assets from customers.
The Company will apply Korean IFRS 1115 to the annual period beginning January 1, 2018 and will recognize the
cumulative impact of initially applying the standard as an adjustment to retained earnings (or other component of
equity, as appropriate) as at January 1, 2018, the period of initial application. Under this transition method, the
Company will elect to apply this standard retrospectively only to contracts that are not completed at the date of initial
application.
Korean IFRS 1018 and other current revenue standards identify revenue as income that arises in the course of ordinary
activities of an entity and provides guidance on a variety of different types of revenue, such as sale of goods, rendering
of services, interest, dividends, royalties and construction contracts. However, the Company shall recognize revenue
in accordance with the new standard by applying the following 5 steps: ①Identify the contract with the customer,
②Identify the separate performance obligations, ③Determine the transaction price of the contract, ④Allocate the
transaction price to each of the separate performance obligations, and⑤Recognize the revenue as each performance
obligation is satisfied.
As at December 31, 2017, for the preparation of implementing Korean IFRS 1115, the Company formed a task force
team which consists of members of the accounting department, the accounting firm which serves as an external
advisor, and also other practical departments such as the IT department, if necessary. An assessment was performed,
by revenue stream, and the Company has subsequently aligned certain internal management processes and modified
part of its accounting system based on the results of the assessment.
Korean IFRS 1115 will affect overall business practices including accounting treatment, sales strategy and operations.
Therefore, the Company provides training for changes due to the application of the new standard to employees, and
periodically reports the plans and progress of the implementation to the management team.
(a) Identification of performance obligations
The Company exports various products and merchandise in accordance with Incoterms Group C trading conditions
(Incoterms CIF, etc.). According to Korean IFRS 1115, since the seller provides the shipping service after control of
the product or merchandise has been transferred to the customer, the shipping service (including insurance) must be
recognized as a separate performance obligation.
As a result of analyzing Incoterms Group C trading condition (Incoterms CIF, etc.) contracts, the Company considers
it appropriate to recognize the transportation service after the control has been transferred as a separate performance
obligation apart from the sale of the goods. The adoption of Korean IFRS 1115 for these arrangements is not expected
to have a material impact on the financial statements.
Samsung Electronics Co., Ltd. and its Subsidiaries
NOTES TO THE CONSOLIDATED FINANCIAL STATEMENTS
33
(b) A performance obligation is satisfied over time: CE Operating Segment
The CE segment of the Company delivers products to customers and installs them in accordance with the system air
conditioner contracts awarded by the Public Procurement Service. According to Korean IFRS 1115, the Company
can recognize revenue over time if the Company’s performance creates or enhances an asset (for example, work in
progress) that the customer controls as the asset is created or enhanced
As a result of the analysis of the contract terms, the Company considers that it should recognize the revenue from
system air conditioner installation over time as the customer controls the outcome of the service. The adoption of
Korean IFRS 1115 for these arrangements is not expected to have a material impact on the financial statements.
(c) A performance obligation is satisfied over time - custom-order semiconductor supply contracts: DS Operating
Segment
The DS segment of the Company supplies semiconductor products according to customer orders. According to
Korean IFRS 1115, the Company can recognize revenue over time if the Company’s performance does not create an
asset with an alternative use to the entity and the entity has an enforceable right to payment for performance completed
to date.
As a result of analyzing the agreement terms, the Company considers the revenue from custom-order semiconductor
supply contracts with no alternative use and an enforceable right to payment should be recognized over time. The
adoption of Korean IFRS 1115 is not expected to have a material impact on the financial statements.
(d) Variable consideration
According to Korean IFRS 1115, the Company shall recognize a refund liability if the entity receives consideration
from a customer and expects to refund some or all of the consideration to the customer. The Company recognizes an
asset (refund asset) for the Company’s right to recover the products from the customer when the refund liability is
paid.
The Company considers that the refund asset should be classified and presented separately from the refund liability.
The adoption of Korean IFRS 1115 is not expected to have a material impact on the financial statements.
Enactment of Korean IFRS 1116, Leases
Korean IFRS 1116 Leases issued on May 22, 2017 is effective for annual periods beginning on or after January 1,
2019, with early adoption permitted. This standard will replace Korean IFRS 1017 Leases, Interpretation 2104
Determining whether an Arrangement contains a Lease, Interpretation 2015 Operating Leases-Incentives, and
Interpretation 2027 Evaluating the Substance of Transactions Involving the Legal Form of a Lease.
At inception of a contract, the Company shall assess whether the contract is, or contains, a lease. Also, at the date of
initial application, the Company shall assess whether the contract is, or contains, a lease in accordance with the
standard. However, the Company will not need to reassess all contracts with applying the practical expedient because
the Company elected to apply the practical expedient only to contracts entered before the date of initial application.
For a contract that is, or contains, a lease, the Company shall account for each lease component within the contract
as a lease separately from non-lease components of the contract. A lessee is required to recognize a right-of-use asset
representing its right to use the underlying leased asset and a lease liability representing its obligation to make lease
Samsung Electronics Co., Ltd. and its Subsidiaries
NOTES TO THE CONSOLIDATED FINANCIAL STATEMENTS
34
payments. The lessee may elect not to apply the requirements to short-term leases (a lease term of 12 months or less
at the commencement date) and low value assets (e.g. underlying assets below $5,000). In addition, as a practical
expedient, the lessee may elect, by class of underlying asset, not to separate non-lease components from lease
components, and instead account for each lease component and any associated non-lease components as a single lease
component.
The accounting standard as a lessor did not change significantly from Korean IFRS 1017 Leases.
(a) Lessee accounting
A lessee shall apply this standard to its leases either: a) retrospectively to each prior reporting period presented
applying Korean IFRS 1008 Accounting Policies, Changes in Accounting Estimates and Errors (Full retrospective
application) or b) retrospectively with the cumulative effect of initially applying the standard recognized at the date
of initial application. The Company has not yet elected an adoption method.
The Company is in the process of performing a preliminary assessment of potential financial impact of applying
Korean IFRS 1116 to the 2017 financial statements.
(b) Lessor accounting
When applying Korean IFRS 1116, the Company does not expect the enactments to have a significant impact on the
financial statements as the accounting standard as a lessor did not change significantly from IFRS 1017.
2.3 Consolidation
The Company prepares the consolidated financial statements in accordance with Korean IFRS 1110, Consolidated
Financial Statements.
(A) Subsidiaries
Subsidiaries are all entities (including special purpose entities) over which the Company has control. The Company
controls the corresponding investee when it is exposed, or has rights, to variable returns from its involvement with
the investee and has the ability to affect those returns through its power over the investee. Consolidation of a
subsidiary begins from the date the Company obtains control of a subsidiary and ceases when the Company loses
control of the subsidiary.
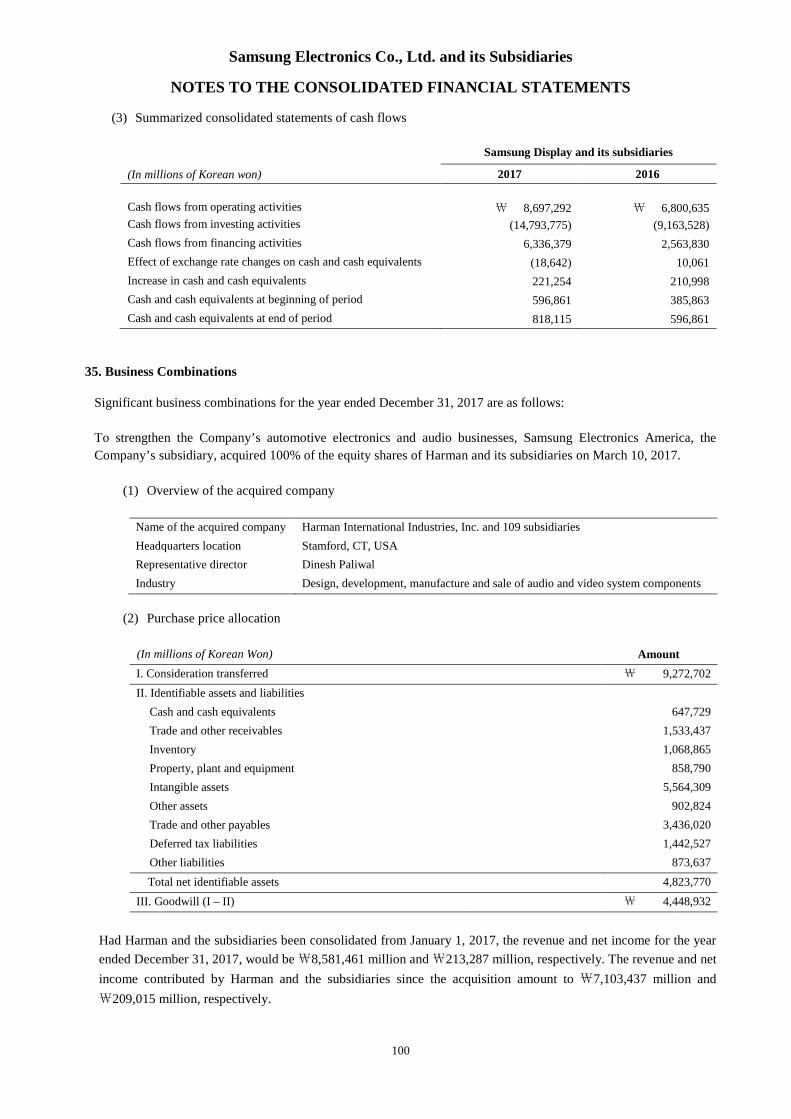
The Company applies the acquisition method to account for business combinations. The consideration transferred is
measured at the fair values of the assets transferred, and identifiable assets acquired and liabilities and contingent
liabilities assumed in a business combination are initially measured at their fair values at the acquisition date. The
Company recognizes any non-controlling interest in the acquiree on an acquisition-by-acquisition basis in the event
of liquidation at the non-controlling interest’s proportionate share of the recognized amounts of acquiree’s identifiable
net assets. Acquisition-related costs are expensed as incurred.
Goodwill is recognized as the excess of (1) the aggregate of i) the consideration transferred, ii) the amount of any
non-controlling interest in the acquiree and iii) the acquisition-date fair value of the Company’s previously held equity
interest in the acquiree over (2) the net identifiable assets acquired. If this consideration (1) is lower than the fair
value of the acquiree’s net assets in (2), the difference is recognized in profit or loss.
Samsung Electronics Co., Ltd. and its Subsidiaries
NOTES TO THE CONSOLIDATED FINANCIAL STATEMENTS
35
Balances of receivables and payables, income and expenses and unrealized gains or losses on transactions between
the Company subsidiaries are eliminated. Accounting policies of subsidiaries are changed where necessary to ensure
consistency with the policies adopted by the Company.
(B) Changes in ownership interests in subsidiaries without change of control
Transactions with non-controlling interests that do not result in loss of control are accounted for as equity transactions
– that is, as transactions with the owners in their capacity as owners. The difference between fair value of any
consideration paid and the relevant share acquired of the carrying value of net assets of the subsidiary is recorded in
equity. Gains or losses on disposals of non-controlling interests are also recorded in equity.
(C) Disposal of subsidiaries
If the Company loses control of a subsidiary, any investment continuously retained in the subsidiary is re-measured
at its fair value at the date when control is lost and any resulting differences are recognized in profit or loss. Such fair
value becomes the initial carrying amount for the subsequent measurement of the retained interest accounted for as
an associate, joint venture, or financial asset. In addition, any amounts previously recognized in other comprehensive
income in respect of such entity are accounted for as if the Company had directly disposed of the related assets or
liabilities. As a result, the previously recognized other comprehensive income are reclassified into profit or loss.
(D) Non-controlling interests
Each component of profit or loss and other comprehensive income is attributed to owners of the parent and to non-
controlling interests. Total comprehensive income is attributed to owners of the parent and to non-controlling interests
even if this results in a negative balance of non-controlling interests.
(E) Associates
Associates are all entities over which the Company has significant influence but does not have control, generally
investees of which from 20% to 50% of voting stock is owned by the Company . Investments in associates are initially
recognized at acquisition cost using the equity method. Unrealized gains on transactions between the Company and
its associates are eliminated to the extent of the Company’s interest in the associates. If there is any objective evidence
that the investment in the associate is impaired, the Company recognizes the difference between the recoverable
amount of the associate and its book value as impairment loss.
(F) Joint arrangements
A joint arrangement of which two or more parties have joint control is classified as either a joint operation or a joint
venture. A joint operator has rights to the assets, and obligations for the liabilities, relating to the joint operation and
recognizes the assets, liabilities, revenues and expenses relating to its interest in a joint operation. A joint venturer
has rights to the net assets relating to the joint venture and accounts for that investment using the equity method.
2.4 Foreign Currency Translation
(A) Functional and presentation currency
Items included in the financial statements of each of the Company’s entities are measured using the currency of the
primary economic environment in which each entity operates (the “functional currency”). The consolidated financial
statements are presented in Korean won, which is the parent company’s functional and presentation currency.
Samsung Electronics Co., Ltd. and its Subsidiaries
NOTES TO THE CONSOLIDATED FINANCIAL STATEMENTS
36
(B) Transactions and balances
Foreign currency transactions are translated into the functional currency using the exchange rates prevailing at the
dates of the transactions or valuation where items are re-measured. Foreign exchange gains and losses resulting from
the settlement of such transactions and from the translation at year-end exchange rates of monetary assets and
liabilities denominated in foreign currencies are recognized in profit or loss.
Exchange differences arising on non-monetary financial assets and liabilities such as equity instruments at fair value
through profit or loss and available-for-sale equity instruments are recognized in profit or loss and other
comprehensive income, respectively, as part of the fair value gain or loss.
(C) Translation into the presentation currency
The results and financial position of all the foreign entities that have a functional currency different from the
presentation currency of the Company are translated into the presentation currency as follows:
Assets and liabilities for each statement of financial position presented are translated at the closing rate at the
end of the reporting date.
Income and expenses for each statement of income are translated at average exchange rates, unless this average
is not a reasonable approximation of the cumulative effect of the rates prevailing on the transaction dates, in
which case income and expenses are translated at the rate on the dates of the transactions.
All resulting exchange differences are recognized in other comprehensive income.
2.5 Cash and Cash Equivalents
Cash and cash equivalents include cash on hand, deposits held at call with banks, and other short-term highly liquid
investments that are readily convertible to a known amount of cash and are subject to an insignificant risk of change
in value.
2.6 Financial Assets
(A) Classification
The Company classifies its financial assets in the following categories: financial assets at fair value through profit or
loss, loans and receivables, available-for-sale financial assets, and held-to-maturity financial assets. The classification
depends on the terms of the instruments and purpose for which the financial assets were acquired. Management
determines the classification of its financial assets at initial recognition.
(1) Financial assets at fair value through profit or loss
Financial assets at fair value through profit or loss are financial assets held for trading. A financial asset is classified
in this category if acquired principally for the purpose of selling in the short-term. Derivatives not subject to hedge
accounting and derivatives separated from financial instruments, such as embedded derivatives, are also categorized
as held for trading. Assets in this category are classified as current assets.
(2) Loans and receivables
Loans and receivables are non-derivative financial assets with fixed or determinable payments that are not quoted in
an active market. They are included in current assets, except for those with maturities greater than 12 months after
the end of the reporting period which are classified as non-current assets.
Samsung Electronics Co., Ltd. and its Subsidiaries
NOTES TO THE CONSOLIDATED FINANCIAL STATEMENTS
37
(3) Available-for-sale financial assets
Available-for-sale financial assets are non-derivative financial assets that are either designated in this category or not
classified in any of the other categories. They are included in non-current assets unless an investment matures or
management intends to dispose of it within 12 months of the end of the reporting period.
(B) Recognition and measurement
Regular purchases and sales of financial assets are recognized on the trade date. At initial recognition, financial assets
are measured at fair value plus, in the case of financial assets not carried at fair value through profit or loss, transaction
costs. Transaction costs of financial assets carried at fair value through profit or loss are expensed in the statement of
income. After the initial recognition, available-for-sale financial assets and financial assets at fair value through profit
or loss are subsequently carried at fair value. Loans and receivables and held-to-maturity investments are
subsequently carried at amortized cost using the effective interest method.
Changes in fair value of financial assets at fair value through profit or loss are recognized in profit or loss and changes
in fair value of available-for-sale financial assets are recognized in other comprehensive income. When the available-
for-sale financial assets are sold or impaired, the fair value adjustments recorded in equity are reclassified into profit
or loss.
Interest on available-for-sale financial assets and held-to-maturity financial assets calculated using the effective
interest method is recognized in the statement of income as part of financial income. Dividends on available-for-sale
financial assets are recognized in the statement of income as part of other non-operating income when the Company’s
right to receive payments is established.
(C) Offsetting financial instruments
Financial assets and liabilities are offset, and the net amount reported in the statement of financial position, when
there is a legally enforceable right to offset the recognized amounts and there is an intention to settle on a net basis,
or realize the asset and settle the liability simultaneously. The legally enforceable right must not be contingent on
future events and must be enforceable in the normal course of business and in the event of default, insolvency or
bankruptcy of the Company or the counterparty.
(D) Derecognition of financial assets
If the Company transfers a financial asset and the transfer does not result in derecognition because the Company has
retained substantially all of the risks and rewards of ownership of the transferred asset due to a recourse in the event
the debtor defaults, the Company continues to recognize the transferred asset in its entirety and recognizes a financial
liability for the consideration received. The related financial liability is classified as ‘borrowings’ in the statement of
financial position.
2.7 Impairment of Financial Assets
The Company assesses at the end of each reporting period whether there is objective evidence that a financial asset
or group of financial assets is impaired. A financial asset or a group of financial assets is impaired and impairment
loss is recognized only if there is objective evidence and that loss event (or events) has an impact on the estimated
future cash flows of the financial asset or group of financial assets that can be reliably estimated.
Impairment of loans and receivables is presented as a deduction in an allowance account. Impairment of other
financial assets is directly deducted from their carrying amount. The Company writes off financial assets when the
assets are determined to no longer be recoverable.
Samsung Electronics Co., Ltd. and its Subsidiaries
NOTES TO THE CONSOLIDATED FINANCIAL STATEMENTS
38
The objective evidence that a financial asset is impaired includes significant financial difficulty of the issuer or obligor,
a delinquency in interest or principal payments, or the disappearance of an active market for that financial asset
because of financial difficulties. A significant and prolonged decline below its cost in the fair value of an available-
for-sale equity instrument is also objective evidence of impairment.
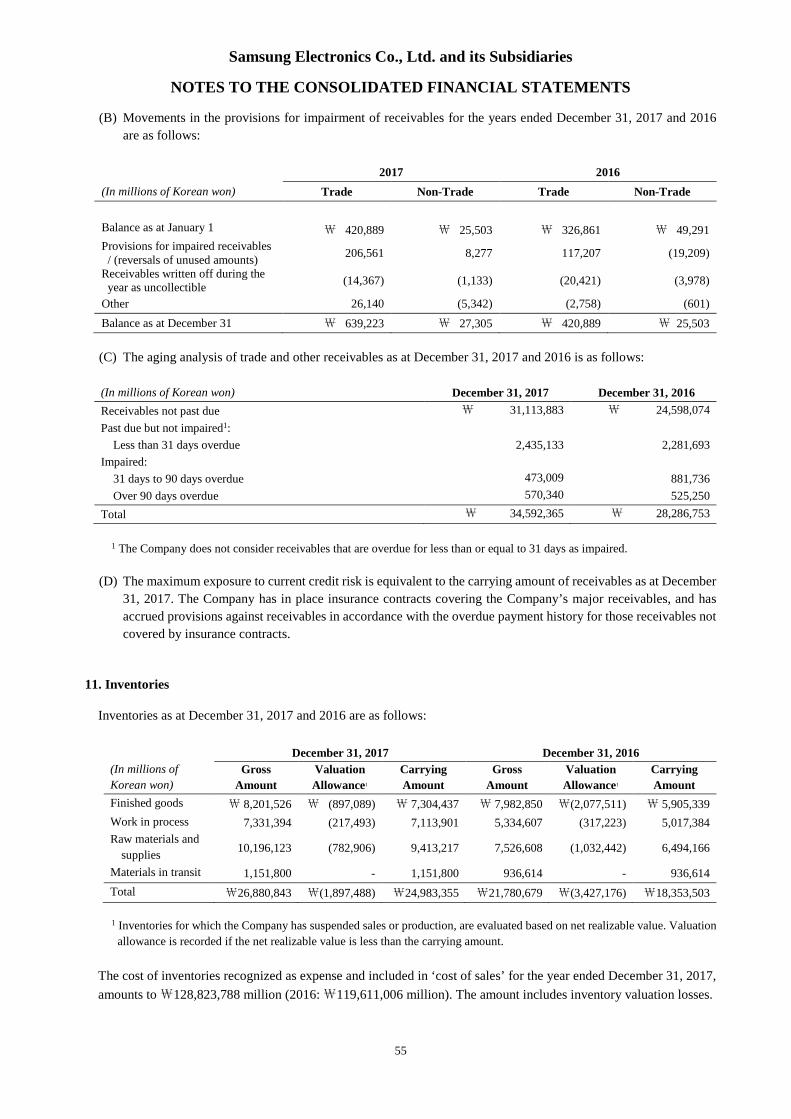
2.8 Trade Receivables
Trade receivables are amounts due from customers for merchandise sold or services performed in the ordinary course
of business. If collection is expected in one year or less, they are classified as current assets. If collection is expected
beyond one year, they are presented as non-current assets. Trade receivables are recognized initially at fair value and
subsequently measured at amortized cost using the effective interest method, less provision for impairment.
2.9 Inventories
Inventories are stated at the lower of cost and net realizable value. Cost is determined using the average cost method,
except for materials in transit. The cost of finished goods and work in progress comprises raw materials, direct labor,
other direct costs and related production overheads (based on normal operating capacity). It excludes costs of idle
plant and abnormal waste. Net realizable value is the estimated selling price in the ordinary course of business, less
applicable variable selling expenses.
Inventories are reduced for the estimated losses arising from excess, obsolescence, and decline in value. This
reduction is determined by estimating market value based on future customer demand. The losses on inventory
obsolescence are recorded as a part of cost of sales.
2.10 Disposal Group Held-for-Sale
Non-current assets (or disposal groups) are classified as assets held-for-sale when their carrying amount is to be
recovered principally through a sale transaction and a sale is considered highly probable. The assets are measured at
the lower of their carrying amount and the fair value less costs to sell.
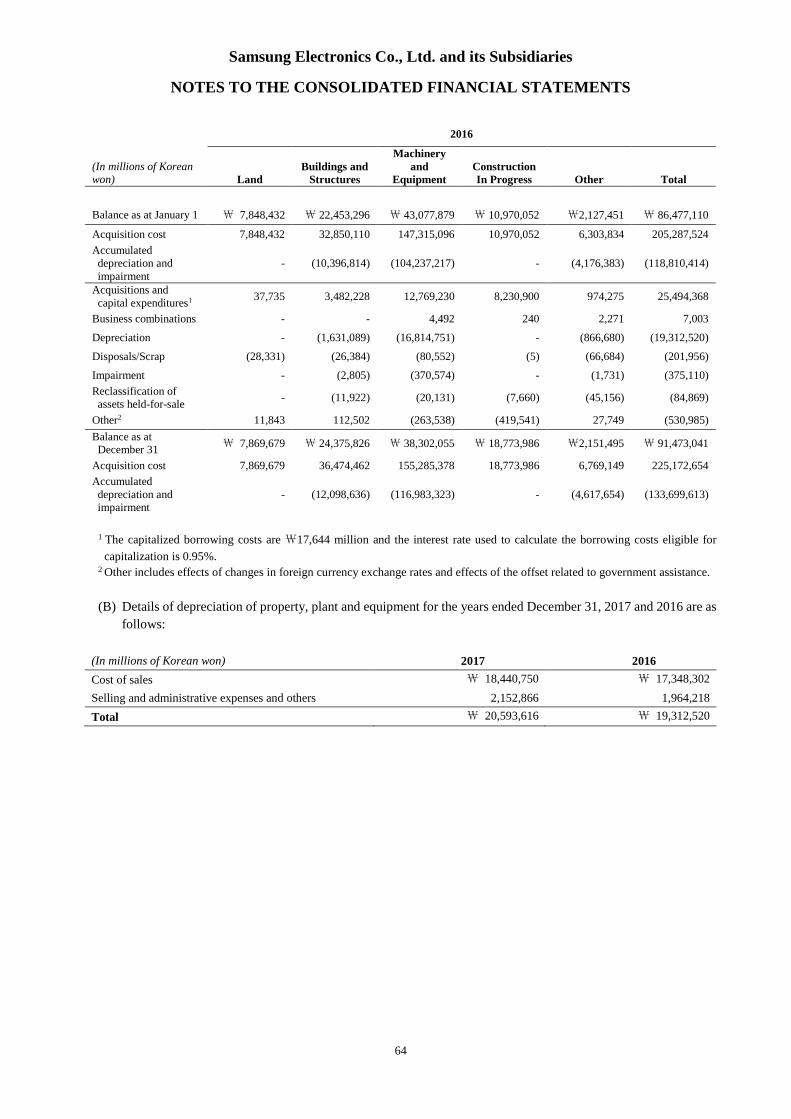
2.11 Property, Plant and Equipment
Property, plant and equipment are stated at cost less accumulated depreciation and accumulated impairment losses.
Historical cost includes expenditures that are directly attributable to the acquisition of the items. Subsequent costs
are included in the asset’s carrying amount or recognized as a separate asset, as appropriate, only when it is probable
that future economic benefits associated with the item will flow to the Company and the cost of the item can be
measured reliably. The carrying amount of those parts that are replaced is derecognized and repairs and maintenance
expenses are recognized in profit or loss in the period they are incurred.
Depreciation on tangible assets is calculated using the straight-line method to allocate the difference between their
cost and their residual values over their estimated useful lives. Land is not depreciated. Costs that are directly
attributable to the acquisition, construction or production of a qualifying asset, including capitalized interest costs,
form part of the cost of that asset and are amortized over the estimated useful lives.
The Company’s policy is that property, plant and equipment should be depreciated over the following estimated
useful lives:
Estimated useful lives
Buildings and structures 15, 30 years
Machinery and equipment 5 years
Other 5 years
Samsung Electronics Co., Ltd. and its Subsidiaries
NOTES TO THE CONSOLIDATED FINANCIAL STATEMENTS
39
The depreciation method, residual values and useful lives of property, plant and equipment are reviewed, and adjusted
if appropriate, at the end of each reporting period. An asset’s carrying amount is written down immediately to its
recoverable amount if the asset’s carrying amount is greater than its estimated recoverable amount. Gains and losses
on disposals are determined by comparing the proceeds with the carrying amount and are recognized within the
statement of income as part of other non-operating income and expenses.
2.12 Borrowing Costs
General and specific borrowing costs that are directly attributable to the acquisition, construction or production of aqualifying asset are capitalized during the period of time that is required to complete and prepare the asset for itsintended use or sale. Investment income earned on the temporary investment of specific borrowings pending theirexpenditure on qualifying assets is deducted from the borrowing costs eligible for capitalization. Other borrowingcosts are expensed in the period in which they are incurred.
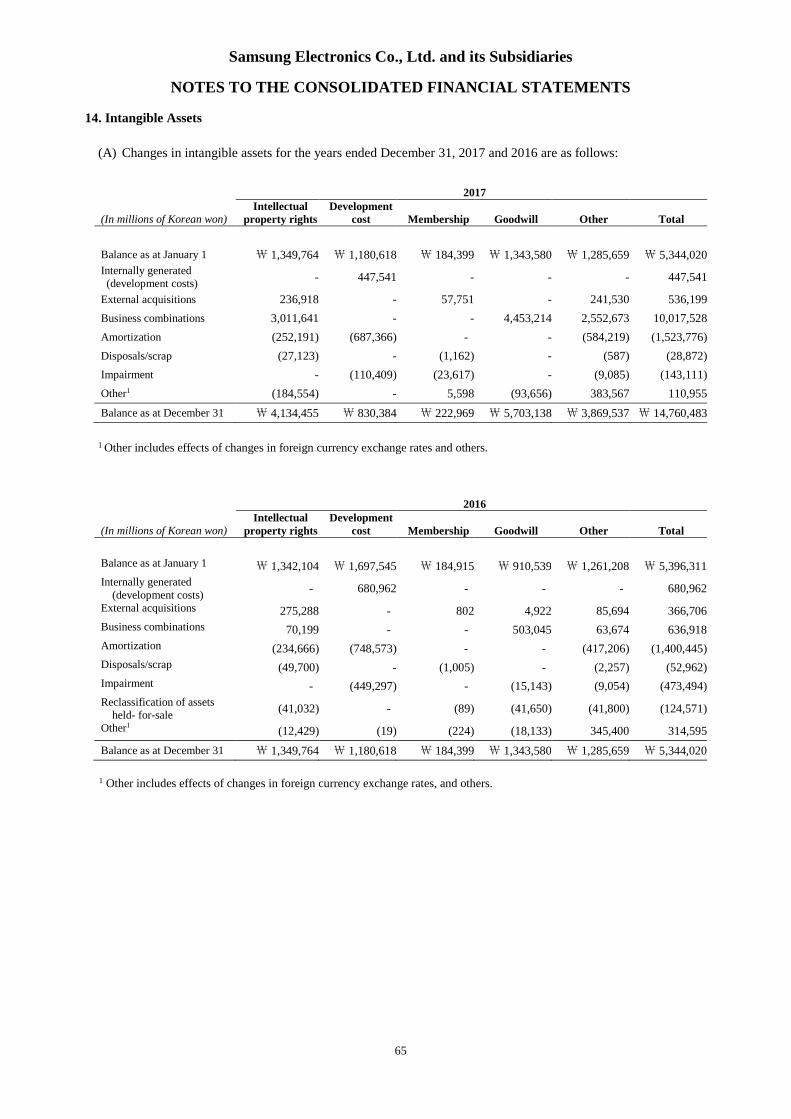
2.13 Intangible Assets
Goodwill represents the excess of the cost of an acquisition over the fair value of the Company’s share of the net
identifiable assets of the acquired subsidiary, associates, joint ventures and businesses at the date of acquisition.
Goodwill on acquisitions of subsidiaries and businesses is included in intangible assets and goodwill on acquisition
of associates and joint ventures is included in the investments in associates and joint ventures.
Intangible assets, except for goodwill, are initially recognized at their historical cost and carried at cost less
accumulated amortization and accumulated impairment losses.
Internally generated development costs are the aggregate costs recognized after meeting the asset recognition criteria,
including technical feasibility, and determined to have future economic benefits. Membership rights and certain
trademarks are regarded as intangible assets with an indefinite useful life and not amortized because there is no
foreseeable limit to the period over which the assets are expected to be utilized. Intangible assets with definite useful
lives such as trademarks and licenses, are amortized using the straight-line method over their estimated useful lives.
The Company’s policy is that intangible assets should be amortized over the following estimated useful lives:
Estimated useful lives
Development costs 2 years
Trademarks, licenses and other intangible assets 5 - 10 years
2.14 Impairment of Non-Financial Assets
Goodwill or intangible assets with indefinite useful lives are not subject to amortization and are tested annually for
impairment. Assets that are subject to amortization are reviewed for impairment whenever events or changes in
circumstances indicate that the carrying amount may not be recoverable. An impairment loss is recognized for the
amount by which the asset’s carrying amount exceeds its recoverable amount. The recoverable amount is the higher
of an asset’s fair value less costs to sell and value in use. For the purposes of assessing impairment, assets are grouped
at the lowest levels for which there are separately identifiable cash flows (cash-generating units). Non-financial assets
other than goodwill for which an impairment charge was previously recorded are reviewed for possible reversal of
the impairment at each reporting date.
Samsung Electronics Co., Ltd. and its Subsidiaries
NOTES TO THE CONSOLIDATED FINANCIAL STATEMENTS
40
2.15 Financial Liabilities
(A) Classification and measurement
Financial liabilities at fair value through profit or loss are financial instruments held for trading. Financial liabilities
are classified in this category if incurred principally for the purpose of repurchasing them in the near term. Derivatives
that are not designated as hedges or bifurcated from financial instruments containing embedded derivatives are also
categorized as held-for-trading.
The Company classifies non-derivative financial liabilities, except for financial liabilities at fair value through profit
or loss, financial guarantee contracts and financial liabilities that arise when a transfer of financial assets does not
qualify for derecognition, as financial liabilities carried at amortized cost and presented as ‘trade payables’,
‘borrowings’, and ‘other financial liabilities’ in the statement of financial position.
(B) Derecognition
Financial liabilities are removed from the statement of financial position when they are extinguished, for example,
when the obligation specified in the contract is discharged, cancelled or expires or when the terms of an existing
financial liability are substantially modified.
2.16 Trade Payables
Trade payables are amounts due to suppliers for merchandise purchased or services received in the ordinary course
of business. If payment is expected in one year or less, they are classified as current liabilities. If payment is expected
beyond one year, they are presented as non-current liabilities. Non-current trade payables are recognized initially at
fair value and subsequently measured at amortized cost using the effective interest method.
2.17 Borrowings
Borrowings are recognized initially at fair value, net of transaction costs, and are subsequently measured at amortized
cost. Any difference between cost and the redemption value is recognized in the statement of income over the period
of the borrowings using the effective interest method. If the Company has an indefinite right to defer payment for a
period longer than 12 months after the end of the reporting date, such liabilities are recorded as non-current liabilities,
otherwise, they are recorded as current liabilities.
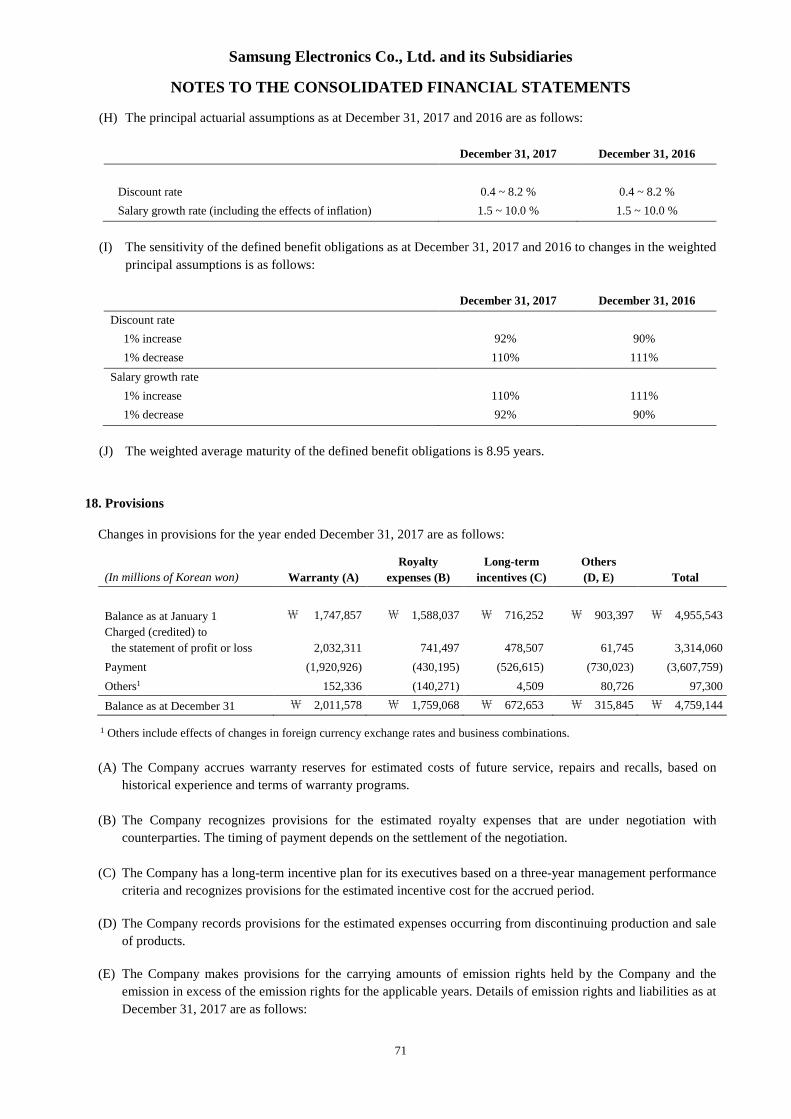
2.18 Provisions
A provision is recognized when the Company has a present legal or constructive obligation as a result of a past event,
it is probable that an outflow of resources embodying economic benefits will be required to settle the obligation, and
a reliable estimate can be made of the amount of the obligation. Provisions are not recognized for future operating
losses.
Provisions are measured at the present value of the expenditures expected to be required to settle the obligation using
a pre-tax rate that reflects current market assessments of the time value of money and the risks specific to the
obligation. The increase in the provision due to passage of time is recognized as interest expense.
When it is probable that an outflow of economic benefits will occur due to a present obligation resulting from a past
event, and the amount is reasonably estimable, a corresponding provision is recognized in the financial statements.
However, when such outflow is dependent upon a future event that is not certain to occur, or cannot be reliably
estimated, a disclosure regarding the contingent liability is made in the notes to the financial statements.
Samsung Electronics Co., Ltd. and its Subsidiaries
NOTES TO THE CONSOLIDATED FINANCIAL STATEMENTS
41
2.19 Employee Benefits
The Company has a variety of retirement pension plans including defined benefit and defined contribution plans. A
defined contribution plan is a pension plan under which the Company pays fixed contributions into a separate entity.
The Company has no legal or constructive obligations to pay further contributions if the fund does not hold sufficient
assets to pay all employees the benefits relating to employee service in the current and prior periods. For defined
contribution plans, the Company pays contributions to annuity plans that are managed either publicly or privately on
a mandatory, contractual or voluntary basis. The Company has no further future payment obligations once the
contributions have been paid. The contributions are recognized as employee benefit expense when they are due.
Prepaid contributions are recognized as an asset to the extent that a cash refund or a reduction in the future payments
is available.
A defined benefit plan is a pension plan that is not a defined contribution plan. Typically defined benefit plans define
an amount of pension benefit that an employee will receive on retirement, usually dependent on one or more factors
such as age, years of service and compensation. The liability recognized in the statement of financial position in
respect to defined benefit pension plans is the present value of the defined benefit obligation at the end of the reporting
period less the fair value of plan assets. The defined benefit obligation is calculated annually by independent actuaries
using the projected unit credit method. The present value of the defined benefit obligation is determined by
discounting the estimated future cash outflows using interest rates of high-quality corporate bonds that are
denominated in the currency in which the benefits will be paid and that have terms to maturity approximating to the
terms of the related pension obligation.
Actuarial gains and losses resulting from the changes in actuarial assumptions, and the differences between the
previous actuarial assumptions and what has actually occurred, are recognized in other comprehensive income in the
period in which they were incurred. Past service costs are immediately recognized in profit or loss.
2.20 Financial Guarantee Contract
Financial guarantee contracts are contracts that require the issuer to make specified payments to reimburse the holder
for a loss it incurs because a specified debtor fails to make payments when due. Financial guarantees are initially
recognized in the financial statements at fair value on the date the guarantee was given. If the amount measured in
subsequent periods exceeds the unamortized balance of the amount initially recognized, the excess is classified as
other financial liability.
2.21 Current and Deferred Tax
The tax expense for the period comprises current and deferred tax. Tax is recognized on the profit for the period in
the statement of income, except to the extent that it relates to items recognized in other comprehensive income or
directly in equity, in which case the tax is also recognized in other comprehensive income or directly in equity,
respectively. The tax expense is calculated on the basis of the tax laws enacted or substantively enacted at the end of
the reporting period.
Deferred tax is recognized for temporary differences arising between the tax bases of assets and liabilities and their
carrying amounts as expected tax consequences at the recovery or settlement of the carrying amounts of the assets
and liabilities. However, deferred tax assets and liabilities are not recognized if they arise from initial recognition of
an asset or liability in a transaction other than a business combination that at the time of the transaction affects neither
accounting nor taxable profit or loss. Deferred tax assets are recognized only to the extent that it is probable that
future taxable profit will be available against which the temporary differences can be utilized.
A deferred tax liability is recognized for taxable temporary differences associated with investments in subsidiaries,
associates, and interests in joint ventures, except to the extent that the Company is able to control the timing of the
reversal of the temporary differences and it is probable that the temporary difference will not reverse in the foreseeable
future. In addition, a deferred tax asset is recognized for deductible temporary differences arising from such
Samsung Electronics Co., Ltd. and its Subsidiaries
NOTES TO THE CONSOLIDATED FINANCIAL STATEMENTS
42
investments to the extent that it is probable the temporary difference will reverse in the foreseeable future and taxable
profit will be available against which the temporary difference can be utilized.
Deferred tax assets and liabilities are offset when there is a legally enforceable right to offset current tax assets against
current tax liabilities and when the deferred income taxes assets and liabilities relate to income taxes levied by the
same taxation authority on either the same taxable entity or different taxable entities where there is an intention to
settle the balances on a net basis.
2.22 Derivative Instruments
Derivatives are initially recognized at fair value on the date when a derivative contract is entered into and are
subsequently remeasured at their fair value at the end of each reporting period. Changes in the fair value of any
derivative instrument that does not qualify for hedge accounting are recognized immediately in profit or loss.
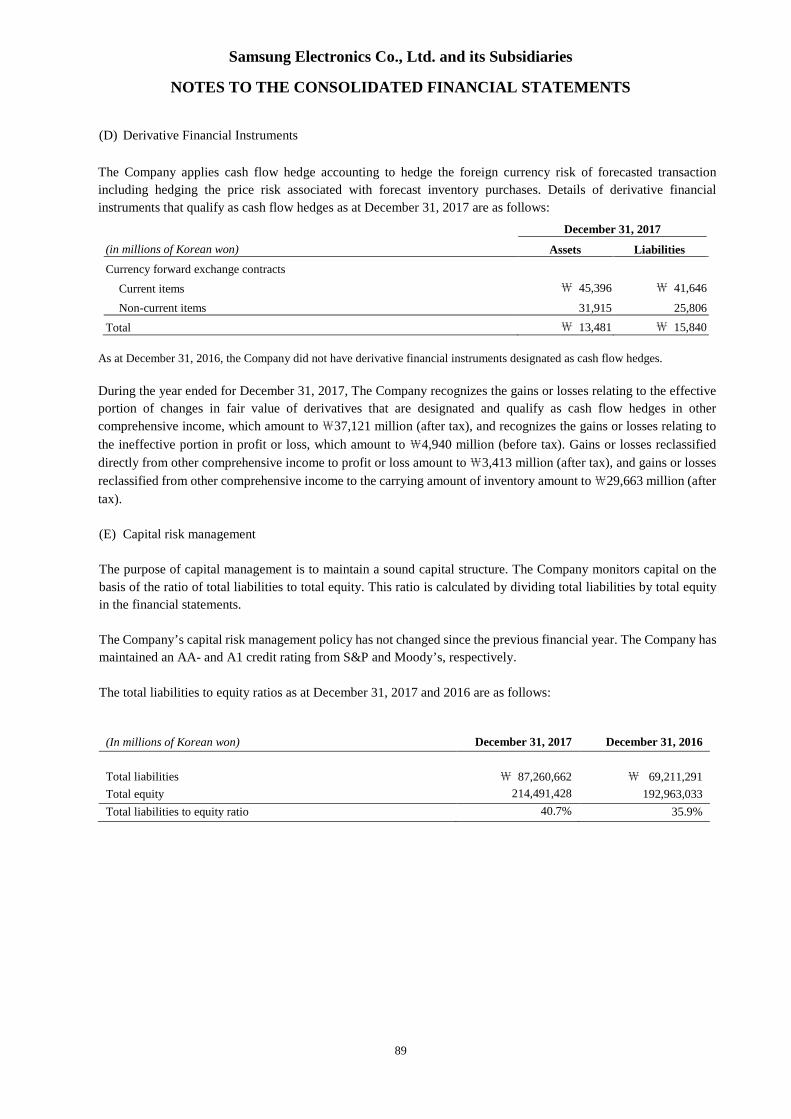
The Company applies cash flow hedge accounting to hedge the foreign currency risk of forecasted transactions
including hedging the price risk associated with forecast inventory purchase. The effective portion of changes in fair
value of derivatives that are designated and qualify as cash flow hedges is recognized in other comprehensive income,
and the ineffective portion is recognized in financial income or cost.
2.23 Dividend
Dividend distribution to the Company’s shareholders is recognized as a liability when the dividends are approved.
2.24 Share Capital
Ordinary shares and preference shares with no repayment obligations are classified as equity. When the Company
purchases its ordinary shares, the acquisition costs, including direct transaction costs, are deducted from equity until
the redemption or reissuance as treasury shares. Consideration received on the subsequent sale or issuance of treasury
shares is credited to equity.
2.25 Revenue Recognition
Revenue mainly comprises the fair value of the consideration received or receivable for the sale of goods in the
ordinary course of the Company’s activities. Revenue is shown net of value-added tax, returns, sales incentives and
discounts and after eliminating intercompany transactions.
The Company recognizes revenue when the amount of revenue can be reliably measured; when it is probable that
future economic benefits will flow to the entity; and when specific criteria have been met for each of the Company’s
activities, as described below. The Company measures revenue by reliably estimating the contingencies associated
with revenue based on historical results, taking into consideration the type of customer, the type of transaction and
the specifics of each arrangement.
Where multiple-element arrangements exist, the fair values of each element are determined based on the current
market price of each of the elements when sold separately. When the fair values of each element are indeterminable,
the fair values of deliverables which have already been provided are calculated in such way that the fair values of
elements which are yet to be provided are subtracted from total contract value of the arrangement.
(A) Sales of goods
Sales of products and merchandise are recognized upon delivery when the significant risks and rewards of ownership
of goods have transferred to the buyer. Revenue is recognized net of discounts and returns, estimated at the time of
sale based on past experience.
Samsung Electronics Co., Ltd. and its Subsidiaries
NOTES TO THE CONSOLIDATED FINANCIAL STATEMENTS
43
(B) Sales of services
Revenues from rendering services are generally recognized using the percentage-of-completion method based on the
percentage of costs to date compared to the total estimated costs, contractual milestones or performance.
(C) Interest income
Interest income is recognized using the effective interest method according to the time passed. When a loan or
receivable is impaired, the Company reduces the carrying amount to its recoverable amount and continues unwinding
the discount as interest income. Interest income on impaired loans and receivables is recognized using the original
effective interest rate.
(D) Royalty income
Royalty income is recognized on an accrual basis in accordance with the substance of the relevant agreements.
(E) Dividend income
Dividend income is recognized when the right to receive payment is established.
2.26 Leases
A lease is an agreement, whereby the lessor conveys to the lessee, in return for a payment or series of payments, the
right to use an asset for an agreed period of time. Leases in which a significant portion of the risks and rewards of
ownership are not transferred to the Company are classified as operating leases. Payments made under operating
leases are charge to profit or loss on a straight-line basis over the period of lease.
Leases where the Company, as lessee, has substantially all the risks and rewards of ownership are classified as finance
leases. Finance leases are capitalized at the lease’s inception at the fair value of the leased property or, if lower, the
present value of the minimum lease payments. The corresponding rental obligations, net of finance charges, are
included in other short-term and long-term payables. Each lease payment is allocated between the liability and
financial expense.
If the Company is a lessor, a lease is classified as a finance lease if it transfers substantially all the risks and rewardsincidental to ownership at the inception of the lease. A lease other than a finance lease is classified as an operatinglease. Lease income from operating leases is recognized in income on a straight-line basis over the lease term.Initial direct costs incurred by the lessor in negotiating and arranging an operating lease is added to the carryingamount of the leased asset and recognized as an expense over the lease term on the same basis as the lease income.
2.27 Government Grants
Government grants are recognized at their fair values when there is reasonable assurance that the grant will be
received and the Company will comply with the conditions attached to it. Government grants relating to costs are
deferred and recognized in the income statement over the period necessary to match them with the costs that they are
intended to compensate. Government grants relating to assets are recognized in liabilities as deferred income
government grants and are credited to the income statement on a straight– line basis over the expected lives of the
related assets.
Samsung Electronics Co., Ltd. and its Subsidiaries
NOTES TO THE CONSOLIDATED FINANCIAL STATEMENTS
44
2.28 Earnings per Share
Basic earnings per share is calculated by dividing net profit for the period available to ordinary shareholders by the
weighted-average number of ordinary shares outstanding during the year. Diluted earnings per share is calculated
using the weighted-average number of ordinary shares outstanding adjusted to include the potentially dilutive effect
of common equivalent shares outstanding.
2.29 Operating Segments
Operating segments are disclosed in the manner reported to the chief operating decision-maker. The chief operating
decision-maker is responsible for making strategic decisions on resource allocation and performance assessment of
the operating segments. The Management Committee, which makes strategic decisions, is regarded as the chief
operating decision-maker.
2.30 Convenience Translation into United States Dollar Amounts
The Company operates primarily in Korean won and its official accounting records are maintained in Korean won.
The US dollar amounts provided in the financial statements represent supplementary information solely for the
convenience of the reader. All Korean won amounts are expressed in U.S. dollars at the rate of₩1131.08 to US $1,
the average exchange rate for the year ended December 31, 2017. Such presentation is not in accordance with
generally accepted accounting principles, and should not be construed as a representation that the Korean won
amounts shown could be readily converted, realized or settled in US dollars at this or at any other rate.
2.31 Approval of the Consolidated Financial Statements
These consolidated financial statements were approved by the Board of Directors on January 31, 2018.
3. Critical Accounting Estimates and Assumptions
The Company makes estimates and assumptions concerning the future. The estimates and assumptions are
continuously assessed, considering historical experience and other factors, including expectations of future events
that are believed to be reasonable under the circumstances. The resulting accounting estimates will, by definition,
seldom equal the related actual results. The estimates and assumptions that have a significant risk of causing a material
adjustment to the carrying amounts of assets and liabilities within the next financial year are addressed below.
(A) Revenue recognition
The Company uses the percentage-of-completion method in accounting for its contracts to deliver installation services.
Use of the percentage-of-completion method requires the Company to estimate the services performed to date as a
proportion of the total services to be performed. Revenues and earnings are subject to significant change, effected by
early steps in a long-term projects, change in scope of a project, cost, period, and plans of the customers.
(B) Provision for warranty
The Company recognizes provision for warranty on products sold. The Company accrues provision for warranty
based on the best estimate of amounts necessary to settle future and existing claims. The amounts are estimated based
on past experience.
Samsung Electronics Co., Ltd. and its Subsidiaries
NOTES TO THE CONSOLIDATED FINANCIAL STATEMENTS
45
(C) Fair value of financial instruments
The fair value of financial instruments that are not traded in an active market is determined by using a variety of
methods and assumptions that are mainly based on market conditions existing at the end of each reporting period.
(D) Net defined benefit liabilities (assets)
The net defined benefit liabilities (assets) depend on a number of factors that are determined on an actuarial basis
using a number of assumptions including the discount rate. Any changes in these assumptions will impact the carrying
amount of the net defined benefit liability. The Company, in consideration of the interest rates of high-quality
corporate bonds, determines the appropriate discount rate at the end of each year. This is the interest rate that is used
to determine the present value of estimated future cash outflows expected to be required to settle the net defined
benefit liabilities (assets). The principal actuarial assumptions associated with the net defined benefit liabilities (assets)
are based on the current market expectations.
(E) Impairment of goodwill
At the end of each reporting period, the Company tests whether goodwill has become impaired by comparing the
carrying amounts of cash-generating units to the recoverable amounts. The recoverable amounts of cash-generating
units have been determined based on value-in-use calculations, and these calculations are based on estimates.
(F) Income taxes
Income taxes on the Company’s taxable income from operating activities are subject to various tax laws and
determinations of each tax authority across various countries throughout the world. There is uncertainty in
determining the eventual tax effects on the taxable income from operating activities. The Company has recognized
current tax and deferred tax at the end of the fiscal year based on the best estimation of future taxes payable as a result
of operating activities. However, the resulting deferred income tax assets and liabilities may not equal the actual
future taxes payable and such difference may impact the current tax and deferred income tax assets and liabilities
upon the determination of eventual tax effects.
Samsung Electronics Co., Ltd. and its Subsidiaries
NOTES TO THE CONSOLIDATED FINANCIAL STATEMENTS
46
4. Cash and Cash Equivalents
Cash and cash equivalents include cash on hand, deposits held at call with banks, and other short-term highly liquid
investments that are readily convertible to a known amount of cash and are subject to an insignificant risk of change
in value.
Cash and cash equivalents as at December 31, 2017 and 2016 consist of the following:
(In millions of Korean won) December 31, 2017 December 31, 2016
Cash on hand \ 37,521 ₩ 51,770
Bank deposits and others 30,507,609 32,059,672
Total \ 30,545,130 ₩ 32,111,442
5. Financial Assets Subject to Withdrawal Restrictions
Financial instruments subject to withdrawal restrictions as at December 31, 2017 and 2016 consist of the following:
(In millions of Korean won) December 31, 2017 December 31, 2016
1 The maximum exposure to credit risk of available-for-sale debt securities is the carrying amount at the reporting date.
(1) Equity securities - Listed
Details of listed equity securities as at December 31, 2017 and 2016 are as follows:
(In millions of Korean won, number of shares and percentage)
December 31, 2017December 31,
2016Number of
Shares OwnedPercentage of
Ownership (%)1Acquisition
CostBook Value
(Market Value)Book Value
(Market Value)
Samsung Heavy Industries 65,930,982 16.9 473,727 483,274 609,862
Hotel Shilla 2,004,717 5.1 13,957 170,200 96,527
iMarket Korea 647,320 1.8 324 5,832 6,732
SFA2 3,644,000 10.2 38,262 141,205 117,519
Wonik Holdings 3,518,342 4.6 30,821 27,760 23,714
Wonik IPS 3,701,872 9.0 32,428 123,643 96,989
ASML 6,297,787 1.4 363,012 1,169,393 851,395
Wacom 8,398,400 5.0 62,013 48,631 26,647
BYD 52,264,808 1.9 528,665 556,381 449,872
Other 158,688 182,262 82,978
Total ₩ 1,701,897 ₩ 2,908,581 ₩ 2,362,235
1 Ownership represents the Company’s ownership of ordinary shares issued in each entity.2 As SFA executed a capital increase without consideration, the Company’s number of SFA shares owned increased.
Acquisition cost includes impairment loss on available-for-sale financial assets recognized due to the decline inrealizable value below acquisition cost. The difference between the acquisition cost, net of impairment loss andthe current fair value is recorded within other components of equity, net of tax effects (unrealized gains or losseson available-for-sale financial assets).
Samsung Electronics Co., Ltd. and its Subsidiaries
NOTES TO THE CONSOLIDATED FINANCIAL STATEMENTS
54
(2) Equity securities – Non-listed
Details of non-listed equity securities as at December 31, 2017 and 2016 are as follows:
Corning Inc. 2,300 7.4 2,434,320 3,629,653 3,440,487
CSOSDT - 9.8 357,315 357,315 357,315
Nanosys 22,500,681 17.5 35,814 37,475 28,985
Other 721,252 676,760 481,756
Total ₩ 3,575,145 ₩ 4,729,124 ₩ 4,337,328
1 Nonmarketable shares are measured at cost as the variability of estimated cash flow is significant and the probability of various
estimates, including discount rate, cannot be reasonably assessed.
Acquisition cost includes impairment loss on available-for-sale financial assets recognized due to the decline inrealizable value below acquisition cost. The difference between the acquisition cost, net of impairment loss andthe current fair value is recorded within other components of equity, net of tax effects (unrealized gains or losseson available-for-sale financial assets).
(3) Debt securities
Details of debt securities as at December 31, 2017 and 2016 are as follows:
(In millions of Korean won) December 31, 2017 December 31, 2016
Corporate bonds \ 114,475 \ 104,713
Total \ 114,475 \ 104,713
10. Trade and Other Receivables
(A) Trade and other receivables as at December 31, 2017 and 2016 are as follows:
December 31, 2017 December 31, 2016
(In millions of Korean won) Trade Non-Trade Trade Non-Trade
Materials in transit 1,151,800 - 1,151,800 936,614 - 936,614
Total ₩26,880,843 ₩(1,897,488) ₩24,983,355 ₩21,780,679 ₩(3,427,176) ₩18,353,503
1 Inventories for which the Company has suspended sales or production, are evaluated based on net realizable value. Valuation
allowance is recorded if the net realizable value is less than the carrying amount.
The cost of inventories recognized as expense and included in ‘cost of sales’ for the year ended December 31, 2017,
amounts to₩128,823,788 million (2016:₩119,611,006 million). The amount includes inventory valuation losses.
Samsung Electronics Co., Ltd. and its Subsidiaries
NOTES TO THE CONSOLIDATED FINANCIAL STATEMENTS
56
12. Investments in Associates and Joint Ventures
(A) Changes in investments in associates and joint ventures for the years ended December 31, 2017 and 2016 are as
follows:
(In millions of Korean won) 2017 2016
Balance as at January 1 ₩ 5,837,884 ₩ 5,276,348
Acquisition 25,293 84,306
Disposal1 (53,187) (1,343,936)
Share of profit 201,442 19,501
Others2 790,919 1,801,665
Balance as at December 31 ₩ 6,802,351 ₩ 5,837,884
1 The Company sold its entire stake in Samsung Card for the year ended December 31, 2016.2 Others consist of dividends, impairment, reversal of impairment and reclassification.
(B) Major investments in associates and joint ventures as at December 31, 2017 are as follows:
(1) Investments in associates
Investee Nature of Relationship with Associate
Percentage of
Ownership1
(%)
Principal
Business
Location
The End of
Reporting
Period
Samsung Electro-
Mechanics
Manufacture and supply electronic components
including passive components, circuit boards, and
modules
23.7 Korea December
Samsung SDS
Provide IT services including computer
programming, system integration and management
and logistical services
22.6 Korea December
Samsung Biologics New business investment 31.5 Korea December
Samsung SDI2 Manufacture and supply electronics including
secondary cell batteries19.6 Korea December
Cheil Worldwide Advertising agency 25.2 Korea December
1 Ownership represents the Company’s ownership of ordinary shares issued by each entity.2 The Company’s ownership of ordinary shares outstanding is 20.6%.
(2) Investments in joint ventures
Investee Nature of Relationship with Joint Venture
Percentage of
Ownership1
(%)
Principal
Business
Location
The End of
Reporting
Period
Samsung Corning
Advanced GlassManufacture and supply industrial glass devices 50.0 Korea December
1 Ownership represents the Company’s ownership of ordinary shares issued by each entity.
Samsung Electronics Co., Ltd. and its Subsidiaries
NOTES TO THE CONSOLIDATED FINANCIAL STATEMENTS
57
(C) Details of investments in associates and joint ventures as at December 31, 2017, 2016 are as follows:
Net assets of equity shares (a x b) 989,924 1,256,881 1,251,292 2,266,451 241,335
Goodwill 7,081 26,801 3,645 - 298,779
Intercompany transactions and
others3 (5,426) (1,477) - (140,207) -
Book value of associates 991,579 1,282,205 1,254,937 2,126,244 540,114
3. Dividends from associates
Dividends ₩ 8,847 ₩ 13,104 ₩ - ₩ 13,463 ₩ 8,711
1 Income (loss) attributable to owners of the parent.2 Ownership percentage includes ordinary and preference shares.3 Consists of unrealized gains and losses and other differences.
Samsung Electronics Co., Ltd. and its Subsidiaries
Net assets of equity shares (a x b) 993,031 1,161,197 1,285,706 2,131,718 192,594
Goodwill 7,081 26,801 3,645 - 325,291
Intercompany transactions and
others3 (3,090) (2,295) - (898,732) -
Book value of associates 997,022 1,185,703 1,289,351 1,232,986 517,885
3. Dividends from associates
Dividends ₩ 8,847 ₩ 8,736 - - -
1 Income (loss) attributable to owners of the parent.2 Ownership percentage includes ordinary and preference shares.3 Consists of unrealized gains and losses and other differences.
Samsung Electronics Co., Ltd. and its Subsidiaries
NOTES TO THE CONSOLIDATED FINANCIAL STATEMENTS
62
(2) A summary of the condensed financial information of major joint ventures and dividends received from joint
ventures as at December 31, 2017 and 2016, and for the years ended December 31, 2017 and 2016 is as
follows:
Samsung Corning Advanced Glass
(In millions of Korean won) 2017 2016
1. Condensed financial information
Condensed statements of financial position:
Current assets ₩ 128,499 ₩ 170,614
- Cash and cash equivalent 11,035 16,021
Non-current assets 253,840 209,881
Current liabilities 41,325 41,076
- Current financial liabilities1 18,900 14,779
Non-current liabilities 134 377
Condensed statements of comprehensive income2:
Revenue ₩ 242,452 ₩ 257,041
Depreciation and amortization 1,356 2,202
Interest income 738 1,433
Income tax expense 129 (8,841)
Profit or loss from continuing operations2 2,034 (37,531)
Other comprehensive income(loss)2 - -
Total comprehensive loss2 2,034 (37,531)
1 Trade payables, other payables, and provisions are excluded.2 Income(loss) attributable to owners of the parent.
Samsung Corning Advanced Glass
(In millions of Korean won) 2017 2016
2. Details of adjustments from the book value of investments in joint ventures
Net assets(a) ₩ 340,880 ₩ 339,042
Ownership percentage(b) 50.0% 50.0%
Net assets of equity shares(a x b) 170,440 169,521
Intercompany transactions and others1 (15) (36)
Book value of joint ventures 170,425 169,485
3. Dividends from joint ventures
Dividends ₩ - ₩ -
1 Consists of unrealized gains and losses and other differences.
Samsung Electronics Co., Ltd. and its Subsidiaries
NOTES TO THE CONSOLIDATED FINANCIAL STATEMENTS
63
(3) Income (loss) amounts attributable to owners of the parent from associates and joint ventures which are not
individually material for the years ended December 31, 2017 and 2016 are as follows:
2017 2016
(In millions of Korean won) Associates Joint ventures Associates Joint ventures
Profit or loss from continuing operations ₩ 33,544 ₩ 6,219 ₩ 4,993 ₩ (3,567)
Other comprehensive income (loss) (9,386) (1,661) (2,042) (4,505)
Total comprehensive income (loss) ₩ 24,158 ₩ 4,558 ₩ 2,951 ₩ (8,072)
(F) Details of marketable investments in associates as at December 31, 2017 and 2016 is as follows:
1 The capitalized borrowing costs are ₩19,711million and the interest rate used to calculate the borrowing costs eligible for
capitalization is 0.71%.2 Other includes effects of changes in foreign currency exchange rates and effects of the offset related to government assistance.
Samsung Electronics Co., Ltd. and its Subsidiaries
NOTES TO THE CONSOLIDATED FINANCIAL STATEMENTS
64
2016
(In millions of Koreanwon) Land
Buildings andStructures
Machineryand
EquipmentConstructionIn Progress Other Total
Balance as at January 1 ₩ 7,848,432 ₩ 22,453,296 ₩ 43,077,879 ₩ 10,970,052 ₩2,127,451 ₩ 86,477,110
1 The capitalized borrowing costs are ₩17,644 million and the interest rate used to calculate the borrowing costs eligible for
capitalization is 0.95%.2 Other includes effects of changes in foreign currency exchange rates and effects of the offset related to government assistance.
(B) Details of depreciation of property, plant and equipment for the years ended December 31, 2017 and 2016 are as
follows:
(In millions of Korean won) 2017 2016
Cost of sales ₩ 18,440,750 ₩ 17,348,302
Selling and administrative expenses and others 2,152,866 1,964,218
Total ₩ 20,593,616 ₩ 19,312,520
Samsung Electronics Co., Ltd. and its Subsidiaries
NOTES TO THE CONSOLIDATED FINANCIAL STATEMENTS
65
14. Intangible Assets
(A) Changes in intangible assets for the years ended December 31, 2017 and 2016 are as follows:
(In millions of Korean won)
2017Intellectual
property rightsDevelopment
cost Membership Goodwill Other Total
Balance as at January 1 ₩ 1,349,764 ₩ 1,180,618 ₩ 184,399 ₩ 1,343,580 ₩ 1,285,659 ₩ 5,344,020
1 Collateralized borrowings are secured by trade receivables (refer to Note 8).2 Leased property, plant and equipment were pledged as collateral (refer to Note 19).
(B) Maturities of long-term borrowings outstanding as at December 31, 2017 are as follows:
(In millions of Korean won) Long-term borrowings
Repayment terms
2018 ₩ 273,418
2019 1,718,616
2020 57,812
2021 6,089
2022 and thereafter 31,929
Total ₩ 2,087,864
Samsung Electronics Co., Ltd. and its Subsidiaries
NOTES TO THE CONSOLIDATED FINANCIAL STATEMENTS
68
16. Debentures
(A) Details of foreign currency denominated debentures as at December 31, 2017 and 2016 are as follows:
(In millions of
Korean Won) Issue Date Due Date
Annual Interest Rates (%)
as at December 31, 2017 2017 2016
US dollar denominated
straight bonds1 1997.10.2 2027.10.1 7.7₩ 53,570
(US$50 million)
₩ 66,468
(US$55 million)
US dollar denominated
unsecured bonds2 2012.4.10 2017.4.10 -- 1,208,500
(US$1,000 million)
US dollar denominated
debenture bonds3 2015.5.6 2025.5.15 4.2428,560
(US$400 million)
-
EURO denominated
debenture bonds4 2015.5.20 2022.5.27 2.0447,739
(EUR€350 million)-
Less: Current Portion (5,357) (1,214,543)
Less: Discounts (1,405) (1,883)
More: Premium 30,254 -
Total ₩ 953,361 ₩ 58,542
1 US dollar denominated straight bonds are repaid annually for twenty years after a ten-year grace period from the date of issuance.
Interest is paid semi-annually.2 Samsung Electronics America issued dollar denominated unsecured bonds. The amount was repaid during 2017.3 Harman International Industries issued dollar denominated debenture bonds. Repayment of these debentures is due on the date
of maturity and interest is paid semi-annually.4 Harman Finance International SCA issued euro denominated debenture bonds. Repayment of these debentures is due on the date
of maturity and interest is paid annually.
(B) Maturities of debentures outstanding as at December 31, 2017 are as follows:
(In millions of Korean won) Debentures
Repayment Term
2018 ₩ 5,357
2019 5,357
2020 5,357
2021 5,357
2022 and thereafter 908,441
Total ₩ 929,869
Samsung Electronics Co., Ltd. and its Subsidiaries
NOTES TO THE CONSOLIDATED FINANCIAL STATEMENTS
69
17. Net Defined Benefit Liabilities (Assets)
(A) Details of net defined benefit liabilities(assets) recognized on the statements of financial position as at December
31, 2017 and 2016 are as follows:
(In millions of Korean won) December 31, 2017 December 31, 2016
Present value of funded defined benefit obligations ₩ 7,302,621 ₩ 7,167,929
Present value of unfunded defined benefit obligations 234,315 110,885
Subtotal 7,536,936 7,278,814
Fair value of plan assets (7,972,906) (7,662,249)
Total ₩ (435,970) ₩ (383,435)
(B) The amounts recognized in the statements of profit or loss for the years ended December 31, 2017 and 2016
related to defined benefit plans are as follows:
(In millions of Korean won) 2017 2016
Current service cost ₩ 885,101 ₩ 1,077,511
Net interest cost (income) (13,381) 11,221
Others (2,206) 2,319
Total ₩ 869,514 ₩ 1,091,051
(C) The amounts recognized as expense of defined contribution plans for the years ended December 31, 2017 and
2016 are₩106,814 million and₩105,971 million, respectively.
(D) The pension expenses related to defined benefit plans recognized on the statements of profit or loss for the years
ended December 31, 2017 and 2016 are as follows:
(In millions of Korean won) 2017 2016
Cost of sales ₩ 353,539 ₩ 469,172
Selling and administrative expenses and others 515,975 621,879
Total ₩ 869,514 ₩ 1,091,051
Samsung Electronics Co., Ltd. and its Subsidiaries
NOTES TO THE CONSOLIDATED FINANCIAL STATEMENTS
70
(E) Changes in the defined benefit obligations for the years ended December 31, 2017 and 2016 are as follows:
(In millions of Korean won) 2017 2016
Balance as at January 1 ₩ 7,278,814 ₩ 7,832,779
Current service cost 885,101 1,077,511
Interest cost 278,029 298,003
Remeasurement:
Actuarial gains or losses arising from changes in demographic assumptions (16,602) (41,608)
Actuarial gains or losses arising from changes in financial assumptions (494,523) (1,062,656)
Other (131,126) (295,125)
Benefits paid (505,689) (474,112)
Foreign exchange differences 6,243 1,846
Other1 236,689 (57,824)
Balance as at December 31 ₩ 7,536,936 ₩ 7,278,814
1 Other includes effects of business combinations.
(F) Changes in the fair value of plan assets for the years ended December 31, 2017 and 2016 are as follows:
(In millions of Korean won) 2017 2016
Balance as at January 1 ₩ 7,662,249 ₩ 7,473,959
Expected return on plan assets 291,410 286,782
Remeasurement factor of plan assets (152,821) (123,794)
Contributions by employer 422,680 498,504
Benefits paid (250,341) (422,249)
Other1 (271) (50,953)
Balance as at December 31 ₩ 7,972,906 ₩ 7,662,249
1 Other includes effects of changes in foreign currency exchange rates and business combinations.
Expected contributions to post-employment benefit plans for the year ending December 31, 2018 are ₩883,058
million.
(G) Plan assets as at December 31, 2017 and 2016 consist of the following:
(In millions of Korean won) December 31, 2017 December 31, 2016
Debt instruments ₩ 7,945,391 ₩ 7,635,150
Other 27,515 27,099
Total ₩ 7,972,906 ₩ 7,662,249
Plan assets are mostly invested in instruments which have a quoted price in active markets.
Samsung Electronics Co., Ltd. and its Subsidiaries
NOTES TO THE CONSOLIDATED FINANCIAL STATEMENTS
71
(H) The principal actuarial assumptions as at December 31, 2017 and 2016 are as follows:
December 31, 2017 December 31, 2016
Discount rate 0.4 ~ 8.2 % 0.4 ~ 8.2 %
Salary growth rate (including the effects of inflation) 1.5 ~ 10.0 % 1.5 ~ 10.0 %
(I) The sensitivity of the defined benefit obligations as at December 31, 2017 and 2016 to changes in the weighted
principal assumptions is as follows:
December 31, 2017 December 31, 2016
Discount rate
1% increase 92% 90%
1% decrease 110% 111%
Salary growth rate
1% increase 110% 111%
1% decrease 92% 90%
(J) The weighted average maturity of the defined benefit obligations is 8.95 years.
18. Provisions
Changes in provisions for the year ended December 31, 2017 are as follows:
(In millions of Korean won) Warranty (A)
Royalty
expenses (B)
Long-term
incentives (C)
Others
(D, E) Total
Balance as at January 1 ₩ 1,747,857 ₩ 1,588,037 ₩ 716,252 ₩ 903,397 ₩ 4,955,543
Charged (credited) to
the statement of profit or loss 2,032,311 741,497 478,507 61,745 3,314,060
Net effect ₩ 26,474 ₩ (26,474) ₩ 55,680 ₩ (55,680)
(B) Credit risk
Credit risk arises during the normal course of transactions and investing activities where clients or other parties fail
to discharge an obligation. The Company monitors and sets the client’s and counterparty’s credit limit on a periodic
basis based on the client’s and counterparty’s financial conditions, default history and other important factors.
Adequate insurance coverage is maintained for accounts receivables related to trading partners situated in higher risk
countries.
Credit risk can arise from transactions with financial institutions which include financial instrument transactions such
as cash and cash equivalents, savings, and derivative instruments. To minimize such risk, the Company transacts only
with banks which have strong international credit rating (S&P A and above), and all new transactions with financial
institutions with no prior transaction history are approved, managed and monitored by the Company’s finance team
and the local finance center. The Company requires separate approval for contracts with restrictions.
Samsung Electronics Co., Ltd. and its Subsidiaries
NOTES TO THE CONSOLIDATED FINANCIAL STATEMENTS
88
As at December 31, 2017 and 2016 the Company estimates that its maximum exposure to credit risk is the carrying
amount of its financial assets, net of impairment losses.
(C) Liquidity risk
Due to large investments made by the Company, maintaining adequate levels of liquidity risk is critical. The
Company strives to achieve this goal by periodically forecasting its capital balance, estimating required cash levels,
and managing income and expenses.
The Company manages its liquidity risk by periodically forecasting projected cash flows. If abnormal signs are
identified, the Company works with the local finance center and provides liquidity support by utilizing a globally
integrated finance structure, such as Cash Pooling. In addition, the Company maintains a liquidity management
process which provides additional financial support by the local finance center and the Company. The Cash Pooling
program allows sharing of surplus funds among entities and contributes to minimizing liquidity risk and strengthening
the Company’s competitive position by reducing capital operation expenses and financial expenses.
In addition, the Company mitigates liquidity risk by contracting with financial institutions with respect to bankoverdrafts and foreign trade finance, and by providing payment guarantees to subsidiaries. For large scale facilityinvestments, liquidity risk is minimized by utilizing internal reserves and long term borrowings according to thecapital injection schedule.
As at December 31, 2017 and 2016, the following table is an undiscounted cash flow analysis for financial liabilities
that are presented on the statements of financial position according to their remaining contractual maturity.
Total financial liabilities ₩ 52,705,258 ₩ 46,944,824
1 Assets and liabilities whose carrying amount is a reasonable approximation of fair value are excluded from the fair value
disclosures.2 Amounts measured at cost of ₩1,191,025 million (December 31, 2016: ₩977,769 million) are excluded as the range of
reasonable fair value estimates is significant and the probabilities of the various estimates cannot be reasonably assessed.3 Assets measured at cost of₩6,212,727 million (December 31, 2016:₩2,452,118 million) and liabilities measured at cost of
₩24,240,081 million (December 31, 2016:₩11,867,772) are excluded as the carrying amount is a reasonable approximation
of fair value.
Samsung Electronics Co., Ltd. and its Subsidiaries
NOTES TO THE CONSOLIDATED FINANCIAL STATEMENTS
91
(2) Fair value hierarchy classifications of the financial instruments that are measured at fair value or its fair value
is disclosed as at December 31, 2017 and 2016 are as follows :
December 31, 2017
(In millions of Korean won) Level 1 Level 2 Level 3 Total
1 For equity securities, changes in fair value are calculated with the correlation among growth rate (-1%~1%), volatility
(26.5%~32.5%) and discount rate, which are significant unobservable inputs.2 The fair value of other payables is calculated by increasing or decreasing the discount rate by 10%, which is the significant
unobservable input.
Samsung Electronics Co., Ltd. and its Subsidiaries
NOTES TO THE CONSOLIDATED FINANCIAL STATEMENTS
94
32. Segment Information
(A) Operating segment information
The chief operating decision maker has been identified as the Management Committee. The Company determines
operating segments based on the units reported to the Management Committee. The Management Committee reviews
operating profits of each operating segment in order to assess performance and to make strategic decisions regarding
allocation of resources to the segment.
The operating segments are product-based and are identified based on the internal organization and revenue streams.
As at the reporting date, the operating segments are comprised of CE, IM, Semiconductor, DP, Harman and others.
The segment information for each reporting period such as depreciation, amortization of intangible assets, and
operating profit is prepared after the allocation of internal transaction adjustments. Total assets and liabilities of each
operating segment are excluded from the disclosure as these have not been provided regularly to the Management
1 Includes other amounts not included in specific operating segments.2 Segment net revenue includes intersegment revenue.3 CE is restated due to the reclassification of the Printing Solutions business segment, which has been changed from CE to Others.
Samsung Electronics Co., Ltd. and its Subsidiaries
NOTES TO THE CONSOLIDATED FINANCIAL STATEMENTS
95
(B) Regional information
The regional segment information provided to the Management Committee for the reportable segments as at and for
the years ended December 31, 2017 and 2016 is as follows:
(1) For the year ended December 31, 2017
(In millions of Korean
won) Korea America Europe
Asia and
Africa China
Intercompany
elimination
within the
Company Consolidated
Net segment revenue 31,545,181 81,019,556 44,418,914 44,247,994 38,343,731 - 239,575,376
Total (Others) \ 125,213 \ 3 \ 609,923 \ 2,386,573
1 Transactions with separate entities that are related parties of the Company.2 Although these entities are not related parties of the Company in accordance with Korean IFRS 1024, they belong to the same
large enterprise group in accordance with the Monopoly Regulation and Fair Trade Act.
(In millions of
Korean won) Name of Company1
2016
Sales
Disposal of
fixed assets Purchases
Purchases of
fixed assets
Associates and
joint ventures
Samsung SDS \ 46,073 \ - \ 1,585,089 \ 199,728
Samsung Electro-Mechanics 27,516 23 2,280,953 -
Samsung SDI2 59,322 397 1,072,830 32,576
Cheil Worldwide3 672 - 214,061 -
Other 286,880 113 6,693,656 214,728
Total (Associates and Joint ventures) \ 420,463 \ 533 \ 11,846,589 \ 447,032
Other related
parties
Samsung C&T \ 42,905 \ 74 \ 249,088 \ 3,343,979
Other 231,878 1,557,589 763,500 398,514
Total (Other related parties) \ 274,783 \ 1,557,663 \ 1,012,588 \ 3,742,493
Others4
Samsung Engineering 15,677 - 17,627 2,485,027
S-1 35,846 - 323,792 37,590
Other 58,054 83,298 663,222 65
Total (Others) \ 109,577 \ 83,298 \ 1,004,641 \ 2,522,682
1 Transactions with separate entities that are related parties of the Company.2 For the year ended December 31, 2016, Samsung SDI was included in associates as the Company’s ownership of common
outstanding stock was increased.3 For the year ended December 31, 2016, Cheil Worldwide was included in associates due to acquisition of shares.4 Although these entities are not related parties of the Company in accordance with Korean IFRS 1024, they belong to the same
large enterprise group in accordance with the Monopoly Regulation and Fair Trade Act.
Samsung Electronics Co., Ltd. and its Subsidiaries
NOTES TO THE CONSOLIDATED FINANCIAL STATEMENTS
97
(B) Balances of receivables and payables
Balances of receivables and payables arising from sales and purchases of goods and services as at December 31, 2017
and December 31, 2016 are as follows:
December 31, 2017
(In millions of Korean won) Name of Company1 Receivables Payables
Associates and
joint ventures
Samsung SDS \ 14,182 \ 406,760
Samsung Electro-Mechanics 7,052 197,364
Samsung SDI 90,370 97,193
Cheil Worldwide 369 500,706
Other 250,059 954,537
Total (Associates and joint ventures) \ 362,032 \ 2,156,560
Other related parties
Samsung C&T \ 242,506 \ 731,995
Other2 29,457 1,313,314
Total (Other related parties) \ 271,963 \ 2,045,309
Others3
Samsung Engineering 2,518 \ 652,519
S-1 2,589 58,309
Other 3,369 35,774
Total (Others) \ 8,476 \ 746,602
1 Balances due from and to separate entities that are related parties of the Company.2 Payables include the unsettled amount from purchasing cards with Samsung Card of\1,121,331 million. The Company has a
purchasing card agreement with a limit of\2,343,000 million as at December 31, 2017. For the year ended December 31, 2017,
the amounts used and reimbursed are\5,091,576 million and\5,279,430 million, respectively.3 Although these entities are not related parties of the Company in accordance with Korean IFRS 1024, they belong to the same
large enterprise group in accordance with the Monopoly Regulation and Fair Trade Act.
December 31, 2016
(In millions of Korean won) Name of Company1 Receivables Payables
Associates and
joint ventures
Samsung SDS \ 5,709 \ 362,062
Samsung Electro-Mechanics 1,143 108,469
Samsung SDI2 89,721 76,211
Cheil Worldwide3 456 436,624
Other 210,891 784,475
Total (Associates and joint ventures) \ 307,920 \ 1,767,841
Other related parties
Samsung C&T \ 231,089 \ 435,505
Other 31,752 1,932,924
Total (Other related parties) \ 262,841 \ 2,368,429
Others4
Samsung Engineering \ 10,664 \ 115,726
S-1 4,160 47,098
Other 3,058 28,841
Total (Others) \ 17,882 \ 191,665
1 Balances due from and to separate entities that are related parties of the Company.2 For the year ended December 31, 2016, Samsung SDI was included in associates as the Company’s ownership of common
outstanding stock was increased.3 For the year ended December 31, 2016, Cheil Worldwide was included in associates due to acquisition of shares.4 Although these entities are not related parties of the Company in accordance with Korean IFRS 1024, they belong to the same
large enterprise group in accordance with the Monopoly Regulation and Fair Trade Act.
Samsung Electronics Co., Ltd. and its Subsidiaries
NOTES TO THE CONSOLIDATED FINANCIAL STATEMENTS
98
(C) For the year ended December 31, 2017, the Company invested\25,293 million (for the year ended December
31, 2016, \84,306 million) in associates and joint ventures. And for the year ended December 31, 2017, the
Company recovered \53,085 million (for the year ended December 31, 2016, \4,931) from associates andjoint ventures. Also, for the year ended December 31, 2016, the Company invested 181,081 million to the entitiesthat are not related parties of the Company in accordance with Korean IFRS 1024, but belong to the sameconglomerate according to the Monopoly Regulation and Fair Trade Act.
(D) For the year ended December 31, 2017, the Company declared \1,165,659 million of dividends (for the year
ended December 31, 2016, \505,296 million) to related parties. As at December 31, 2017 and 2016, there are
no unpaid dividends to related parties. Also, for the year ended December 31, 2017, the Company declared
\90,034 million of dividends (for the year ended December 31, 2016, \38,983 million) to the entities that are
not related parties of the Company in accordance with Korean IFRS 1024, but belong to the same conglomerate
according to the Monopoly Regulation and Fair Trade Act. As at December 31, 2017 and 2016, there are no
unpaid dividends to these entities.
(E) Key management compensation
Key management includes directors (executive and non-executive) and members of the Executive Committee. The
compensation paid or payable for employee services for the years ended December 31, 2017 and 2016 consists of:
(In millions of Korean won) 2017 2016
Short-term employee benefits \ 28,025 \ 16,822
Post-employment benefits 792 640
Other long-term employee benefits 8,617 8,671
Samsung Electronics Co., Ltd. and its Subsidiaries
NOTES TO THE CONSOLIDATED FINANCIAL STATEMENTS
99
34. Information about Non-Controlling Interests
(A) Changes in accumulated non-controlling interests
The profit or loss allocated to non-controlling interests and accumulated non-controlling interests of subsidiaries that
are material to the Company for the years ended December 31, 2017 and 2016 are as follows: