103
CONSOLIDATED FINANCIAL STATEMENTS OF SUEZ ENVIRONNEMENT COMPANY FOR THE FISCAL YEARS ENDED DECEMBER 31, 2013 AND 2012
CONSOLIDATED FINANCIAL STATEMENTS OF
SUEZ ENVIRONNEMENT COMPANY
FOR THE FISCAL YEARS ENDED
DECEMBER 31, 2013 AND 2012
2
FINANCIAL INFORMATION
RELATING TO THE COMPANY’S ASSETS,
FINANCIAL POSITION AND
REVENUES
1 CONSOLIDATED FINANCIAL STATEMENTS
1.1 Consolidated statements of financial position
1.2 Consolidated income statements
1.3 Statements of changes in consolidated shareholders’ equity
1.4 Consolidated statements of comprehensive income
1.5 Consolidated statements of cash flows
1.6 Notes to the consolidated financial statements
2 STATUTORY AUDITORS’ REPORT ON THE CONSOLIDATED FINANCIAL STATEMENTS

3
1 CONSOLIDATED FINANCIAL STATEMENTS
1.1 Consolidated statements of financial position
In millions of euros Note December 31, 2013 December 31, 2012
NON-CURRENT ASSETS
Intangible assets, net 10 4,517.5 4,060.8
Goodwill 9 3,184.3 3,256.9
Property, plant and equipment net 11 7,832.5 8,882.0
Available-for-sale securities 12 498.1 395.9
Loans and receivables carried at amortized cost 12 787.6 700.7
Derivative financial instruments 12 200.2 259.1
Investments in associates 497.1 490.9
Other assets 303.0 80.0
Deferred tax assets 7 730.1 755.1
TOTAL NON-CURRENT ASSETS 18,550.4 18,881.4
CURRENT ASSETS
Loans and receivables carried at amortized cost 12 353.8 266.6
Derivative financial instruments 12 11.6 5.5
Trade and other receivables 12 3,628.5 3,805.3
Inventories 286.4 290.1
Other assets 1,279.6 1,116.8
Financial assets measured at fair value through income 12 91.6 23.5
Cash and cash equivalents 12 2,506.0 2,247.3
TOTAL CURRENT ASSETS 8,157.5 7,755.1
TOTAL ASSETS 26,707.9 26,636.5
Shareholders' equity, Group share 4,963.0 4,863.9
Non-controlling interests 1,946.6 1,995.3
TOTAL SHAREHOLDERS' EQUITY 14 6,909.6 6,859.2
NON-CURRENT LIABILITIES
Provisions 15 1,339.8 1,431.5
Long-term borrowings (a) 12 7,228.9 8,554.8
Derivative financial instruments 12 46.2 90.7
Other financial liabilities 12 3.6 2.7
Other liabilities 876.2 645.3
Deferred tax liabilities 7 568.5 573.9
TOTAL NON-CURRENT LIABILITIES 10,063.2 11,298.9
CURRENT LIABILITIES
Provisions 15 461.0 563.7
Short-term borrowings (a) 12 2,769.7 1,363.6
Derivative financial instruments 12 6.9 11.3
Trade and other payables 12 2,770.1 2,871.0
Other liabilities 3,727.4 3,668.8
TOTAL CURRENT LIABILITIES 9,735.1 8,478.4
TOTAL SHAREHOLDERS' EQUITY AND LIABILITIES 26,707.9 26,636.5
NB: The values in the tables are generally expressed in millions of euros. Rounding may in some cases produce a non-material
discrepancy in totals or variances.
(a) See explanation of the variation in Note 12.3.1.
4
1.2 Consolidated income statements
In millions of euros Note December 31, 2013 December 31, 2012
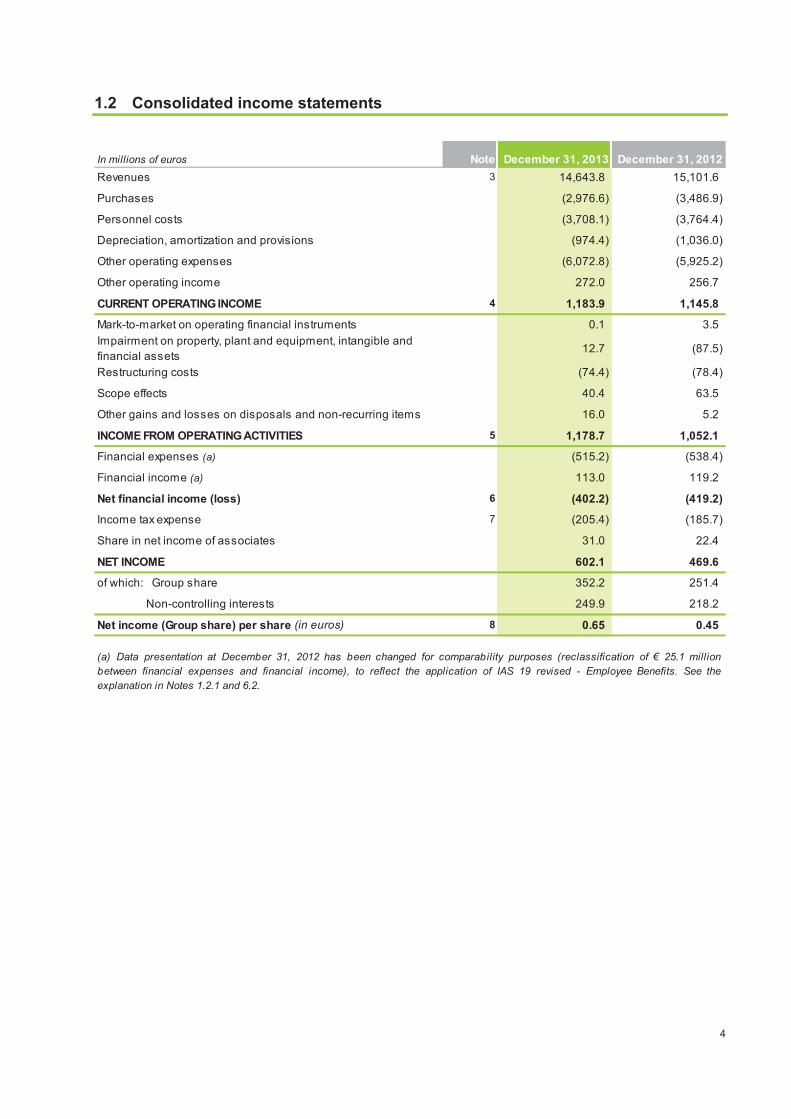
Revenues 3 14,643.8 15,101.6
Purchases (2,976.6) (3,486.9)
Personnel costs (3,708.1) (3,764.4)
Depreciation, amortization and provisions (974.4) (1,036.0)
Other operating expenses (6,072.8) (5,925.2)
Other operating income 272.0 256.7
CURRENT OPERATING INCOME 4 1,183.9 1,145.8
Mark-to-market on operating financial instruments 0.1 3.5
Impairment on property, plant and equipment, intangible and
financial assets12.7 (87.5)
Restructuring costs (74.4) (78.4)
Scope effects 40.4 63.5
Other gains and losses on disposals and non-recurring items 16.0 5.2
INCOME FROM OPERATING ACTIVITIES 5 1,178.7 1,052.1
Financial expenses (a) (515.2) (538.4)
Financial income (a) 113.0 119.2
Net financial income (loss) 6 (402.2) (419.2)
Income tax expense 7 (205.4) (185.7)
Share in net income of associates 31.0 22.4
NET INCOME 602.1 469.6
of which: Group share 352.2 251.4
Non-controlling interests 249.9 218.2
Net income (Group share) per share (in euros) 8 0.65 0.45
(a) Data presentation at December 31, 2012 has been changed for comparability purposes (reclassification of € 25.1 million
between financial expenses and financial income), to reflect the application of IAS 19 revised - Employee Benefits. See the
explanation in Notes 1.2.1 and 6.2.
5
1.3 Statements of changes in consolidated shareholders’ equity
In millions of euros
Number of
shares
Share
Capital
Change in fair
value and
other
Translation
adjustments
Treasury
shares
Shareholder
s' equity,
Group share Total
Shareholders’ equity at December
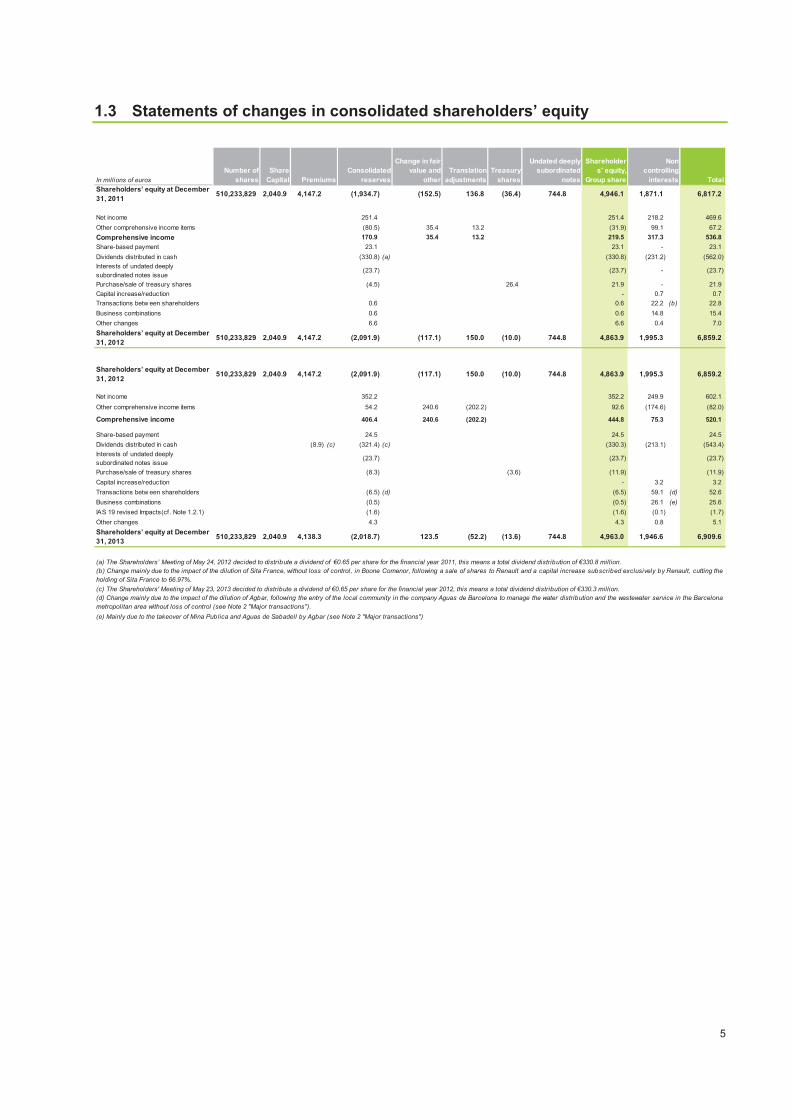
31, 2011510,233,829 2,040.9 4,147.2 (1,934.7) (152.5) 136.8 (36.4) 744.8 4,946.1 1,871.1 6,817.2
Net income 251.4 251.4 218.2 469.6
Other comprehensive income items (80.5) 35.4 13.2 (31.9) 99.1 67.2
Comprehensive income 170.9 35.4 13.2 219.5 317.3 536.8
Share-based payment 23.1 23.1 - 23.1
Dividends distributed in cash (330.8) (a) (330.8) (231.2) (562.0)
Interests of undated deeply
subordinated notes issue(23.7) (23.7) - (23.7)
Purchase/sale of treasury shares (4.5) 26.4 21.9 - 21.9
Capital increase/reduction - 0.7 0.7
Transactions betw een shareholders 0.6 0.6 22.2 (b) 22.8
Business combinations 0.6 0.6 14.8 15.4
Other changes 6.6 6.6 0.4 7.0
Shareholders’ equity at December
31, 2012510,233,829 2,040.9 4,147.2 (2,091.9) (117.1) 150.0 (10.0) 744.8 4,863.9 1,995.3 6,859.2
Shareholders’ equity at December
31, 2012510,233,829 2,040.9 4,147.2 (2,091.9) (117.1) 150.0 (10.0) 744.8 4,863.9 1,995.3 6,859.2
Net income 352.2 352.2 249.9 602.1
Other comprehensive income items 54.2 240.6 (202.2) 92.6 (174.6) (82.0)
Comprehensive income 406.4 240.6 (202.2) 444.8 75.3 520.1
Share-based payment 24.5 24.5 24.5
Dividends distributed in cash (8.9) (c) (321.4) (c) (330.3) (213.1) (543.4)
Interests of undated deeply
subordinated notes issue(23.7) (23.7) (23.7)
Purchase/sale of treasury shares (8.3) (3.6) (11.9) (11.9)
Capital increase/reduction - 3.2 3.2
Transactions betw een shareholders (6.5) (d) (6.5) 59.1 (d) 52.6
Business combinations (0.5) (0.5) 26.1 (e) 25.6
IAS 19 revised Impacts(cf. Note 1.2.1) (1.6) (1.6) (0.1) (1.7)
Other changes 4.3 4.3 0.8 5.1
Shareholders’ equity at December
31, 2013510,233,829 2,040.9 4,138.3 (2,018.7) 123.5 (52.2) (13.6) 744.8 4,963.0 1,946.6 6,909.6
(c) The Shareholders' Meeting of May 23, 2013 decided to distribute a dividend of €0.65 per share for the financial year 2012, this means a total dividend distribution of €330.3 million.
(a) The Shareholders’ Meeting of May 24, 2012 decided to distribute a dividend of €0.65 per share for the financial year 2011, this means a total dividend distribution of €330.8 million.
(b) Change mainly due to the impact of the dilution of Sita France, without loss of control, in Boone Comenor, following a sale of shares to Renault and a capital increase subscribed exclusively by Renault, cutting the
holding of Sita France to 66.97%.
(d) Change mainly due to the impact of the dilution of Agbar, following the entry of the local community in the company Aguas de Barcelona to manage the water distribution and the wastewater service in the Barcelona
metropolitan area without loss of control (see Note 2 "Major transactions").
(e) Mainly due to the takeover of Mina Publica and Aguas de Sabadell by Agbar (see Note 2 "Major transactions")
Premiums
Consolidated
reserves
Undated deeply
subordinated
notes
Non
controlling
interests
6
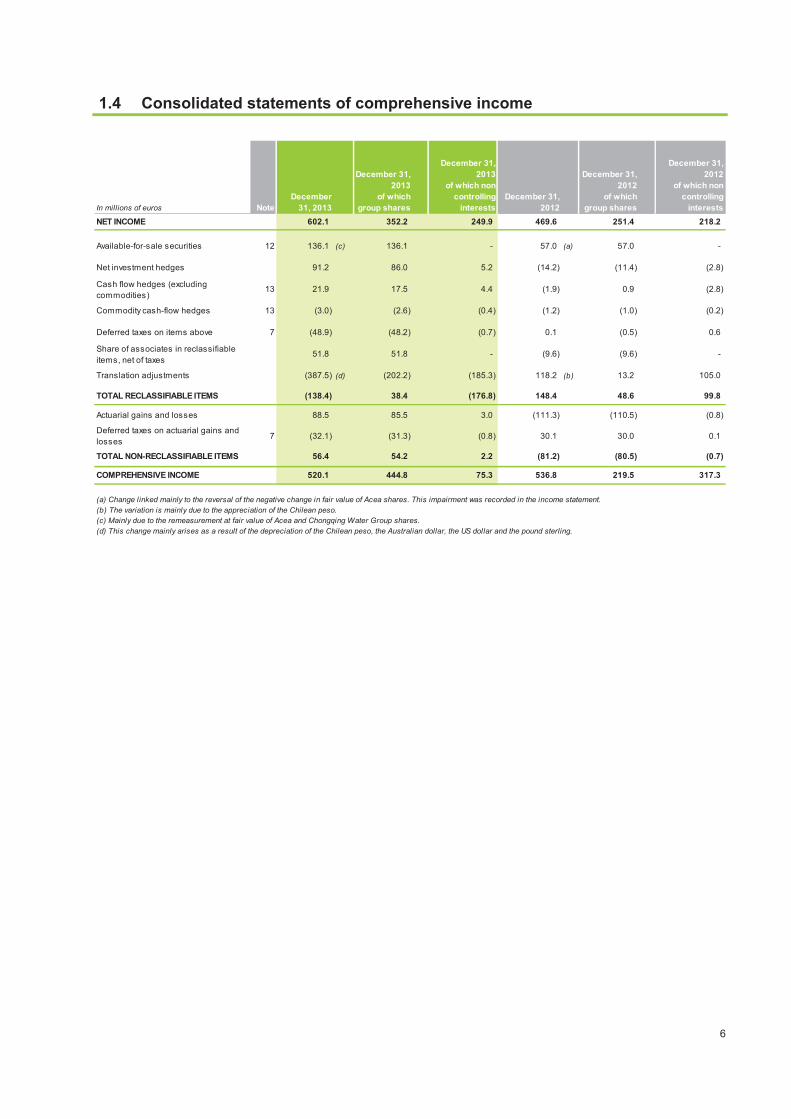
1.4 Consolidated statements of comprehensive income
In millions of euros Note
December
31, 2013
December 31,
2013
of which
group shares
December 31,
2013
of which non
controlling
interests
December 31,
2012
December 31,
2012
of which
group shares
December 31,
2012
of which non
controlling
interests
NET INCOME 602.1 352.2 249.9 469.6 251.4 218.2
Available-for-sale securities 12 136.1 (c) 136.1 - 57.0 (a) 57.0 -
Net investment hedges 91.2 86.0 5.2 (14.2) (11.4) (2.8)
Cash flow hedges (excluding
commodities)13 21.9 17.5 4.4 (1.9) 0.9 (2.8)
Commodity cash-flow hedges 13 (3.0) (2.6) (0.4) (1.2) (1.0) (0.2)
Deferred taxes on items above 7 (48.9) (48.2) (0.7) 0.1 (0.5) 0.6
Share of associates in reclassifiable
items, net of taxes51.8 51.8 - (9.6) (9.6) -
Translation adjustments (387.5) (d) (202.2) (185.3) 118.2 (b) 13.2 105.0
TOTAL RECLASSIFIABLE ITEMS (138.4) 38.4 (176.8) 148.4 48.6 99.8
Actuarial gains and losses 88.5 85.5 3.0 (111.3) (110.5) (0.8)
Deferred taxes on actuarial gains and
losses7 (32.1) (31.3) (0.8) 30.1 30.0 0.1
TOTAL NON-RECLASSIFIABLE ITEMS 56.4 54.2 2.2 (81.2) (80.5) (0.7)
COMPREHENSIVE INCOME 520.1 444.8 75.3 536.8 219.5 317.3
(a) Change linked mainly to the reversal of the negative change in fair value of Acea shares. This impairment was recorded in the income statement.
(b) The variation is mainly due to the appreciation of the Chilean peso.
(c) Mainly due to the remeasurement at fair value of Acea and Chongqing Water Group shares.
(d) This change mainly arises as a result of the depreciation of the Chilean peso, the Australian dollar, the US dollar and the pound sterling.

7
1.5 Consolidated statements of cash flows
In millions of euros Note December 31, 2013 December 31, 2012
Net income 602.1 469.6
- Share in net income of associates (31.0) (22.4)
+ Dividends received from associates 34.6 39.4
- Net depreciation, amortization and provisions 923.1 1,117.5
- Scope effects, other gains and losses on disposal and non-recurring items (54.1) (67.9)
- Other items with no cash impact 24.2 23.6
- Income tax expense 7 205.4 185.7
- Financial income 6 402.2 419.2
Cash flows from operations before financial income/(expense) and income tax 2,106.5 2,164.7
+ Tax paid (a) (214.5) (112.9)
Change in working capital requirements (b) (68.2) 305.3
Cash flows from operating activities 1,823.8 2,357.1
Investments in property, plant and equipment and intangible assets 3.4.3 (1,138.3) (1,222.4)
Takeover of subsidiaries net of cash and cash equivalents acquired 3.4.3 (22.2) (6.4)
Acquisitions of interests in associates and joint-ventures 3.4.3 (6.6) (65.2)
Acquisitions of available-for-sale securities 3.4.3 (8.0) (20.1)
Disposals of property, plant and equipment and intangible assets 125.5 33.8
Loss of controlling interests in subsidiaries net of cash and cash equivalents sold 10.4 77.3
Disposals of interests in associates and joint ventures 69.6 2.6
Disposals of available-for-sale securities 5.8 31.0
Interest received on non-current financial assets 8.2 13.4
Dividends received on non-current financial assets 43.0 19.1
Change in loans and receivables issued by the Company and others (74.8) (146.4)
Cash flows from investing activities (987.4) (1,283.3)
Dividends paid (c) (556.1) (601.1)
Repayment of borrowings (d) 12 (1,350.9) (1,491.2)
Change in financial assets at fair value through income (64.3) (9.0)
Financial interest paid (359.1) (432.1)
Financial interest received on cash and cash equivalents 36.9 48.1
Flows on financial derivatives qualifying net investment hedges and compensation
payments on financial derivatives57.2 (67.8)
Increase in financial debt (d) 12 1,743.5 1,157.2
Increase in share capital 5.9 (0.1)
Purchase/sale of treasury shares (11.6) 20.2
Change in share of interests in controlled entities 3.4.3 0.6 0.6
Cash flows from financing activities (497.9) (1,375.2)
Impact of changes in exchange rates and other (79.8) 55.2
TOTAL CASH FLOWS FOR THE PERIOD 258.7 (246.2)
OPENING CASH AND CASH EQUIVALENTS 2,247.3 2,493.5
CLOSING CASH AND CASH EQUIVALENTS 12 2,506.0 2,247.3
(a) The variation mainly reflects the settlement of tax disputes by Agbar for €20 million (see Note 24) and the state tax refund in favour of Agbar in 2012.
(b) The variation is mainly due to the sale and derecognition of trade receivables in 2012 for €317 million.
(d) These variations are detailed in Note 12 "Financial Instruments" (see explanation of significant changes that affect the gross debt and comments on the
change in net debt).
(c) including withholding tax.
8
1.6 Notes to the consolidated financial statements
NOTE 1 BASIS OF PRESENTATION, PRINCIPLES AND ACCOUNTING POLICIES
1.1 Basis of presentation
SUEZ ENVIRONNEMENT COMPANY SA, the Parent Company of the Group, is a French société anonyme subject to the provisions
of Book II of the French Commercial Code, as well as to all other legal provisions applying to French commercial corporations. It was
incorporated in November 2000. The Group’s headquarter is in the CB21 tower - 16 place de l’Iris - 92040 Paris La Défense – France.
The Group is a major international player in the water and waste industries. It came about as the result of the SUEZ Group’s 2008
regrouping of all its subsidiaries and holdings in the environment sector, within SUEZ ENVIRONNEMENT COMPANY, as part of the
merger between Gaz de France and SUEZ. SUEZ ENVIRONNEMENT COMPANY has been listed on the Euronext Paris market
(Compartiment A) and Euronext Brussels market since July 22, 2008.
On February 19, 2014, the Board of Directors of SUEZ ENVIRONNEMENT COMPANY approved and authorized the publication of
the Group’s consolidated financial statements for the fiscal year ended December 31, 2013.
1.2 Accounting standards
Pursuant to European Commission Regulation (EC) 809/2004 on Prospectus dated April 29, 2004, the financial information
concerning the assets, liabilities, financial position, and profit and loss of SUEZ ENVIRONNEMENT COMPANY has been provided for
the last two fiscal years ended December 31, 2012 and 2013, and was prepared in accordance with European Regulation (EC)
1606/2002 of July 19, 2002 relating to the application of international accounting standards (IFRS). The Group’s Consolidated
Financial Statements for the year ended December 31, 2013 were prepared in accordance with IFRS as issued by the IASB and
endorsed by the European Union(1).
The accounting standards applied in preparing the financial statements at December 31, 2013 are consistent with those applied in
preparing the financial statements of December 31, 2012, with the exception of the items mentioned below in paragraphs 1.2.1 to
1.2.2.
1.2.1 IAS 19 Revised – Employee benefits applicable on January 1, 2013
Changes in accounting principles pursuant to the application of IAS 19 Revised are as follows for the Group:
• Under IAS 19 Revised, the net interest expense (income) on the net defined benefit liability is determined by applying the
discount rate, used to measure the defined benefit obligation, to the net defined benefit liability (asset). This net interest
expense (income) is presented as “financial expense” (“financial income”) in the income statement. Until December 31,
2012, two separate financial components regarding defined benefit plans were recognized in the Group’s income statement,
which are now compensated:
• an interest expense (“financial expense”), being the discount unwinding of the defined benefit obligation;
• an interest income (“financial income”), being the expected return on plan assets.
• Under the amended standard, plan administration costs, other than those relating to asset management, are recognized in
the profit and loss when the administration services are rendered. Before the revision of the IAS 19, administration costs
were provisioned and included in the actuarial assumptions used to measure the defined benefit obligation.
(1) Basis of presentation available on the website of the European Commission,
http://ec.europa.eu/internal_market/accounting/ias/index_fr.htm

9
• As from application of IAS 19 Revised, unvested past service cost shall be recognized immediately whereas previously it
was recognized over the vesting period.
These changes in accounting principles are retrospectively applied starting from January 1, 2012. However, given the low incidence,
the consolidated statement of financial position has not been restated. For the sake of comparison, financial income items were
reclassified in the income statement, but net income was not restated. Applying these new standards would have generated:
• a €2.3 million increase in provision of post-employment benefits, a €0.6 million increase in deferred tax assets and a €1.7
million decrease of equity in the statement of financial position at December 31, 2012. These restatements are mainly due
to the recognition of unvested past service cost.
• a €9.2 million decrease in net financial income with a tax effect of €3.8 million, that is a net decrease of € 5.4 million in the
December 31, 2012 income statement offset by an actuarial gain for the same amount in the statement of comprehensive
income.
The additional information required by IAS 19 Revised is provided in Note 16, "Post-employment benefit obligations and other long-
term benefits".
1.2.2 Mandatory other standards, amendments and interpretations applicable in 2013
• IFRS 13 - Fair value measurement: this new standard provides as the sole definition of fair value per the entire IFRS the
price that would be received when selling an asset or paid when transferring a liability during normal transactions between
market operators at the valuation date, and extends to financial and non-financial assets and liabilities appraised at fair
value in application of an existing standard, the reporting duty on the fair value level:
• Level 1: price listed for the same instrument on an active market;
• Level 2: directly or indirectly observable data for a similar instrument on an active market;
• Level 3: primarily non-observable data.
Application of these provisions is forthcoming beginning on January 1, 2013. They have no material impact on the Group's income
statement or statement of financial position. Additional Information required by IFRS 13 regarding the fair value of financial assets and
liabilities are specifically provided in Note 12, "Financial Instruments."
• Amendments to IAS 12 - Income Taxes - Deferred tax: Recovery of underlying assets. The Group is not concerned by
these amendments.
• Amendments to IFRS 7 - Disclosures - Offsetting Financial Assets and Financial Liabilities: Information, about rights to
offset and about related arrangements associated with financial assets and liabilities are disclosed in the Note 12 “Financial
Instruments”.
• Annual improvements - 2009-2011 Cycle: these amendments have no significant impact for the Group.
• IFRIC 20 - Stripping costs in the production phase of a surface mine: this interpretation has no bearing on the Group.
1.2.3 IFRS standards and amendments applicable after 2013 that the Group has elected not to early adopt
2014 applicable standards and amendments
• IFRS 10 - Consolidated financial statements;
• IFRS 11 - Joint Arrangements;
In adopting these new standards, the Group analyzed companies that had entered into governance agreements with outside investors
in order to evaluate Group's level of control on the joint ventures in question as well as the impact of eliminating proportionate
consolidation.
The impact of applying these two standards on the Group's key indicators based on figures at the end of December 2013 would be:
• Revenues: -321 million euros.
• Current operating income: -36 million euros.
• Net debt: -59 million euros.
• IFRS 12 - Disclosure of Interests in Other Entities;
• Amendments to IAS 28 - Investments in Associates and Joint Ventures;
10
• Amendments to IAS 36 - Recoverable Amount Disclosures for Non-Financial Assets;
• Amendments IAS 32 - Financial Instruments - Disclosures - Offsetting financial assets and financial liabilities;
• Amendements IAS 39 - Novation of Derivatives and Continuation of Hedge Accounting(2) ;
• IFRIC 21 - Legal Rights or Tax Bases (Levies)(2).
The impact resulting from the application of these standards and amendments is currently being assessed.
1.2.4 Reminder of IFRS 1 transition options
The Group used some of the options available under IFRS 1 for its transition to IFRS in 2005. The options that continue to have an
effect on the consolidated financial statements are:
• translation adjustments: the Group elected to reclassify cumulative translation adjustments within equity in the consolidated
reserves at January 1, 2004;
• business combinations: the Group elected not to restate business combinations that took place prior to January 1, 2004 in
accordance with IFRS 3.
1.3 Measurement basis for preparation of the consolidated financial statements
The Consolidated Financial Statements have been prepared using the historical cost convention, except for financial instruments that
are accounted for according to the financial instrument categories defined by IAS 39.
1.4 Use of judgment and estimates
The economic and financial crisis continues, while the Group maintains its risk management procedures of its financial instruments.
The significant market volatility caused by the crisis is taken into account by the Group in the estimates made such as for its business
plans and in the various discount rates used in impairment testing and computing provisions.
1.4.1 Estimates
The preparation of the Consolidated Financial Statements requires the use of estimates and assumptions to determine the value of
assets and liabilities, the disclosure of contingent assets and liabilities at the reporting date, as well as the revenues and expenses
reported during the period.
Due to uncertainties inherent in the estimation process, the Group regularly revises its estimates in light of currently available
information. Final outcomes could differ from those estimates.
The key estimates used by the Group in preparing the Consolidated Financial Statements relate mainly to:
• the measurement of the fair value of assets acquired and liabilities assumed in a business combination,
• the measurement of the recoverable amount of goodwill, property, plant and equipment and intangible assets (see Notes
1.5.4.1 and 1.5.7),
• the measurement of provisions, particularly for legal and arbitration proceedings and for pensions and other employee
benefits (see Note 1.5.15),
• capital renewal and replacement liabilities (see Note 1.5.6),
• financial instruments (see Note 1.5.10),
• unmetered revenues (see Note 1.5.16),
• margin at termination relating to construction contracts (see Note 1.5.13),
• the measurement of capitalized tax-loss carry-forwards.
(2)These standard, amendments and interpretation have not yet been endorsed by the European Union.

11
1.4.1.1 Measurement of the fair value of assets acquired and liabilities assumed in a business combination
The fair value of the assets acquired and liabilities assumed is based on estimates and assumptions regarding in particular the
expected market outlook and future cash flows as well as the discount rate to apply. The values used reflect management’s best
estimates.
1.4.1.2 Recoverable amount of goodwill, property, plant and equipment and intangible assets
The recoverable amount of goodwill, intangible assets and property, plant and equipment is based on estimates and assumptions
regarding in particular the expected market outlook and future cash flows associated with the assets and the discount rate to apply.
Any changes in these assumptions may have a material impact on the measurement of the recoverable amount and could result in
adjustments to the impairment losses already booked.
1.4.1.3 Estimates of provisions
Parameters with a significant influence on the amount of provisions include the timing of expenditure and the discount rate applied to
cash flows, as well as the actual level of expenditure. These parameters are based on information and estimates deemed to be
appropriate by the Group at the current time.
To the Group's best knowledge, there is no information suggesting that the parameters used taken as a whole are not appropriate.
Furthermore, the Group is not aware of any developments that are likely to have a material impact on the provisions booked.
1.4.1.4 Pensions and other employee benefit obligations
Pension obligations are measured on the basis of actuarial calculations. The Group considers that the assumptions used to measure
its obligations are appropriate and documented. However, any change in these assumptions may have a material impact on the
resulting calculations.
1.4.1.5 Capital renewal and replacement liabilities
This item includes concession operators' liabilities for renewing and replacing equipment and for restoring sites. The liabilities are
determined by estimating the cost of renewing or replacing equipment and restoring the sites under concession (as defined by IFRIC
12), discounted each year at rates linked to inflation. The related expense is calculated on a contract-by-contract basis with probable
capital renewal and site restoration costs allocated over the life of each contract.
1.4.1.6 Financial instruments
To determine the fair value of financial instruments that are not listed on an active market, the Group uses valuation techniques that
are based on certain assumptions. Any change in these assumptions could have a material impact on the resulting calculations.
1.4.1.7 Revenues
Revenues generated from customers whose consumption is metered during the accounting period are estimated at the reporting date
based on historical data, consumption statistics and estimated selling prices. The Group has developed measuring and modelling
tools that allow it to estimate revenues with a satisfactory degree of accuracy and subsequently ensure that risks of error associated
with estimating quantities sold and the resulting revenues can be considered as not material.
1.4.1.8 Margin at termination relating to construction contracts
The determination of total expected revenue and costs at termination involves significant estimates related to technical solutions,
duration of project and contractual issues.
Management reassesses those estimates for the preparation of consolidated financial statements on a quarterly basis or more
frequently if required by significant new developments in the course of the projects. Any significant change in expected revenue or
expected costs implies an immediate adjustment of the margin already recognized for the portion of the project already performed,
and impacts future margin for works still to be performed.
1.4.1.9 Measurement of capitalized tax loss carry-forwards
Deferred tax assets are recognized on tax loss carry-forwards when it is probable that future taxable profit will be available to the
Group against which the tax loss carry-forwards can be utilized. The likelihood of future taxable profits is estimated taking into account
the existence of temporary taxable differences from the same tax entity and is passed on to the same deadlines towards the tax
authority as well as the estimates of future taxable profits. Estimates of taxable profit and utilizations of tax loss carry-forwards were
prepared on the basis of profit and loss forecasts as included in the medium-term business plan and, if necessary, on the basis of
additional forecasts.

12
1.4.2 Judgment
As well as relying on estimates, the Group management also makes judgments to define the appropriate accounting treatment to
apply to certain activities and transactions, when the effective IFRS standards and interpretations do not specifically deal with the
related accounting issue.
This particularly applies in relation to the recognition of concession arrangements, the classification of agreements that contain a
lease, and the recognition of acquisitions of non-controlling interests prior to January 1, 2010.
In accordance with IAS 1, the Group's current and non-current assets and current and non-current liabilities are shown separately on
the consolidated statement of financial position. For most of the Group's activities, the breakdown into current and non-current items is
based on when assets are expected to be realized, or liabilities extinguished. Assets expected to be realized or liabilities extinguished
within 12 months of the reporting date are classified as current, while all other items are classified as non-current.
1.5 Accounting policies
1.5.1 Scope and methods of consolidation
The consolidation methods used by the Group include the full consolidation method, the proportionate consolidation method and the
equity method:
• Subsidiaries (over which the Group exercises exclusive control are fully consolidated);
• Companies over which the Group exercises joint control are consolidated by the proportionate method, based on the
Group's percentage of interest;
• The equity method is used for all associate companies over which the Group exercises significant influence. In accordance
with this method, the Group recognizes its proportionate share of the investee's net income or loss on a separate line of the
consolidated income statement under "Share in net income of associates." The accounting policies applied by these
companies comply with IFRS and are consistent with the accounting policies of the Group.
The Group analyses what type of control exists on a case-by-case basis, taking into account the situations illustrated in IAS 27, 28
and 31.
All intercompany balances and transactions are eliminated in the Consolidated Financial Statements.
A list of the main fully and proportionately consolidated companies, together with investments accounted for by the equity method, is
presented in Note 26 - List of the main consolidated companies at December 31, 2013 and 2012.
1.5.2 Foreign currency translation methods
1.5.2.1 Presentation currency of the consolidated financial statements
The Group's Consolidated Financial Statements are presented in euros (€).
1.5.2.2 Functional currency
Functional currency is the currency of the primary economic environment in which an entity operates. In most cases, the functional
currency corresponds to the local currency. However, certain entities may have a different functional currency from the local currency
when that other currency is used for an entity's main transactions and better reflects its economic environment.
1.5.2.3 Foreign currency transactions
Foreign currency transactions are recorded in the functional currency at the exchange rate prevailing at the date of the transaction. At
each reporting date:
• Monetary assets and liabilities denominated in foreign currencies are translated at year-end exchange rates. The related
translation gains and losses are recorded in the income statement for the year to which they relate;
• Non-monetary assets and liabilities denominated in foreign currencies are recognized at the historical cost applicable at the
date of the transaction.
13
1.5.2.4 Translation of the financial statements of consolidated companies with a functional currency other than the euro
The statement of financial position is translated into euros at year-end exchange rates. Income statement and statement of cash flow
items are translated using the average exchange rate for the year. Any differences arising from the translation of the financial
statements of consolidated companies are recorded under "Cumulative translation adjustment" as Other Comprehensive Income.
Goodwill and fair value adjustments arising from the acquisition of foreign entities are classified as assets and liabilities of those
foreign entities. Therefore, they are denominated in the functional currencies of the entities and translated at the year-end exchange
rate.
1.5.3 Business combinations
Business combinations accomplished before January 1, 2010 have been recognized in accordance with IFRS 3 prior to the revision
effective January 1, 2010. In accordance with IFRS 3 Revised, these business combinations have not been restated.
Since January 1, 2010, the Group applies the purchase method as defined in IFRS 3 Revised, which consists of recognizing at the
acquisition date the identifiable assets acquired and liabilities assumed at their fair values, including any non-controlling interests in
the acquired company. Non-controlling interests are measured either at fair value or at proportionate interest in the net identifiable
assets. The Group determines on a case-by-case basis which measurement option is to be used to recognize non controlling
interests.
1.5.4 Intangible assets
Intangible assets are recognized at cost less any accumulated amortization and any accumulated impairment losses.
1.5.4.1 Goodwill
A. Recognition of goodwill
The application of IFRS 3 Revised on January 1, 2010 requires the Group to identify business combinations carried out before or after
that date.
Business combinations carried out before January 1, 2010
Goodwill represents the excess of the cost of a business combination (acquisition price of shares plus any costs directly attributable to
the business combination) and the Group's interest in the fair value of the identifiable assets, liabilities and contingent liabilities
recognized at the acquisition date (except if the business combination is achieved in stages).
For a business combination achieved in stages - i.e. where the Group acquires a subsidiary through successive share purchases - the
amount of goodwill is determined separately for each exchange transaction based on the fair values of the acquiree's identifiable
assets, liabilities and contingent liabilities at the date of each exchange transaction.
Business combinations carried out after January 1, 2010
Goodwill is measured as being the amount by which the total of
i. the consideration transferred,
ii. the amount of any non-controlling interest in the acquired company, and
iii. in a business combination achieved in stages, the fair value at acquisition-date of the previously held interests in the
acquired company;
exceeds the net balance of identifiable assets acquired and liabilities assumed.
The amount of goodwill recognized at the acquisition date cannot be adjusted after the end of the measurement period.
Goodwill relating to associates is recorded under "Investments in associates."
14
B. Measurement of goodwill
Goodwill is not amortized but is tested for impairment each year, or more frequently when an indication of impairment is identified.
Impairment tests are carried out at the level of cash-generating units (CGUs), which constitute groups of assets generating cash
inflows that are largely independent of the cash inflows from other cash-generating units.
The methods used to carry out these impairment tests are described in Note 1.5.7 "Impairment of property, plant and equipment and
intangible assets."
Impairment losses in relation to goodwill cannot be reversed and are shown under "Impairment" in the income statement.
Impairment losses on goodwill relating to associates are reported under "Share in net income of associates."
1.5.4.2 Other intangible assets
A. Development costs
Research costs are expensed as incurred.
Development costs are capitalized when the asset recognition criteria set out in IAS 38 are met. Capitalized development costs are
amortized over the useful life of the intangible asset recognized. In view of the Group's activities, capitalized development costs are
not material.
B. Other internally generated or acquired intangible assets
Other intangible assets include mainly:
• amounts paid or payable as consideration for rights relating to concession arrangements or public service contracts,
• customer portfolios acquired on business combinations,
• surface and underground water drawing rights, which are not amortized as they are granted indefinitely,
• concession assets,
• exclusive rights to distribute drinking water in a defined geographic area in perpetuity.
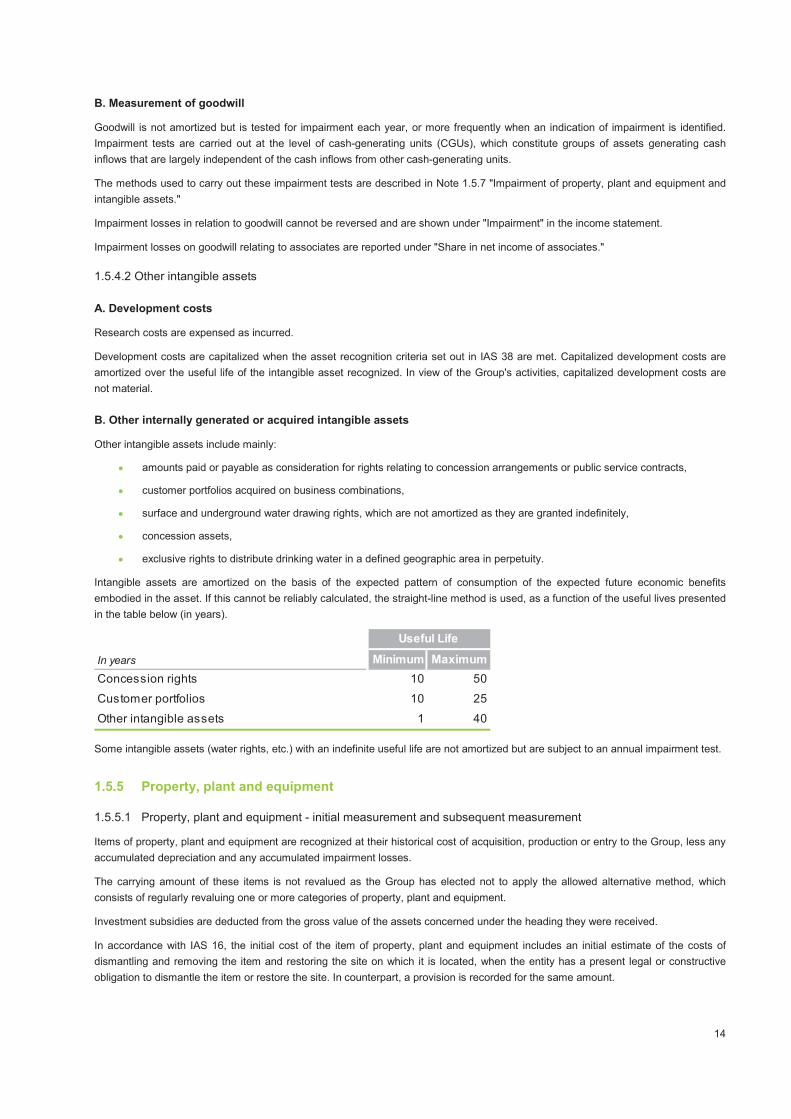
Intangible assets are amortized on the basis of the expected pattern of consumption of the expected future economic benefits
embodied in the asset. If this cannot be reliably calculated, the straight-line method is used, as a function of the useful lives presented
in the table below (in years).
Some intangible assets (water rights, etc.) with an indefinite useful life are not amortized but are subject to an annual impairment test.
1.5.5 Property, plant and equipment
1.5.5.1 Property, plant and equipment - initial measurement and subsequent measurement
Items of property, plant and equipment are recognized at their historical cost of acquisition, production or entry to the Group, less any
accumulated depreciation and any accumulated impairment losses.
The carrying amount of these items is not revalued as the Group has elected not to apply the allowed alternative method, which
consists of regularly revaluing one or more categories of property, plant and equipment.
Investment subsidies are deducted from the gross value of the assets concerned under the heading they were received.
In accordance with IAS 16, the initial cost of the item of property, plant and equipment includes an initial estimate of the costs of
dismantling and removing the item and restoring the site on which it is located, when the entity has a present legal or constructive
obligation to dismantle the item or restore the site. In counterpart, a provision is recorded for the same amount.
In years Minimum Maximum
Concession rights 10 50
Customer portfolios 10 25
Other intangible assets 1 40
Useful Life
15
Property, plant and equipment acquired under finance leases are carried in the consolidated statement of financial position at the
lower of the market value and the present value of the related minimum lease payments. The corresponding liability is recognized
under financial debt. These assets are also depreciated using the methods and useful lives set out below.
The Group applies IAS 23 Revised, which consists in capitalizing borrowing costs that are directly attributable to the acquisition,
construction or production of a qualifying asset as part of the cost of that asset.
1.5.5.2 Depreciation
In accordance with the components approach, the Group uses different depreciation terms for each significant component of a sole
tangible asset when one of these significant components has a different useful life from that of the main tangible asset to which it
relates.
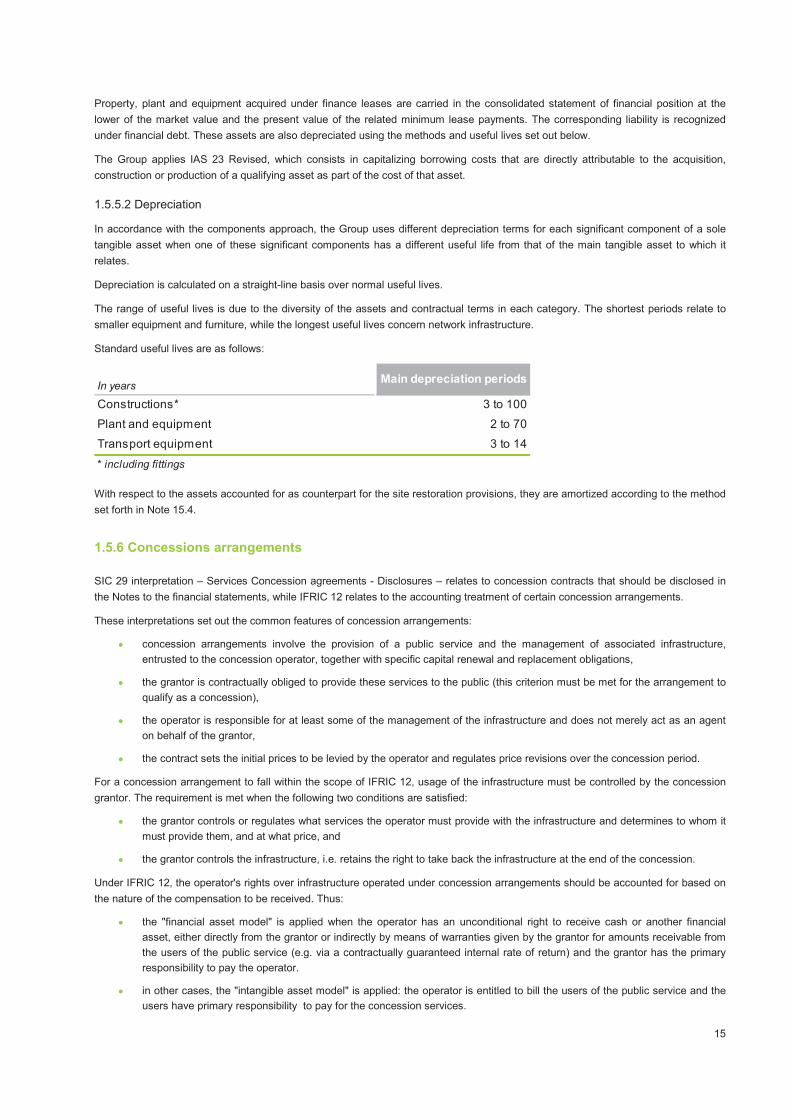
Depreciation is calculated on a straight-line basis over normal useful lives.
The range of useful lives is due to the diversity of the assets and contractual terms in each category. The shortest periods relate to
smaller equipment and furniture, while the longest useful lives concern network infrastructure.
Standard useful lives are as follows:
With respect to the assets accounted for as counterpart for the site restoration provisions, they are amortized according to the method
set forth in Note 15.4.
1.5.6 Concessions arrangements
SIC 29 interpretation – Services Concession agreements - Disclosures – relates to concession contracts that should be disclosed in
the Notes to the financial statements, while IFRIC 12 relates to the accounting treatment of certain concession arrangements.
These interpretations set out the common features of concession arrangements:
• concession arrangements involve the provision of a public service and the management of associated infrastructure,
entrusted to the concession operator, together with specific capital renewal and replacement obligations,
• the grantor is contractually obliged to provide these services to the public (this criterion must be met for the arrangement to
qualify as a concession),
• the operator is responsible for at least some of the management of the infrastructure and does not merely act as an agent
on behalf of the grantor,
• the contract sets the initial prices to be levied by the operator and regulates price revisions over the concession period.
For a concession arrangement to fall within the scope of IFRIC 12, usage of the infrastructure must be controlled by the concession
grantor. The requirement is met when the following two conditions are satisfied:
• the grantor controls or regulates what services the operator must provide with the infrastructure and determines to whom it
must provide them, and at what price, and
• the grantor controls the infrastructure, i.e. retains the right to take back the infrastructure at the end of the concession.
Under IFRIC 12, the operator's rights over infrastructure operated under concession arrangements should be accounted for based on
the nature of the compensation to be received. Thus:
• the "financial asset model" is applied when the operator has an unconditional right to receive cash or another financial
asset, either directly from the grantor or indirectly by means of warranties given by the grantor for amounts receivable from
the users of the public service (e.g. via a contractually guaranteed internal rate of return) and the grantor has the primary
responsibility to pay the operator.
• in other cases, the "intangible asset model" is applied: the operator is entitled to bill the users of the public service and the
users have primary responsibility to pay for the concession services.
In yearsMain depreciation periods
Constructions* 3 to 100
Plant and equipment 2 to 70
Transport equipment 3 to 14
* including fittings
16
In cases where the users actually pay the Group, but the local authority guarantees the amounts that will be paid for the duration of
the contract (e.g., via a guaranteed internal rate of return), the financial asset model should be used to account for the concession
infrastructure, since the local authority is, in substance, primarily responsible for payment. In practice, the financial asset model is
used to account for BOT (Build, Operate and Transfer) contracts entered into with local authorities for public services such as
wastewater treatment and household waste incineration).
However, where the local authority pays the Group but merely acts as an intermediary fee collector and does not guarantee the
amounts receivable ("pass through arrangement"), the intangible asset model should be used to account for the concession since the
users are, in substance, primarily responsible for payment.
"Primary responsibility" means that while the identity of the payer of the services is not an essential criterion, the person ultimately
responsible for payment should be identified.
Pursuant to these principles:
• Property, plant and equipment received at no cost from the grantor as infrastructure, access to which the operator is
granted for the purposes of the service agreement, may not be transferred and, as these will be returned to the grantor at
no cost at the end of the contract, they are not recorded in the statement of financial position. In particular, infrastructure
entrusted during the term of the contract by the grantor to the operator for servicing and maintenance is not recognized in
the statement of financial position,
• Infrastructure undertaken by the operator is recognized as follows:
• under the intangible asset model, the fair value of construction and other work on the infrastructure represents the
acquisition cost of the intangible asset and should be recognized when the infrastructure is built provided that this work
is expected to generate future economic benefits (e.g., the case of work carried out to extend the network). Where no
such economic benefits are expected, the present value of commitments in respect of construction and other work on
the infrastructure is recognized from the outset, with a corresponding adjustment to concession liabilities,
• under the financial asset model, the amount receivable from the grantor is recognized at the time the infrastructure is
built, at the fair value of the construction and other work carried out,
• when the grantor has a payment obligation for only part of the investment, the cost is recognized in financial assets for
the amount guaranteed by the grantor, with the balance included in intangible assets ("mixed model").
Renewal costs consist of obligations under concession arrangements with potentially different terms and conditions (obligation to
restore the site, renewal plan, tracking account, etc.).
Renewal costs are recognized as either (i) intangible or financial assets depending on the applicable model, when the costs are
expected to generate future economic benefits (i.e. they bring about an improvement); or (ii) expenses, where no such benefits are
expected to be generated (i.e. the infrastructure is restored to its original condition).
Costs incurred to restore the asset to its original condition are recognized as a renewal asset or liability when there is a timing
difference between the contractual obligation calculated on a time proportion basis, and its realization.
The costs are calculated on a case-by-case basis based on the obligations associated with each arrangement.
1.5.7 Impairment of property, plant and equipment and intangible assets
In accordance with IAS 36, impairment tests are carried out on intangible assets and on property, plant and equipment whenever
there is an indication that the assets may be impaired. Such indications may be based on events or changes in the market
environment, or on internal sources of information. Intangible assets that are not amortized are tested for impairment annually.
Impairment indicators
This impairment test is only carried out for property, plant and equipment and intangible assets for the defined useful lives when they
are indications of an alteration in their value. In general, this arises as a result of significant changes in the operational environment of
the assets or from a poorer than expected economic performance.
The main indications of impairment used by the Group are:
• External sources of information
• Significant changes in the economic, technological, political or market environment in which the entity operates or to
which the asset is dedicated;
• Fall in demand,
17
• Internal sources of information
• Evidence of obsolescence or physical damage not budgeted for in the depreciation/amortization schedule;
• Worse-than-expected performance.
Impairment
Items of property, plant and equipment or intangible assets are tested for impairment at the level of the individual asset or cash-
generating unit as appropriate, determined in accordance with IAS 36. If the recoverable amount of an asset is lower than its carrying
amount, the carrying amount is reduced to the recoverable amount by recording an impairment loss. Upon recognition of an
impairment loss, the depreciable amount - and possibly the useful life - of the asset concerned is revised.
Impairment losses recorded in relation to property, plant and equipment or intangible assets may be subsequently reversed if the
recoverable amount of the assets is once again higher than their carrying value. The increased carrying amount of an item of property,
plant or equipment attributable to a reversal of an impairment loss may not exceed the carrying amount that would have been
determined (net of depreciation/amortization) had no impairment loss been recognized in prior periods.
Measurement of recoverable amount
In order to review the recoverable amount of property, plant and equipment and intangible assets, the assets are, where appropriate,
grouped into cash-generating units (CGUs), and the carrying amount of each unit is compared with its recoverable amount.
For operating entities which the Group intends to hold on a long-term and going concern basis, the recoverable amount of a CGU
corresponds to the higher of its fair value less costs to sell and its value in use. Value in use is primarily determined based on the
present value of future operating cash flows and a terminal value. Standard valuation techniques are used based on the following
main economic data:
• discount rates based on the specific characteristics of the operating entities concerned,
• terminal values in line with the available market data specific to the operating segments concerned and growth rates
associated with these terminal values, not to exceed inflation.
Discount rates are determined on a post-tax basis and applied to post-tax cash flows. The recoverable amounts calculated on the
basis of these discount rates are the same as the amounts obtained by applying the pre-tax discount rates to cash flows estimated on
a pre-tax basis, as required by IAS 36.
For operating entities which the Group has decided to sell, the related carrying amount of the assets concerned is written down to the
estimated market value less costs of disposal. When negotiations are ongoing, this is determined based on the best estimate of their
outcome as of the reporting date.
In the event of a decline in value, the impairment loss is recorded in the consolidated income statement under "Impairment".
1.5.8 Leases
The Group holds assets for its various activities under lease contracts.
These leases are analyzed based on the situations and indicators set out in IAS 17 in order to determine whether they constitute
operating leases or finance leases.
A finance lease is defined as a lease which transfers substantially all the risks and rewards incidental to the ownership of the related
asset to the lessee. All leases which do not comply with the definition of a finance lease are classified as operating leases.
The following main factors are considered by the Group to assess whether or not a lease transfers substantially all the risks and
rewards incidental to ownership: whether (i) the lease transfers ownership of the asset to the lessee by the end of the lease term; (ii)
the lessee has an option to purchase the asset and if so, the conditions applicable to exercising that option; (iii) the lease term covers
the major part of the estimated economic life of the asset; and (iv) the asset is of a highly specialized nature. A comparison is also
made between the present value of the minimum lease payments and the fair value of the asset concerned.
1.5.8.1 Accounting for finance leases
On initial recognition, assets held under finance leases are recorded as property, plant and equipment and the related liability is
recognized under borrowings. At inception of the lease, finance leases are recorded at amounts equal to the fair value of the leased
asset or, if lower, the present value of the minimum lease payments.
18
1.5.8.2 Accounting for operating leases
Payments made under operating leases are recognized as an expense in the consolidated income statement on a straight-line basis
over the lease term.
1.5.8.3 Accounting for arrangements that contain a lease
IFRIC 4 deals with the identification of services and take-or-pay sales or purchase contracts that do not take the legal form of a lease
but convey rights to customers/suppliers to use an asset or a group of assets in return for a payment or a series of fixed payments.
Contracts meeting these criteria should be identified as either operating leases or finance leases. In the latter case, a financial
receivable should be recognized to reflect the financing deemed to be granted by the Group where it is considered as acting as lessor
and its customers as lessees.
This interpretation applies to some contracts with industrial or public customers relating to assets financed by the Group.
1.5.9 Inventories
Inventories are measured at the lower of cost and net realizable value. Net realizable value corresponds to the estimated selling price
in the ordinary course of business, less the estimated costs of completion and the estimated costs necessary to make the sale.
The cost of inventories is determined based on the first-in, first-out method or the weighted average cost formula.
1.5.10 Financial instruments
Financial instruments are recognized and measured in accordance with IAS 32 and IAS 39.
1.5.10.1 Financial assets
Financial assets comprise available-for-sale securities, loans and receivables carried at amortized cost including trade and other
receivables, and financial assets measured at fair value through income including derivative financial instruments. Financial assets
are broken down into current and non-current assets in the statement of financial position.
A. Available-for-sale securities
Available-for-sale securities include the Group's investments in non-consolidated companies and equity or debt instruments that do
not satisfy the criteria for classification in another category (see below). These items are measured by using a weighted average cost
formula.
On initial recognition, they are measured at fair value which generally corresponds to the acquisition cost plus transaction costs.
At each reporting date, available-for-sale securities are measured at fair value. For listed companies, fair value is determined based
on the quoted market price at the closing date. Unlisted securities are measured using valuation models based primarily on the most
recent market transactions, discounted dividends or cash flow and net asset value.
Changes in fair value are recognized directly in "Other Comprehensive Income", except when the decline in the value of the
investment below its historical acquisition cost is judged significant or prolonged enough to require an impairment if needed. In this
case, loss is recognized in income under "Impairment." Only impairment losses recognized on debt instruments (debt
securities/bonds) may be reversed through income (refer to note 12.1.1.2).
B. Loans and receivables carried at amortized cost
This item primarily includes loans and advances to associates or non-consolidated companies, and guarantee deposits as well as
trade and other receivables.
On initial recognition, these loans and receivables are recorded at fair value plus transaction costs. At each reporting date, they are
measured at amortized cost using the effective interest rate method.
On initial recognition, trade and other receivables are recorded at fair value, which generally corresponds to their nominal value.
Impairment losses are recorded based on the estimated risk of non-recovery. The amounts owed by customers under construction
contracts are included in this item.

19
C. Financial assets measured at fair value through income
These financial assets meet the qualification or designation criteria set out in IAS 39.
This item mainly includes trading securities and short-term investments which do not meet the criteria for classification as cash or
cash equivalents (see Note 1.5.11). The financial assets are measured at fair value at the reporting date and changes in fair value are
recorded in the consolidated income statement.
1.5.10.2 Financial liabilities
Financial liabilities include borrowings, trade and other payables, derivative financial instruments, and other financial liabilities.
Financial liabilities are broken down into current and non-current liabilities in the statement of financial position. Current financial
liabilities primarily comprise:
• financial liabilities with a settlement or maturity date within 12 months of the reporting date,
• financial liabilities for which the Group does not have an unconditional right to defer settlement for at least 12 months after
the reporting date,
• financial liabilities held primarily for trading purposes,
• derivative financial instruments qualifying as fair value hedges where the underlying is classified as a current item,
• all derivative financial instruments not qualifying as hedges.
A. Measurement of borrowings and other financial liabilities
Borrowings and other financial liabilities are measured at amortized cost using the effective interest rate method.
On initial recognition, any issue premiums/discounts, redemption premiums/discounts and issuing costs are added to/deducted from
the nominal value of the borrowings concerned. These items are taken into account when calculating the effective interest rate and
are therefore recorded in the consolidated income statement over the life of the borrowings using the amortized cost method.
As regards structured debt instruments that do not have an equity component, the Group may be required to separate an "embedded"
derivative instrument from its host contract. The conditions under which these instruments must be separated are detailed below.
When an embedded derivative is separated from its host contract, the initial carrying amount of the structured instrument is broken
down into an embedded derivative component, corresponding to the fair value of the embedded derivative, and a financial liability
component, corresponding to the difference between the amount of the issue and the fair value of the embedded derivative. The
separation of components upon initial recognition does not give rise to any gains or losses. Subsequently, the debt is recorded at
amortized cost using the effective interest method, while the derivative is measured at fair value, with changes in fair value taken to
income.
B. Call options on non-controlling interests granted before January 1, 2010
Other financial liabilities primarily include put options on non-controlling interests granted by the Group. As no specific guidance is
provided by IFRS and in view of the AMF (French Financial Market Authority) recommendations for year-end 2009, the Group has
adopted the following accounting treatment for these commitments:
• when the put option is initially granted, the present value of the exercise price is recognized as a financial liability, with a
corresponding reduction in non-controlling interests. When the value of the put option is greater than the carrying amount of
the non-controlling interests, the difference is recognized as goodwill,
• at each reporting date, the amount of the financial liability is revised and any changes in the amount are recorded with a
corresponding adjustment to goodwill,
• payments of dividends to non-controlling interests result in an increase in goodwill,
• in the income statement, non-controlling interests are allocated their share in income. In the statement of financial position,
the share in income allocated to non-controlling interests reduces the carrying amount of goodwill. No finance costs are
recognized in respect of changes in the fair value of liabilities recognized against goodwill.
1.5.10.3 Derivatives and hedge accounting
The Group uses financial instruments to manage and reduce its exposure to market risks arising from fluctuations in interest rates,
foreign currency exchange rates and commodity prices. Use of derivative instruments is governed by a Group policy for managing
interest rate, currency and commodity risks.
20
Definition and scope of derivative financial instruments
Derivative financial instruments are contracts whose value changes in response to the change in one or more observable variables
that do not require any material initial net investment and that are settled at a future date.
Derivative instruments therefore include swaps, options and futures, as well as forward commitments to purchase or sell listed and
unlisted securities.
Embedded derivatives
An embedded derivative is a component of an agreement known as a host contract, which meets the definition of a derivative
instrument and whose economic characteristics are not closely related to those of its host contract.
At Group level, the main contracts likely to contain embedded derivatives are those containing clauses or options that can affect the
price, volume or maturity of the contract. In particular, these are contracts to buy or sell non-financial assets whose price may be
adjusted in accordance with fluctuations of an index, a pricing provision, foreign currency prices, or the price of an asset other than the
asset underlying the contract.
Embedded derivatives are separately recognized in the following cases:
• if the host contract is not a financial instrument already recognized at fair value with any fair value adjustment shown in
income;
• if when separated from the host contract, the component still meets the definition of a derivative product (existence of an
underlying instrument, absence of initial and future settlement);
• if the characteristics of the identified derivative are not closely related to those of the host contract. The determination of
"closely related" is carried out on the date that the contract is signed.
When an embedded derivative is separated from its host contract, it is recognized at fair value in the statement of financial position
and variations in fair value are recognized in income (if the embedded derivative is not documented in a hedge relationship).
Derivative hedging instruments: recognition and presentation
Derivative instruments qualifying as hedging instruments are recognized in the statement of financial position and measured at fair
value. However, their accounting treatment varies according to whether they are classified as:
• a fair value hedge of an asset or liability,
• a cash flow hedge,
• a hedge of a net investment in a foreign operation.
Fair value hedges
A fair value hedge is defined as a hedge of the exposure to changes in fair value of a recognized asset or liability, such as a fixed-rate
loan or borrowing, or of assets, liabilities or an unrecognized firm commitment denominated in a foreign currency.
The gain or loss from re-measuring the hedging instrument at fair value is recognized in income. The gain or loss on the hedged item
attributable to the hedged risk adjusts the carrying amount of the hedged item and is also recognized in income even if the hedged
item is in a category in respect of which changes in fair value are recognized through "Other Comprehensive Income", or if it is
normally recognized at amortized cost in the absence of hedging. These two adjustments are presented net in the income statement,
with the net effect corresponding to the ineffective portion of the hedge.
Cash flow hedges
A cash flow hedge is a hedge of the exposure to variability in cash flows that could affect the Group's consolidated income. The
hedged cash flows may be attributable to a particular risk associated with a recognized financial or non-financial asset or a highly
probable forecast transaction.
The portion of the gain or loss on the hedging instrument that is determined to be an effective hedge is recognized in Other
Comprehensive Income, net of tax, while the ineffective portion is recognized in income. The gains or losses accumulated in
shareholders' equity are reclassified to the income statement, under the same caption as the loss or gain on the hedged item - i.e.
current operating income for operating cash flows and financial income/expense for other cash flows - in the same periods in which
the hedged cash flows affect income.
21
If the hedging relationship is discontinued, in particular because the hedge is no longer considered effective, the cumulative gain or
loss on the hedging instrument remains separately recognized in shareholders' equity until the forecast transaction occurs. However, if
a forecast transaction is no longer highly probable, the cumulative gain or loss on the hedging instrument is recognized in income.
Hedge of a net investment in a foreign operation
In the same way as for a cash flow hedge, the portion of the gain or loss on the hedging instrument that is determined to be an
effective hedge of the currency risk is recognized directly in Other Comprehensive Income, net of tax, while the ineffective portion is
recognized in income. The gains or losses accumulated in Other Comprehensive Income are transferred to the consolidated income
statement when the investment is sold or liquidated.
Identification and documentation of hedging relationships
The hedging instruments and hedged items are designated at the inception of the hedging relationship. The hedging relationship is
formally documented in each case, specifying the hedging strategy, the hedged risk and the method used to assess hedge
effectiveness. Only derivative contracts entered into with external counterparts are considered eligible for hedge accounting.
Hedge effectiveness is assessed and documented at the inception of the hedging relationship and on an ongoing basis throughout the
periods for which the hedge was designated. Hedges are considered to be effective when changes in fair value or cash flows between
the hedging instrument and the hedged item are offset within a range of 80%-125%.
Hedge effectiveness is demonstrated both prospectively and retrospectively using various methods, based mainly on a comparison
between changes in the fair value or cash flows between the hedging instrument and the hedged item. Methods based on an analysis
of statistical correlations between historical price data are also used by the Group.
Derivative instruments not qualifying for hedge accounting: recognition and presentation
These items mainly concern derivative financial instruments used in economic hedges that have not been - or are no longer -
documented as hedging relationships for accounting purposes.
When a derivative financial instrument does not qualify or no longer qualifies for hedge accounting, changes in fair value are
recognized directly in income, under "Mark-to-Market on commodity contracts other than trading instruments", in current operating
income for derivative instruments with non-financial assets as the underlying, and in financial income or expenses for currency,
interest rate and equity derivatives.
Derivative expiring in less than 12 months are recognized in the consolidated statement of financial position in current assets and
liabilities, while derivatives expiring after this period are classified as non-current items.
Measurement of fair value
The fair value of listed instruments on an active market is determined based on the market price. In this case, these instruments are
presented at Level 1 of the fair value measurement.
The fair value of non-listed financial instruments for which there is observable market data is determined by using valuation
techniques such as the valuation models applied for options, or by using the discounted cash flows method. The counterparty risk is
taken into account when valuing derivative contracts.
The models used to value these instruments include assumptions based on market data in accordance with IFRS 13:
• the fair value of interest rate swaps is calculated based on discounted future cash flows;
• the fair value of forward exchange contracts and currency swaps is calculated based on current prices for contracts with
similar maturity profiles by discounting the differential of future cash flows (the difference between the forward price of the
contract and the recalculated forward price based on new market conditions applied to the nominal amount);
• the fair value of currency or interest rate options is determined using valuation techniques for options;
22
• commodity derivatives are valued as a function of market quotes based on discounted future cash flows (firm contracts:
commodity swaps or commodity forwards), and option valuation models (optional contracts) for which it may be necessary
to observe market price volatility. For contracts with maturity exceeding the depth of transactions for which prices are
observable, or that are particularly complex, valuations may be based on internal assumptions;
• for complex contracts entered into with independent financial institutions, the Group uses valuations carried out by
counterparties, on an exceptional basis.
These instruments are presented in Level 2 of the fair value measurement hierarchy, unless their valuation depends significantly on
non-observable parameters. In this case, they are presented at Level 3 of the fair value measurement hierarchy. These largely involve
derivative financial instruments with maturities exceeding the observable horizon for the forward prices of the underlying asset, or for
which certain parameters, such as underlying volatility, are not observable.
1.5.11 Cash and cash equivalents
These items include cash equivalents as well as short-term investments that are considered to be readily convertible into a known
amount of cash and where the risk of a change in their value is deemed to be negligible based on the criteria set out in IAS 7.
Bank overdrafts are not included in the calculation of cash and cash equivalents and are recorded under "Short-term borrowings".
1.5.12 Treasury shares
Treasury shares are recognized at cost and deducted from equity. Gains and losses on disposal of treasury shares are directly
recorded in equity and do not therefore impact income for the period.
1.5.13 Construction contracts
The engineering operations carried out by Degrémont and OIS fall within the scope of IAS 11 - Construction Contracts.
In accordance with IAS 11, the Group applies the percentage of completion method as described in Section 1.5.16 ("Revenues") to
determine the contract revenue and costs to be recorded in the consolidated income statement for each period.
When it is probable that total contract costs will exceed total contract revenue, the expected loss at termination is recognized as an
expense immediately.
Partial payments received under construction contracts before the corresponding work has been carried out are recorded on the
liabilities side of the statement of financial position as advances received from customers. The costs incurred plus any recognized
profit less any recognized losses and progress billings are then determined. If this amount is positive, it is recognized as an asset
under "Amount due from customers under construction contracts" within "Trade and other receivables." If the amount is negative, it is
recognized as a liability under "Amount due to customers under construction contracts" within "Trade and other payables”.
1.5.14 Share-based payments
Under IFRS 2, the Group is required to recognize an expense (personnel costs) corresponding to benefits granted to employees in the
form of share-based payments, in consideration for services provided. These services are valued at the fair value of the instruments
awarded.
This payment may take the form of instruments paid in shares or in cash.
EQUITY-SETTLED INSTRUMENTS
1.5.14.1 Stock option plans
Options granted to Group employees are measured at the grant date using a binomial pricing model for options with no performance
conditions, or a Monte Carlo pricing model for those with external performance conditions. These models take into account the
characteristics of the plan concerned (exercise price, exercise period, performance conditions if any), market data at the time of grant
(risk-free rate, share price, volatility, expected dividends), and a behavioral assumption in relation to beneficiaries. The value
determined is recorded in personnel costs over the vesting period and offset against equity.
23
1.5.14.2 Allotment of bonus shares
The fair value of bonus share plans is estimated based on the share price on the allotment date, taking into account the absence of
dividend payments over the vesting period, the turnover rate for the relevant staff in each plan and the likelihood of the Group's
performance. The estimation of the fair value of the plans also takes into account the non-transferability period associated with these
instruments. The cost is expensed over the vesting period of the rights and offset against equity. For performance shares that are
allotted on a discretionary basis and include external performance conditions, a Monte Carlo model is used.
1.5.14.3 Employee share purchase plans
Employee share purchase plans enable employees to subscribe to company shares at a lower-than-market price. The fair value of the
instruments awarded under employee share purchase plans is estimated on the allotment date based on the value of this discount
awarded to employees and non-transferability period applicable to the share subscribed. As it is treated as a service rendered, the
cost is recognized in full and offset against equity.
CASH-SETTLED INSTRUMENTS
In specific cases where local legislation prohibits employee share purchase plans, share appreciation rights (SAR) are granted
instead. When these instruments are settled in cash, their fair value is recognized in expenses over the vesting period, with an
offsetting entry recorded in employee-related liabilities. Changes in the fair value of the liability are taken to income for each fiscal
year.
1.5.15 Provisions
1.5.15.1 Provisions for post-employment benefit obligations and other long-term benefits
Depending on the laws and practices in force in the countries where SUEZ ENVIRONNEMENT COMPANY operates, Group
companies have obligations in terms of pensions, early retirement payments, retirement bonuses and other benefit plans. Such
obligations generally apply to all of the employees within the companies concerned.
The Group's obligations in relation to pensions and other employee benefits are recognized and measured in accordance with IAS 19
Revised (see Note 1.2.1). Accordingly:
• The cost of defined contribution plans is expensed based on the amount of contributions payable in the period;
• The Group's obligations concerning pensions and other employee benefits payable under defined benefit plans are
assessed on an actuarial basis. These calculations are based on assumptions relating to mortality, staff turnover and
estimated future salary increases, as well as the economic conditions specific to each country or subsidiary of the Group.
Discount rates are determined by reference to the yield, at the measurement date, on high-quality corporate bonds in the
related geographical area (or on government bonds in countries where no representative market for such corporate bonds
exists).
Provisions are recorded when commitments under these plans less the unrecognized past service cost exceed the fair value of plan
assets. When the value of plan assets (capped where appropriate) is greater than the related commitments, the surplus is recorded as
an asset under "Other current assets" or "Other non-current assets."
As regards post-employment benefit obligations, the Group recognizes actuarial gains and losses resulting from changes in actuarial
assumptions and experience adjustments directly to Other Comprehensive Income (equity) items.Where appropriate, adjustments
resulting from applying the asset ceiling to net assets relating to overfunded plans are treated in a similar way.
However, actuarial gains and losses on other long-term benefits such as long-service awards, continue to be recognized immediately
in income.
The net interest expense (income) in respect of pensions is presented as a "financial result".
1.5.15.2 Other provisions
The Group records a provision where it has a present obligation (legal or constructive), the settlement of which is expected to result in
an outflow of resources embodying economic benefits with no corresponding consideration in return.
A provision for restructuring costs is recorded when the general criteria for setting up a provision are met, i.e., when the Group has a
detailed formal plan relating to the restructuring and has raised a valid expectation in those affected that it will carry out the
restructuring by starting to implement that plan or announcing its main features to those affected by it.
24
Provisions with a maturity of over 12 months are discounted when the effect of discounting is material. The Group’s main long-term
provisions, excluding the provisions for post-employment benefit obligations, are provisions for site restoration costs (relating to the
waste services business). The discount rate (or rates) used reflect current market measurements of the time value of money and the
risks specific to the liability concerned. Expenses corresponding to the reversal of discounting adjustments to long term provisions are
recorded under other financial income and expenses.
A provision is recognized when the Group has a present legal or constructive obligation to restore a site. The counterpart for this
provision is included in the carrying amount of the asset concerned. Adjustments to the provision due to subsequent changes in the
expected outflow of resources, the site restoration date or the discount rate are deducted from or added to the cost of the
corresponding asset in a symmetrical manner. The impacts of unwinding the discount are recognized in expenses for the fiscal year.
1.5.16 Revenues
Group revenues (as defined by IAS 18) are mainly generated from the following:
• Water services
• Waste services
• Engineering and construction contracts and other services
Revenues on sales of goods are recognized on delivery (i.e., when the significant risks and rewards of ownership are transferred to
the buyer), or as a function of the progress of the contract, in the case of provisions of services and construction contracts, when the
price is fixed or determinable and receivables are likely to be recoverable.
Revenues are measured at the fair value of the consideration received or receivable. Where deferred payment has a material impact
on the measurement of the fair value of this consideration, this is taken into account by discounting future receipts.
1.5.16.1 Water services
Revenues generated by water distribution are recognized based on volumes delivered to customers, either specifically metered and
invoiced or estimated based on the output of the supply networks.
The price for wastewater services and wastewater treatment is either included in the water distribution invoice, or is sent in a separate
invoice to the local municipality or industrial client.
Commission fees received from the grantors of concessions are recorded as revenues.
1.5.16.2 Waste services
Revenues arising from waste collection are generally based on the tonnage collected and the service provided by the operator.
Revenues from other forms of treatment (principally sorting and incineration) are recognized based on volumes processed by the
operator and the incidental revenues generated by recycling and reuse, such as the sale of paper, cardboard, glass, metals and
plastics for sorting centers, and the sale of electricity and heat for incinerators.
1.5.16.3 Engineering, construction contracts and services rendered
Revenues from construction contracts are determined using the percentage of completion method and more generally according to
the provisions of IAS 11 (see Section 1.5.13). Depending on the contract concerned, the stage of completion may be determined
either based on the proportion that costs incurred to date bear to the estimated total costs of the contract, or on the physical progress
of the contract based on factors such as contractually defined stages.
Revenues also include revenues from financial concession assets (IFRIC 12) and lease receivables (IFRIC 4).
1.5.17 Current operating income (COI)
Current operating income is an indicator used by the Group to present "a level of operational performance that can be used as part of
an approach to forecast recurring performance" (in accordance with CNC Recommendation 2009-R03 in the financial statements of
companies applying IFRS). Current operating income is a sub-total which helps management to better understand the Group's
performance because it excludes elements which are inherently difficult to predict due to their unusual, irregular or non-recurring
nature. For the Group, these elements relate to the marked-to-market (MtM) value of trading instruments, asset impairments,
restructuring costs, scope effects, other gains and losses on disposals, and non-recurring items. They are defined as follows:
• MtM of trading instruments: This corresponds to changes in the fair value (marked-to-market) of financial instruments
25
relating to commodities and gas which do not qualify as either trading or hedging instruments. These contracts are used in
economic hedges of operating transactions,
• Impairment of assets: this includes impairment losses on goodwill, intangible and tangible assets, investments in associates
and available-for-sale securities,
• Restructuring costs: These relate to costs of a restructuring program planned and controlled by management that materially
changes either the scope of a business undertaken by an entity, or the manner in which that business is conducted, based
on the criteria set out in IAS 37,
• Scope effects
This line includes:
• direct costs related to acquisitions of controlling interests;
• in the event of a business combination achieved in stages, impacts of the remeasurement of the previously held
interest at acquisition-date fair value;
• subsequent changes in the fair value of contingent consideration;
• gains or losses from disposals of interests which result in a change in consolidation method, as well as any impact of
the remeasurement of retained interests.
• Other gains and losses on disposals and non-recurring items: This includes mainly capital gains and losses on disposals of
non-current assets and available-for-sale securities.
1.5.18 Statement of cash flows
The Group consolidated statement of cash flows is prepared based on net income, using the indirect method.
"Interest received on non-current financial assets" is classified within investing activities because it represents a return on
investments. "Interest received on cash and cash equivalents" is shown as a component of financing activities because the interest
can be used to reduce borrowing costs.
Impairment losses on current assets are identified as definitive losses, and therefore any change in current assets is shown net of
impairment.
Cash flows related to payment of taxes are treated separately.
1.5.19 Income tax expense
The Group computes taxes in accordance with the prevailing tax legislation in the countries where income is taxable.
In accordance with IAS 12, deferred taxes are recognized according to the liability method on temporary differences between the book
values of assets and liabilities in the consolidated financial statements and their tax bases, using tax rates that have been enacted or
substantively enacted by the reporting date. However, under the provisions of IAS 12, no deferred taxes are recognized for temporary
differences arising from goodwill for which impairment losses are not deductible for tax purposes, or from the initial recognition of an
asset or liability in a transaction which (i) is not a business combination; and (ii) at the time of the transaction, affects neither
accounting income nor taxable income. In addition, deferred tax assets are only recognized to the extent that it is probable that
taxable income will be available against which the deductible temporary difference can be utilized.
Temporary differences arising on restatements of finance leases result in the recognition of deferred taxes.
A deferred tax liability is recognized for all taxable temporary differences associated with investments in subsidiaries, branches and
associates, and interests in joint ventures, except if the Group is able to control the timing of the reversal of the temporary difference
and it is probable that the temporary difference will not reverse in the foreseeable future.
Net balances of deferred tax are calculated based on the tax position of each company or on the total income of the companies
included within the consolidated tax group and the net position of each fiscal entity is recorded on the statement of financial position
under assets or liabilities, as appropriate.
Deferred taxes are reviewed at each reporting date to take into account factors including the impact of changes in tax laws and the
prospects of recovering deferred tax assets arising from deductible temporary differences.
Deferred tax assets and liabilities are not discounted.

26
1.5.20 Earnings per share
Basic earnings per share are calculated by dividing the adjusted net income Group share for the fiscal year attributable to ordinary
shares by the weighted average number of shares outstanding during the fiscal year. The adjusted net income Group share takes into
account the cost of the coupon attributable to holders of undated deeply subordinated notes issued by SUEZ ENVIRONNEMENT
COMPANY. The average number of shares outstanding during the fiscal year is the number of ordinary shares outstanding at the
beginning of the year, adjusted by the number of ordinary shares bought back or issued during the course of the year.

27
NOTE 2 Major transactions in 2013
2.1 Commercial paper issue
On January 3, 2013, SUEZ ENVIRONNEMENT COMPANY established a commercial paper program for up to €1,500 million. As of
December 31, 2013, the outstanding notes totaled €679 million.
2.2 SUEZ ENVIRONNEMENT COMPANY worldwide financial incentive scheme
On January 17, 2013, the Board of Directors of SUEZ ENVIRONNEMENT COMPANY decided to implement a new worldwide
financial incentive scheme to benefit its employees, who will eventually receive 38 SUEZ ENVIRONNEMENT COMPANY shares each
(see Note 21 “Share-based payments” of the present chapter).
2.3 Sale of United Water Arkansas (United States)
On February 1, 2013, United Water Inc., a subsidiary of SUEZ ENVIRONNEMENT, finalized the sale of its regulated water activities in
Arkansas for €20.8 million.
2.4 Public tender offer for Aguas de Sabadell
On June 12, 2013, the board of the Spanish Securities and Exchange Commission (CNMV) approved the public tender offer filed by
Agbar to purchase shares of the company "Companyia d'Aigues de Sabadell, SA. (CASSA)".
Following the offer period, whose results were officially published on July 16, 2013 by the CNMV, Agbar held 77.7% of CASSA.
CASSA provides water services to approximately 350,000 inhabitants in more than 40 municipalities (mainly in Catalonia), with
concession contracts. The revenues as of December 31, 2013 were €36.4 million.
2.5 Settlement agreement with the Urban Community of Lille
On July 3, 2013, the dispute between the company "Société des Eaux du Nord" (SEN) and the Urban Community of Lille (LMCU)
ended (see Note 24 “Legal and arbitration proceedings" of the present chapter) by signing a settlement agreement providing mutual
financial commitments, including:
- the payment of €60 million by SEN relating to renewal costs, amount increased by €8.7 million in order to take into account the
conclusion of the independent expertise released in February 2014. The total payable amount is therefore €68.7 million.
- the acquisition in 2013 by LMCU of the production, storage and transport assets belonging to the SEN for an amount of €54 million.
2.6 Termination of the shareholders' agreement relating to SUEZ ENVIRONNEMENT COMPANY
As indicated in press releases dated December 5, 2012 and January 22, 2013 (see section 18.3.1 and chapter 19 of the 2012
Reference Document), the shareholders' agreement relating to SUEZ ENVIRONNEMENT COMPANY was terminated on July 22,
2013.
This decision resulted in GDF SUEZ losing control of SUEZ ENVIRONNEMENT COMPANY. As of July 22, 2013, the 35.8% stake
held by the GDF SUEZ Group is accounted for under the equity method in the consolidated financial statements of GDF SUEZ.
GDF SUEZ has also expressed its intention to remain the Company's main shareholder and a long-term strategic partner. GDF SUEZ
has affirmed its commitment not to reduce its stake in the Company and to support its development strategy. The Company's
governance has been modified to reflect these changes. The number of directors representing GDF SUEZ has been reduced, Gérard
Mestrallet remaining as Chairman.
2.7 New bond issue
On October 8, 2013, SUEZ ENVIRONNEMENT COMPANY completed the placement of a €500 million bond issue maturing on
October 9, 2023 with a fixed annual coupon of 2.75%.

28
2.8 Agbar to manage the entire water cycle (water and sanitation) in the Barcelona Metropolitan Area for 35 years
Agbar, a subsidiary of SUEZ ENVIRONNEMENT, and the Barcelona Metropolitan Area (AMB), have created a joint venture company
dedicated to water and wastewater management of 24 municipalities, including the city of Barcelona and the surrounding
communities. This contract, which has a duration of 35 years, will generate a total revenues of €3.5 billion.
This new company is a public-private partnership in which Agbar has an 85% stake and the Barcelona Metropolitan Area holds the
remaining 15%. The company will operate under the name Aguas de Barcelona, and will supply water and wastewater services to
three million inhabitants.
2.9 Successful refinancing and resolution of legal disputes concerning the SUEZ ENVIRONNEMENT desalination plant in Australia
AquaSure, in which SUEZ ENVIRONNEMENT holds a 21% stake, reached an agreement on refinancing the seawater desalination
plant in Melbourne (Victoria) for a total of AUD$3.7 billion (or €2.4 billion), thus achieving a significant reduction in financial costs.
SUEZ ENVIRONNEMENT has also obtained a satisfactory resolution to the legal disputes related to the desalination plant's
construction. All outstanding claims were ended and the remaining provisions were reversed on December 31, 2013.
2.10 Sita France sells its stake in the Nicollin Group
Sita France, a subsidiary of SUEZ ENVIRONNEMENT, and the Nicollin Group have concluded an agreement to sell Sita France's
36% stake in Nicollin.
29
NOTE 3 Operating segments information
In accordance with the provisions of IFRS 8 – Operating Segments, the segments used below to present segment information have
been identified based on internal reporting, in particular those segments monitored by the Management Committee, comprised of the
Group’s key operational decision-makers.
As for the preceding years, the Group uses four operating segments :
• Water Europe ;
• Waste Europe ;
• International ;
• Other.
A distinction is made between the water distribution and water treatment services and the waste collection and waste treatment
services in Europe.
The activities conducted internationally are grouped together and separated from those conducted in the Europe region. This specific
segmentation reflects the difference in development strategy implemented internationally compared to the strategy pursued in Europe
and is consistent with the Group’s internal organizational systems and management structure.
3.1 Operating segments
SUEZ ENVIRONNEMENT COMPANY’s subsidiaries are divided into the following operating segments :
• Water Europe: water distribution and treatment services, particularly under concession contracts (water management).
These services are rendered to individuals, local authorities and industrial clients ;
• Waste Europe: waste collection and treatment services for local authorities and industrial clients. These services include
collection, sorting, recycling, composting, energy recovery and landfilling for both non-hazardous and hazardous waste ;
• International: the Group is expanding in these business segments, depending on the opportunities that may arise, in the
areas of water, waste and engineering services, with a special focus on risk-management resulting from specific local
environments by setting up partnerships, entering into hedges, and limiting invested capital or other investments in highly
regulated environments.
• The “Other” segment is essentially made up of holding companies, including SUEZ ENVIRONNEMENT COMPANY.
The accounting principles and valuation methods used to prepare internal reporting are the same as those used to prepare the
consolidated financial statements. EBITDA and industrial capital employed are reconciled with the consolidated financial statements.
3.2 Key indicators by operating segment
In 2013, the operating segments Water Europe, Waste Europe and International have been modified to reflect the internal reporting
monitored by the Management Committee consistently with the new organization of this Committee: Water and Waste activities
located in Central Europe previously included in the International segment, are now reclassified in Water Europe and Waste Europe
Segments.
The 2012 data in the tables below have been restated for comparison purposes.
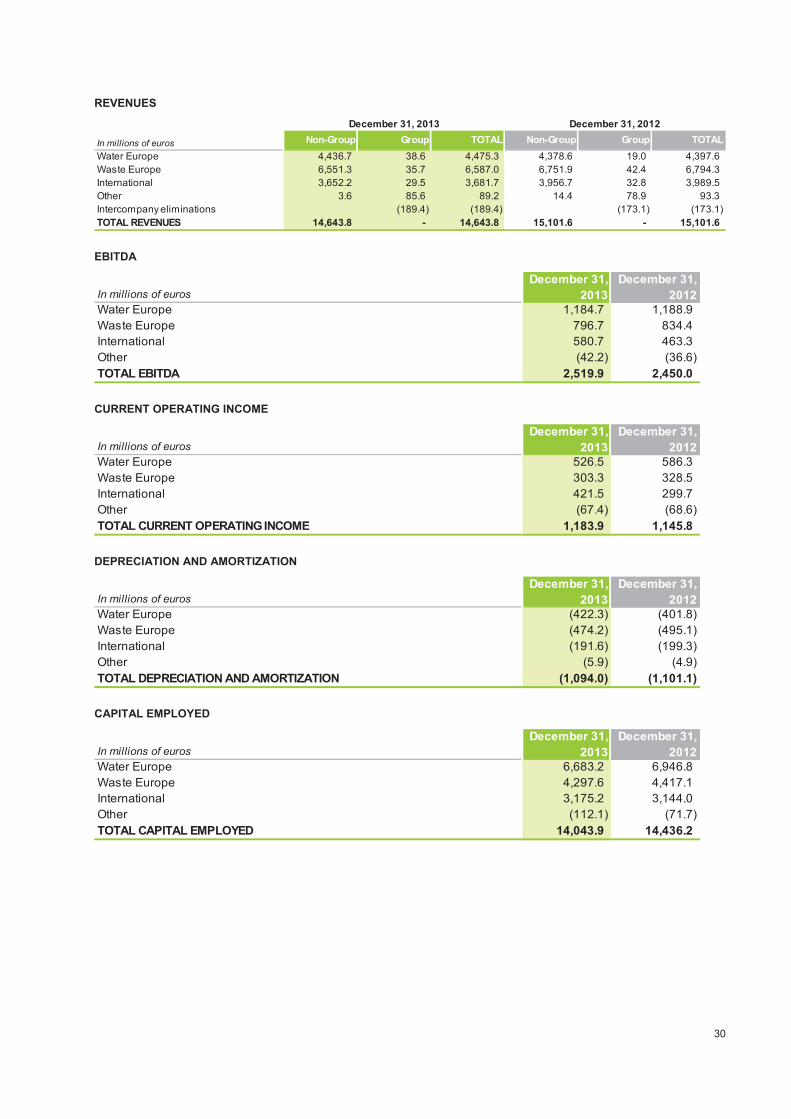
30
REVENUES
EBITDA
CURRENT OPERATING INCOME
DEPRECIATION AND AMORTIZATION
CAPITAL EMPLOYED
In millions of euros Non-Group Group TOTAL Non-Group Group TOTAL
Water Europe 4,436.7 38.6 4,475.3 4,378.6 19.0 4,397.6
Waste Europe 6,551.3 35.7 6,587.0 6,751.9 42.4 6,794.3
International 3,652.2 29.5 3,681.7 3,956.7 32.8 3,989.5
Other 3.6 85.6 89.2 14.4 78.9 93.3
Intercompany eliminations (189.4) (189.4) (173.1) (173.1)
TOTAL REVENUES 14,643.8 - 14,643.8 15,101.6 - 15,101.6
December 31, 2013 December 31, 2012
In millions of euros
December 31,
2013
December 31,
2012
Water Europe 1,184.7 1,188.9
Waste Europe 796.7 834.4
International 580.7 463.3
Other (42.2) (36.6)
TOTAL EBITDA 2,519.9 2,450.0
In millions of euros
December 31,
2013
December 31,
2012
Water Europe 526.5 586.3
Waste Europe 303.3 328.5
International 421.5 299.7
Other (67.4) (68.6)
TOTAL CURRENT OPERATING INCOME 1,183.9 1,145.8
In millions of euros
December 31,
2013
December 31,
2012
Water Europe (422.3) (401.8)
Waste Europe (474.2) (495.1)
International (191.6) (199.3)
Other (5.9) (4.9)
TOTAL DEPRECIATION AND AMORTIZATION (1,094.0) (1,101.1)
In millions of euros
December 31,
2013
December 31,
2012
Water Europe 6,683.2 6,946.8
Waste Europe 4,297.6 4,417.1
International 3,175.2 3,144.0
Other (112.1) (71.7)
TOTAL CAPITAL EMPLOYED 14,043.9 14,436.2

31
INVESTMENTS IN PROPERTY, PLANT AND EQUIPMENT, INTANGIBLE ASSETS AND FINANCIAL ASSETS
Financial investments included in this indicator include the acquisitions of additional interests in controlled entities, which are
accounted for in cash flows used in financing activities in the consolidated statement of cash flows (under the item “Change in share
of interest in controlled entities”).
3.3 Key indicators by geographical area
The indicators below are analyzed by:
• destination of products and services sold for revenues ;
• geographical location of consolidated companies for capital employed.
3.4 Reconciliation of indicators with consolidated financial statements
3.4.1 Reconciliation of EBITDA with current operating income
The reconciliation of EBITDA with current operating income can be analyzed as follows:
In millions of euros
December 31,
2013
December 31,
2012
Water Europe (424.7) (467.3)
Waste Europe (439.0) (487.7)
International (289.7) (339.0)
Other (21.1) (19.5)
TOTAL INVESTMENTS (1,174.5) (1,313.5)
In millions of euros
December 31,
2013
December 31,
2012
December 31,
2013
December 31,
2012
France 5,306.2 5,446.5 2,572.1 2,589.3
Europe 5,038.9 5,038.2 8,100.9 8,461.2
International 4,298.7 4,616.9 3,370.9 3,385.7
TOTAL 14,643.8 15,101.6 14,043.9 14,436.2
Revenues Capital Employed
In millions of euros
December 31,
2013
December 31,
2012
Current Operating Income 1,183.9 1,145.8
(-) Net depreciation, amortization and provisions 974.4 1,036.0
(-) Share-based payments (IFRS 2) 24.2 23.6
(-) Disbursements under concession contracts 337.4 244.6
EBITDA 2,519.9 2,450.0
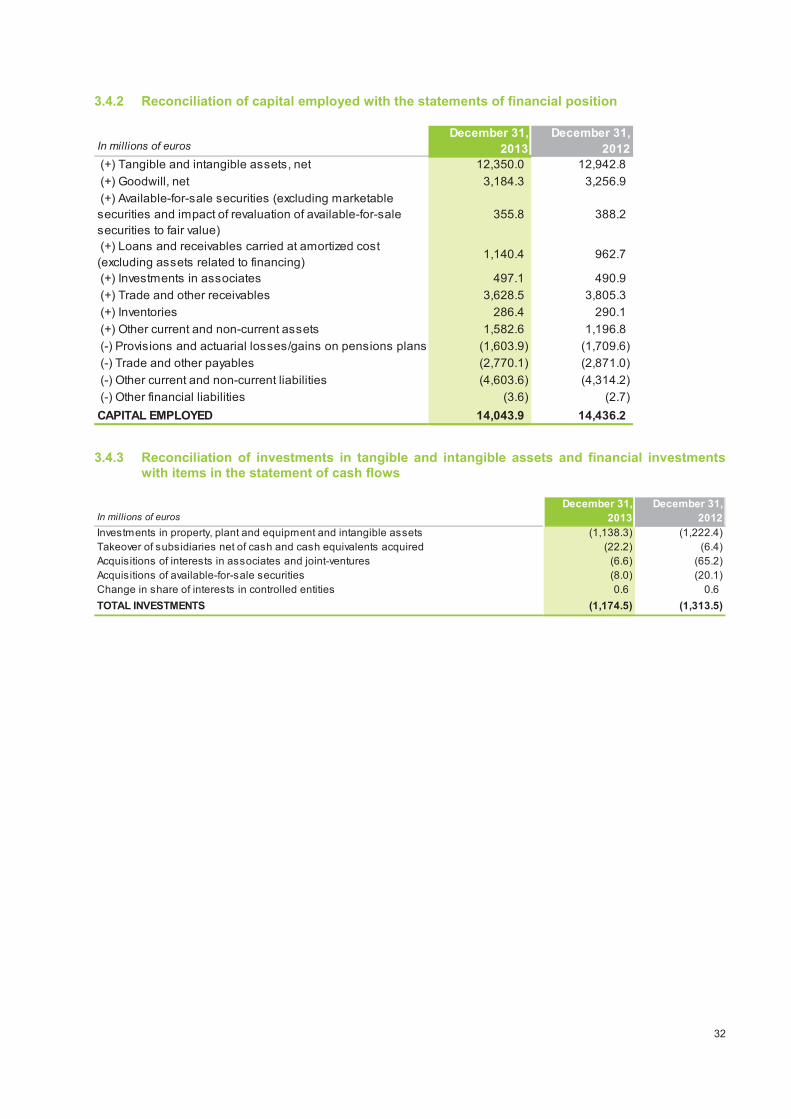
32
3.4.2 Reconciliation of capital employed with the statements of financial position
3.4.3 Reconciliation of investments in tangible and intangible assets and financial investments with items in the statement of cash flows
In millions of eurosDecember 31,
2013
December 31,
2012
(+) Tangible and intangible assets, net 12,350.0 12,942.8
(+) Goodwill, net 3,184.3 3,256.9
(+) Available-for-sale securities (excluding marketable
securities and impact of revaluation of available-for-sale
securities to fair value)
355.8 388.2
(+) Loans and receivables carried at amortized cost
(excluding assets related to financing)1,140.4 962.7
(+) Investments in associates 497.1 490.9
(+) Trade and other receivables 3,628.5 3,805.3
(+) Inventories 286.4 290.1
(+) Other current and non-current assets 1,582.6 1,196.8
(-) Provisions and actuarial losses/gains on pensions plans (1,603.9) (1,709.6)
(-) Trade and other payables (2,770.1) (2,871.0)
(-) Other current and non-current liabilities (4,603.6) (4,314.2)
(-) Other financial liabilities (3.6) (2.7)
CAPITAL EMPLOYED 14,043.9 14,436.2
In millions of euros
December 31,
2013
December 31,
2012
Investments in property, plant and equipment and intangible assets (1,138.3) (1,222.4)
Takeover of subsidiaries net of cash and cash equivalents acquired (22.2) (6.4)
Acquisitions of interests in associates and joint-ventures (6.6) (65.2)
Acquisitions of available-for-sale securities (8.0) (20.1)
Change in share of interests in controlled entities 0.6 0.6
TOTAL INVESTMENTS (1,174.5) (1,313.5)

33
NOTE 4 Current operating income
4.1 Revenues
The following table shows Group revenues per category:
4.2 Personnel costs
Short-term benefits correspond to salaries and expenses recognized for the period. It includes the impact of CICE (tax credit for
competitiveness and employment) in France.
Share-based payments are broken down in Note 21.
Post-employment benefit obligations and other long-term benefits are disclosed in Note 16. This amount corresponds to defined-
benefit plan expenses (see Note 16.2.3) and to defined-contribution plan expenses (see Note 16.3).
4.3 Depreciation, amortization and provisions
The amounts shown below are net of reversals.
The depreciation breakdown is €740.8 million for property, plant and equipment and €353.2 million for intangible assets. The
breakdown by type of asset is shown in Notes 10 and 11.
In millions of euros
December 31,
2013
December 31,
2012
Revenues 14,643.8 15,101.6
Purchases (2,976.6) (3,486.9)
Personnel costs (3,708.1) (3,764.4)
Depreciation, amortization and provisions (974.4) (1,036.0)
Other operating income and expenses (5,800.8) (5,668.5)
CURRENT OPERATING INCOME 1,183.9 1,145.8
In millions of euros
December 31,
2013
December 31,
2012
Sale, transport and distribution of electricity 458.4 494.6
Water and waste 12,982.6 13,113.2
Engineering and construction contracts and other services 1,202.8 1,493.8
TOTAL 14,643.8 15,101.6
In millions of euros
December 31,
2013
December 31,
2012
Short-term benefits (3,582.1) (3,636.3)
Share-based payments (24.2) (23.6)
Post-employment benefit obligations and other
long-term benefits(101.8) (104.5)
TOTAL (3,708.1) (3,764.4)
In millions of euros
December 31,
2013
December 31,
2012
Depreciation and amortization (1,094.0) (1,101.1)
Depreciation of inventories and trade receivables (14.8) (24.4)
Net change in provisions 134.4 89.5
TOTAL (974.4) (1,036.0)
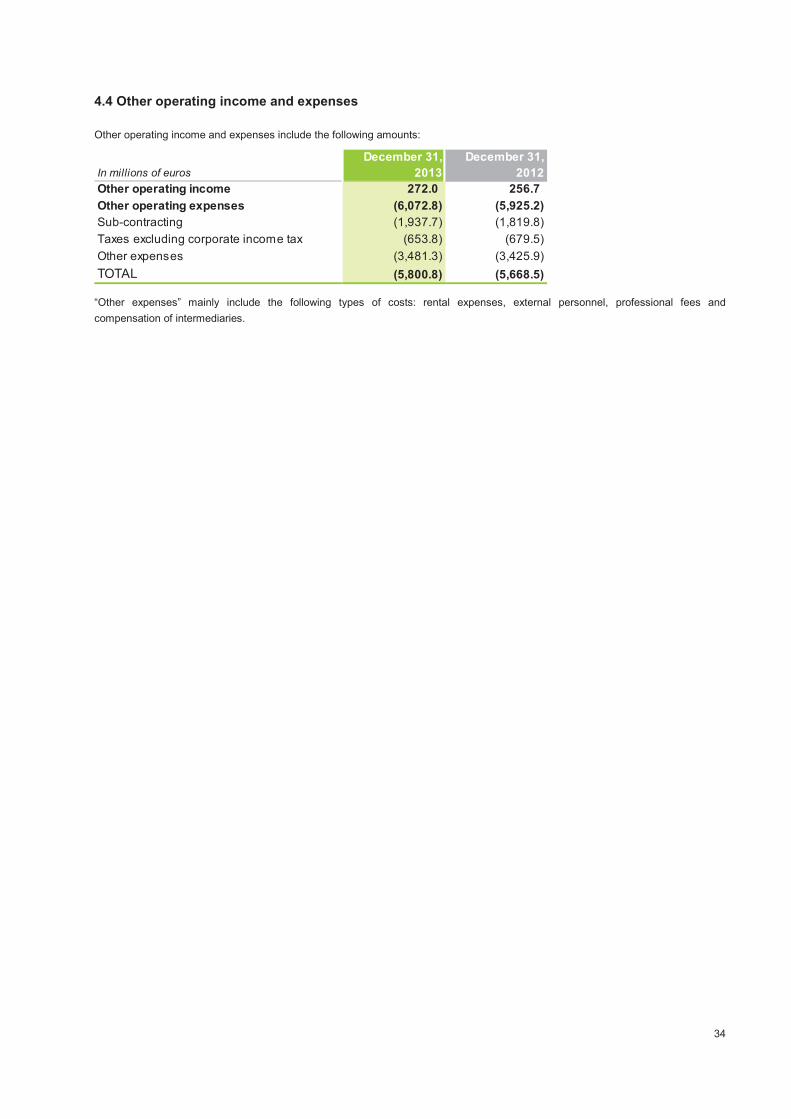
34
4.4 Other operating income and expenses
Other operating income and expenses include the following amounts:
“Other expenses” mainly include the following types of costs: rental expenses, external personnel, professional fees and
compensation of intermediaries.
In millions of euros
December 31,
2013
December 31,
2012
Other operating income 272.0 256.7
Other operating expenses (6,072.8) (5,925.2)
Sub-contracting (1,937.7) (1,819.8)
Taxes excluding corporate income tax (653.8) (679.5)
Other expenses (3,481.3) (3,425.9)
TOTAL (5,800.8) (5,668.5)
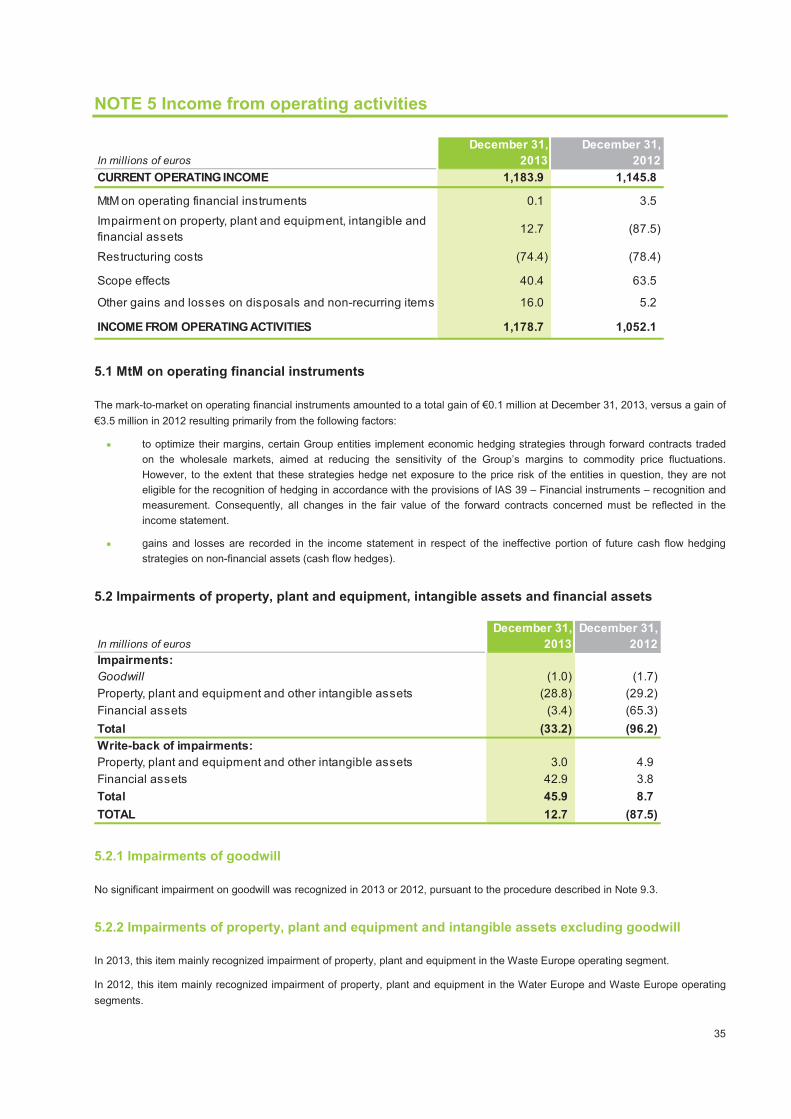
35
NOTE 5 Income from operating activities
5.1 MtM on operating financial instruments
The mark-to-market on operating financial instruments amounted to a total gain of €0.1 million at December 31, 2013, versus a gain of
€3.5 million in 2012 resulting primarily from the following factors:
• to optimize their margins, certain Group entities implement economic hedging strategies through forward contracts traded
on the wholesale markets, aimed at reducing the sensitivity of the Group’s margins to commodity price fluctuations.
However, to the extent that these strategies hedge net exposure to the price risk of the entities in question, they are not
eligible for the recognition of hedging in accordance with the provisions of IAS 39 – Financial instruments – recognition and
measurement. Consequently, all changes in the fair value of the forward contracts concerned must be reflected in the
income statement.
• gains and losses are recorded in the income statement in respect of the ineffective portion of future cash flow hedging
strategies on non-financial assets (cash flow hedges).
5.2 Impairments of property, plant and equipment, intangible assets and financial assets
5.2.1 Impairments of goodwill
No significant impairment on goodwill was recognized in 2013 or 2012, pursuant to the procedure described in Note 9.3.
5.2.2 Impairments of property, plant and equipment and intangible assets excluding goodwill
In 2013, this item mainly recognized impairment of property, plant and equipment in the Waste Europe operating segment.
In 2012, this item mainly recognized impairment of property, plant and equipment in the Water Europe and Waste Europe operating
segments.
In millions of euros
December 31,
2013
December 31,
2012
CURRENT OPERATING INCOME 1,183.9 1,145.8
MtM on operating financial instruments 0.1 3.5
Impairment on property, plant and equipment, intangible and
financial assets12.7 (87.5)
Restructuring costs (74.4) (78.4)
Scope effects 40.4 63.5
Other gains and losses on disposals and non-recurring items 16.0 5.2
INCOME FROM OPERATING ACTIVITIES 1,178.7 1,052.1
In millions of euros
December 31,
2013
December 31,
2012
Impairments:
Goodwill (1.0) (1.7)
Property, plant and equipment and other intangible assets (28.8) (29.2)
Financial assets (3.4) (65.3)
Total (33.2) (96.2)
Write-back of impairments:
Property, plant and equipment and other intangible assets 3.0 4.9
Financial assets 42.9 3.8
Total 45.9 8.7
TOTAL 12.7 (87.5)

36
5.2.3 Impairments of financial assets
At December 31, 2013, this item included the reversal of impairment losses on financial receivables relating to an International
concession contract.
In 2012, this item essentially consisted of an impairment of €60.0 million recorded by the Group on non-consolidated Acea shares, a
company listed on the Milan stock exchange, based on the share price at December 31, 2012.
5.3 Restructuring costs
At December 31, 2013, this item mainly included the costs of adaptation plans related to the business slowdown in the Waste Europe
and Water Europe segments, and at Degrémont, as well as the latest impacts of the Group's exit from Hungary.
In 2012, this item mainly recognized the costs associated with restructuring plans decided by Agbar (in Spain) and by Degrémont
(mainly in France), and the costs of adaptation plans for the Waste Europe segment related to the slowdown in activity.
5.4 Scope effects
In 2013, this item mainly included:
• a gain recognized on SITA France's disposal of its shares in companies of the Nicollin Group, as described in Note 2; and
• a gain resulting from the disposal of our stake in the company managing the concession in Cancun (Mexico).
In 2012, this item mainly included the gains realized on the disposal of shares in Eurawasser (Germany) and Altiservice (France), as
well as the gain from the sale of regulated water activities in Connecticut (United States).
5.5 Other gains/losses on disposals and non-recurring items
In 2013 and in 2012, this item shows only insignificant individual amounts.
In millions of euros
December 31,
2013
December 31,
2012
Disposals of property, plant and equipment and intangible
assets13.6 1.2
Disposals of shares 2.4 4.0
Total 16.0 5.2

37
NOTE 6 Net financial income/loss
6.1 Cost of net debt
This item primarily includes interest expenses related to gross borrowings (calculated using the effective interest rate – EIR), gains
and losses arising from foreign currency and interest rate hedging transactions on gross borrowings, as well as interest income on
cash investments and changes in the fair value of financial assets measured at fair value through profit or loss.
The decrease in cost of net debt between December 31, 2013 and December 31, 2012 is mainly due to the impact of lower interest
rates and the issuance of commercial paper instead of long-term syndicated credit lines.
6.2 Other financial income and expenses
(a) As a result of the application of IAS 19 revised (see Note 1.2.1 "Revised IAS 19 - Employee Benefits"), the net interest cost related to the application
of the discount rate on net defined benefit plans obligations is presented on a separate line. Data presentation at December 31, 2012 has been changed
for comparative purposes.
December, 31 2013 December, 31 2012
In millions of euros Expenses Incomes Total Expenses Incomes Total
Cost of net debt (431.7) 58.2 (373.5) (466.2) 55.6 (410.6)
Other financial income and expenses (83.5) 54.8 (28.7) (72.2) 63.6 (8.6)
Financial income/(loss) (515.2) 113.0 (402.2) (538.4) 119.2 (419.2)
December, 31 2013 December, 31 2012
In millions of euros Expenses Incomes Total Expenses Incomes Total
Interest expense on gross borrowings (385.2) - (385.2) (428.8) - (428.8)
Exchange gain/(loss) on borrowings and hedges (21.7) - (21.7) (22.1) (22.1)
Unrealized income/(expense) from economic hedges on
borrowings (1.0) - (1.0) - - -
Income/(expense) on cash and cash equivalents, and
financial assets at fair value through income- 37.5 37.5 - 45.7 45.7
Capitalized borrowing costs - 10.2 10.2 - 6.7 6.7
Financial income (expense) relating to a financial debt
or receivable restructuring (23.8) 10.5 (13.3) (15.3) 3.2 (12.1)
Cost of net debt (431.7) 58.2 (373.5) (466.2) 55.6 (410.6)
December, 31 2013 December, 31 2012
In millions of euros Expenses Incomes Total Expenses Incomes Total
Net interest expenses related to post employment and
other long term benefits (a)(22.2) - (22.2) (16.3) - (16.3)
Unwinding of discounting adjustment to long term
provisions (except post employment)(43.3) - (43.3) (40.1) - (40.1)
Change in fair value of derivatives not included in net
debt(5.7) - (5.7) - 3.8 3.8
Income from available-for-sale securities - 27.0 27.0 - 25.1 25.1
Other (12.3) 27.8 15.5 (15.8) 34.7 18.9
Other Financial Income and Expenses (83.5) 54.8 (28.7) (72.2) 63.6 (8.6)

38
NOTE 7 Income tax
7.1 Income tax expense in the income statement
7.1.1 Breakdown of income tax expense in the income statement
Income tax expense for the fiscal year amounted to €205.4 million (compared to €185.7 million in 2012) and breaks down as follows:
In millions of euros Dec. 31, 2013 Dec. 31, 2012
Current income tax (236.6) (171.7)
Deferred taxes 31.2 (14.0)
Total income tax expense recognized in income (205.4) (185.7)
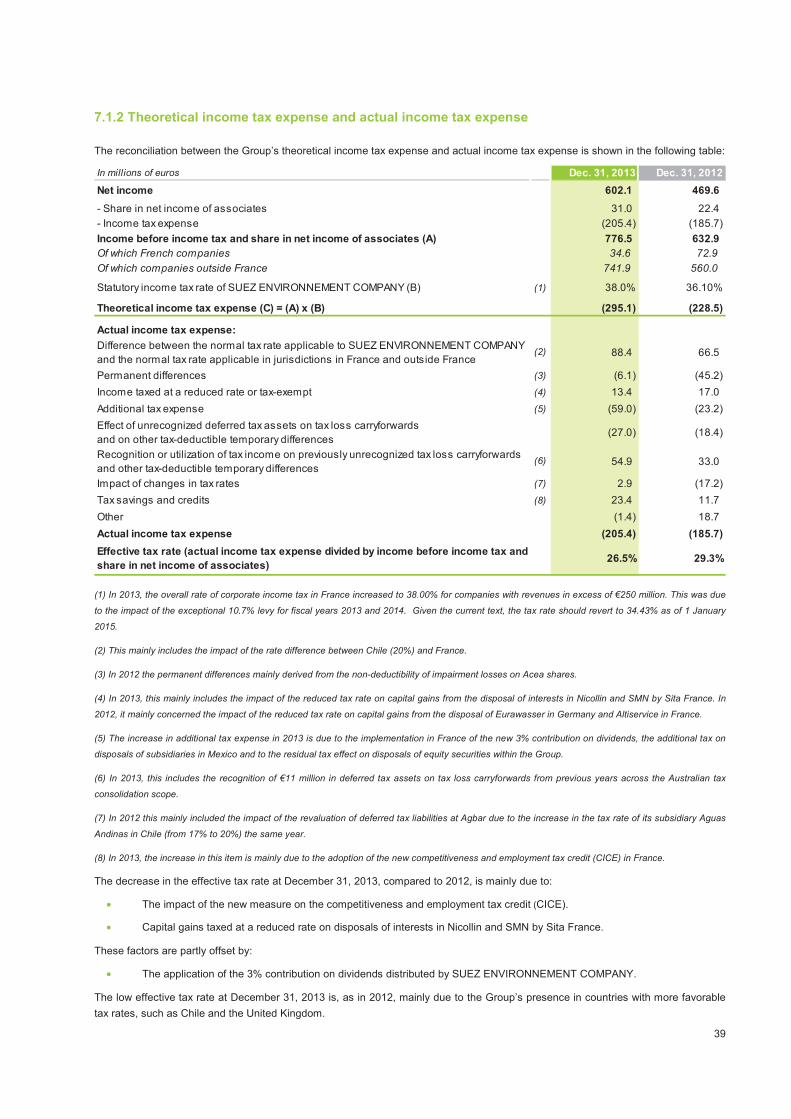
39
7.1.2 Theoretical income tax expense and actual income tax expense
The reconciliation between the Group’s theoretical income tax expense and actual income tax expense is shown in the following table:
(1) In 2013, the overall rate of corporate income tax in France increased to 38.00% for companies with revenues in excess of €250 million. This was due
to the impact of the exceptional 10.7% levy for fiscal years 2013 and 2014. Given the current text, the tax rate should revert to 34.43% as of 1 January
2015.
(2) This mainly includes the impact of the rate difference between Chile (20%) and France.
(3) In 2012 the permanent differences mainly derived from the non-deductibility of impairment losses on Acea shares.
(4) In 2013, this mainly includes the impact of the reduced tax rate on capital gains from the disposal of interests in Nicollin and SMN by Sita France. In
2012, it mainly concerned the impact of the reduced tax rate on capital gains from the disposal of Eurawasser in Germany and Altiservice in France.
(5) The increase in additional tax expense in 2013 is due to the implementation in France of the new 3% contribution on dividends, the additional tax on
disposals of subsidiaries in Mexico and to the residual tax effect on disposals of equity securities within the Group.
(6) In 2013, this includes the recognition of €11 million in deferred tax assets on tax loss carryforwards from previous years across the Australian tax
consolidation scope.
(7) In 2012 this mainly included the impact of the revaluation of deferred tax liabilities at Agbar due to the increase in the tax rate of its subsidiary Aguas
Andinas in Chile (from 17% to 20%) the same year.
(8) In 2013, the increase in this item is mainly due to the adoption of the new competitiveness and employment tax credit (CICE) in France.
The decrease in the effective tax rate at December 31, 2013, compared to 2012, is mainly due to:
• The impact of the new measure on the competitiveness and employment tax credit (CICE).
• Capital gains taxed at a reduced rate on disposals of interests in Nicollin and SMN by Sita France.
These factors are partly offset by:
• The application of the 3% contribution on dividends distributed by SUEZ ENVIRONNEMENT COMPANY.
The low effective tax rate at December 31, 2013 is, as in 2012, mainly due to the Group’s presence in countries with more favorable
tax rates, such as Chile and the United Kingdom.
In millions of euros Dec. 31, 2013 Dec. 31, 2012
Net income 602.1 469.6
- Share in net income of associates 31.0 22.4
- Income tax expense (205.4) (185.7)
Income before income tax and share in net income of associates (A) 776.5 632.9
Of which French companies 34.6 72.9
Of which companies outside France 741.9 560.0
Statutory income tax rate of SUEZ ENVIRONNEMENT COMPANY (B) (1) 38.0% 36.10%
Theoretical income tax expense (C) = (A) x (B) (295.1) (228.5)
Actual income tax expense:
Difference between the normal tax rate applicable to SUEZ ENVIRONNEMENT COMPANY
and the normal tax rate applicable in jurisdictions in France and outside France(2) 88.4 66.5
Permanent differences (3) (6.1) (45.2)
Income taxed at a reduced rate or tax-exempt (4) 13.4 17.0
Additional tax expense (5) (59.0) (23.2)
Effect of unrecognized deferred tax assets on tax loss carryforwards
and on other tax-deductible temporary differences(27.0) (18.4)
Recognition or utilization of tax income on previously unrecognized tax loss carryforwards
and other tax-deductible temporary differences(6) 54.9 33.0
Impact of changes in tax rates (7) 2.9 (17.2)
Tax savings and credits (8) 23.4 11.7
Other (1.4) 18.7
Actual income tax expense (205.4) (185.7)
Effective tax rate (actual income tax expense divided by income before income tax and
share in net income of associates)26.5% 29.3%
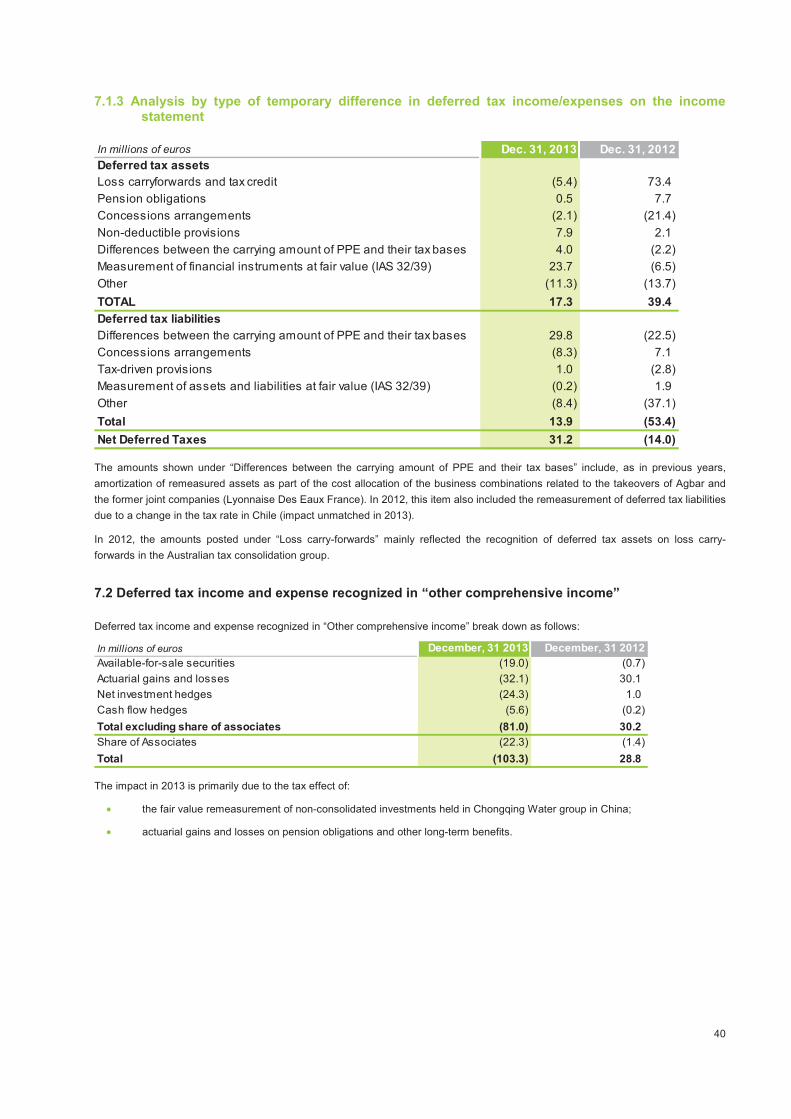
40
7.1.3 Analysis by type of temporary difference in deferred tax income/expenses on the income statement
The amounts shown under “Differences between the carrying amount of PPE and their tax bases” include, as in previous years,
amortization of remeasured assets as part of the cost allocation of the business combinations related to the takeovers of Agbar and
the former joint companies (Lyonnaise Des Eaux France). In 2012, this item also included the remeasurement of deferred tax liabilities
due to a change in the tax rate in Chile (impact unmatched in 2013).
In 2012, the amounts posted under “Loss carry-forwards” mainly reflected the recognition of deferred tax assets on loss carry-
forwards in the Australian tax consolidation group.
7.2 Deferred tax income and expense recognized in “other comprehensive income”
Deferred tax income and expense recognized in “Other comprehensive income” break down as follows:
The impact in 2013 is primarily due to the tax effect of:
• the fair value remeasurement of non-consolidated investments held in Chongqing Water group in China;
• actuarial gains and losses on pension obligations and other long-term benefits.
In millions of euros Dec. 31, 2013 Dec. 31, 2012
Deferred tax assets
Loss carryforwards and tax credit (5.4) 73.4
Pension obligations 0.5 7.7
Concessions arrangements (2.1) (21.4)
Non-deductible provisions 7.9 2.1
Differences between the carrying amount of PPE and their tax bases 4.0 (2.2)
Measurement of financial instruments at fair value (IAS 32/39) 23.7 (6.5)
Other (11.3) (13.7)
TOTAL 17.3 39.4
Deferred tax liabilities
Differences between the carrying amount of PPE and their tax bases 29.8 (22.5)
Concessions arrangements (8.3) 7.1
Tax-driven provisions 1.0 (2.8)
Measurement of assets and liabilities at fair value (IAS 32/39) (0.2) 1.9
Other (8.4) (37.1)
Total 13.9 (53.4)
Net Deferred Taxes 31.2 (14.0)
In millions of euros December, 31 2013 December, 31 2012
Available-for-sale securities (19.0) (0.7)
Actuarial gains and losses (32.1) 30.1
Net investment hedges (24.3) 1.0
Cash flow hedges (5.6) (0.2)
Total excluding share of associates (81.0) 30.2
Share of Associates (22.3) (1.4)
Total (103.3) 28.8
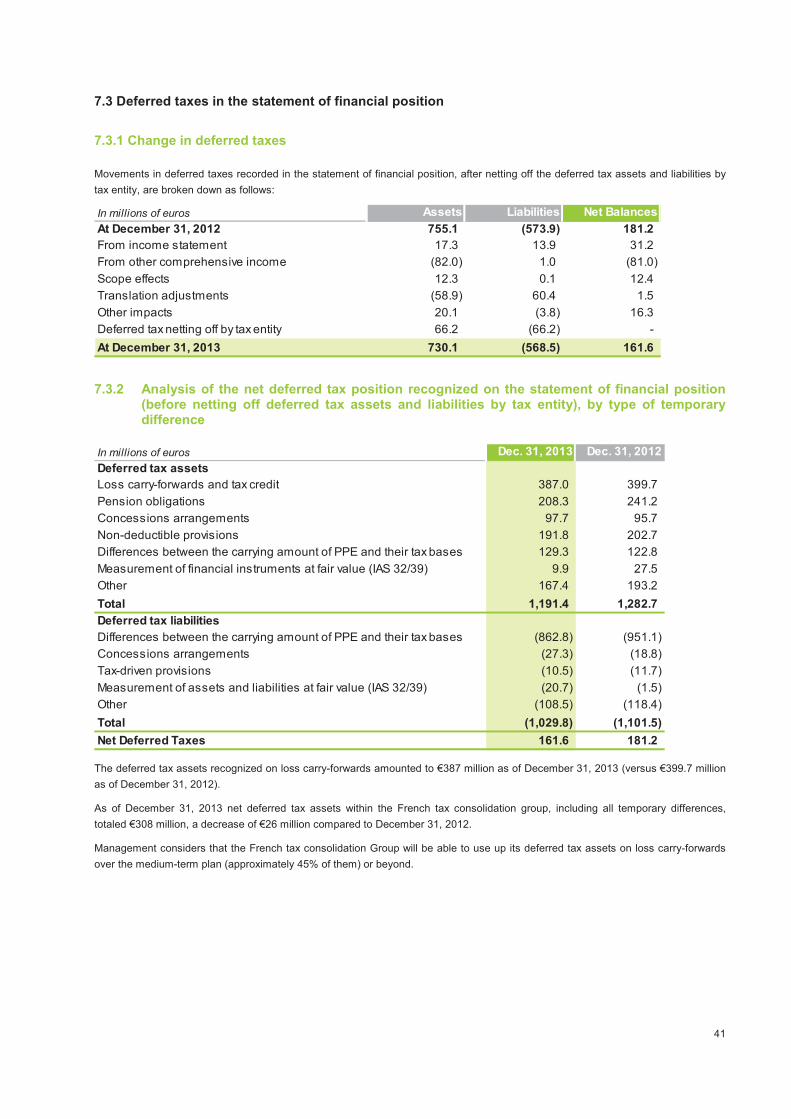
41
7.3 Deferred taxes in the statement of financial position
7.3.1 Change in deferred taxes
Movements in deferred taxes recorded in the statement of financial position, after netting off the deferred tax assets and liabilities by
tax entity, are broken down as follows:
7.3.2 Analysis of the net deferred tax position recognized on the statement of financial position (before netting off deferred tax assets and liabilities by tax entity), by type of temporary difference
The deferred tax assets recognized on loss carry-forwards amounted to €387 million as of December 31, 2013 (versus €399.7 million
as of December 31, 2012).
As of December 31, 2013 net deferred tax assets within the French tax consolidation group, including all temporary differences,
totaled €308 million, a decrease of €26 million compared to December 31, 2012.
Management considers that the French tax consolidation Group will be able to use up its deferred tax assets on loss carry-forwards
over the medium-term plan (approximately 45% of them) or beyond.
In millions of euros Assets Liabilities Net Balances
At December 31, 2012 755.1 (573.9) 181.2
From income statement 17.3 13.9 31.2
From other comprehensive income (82.0) 1.0 (81.0)
Scope effects 12.3 0.1 12.4
Translation adjustments (58.9) 60.4 1.5
Other impacts 20.1 (3.8) 16.3
Deferred tax netting off by tax entity 66.2 (66.2) -
At December 31, 2013 730.1 (568.5) 161.6
In millions of euros Dec. 31, 2013 Dec. 31, 2012
Deferred tax assets
Loss carry-forwards and tax credit 387.0 399.7
Pension obligations 208.3 241.2
Concessions arrangements 97.7 95.7
Non-deductible provisions 191.8 202.7
Differences between the carrying amount of PPE and their tax bases 129.3 122.8
Measurement of financial instruments at fair value (IAS 32/39) 9.9 27.5
Other 167.4 193.2
Total 1,191.4 1,282.7
Deferred tax liabilities
Differences between the carrying amount of PPE and their tax bases (862.8) (951.1)
Concessions arrangements (27.3) (18.8)
Tax-driven provisions (10.5) (11.7)
Measurement of assets and liabilities at fair value (IAS 32/39) (20.7) (1.5)
Other (108.5) (118.4)
Total (1,029.8) (1,101.5)
Net Deferred Taxes 161.6 181.2
42
7.4 Unrecognized deferred taxes
7.4.1 Deductible temporary differences not recognized
Temporary differences on losses carried forward
As of December 31, 2013, unused tax losses carried forward and not recognized in the statement of financial position (because they
did not meet the criteria for recognition as a deferred tax asset) amounted to €132.6 million for ordinary tax loss carry-forwards, versus
€150.8 million as of December 31, 2012.
Other temporary differences not recognized
The amount of deferred tax assets on other unrecognized temporary differences amounted to €37.6 million as of December 31, 2013,
compared to €71.0 million as of December 31, 2012.
7.4.2 Unrecognized deferred tax liabilities on taxable temporary differences relating to investments in subsidiaries
No significant deferred tax liability has been recognized on temporary differences when the Group is able to control the timing of their
reversal and it is probable that the temporary difference will not reverse in the foreseeable future.
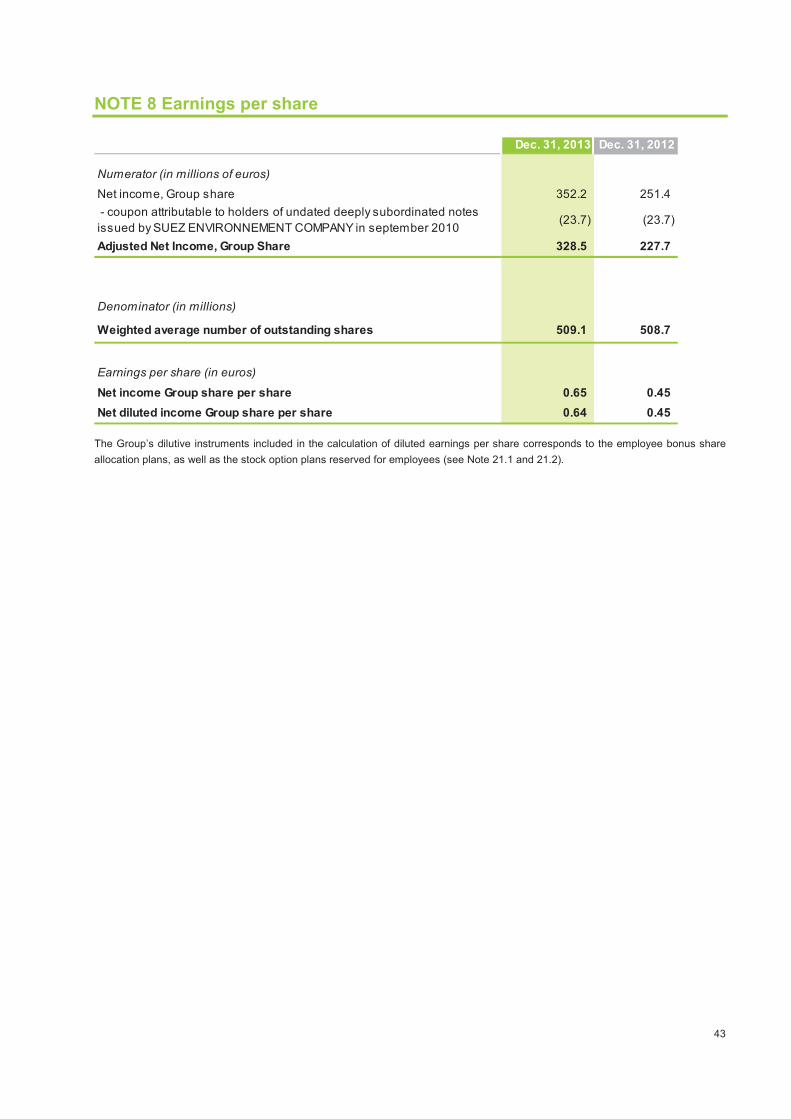
43
NOTE 8 Earnings per share
The Group’s dilutive instruments included in the calculation of diluted earnings per share corresponds to the employee bonus share
allocation plans, as well as the stock option plans reserved for employees (see Note 21.1 and 21.2).
Dec. 31, 2013 Dec. 31, 2012
Numerator (in millions of euros)
Net income, Group share 352.2 251.4
- coupon attributable to holders of undated deeply subordinated notes
issued by SUEZ ENVIRONNEMENT COMPANY in september 2010(23.7) (23.7)
Adjusted Net Income, Group Share 328.5 227.7
Denominator (in millions)
Weighted average number of outstanding shares 509.1 508.7
Earnings per share (in euros)
Net income Group share per share 0.65 0.45
Net diluted income Group share per share 0.64 0.45

44
NOTE 9 Goodwill
9.1 Movements in the carrying amount of goodwill
In 2013, the net change in goodwill came to -€72.6 million. This is largely the result of:
• the takeover of Aguas de Sabadell by Agbar, described in Note 2, for +€9.5 million; and
• translation adjustments (mainly related to fluctuations in the Australian dollar, the pound sterling and the US dollar for -€88.4
million).
In 2012, the net change in goodwill was -€7.8 million. This stemmed mainly from:
• the sale of Eurawasser (-€26.2 million) and the sale by United Water of its regulated water activities in Connecticut (-€2.3
million);
• the first-time consolidation of entities in the Waste Europe operating segment (+€10.7 million); and
• translation adjustments (mainly related to fluctuations in the US dollar, the Hong Kong dollar, the pound sterling, the Swedish
krona and the Chilean peso; +€5.3 million).
9.2 Main goodwill cash generating units (CGUs)
Goodwill CGUs break down as follows:
In millions of euros Gross amount Impairment Losses Carrying amount
At December 31, 2011 3,366.9 (102.2) 3,264.7
Scope effects (11.8) - (11.8)
Impairment losses - (1.7) (1.7)
Translation adjustments 6.0 (0.7) 5.3
Other 0.4 - 0.4
At December 31, 2012 3,361.5 (104.6) 3,256.9
Scope effects 15.6 1.2 16.8
Impairment losses - (1.0) (1.0)
Translation adjustments (95.3) 6.9 (88.4)
Other (0.4) 0.4 -
At December 31, 2013 3,281.4 (97.1) 3,184.3
In millions of euros
Operating
segmentDec. 31, 2013 Dec. 31, 2012
Material CGUs
Sita France Waste Europe 542.6 540.2
Agbar Water Europe 513.8 518.9
Sita News Waste Europe 513.8 514.5
United Water International 379.2 396.4
Sita UK Waste Europe 373.0 381.1
Lyonnaise des Eaux Water Europe 312.0 312.0
Sita Australia International 152.7 185.2
Sita Waste Services International 171.7 179.5
Other CGUs (individual goodwill of less than €150 million or
5% of total amount)225.5 229.1
TOTAL 3,184.3 3,256.9
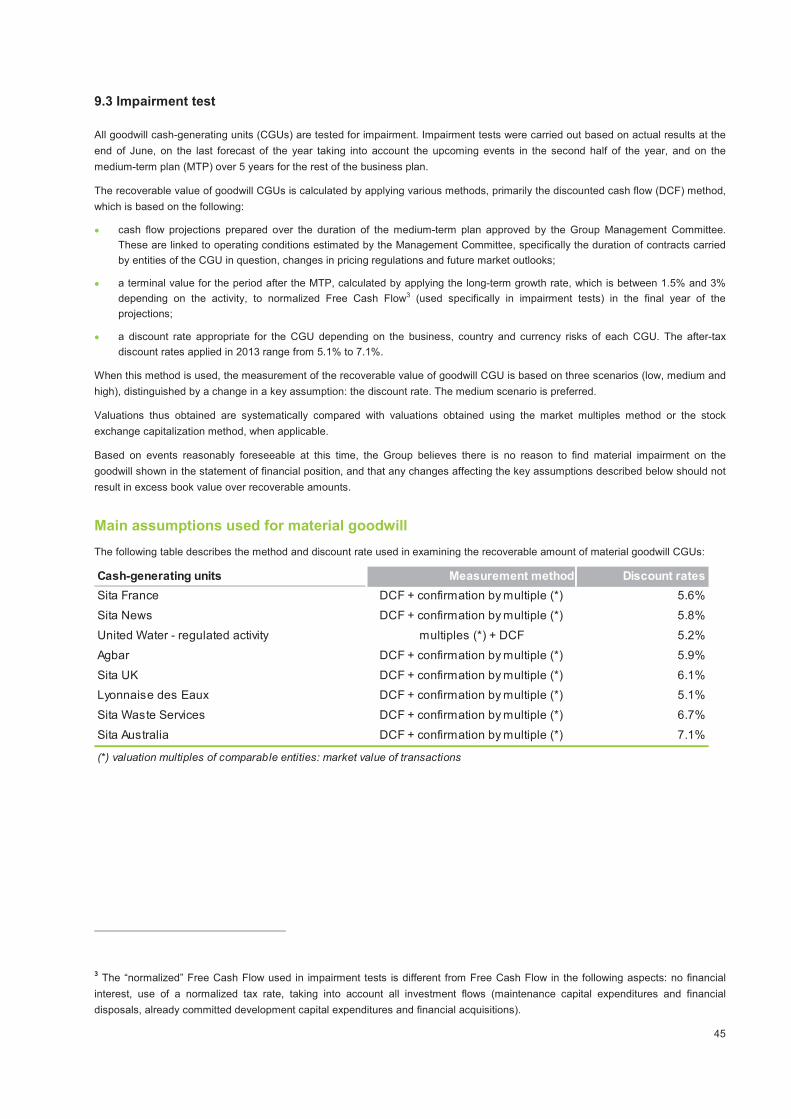
45
9.3 Impairment test
All goodwill cash-generating units (CGUs) are tested for impairment. Impairment tests were carried out based on actual results at the
end of June, on the last forecast of the year taking into account the upcoming events in the second half of the year, and on the
medium-term plan (MTP) over 5 years for the rest of the business plan.
The recoverable value of goodwill CGUs is calculated by applying various methods, primarily the discounted cash flow (DCF) method,
which is based on the following:
• cash flow projections prepared over the duration of the medium-term plan approved by the Group Management Committee.
These are linked to operating conditions estimated by the Management Committee, specifically the duration of contracts carried
by entities of the CGU in question, changes in pricing regulations and future market outlooks;
• a terminal value for the period after the MTP, calculated by applying the long-term growth rate, which is between 1.5% and 3%
depending on the activity, to normalized Free Cash Flow3 (used specifically in impairment tests) in the final year of the
projections;
• a discount rate appropriate for the CGU depending on the business, country and currency risks of each CGU. The after-tax
discount rates applied in 2013 range from 5.1% to 7.1%.
When this method is used, the measurement of the recoverable value of goodwill CGU is based on three scenarios (low, medium and
high), distinguished by a change in a key assumption: the discount rate. The medium scenario is preferred.
Valuations thus obtained are systematically compared with valuations obtained using the market multiples method or the stock
exchange capitalization method, when applicable.
Based on events reasonably foreseeable at this time, the Group believes there is no reason to find material impairment on the
goodwill shown in the statement of financial position, and that any changes affecting the key assumptions described below should not
result in excess book value over recoverable amounts.
Main assumptions used for material goodwill
The following table describes the method and discount rate used in examining the recoverable amount of material goodwill CGUs:
3 The “normalized” Free Cash Flow used in impairment tests is different from Free Cash Flow in the following aspects: no financial
interest, use of a normalized tax rate, taking into account all investment flows (maintenance capital expenditures and financial
disposals, already committed development capital expenditures and financial acquisitions).
Cash-generating units Measurement method Discount rates
Sita France DCF + confirmation by multiple (*) 5.6%
Sita News DCF + confirmation by multiple (*) 5.8%
United Water - regulated activity multiples (*) + DCF 5.2%
Agbar DCF + confirmation by multiple (*) 5.9%
Sita UK DCF + confirmation by multiple (*) 6.1%
Lyonnaise des Eaux DCF + confirmation by multiple (*) 5.1%
Sita Waste Services DCF + confirmation by multiple (*) 6.7%
Sita Australia DCF + confirmation by multiple (*) 7.1%
(*) valuation multiples of comparable entities: market value of transactions

46
9.4 Sensitivity to interest rate and operational assumptions
A change of 50 basis points upward or downward in the discount rate or growth rate of normalized Free Cash Flow does not affect the
recoverable amounts of goodwill CGUs, which remain higher than their book values.
The table below shows the sensitivity of the measurements of recoverable value exceeding book value, in response to changes in
discount rates and growth rates:
Moreover, we have ensured that, in 2013, a reasonable decrease (equal to or less than 5%) of both cash flows during the medium-
term plan and of the terminal value does not call into question the goodwill values of the different significant CGUs.
9.5 Segment information
The carrying amount of goodwill can be analyzed by operating segment as follows:
(a) In 2013, the Water and Waste activities located in Central Europe, which were previously included in the International segment, were reclassified to
the Water Europe and Waste Europe segments. The 2012 data have been restated for comparison purposes (see Note 3.2).
The segment breakdown above is based on the operating segment of the acquired entity (and not on that of the acquirer).
- 50 pb + 50 pb - 50 pb + 50 pb
Sita France 35% -27% -23% 31%
Sita News 38% -29% -25% 33%
United Water - regulated activity 115% -72% -22% 36%
Agbar 62% -48% -42% 54%
Sita UK 54% -42% -34% 44%
Lyonnaise des Eaux 31% -22% -20% 27%
Sita Waste Services 32% -26% -21% 26%
Sita Australia 17% -14% -12% 14%
Impact in % on excess of recoverable value over book
value
Discount ratesGrowth rate of "normalized"
Free Cash Flow
In millions of euros Dec. 31, 2013 Dec. 31, 2012 (a)
Water Europe 838.7 843.1
Waste Europe 1,567.2 1,578.8
International 778.4 835.0
Other - -
Total 3,184.3 3,256.9
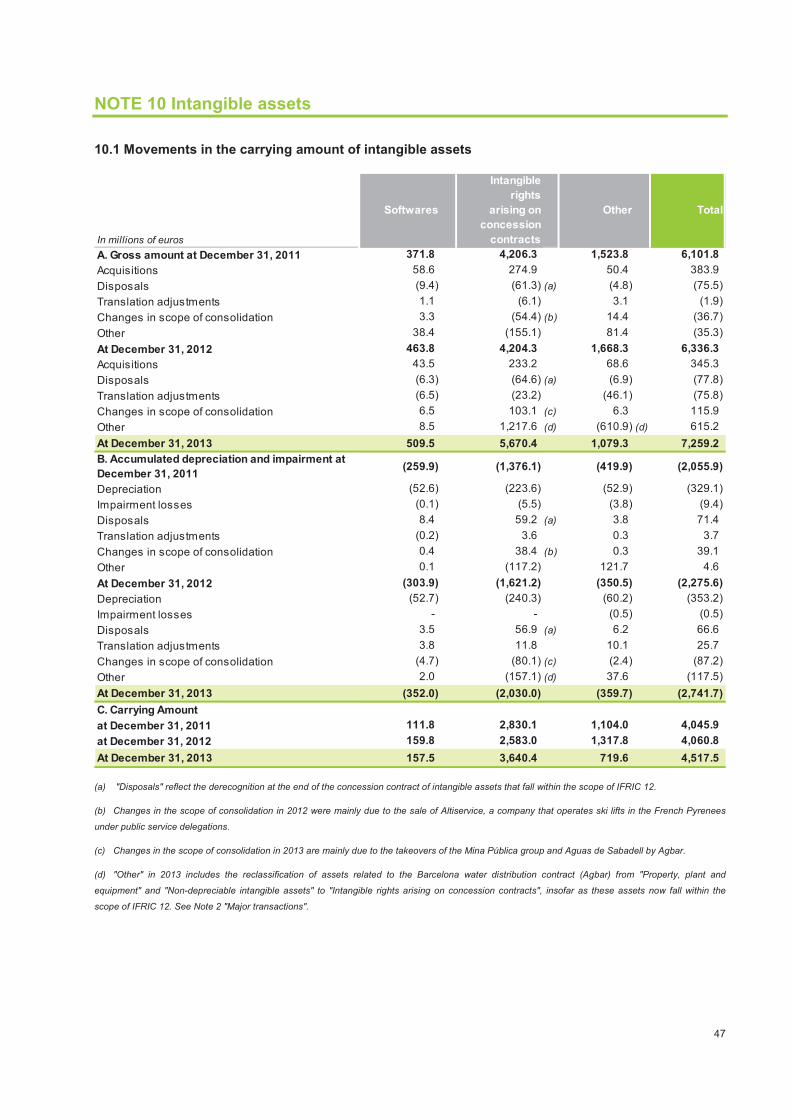
47
NOTE 10 Intangible assets
10.1 Movements in the carrying amount of intangible assets
(a) "Disposals" reflect the derecognition at the end of the concession contract of intangible assets that fall within the scope of IFRIC 12.
(b) Changes in the scope of consolidation in 2012 were mainly due to the sale of Altiservice, a company that operates ski lifts in the French Pyrenees
under public service delegations.
(c) Changes in the scope of consolidation in 2013 are mainly due to the takeovers of the Mina Pública group and Aguas de Sabadell by Agbar.
(d) "Other" in 2013 includes the reclassification of assets related to the Barcelona water distribution contract (Agbar) from "Property, plant and
equipment" and "Non-depreciable intangible assets" to "Intangible rights arising on concession contracts", insofar as these assets now fall within the
scope of IFRIC 12. See Note 2 "Major transactions".
In millions of euros
Softwares
Intangible
rights
arising on
concession
contracts
Other Total
A. Gross amount at December 31, 2011 371.8 4,206.3 1,523.8 6,101.8
Acquisitions 58.6 274.9 50.4 383.9
Disposals (9.4) (61.3) (a) (4.8) (75.5)
Translation adjustments 1.1 (6.1) 3.1 (1.9)
Changes in scope of consolidation 3.3 (54.4) (b) 14.4 (36.7)
Other 38.4 (155.1) 81.4 (35.3)
At December 31, 2012 463.8 4,204.3 1,668.3 6,336.3
Acquisitions 43.5 233.2 68.6 345.3
Disposals (6.3) (64.6) (a) (6.9) (77.8)
Translation adjustments (6.5) (23.2) (46.1) (75.8)
Changes in scope of consolidation 6.5 103.1 (c) 6.3 115.9
Other 8.5 1,217.6 (d) (610.9) (d) 615.2
At December 31, 2013 509.5 5,670.4 1,079.3 7,259.2
B. Accumulated depreciation and impairment at
December 31, 2011(259.9) (1,376.1) (419.9) (2,055.9)
Depreciation (52.6) (223.6) (52.9) (329.1)
Impairment losses (0.1) (5.5) (3.8) (9.4)
Disposals 8.4 59.2 (a) 3.8 71.4
Translation adjustments (0.2) 3.6 0.3 3.7
Changes in scope of consolidation 0.4 38.4 (b) 0.3 39.1
Other 0.1 (117.2) 121.7 4.6
At December 31, 2012 (303.9) (1,621.2) (350.5) (2,275.6)
Depreciation (52.7) (240.3) (60.2) (353.2)
Impairment losses - - (0.5) (0.5)
Disposals 3.5 56.9 (a) 6.2 66.6
Translation adjustments 3.8 11.8 10.1 25.7
Changes in scope of consolidation (4.7) (80.1) (c) (2.4) (87.2)
Other 2.0 (157.1) (d) 37.6 (117.5)
At December 31, 2013 (352.0) (2,030.0) (359.7) (2,741.7)
C. Carrying Amount
at December 31, 2011 111.8 2,830.1 1,104.0 4,045.9
at December 31, 2012 159.8 2,583.0 1,317.8 4,060.8
At December 31, 2013 157.5 3,640.4 719.6 4,517.5
48
10.1.1 Intangible rights arising on concession contracts
The Group manages a large number of concession contracts as defined by SIC 29 (see Note 20) in the drinking water distribution,
wastewater treatment, and waste management businesses. Infrastructure rights granted to the Group as concession operator, falling
within the scope of application of IFRIC 12, and corresponding to the intangible model, are recognized under this category. These
include the rights to charge users recognized under the intangible asset model in IFRIC 12.
10.1.2 Non-depreciable intangible assets
Non-depreciable intangible assets, mainly composed of water rights, amounted to €124 million as of December 31, 2013, versus €326
million as of December 31, 2012, and were included in the “Other” column.
The decrease corresponds mainly to fixed intangible assets under the Barcelona water distribution contract, which are now
amortizable. This is because, as part of Agbar's takeover of wastewater treatment activities in Barcelona, the initial water distribution
contract now has a fixed term of 35 years. See Note 2 "Major Transactions".
No significant impairment was posted in this asset category in 2013.
10.2 Information on research and development expenses
Research and development activities relate to various studies regarding technological innovation, improvements in plant efficiency,
safety, environmental protection and service quality.
Research and development activities that do not meet the assessment criteria defined in IAS 38 were posted to expenses in the
amount of €74 million, unchanged from 2012.
Expenses related to in-house projects in the development phase that meet the criteria for recognition as an intangible asset are not
material.
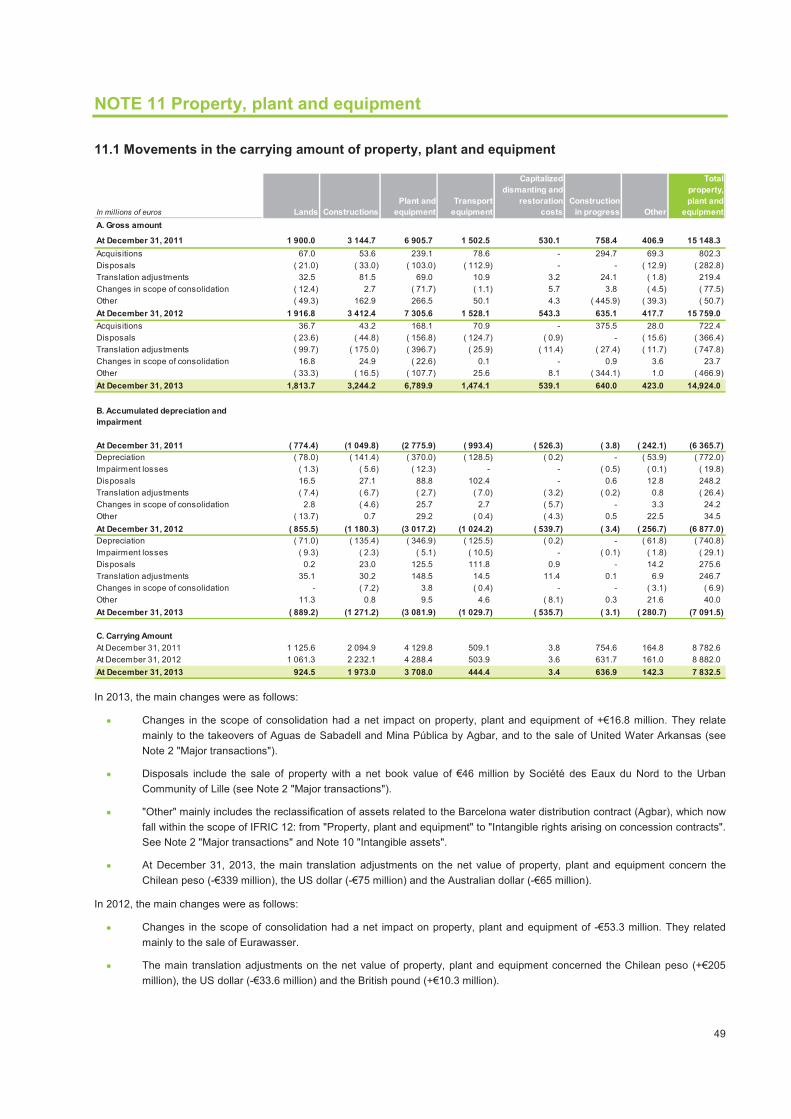
49
NOTE 11 Property, plant and equipment
11.1 Movements in the carrying amount of property, plant and equipment
In 2013, the main changes were as follows:
• Changes in the scope of consolidation had a net impact on property, plant and equipment of +€16.8 million. They relate
mainly to the takeovers of Aguas de Sabadell and Mina Pública by Agbar, and to the sale of United Water Arkansas (see
Note 2 "Major transactions").
• Disposals include the sale of property with a net book value of €46 million by Société des Eaux du Nord to the Urban
Community of Lille (see Note 2 "Major transactions").
• "Other" mainly includes the reclassification of assets related to the Barcelona water distribution contract (Agbar), which now
fall within the scope of IFRIC 12: from "Property, plant and equipment" to "Intangible rights arising on concession contracts".
See Note 2 "Major transactions" and Note 10 "Intangible assets".
• At December 31, 2013, the main translation adjustments on the net value of property, plant and equipment concern the
Chilean peso (-€339 million), the US dollar (-€75 million) and the Australian dollar (-€65 million).
In 2012, the main changes were as follows:
• Changes in the scope of consolidation had a net impact on property, plant and equipment of -€53.3 million. They related
mainly to the sale of Eurawasser.
• The main translation adjustments on the net value of property, plant and equipment concerned the Chilean peso (+€205
million), the US dollar (-€33.6 million) and the British pound (+€10.3 million).
In millions of euros Lands Constructions
Plant and
equipment
Transport
equipment
Capitalized
dismanting and
restoration
costs
Construction
in progress Other
Total
property,
plant and
equipment
A. Gross amount
At December 31, 2011 1 900.0 3 144.7 6 905.7 1 502.5 530.1 758.4 406.9 15 148.3
Acquisitions 67.0 53.6 239.1 78.6 - 294.7 69.3 802.3
Disposals ( 21.0) ( 33.0) ( 103.0) ( 112.9) - - ( 12.9) ( 282.8)
Translation adjustments 32.5 81.5 69.0 10.9 3.2 24.1 ( 1.8) 219.4
Changes in scope of consolidation ( 12.4) 2.7 ( 71.7) ( 1.1) 5.7 3.8 ( 4.5) ( 77.5)
Other ( 49.3) 162.9 266.5 50.1 4.3 ( 445.9) ( 39.3) ( 50.7)
At December 31, 2012 1 916.8 3 412.4 7 305.6 1 528.1 543.3 635.1 417.7 15 759.0
Acquisitions 36.7 43.2 168.1 70.9 - 375.5 28.0 722.4
Disposals ( 23.6) ( 44.8) ( 156.8) ( 124.7) ( 0.9) - ( 15.6) ( 366.4)
Translation adjustments ( 99.7) ( 175.0) ( 396.7) ( 25.9) ( 11.4) ( 27.4) ( 11.7) ( 747.8)
Changes in scope of consolidation 16.8 24.9 ( 22.6) 0.1 - 0.9 3.6 23.7
Other ( 33.3) ( 16.5) ( 107.7) 25.6 8.1 ( 344.1) 1.0 ( 466.9)
At December 31, 2013 1,813.7 3,244.2 6,789.9 1,474.1 539.1 640.0 423.0 14,924.0
B. Accumulated depreciation and
impairment
At December 31, 2011 ( 774.4) (1 049.8) (2 775.9) ( 993.4) ( 526.3) ( 3.8) ( 242.1) (6 365.7)
Depreciation ( 78.0) ( 141.4) ( 370.0) ( 128.5) ( 0.2) - ( 53.9) ( 772.0)
Impairment losses ( 1.3) ( 5.6) ( 12.3) - - ( 0.5) ( 0.1) ( 19.8)
Disposals 16.5 27.1 88.8 102.4 - 0.6 12.8 248.2
Translation adjustments ( 7.4) ( 6.7) ( 2.7) ( 7.0) ( 3.2) ( 0.2) 0.8 ( 26.4)
Changes in scope of consolidation 2.8 ( 4.6) 25.7 2.7 ( 5.7) - 3.3 24.2
Other ( 13.7) 0.7 29.2 ( 0.4) ( 4.3) 0.5 22.5 34.5
At December 31, 2012 ( 855.5) (1 180.3) (3 017.2) (1 024.2) ( 539.7) ( 3.4) ( 256.7) (6 877.0)
Depreciation ( 71.0) ( 135.4) ( 346.9) ( 125.5) ( 0.2) - ( 61.8) ( 740.8)
Impairment losses ( 9.3) ( 2.3) ( 5.1) ( 10.5) - ( 0.1) ( 1.8) ( 29.1)
Disposals 0.2 23.0 125.5 111.8 0.9 - 14.2 275.6
Translation adjustments 35.1 30.2 148.5 14.5 11.4 0.1 6.9 246.7
Changes in scope of consolidation - ( 7.2) 3.8 ( 0.4) - - ( 3.1) ( 6.9)
Other 11.3 0.8 9.5 4.6 ( 8.1) 0.3 21.6 40.0
At December 31, 2013 ( 889.2) (1 271.2) (3 081.9) (1 029.7) ( 535.7) ( 3.1) ( 280.7) (7 091.5)
C. Carrying Amount
At December 31, 2011 1 125.6 2 094.9 4 129.8 509.1 3.8 754.6 164.8 8 782.6
At December 31, 2012 1 061.3 2 232.1 4 288.4 503.9 3.6 631.7 161.0 8 882.0
At December 31, 2013 924.5 1 973.0 3 708.0 444.4 3.4 636.9 142.3 7 832.5
50
11.2 Pledged and mortgaged assets
Assets pledged and mortgaged as collateral for borrowings amounted to €150 million at December 31, 2013 against €157.4 million at
December 31, 2012.
11.3 Contractual commitments for the acquisition of property, plant and equipment
In the course of ordinary operations, some Group companies also entered into commitments to invest in technical facilities, with a
corresponding commitment by related third parties to deliver these facilities.
The Group’s contractual commitments for property, plant and equipment amounted to €323.5 million at December 31, 2013, against
€468.3 million at December 31, 2012. This change is mainly due to the €124.8 million reduction in Sita UK's commitments for
property, plant and equipment due to the completion of the construction works of various projects.
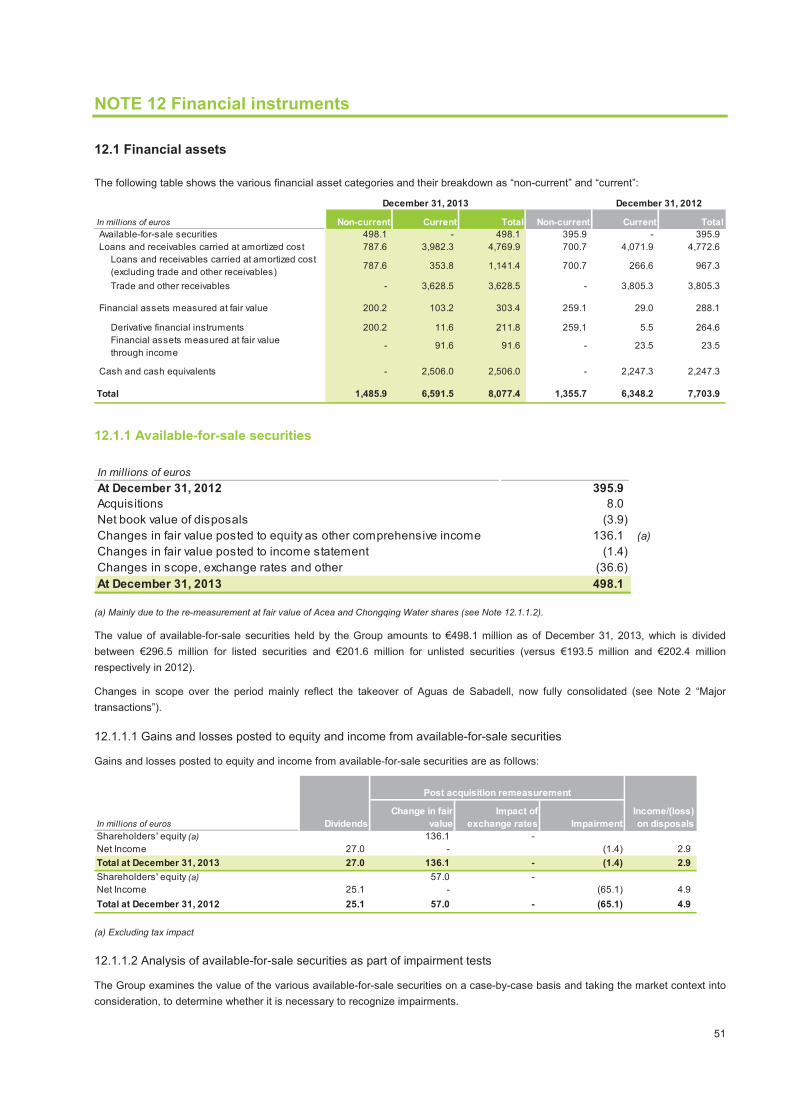
51
NOTE 12 Financial instruments
12.1 Financial assets
The following table shows the various financial asset categories and their breakdown as “non-current” and “current”:
12.1.1 Available-for-sale securities
(a) Mainly due to the re-measurement at fair value of Acea and Chongqing Water shares (see Note 12.1.1.2).
The value of available-for-sale securities held by the Group amounts to €498.1 million as of December 31, 2013, which is divided
between €296.5 million for listed securities and €201.6 million for unlisted securities (versus €193.5 million and €202.4 million
respectively in 2012).
Changes in scope over the period mainly reflect the takeover of Aguas de Sabadell, now fully consolidated (see Note 2 “Major
transactions”).
12.1.1.1 Gains and losses posted to equity and income from available-for-sale securities
Gains and losses posted to equity and income from available-for-sale securities are as follows:
(a) Excluding tax impact
12.1.1.2 Analysis of available-for-sale securities as part of impairment tests
The Group examines the value of the various available-for-sale securities on a case-by-case basis and taking the market context into
consideration, to determine whether it is necessary to recognize impairments.
December 31, 2013 December 31, 2012
In millions of euros Non-current Current Total Non-current Current Total
Available-for-sale securities 498.1 - 498.1 395.9 - 395.9
Loans and receivables carried at amortized cost 787.6 3,982.3 4,769.9 700.7 4,071.9 4,772.6
Loans and receivables carried at amortized cost
(excluding trade and other receivables) 787.6 353.8 1,141.4 700.7 266.6 967.3
Trade and other receivables - 3,628.5 3,628.5 - 3,805.3 3,805.3
Financial assets measured at fair value 200.2 103.2 303.4 259.1 29.0 288.1
Derivative financial instruments 200.2 11.6 211.8 259.1 5.5 264.6
Financial assets measured at fair value
through income- 91.6 91.6 - 23.5 23.5
Cash and cash equivalents - 2,506.0 2,506.0 - 2,247.3 2,247.3
Total 1,485.9 6,591.5 8,077.4 1,355.7 6,348.2 7,703.9
In millions of euros
At December 31, 2012 395.9
Acquisitions 8.0
Net book value of disposals (3.9)
Changes in fair value posted to equity as other comprehensive income 136.1 (a)
Changes in fair value posted to income statement (1.4)
Changes in scope, exchange rates and other (36.6)
At December 31, 2013 498.1
In millions of euros Dividends
Change in fair
value
Impact of
exchange rates Impairment
Income/(loss)
on disposals
Shareholders' equity (a) 136.1 -
Net Income 27.0 - (1.4) 2.9
Total at December 31, 2013 27.0 136.1 - (1.4) 2.9
Shareholders' equity (a) 57.0 -
Net Income 25.1 - (65.1) 4.9
Total at December 31, 2012 25.1 57.0 - (65.1) 4.9
Post acquisition remeasurement
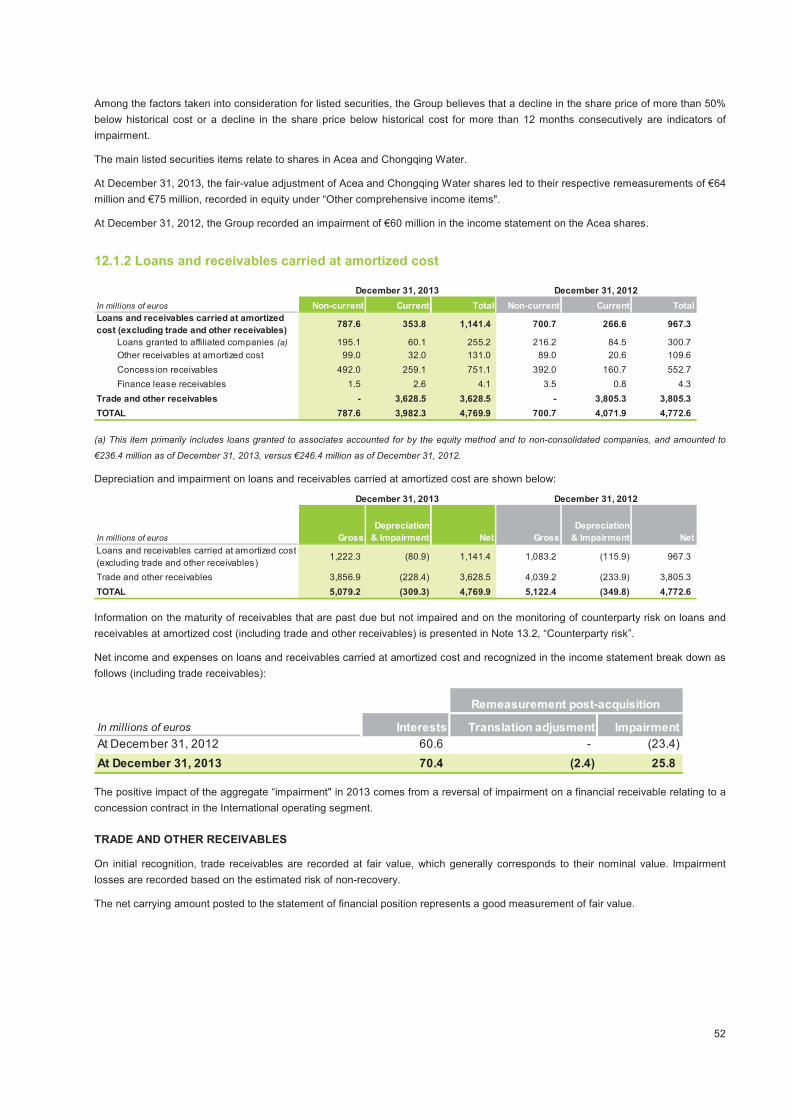
52
Among the factors taken into consideration for listed securities, the Group believes that a decline in the share price of more than 50%
below historical cost or a decline in the share price below historical cost for more than 12 months consecutively are indicators of
impairment.
The main listed securities items relate to shares in Acea and Chongqing Water.
At December 31, 2013, the fair-value adjustment of Acea and Chongqing Water shares led to their respective remeasurements of €64
million and €75 million, recorded in equity under “Other comprehensive income items".
At December 31, 2012, the Group recorded an impairment of €60 million in the income statement on the Acea shares.
12.1.2 Loans and receivables carried at amortized cost
(a) This item primarily includes loans granted to associates accounted for by the equity method and to non-consolidated companies, and amounted to
€236.4 million as of December 31, 2013, versus €246.4 million as of December 31, 2012.
Depreciation and impairment on loans and receivables carried at amortized cost are shown below:
Information on the maturity of receivables that are past due but not impaired and on the monitoring of counterparty risk on loans and
receivables at amortized cost (including trade and other receivables) is presented in Note 13.2, “Counterparty risk”.
Net income and expenses on loans and receivables carried at amortized cost and recognized in the income statement break down as
follows (including trade receivables):
The positive impact of the aggregate “impairment" in 2013 comes from a reversal of impairment on a financial receivable relating to a
concession contract in the International operating segment.
TRADE AND OTHER RECEIVABLES
On initial recognition, trade receivables are recorded at fair value, which generally corresponds to their nominal value. Impairment
losses are recorded based on the estimated risk of non-recovery.
The net carrying amount posted to the statement of financial position represents a good measurement of fair value.
December 31, 2013 December 31, 2012
In millions of euros Non-current Current Total Non-current Current Total
Loans and receivables carried at amortized
cost (excluding trade and other receivables)787.6 353.8 1,141.4 700.7 266.6 967.3
Loans granted to affiliated companies (a) 195.1 60.1 255.2 216.2 84.5 300.7
Other receivables at amortized cost 99.0 32.0 131.0 89.0 20.6 109.6
Concession receivables 492.0 259.1 751.1 392.0 160.7 552.7
Finance lease receivables 1.5 2.6 4.1 3.5 0.8 4.3
Trade and other receivables - 3,628.5 3,628.5 - 3,805.3 3,805.3
TOTAL 787.6 3,982.3 4,769.9 700.7 4,071.9 4,772.6
December 31, 2013 December 31, 2012
In millions of euros Gross
Depreciation
& Impairment Net Gross
Depreciation
& Impairment Net
Loans and receivables carried at amortized cost
(excluding trade and other receivables)1,222.3 (80.9) 1,141.4 1,083.2 (115.9) 967.3
Trade and other receivables 3,856.9 (228.4) 3,628.5 4,039.2 (233.9) 3,805.3
TOTAL 5,079.2 (309.3) 4,769.9 5,122.4 (349.8) 4,772.6
In millions of euros Interests Translation adjusment Impairment
At December 31, 2012 60.6 - (23.4)
At December 31, 2013 70.4 (2.4) 25.8
Remeasurement post-acquisition
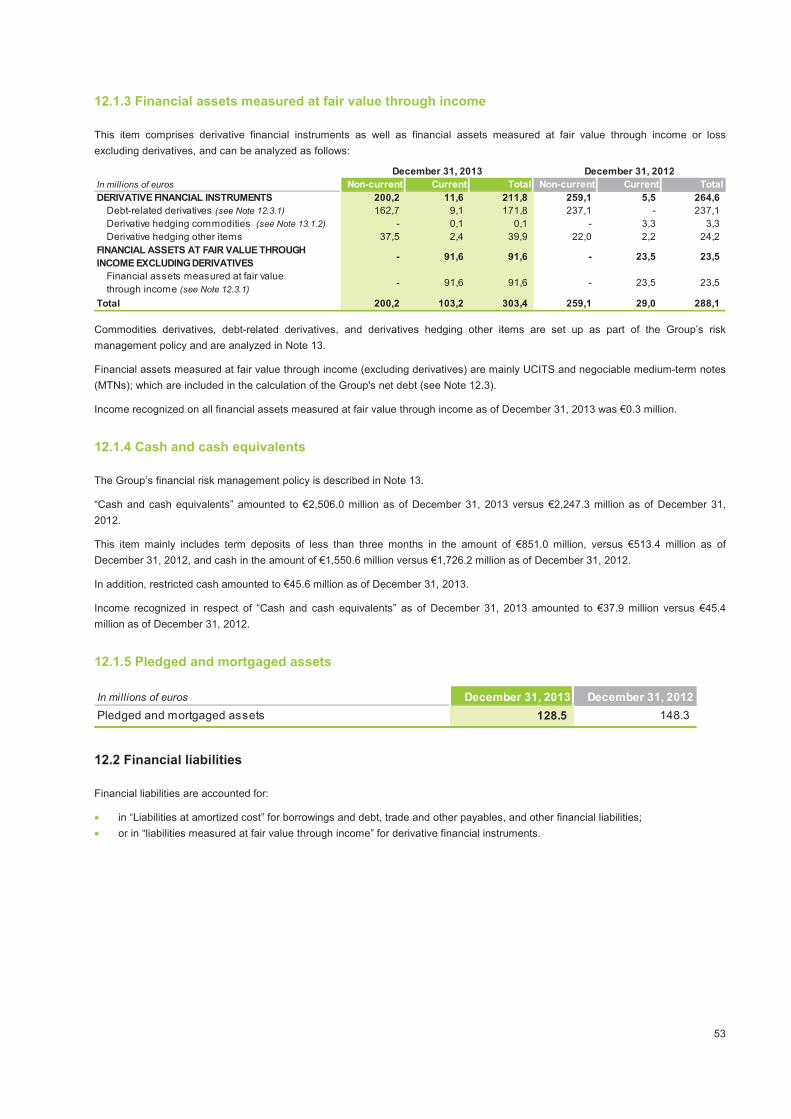
53
12.1.3 Financial assets measured at fair value through income
This item comprises derivative financial instruments as well as financial assets measured at fair value through income or loss
excluding derivatives, and can be analyzed as follows:
Commodities derivatives, debt-related derivatives, and derivatives hedging other items are set up as part of the Group’s risk
management policy and are analyzed in Note 13.
Financial assets measured at fair value through income (excluding derivatives) are mainly UCITS and negociable medium-term notes
(MTNs); which are included in the calculation of the Group's net debt (see Note 12.3).
Income recognized on all financial assets measured at fair value through income as of December 31, 2013 was €0.3 million.
12.1.4 Cash and cash equivalents
The Group’s financial risk management policy is described in Note 13.
“Cash and cash equivalents” amounted to €2,506.0 million as of December 31, 2013 versus €2,247.3 million as of December 31,
2012.
This item mainly includes term deposits of less than three months in the amount of €851.0 million, versus €513.4 million as of
December 31, 2012, and cash in the amount of €1,550.6 million versus €1,726.2 million as of December 31, 2012.
In addition, restricted cash amounted to €45.6 million as of December 31, 2013.
Income recognized in respect of “Cash and cash equivalents” as of December 31, 2013 amounted to €37.9 million versus €45.4
million as of December 31, 2012.
12.1.5 Pledged and mortgaged assets
12.2 Financial liabilities
Financial liabilities are accounted for:
• in “Liabilities at amortized cost” for borrowings and debt, trade and other payables, and other financial liabilities;
• or in “liabilities measured at fair value through income” for derivative financial instruments.
December 31, 2013 December 31, 2012
In millions of euros Non-current Current Total Non-current Current Total
DERIVATIVE FINANCIAL INSTRUMENTS 200,2 11,6 211,8 259,1 5,5 264,6
Debt-related derivatives (see Note 12.3.1) 162,7 9,1 171,8 237,1 - 237,1
Derivative hedging commodities (see Note 13.1.2) - 0,1 0,1 - 3,3 3,3
Derivative hedging other items 37,5 2,4 39,9 22,0 2,2 24,2
FINANCIAL ASSETS AT FAIR VALUE THROUGH
INCOME EXCLUDING DERIVATIVES- 91,6 91,6 - 23,5 23,5
Financial assets measured at fair value
through income (see Note 12.3.1)- 91,6 91,6 - 23,5 23,5
Total 200,2 103,2 303,4 259,1 29,0 288,1
In millions of euros December 31, 2013 December 31, 2012
Pledged and mortgaged assets 128.5 148.3
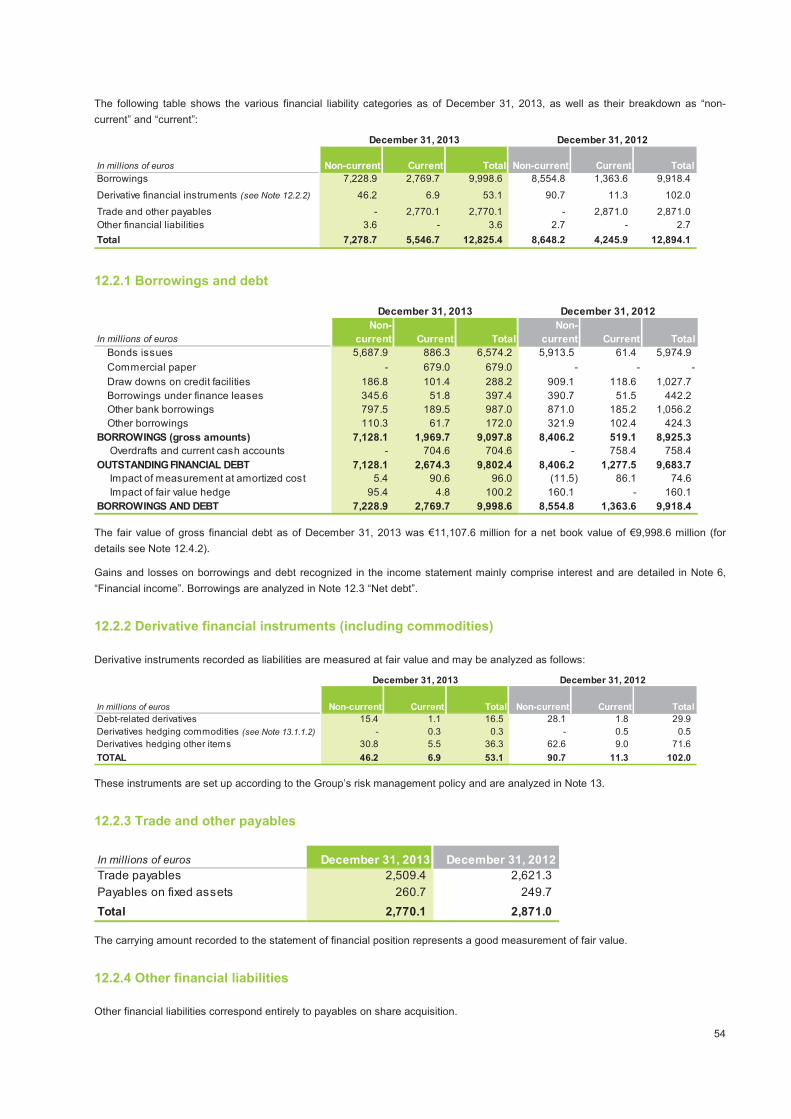
54
The following table shows the various financial liability categories as of December 31, 2013, as well as their breakdown as “non-
current” and “current”:
12.2.1 Borrowings and debt
The fair value of gross financial debt as of December 31, 2013 was €11,107.6 million for a net book value of €9,998.6 million (for
details see Note 12.4.2).
Gains and losses on borrowings and debt recognized in the income statement mainly comprise interest and are detailed in Note 6,
“Financial income”. Borrowings are analyzed in Note 12.3 “Net debt”.
12.2.2 Derivative financial instruments (including commodities)
Derivative instruments recorded as liabilities are measured at fair value and may be analyzed as follows:
These instruments are set up according to the Group’s risk management policy and are analyzed in Note 13.
12.2.3 Trade and other payables
The carrying amount recorded to the statement of financial position represents a good measurement of fair value.
12.2.4 Other financial liabilities
Other financial liabilities correspond entirely to payables on share acquisition.
December 31, 2013 December 31, 2012
In millions of euros Non-current Current Total Non-current Current Total
Borrowings 7,228.9 2,769.7 9,998.6 8,554.8 1,363.6 9,918.4
Derivative financial instruments (see Note 12.2.2) 46.2 6.9 53.1 90.7 11.3 102.0
Trade and other payables - 2,770.1 2,770.1 - 2,871.0 2,871.0
Other financial liabilities 3.6 - 3.6 2.7 - 2.7
Total 7,278.7 5,546.7 12,825.4 8,648.2 4,245.9 12,894.1
December 31, 2013 December 31, 2012
In millions of euros
Non-
current Current Total
Non-
current Current Total
Bonds issues 5,687.9 886.3 6,574.2 5,913.5 61.4 5,974.9
Commercial paper - 679.0 679.0 - - -
Draw downs on credit facilities 186.8 101.4 288.2 909.1 118.6 1,027.7
Borrowings under finance leases 345.6 51.8 397.4 390.7 51.5 442.2
Other bank borrowings 797.5 189.5 987.0 871.0 185.2 1,056.2
Other borrowings 110.3 61.7 172.0 321.9 102.4 424.3
BORROWINGS (gross amounts) 7,128.1 1,969.7 9,097.8 8,406.2 519.1 8,925.3
Overdrafts and current cash accounts - 704.6 704.6 - 758.4 758.4
OUTSTANDING FINANCIAL DEBT 7,128.1 2,674.3 9,802.4 8,406.2 1,277.5 9,683.7
Impact of measurement at amortized cost 5.4 90.6 96.0 (11.5) 86.1 74.6
Impact of fair value hedge 95.4 4.8 100.2 160.1 - 160.1
BORROWINGS AND DEBT 7,228.9 2,769.7 9,998.6 8,554.8 1,363.6 9,918.4
December 31, 2013 December 31, 2012
In millions of euros Non-current Current Total Non-current Current Total
Debt-related derivatives 15.4 1.1 16.5 28.1 1.8 29.9
Derivatives hedging commodities (see Note 13.1.1.2) - 0.3 0.3 - 0.5 0.5
Derivatives hedging other items 30.8 5.5 36.3 62.6 9.0 71.6
TOTAL 46.2 6.9 53.1 90.7 11.3 102.0
In millions of euros December 31, 2013 December 31, 2012
Trade payables 2,509.4 2,621.3
Payables on fixed assets 260.7 249.7
Total 2,770.1 2,871.0
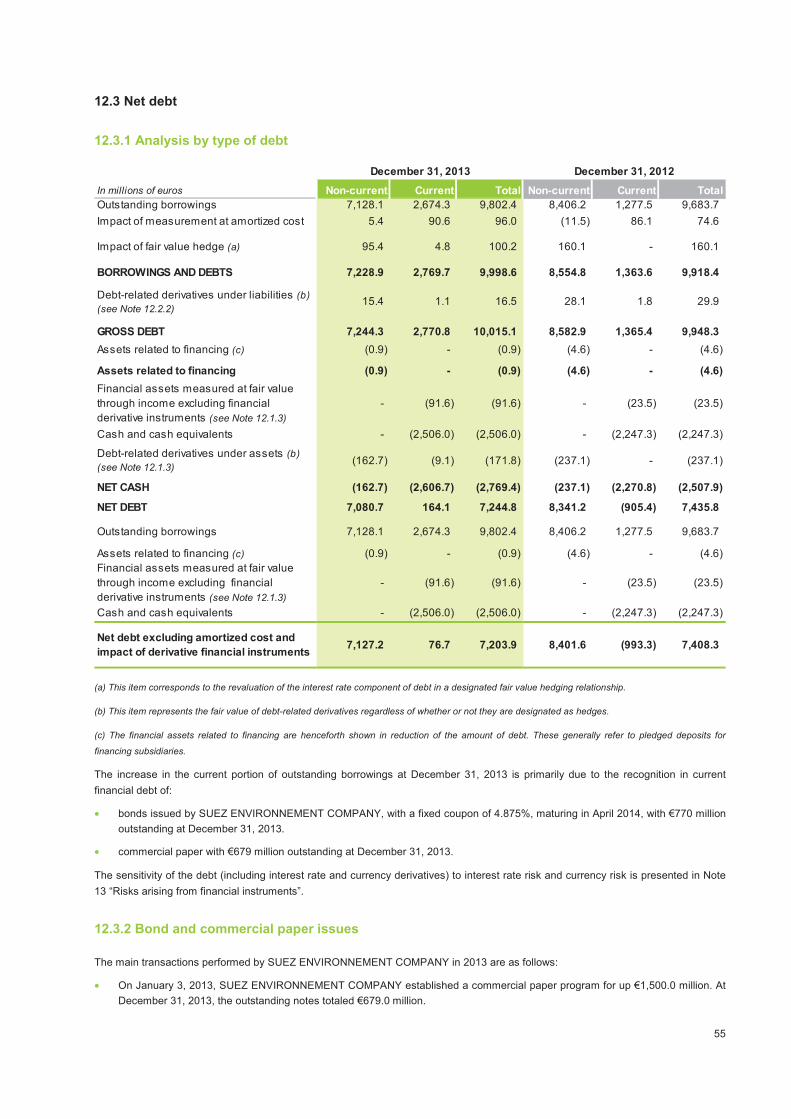
55
12.3 Net debt
12.3.1 Analysis by type of debt
(a) This item corresponds to the revaluation of the interest rate component of debt in a designated fair value hedging relationship.
(b) This item represents the fair value of debt-related derivatives regardless of whether or not they are designated as hedges.
(c) The financial assets related to financing are henceforth shown in reduction of the amount of debt. These generally refer to pledged deposits for
financing subsidiaries.
The increase in the current portion of outstanding borrowings at December 31, 2013 is primarily due to the recognition in current
financial debt of:
• bonds issued by SUEZ ENVIRONNEMENT COMPANY, with a fixed coupon of 4.875%, maturing in April 2014, with €770 million
outstanding at December 31, 2013.
• commercial paper with €679 million outstanding at December 31, 2013.
The sensitivity of the debt (including interest rate and currency derivatives) to interest rate risk and currency risk is presented in Note
13 “Risks arising from financial instruments”.
12.3.2 Bond and commercial paper issues
The main transactions performed by SUEZ ENVIRONNEMENT COMPANY in 2013 are as follows:
• On January 3, 2013, SUEZ ENVIRONNEMENT COMPANY established a commercial paper program for up €1,500.0 million. At
December 31, 2013, the outstanding notes totaled €679.0 million.
December 31, 2013 December 31, 2012
In millions of euros Non-current Current Total Non-current Current Total
Outstanding borrowings 7,128.1 2,674.3 9,802.4 8,406.2 1,277.5 9,683.7
Impact of measurement at amortized cost 5.4 90.6 96.0 (11.5) 86.1 74.6
Impact of fair value hedge (a) 95.4 4.8 100.2 160.1 - 160.1
BORROWINGS AND DEBTS 7,228.9 2,769.7 9,998.6 8,554.8 1,363.6 9,918.4
Debt-related derivatives under liabilities (b)
(see Note 12.2.2)15.4 1.1 16.5 28.1 1.8 29.9
GROSS DEBT 7,244.3 2,770.8 10,015.1 8,582.9 1,365.4 9,948.3
Assets related to financing (c) (0.9) - (0.9) (4.6) - (4.6)
Assets related to financing (0.9) - (0.9) (4.6) - (4.6)
Financial assets measured at fair value
through income excluding financial
derivative instruments (see Note 12.1.3)
- (91.6) (91.6) - (23.5) (23.5)
Cash and cash equivalents - (2,506.0) (2,506.0) - (2,247.3) (2,247.3)
Debt-related derivatives under assets (b)
(see Note 12.1.3)(162.7) (9.1) (171.8) (237.1) - (237.1)
NET CASH (162.7) (2,606.7) (2,769.4) (237.1) (2,270.8) (2,507.9)
NET DEBT 7,080.7 164.1 7,244.8 8,341.2 (905.4) 7,435.8
Outstanding borrowings 7,128.1 2,674.3 9,802.4 8,406.2 1,277.5 9,683.7
Assets related to financing (c) (0.9) - (0.9) (4.6) - (4.6)
Financial assets measured at fair value
through income excluding financial
derivative instruments (see Note 12.1.3)
- (91.6) (91.6) - (23.5) (23.5)
Cash and cash equivalents - (2,506.0) (2,506.0) - (2,247.3) (2,247.3)
Net debt excluding amortized cost and
impact of derivative financial instruments7,127.2 76.7 7,203.9 8,401.6 (993.3) 7,408.3
56
• Commercial paper is recognized as current financial debt. However, the Group’s policy is to back all commercial paper by
available credit lines. Thus, the refinancing of commercial paper is guaranteed even in case of closure of the money market.
• At December 31, 2013, outstanding commercial paper was entirely covered by confirmed available for more than one year credit
lines.
• In October 2013, SUEZ ENVIRONNEMENT COMPANY also carried out a €500 million bond issue with a coupon of 2.75%
maturing in 2023.
12.3.3 Securitization of receivables
Context
Since 2002, SUEZ ENVIRONNEMENT has implemented a program for the sales of commercial receivables to a special purpose
vehicle (SPV) called “Fonds Commun de Créances”. The receivables transferred related to invoices linked to the Waste Europe
activity in France, Belgium (exit from the program on November 25, 2013) and the Netherlands.
This program had a 5-year initial duration and was renewed in 2007 for 5 additional years that ended June 18, 2012.
The risks associated with securitized receivables, mainly credit risk and the risk of late payment, were retained by the Group.
Consequently, the receivables sold could not be derecognized in the sense of IAS 39 (Financial Instruments: Recognition and
Measurement) and were maintained on the consolidated statement of financial position. Sums received for the sales were therefore
entered against a debt on the Group's consolidated statement of financial position.
Description of the program
The program ending June 18, 2012 was renewed for 5-year duration and modified in order to set up conditions allowing for
derecognition of the receivables under IAS 39.
The main characteristics of the program are as follows:
(a) a new SPV was created, called “Fonds Commun de Titrisation” (or FCT) to replace the previous one;
(b) the preexisting securitization program was subject to a “simple” renewal;
(c) a compartment dedicated to the Group’s receivables was created within the FCT;
(d) on the implementation date, part of receivables from the former securitization program were transferred to the new
compartment; the other part continued to fund the former SPV compartment and switched in November 2012 (with the
exception of Belgium, which continued to fund the former program until November 25, 2013);
(e) the FCT used in the program is financing the new compartment by issuing 3 types of instruments:
• shares known as “senior”, issued on the markets through a dedicated channel;
• a deposit known as “mezzanine”, underwritten by the Group;
• shares known as “subordinated”, underwritten by an investor taking part in the program and with contracted
involvement with the Group.
(f) these shares are presented here in order of payment priority related to each other; the senior shares are therefore the first
to be reimbursed and the subordinated shares are the last.
(g) the Group subsidiaries involved remain in charge of recovering the receivables transferred against remuneration.
The sales of receivables are made by Group subsidiaries at their nominal value, minus a discount that covers the cost of financing the
receivables, the risk of late payment and the credit risk.
The main commitments of the Group towards the securitization fund are the following:
(h) set-up of a security deposit for the compartment, earning interest, and designed to cover, if the FCT reserves and the
“subordinated” shares ever came to run out, any defaults and late payments on transferred receivables exceeding the
amount estimated during the transfer and invoiced through the discount applied to the transfer price, to a set maximum limit
(Cash Collateral 1 or CC1); this deposit is effective from the launch of the program and corresponds to the “mezzanine”
deposit presented above;
(i) set-up of a security deposit for the compartment, earning interest, and designed to preserve the correct execution of all
financial obligations of Group entities party to the program, to a set maximum limit (Cash Collateral 2 or CC2); this deposit is
only effective if certain events or triggers occur linked to the downgrading of SUEZ ENVIRONNEMENT COMPANY or to the
57
non-respect by the Group of its contractual obligations. At December 31, 2013, this security deposit had not yet been
formed.
(j) existence of a mechanism known as “excess fee” through which, in certain cases, the FCT can give back part of the excess
cash accumulated in the compartment when recovering receivables (transferred at discount prices). This mechanism
corresponds to a part of the remuneration of Group subsidiaries for collecting receivables (see below);
(k) an option, for all Group subsidiaries, to jointly request buyback at fair value of the receivables held by the compartment in a
single and unique transaction, in case of program amortization, planned (with a 5-year term), or accelerated, and after
agreement with the holders of “subordinated” shares. To date, accelerated amortization of the program is not expected
before its maturity date;
(l) issue of a guarantee for the risk of modification of tax rules;
(m) preservation by each Group subsidiary of the follow-up and collection of receivables that it has transferred to the
compartment; to this effect, a follow-up and collection agreement was signed by each of the subsidiaries acting as collector
and by the compartment, this service being remunerated by FCT.
The Group remains exposed to the risks linked to the receivables transferred within the limit of the security deposits. It also receives
part of the benefits from the FCT via the collection of an excess fee in its role as servicer.
However, the discount applied to the sales and the sizing of the “subordinated” shares allow almost all possible losses of the
compartment to be absorbed. The probability that the “mezzanine” deposit is impacted is very low. Finally, the holders of the
“subordinated” shares benefit from almost all the advantages through excess fees more favorable than those attributable to the
Group, and the granting of the liquidation profit.
Accounting treatment
The new compartment of the FCT is not controlled by the Group and is therefore not consolidated.
According to IAS 39 and based on the terms of the new program and the quantitative analyses implemented, the Group transferred
almost all the risks and rewards inherent to the ownership of the receivables sold. The receivables transferred within the scope of the
new program are therefore fully derecognized from the Group’s consolidated statement of financial position.
The loss arising from the sale of these receivables, through the applied discount, is recorded in the income statement under financial
expenses (see Note 6).
The security deposit paid and representing the “mezzanine” shares underwritten by the Group is recorded under the item “Loans and
receivables carried at amortized cost” on the Group’s consolidated statement of financial position. Its remuneration is recorded in the
income statement under financial income (see Note 6).
The remuneration of services provided by the group for follow-up and recovery of receivables transferred is shown in the income
statement under financial income (see Note 6).
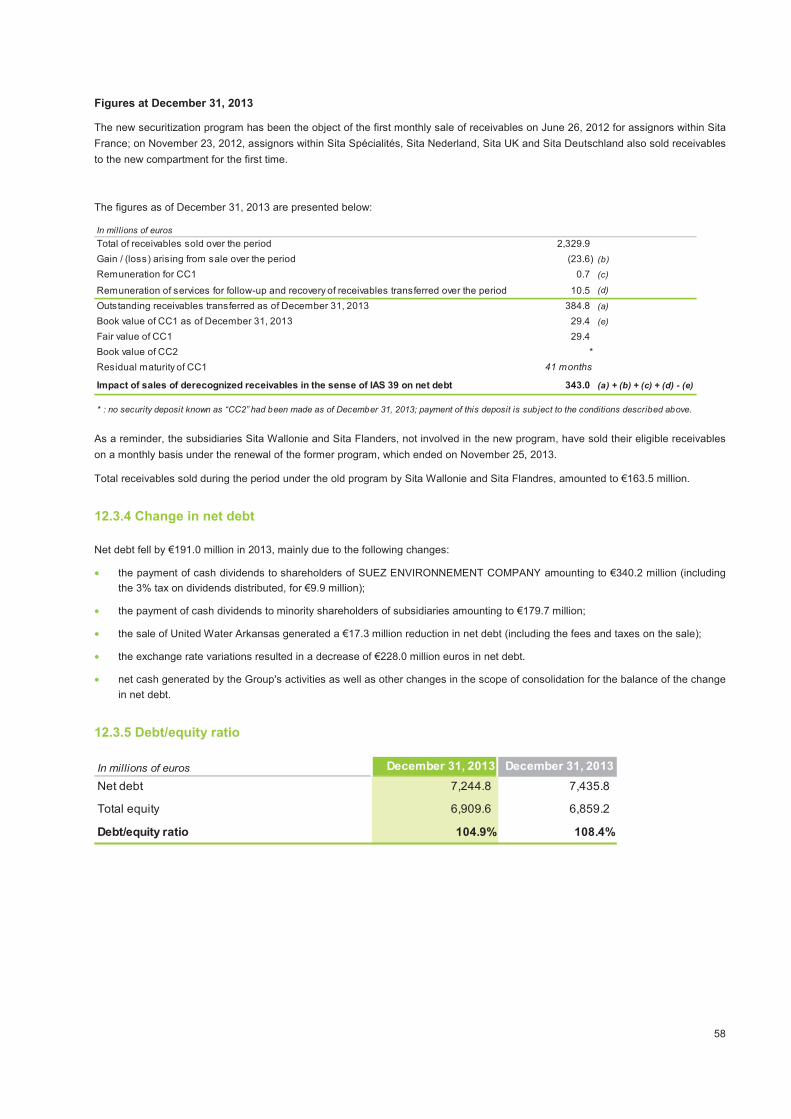
58
Figures at December 31, 2013
The new securitization program has been the object of the first monthly sale of receivables on June 26, 2012 for assignors within Sita
France; on November 23, 2012, assignors within Sita Spécialités, Sita Nederland, Sita UK and Sita Deutschland also sold receivables
to the new compartment for the first time.�
The figures as of December 31, 2013 are presented below:
�
As a reminder, the subsidiaries Sita Wallonie and Sita Flanders, not involved in the new program, have sold their eligible receivables
on a monthly basis under the renewal of the former program, which ended on November 25, 2013.
Total receivables sold during the period under the old program by Sita Wallonie and Sita Flandres, amounted to €163.5 million.�
12.3.4 Change in net debt
Net debt fell by €191.0 million in 2013, mainly due to the following changes:
• the payment of cash dividends to shareholders of SUEZ ENVIRONNEMENT COMPANY amounting to €340.2 million (including
the 3% tax on dividends distributed, for €9.9 million);
• the payment of cash dividends to minority shareholders of subsidiaries amounting to €179.7 million;
• the sale of United Water Arkansas generated a €17.3 million reduction in net debt (including the fees and taxes on the sale);
• the exchange rate variations resulted in a decrease of €228.0 million euros in net debt.
• net cash generated by the Group's activities as well as other changes in the scope of consolidation for the balance of the change
in net debt.
12.3.5 Debt/equity ratio
In millions of euros
Total of receivables sold over the period 2,329.9
Gain / (loss) arising from sale over the period (23.6) (b)
Remuneration for CC1 0.7 (c)
Remuneration of services for follow-up and recovery of receivables transferred over the period 10.5 (d)
Outstanding receivables transferred as of December 31, 2013 384.8 (a)
Book value of CC1 as of December 31, 2013 29.4 (e)
Fair value of CC1 29.4
Book value of CC2 *
Residual maturity of CC1 41 months
Impact of sales of derecognized receivables in the sense of IAS 39 on net debt 343.0 (a) + (b) + (c) + (d) - (e)
* : no security deposit known as “CC2” had been made as of December 31, 2013; payment of this deposit is subject to the conditions described above.
In millions of euros December 31, 2013 December 31, 2013
Net debt 7,244.8 7,435.8
Total equity 6,909.6 6,859.2
Debt/equity ratio 104.9% 108.4%
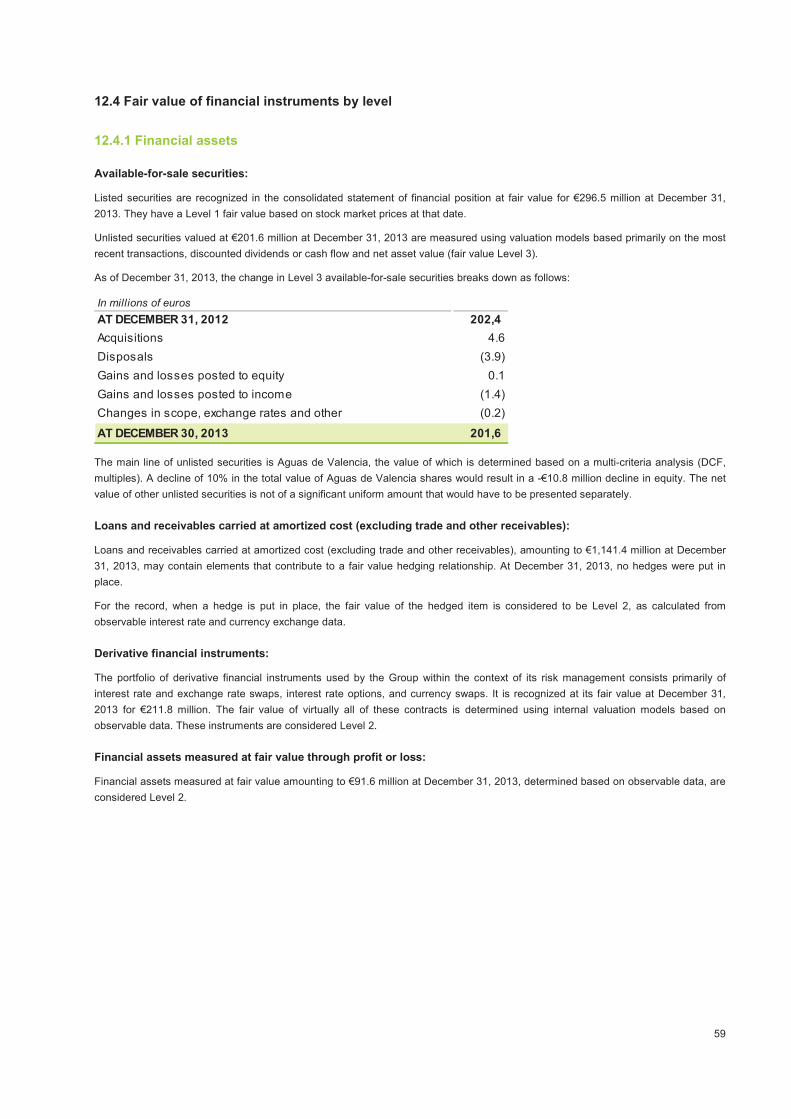
59
12.4 Fair value of financial instruments by level
12.4.1 Financial assets
Available-for-sale securities:
Listed securities are recognized in the consolidated statement of financial position at fair value for €296.5 million at December 31,
2013. They have a Level 1 fair value based on stock market prices at that date.
Unlisted securities valued at €201.6 million at December 31, 2013 are measured using valuation models based primarily on the most
recent transactions, discounted dividends or cash flow and net asset value (fair value Level 3).
As of December 31, 2013, the change in Level 3 available-for-sale securities breaks down as follows:
The main line of unlisted securities is Aguas de Valencia, the value of which is determined based on a multi-criteria analysis (DCF,
multiples). A decline of 10% in the total value of Aguas de Valencia shares would result in a -€10.8 million decline in equity. The net
value of other unlisted securities is not of a significant uniform amount that would have to be presented separately.
Loans and receivables carried at amortized cost (excluding trade and other receivables):
Loans and receivables carried at amortized cost (excluding trade and other receivables), amounting to €1,141.4 million at December
31, 2013, may contain elements that contribute to a fair value hedging relationship. At December 31, 2013, no hedges were put in
place.
For the record, when a hedge is put in place, the fair value of the hedged item is considered to be Level 2, as calculated from
observable interest rate and currency exchange data.
Derivative financial instruments:
The portfolio of derivative financial instruments used by the Group within the context of its risk management consists primarily of
interest rate and exchange rate swaps, interest rate options, and currency swaps. It is recognized at its fair value at December 31,
2013 for €211.8 million. The fair value of virtually all of these contracts is determined using internal valuation models based on
observable data. These instruments are considered Level 2.
Financial assets measured at fair value through profit or loss:
Financial assets measured at fair value amounting to €91.6 million at December 31, 2013, determined based on observable data, are
considered Level 2.
In millions of euros
AT DECEMBER 31, 2012 202,4
Acquisitions 4.6
Disposals (3.9)
Gains and losses posted to equity 0.1
Gains and losses posted to income (1.4)
Changes in scope, exchange rates and other (0.2)
AT DECEMBER 30, 2013 201,6
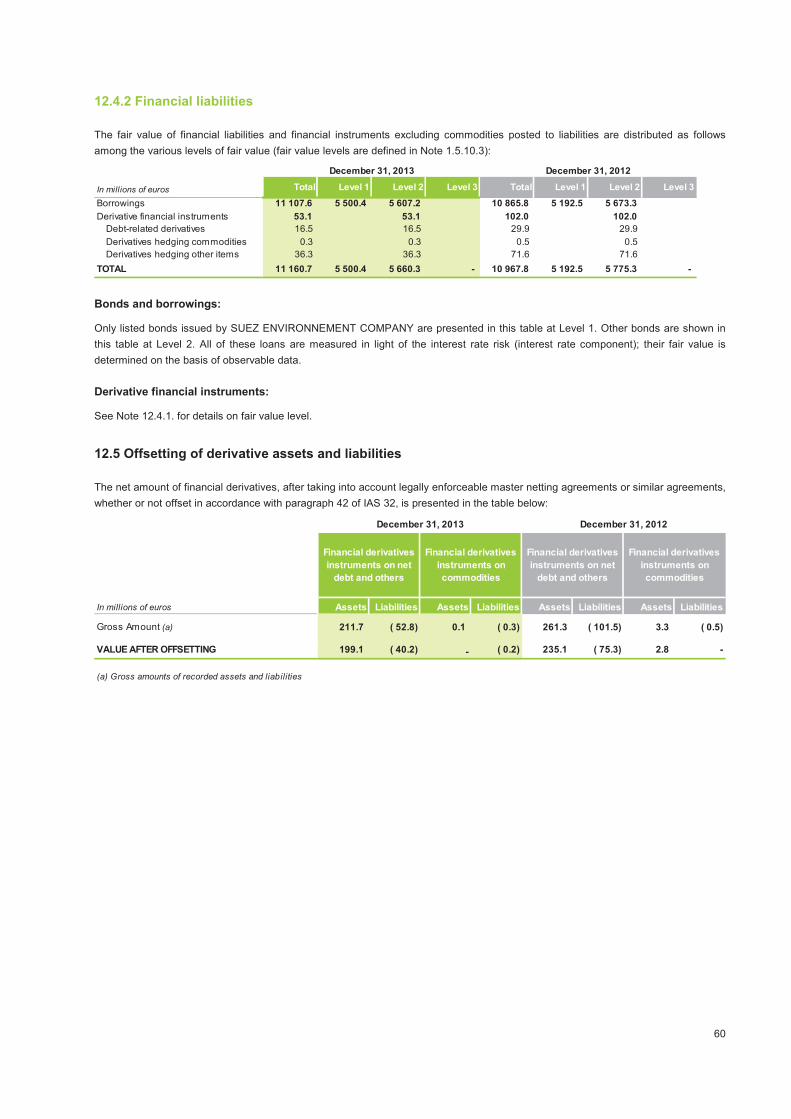
60
12.4.2 Financial liabilities
The fair value of financial liabilities and financial instruments excluding commodities posted to liabilities are distributed as follows
among the various levels of fair value (fair value levels are defined in Note 1.5.10.3):
Bonds and borrowings:
Only listed bonds issued by SUEZ ENVIRONNEMENT COMPANY are presented in this table at Level 1. Other bonds are shown in
this table at Level 2. All of these loans are measured in light of the interest rate risk (interest rate component); their fair value is
determined on the basis of observable data.
Derivative financial instruments:
See Note 12.4.1. for details on fair value level.
12.5 Offsetting of derivative assets and liabilities
The net amount of financial derivatives, after taking into account legally enforceable master netting agreements or similar agreements,
whether or not offset in accordance with paragraph 42 of IAS 32, is presented in the table below:
December 31, 2013 December 31, 2012
In millions of euros Total Level 1 Level 2 Level 3 Total Level 1 Level 2 Level 3
Borrowings 11 107.6 5 500.4 5 607.2 10 865.8 5 192.5 5 673.3
Derivative financial instruments 53.1 53.1 102.0 102.0
Debt-related derivatives 16.5 16.5 29.9 29.9
Derivatives hedging commodities 0.3 0.3 0.5 0.5
Derivatives hedging other items 36.3 36.3 71.6 71.6
TOTAL 11 160.7 5 500.4 5 660.3 - 10 967.8 5 192.5 5 775.3 -
In millions of euros Assets Liabilities Assets Liabilities Assets Liabilities Assets Liabilities
Gross Amount (a) 211.7 ( 52.8) 0.1 ( 0.3) 261.3 ( 101.5) 3.3 ( 0.5)
VALUE AFTER OFFSETTING 199.1 ( 40.2) - ( 0.2) 235.1 ( 75.3) 2.8 -
(a) Gross amounts of recorded assets and liabilities
Financial derivatives
instruments on net
debt and others
Financial derivatives
instruments on
commodities
Financial derivatives
instruments on net
debt and others
Financial derivatives
instruments on
commodities
December 31, 2013 December 31, 2012

61
NOTE 13 Management of risks arising from financial instruments
The Group mainly uses derivative instruments to manage its exposure to market risks. The management of financial risks is explained
in Chapter 4 – “Risk factors” of the Reference Document.
13.1 Market risks
13.1.1 Commodity market risks
13.1.1.1 Hedging operations
The Group sets up cash flow hedges on fuel and electricity as defined by IAS 39 by using the derivative instruments available on over-
the-counter markets, whether they are firm commitments or options, but always settled in cash. The Group’s aim is to protect itself
against adverse changes in market prices, which may specifically affect its supply costs.
13.1.1.2 Fair value of derivative instruments linked to commodities
The fair values of derivative instruments linked to commodities at December 31, 2013 and 2012 are presented in the table below:
The fair value of cash flow hedging instruments by type of commodity breaks down as follows:
13.1.2 Currency risk
The Group is exposed to financial statement translation risk due to the geographical spread of its activities: its statement of financial
position and income statement are impacted by changes in exchange rates when consolidating its foreign subsidiaries with a currency
other than the euro (translation risk). Translation risk is mainly concentrated on equity holdings in the United States, United Kingdom,
Chile and Australia. The Group’s hedging policy with regard to investments in non-eurozone currencies consists in contracting
liabilities denominated in the same currency as the cash flows expected to derive from the hedged assets.
Among the hedging instruments used, borrowings in the relevant currency constitute the most natural hedging tool. The Group also
uses foreign currency derivatives (swaps), which allow for the creation of synthetic currency debts.
Exposure to currency risk is reviewed monthly and the asset hedging coverage ratio (corresponding to the ratio between the carrying
amount of an asset denominated in a foreign currency outside the eurozone, and the debt assumed for that asset) is periodically
reviewed in the light of market conditions and whenever assets are acquired or sold. Any significant change in the hedging ratio is
subject to prior approval by the Treasury Committee.
Taking financial instruments into account, 62% of net debt was denominated in euros, 14% in US dollars, 5% in pounds sterling, 14%
in Chilean pesos and 1% in Australian dollars at the end of 2013, compared to 57% in euros, 15% in US dollars, 5% in pounds
sterling, 16% in Chilean pesos and 2% in Australian dollars at the end of 2012.
In millions of euros Current Non-current Current Non-current Current Non-current Current Non-current
Cash flow hedges 0.1 - 0.3 - 3.3 - 0.5 -
TOTAL 0.1 - 0.3 - 3.3 - 0.5 -
December 31, 2013 December 31, 2012
Assets Liabilities Assets Liabilities
In millions of euros Current Non-current Current Non-current Current Non-current Current Non-current
ELECTRICITY - - - - 0.7 - - -
Swaps - - - - 0.7 - - -
OIL 0.1 - 0.3 - 2.6 - 0.5 -
Swaps 0.1 - 0.3 - 2.6 - 0.5 -
TOTAL 0.1 - 0.3 - 3.3 - 0.5 -
December 31, 2013 December 31, 2012
Assets Liabilities Assets Liabilities
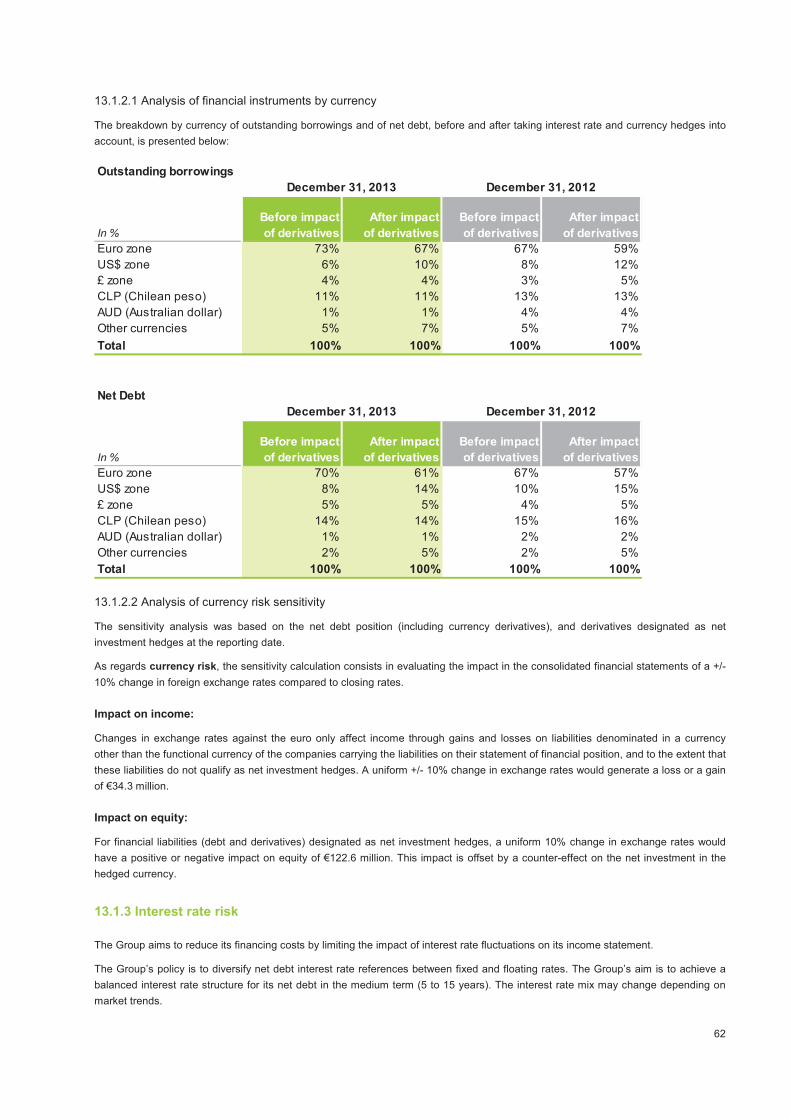
62
13.1.2.1 Analysis of financial instruments by currency
The breakdown by currency of outstanding borrowings and of net debt, before and after taking interest rate and currency hedges into
account, is presented below:
13.1.2.2 Analysis of currency risk sensitivity
The sensitivity analysis was based on the net debt position (including currency derivatives), and derivatives designated as net
investment hedges at the reporting date.
As regards currency risk, the sensitivity calculation consists in evaluating the impact in the consolidated financial statements of a +/-
10% change in foreign exchange rates compared to closing rates.
Impact on income:
Changes in exchange rates against the euro only affect income through gains and losses on liabilities denominated in a currency
other than the functional currency of the companies carrying the liabilities on their statement of financial position, and to the extent that
these liabilities do not qualify as net investment hedges. A uniform +/- 10% change in exchange rates would generate a loss or a gain
of €34.3 million.
Impact on equity:
For financial liabilities (debt and derivatives) designated as net investment hedges, a uniform 10% change in exchange rates would
have a positive or negative impact on equity of €122.6 million. This impact is offset by a counter-effect on the net investment in the
hedged currency.
13.1.3 Interest rate risk
The Group aims to reduce its financing costs by limiting the impact of interest rate fluctuations on its income statement.
The Group’s policy is to diversify net debt interest rate references between fixed and floating rates. The Group’s aim is to achieve a
balanced interest rate structure for its net debt in the medium term (5 to 15 years). The interest rate mix may change depending on
market trends.
Outstanding borrowings
In %
Before impact
of derivatives
After impact
of derivatives
Before impact
of derivatives
After impact
of derivatives
Euro zone 73% 67% 67% 59%
US$ zone 6% 10% 8% 12%
£ zone 4% 4% 3% 5%
CLP (Chilean peso) 11% 11% 13% 13%
AUD (Australian dollar) 1% 1% 4% 4%
Other currencies 5% 7% 5% 7%
Total 100% 100% 100% 100%
December 31, 2013 December 31, 2012
Net Debt
In %
Before impact
of derivatives
After impact
of derivatives
Before impact
of derivatives
After impact
of derivatives
Euro zone 70% 61% 67% 57%
US$ zone 8% 14% 10% 15%
£ zone 5% 5% 4% 5%
CLP (Chilean peso) 14% 14% 15% 16%
AUD (Australian dollar) 1% 1% 2% 2%
Other currencies 2% 5% 2% 5%
Total 100% 100% 100% 100%
December 31, 2013 December 31, 2012

63
The Group therefore uses hedging instruments (particularly swaps) to protect itself from increases in interest rates in the currencies in
which the debt is denominated.
The Group’s exposure to interest rate risk is managed centrally and regularly reviewed (generally on a monthly basis) during meetings
of the Treasury Committee. Any significant change in the interest rate mix is subject to prior approval by Management.
The cost of debt is sensitive to changes in interest rates on all floating-rate debt. The cost of debt is also affected by changes in
market value of derivative instruments not classified as hedges under IAS 39.
The Group’s main exposure to interest rate risk arises from loans and borrowings denominated in euros, US dollars, pounds sterling,
Chilean pesos and Australian dollars, which represented 95% of net debt as of December 31, 2013.
13.1.3.1 Financial instruments by rate type
The breakdown by type of rate of outstanding borrowings and net debt, before and after impact of hedging instruments, is shown in
the following tables:
13.1.3.2 Analysis of interest rate risk sensitivity
The sensitivity analysis was based on the net debt position as at the reporting date (including interest rate derivative instruments).
For interest rate risk, sensitivity is calculated based on the impact of a rate change of +/-1% compared with year-end interest rates.
Impact on income:
A +/- 1% change in short-term interest rates (for all currencies) on the nominal amount of floating-rate net debt and the floating-rate
component of derivatives would have a negative or positive impact of €11.9 million on net interest expense.
A 1% increase in interest rates (for all currencies) would generate a gain of €0.6 million in the income statement due to the change in
fair value of non-qualified derivatives. Conversely, a 1% decrease in interest rates would generate a €0.6 million loss.
Impact on equity:
An increase of 1% in all interest rates (uniform for all currencies) would generate a gain of €8.3 million in equity, linked to the change
in fair value for derivatives documented as cash flow hedges and accounted for in the statement of financial position. On the other
hand, a decrease of 1% would generate a loss of €9.2 million.
The asymmetrical impacts are attributable to the low short-term interest rates (less than 1%) applicable to certain financial assets and
liabilities.
Outstanding borrowings
In %
Before impact
of derivatives
After impact of
derivatives
Before impact
of derivatives
After impact of
derivatives
Floating rate 26% 41% 30% 40%
Fixed rate 74% 59% 70% 60%
TOTAL 100% 100% 100% 100%
December 31, 2013 December 31, 2012
Net Debt
In %
Before impact
of derivatives
After impact of
derivatives
Before impact
of derivatives
After impact of
derivatives
Floating rate -2% 18% 6% 19%
Fixed rate 102% 82% 94% 81%
TOTAL 100% 100% 100% 100%
December 31, 2013 December 31, 2012

64
13.1.4 Currency and interest rate risk hedges
The fair values and notional amounts of the financial derivative instruments used to hedge currency and interest rate risks are as
follows:
Foreign currency derivatives
Interest rate derivatives
The market values shown in the table above are positive for an asset and negative for a liability.
The Group defines foreign currency derivatives hedging by firm foreign currency commitments, and instruments transforming fixed-
rate debt into floating-rate debt, as fair value hedges.
Cash-flow hedges correspond mainly to hedges of future operating cash flows in foreign currency and the hedging of floating-rate
debt.
Net investment hedging instruments are mainly foreign exchange swaps.
Interest rate derivatives not designated as hedges consist of structured instruments, which because of their type and because they do
not meet the effectiveness criteria defined in IAS 39, cannot be qualified as hedges for accounting purposes.
Foreign currency derivatives not designated as hedges provide financial cover for foreign currency commitments. Furthermore, the
effect of foreign currency derivatives is almost entirely offset by translation adjustments on the hedged items.
Fair-value hedges:
As of December 31, 2013, the net impact of fair value hedges recognized in the income statement was -€0.6 million.
Cash flow hedges:
The breakdown by maturity of the market value of the foreign currency and interest rate derivatives designated as cash flow hedges is
as follows:
The unrealized gains and losses directly recognized in shareholders’ equity, Group share over 2013 amounted to +€91.7 million
(including impacts on associates).
The ineffective portion of cash-flow hedges recognized in income amounted to -€6.3 million.
In millions of euros
Total market
value
Total nominal
value
Total market
value
Total nominal
value
Fair-value hedges 1.4 197.5 0.9 219.6
Cash-flow hedges (0.6) 109.9 0.3 50.3
Net investment hedges 28.3 1,109.5 3.6 964.5
Derivative instruments not qualifying for hedge accounting 8.4 721.2 1.5 820.3
Total 37.5 2,138.1 6.3 2,054.7
December 31, 2013 December 31, 2012
In millions of euros
Total market
value
Total nominal
value
Total market
value
Total nominal
value
Fair-value hedges 149.4 1,820.5 209.4 1,820.5
Cash-flow hedges (28.0) 321.9 (55.5) 864.2
Derivative instruments not qualifying for hedge accounting (0.1) 348.2 (0.4) 420.5
TOTAL 121.3 2,490.6 153.5 3,105.2
December 31, 2013 December 31, 2012
At December 31, 2013
In millions of eurosTotal 2014 2015 2016 2017 2018
Beyond 5
years
Fair value of derivatives by maturity date (28.6) (9.4) (6.2) (4.0) (2.4) (3.6) (3.0)
At December 31, 2012
In millions of eurosTotal 2013 2014 2015 2016 2017
Beyond 5
years
Fair value of derivatives by maturity date (55.3) (28.4) (5.2) (4.2) (3.2) (2.3) (12.0)

65
Net investment hedges:
The ineffective portion of net investment hedges recognized in income is nil.
13.2 Counterparty risk
Through its operational and financial activities, the Group is exposed to the risk of default on the part of its counterparties (customers,
suppliers, associates, intermediaries, banks) in the event that they find it impossible to meet their contractual obligations. This risk
arises from a combination of payment risk (non-payment of goods or services rendered), delivery risk (non-delivery of goods or
services already paid), and replacement risk on defaulting contracts (called mark-to-market exposure and corresponding to the risk
that replacement terms will be different from the initially agreed terms).
13.2.1 Operating activities
Trade and other receivables
The gross maturity of past-due trade and other receivables is broken down below:
(a) This figure corresponds to the nominal value of trade and other receivables that are partially or fully depreciated.
The ageing of receivables that are past due but not impaired may vary significantly depending on the type of customer with which the
Group companies do business (private companies, individuals or public authorities). The Group decides whether to recognize
impairment on a case-by-case basis according to the characteristics of the various types of customers. The Group does not consider
that it is exposed to any material credit concentration risk in respect of receivables, taking into account the diversified nature of its
portfolio.
Other assets
In ‘Other assets’ the proportion of depreciated assets is not material in relation to the total amount of the item. Moreover, the Group
does not consider that it is exposed to any counterparty risk on those assets.
13.2.2 Financial activities
The Group’s maximum exposure to counterparty risk in its financial activities may be measured in terms of the carrying amount of
financial assets excluding available-for-sale securities and the fair value of derivatives on the assets side of the statement of financial
position (i.e. €7,579.3 million at December 31, 2013, and €7,308.0 million at December 31, 2012).
Trade and other receivables
Impaired
assets (a)
Non-
impaired
and not
past-due
assets
In millions of euros 0-6 months 6-12 months Over one year Total Total Total Total
At December 31, 2013 202.7 15.7 70.3 288.7 344.0 3,224.2 3,856.9
At December 31, 2012 220.2 29.0 47.2 296.4 363.7 3,379.1 4,039.2
Past-due non impaired assets at closing date
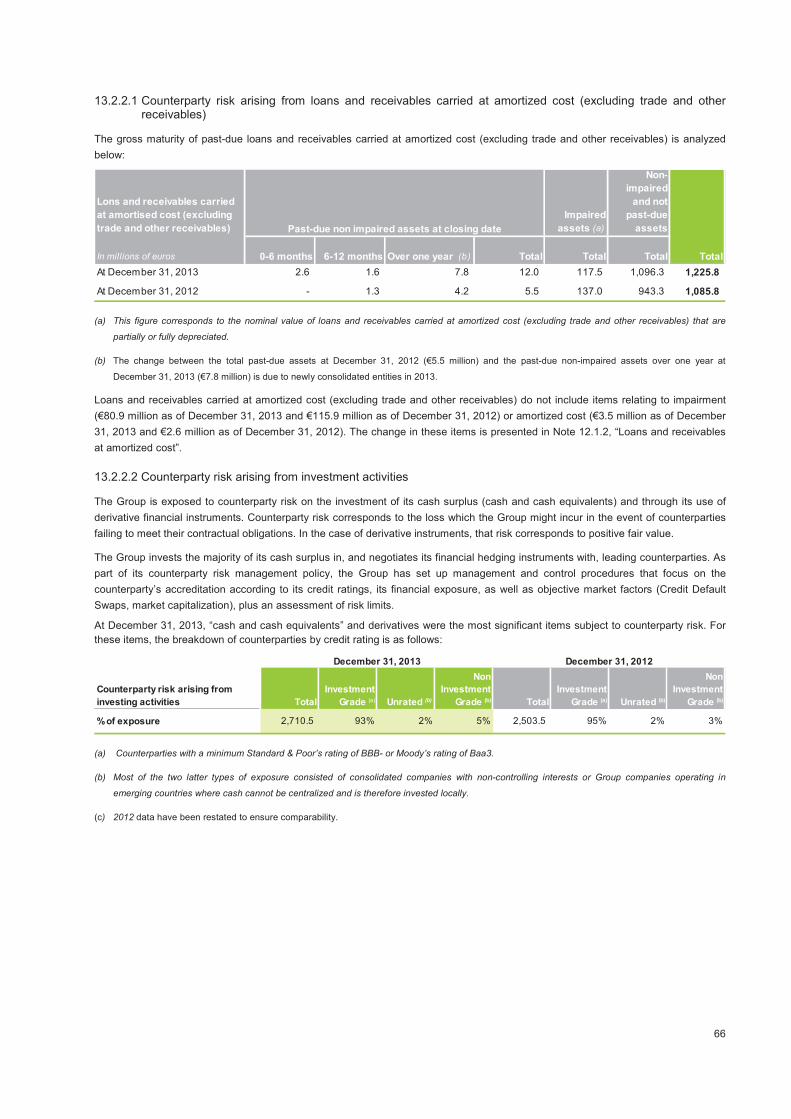
66
13.2.2.1 Counterparty risk arising from loans and receivables carried at amortized cost (excluding trade and other receivables)
The gross maturity of past-due loans and receivables carried at amortized cost (excluding trade and other receivables) is analyzed
below:
(a) This figure corresponds to the nominal value of loans and receivables carried at amortized cost (excluding trade and other receivables) that are
partially or fully depreciated.
(b) The change between the total past-due assets at December 31, 2012 (€5.5 million) and the past-due non-impaired assets over one year at
December 31, 2013 (€7.8 million) is due to newly consolidated entities in 2013.
Loans and receivables carried at amortized cost (excluding trade and other receivables) do not include items relating to impairment
(€80.9 million as of December 31, 2013 and €115.9 million as of December 31, 2012) or amortized cost (€3.5 million as of December
31, 2013 and €2.6 million as of December 31, 2012). The change in these items is presented in Note 12.1.2, “Loans and receivables
at amortized cost”.
13.2.2.2 Counterparty risk arising from investment activities
The Group is exposed to counterparty risk on the investment of its cash surplus (cash and cash equivalents) and through its use of
derivative financial instruments. Counterparty risk corresponds to the loss which the Group might incur in the event of counterparties
failing to meet their contractual obligations. In the case of derivative instruments, that risk corresponds to positive fair value.
The Group invests the majority of its cash surplus in, and negotiates its financial hedging instruments with, leading counterparties. As
part of its counterparty risk management policy, the Group has set up management and control procedures that focus on the
counterparty’s accreditation according to its credit ratings, its financial exposure, as well as objective market factors (Credit Default
Swaps, market capitalization), plus an assessment of risk limits.
At December 31, 2013, “cash and cash equivalents” and derivatives were the most significant items subject to counterparty risk. For
these items, the breakdown of counterparties by credit rating is as follows:
(a) Counterparties with a minimum Standard & Poor’s rating of BBB- or Moody’s rating of Baa3.
(b) Most of the two latter types of exposure consisted of consolidated companies with non-controlling interests or Group companies operating in
emerging countries where cash cannot be centralized and is therefore invested locally.
(c) 2012 data have been restated to ensure comparability.
Lons and receivables carried
at amortised cost (excluding
trade and other receivables)
Impaired
assets (a)
Non-
impaired
and not
past-due
assets
In millions of euros 0-6 months 6-12 months Over one year (b) Total Total Total Total
At December 31, 2013 2.6 1.6 7.8 12.0 117.5 1,096.3 1,225.8
At December 31, 2012 - 1.3 4.2 5.5 137.0 943.3 1,085.8
Past-due non impaired assets at closing date
Counterparty risk arising from
investing activities Total
Investment
Grade (a) Unrated (b)
Non
Investment
Grade (b) Total
Investment
Grade (a) Unrated (b)
Non
Investment
Grade (b)
% of exposure 2,710.5 93% 2% 5% 2,503.5 95% 2% 3%
December 31, 2013 December 31, 2012

67
13.3 Liquidity risk
As part of its operating and financial activities, the Group could be exposed to a risk of insufficient liquidity, preventing it from meeting
its contractual commitments.
13.3.1 Available cash
The Group’s financing policy is based on the following principles:
• Diversification of financing sources between the banking and capital markets.
• Balanced repayment profile of borrowings.
As of December 31, 2013, the Group’s total net cash stood at €2,769.4 million (including €171.8 million in derivative financial
instruments). Almost all surplus cash is invested in short-term bank deposits and interest-bearing accounts.
In addition, at December 31, 2013 the Group specifically had €2,980.0 million in confirmed credit facilities, including €288.2 million
already drawn; unused credit facilities therefore totaled €2,691.8 million, €631.3 million of which will be maturing in 2014.
65% of total credit lines and 72% of undrawn facilities were centralized. None of these centralized lines contains a default clause
linked to financial ratios or minimum credit ratings.
In addition, on January 3, 2013, SUEZ ENVIRONNEMENT COMPANY established a commercial paper program for €1,500.0 million.
At December 31, 2013, the outstanding notes totaled €679.0 million
As of December 31, 2013, bank funding accounted for 14% of gross financial debt (excluding bank overdrafts and liability current
accounts as those elements don't correspond to sustainable financial resources). Funding from capital markets (bond issues for 72%
and commercial paper for 8%) represented 80% of the outstanding borrowings (excluding bank overdrafts and liability current
accounts).
At December 31, 2013, cash and cash equivalents (€2,506.0 million) and qualifying financial assets measured at fair value through
income (€91.6 million), net of bank overdrafts and liability current accounts (€704.6 million), amounted to €1,893.0 million versus
€1,512.4 million at December 31, 2012.
The Group anticipates that its financing needs for the major planned investments will be covered by its net cash, the sale of mutual
fund shares held for trading purposes, its future cash flows resulting from operating activities, and the potential use of available credit
facilities.

68
13.3.2 Undiscounted contractual payments
In order to best reflect the current economic circumstances of operations, cash flows related to derivatives recognized as liabilities or
assets shown below correspond to net positions. Moreover, the values shown in the table below are positive for a liability and negative
for an asset.
At December 31, 2013, undiscounted contractual payments on outstanding borrowings by maturity and type of lenders are as follows:
As of December 31, 2013, undiscounted contractual payments on outstanding borrowings broke down as follows by maturity:
At December 31, 2013 undiscounted contractual payments on outstanding derivatives (excluding commodity instruments) recognized
in liabilities and assets broke down as follows by maturity (net amounts):
At December 31, 2013
In millions of euros
Bonds issues 6,574.2 886.3 54.1 74.7 448.3 209.5 4,901.3
Commercial paper 679.0 679.0
Draw downs on credit facilities 288.2 101.4 81.9 66.6 38.3
Borrowings under finance leases 397.4 51.8 47.2 46.8 47.3 75.4 128.9
Other bank borrowings 987.0 189.5 131.1 121.5 175.8 244.2 124.9
Other borrowings 172.0 61.7 13.2 9.0 32.2 8.6 47.3
Overdrafts and current accounts 704.6 704.6
Outstanding borrowings 9,802.4 2,674.3 327.5 318.6 703.6 537.7 5,240.7
Financial assets relating to financing (0.9) (0.9)
Financial assets measured at fair value through income (91.6) (91.6) - - - - -
Cash and cash equivalents (2,506.0) (2,506.0) - - - - -
Net debt excluding amortized cost and impact
of derivative financial instruments7,203.9 76.7 327.5 318.6 703.6 537.7 5,239.8
At December 31, 2012
In millions of euros
Outstanding borrowings 9,683.7 1,277.5 1,253.2 501.2 933.4 703.6 5,014.8
Financial assets measured at fair value through income
and Cash and cash equivalents(2,275.4) (2,270.8) - - - - (4.6)
Net debt excluding amortized cost and impact
of derivative financial instruments7,408.3 (993.3) 1,253.2 501.2 933.4 703.6 5,010.2
2018Beyond 5
yearsTOTAL 2014 2015 2016 2017
Beyond 5
yearsTOTAL 2013 2014 2015 2016 2017
At December 31, 2013
In millions of euros
Undiscounted contractual interest payments
on outstanding borrowings3,169.0 376.7 332.4 321.7 309.7 274.8 1,553.7
At December 31, 2012
In millions of euros
Undiscounted contractual interest payments
on outstanding borrowings3,384.0 392.4 367.7 319.0 308.9 297.8 1,698.4
TOTAL 2014 2015 2016 2017 2018Beyond 5
years
Beyond 5
yearsTOTAL 2013 2014 2015 2016 2017
At December 31, 2013
In millions of euros
Derivatives (excluding commodities) (157.6) (76.5) (20.4) (17.5) (11.9) (6.7) (24.6)
At December 31, 2012
In millions of euros
Derivatives (excluding commodities) (165.9) (22.0) (45.9) (21.5) (17.4) (16.0) (43.1)
Beyond 5
years
TOTAL 2013 2014 2015 2016 2017Beyond 5
years
TOTAL 2014 2015 2016 2017 2018
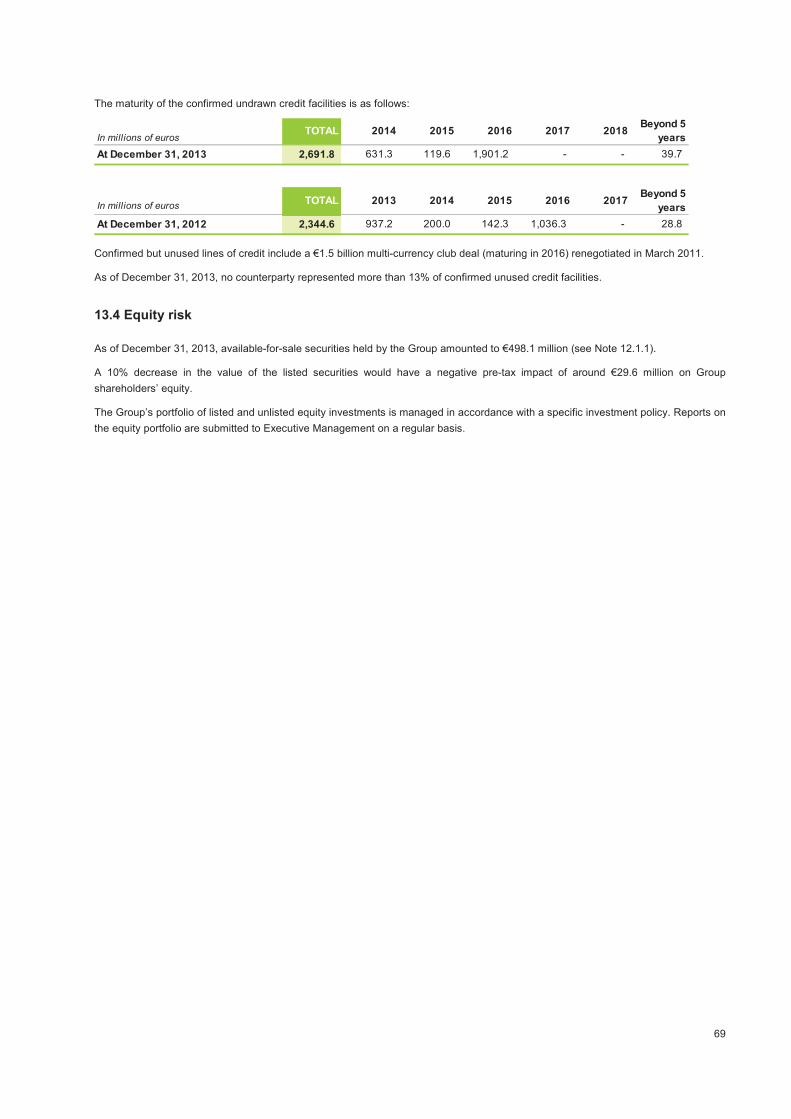
69
The maturity of the confirmed undrawn credit facilities is as follows:
Confirmed but unused lines of credit include a €1.5 billion multi-currency club deal (maturing in 2016) renegotiated in March 2011.
As of December 31, 2013, no counterparty represented more than 13% of confirmed unused credit facilities.
13.4 Equity risk
As of December 31, 2013, available-for-sale securities held by the Group amounted to €498.1 million (see Note 12.1.1).
A 10% decrease in the value of the listed securities would have a negative pre-tax impact of around €29.6 million on Group
shareholders’ equity.
The Group’s portfolio of listed and unlisted equity investments is managed in accordance with a specific investment policy. Reports on
the equity portfolio are submitted to Executive Management on a regular basis.
In millions of euros
At December 31, 2013 2,691.8 631.3 119.6 1,901.2 - - 39.7
In millions of euros
At December 31, 2012 2,344.6 937.2 200.0 142.3 1,036.3 - 28.8
Beyond 5
years
TOTAL 2013 2014 2015 2016 2017Beyond 5
years
TOTAL 2014 2015 2016 2017 2018
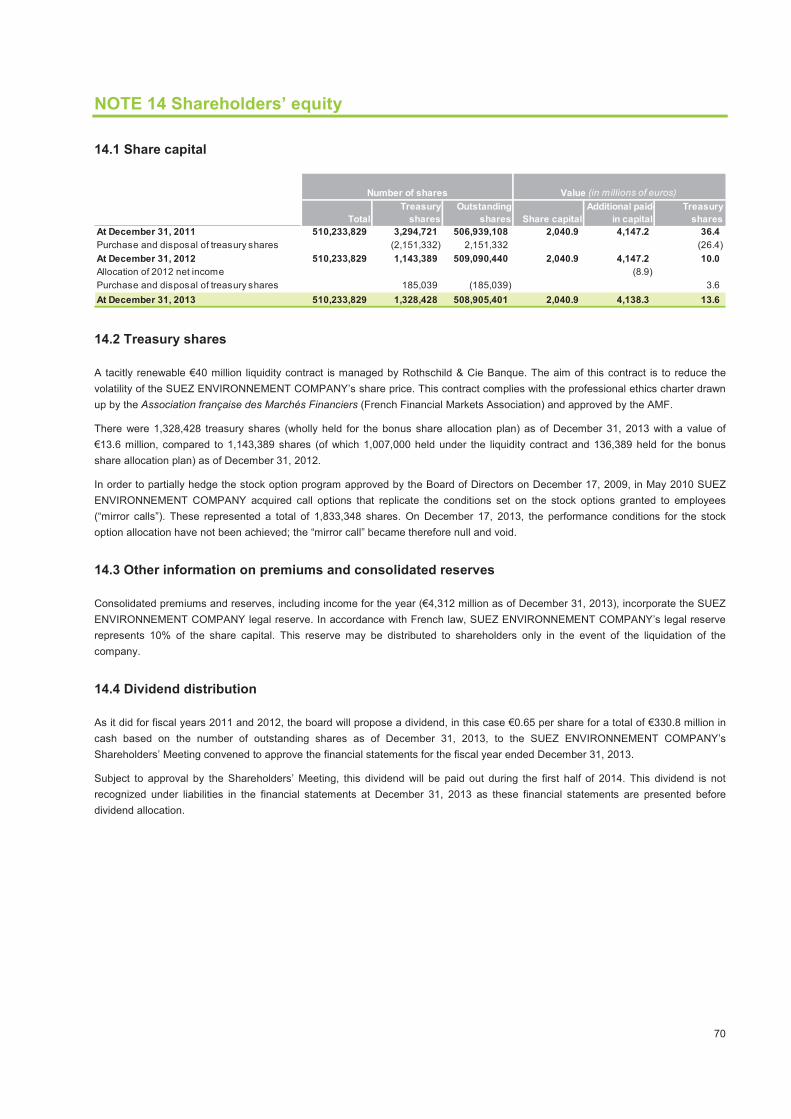
70
NOTE 14 Shareholders’ equity
14.1 Share capital
14.2 Treasury shares
A tacitly renewable €40 million liquidity contract is managed by Rothschild & Cie Banque. The aim of this contract is to reduce the
volatility of the SUEZ ENVIRONNEMENT COMPANY’s share price. This contract complies with the professional ethics charter drawn
up by the Association française des Marchés Financiers (French Financial Markets Association) and approved by the AMF.
There were 1,328,428 treasury shares (wholly held for the bonus share allocation plan) as of December 31, 2013 with a value of
€13.6 million, compared to 1,143,389 shares (of which 1,007,000 held under the liquidity contract and 136,389 held for the bonus
share allocation plan) as of December 31, 2012.
In order to partially hedge the stock option program approved by the Board of Directors on December 17, 2009, in May 2010 SUEZ
ENVIRONNEMENT COMPANY acquired call options that replicate the conditions set on the stock options granted to employees
(“mirror calls”). These represented a total of 1,833,348 shares. On December 17, 2013, the performance conditions for the stock
option allocation have not been achieved; the “mirror call” became therefore null and void.
14.3 Other information on premiums and consolidated reserves
Consolidated premiums and reserves, including income for the year (€4,312 million as of December 31, 2013), incorporate the SUEZ
ENVIRONNEMENT COMPANY legal reserve. In accordance with French law, SUEZ ENVIRONNEMENT COMPANY’s legal reserve
represents 10% of the share capital. This reserve may be distributed to shareholders only in the event of the liquidation of the
company.
14.4 Dividend distribution
As it did for fiscal years 2011 and 2012, the board will propose a dividend, in this case €0.65 per share for a total of €330.8 million in
cash based on the number of outstanding shares as of December 31, 2013, to the SUEZ ENVIRONNEMENT COMPANY’s
Shareholders’ Meeting convened to approve the financial statements for the fiscal year ended December 31, 2013.
Subject to approval by the Shareholders’ Meeting, this dividend will be paid out during the first half of 2014. This dividend is not
recognized under liabilities in the financial statements at December 31, 2013 as these financial statements are presented before
dividend allocation.
Total
Treasury
shares
Outstanding
shares Share capital
Additional paid-
in capital
Treasury
shares
At December 31, 2011 510,233,829 3,294,721 506,939,108 2,040.9 4,147.2 36.4
Purchase and disposal of treasury shares (2,151,332) 2,151,332 (26.4)
At December 31, 2012 510,233,829 1,143,389 509,090,440 2,040.9 4,147.2 10.0
Allocation of 2012 net income (8.9)
Purchase and disposal of treasury shares 185,039 (185,039) 3.6
At December 31, 2013 510,233,829 1,328,428 508,905,401 2,040.9 4,138.3 13.6
Number of shares Value (in millions of euros)
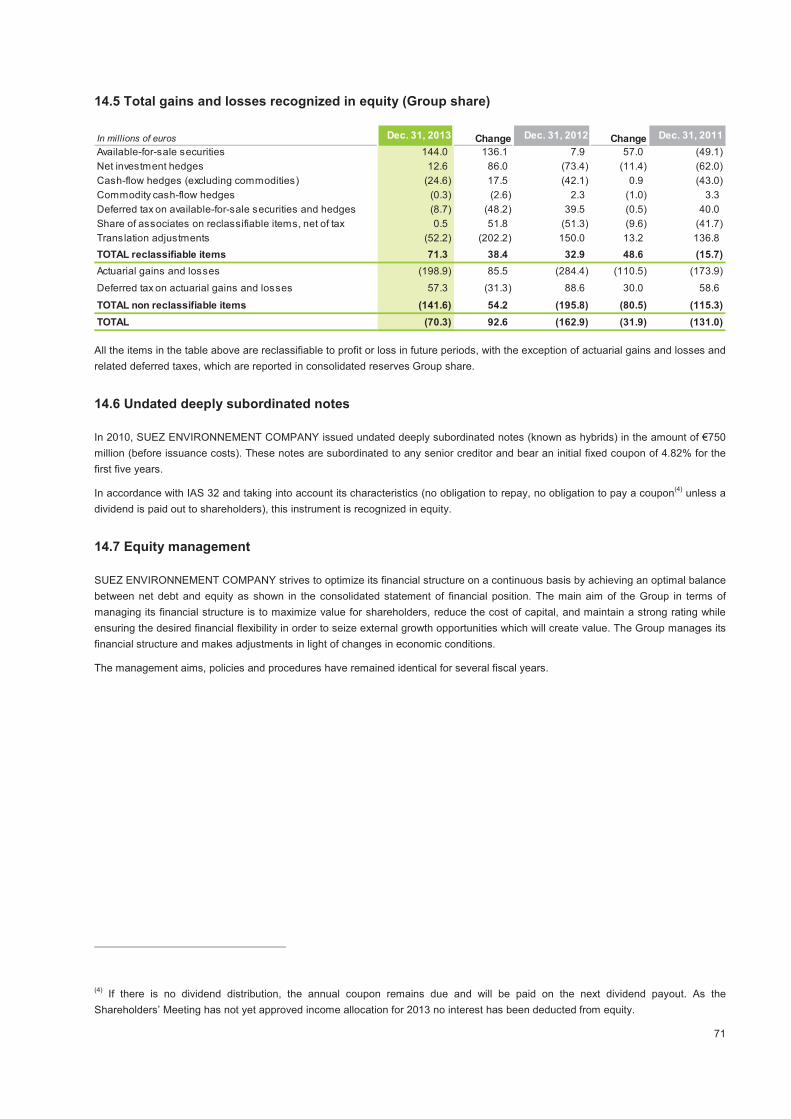
71
14.5 Total gains and losses recognized in equity (Group share)
All the items in the table above are reclassifiable to profit or loss in future periods, with the exception of actuarial gains and losses and
related deferred taxes, which are reported in consolidated reserves Group share.
14.6 Undated deeply subordinated notes
In 2010, SUEZ ENVIRONNEMENT COMPANY issued undated deeply subordinated notes (known as hybrids) in the amount of €750
million (before issuance costs). These notes are subordinated to any senior creditor and bear an initial fixed coupon of 4.82% for the
first five years.
In accordance with IAS 32 and taking into account its characteristics (no obligation to repay, no obligation to pay a coupon(4)
unless a
dividend is paid out to shareholders), this instrument is recognized in equity.
14.7 Equity management
SUEZ ENVIRONNEMENT COMPANY strives to optimize its financial structure on a continuous basis by achieving an optimal balance
between net debt and equity as shown in the consolidated statement of financial position. The main aim of the Group in terms of
managing its financial structure is to maximize value for shareholders, reduce the cost of capital, and maintain a strong rating while
ensuring the desired financial flexibility in order to seize external growth opportunities which will create value. The Group manages its
financial structure and makes adjustments in light of changes in economic conditions.
The management aims, policies and procedures have remained identical for several fiscal years.
(4) If there is no dividend distribution, the annual coupon remains due and will be paid on the next dividend payout. As the
Shareholders’ Meeting has not yet approved income allocation for 2013 no interest has been deducted from equity.
In millions of euros Dec. 31, 2013 Change Dec. 31, 2012 Change Dec. 31, 2011
Available-for-sale securities 144.0 136.1 7.9 57.0 (49.1)
Net investment hedges 12.6 86.0 (73.4) (11.4) (62.0)
Cash-flow hedges (excluding commodities) (24.6) 17.5 (42.1) 0.9 (43.0)
Commodity cash-flow hedges (0.3) (2.6) 2.3 (1.0) 3.3
Deferred tax on available-for-sale securities and hedges (8.7) (48.2) 39.5 (0.5) 40.0
Share of associates on reclassifiable items, net of tax 0.5 51.8 (51.3) (9.6) (41.7)
Translation adjustments (52.2) (202.2) 150.0 13.2 136.8
TOTAL reclassifiable items 71.3 38.4 32.9 48.6 (15.7)
Actuarial gains and losses (198.9) 85.5 (284.4) (110.5) (173.9)
Deferred tax on actuarial gains and losses 57.3 (31.3) 88.6 30.0 58.6
TOTAL non reclassifiable items (141.6) 54.2 (195.8) (80.5) (115.3)
TOTAL (70.3) 92.6 (162.9) (31.9) (131.0)
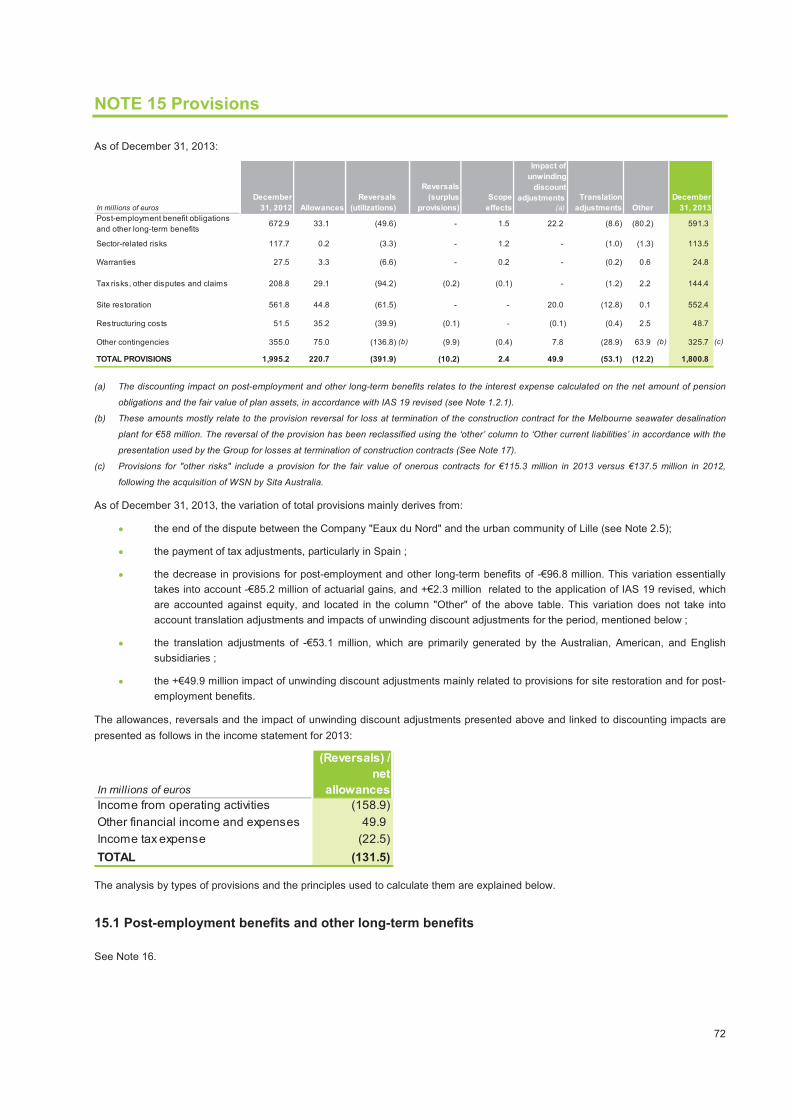
72
NOTE 15 Provisions
As of December 31, 2013:
(a) The discounting impact on post-employment and other long-term benefits relates to the interest expense calculated on the net amount of pension
obligations and the fair value of plan assets, in accordance with IAS 19 revised (see Note 1.2.1).
(b) These amounts mostly relate to the provision reversal for loss at termination of the construction contract for the Melbourne seawater desalination
plant for €58 million. The reversal of the provision has been reclassified using the ‘other’ column to ‘Other current liabilities’ in accordance with the
presentation used by the Group for losses at termination of construction contracts (See Note 17).
(c) Provisions for "other risks" include a provision for the fair value of onerous contracts for €115.3 million in 2013 versus €137.5 million in 2012,
following the acquisition of WSN by Sita Australia.
As of December 31, 2013, the variation of total provisions mainly derives from:
• the end of the dispute between the Company "Eaux du Nord" and the urban community of Lille (see Note 2.5);
• the payment of tax adjustments, particularly in Spain ;
• the decrease in provisions for post-employment and other long-term benefits of -€96.8 million. This variation essentially
takes into account -€85.2 million of actuarial gains, and +€2.3 million related to the application of IAS 19 revised, which
are accounted against equity, and located in the column "Other" of the above table. This variation does not take into
account translation adjustments and impacts of unwinding discount adjustments for the period, mentioned below ;
• the translation adjustments of -€53.1 million, which are primarily generated by the Australian, American, and English
subsidiaries ;
• the +€49.9 million impact of unwinding discount adjustments mainly related to provisions for site restoration and for post-
employment benefits.
The allowances, reversals and the impact of unwinding discount adjustments presented above and linked to discounting impacts are
presented as follows in the income statement for 2013:
The analysis by types of provisions and the principles used to calculate them are explained below.
15.1 Post-employment benefits and other long-term benefits
See Note 16.
In millions of euros
December
31, 2012
Reversals
(utilizations)
Reversals
(surplus
provisions)
Scope
effects
Impact of
unwinding
discount
adjustments
(a)
Translation
adjustments Other
December
31, 2013
Post-employment benefit obligations
and other long-term benefits672.9 33.1 (49.6) - 1.5 22.2 (8.6) (80.2) 591.3
Sector-related risks 117.7 0.2 (3.3) - 1.2 - (1.0) (1.3) 113.5
Warranties 27.5 3.3 (6.6) - 0.2 - (0.2) 0.6 24.8
Tax risks, other disputes and claims 208.8 29.1 (94.2) (0.2) (0.1) - (1.2) 2.2 144.4
Site restoration 561.8 44.8 (61.5) - - 20.0 (12.8) 0.1 552.4
Restructuring costs 51.5 35.2 (39.9) (0.1) - (0.1) (0.4) 2.5 48.7
Other contingencies 355.0 75.0 (136.8) (b) (9.9) (0.4) 7.8 (28.9) 63.9 (b) 325.7 (c)
TOTAL PROVISIONS 1,995.2 220.7 (391.9) (10.2) 2.4 49.9 (53.1) (12.2) 1,800.8
Allowances
In millions of euros
(Reversals) /
net
allowances
Income from operating activities (158.9)
Other financial income and expenses 49.9
Income tax expense (22.5)
TOTAL (131.5)
73
15.2 Sector-related risks
This item primarily includes provisions for risks relating to court proceedings involving the Argentinean contracts and to warranties
given in connection with divestments that are likely to be called upon.
15.3 Tax risks, other disputes and claims
This item includes provisions for ongoing disputes involving employees or social security agencies (social security contribution relief,
etc.), disputes arising in the ordinary course of business (customer claims, accounts payable disputes), tax adjustments and tax
disputes.
15.4 Site restoration
The June 1998 European Directive on waste management introduced a number of obligations regarding the closure and long-term
monitoring of landfills. These obligations lay down the rules and conditions incumbent upon the operator (or owner of the site where
the operator fails to comply with its obligations) in terms of the design and scale of storage and collection and treatment of liquid
(leachates) and gas (biogas) effluents. It also requires provisions for these facilities to be inspected over a 30-year period after
closure.
These two types of provisions (rehabilitation and long-term monitoring) are calculated on a case-by-case basis depending on the site
concerned. In accordance with the accrual basis of accounting, the provisions are recorded over the period that the site is in
operation, pro rata to the depletion of landfill capacity (void-space) (matching of income and expenses). Costs to be incurred at the
time of a site’s closure or during the long-term monitoring period (30 years after a site is shut down within the European Union) are
discounted to present value. An asset is recorded as a counterparty against the provision. It is depreciated in line with the depletion of
the landfill capacity or the need for capping, during the period.
The rehabilitation provision calculations (at the time the facility is shut down) depend on whether the capping used is: semi-
permeable, semi-permeable with drainage, or impermeable. That choice has a considerable impact on future levels of leachate
effluents and therefore on future costs of treating such effluents. Calculating the provision requires an evaluation of the cost of
rehabilitating the area to be covered. The provision recorded in the statement of financial position at year-end must cover the costs of
rehabilitating the untreated surface area (difference between the fill rate and the percentage of the site’s area that has already been
rehabilitated). The amount of the provision is reviewed each year based on work completed or still to be carried out.
The calculation of the provision for long-term monitoring depends on the costs linked to the production of leachate and biogas
effluents on the one hand, and on the amount of biogas recycled on the other. Biogas recycling represents a source of revenue and is
deducted from long-term monitoring expenses. The main expense items arising from long-term monitoring obligations relate to:
• Construction of infrastructure (biogas recycling facility, installation of leachate treatment facility) and the demolition of
installations used while the site was in operation;
• Upkeep and maintenance of the protective capping and of the infrastructure (surface water collection);
• Control and monitoring of surface water, underground water and leachates;
• Replacement and repair of observation wells (piezometer wells);
• Leachate treatment costs;
• Biogas collection and processing costs (taking into account any revenues from biogas recycling).
The provision for long-term monitoring obligations that should be recorded in the statement of financial position at year-end depends
on the fill rate of the facility at the end of the period, the estimated aggregate costs per year and per unit (based on standard or
specific costs), the estimated closure date of the site and the discount rate applied to each site (depending on its residual life).
15.5 Other contingencies
“Other contingencies” mainly includes provisions for miscellaneous employee-related and environment-related litigations and for
various business risks.
74
NOTE 16 Post-employment benefit obligations and other long-term benefits
16.1 Description of the main pension plans and related benefits
Most Group companies grant their employees post-employment benefits (pension plans, retirement bonuses, medical coverage,
benefits in kind, etc.) as well as other long-term benefits, such as jubilee and other long-service awards.
16.1.1 Main pension plans
In France, employees have defined-contribution retirement plans, such as the basic social security benefits, and supplementary
pension schemes. Some employees also have optional retirement plans, some of which are defined-benefit plans through which the
employer agrees to pay its employees, or a category of its employees, retirement benefits based on a contractually agreed amount.
Thus, the so-called “1991” and “1998” defined-benefit plans at SUEZ ENVIRONNEMENT COMPANY, SUEZ ENVIRONNEMENT
SAS, Lyonnaise des Eaux France and Eau et Force apply to those companies' senior executives. At December 31, 2013, the
Projected Benefit Obligation (PBO) for this senior executives' plan was €46.4 million, against €42.5 million at December 31, 2012. The
average duration of the actuarial liability for the senior executives' plans is 13 years. It should be noted that these plans are partially
funded (25% of gross debt at December 31, 2013).
All employees also receive a retirement termination benefit in the form of a lump-sum payment on the date of the employee’s effective
departure. Such indemnities correspond to defined-benefit plans.
Outside France, the main retirement plans and related benefits involve the companies in the US and the UK.
In the United States, there are two defined benefit plans: the United Water Resources Inc. Retirement Plan, closed to new employees
since January 2010, and the United Water Environmental Services Pension Plan for employees of the unregulated business sector.
The latter was closed to non-unionized employees in December 2010. In addition, key executives have a specific retirement plan
(SERP). At December 31, 2013, the PBO for the United Water defined-benefit pension plans was €369.6 million, against €417 million
at December 31, 2012. The average duration of the actuarial liability for the United Water plans is 13 years. It should be noted that
these plans are funded up to 67% at December 31, 2013.
In addition, all US subsidiaries offer a 401(k)-type defined-contribution plan to their employees.
In the United Kingdom, Sita UK has several defined-benefit retirement plans, most of which are closed to new hires, except for the
Sita Final Salary Pension Scheme. Sita UK, as part of its expansion, has acquired various entities throughout the United Kingdom.
These entities were most often public companies prior to their acquisition, so their staff was affiliated with the Local Government
Pension Schemes (LGPS), which Sita UK must maintain. At December 31, 2013, the PBO for the Sita UK retirement plans was
€104.7 million, against €106.6 million at December 31, 2012. The average duration of the actuarial liability for the Sita UK plans is 19
years. It should be noted that these plans are funded up to 94% at December 31, 2013.
Employees hired after the closing date of these plans are covered by a defined-contribution plan, the Sita Stakeholder pension plan.
As mentioned above, defined-benefit plans may be fully or partially funded by contributions to a pension fund (as it is the case in the
US and the UK) or to a dedicated fund managed by an insurance company (France). These funds are fed by contributions made by
the company and, in certain cases, by the employees.
16.1.2 Multi-employer pension plans
Employees of some Group companies are affiliated to multi-employer pension plans. This is especially the case in the Netherlands,
where most of the Group’s entities are in business activities that make it mandatory to join an industry-wide scheme. These plans
spread risk so that financing is assured through payroll-based contributions, calculated uniformly across all affiliated companies. In the
Netherlands, multi-employer plans are defined benefit plans. However, the Group recognizes them as defined contribution plans in
accordance with IAS 19.
Total contributions of €2.5 million are expected in 2014.
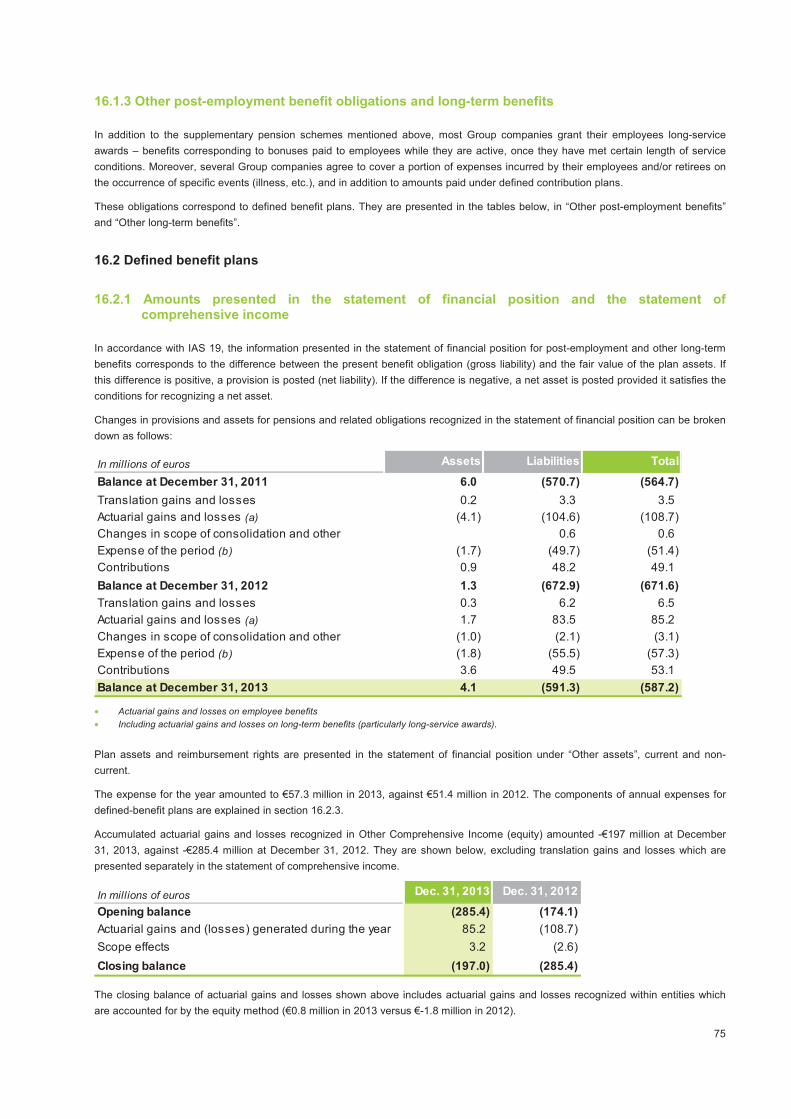
75
16.1.3 Other post-employment benefit obligations and long-term benefits
In addition to the supplementary pension schemes mentioned above, most Group companies grant their employees long-service
awards – benefits corresponding to bonuses paid to employees while they are active, once they have met certain length of service
conditions. Moreover, several Group companies agree to cover a portion of expenses incurred by their employees and/or retirees on
the occurrence of specific events (illness, etc.), and in addition to amounts paid under defined contribution plans.
These obligations correspond to defined benefit plans. They are presented in the tables below, in “Other post-employment benefits”
and “Other long-term benefits”.
16.2 Defined benefit plans
16.2.1 Amounts presented in the statement of financial position and the statement of comprehensive income
In accordance with IAS 19, the information presented in the statement of financial position for post-employment and other long-term
benefits corresponds to the difference between the present benefit obligation (gross liability) and the fair value of the plan assets. If
this difference is positive, a provision is posted (net liability). If the difference is negative, a net asset is posted provided it satisfies the
conditions for recognizing a net asset.
Changes in provisions and assets for pensions and related obligations recognized in the statement of financial position can be broken
down as follows:
• Actuarial gains and losses on employee benefits
• Including actuarial gains and losses on long-term benefits (particularly long-service awards).
Plan assets and reimbursement rights are presented in the statement of financial position under “Other assets”, current and non-
current.
The expense for the year amounted to €57.3 million in 2013, against €51.4 million in 2012. The components of annual expenses for
defined-benefit plans are explained in section 16.2.3.
Accumulated actuarial gains and losses recognized in Other Comprehensive Income (equity) amounted -€197 million at December
31, 2013, against -€285.4 million at December 31, 2012. They are shown below, excluding translation gains and losses which are
presented separately in the statement of comprehensive income.
The closing balance of actuarial gains and losses shown above includes actuarial gains and losses recognized within entities which
are accounted for by the equity method (€0.8 million in 2013 versus €-1.8 million in 2012).
In millions of euros Assets Liabilities Total
Balance at December 31, 2011 6.0 (570.7) (564.7)
Translation gains and losses 0.2 3.3 3.5
Actuarial gains and losses (a) (4.1) (104.6) (108.7)
Changes in scope of consolidation and other 0.6 0.6
Expense of the period (b) (1.7) (49.7) (51.4)
Contributions 0.9 48.2 49.1
Balance at December 31, 2012 1.3 (672.9) (671.6)
Translation gains and losses 0.3 6.2 6.5
Actuarial gains and losses (a) 1.7 83.5 85.2
Changes in scope of consolidation and other (1.0) (2.1) (3.1)
Expense of the period (b) (1.8) (55.5) (57.3)
Contributions 3.6 49.5 53.1
Balance at December 31, 2013 4.1 (591.3) (587.2)
In millions of euros Dec. 31, 2013 Dec. 31, 2012
Opening balance (285.4) (174.1)
Actuarial gains and (losses) generated during the year 85.2 (108.7)
Scope effects 3.2 (2.6)
Closing balance (197.0) (285.4)

76
16.2.2 Change in the amount of obligations and plan assets
The table below shows the amount of present benefit obligations and plan assets of the SUEZ ENVIRONNEMENT Group, the
changes to these over the periods concerned, as well as a reconciliation with the amounts recognized in the statement of financial
position.
• Pensions and retirement bonuses.
• Medical coverage, gratuities and other post-employment benefits.
• Long-service awards and other long-term benefits.
In 2013, the change in the net pension obligation is mainly due to actuarial gains which amounted to €87 million (€85.2 million
recorded in “Other comprehensive income” and €1.8 million in the income statement).
In 2012, the change in the net pension obligation was mainly explained by the increase in the net actuarial loss of €111.3 million. This
actuarial loss (€108.7 million recognized in other comprehensive income and €2.6 million in the income statement) included a €112.4
million loss directly related to lower discount and inflation rates in 2012. Moreover, the experience adjustment, corresponding to the
fair value measurement of plan assets at December 31, 2012, generated an actuarial gain of €10.8 million. The balance mainly
reflected actuarial losses relative to experience adjustments on the benefit obligation.
In millions of euros
Pension
benefit
obligations
(a)
Other post-
employment
benefits (b)
Other
long term
benefits (c) Total
Pension
benefit
obligations
(a)
Other post-
employment
benefits (b)
Other
long term
benefits (c) Total
Change in projected benefit obligation
Projected benefit obligation
at the beginning of the period(888.9) (238.2) (22.6) (1,149.7) (771.7) (205.6) (20.9) (998.2)
Service Cost (31.5) (7.6) (1.3) (40.4) (28.5) (6.3) (1.2) (36.0)
Interest cost (31.2) (9.4) (0.6) (41.2) (33.7) (9.4) (0.8) (43.9)
Contributions paid (1.3) - - (1.3) (1.4) - - (1.4)
Amendments - - - - (0.1) 0.1 - (0.0)
Acquisitions/Disposals of subsidiaries (2.8) - (0.3) (3.1) 0.5 - (0.0) 0.5
Curtailments/settlements 4.3 2.1 - 6.4 5.2 0.3 1.6 7.1
Special terminations (0.2) - - (0.2) (0.1) (0.1) - (0.2)
Financial actuarial gains and losses 37.3 16.6 0.8 54.7 (85.6) (19.3) (1.2) (106.1)
Demographic actuarial gains and losses 11.1 (0.6) 1.0 11.5 (7.2) (7.4) (1.4) (16.0)
Benefits paid 36.8 7.2 1.8 45.8 29.6 6.9 1.6 38.1
Other 17.1 5.0 0.1 22.2 4.1 2.6 (0.3) 6.4
Projected benefit obligation
at the end of periodA (849.3) (224.9) (21.1) (1,095.3) (888.9) (238.2) (22.6) (1,149.7)
Change in fair value of plan assets
Fair value of plan assets
at the beginning of the period429.8 46.0 - 475.8 389.7 42.0 - 431.7
Expected return on plan assets 16.9 2.2 19.1 24.6 3.0 - 27.6
Contributions received 41.8 10.8 1.8 54.4 42.6 6.3 1.6 50.5
Acquisitions/Disposals of subsidiaries - - - - - - -
Curtailments/settlements (2.8) - (2.8) (3.7) (0.1) - (3.8)
Actuarial gains and losses 17.1 3.7 20.8 8.3 2.5 - 10.8
Benefits paid (36.6) (7.2) (1.8) (45.6) (29.6) (6.9) (1.6) (38.1)
Other (11.3) (2.3) (13.6) (2.1) (0.8) - (2.9)
Fair value of plan assets
at the end of periodB 454.9 53.2 - 508.1 429.8 46.0 - 475.8
Funded status A+B (394.4) (171.7) (21.1) (587.2) (459.1) (192.2) (22.6) (673.9)
Unrecognized past service cost - 8.8 (6.5) - 2.3
Net benefit obligation (394.4) (171.7) (21.1) (587.2) (450.3) (198.7) (22.6) (671.6)
TOTAL LIABILITIES (398.5) (171.7) (21.1) (591.3) (451.6) (198.7) (22.6) (672.9)
TOTAL ASSETS 4.1 - 4.1 1.3 - - 1.3
December 31, 2013 December 31, 2012

77
16.2.3 Components of cost for the period
The net cost recognized in respect of pensions and other defined benefit obligations in 2013 and 2012 breaks down as follows:
16.2.4 Funding policy and strategy
When defined benefit plans are funded, the related plan assets are invested through pension funds and/or with insurance companies,
depending on the investment practices specific to the country concerned. The investment strategies underlying these defined benefit
plans are aimed at striking the right balance between an optimum return on investment and an acceptable level of risk.
These strategies have a twofold objective:
• to maintain sufficient income streams and liquidity to cover pensions and other benefit payments; and
• in a controlled-risk environment, to achieve a long-term return on investment matching the discount rate or, as applicable, at
least equal to the future returns required.
When plan assets are invested through pension funds, investment decisions and the allocation of plan assets are the responsibility of
the fund manager concerned. For French companies, where plan assets are invested through an insurance company, the fund
manager manages the investment portfolio in units of account or euros, and guarantees a rate of return on the related assets. Such
diversified funds are characterized by active management benchmarked to composite indices, adapted to the long-term horizon of the
liabilities and taking into account the government’s eurozone obligations and the shares of the largest companies in and outside the
eurozone. In the case of euro funds, the insurer’s sole obligation is to ensure a fixed minimum return on plan assets.
The funding of these obligations breaks down as follows:
The allocation of plan assets by main asset category breaks down as follows:
In millions of euros Dec. 31, 2013 Dec. 31, 2012
Current service cost (40.4) (36.0)
Net interest expense on the net defined benefit liability (22.1) (16.3)
Actuarial gains or losses 1.8 (2.6)
Past service cost - 0.5
Gains or losses on pension plan curtailments, terminations and
settlements 3.6 3.3
Special terminations (0.2) (0.3)
Total (57.3) (51.4)
Of which recognized in current operating income (35.2) (35.1)
Of which recognized in financial income/(loss) (22.1) (16.3)
In millions of euros
Present benefit
obligation
Fair value of plan
assets
Cost of
unrecognized past
service
Limit on defined
benefit assets and
supplementary
provision
Total net
obligation
Underfunded plans (877.1) 446.3 4.3 - (426.5)
Overfunded plans (31.9) 29.5 - - (2.4)
Unfunded plans (240.7) - (2.0) - (242.7)
Total December 31, 2012 (1,149.7) 475.8 2.3 - (671.6)
Underfunded plans (793.3) 451.3 - - (342.0)
Overfunded plans (53.3) 56.8 - - 3.5
Unfunded plans (248.7) - - - (248.7)
Total December 31, 2013 (1,095.3) 508.1 - - (587.2)
2013 2012
Equities 39% 35%
Bonds 43% 47%
Real Estate 1% 1%
Other (including money market securities) 17% 17%
TOTAL 100% 100%
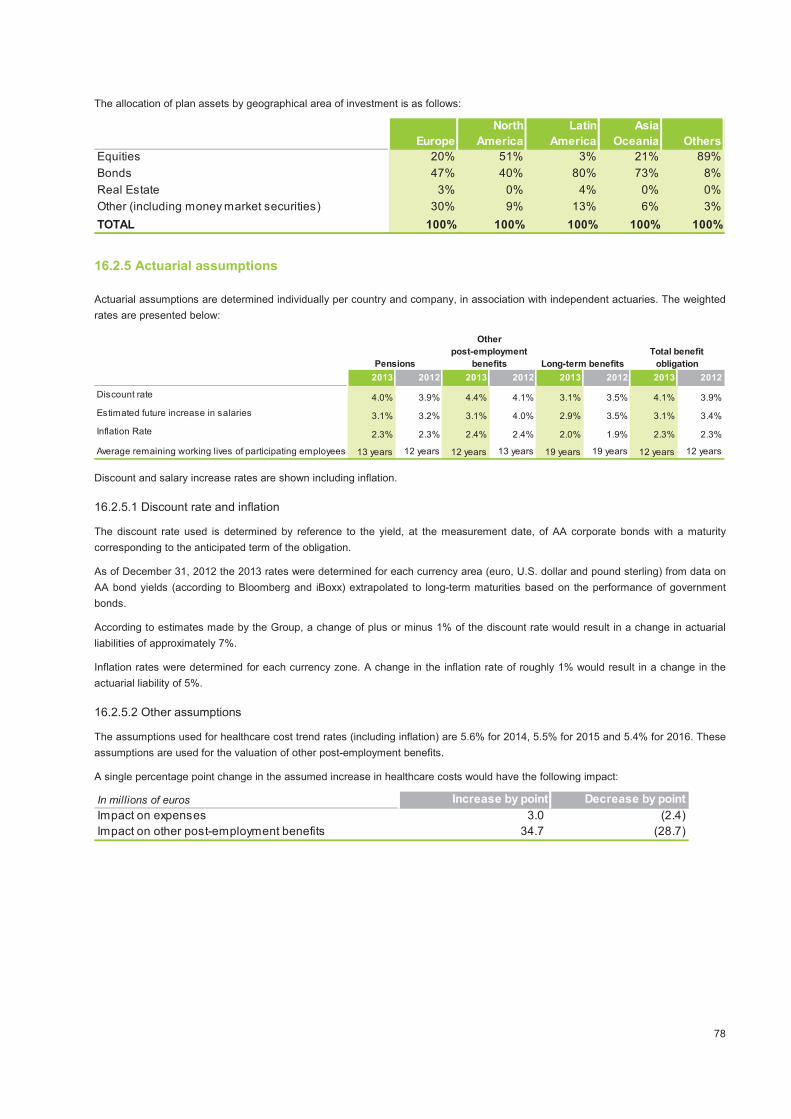
78
The allocation of plan assets by geographical area of investment is as follows:
16.2.5 Actuarial assumptions
Actuarial assumptions are determined individually per country and company, in association with independent actuaries. The weighted
rates are presented below:
Discount and salary increase rates are shown including inflation.
16.2.5.1 Discount rate and inflation
The discount rate used is determined by reference to the yield, at the measurement date, of AA corporate bonds with a maturity
corresponding to the anticipated term of the obligation.
As of December 31, 2012 the 2013 rates were determined for each currency area (euro, U.S. dollar and pound sterling) from data on
AA bond yields (according to Bloomberg and iBoxx) extrapolated to long-term maturities based on the performance of government
bonds.
According to estimates made by the Group, a change of plus or minus 1% of the discount rate would result in a change in actuarial
liabilities of approximately 7%.
Inflation rates were determined for each currency zone. A change in the inflation rate of roughly 1% would result in a change in the
actuarial liability of 5%.
16.2.5.2 Other assumptions
The assumptions used for healthcare cost trend rates (including inflation) are 5.6% for 2014, 5.5% for 2015 and 5.4% for 2016. These
assumptions are used for the valuation of other post-employment benefits.
A single percentage point change in the assumed increase in healthcare costs would have the following impact:
Europe
North
America
Latin
America
Asia
Oceania Others
Equities 20% 51% 3% 21% 89%
Bonds 47% 40% 80% 73% 8%
Real Estate 3% 0% 4% 0% 0%
Other (including money market securities) 30% 9% 13% 6% 3%
TOTAL 100% 100% 100% 100% 100%
2013 2012 2013 2012 2013 2012 2013 2012
Discount rate 4.0% 3.9% 4.4% 4.1% 3.1% 3.5% 4.1% 3.9%
Estimated future increase in salaries 3.1% 3.2% 3.1% 4.0% 2.9% 3.5% 3.1% 3.4%
Inflation Rate 2.3% 2.3% 2.4% 2.4% 2.0% 1.9% 2.3% 2.3%
Average remaining working lives of participating employees 13 years 12 years 12 years 13 years 19 years 19 years 12 years 12 years
Pensions
Other
post-employment
benefits Long-term benefits
Total benefit
obligation
In millions of euros Increase by point Decrease by point
Impact on expenses 3.0 (2.4)
Impact on other post-employment benefits 34.7 (28.7)

79
16.2.6 Geographical breakdown of obligations
In 2013, the geographical breakdown of the main obligations and the related actuarial assumptions (including inflation) were as
follows:
(a) Funded status corresponds to the difference between the present benefit obligation and the fair value of the plan assets.
Concerning “Rest of the world” category, the funded status relating to pension mainly concerns Sweden, while the funded status
relating to the other benefit obligations stems largely from Morocco.
16.2.7 Payments due in 2014
The Group expects to contribute approximately €58.9 million to its defined benefit plans in 2014.
16.3 Defined contribution plans
In 2013, the Group SUEZ ENVIRONNEMENT recorded a €66.6 million expense in respect of contributions to Group defined
contribution plans. These contributions are recorded under “Personnel costs” in the income statement.
In millions of euros Pensions
Other benefit
obligations Pensions
Other benefit
obligations Pensions
Other benefit
obligations Pensions
Other benefit
obligations
Funded status (a) (277.2) (106.3) (6.5) - (73.9) (48.2) (36.9) (38.2)
Discount rate 3.0% 3.0% 4.4% - 5.1% 5.2% 4.1% 5.7%
Estimated future increase in salaries 3.0% 3.6% 3.5% - 3.1% 3.0% 2.3% 2.1%
Inflation Rate 2.0% N/A 2.5% - 3.0% 3.0% 1.2% 1.9%
Average remaining working lives of
participating employees17 years 19 years 10 years - 13 years 12 years 11 years 13 years
Euro Zone United Kingdom United States Rest of the World

80
NOTE 17 Construction contracts
The “Amounts due from customers under construction contracts” and “Amounts due to customers under construction contracts” items
are presented in the statement of financial position under “Other assets” and “Other liabilities” respectively.
According to the presentation method adopted by the Group, provisions for loss at termination of construction contracts have been
transferred to the bottom of the statement of financial position under “Amounts due to customers under construction contracts”. In
2013, the decrease in this liability is mainly explained by the reversal of the remaining provision for loss at termination regarding the
Melbourne desalination plant construction contract after the end of legal disputes (see Note 2 “Major transactions”).
Contracts in progress at the closing date:
For the design and construction contracts of Degrémont and OIS, the Group guarantees, by contract, its customers on the delivery of
plants ready for operation. In this context, the Group is required to give guarantees which are contingent liabilities, for which the Group
believes that the probability of cash out is low.
The significant reduction in accrued costs and margins recognized at end-2013 compared with 2012 is mainly due to the end of
construction on the Melbourne desalination plant, which was completed in December 2012.
In millions of euros Dec. 31, 2013 Dec. 31, 2012
Amounts due from customers under construction contracts 102.2 127.3
Amounts due to customers under construction contracts 222.0 349.4
NET POSITION (119.8) (222.1)
In millions of euros Dec. 31, 2013 Dec. 31, 2012
Cumulated cost incurred and margins recognized 3,309.2 4,490.2
Advances received 34.5 27.4
Retentions 37.7 43.0

81
NOTE 18 Finance leases
The net amount of Property, plant and equipment assets owned under finance leases are broken down into various asset categories,
depending on their type.
The main finance leases entered into by the Group concern the incineration plants of Novergie and Torre Agbar as a result of Agbar
taking over in 2010, the rights and obligations of the finance lease previously linking Azurelau to Caixa, the owner and financial
leaseholder of the building.
The reconciliation between the undiscounted value and the present value of minimum lease payments is as follows:
The following table provides a reconciliation of maturities of liabilities under finance leases as reported in the statement of financial
position (see Note 12.2.1) with undiscounted future minimum lease payments by maturity:
Future minimum lease
payments at Dec. 31, 2013
Future minimum lease
payments at Dec. 31, 2012
In millions of euros
Undiscounted
value
Present
value
Undiscounted
value
Present
value
During year 1 67.2 64.5 66.4 63.9
During years 2 to 5 inclusive 260.1 223.1 244.0 214.1
Beyond year 5 140.8 110.6 228.3 164.3
TOTAL FUTURE MINIMUM LEASE PAYMENTS (a) 468.1 398.2 538.7 442.3
(a) Including amortized cost
In millions of euros Total During year 1
During years 2 to
5 inclusive Beyond year 5
Liabilities under financial lease (a) 398.2 64.5 223.1 110.6
Impact of discounting future repayments of principal and interest 69.9 2.7 37.0 30.2
UNDISCOUNTED FUTURE MINIMUM LEASE PAYMENTS 468.1 67.2 260.1 140.8
(a) Including amortized cost
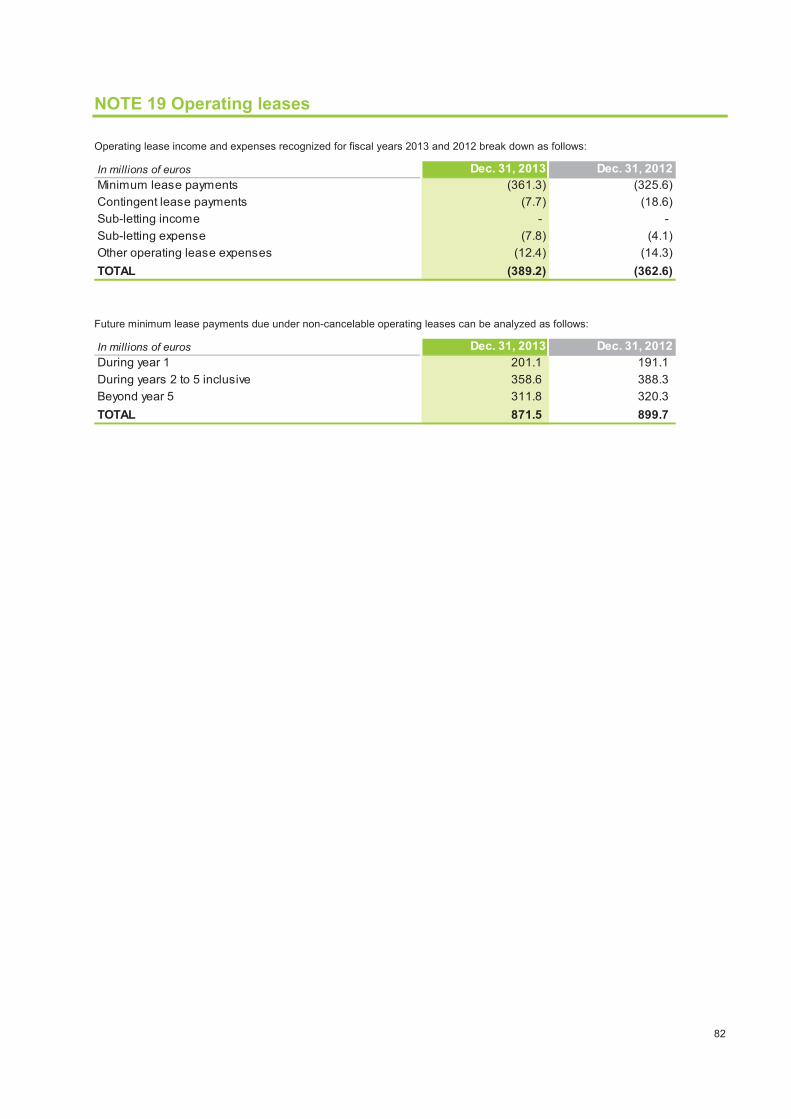
82
NOTE 19 Operating leases
Operating lease income and expenses recognized for fiscal years 2013 and 2012 break down as follows:
Future minimum lease payments due under non-cancelable operating leases can be analyzed as follows:
In millions of euros Dec. 31, 2013 Dec. 31, 2012
Minimum lease payments (361.3) (325.6)
Contingent lease payments (7.7) (18.6)
Sub-letting income - -
Sub-letting expense (7.8) (4.1)
Other operating lease expenses (12.4) (14.3)
TOTAL (389.2) (362.6)
In millions of euros Dec. 31, 2013 Dec. 31, 2012
During year 1 201.1 191.1
During years 2 to 5 inclusive 358.6 388.3
Beyond year 5 311.8 320.3
TOTAL 871.5 899.7
83
NOTE 20 Service concession arrangements
SIC 29 – Service Concession Arrangements-Disclosures was published in May 2001 and deals with the information regarding
concession contracts which should be disclosed in the Notes to the Financial Statements.
IFRIC 12 – Service Concession Arrangements, published in November 2006 deals with the recognition of concession contracts which
meet certain criteria according to which it is estimated that the concession-grantor controls the facilities (see Note 1.5.6).
As specified in SIC 29, a service concession agreement generally involves a transfer by the concession-grantor to the concession-
holder for the entire duration of the concession:
(a) of the right to offer services enabling the public to access major economic and social services, and
(b) of the right, in certain cases, to use tangible and intangible assets and/or specified financial assets; in exchange for the
commitment made by the concession-holder,
(c) to offer services in accordance with certain terms and conditions during the length of the concession; and
(d) if the need arises, to return the rights received at the beginning of the concession and/or acquired during the concession.
The common characteristic of all the service concession agreements is the fact that the concession holder is both granted a right and
becomes bound by an obligation to offer public services.
The Group manages a large number of concession contracts as defined by SIC 29 in drinking water distribution, wastewater
treatment, and waste management.
These concession contracts include terms and conditions on rights and obligations with regard to the infrastructure and to the
obligations relating to public service, in particular the obligation to allow users to access the public service, an obligation, which, in
certain contracts, may be subject to a timeframe. The terms of the concessions vary between 12 and 50 years, depending mainly on
the level of investments to be made by the concession operator.
In exchange for these obligations, the Group is entitled to bill either the local authority granting the concession (mainly incineration
activities and BOT water treatment contracts) or the users for the services provided. That right gives rise either to an intangible asset,
or to a receivable, or a tangible asset, depending on the accounting model applicable (see Note 1.5.6).
The tangible asset model is used when the concession-grantor does not control the infrastructure, like for example, water distribution
concession contracts in the United States which do not provide for the return to the concession grantor at the end of the contract of
the infrastructure, which remains the property of the SUEZ ENVIRONNEMENT Group.
A general obligation also exists to return the concession infrastructure in good working condition at the end of the contract. Where
appropriate (see Note 1.5.6), this obligation results in the recognition of a capital renewal and replacement liability. The replacement
liability amounted to €280 million at December 31, 2013 versus €288.7 million at December 31, 2012 and is classified as « Other
current liabilities ».
Services are generally billed at a fixed price which is index-linked for the duration of the contract. However, contracts contain clauses
providing for periodic price adjustments (usually at the end of a five-year period) if there is a change in the economic conditions which
were initially expected when the contracts were signed.

84
NOTE 21 Share-based payments
Expenses recognized in respect of share-based payments are as follows:
(a) The impact of Share Appreciation Rights is shown excluding hedging by warrants.
21.1 Stock option plans
21.1.1 Arrangements and grants
No stock options were allocated in 2013, as in 2011 and 2012. Arrangements relating to plans prior to 2013 are described in previous
SUEZ, later GDF SUEZ and SUEZ ENVIRONNEMENT COMPANY Reference Documents.
21.1.2 Description of current plans
SUEZ ENVIRONNEMENT COMPANY stock option plans
The average share price for SUEZ ENVIRONNEMENT COMPANY in 2013 was €10.95.
GDF SUEZ stock option plans
The average share price for GDF SUEZ in 2013 was €16.36.
In millions of euros Note 2013 2012
Stock-option plans 21.1 (5.1) (7.3)
Performance share plans 21.2 (5.5) (5.1)
Worldwide financial incentive scheme 21.3 (13.6) (10.3)
Employees share issues (a) 21.4 - (0.9)
TOTAL (24.2) (23.6)
(Expense) for the period
Plan
Date of the
authorizing
Shareholders
' Meeting
Starting
point for
exercise
of the
options
Adjusted
Exercise
price
Outstanding
number of
shares at
12/31/2012 Exercised* Granted
Cancelled
or Expired
Outstanding
number of
shares at
12/31/2013
Expiration
date
Residual
life
12/17/2009 5/26/2009 12/17/2013 15.49 3,373,784 - - 1,817,183 1,556,601 12/16/2017 4.0
12/16/2010 5/26/2009 12/16/2014 14.20 2,900,300 - - 40,200 2,860,100 12/15/2018 5.0
TOTAL 6,274,084 - - 1,857,383 4,416,701
* under specif ic circumstances such as retirement or death, the anticipated exercice of options is authorized.
Plan
Date of the
authorizing
Shareholders
' Meeting
Starting
point for
exercise
of the
options
Adjusted
Exercise
price
Outstanding
number of
shares at
12/31/2012 Exercised* Granted
Cancelled
or Expired
Outstanding
number of
shares at
12/31/2013
Expiration
date
Residual
life
12/9/2005 * 4/27/2004 12/9/2009 22.79 1,693,667 - - 1,693,667 - 12/9/2013 -
1/17/2007 * 4/27/2004 1/16/2011 36.62 1,614,018 - - 25,757 1,588,261 1/16/2015 1.0
11/14/2007 * 5/4/2007 11/13/2011 41.78 1,270,806 - - 15,744 1,255,062 11/13/2015 1.9
11/12/2008 * 7/16/2008 11/12/2012 32.74 1,026,670 - - 12,540 1,014,130 11/11/2016 2.9
11/10/2009 * 5/4/2009 11/10/2013 29.44 389,154 - - 5,580 383,574 11/9/2017 3.9
TOTAL 5,994,315 - - 1,753,288 4,241,027
* exercisable plans.
** under specific circumstances such as retirement or death, the anticipated exercice of options is authorized.
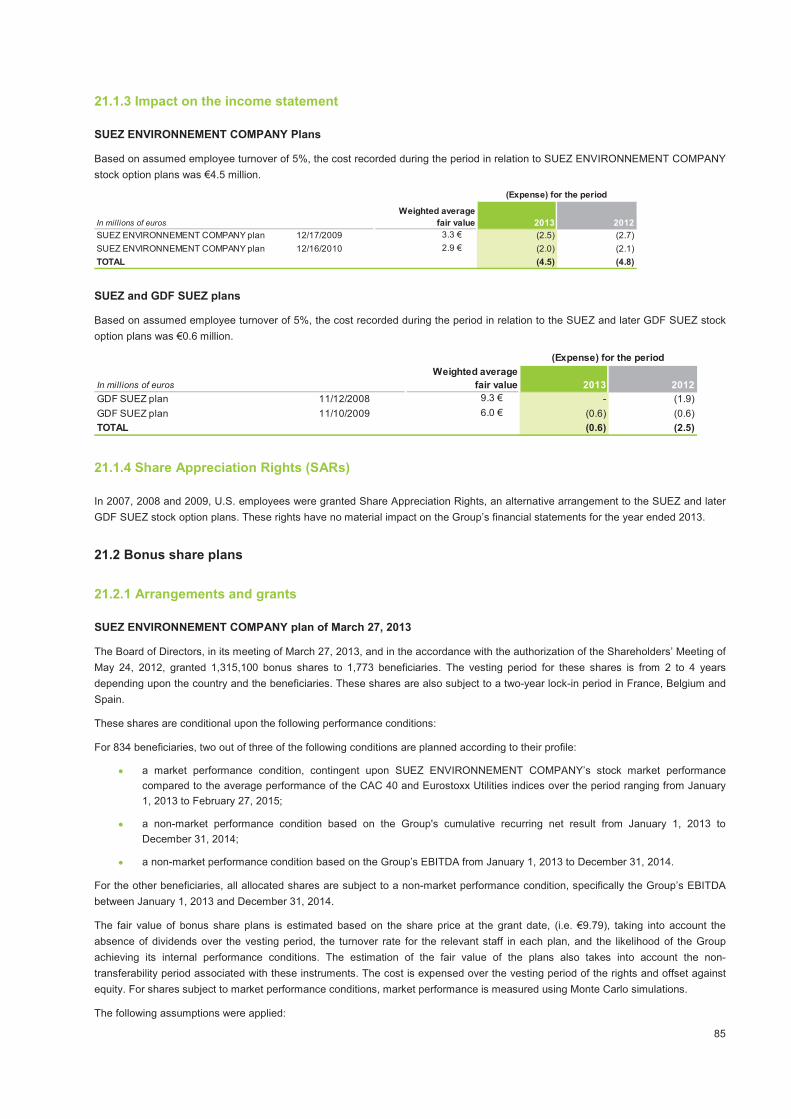
85
21.1.3 Impact on the income statement
SUEZ ENVIRONNEMENT COMPANY Plans
Based on assumed employee turnover of 5%, the cost recorded during the period in relation to SUEZ ENVIRONNEMENT COMPANY
stock option plans was €4.5 million.
SUEZ and GDF SUEZ plans
Based on assumed employee turnover of 5%, the cost recorded during the period in relation to the SUEZ and later GDF SUEZ stock
option plans was €0.6 million.
21.1.4 Share Appreciation Rights (SARs)
In 2007, 2008 and 2009, U.S. employees were granted Share Appreciation Rights, an alternative arrangement to the SUEZ and later
GDF SUEZ stock option plans. These rights have no material impact on the Group’s financial statements for the year ended 2013.
21.2 Bonus share plans
21.2.1 Arrangements and grants
SUEZ ENVIRONNEMENT COMPANY plan of March 27, 2013
The Board of Directors, in its meeting of March 27, 2013, and in the accordance with the authorization of the Shareholders’ Meeting of
May 24, 2012, granted 1,315,100 bonus shares to 1,773 beneficiaries. The vesting period for these shares is from 2 to 4 years
depending upon the country and the beneficiaries. These shares are also subject to a two-year lock-in period in France, Belgium and
Spain.
These shares are conditional upon the following performance conditions:
For 834 beneficiaries, two out of three of the following conditions are planned according to their profile:
• a market performance condition, contingent upon SUEZ ENVIRONNEMENT COMPANY’s stock market performance
compared to the average performance of the CAC 40 and Eurostoxx Utilities indices over the period ranging from January
1, 2013 to February 27, 2015;
• a non-market performance condition based on the Group's cumulative recurring net result from January 1, 2013 to
December 31, 2014;
• a non-market performance condition based on the Group’s EBITDA from January 1, 2013 to December 31, 2014.
For the other beneficiaries, all allocated shares are subject to a non-market performance condition, specifically the Group’s EBITDA
between January 1, 2013 and December 31, 2014.
The fair value of bonus share plans is estimated based on the share price at the grant date, (i.e. €9.79), taking into account the
absence of dividends over the vesting period, the turnover rate for the relevant staff in each plan, and the likelihood of the Group
achieving its internal performance conditions. The estimation of the fair value of the plans also takes into account the non-
transferability period associated with these instruments. The cost is expensed over the vesting period of the rights and offset against
equity. For shares subject to market performance conditions, market performance is measured using Monte Carlo simulations.
The following assumptions were applied:
In millions of euros
Weighted average
fair value 2013 2012
SUEZ ENVIRONNEMENT COMPANY plan 12/17/2009 3.3 € (2.5) (2.7)
SUEZ ENVIRONNEMENT COMPANY plan 12/16/2010 2.9 € (2.0) (2.1)
TOTAL (4.5) (4.8)
(Expense) for the period
In millions of euros
Weighted average
fair value 2013 2012
GDF SUEZ plan 11/12/2008 9.3 € - (1.9)
GDF SUEZ plan 11/10/2009 6.0 € (0.6) (0.6)
TOTAL (0.6) (2.5)
(Expense) for the period

86
• volatility of 29.2%;
• a 2-year risk-free rate of 0.19%, a 3-year risk-free of 0.35% and a 4-year risk-free of 0.61%;
• a normalized annual dividend of €0.65.
A Monte Carlo model was used to assess the market conditions applied to some of the allocated shares. The following assumptions
were applied in addition to those cited above:
• correlation between SUEZ ENVIRONNEMENT COMPANY share price and the CAC 40 index: 65%;
• correlation between SUEZ ENVIRONNEMENT COMPANY share price and the Eurostoxx Utilities index: 70%;
• correlation between the CAC 40 and Eurostoxx Utilities indices: 85%;
• volatility of the Eurostoxx Utilities index: 23%;
• volatility of the CAC 40: 22%;
• index dividend rate: 3.5%.
The resulting fair value of the shares granted leads to a total expense of €8.1 million, recorded over the plan’s duration.
At December 31, 2013, the impact of this plan on the net income Group share stands at -€2.6 million.
21.2.2 Review of internal performance conditions
In addition to the service condition, some plans are subject to internal performance conditions. If the performance targets have not
been met in full, the number of shares granted to employees is reduced in accordance with the plan rules. Any such change in the
number of shares leads to a reduction in the total expense of the plan, in accordance with IFRS 2. Performance conditions are
reviewed at each year-end. Volume reductions in 2012 due to the non-achievement of performance conditions are insignificant. In
2013, a profit of €1.6 million was recognized for the 2010 SUEZ ENVIRONNEMENT COMPANY bonus share plans to cancel the
expenses recognized in previous years.
21.2.3 Impact on the income statement
SUEZ ENVIRONNEMENT COMPANY plans
During the period, an expense of €5.2 million was recognized for the SUEZ ENVIRONNEMENT COMPANY bonus share plans.
Number of
shares granted
Weighted average
fair value 2013 2012
December 2009 173,852 12.3 € (0.2) (0.3)
December 2010 829,080 11.6 € (0.1) (2.7)
March 2012 828,710 8.8 € (2.3) (1.8)
March 2013 1,315,100 6.5 € (2.6) -
TOTAL (5.2) (4.8)
(Expense) for the period
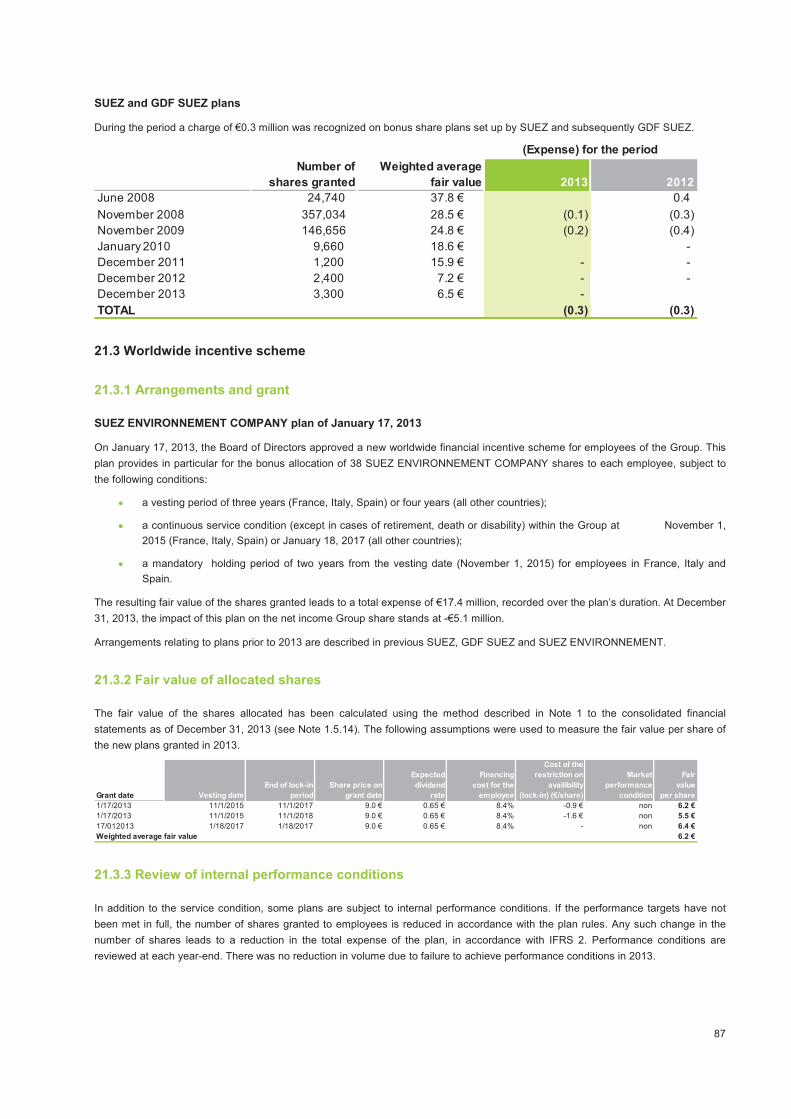
87
SUEZ and GDF SUEZ plans
During the period a charge of €0.3 million was recognized on bonus share plans set up by SUEZ and subsequently GDF SUEZ.
21.3 Worldwide incentive scheme
21.3.1 Arrangements and grant
SUEZ ENVIRONNEMENT COMPANY plan of January 17, 2013
On January 17, 2013, the Board of Directors approved a new worldwide financial incentive scheme for employees of the Group. This
plan provides in particular for the bonus allocation of 38 SUEZ ENVIRONNEMENT COMPANY shares to each employee, subject to
the following conditions:
• a vesting period of three years (France, Italy, Spain) or four years (all other countries);
• a continuous service condition (except in cases of retirement, death or disability) within the Group at November 1,
2015 (France, Italy, Spain) or January 18, 2017 (all other countries);
• a mandatory holding period of two years from the vesting date (November 1, 2015) for employees in France, Italy and
Spain.
The resulting fair value of the shares granted leads to a total expense of €17.4 million, recorded over the plan’s duration. At December
31, 2013, the impact of this plan on the net income Group share stands at -€5.1 million.
Arrangements relating to plans prior to 2013 are described in previous SUEZ, GDF SUEZ and SUEZ ENVIRONNEMENT.
21.3.2 Fair value of allocated shares
The fair value of the shares allocated has been calculated using the method described in Note 1 to the consolidated financial
statements as of December 31, 2013 (see Note 1.5.14). The following assumptions were used to measure the fair value per share of
the new plans granted in 2013.
21.3.3 Review of internal performance conditions
In addition to the service condition, some plans are subject to internal performance conditions. If the performance targets have not
been met in full, the number of shares granted to employees is reduced in accordance with the plan rules. Any such change in the
number of shares leads to a reduction in the total expense of the plan, in accordance with IFRS 2. Performance conditions are
reviewed at each year-end. There was no reduction in volume due to failure to achieve performance conditions in 2013.
Number of
shares granted
Weighted average
fair value 2013 2012
June 2008 24,740 37.8 € 0.4
November 2008 357,034 28.5 € (0.1) (0.3)
November 2009 146,656 24.8 € (0.2) (0.4)
January 2010 9,660 18.6 € -
December 2011 1,200 15.9 € - -
December 2012 2,400 7.2 € - -
December 2013 3,300 6.5 € -
TOTAL (0.3) (0.3)
(Expense) for the period
Grant date Vesting date
End of lock-in
period
Share price on
grant date
Expected
dividend
rate
Financing
cost for the
employee
Cost of the
restriction on
availibility
(lock-in) (€/share)
Market
performance
condition
Fair
value
per share
1/17/2013 11/1/2015 11/1/2017 9.0 € 0.65 € 8.4% -0.9 € non 6.2 €
1/17/2013 11/1/2015 11/1/2018 9.0 € 0.65 € 8.4% -1.6 € non 5.5 €
17/012013 1/18/2017 1/18/2017 9.0 € 0.65 € 8.4% - non 6.4 €
Weighted average fair value 6.2 €

88
21.3.4 Impact on the income statement
SUEZ ENVIRONNEMENT COMPANY plans
During the period, an expense of €6.1 million was recognized for the SUEZ ENVIRONNEMENT COMPANY worldwide incentive
scheme.
SUEZ and GDF SUEZ plans
During the period, an expense of €7.5 million was recognized for the SUEZ and GDF SUEZ worldwide incentive scheme.
21.4 Employee share issues
There was no employee share issue in 2013. The only impacts on 2013 income linked to employee share issues came from SARs
and the amortization of international matching contributions for the Spring 2007, LINK 2010 and Sharing 2011 plans.
In 2013, the accounting impact of employee share issues was not material.
The arrangements relating to Sharing 2011, Link 2010 and Spring 2007 plans are described in more detail in previous SUEZ, later
GDF SUEZ and SUEZ ENVIRONNEMENT COMPANY Reference Documents.
Number of
shares granted
Weighted average
fair value 2013 2012
June 2009 2,040,810 9.6 € (1.0) (2.0)
January 2013 3,018,720 6.2 € (5.1) -
TOTAL (6.1) (2.0)
(Expense) for the period
Number of
shares granted
Weighted average
fair value 2013 2012
June 2008 928,725 39.0 € (1.1)
July 2009 544,216 19.7 € (0.5) (1.1)
June 2011 749,655 19.9 € (3.4) (5.5)
October 2012 1,140,525 11.7 € (3.6) (0.6)
TOTAL (7.5) (8.3)
(Expense) for the period
2013 2012
Plan SUEZ ENVIRONNEMENT
Sharing 2011Share Appreciation Rights December 2011 0.4 (0.2)
Plan SUEZ ENVIRONNEMENT
Sharing 2011Matching shares - International December 2011 (0.1) (0.1)
Plan SUEZ Spring 2007 Matching shares - International August 2007 - (0.2)
Plan GDF SUEZ Link 2010 Matching shares - International August 2010 (0.2) (0.2)
Plan SUEZ Spring 2007 Share Appreciation Rights August 2007 - (0.2)
Plan GDF SUEZ Link 2010 Share Appreciation Rights August 2010 (0.1) -
TOTAL - (0.9)
(Expense) for the period
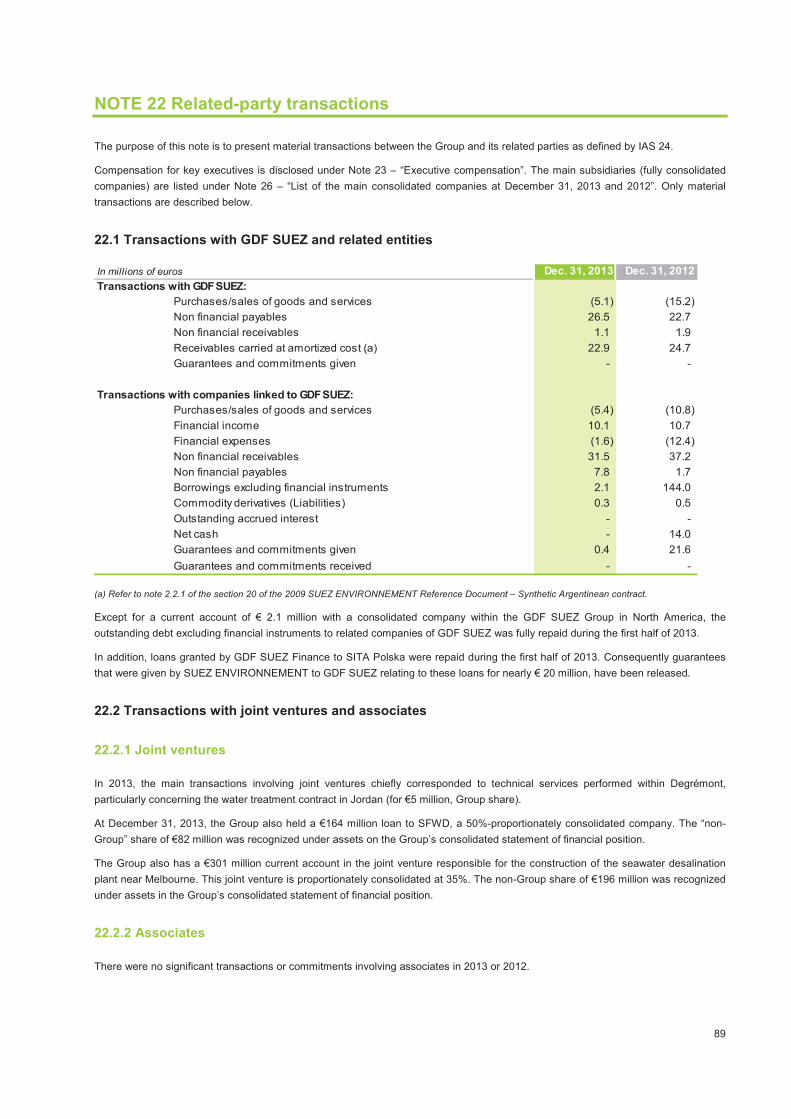
89
NOTE 22 Related-party transactions
The purpose of this note is to present material transactions between the Group and its related parties as defined by IAS 24.
Compensation for key executives is disclosed under Note 23 – “Executive compensation”. The main subsidiaries (fully consolidated
companies) are listed under Note 26 – “List of the main consolidated companies at December 31, 2013 and 2012”. Only material
transactions are described below.
22.1 Transactions with GDF SUEZ and related entities
(a) Refer to note 2.2.1 of the section 20 of the 2009 SUEZ ENVIRONNEMENT Reference Document – Synthetic Argentinean contract.
Except for a current account of € 2.1 million with a consolidated company within the GDF SUEZ Group in North America, the
outstanding debt excluding financial instruments to related companies of GDF SUEZ was fully repaid during the first half of 2013.
In addition, loans granted by GDF SUEZ Finance to SITA Polska were repaid during the first half of 2013. Consequently guarantees
that were given by SUEZ ENVIRONNEMENT to GDF SUEZ relating to these loans for nearly € 20 million, have been released.
22.2 Transactions with joint ventures and associates
22.2.1 Joint ventures
In 2013, the main transactions involving joint ventures chiefly corresponded to technical services performed within Degrémont,
particularly concerning the water treatment contract in Jordan (for €5 million, Group share).
At December 31, 2013, the Group also held a €164 million loan to SFWD, a 50%-proportionately consolidated company. The “non-
Group” share of €82 million was recognized under assets on the Group’s consolidated statement of financial position.
The Group also has a €301 million current account in the joint venture responsible for the construction of the seawater desalination
plant near Melbourne. This joint venture is proportionately consolidated at 35%. The non-Group share of €196 million was recognized
under assets in the Group’s consolidated statement of financial position.
22.2.2 Associates
There were no significant transactions or commitments involving associates in 2013 or 2012.
In millions of euros Dec. 31, 2013 Dec. 31, 2012
Transactions with GDF SUEZ:
Purchases/sales of goods and services (5.1) (15.2)
Non financial payables 26.5 22.7
Non financial receivables 1.1 1.9
Receivables carried at amortized cost (a) 22.9 24.7
Guarantees and commitments given - -
Transactions with companies linked to GDF SUEZ:
Purchases/sales of goods and services (5.4) (10.8)
Financial income 10.1 10.7
Financial expenses (1.6) (12.4)
Non financial receivables 31.5 37.2
Non financial payables 7.8 1.7
Borrowings excluding financial instruments 2.1 144.0
Commodity derivatives (Liabilities) 0.3 0.5
Outstanding accrued interest - -
Net cash - 14.0
Guarantees and commitments given 0.4 21.6
Guarantees and commitments received - -

90
NOTE 23 Executive compensation
The Group’s key executives were the nine members of the Management Committee at December 31, 2013 (see Section 14.1.3. of
this Reference Document).
Their compensation breaks down as follows:
(a) post-employment benefits relate to the SUEZ ENVIRONNEMENT Group plans only.
In millions of euros Dec. 31, 2013 Dec. 31, 2012
Short-term benefits 5.8 4.7
Post-employment benefit (a) 1.3 1.3
Share-based payments 0.8 1.1
TOTAL 7.9 7.1
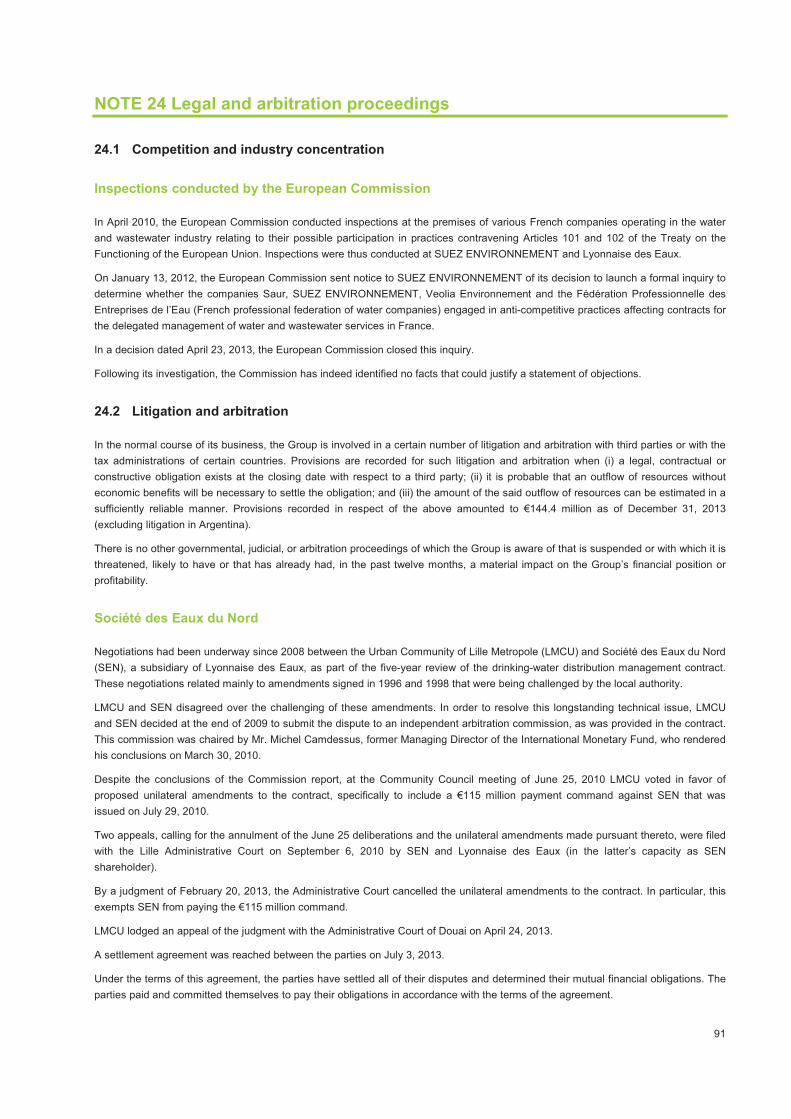
91
NOTE 24 Legal and arbitration proceedings
24.1 Competition and industry concentration
Inspections conducted by the European Commission
In April 2010, the European Commission conducted inspections at the premises of various French companies operating in the water
and wastewater industry relating to their possible participation in practices contravening Articles 101 and 102 of the Treaty on the
Functioning of the European Union. Inspections were thus conducted at SUEZ ENVIRONNEMENT and Lyonnaise des Eaux.
On January 13, 2012, the European Commission sent notice to SUEZ ENVIRONNEMENT of its decision to launch a formal inquiry to
determine whether the companies Saur, SUEZ ENVIRONNEMENT, Veolia Environnement and the Fédération Professionnelle des
Entreprises de l’Eau (French professional federation of water companies) engaged in anti-competitive practices affecting contracts for
the delegated management of water and wastewater services in France.
In a decision dated April 23, 2013, the European Commission closed this inquiry.
Following its investigation, the Commission has indeed identified no facts that could justify a statement of objections.
24.2 Litigation and arbitration
In the normal course of its business, the Group is involved in a certain number of litigation and arbitration with third parties or with the
tax administrations of certain countries. Provisions are recorded for such litigation and arbitration when (i) a legal, contractual or
constructive obligation exists at the closing date with respect to a third party; (ii) it is probable that an outflow of resources without
economic benefits will be necessary to settle the obligation; and (iii) the amount of the said outflow of resources can be estimated in a
sufficiently reliable manner. Provisions recorded in respect of the above amounted to €144.4 million as of December 31, 2013
(excluding litigation in Argentina).
There is no other governmental, judicial, or arbitration proceedings of which the Group is aware of that is suspended or with which it is
threatened, likely to have or that has already had, in the past twelve months, a material impact on the Group’s financial position or
profitability.
Société des Eaux du Nord
Negotiations had been underway since 2008 between the Urban Community of Lille Metropole (LMCU) and Société des Eaux du Nord
(SEN), a subsidiary of Lyonnaise des Eaux, as part of the five-year review of the drinking-water distribution management contract.
These negotiations related mainly to amendments signed in 1996 and 1998 that were being challenged by the local authority.
LMCU and SEN disagreed over the challenging of these amendments. In order to resolve this longstanding technical issue, LMCU
and SEN decided at the end of 2009 to submit the dispute to an independent arbitration commission, as was provided in the contract.
This commission was chaired by Mr. Michel Camdessus, former Managing Director of the International Monetary Fund, who rendered
his conclusions on March 30, 2010.
Despite the conclusions of the Commission report, at the Community Council meeting of June 25, 2010 LMCU voted in favor of
proposed unilateral amendments to the contract, specifically to include a €115 million payment command against SEN that was
issued on July 29, 2010.
Two appeals, calling for the annulment of the June 25 deliberations and the unilateral amendments made pursuant thereto, were filed
with the Lille Administrative Court on September 6, 2010 by SEN and Lyonnaise des Eaux (in the latter’s capacity as SEN
shareholder).
By a judgment of February 20, 2013, the Administrative Court cancelled the unilateral amendments to the contract. In particular, this
exempts SEN from paying the €115 million command.
LMCU lodged an appeal of the judgment with the Administrative Court of Douai on April 24, 2013.
A settlement agreement was reached between the parties on July 3, 2013.
Under the terms of this agreement, the parties have settled all of their disputes and determined their mutual financial obligations. The
parties paid and committed themselves to pay their obligations in accordance with the terms of the agreement.
92
Litigation in Argentina
In Argentina, tariffs applicable to public-service contracts were frozen by the Public Emergency and Exchange Regime Reform Law
(Emergency Act) in January 2002, preventing the application of contractual price indexation that would apply in the event of a
depreciation of the Argentine peso against the US dollar.
In 2003, Suez – now GDF SUEZ – and its co-shareholders in the water concessions for Buenos Aires and Santa Fe filed arbitration
proceedings against the Argentinean government, in its capacity as grantor, to enforce the concession agreements’ contractual
clauses with the International Center for the Settlement of Investment Disputes (ICSID), in accordance with the bilateral Franco-
Argentinean investment protection treaties.
These ICSID arbitration proceedings aim at obtaining indemnities to compensate for the loss of value of the investments made since
the start of the concession due to the measures adopted by the Argentinean government following the adoption of the
abovementioned Emergency Act. The ICSID acknowledged its jurisdiction to rule on the two cases in 2006, and hearings for both
disputes were held in 2007. At the same time as the ICSID proceedings, the concession-holders Aguas Argentinas and Aguas
Provinciales de Santa Fe were forced to file proceedings to cancel their concession agreement with local governments.
However, since the financial situation of the concession-holding companies had deteriorated since the Emergency Act, Aguas
Provinciales de Santa Fe announced that it was filing for judicial liquidation at its Shareholders’ Meeting on January 13, 2006.
At the same time, Aguas Argentinas applied to file a Concurso Preventivo (similar to a French bankruptcy procedure). As part of these
bankruptcy proceedings, a settlement proposal involving the novation of admissible Aguas Argentinas liabilities was approved by
creditors and ratified by the bankruptcy court on April 11, 2008. The liabilities are in the process of being settled. The proposal
provides for an initial payment of 20% (about US$40 million) upon ratification and a second payment of 20% in the event of
compensation by the Argentinean government. As controlling shareholders, SUEZ and Agbar decided to financially support Aguas
Argentinas in making this first payment, upon ratification, and paid US$6.1 million and US$3.8 million respectively.
For the record, SUEZ and SUEZ ENVIRONNEMENT – prior to both the SUEZ-Gaz de France merger and the listing of SUEZ
ENVIRONNEMENT COMPANY on the stock exchange – agreed to the economic transfer to SUEZ ENVIRONNEMENT of the rights
and obligations associated with the interests held by SUEZ in Aguas Argentinas and Aguas Provinciales de Santa Fe.
The Group considers that the provisions recorded in the financial statements relating to this litigation are appropriate.
In two decisions dated July 30, 2010, the ICSID recognized the Argentine government’s liability in canceling the Buenos Aires and
Santa Fe water and wastewater treatment concession contracts. In addition, in June 2011 the ICSID appointed an expert to provide a
definitive assessment of the compensation payable for the commercial harm.
A report on the Buenos Aires concession was presented by the expert to the ICSID in 2013. The expert report on the Santa Fe
concession is meanwhile expected in 2014. The proceedings are ongoing.
United Water (New York State, United States)
In March 2008, certain residents on the banks of the Hackensack River in Rockland County (New York State) filed a claim for a total
amount of US$66 million (subsequently raised to US$130 million) with the New York Supreme Court against United Water (New York)
following flooding in the aftermath of heavy rains.
These residents claimed faulty maintenance of the reservoir and of the DeForest Lake dam adjoining DeForest Lake, which allegedly
did not operate properly in the aftermath of the heavy rains in question and did not enable the gradual overflow of water into the
Hackensack River on which it is built, thus causing flooding in the homes of the said residents. As the rainwater drainage network
operated by United Water flows into the river upstream from the dam, the residents, although living in a flood zone, claimed
compensatory damages and interest from United Water in the amount of US$65 million, as well as punitive damages and interest in
the same amount for alleged negligence in the maintenance of the DeForest Lake reservoir and dam.
United Water maintained that it was not responsible for the floods or the maintenance of the dam and reservoir, and that the claims
were unlikely to succeed, and filed a motion to dismiss in July 2009 on the basis that it had no obligation to operate the dam for flood
prevention purposes. Its motion was dismissed on August 27, 2009 and the dismissal confirmed on June 1, 2010. United Water has
appealed this latest ruling.
The claim for punitive damages was dismissed on December 21, 2009 and then confirmed on February 11, 2010 following an appeal
filed by the residents. It was then definitively dismissed on May 31, 2011.
The claim for compensatory damages and interest was dismissed on October 12, 2012 by the Supreme Court of Rockland County.
The residents referred to the judge, in order to have him reconsider the jury’s decision. The judge rejected this request on January 25,

93
2013. On February 12, 2013, the residents appealed this last decision, and had 6 months in order to present their conclusions, which
they did not do. United Water Inc. therefore filed a motion to dismiss, and the case was permanently closed.
Degrémont (Melbourne)
In July 2009, SUEZ ENVIRONNEMENT, in conjunction with its subsidiary Degrémont under a special purpose entity called Aquasure,
was awarded the project for a seawater desalination plant by the State of Victoria. This 30-year contract covers the financing,
designing, building and operation of the plant. The purpose of this plant consists of three production lines with a total capacity of
450,000 m3 of drinking water per day to meet approximately one-third of Greater Melbourne’s water needs.
Aquasure, a vehicle specially created for the project and owned by multiple funds and investors (including SUEZ ENVIRONNEMENT,
which holds a 21% interest), is signatory to the agreements with the State of Victoria. Aquasure then allocated the contract for the
design and build stages of the plant to a joint venture consisting of Thiess (65% – Leighton Group, the leading Australian civil-
engineering group) and Degrémont (35%). The operating stage was allocated to a joint venture between Degrémont (60%) and
Thiess (40%).
The contractual timeline provided for the progressive commissioning of desalinated water as of December 19, 2011 and the final
delivery of the plant on June 30, 2012.
Construction work began in September 2009. However, site progress was constantly and significantly impacted by (i) major weather
events and (ii) particularly acute union action (persistent social unrest and low productivity).
The impact of the above events on the contractual timeline pushed back the projected dates for commissioning and final delivery by
several months, with the final acceptance of the plant taking place on December 17, 2012.
On December 15, 2011, a moratorium (“standstill”) was agreed upon to freeze all claims until March 31, 2012 (prorogable) between
Aquasure and the Thiess-Degrémont construction joint venture.
An additional expense was booked in the financial statements, as detailed in Note 2 to the consolidated financial statements as at
December 31, 2012.
On April 24, 2012, the aforementioned parties signed a new moratorium to ensure financing for Aquasure between July 1, 2012 and
the earlier of the final delivery of the plant or February 28, 2013 on the one hand, and to allow the submission and pursuit of claims
against the State of Victoria on the other hand.
As the final delivery of the plant was made on December 17, 2012, the parties decided to prorogate the effects of the standstill until
February 28, 2013. A further amendment was made on March 1, 2013 to allow the parties to continue their discussions.
Aquasure and the construction joint venture Thiess-Degrémont had first signed a settlement agreement allowing them to settle their
dispute, excluding the claims they intend to lodge against the State of Victoria. This agreement was subject to the approvals of the
State of Victoria and the lenders.
SUEZ ENVIRONNEMENT and its partner, the Leighton group, believed, however, that the majority of additional costs incurred to date
were linked to elements, many of which were attributed to force majeure and could not be fully attributed to them.
Accordingly, various claims have been filed against the State of Victoria:
• The first claim related to compensation for 71 days not worked due to bad weather was notified on January 30, 2013.
• A second claim related to the consequences of a change in social welfare regulations after the tender submitted by
Aquasure, notified on April 4, 2013;
• A third claim related to the payment for water produced before delivery of the plant was notified on June 12, 2013.
An agreement to end all of these claims was reached with the State of Victoria in October 2013, which enabled SUEZ
ENVIRONNEMENT to reverse all remaining provisions, which amounted to €58 million.
Sociedad General de Aguas de Barcelona
Agbar was subject to a number of tax audits, mainly relating to corporate tax.
With respect to corporate tax, Agbar received a reassessment notice from the Spanish tax authorities for the 1995-1998 fiscal years
that outlined a reassessment of tax payable in the amount of €28 million in addition to penalties of €12 million. Agbar also received a
reassessment notice relating to the 1999-2001 fiscal years that outlined a reassessment of tax payable in the amount of €41 million in
94
addition to penalties of €25 million. In May 2009, Agbar was also notified of a reassessment in the amount of €60.5 million for the
2002-2004 fiscal years, without additional penalties.
In court, the company challenged these notices, which were, for each period in question, justified with similar arguments by the tax
authorities. Agbar considers the tax authorities’ arguments groundless.
In May 2007, the Administrative Court rendered its ruling on the 1995-1998 fiscal years, reducing the amount of the claim to €21
million and canceling the penalties. However, Agbar appealed against the judgment on the remaining part of the reassessment. In this
action, the Court of Appeals has now handed down its ruling with respect to 1998, followed by 1995, 1996 and 1997. These four
decisions were appealed to the Supreme Court by Agbar with respect to 1998 and by the Spanish government with respect to 1995,
1996 and 1997. However, as the Supreme Court dismissed the appeal made by the Spanish government with respect to 1996 and
1997, Agbar received the repayment of €4.1 million in taxes wrongly levied as well as €1 million in late penalties. The amount in
dispute between Agbar and the tax authorities is therefore reduced to €17 million.
Moreover, in May 2008 the Administrative Court cancelled the penalties relating to the 1999-2001 fiscal years, but upheld almost all of
the reassessments. Agbar appealed this ruling in July 2008. In July 2011, Agbar was awarded a partially favorable decision by the
court of appeal. Agbar subsequently filed an appeal with the Supreme Court concerning the disputes related to the reassessments
upheld. The Spanish government also appealed the ruling in favor of Agbar.
On October 25, 2012, Agbar was given the ruling of the Supreme Court, validating what had been decided by the Court of Appeals.
Agbar received notification of the decision of the Supreme Court in March 2013 and paid the sum of €20 million corresponding to the
principal. The interest of €9 million was challenged before the Central Administrative Tribunal.
Finally, in June 2009, Agbar filed suit with the Administrative Court to challenge the reassessments for 2002-2004. In June 2012 the
Court reached a decision partially in Agbar’s favor.
Agbar filed an appeal before the Court of Appeals regarding the other elements for which the Administrative Court has not held in
favor of Agbar.

95
NOTE 25 Subsequent events
There is no significant subsequent event.

96
NOTE 26 List of the main consolidated companies at December 31, 2013 and 2012
The aim of this note is to present the list of entities covering 80% of the following indicators: Revenues, EBITDA, Net Debt and capital
employed.
% interest % control
Consolidation
methods (a)
Names Headquarters address
Déc.
2013
Déc.
2012
Déc.
2013
Déc.
2012
Déc.
2013
Déc.
2012
SUEZ ENVIRONNEMENT COMPANYTour CB21, 16 Place de l'Iris,
92040 Paris La Défense Cedex - France100.0 100.0 100.0 100.0 FC FC
WATER EUROPE
LYONNAISE DES EAUX FranceTour CB21, 16 Place de l'Iris,
92040 Paris La Défense Cedex - France100.0 100.0 100.0 100.0 FC FC
EAU ET FORCE300, rue Paul Vaillant Couturier
BP 712 92007 Nanterre - France100.0 100.0 100.0 100.0 FC FC
EAUX DU NORD217, boulevard de la Liberté
BP 329 59020 Lille - France99.3 99.2 99.3 99.2 FC FC
SOCIETE DES EAUX DE
VERSAILLES ET DE SAINT-CLOUD
(SEVESC)
5-7 Rue Pierre Lescot
78000 Versailles - France100.0 100.0 100.0 100.0 FC FC
HISUSATorre Agbar - Av.Diagonal, 211
08018 Barcelona - Espagne75.7 75.7 75.7 75.7 FC FC
AGBAR Torre Agbar - Av.Diagonal, 211
08018 Barcelona - Espagne75.4 75.4 99.5 99.5 FC FC
AGUAS ANDINAS Avenida Presidente Balmaceda 1398,
Piso – 4, Santiago - Chili 21.4 21.4 50.1 50.1 FC FC
UTILITY SERVICES CO, IncP.O. Box 1350 - 535 Courtney Hodges
Blvd. - Perry, Georgia 31069 - Etats-Unis 100.0 100.0 100.0 100.0 FC FC
WASTE EUROPE
SITA HOLDINGS UK LTDGrenfell road, Maidenhead,
Berkshire SL6 1ES, Royaume-Uni100.0 100.0 100.0 100.0 FC FC
SE DEUTSCHLAND GmbHIndustriestrasse 161 D-50999
Köln, Allemagne100.0 100.0 100.0 100.0 FC FC
SITA NEDERLAND BVMr. E.N. van Kleffensstraat 6, Postbus
7009, NL - 6801 HA Arnhem, Pays-Bas100.0 100.0 100.0 100.0 FC FC
SITA FRANCETour CB21, 16 Place de l'Iris,
92040 Paris La Défense Cedex - France99.9 99.9 99.9 99.9 FC FC
SITA BELGIUM5 Avenue de la Metrologie
1130 Haren - Belgique100.0 100.0 100.0 100.0 FC FC
SOCALUXLamesch SA - ZI Wolser Nord BP 75 - L-
3201 Bettembourg - Luxembourg100.0 100.0 100.0 100.0 FC FC
SITA SVERIGE AB.Kungsgardsleden - 26271 Angelholm -
Suède100.0 100.0 100.0 100.0 FC FC
SITA SUOMI OY Sahaajankatu 49 - 00880 Helsinki -
Finlande100.0 100.0 100.0 100.0 FC FC
(a) FC : Full consolidation
PC : Proportional consolidation

97
% interest % control
Consolidation
methods (a)
Names Headquarters address
Déc.
2013
Déc.
2012
Déc.
2013
Déc.
2012
Déc.
2013
Déc.
2012
INTERNATIONAL
SITA WASTE SERVICES2801 Island Place Tower - 510 King's
Road - North Point - Hong-Kong100.0 100.0 100.0 100.0 FC FC
SITA AUSTRALIAPO Box 160, Kemps Creek NSW 2171 -
Australie60.0 60.0 60.0 60.0 FC FC
SITA CZKonevova, 1107/54 - 130 00 Praha 3 -
République Tchèque100.0 100.0 100.0 100.0 FC FC
UNITED WATER200 Old Hook Road,
Harrington Park New Jersey - Etats-Unis 100.0 100.0 100.0 100.0 FC FC
MACAO WATER718 avenida do Conselheiro Borja Macao
Via - Macao - Chine42.5 42.5
Consolida-
ted via
SFH
Consolida-
ted via
SFH
PC PC
DEGREMONTTour CB21, 16 Place de l'Iris,
92040 Paris La Défense Cedex - France100.0 100.0 100.0 100.0 FC FC
ONDEO INDUSTRIAL SOLUTIONSTour CB21, 16 Place de l'Iris,
92040 Paris La Défense Cedex - France100.0 100.0 100.0 100.0 FC FC
LYDEC 48, Boulevard Mohamed Diouri,
Casablanca - Maroc51.0 51.0 51.0 51.0 FC FC
SINO FRENCH HOLDING (SFH)New World Tower 29/f 16-18 Queensroad
Central - Hong Kong50.0 50.0 50.0 50.0 PC PC
PT PAM LYONNAISE JAYACentral Senayan 1, 7th floor JI. Asia Afrika
n°8 - 10270 Jakarta - Indonésie51.0 51.0 51.0 51.0 FC FC
SE POLSKAUI. Kopernika, 17,
02359 Warszawa - Pologne100.0 100.0 100.0 100.0 FC FC
OTHER
SUEZ ENVIRONNEMENT SASTour CB21, 16 Place de l'Iris,
92040 Paris La Défense Cedex - France100.0 100.0 100.0 100.0 FC FC
(a) FC : Full consolidation
PC : Proportional consolidation

98
NOTE 27 Fees of the statutory auditors and members of their networks
The accounting firms Ernst & Young and Mazars act as statutory auditors for the SUEZ ENVIRONNEMENT Group. Information on
fees paid to the statutory auditors and members of their networks is provided in accordance with Decree 2008-1487.
(a) The amounts relating to the entities consolidated proportionately, which largely involved tasks assigned to the statutory auditors, totaled 135
thousands of euros in 2013 (203 thousands of euros in 2012). These fees were paid in full to Ernst & Young.
Ernst & Young Mazars
In thousands of euros 2013 2012 2013 2012 2013 2012 2013 2012
Audit
SUEZ ENVIRONNEMENT COMPANY SA 663 680 7% 7% 592 565 14% 13%
Fully and proportionately consolidated
subsidiaries6,913 6,967 75% 73% 3,126 3,333 74% 79%
SUEZ ENVIRONNEMENT COMPANY SA 186 126 2% 1% 202 179 5% 4%
Fully and proportionately consolidated
subsidiaries1,063 1,319 12% 14% 292 160 7% 4%
Sub-total 8,825 9,092 96% 95% 4,212 4,237 100% 100%
Other Services
Tax 330 376 4% 4% 21 6 1% 0%
Other - 88 - 1% - - - -
Sub-total 330 464 4% 5% 21 6 1% 0%
TOTAL (a) 9,155 9,556 100% 100% 4,233 4,243 100% 100%
Amount %
Statutory Audits, attest engagements, review of
individual and consolidated accounts
Other audit procedures and incidental
assigments in relation to Auditor's engagement
to the Statutory Auditor's mission
Amount %

SUEZ ENVIRONNEMENT COMPANY
Tour CB21 - 16, place de l'Iris 92040 Paris La Défense, France Tel. + 33 (0)1 58 81 20 00 Fax + 33 (0)1 58 81 25 00
www.suez-environnement.com
MAZARS ERNST & YOUNG et Autres
This is a free translation into English of the statutory auditors’ report on the
consolidated financial statements issued in French and it is provided solely for the
convenience of English-speaking users.
The statutory auditors’ report includes information specifically required by French
law in such reports, whether modified or not. This information is presented below
the audit opinion on the consolidated financial statements and includes an
explanatory paragraph discussing the auditors’ assessments of certain significant
accounting and auditing matters. These assessments were considered for the
purpose of issuing an audit opinion on the consolidated financial statements taken
as a whole and not to provide separate assurance on individual account balances,
transactions or disclosures.
This report also includes information relating to the specific verification of
information given in the group’s management report.
This report should be read in conjunction with and construed in accordance with
French law and professional auditing standards applicable in France.
Suez Environnement Company Year ended December 31, 2013
Statutory auditors’ report
on the consolidated financial statements

MAZARS
61, rue Henri Regnault
Tour Exaltis
92400 Courbevoie
S.A. au capital de € 8.320.000
Commissaire aux Comptes
Membre de la compagnie
régionale de Versailles
ERNST & YOUNG et Autres
1/2, place des Saisons
92400 Courbevoie - Paris-La Défense 1
S.A.S. à capital variable
Commissaire aux Comptes
Membre de la compagnie
régionale de Versailles
Suez Environnement Company Year ended December 31, 2013
Statutory auditors’ report
on the consolidated financial statements
To the Shareholders,
In compliance with the assignment entrusted to us by your annual general meetings, we hereby report
to you, for the year ended December 31, 2013, on:
! the audit of the accompanying consolidated financial statements of Suez Environnement Company;
! the justification of our assessments;
! the specific verification required by law.
These consolidated financial statements have been approved by the board of directors. Our role is to
express an opinion on these consolidated financial statements based on our audit.
I. Opinion on the consolidated financial statements
We conducted our audit in accordance with professional standards applicable in France; those
standards require that we plan and perform the audit to obtain reasonable assurance about whether
the consolidated financial statements are free of material misstatement. An audit involves performing
procedures, using sampling techniques or other methods of selection, to obtain audit evidence about
the amounts and disclosures in the consolidated financial statements. An audit also includes evaluating
the appropriateness of accounting policies used and the reasonableness of accounting estimates made,
as well as the overall presentation of the consolidated financial statements. We believe that the audit
evidence we have obtained is sufficient and appropriate to provide a basis for our audit opinion.
In our opinion, the consolidated financial statements give a true and fair view of the assets and
liabilities and of the financial position of the group as at December 31, 2013 and of the results of its
operations for the year then ended in accordance with International Financial Reporting Standards as
adopted by the European Union.
Suez Environnement Company
Year ended December 31, 2013 2
Without qualifying our opinion, we draw your attention to notes 1.2.1 « IAS 19 Revised – Employee
benefits applicable on January 1, 2013 » and 1.2.2 « Mandatory other standards, amendments and
interpretations applicable in 2013 » to the consolidated financial statements, which outline the impact
resulting from the application of new standards, amendments and interpretations whose application is
mandatory.
II. Justification of our assessments
In accordance with the requirements of article L. 823-9 of the French commercial code (Code de
commerce) relating to the justification of our assessments, we bring to your attention the following
matters:
! As disclosed in note 1.4.1 to the consolidated financial statements, Suez Environnement Company
group is required to make estimates and assumptions in order to prepare its financial statements.
This note also specifies that the future results of the related operations could be different from
these estimates according to different assumptions or situations. These significant accounting
estimates relate to the fair valuation of assets acquired and liabilities assumed within a business
combination, the measurement of the recoverable amount of goodwill, property, plant and
equipment and intangible assets, provisions, capital renewal and replacement liabilities, financial
instruments, revenues generated but not metered (as in "meters not read"), margin at termination
on construction contracts and the assessment of the tax loss carry forwards recognized as deferred
tax assets.
! In respect of assets acquired and liabilities assumed within a business combination, we have
examined data and assumptions allowing their fair valuation and reviewed the correct adjustment of
the goodwill accounted for at the acquisition date. We have also verified that note 9 to the
consolidated financial statements provides appropriate information.
! In respect of the recoverable amount of goodwill, property, plant and equipment and intangible
assets, we have examined the methods adopted to perform impairment tests, as well as the data
and assumptions used. We have reviewed the calculations made by the group and verified that
notes 1, 5, 9, 10 and 11 to the consolidated financial statements provide appropriate information.
! As regards provisions, and particularly provisions for site rehabilitation, litigation, retirement and
other employee benefits, we have assessed the bases on which these provisions have been
established and verified that notes 15, 16 and 24 to the consolidated financial statements provide
appropriate information.
! In respect of capital renewal and replacement liabilities, we have assessed the bases on which they
have been established and verified that note 20 to the consolidated financial statements provides
appropriate information.
! As regards financial instruments, we have examined data and assumptions used for the valuation
models allowing the fair valuation of non-listed financial instruments and verified that notes 12 and
13 to the consolidated financial statements provide appropriate information.
! In respect of sales of water metered during the accounting period, the group prepares an estimate
of the revenues based on historical data of consumption as well as the estimated selling price. Our
work consisted in examining the data and assumptions used to calculate these estimates and
verifying that note 1 to the consolidated financial statements provides appropriate information.
Suez Environnement Company
Year ended December 31, 2013 3
! As regards margin at termination on construction contracts, our work consisted in examining the
relating processes put in place by the group, assessing the data and assumptions on which are
based the kept estimations and verifying that notes 1, 2, 17 and 24 to the consolidated financial
statements provide appropriate information.
! As regards the tax loss carry-forwards recognized as deferred tax assets, our work consisted in
verifying that the recognition criteria were satisfied and in assessing the assumptions underlying
the forecasts of taxable profits and the relating use of tax loss carry-forwards. We have also verified
that notes 1 and 7 to the consolidated financial statements provide appropriate information.
In the course of our assessments, we verified the reasonableness of these estimates.
These assessments were made as part of our audit of the consolidated financial statements taken as a
whole, and therefore contributed to the opinion we formed which is expressed in the first part of this
report.
III. Specific verification
As required by law we have also verified, in accordance with professional standards applicable in
France, the information presented in the group’s management report.
We have no matters to report as to its fair presentation and its consistency with the consolidated
financial statements.
Courbevoie and Paris-La Défense, February 20, 2014
The statutory auditors
French original signed by
MAZARS ERNST & YOUNG et Autres
Thierry Blanchetier Isabelle Massa Charles-Emmanuel Chosson Pascal Macioce


