68
Consolidated half-year Financial report as at 30th June 2014

Consolidated half-year Financial report as at 30th June 2014

2 Consolidated half-year financial Report as at 30th June 2014
Consolidated half-year financial Report as at 30th June 2014 3
Summary
Corporate officers and Independent Auditors 5
Profile of the Cariparma Crédit Agricole Group 6
Consolidated financial highlights and ratios 10
Interim Report on Operations 12
OUTLINE OF THE GENERAL MACROECONOMIC SCENARIO AND OF THE BANKING
SYSTEM - SIGNIFICANT EVENTS IN THE HALF-YEAR
OPERATING PERFORMANCE RISKS AND UNCERTAINTIES
DIVIDENDS DISTRIBUTED BY THE PARENT COMPANY IN THE HALF-YEAR
Interim Condensed Consolidated Financial Statements 25
CONSOLIDATED BALANCE SHEET
CONSOLIDATED INCOME STATEMENT
CONSOLIDATED STATEMENT OF COMPREHENSIVE INCOME
CONSOLIDATED STATEMENTS OF CHANGES IN EQUITY
CONSOLIDATED STATEMENT OF CASH FLOWS
Notes to the Interim Consolidated Financial Statements 33
ACCOUNTING POLICIES
EVENTS AFTER THE REPORTING DATE AND OUTLOOK
PERFORMANCE
BALANCE SHEET AGGREGATES
OPERATIONS AND PROFITABILITY BY BUSINESS LINE - RISK CONTROL
BUSINESS COMBINATIONS CONCERNING COMPANIES OR BUSINESS UNITS
TRANSACTIONS WITH RELATED PARTIES
Certification of the Interim Condensed Consolidated Financial Statements pursuant to Article 154-bis of Legislative Decree No. 58/1998 56
Independent Auditors’ Report 57
Annexes 59
FINANCIAL STATEMENTS OF THE PARENT COMPANY

4 Consolidated half-year financial Report as at 30th June 2014

Consolidated half-year financial Report as at 30th June 2014 5
CORPORATE BODIES AND INDEPENDENT AUDITORS
Corporate Bodies and Independent Auditors
Board of Directors
CHAIRPERSON
Ariberto Fassati*
DEPUTY CHAIRPERSONS
Xavier Musca*
Fabrizio Pezzani*
CHIEF EXECUTIVE OFFICER
Giampiero Maioli*
DIRECTORS
Giovanni Borri
Pierre Derajinski
Daniel Epron
Marco Granelli
Nicolas Langevin
Michel Mathieu
Germano Montanari
Marc Oppenheim*
Lorenzo Ornaghi
Annalisa Sassi
Jean-Louis Roveyaz
* Members of the Executive Committee
Board of Auditors
CHAIRPERSON
Paolo Alinovi
STANDING AUDITORS
Luigi Capitani
Angelo Gilardi
Stefano Lottici
Marco Ziliotti
ALTERNATE AUDITORS
Alberto Cacciani
Isotta Parenti
Senior Management
CO-GENERAL MANAGER
Hugues Brasseur
DEPUTY GENERAL MANAGER
Massimo Basso Ricci
MANAGER IN CHARGE OF THE PREPARATION OF CORPORATE ACCOUNTING DOCUMENTS
Pierre Débourdeaux
Independent Auditors
Reconta Ernst & Young S.p.A.

6 Consolidated half-year financial Report as at 30th June 2014
80,17%
Banca PopolareFriulAdria S.p.A.
CARIPARMA CRÉDIT AGRICOLE GROUP NETWORK
Profile of the Cariparma Crédit Agricole Group
As at 30 June 2014, the Cariparma Crédit Agricole Group, led by the Parent Company Cariparma, showed an extensive geographical coverage:
15,00% 75,00% 10,00%
SACAM International S.a.s.
FondazioneCariparma Crédit Agricole S.A.
Cariparma OBGCrédit Agricole Leasing Italia S.r.l.
85,00% 60,00%
Cassa di Risparmio della Spezia S.p.A.
83,00%
» DESCRIPTION
Cariparma Carispezia FriulAdria Group
Number of branches 565 87 191 843
Private Banking Centres 14 2 4 20
Mid-corporate Centres 16 3 6 25
Corporate Areas 5 1 1 7

Consolidated half-year financial Report as at 30th June 2014 7
CARIPARMA CRÉDIT AGRICOLE GROUP NETWORK
The Cariparma Crédit Agricole Group ranks eighth in Italy by number of branches. In the first half of 2014, the Group continued with the process designed for the rationalization of its geographical coverage in order to improve its Network’s efficiency by closing a few branches that were no longer deemed strategic, since poorly efficient or overlapping other Branches (for a total of 20).
This measure is consistent with the current development of the Italian Banking System, which, since 2008, has undergone a progressive decrease in the number of branches (down by -7.0% from 2009 to 2013).
In May 2014, the transfer to Carispezia of the Cariparma assets located in the Liguria Region was finalized: 16 Retail Branches, 1
Mid-corporate Centre and 1 Private Banking Market, in order to rationalize the Group’s Network in the Liguria Region and to improve its efficiency, operating with a single brand in order to optimize the Bank’s visibility, to increase the effectiveness of its commercial actions, to foster Carispezia’s future development in this area.
The Cariparma Crédit Agricole Group holds a 2.65% market share at a national level in terms of branches, with shares of 26.1% in Parma, 25.9% in Piacenza, 17.4% in Pordenone and of 39.1% in La Spezia.
» BRANCH GEOGRAPHICAL DISTRIBUTION AS AT 30th JUNE 2014
Northern Italy 682 branches81%
Central Italy 101 branches12%
Southern Italy 60 branches7%

8 Consolidated half-year financial Report as at 30th June 2014
CARIPARMA CRÉDIT AGRICOLE GROUP NETWORK
» GEOGRAPHICAL DISTRIBUTION OF BRANCHES*
11,0%
2,3% 2,7%
0,9%
1,6%
2,8%
2,2%
3,8%
7,7%5,6%
* The market shares in terms of branches have been calculated considering the branches of the Cariparma Crédit Agricole Group as at 30 June 2014 and the System as at 31 December 2013.

Consolidated half-year financial Report as at 30th June 2014 9
CARIPARMA CRÉDIT AGRICOLE GROUP NETWORK
» MARKET SHARES BY BRANCHES IN THE MAIN PROVINCES OF OPERATIONS
39,1%
26,1% 25,9%
17,4%
La Spezia Parma Piacenza Pordenone
10 Consolidated half-year financial Report as at 30th June 2014
FINANCIAL HIGHLIGHTS AND RATIOS
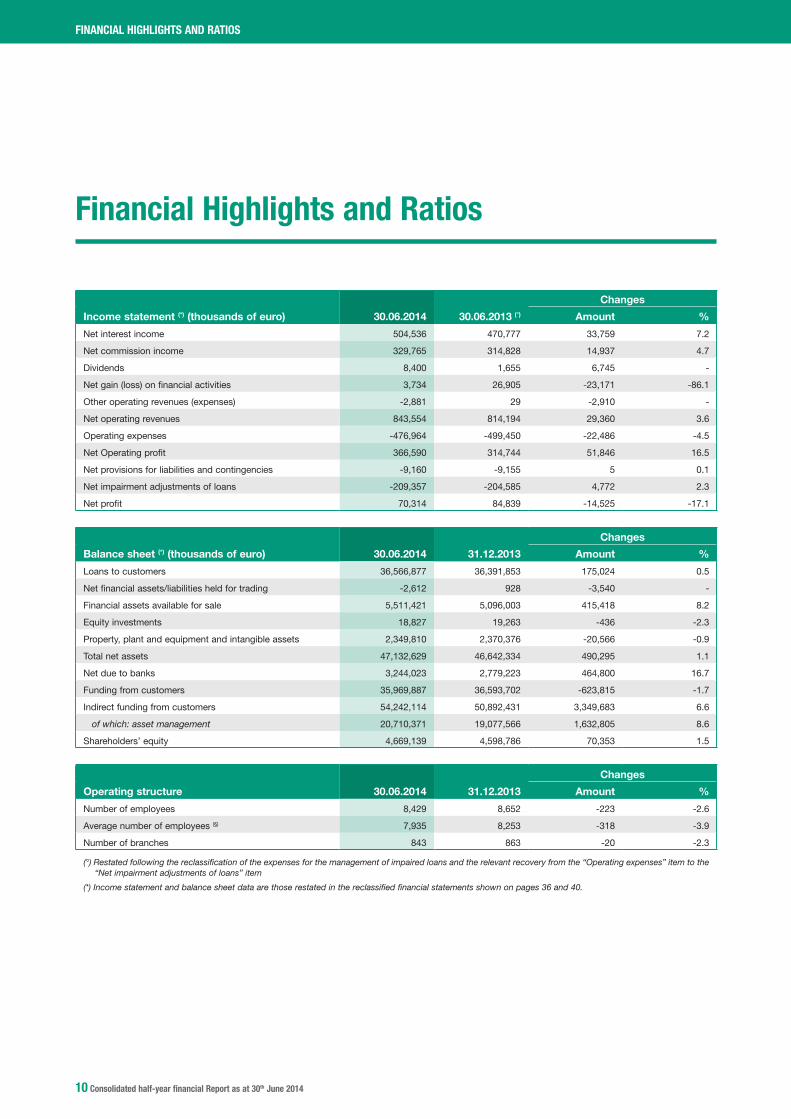
Financial Highlights and Ratios
Income statement (*) (thousands of euro) 30.06.2014 30.06.2013 (°)
Changes
Amount %
Net interest income 504,536 470,777 33,759 7.2
Net commission income 329,765 314,828 14,937 4.7
Dividends 8,400 1,655 6,745 -
Net gain (loss) on financial activities 3,734 26,905 -23,171 -86.1
Other operating revenues (expenses) -2,881 29 -2,910 -
Net operating revenues 843,554 814,194 29,360 3.6
Operating expenses -476,964 -499,450 -22,486 -4.5
Net Operating profit 366,590 314,744 51,846 16.5
Net provisions for liabilities and contingencies -9,160 -9,155 5 0.1
Net impairment adjustments of loans -209,357 -204,585 4,772 2.3
Net profit 70,314 84,839 -14,525 -17.1
Balance sheet (*) (thousands of euro) 30.06.2014 31.12.2013
Changes
Amount %
Loans to customers 36,566,877 36,391,853 175,024 0.5
Net financial assets/liabilities held for trading -2,612 928 -3,540 -
Financial assets available for sale 5,511,421 5,096,003 415,418 8.2
Equity investments 18,827 19,263 -436 -2.3
Property, plant and equipment and intangible assets 2,349,810 2,370,376 -20,566 -0.9
Total net assets 47,132,629 46,642,334 490,295 1.1
Net due to banks 3,244,023 2,779,223 464,800 16.7
Funding from customers 35,969,887 36,593,702 -623,815 -1.7
Indirect funding from customers 54,242,114 50,892,431 3,349,683 6.6
of which: asset management 20,710,371 19,077,566 1,632,805 8.6
Shareholders’ equity 4,669,139 4,598,786 70,353 1.5
Operating structure 30.06.2014 31.12.2013
Changes
Amount %
Number of employees 8,429 8,652 -223 -2.6
Average number of employees (§) 7,935 8,253 -318 -3.9
Number of branches 843 863 -20 -2.3
(°) Restated following the reclassification of the expenses for the management of impaired loans and the relevant recovery from the “Operating expenses” item to the “Net impairment adjustments of loans” item
(*) Income statement and balance sheet data are those restated in the reclassified financial statements shown on pages 36 and 40.

Consolidated half-year financial Report as at 30th June 2014 11
FINANCIAL HIGHLIGHTS AND RATIOS
Structure ratios (*) 30.06.2014 31.12.2013
Loans to customers / Total net assets 77.6% 78.0%
Direct customer deposits / Total net assets 76.3% 78.5%
Asset management / Total indirect funding 38.2% 37.5%
Loans to customers / Direct customer deposits 101.7% 99.4%
Total assets / Shareholders’ Equity (Leverage) 10.8 10.9
Profitability ratios (*) 30.06.2014 30.06.2013
Net interest income / Net operating revenues 59.8% 57.8%
Net commissions income / Net operating revenues 39.1% 38.7%
Cost / income (c) 56.5% 61.3%
Net income / Average equity (ROE) (a) 3.1% 3.9%
Net profit / Patrimonio netto medio (ROTE) 5.2% 6.9%
Net profit / Total assets (ROA) 0.3% 0.3%
Net profit / Risk-weighted assets 0.6% 0.7%
Risk ratios (*) 30.06.2014 31.12.2013
Gross bad debts / Gross loans to customers 5.9% 5.5%
Net bad debts / Net loans to customers 2.7% 2.5%
Net impairment adjustments of loans / Net loans to customers 1.2% 1.4%
Cost of risk (b) / Operating profit 59.6% 73.6%
Net bad debts / Total regulatory capital 32.1% 29.4%
Net impaired loans / Net loans to customers 7.1% 6.2%
Total writedowns on impaired loans / Gross impaired loans 38.3% 40.1%
Productivity ratios (*) (economic) 30.06.2014 31.12.2013
Operating expenses / No. of employees (average) 121 122
Operating revenues / No. of employees (average) 214 199
Productivity ratios (*) (capital) 30.06.2014 31.12.2013
Loans to customers / No. of employees (average) 4,608 4,409
Direct customer deposits / No. of employees (average) 4,533 4,434
Capital ratios 30.06.2014 31.03.2014 (f)
Core Tier 1 (d) / Risk-weighted assets (Core Tier 1 ratio) 10.7% 10.5%
Tier 1 capital / Risk-weighted assets (Tier 1 ratio) 10.7% 10.5%
Total regulatory capital / Risk-weighted assets (Total capital ratio) 13.0% 13.0%
Risk-weighted assets (thousands of euro) 23,782,063 24,461,488
(*) The Ratios are based on the balance sheet and income statement data of the reclassified financial statements shown on pages 36 and 40.
(a) The ratio of the annualized net earnings to the equity weighted average (for ROTE net of intangibles).
(b) Total risk cost includes the provision for contingencies and liabilities as well as net adjustments of loans.
(c) Total Capital: total regulatory own funds (as at December 2013 Total Regulatory Capital)
(d) Common Equity Tier1:
(e) Tier 1: Common Equity Tier 1
(f) As at 31 December 2013, Core Tier 1, Tier 1 and Total capital ratio (Basel 2) were 10.4%, 10.9% and 13.4%, respectively

12 Consolidated half-year financial Report as at 30th June 2014
INTERIM REPORT ON OPERATIONS
Interim Report on Operations
» THE GENERAL MACROECONOMIC SCENARIO AND THE BANKING SYSTEM
The macroeconomic scenario in 2014
In the first months of 2014, the world economic cycle has been slowed down by different kinds of additional adverse factors which caused a decrease in the rate of growth of the GWP:
• intheUnitedStatestheperformanceofthefirstquarterhasaffectedtheaveragegrowthfor2014,whichwillnotbehigherthan1.5%in terms of annual average, despite the positive rebound expected for the second quarter. The growth in the GDP will be generated entirely by domestic demand, since the fragility of the international situation will tend to keep exports at a low profile, which will be offset by increasing imports driven by domestic expense items;• inJapan,theincreaseindomesticdemandhascombinedwithhighabsorptionofimports,which,however,wasoffsetbyasstrongan increase in exports regarding Japan’s main markets. A 1.7% increase is expected in 2014;• theleadingemergingeconomies,exceptforIndia,experiencedadecreaseinthegrowthrateoftheirGDPvs.theendof2013,witha main role of domestic demand. However, exports of goods and services have not performed well: for Brazil and Russia exports decreased vs. the fourth quarter 2013. Finally, as regards China,the contribution of net exports to the GDP growth was negative, as it was in the fourth quarter of 2013;• fortheEMU,thebeginningof2014wasdisappointing.TheGDPhascontinuedwiththesamegrowthrateasinthelastquarterof2013 with a significant decrease in exports, which has concerned the majority of the EMU Countries, severely penalizing those Countries whose recovery is based almost exclusively on foreign demand. In 2014, the GDP growth for the Euro Area is expected to be 0.9%.
The Italian GDP decreased by 0.1% in the first quarter of 2014 and this has impacted on the outlook, mainly because it marked a trend reversal compared with the first signs of positive performance recorded at the end of 2013. Compared with the previous quarter, the main domestic demand aggregates showed differences in performance, with final domestic consumption increasing by 0.1% and gross fixed investments decreasing by 1.1%. Exports and imports increased by 0.8% and 0.3% respectively1.
The GDP performance in first quarter of 2014 caused a negative adjustment in its outlook, with however an expected increase (+0.3%)2: households’ consumption is showing signs of improvement (+0.3%) with a gradual increase in consumption expense driven by the recovery in purchasing power and in investments in operating assets, which stopped decreasing in the first quarter of this year and are expected to progressively increase between 2014 (+0.9%) and 2015 (+4%). Therefore, the first effects of less uncertainty seem to be arising in a situation still featuring difficult access to credit even though with signs that credit crunch is slightly loosening. Investments are expected to developed also driven by the repayment of matured payables by the public Administration and by improving lending conditions; conversely, as regards the building sector, a decrease (-1.9%) is expected for 2014 and any reversal is expected not before 2016, when the sector growth will however be weak and driven mainly by the non-residential segment.
Despite a slow-down in the third quarter, exports are expected, also for 2014, to post an annual average increase of +2.7%, after stagnating in 2013, and to increase at a higher rate in 2015-2016, thanks to the depreciation of the Euro, which, even though remaining high, will begin to weaken in the second half of the year.
1 Source: ISTAT (the Italian National Institute of Statistics) - June 20142 Source: Macroeconomic Forecast in Prometeia Economic Outlook - July 2014

Consolidated half-year financial Report as at 30th June 2014 13
INTERIM REPORT ON OPERATIONS
Source: Macroeconomic Forecast in Prometeia Economic Outlook - July 2014
Moreover, positive trends have been confirmed by some indicators. The OECD leading indicator reports slight improvements in the growth outlook3, increasing, in April, to 101.6 from 101.4 of the previous month (99.2 in April 2013).
In April 2014, the seasonally adjusted index of industrial production also increased by 0.7% vs. March and by 1.6% vs. the previous year. Indexes show year-on year increases in intermediate goods (up by +3.9%) and consumer goods (up by +3.2%). The energy sector decreased (down by -5.3%) as well as, to a lesser extent, the operating goods one (down by -0.7%). In March, new manufacturing orders posted a YOY increase of +2.8% (+2.8% also in the previous month). In the same month, retail sales were unchanged, both YOY and vs. the previous month.
After progressively improving in the previous months, in May the Business Confidence Index, remained unchanged at -4.1; on the other hand, consumers’ mood has continued to show positive signs, increasing to -8.6 from -9.6 in the previous month (-32.2 in May 2013).
In April 2014, the unemployment rate came to 12.6%, in line with the previous month and increasing by 0.6 percentage pints YOY. Youth unemployment continues to be a major concern; the unemployment rate of young people between 15 and 24 years of age is 43.3%, increasing by 0.4 percentage points vs. the previous month and by 3.8 points year-on-year.
In April, the Consumer price index slightly increased coming to +0.5% vs. the minimum level of +0.3% in the previous month (+1.3% a year before).
As regards public finance, the latest data are in line with expectations. The requirement in the first four months improved by approximately Euro 6 billion (€3 billion net of non-recurring items) and the tax revenue in the first three months posted a YOY increase of 1.5%.
The measures that have been announced by the new Italian government are supposed to allow a slightly more expansionary budgetary policy, which, in 2014, will mainly support households’ income, while businesses are supposed to benefit from further payment of trade receivables from public Administrations.
Foreign investments in Italy have increased, contributing to the stabilization of financial markets; the decrease in interest rates has concerned all maturities and generated further decreases in the spread between Italian and German Government securities, which is approximately 150 basis points.
In terms of outlook, a favourable element could be the different development in the monetary policies of the ECB and of the FED, the former still markedly expansionary, the latter gradually less accommodative. After some years of steady appreciation of the Euro over the US Dollar, its depreciation is expected to start as early as at the end of 2014, which would boost Italian exports.
Another stimulus to the real economy is expected to be provided by the cuts in ECB interest rates; these measures are expected to make more resources available to businesses and households, thus fostering the recovery of consumption and higher productivity. The package designed by the ECB includes: cutting the cost of money (which is at its all-time low, with the reference interest rate at 0.15%; negative for the first time the rate on deposits at -0.10%); new long-term refinancing operations - LTRO - (the first one in September and
3 Source: ABI Monthly Outlook
Household Consumption
Exports
Investment in equipment
Investment in construction
GDP (right scale)

14 Consolidated half-year financial Report as at 30th June 2014
the second one in December); speed up of the preparatory phase for purchasing ABS. Moreover, the President of the ECB, Mario Draghi, hinted that quantitative easing measures might be implemented, as done by the FED, that is to say, large-scale purchases of securities.
The banking system in the first half of 2014
The present weakness in economic recovery is continuing to impact also on the profitability of the Italian banking system, maintaining intermediated assets weak and credit risk high.
As of June 2014, funding from resident Customers came to Euro 1,718.2 billion4, decreasing by approximately Euro 14.8 billion on an annual basis, with a -0.9% change (down by -0.6% as of May 2014; up by +0.5% as of June 2013). As of June 2014, deposits from resident Customers5 posted and annual increase of +2.4% (up by +2.4% also as of May 2014), coming to a value of Euro 1,233 billion increasing in absolute value by approximately Euro 26 billion. The annual change in bonds was -8.3% (-7.4% as of May 2014), decreasing in absolute value by Euro 43.8 billion. Bonds amounted to Euro 485.2 billion.
As of June 2014, asset management increased by Euro 13.8 billion on top of the Euro 7.1 billion increase in May (a new all-time high for assets under management coming to Euro 1,456 billion). This figure has taken total funding since the beginning of the year to Euro 57.5 billion6, an amount close to Euro 62.5 billion, which was the total achieved throughout 2013. Once again, this performance was due to open-end funds, with net funding coming to Euro 7.3 billion, as well as to institutional investment mandates, which came to Euro 5.8 billion. Therefore, in the first six months of 2014, open-end funds totalled Euro 41.9 billion and institutional investment mandates totalled Euro 11.4 billion.
In June 2014, the performance of bank loans settled, coming to Euro 1,842,7 billion and decreasing on an annual basis by -2.2%.
In May 2014, loans to non-financial companies7 posted an annual decrease of -4.7%8 (-4.4% in the previous month;
-5.9% in November 2013, the most negative value); the performance of loans to households posted a slight decrease (-1% in May 2014, -1% also in the previous month; -1.5% in November 2013).
The breakdown of bank loans by economic activity sector shows that, as of May 2014, manufacturing activities, mining and services accounted for approximately 54% of total loans, manufacturing activities on their own accounted for 23.1%. Loans to the trade sector and to accommodation and catering businesses accounted for approximately
19.3% of total loans, whereas the building sector accounted for 17.3% and agriculture for 4.8%. Other sectors accounted for approximately 4.6%.
In the first quarter of 2014, corporate and business demand for loans relating to investments9 showed no change, but posted all the same an improvement compared with the previous quarters. Demand for loans for mergers, incorporations and other corporate restructuring activities was null. Corporate and business demand for loans relating to stock and working capital posted a slight increase, as well as demand for loans relating to debt restructuring.
The latest data on gross bad loans showed further worsening, even though at a decelerating rate: in May 2014, they came close to Euro 168.6 billion (Euro 32.9 billion higher than the previous year, i.e. up by +24.2% on an annual basis, a decreasing rate vs. +27.2% as at the beginning of the year), net bad loans came to Euro 78.7 billion (the annual change is up by +14.9%, decreasing vs. +31.5% as of May 2013). The ratio of gross bad loans to total loans came to 8.9% as of May 2014, increasing from 6.9% of the previous year. Compared with the pre-crisis one, from December 2007 to May 2014 this ratio is more than three times higher.
4 Source: ABI Monthly Outlook5 Net of transactions with central counterparties, net of deposits with an agreed maturity relating to transactions for the sale of accounts receivable6 Source: Assogestioni7 Source: ABI Monthly Outlook8 Growth rates have been calculated including loans not recognized by the banks as they have been securitized, and net of any changes in the amounts not relating to transactions (e.g. changes due to interest rate fluctuations, to adjustments or reclassifications).9 Source: Bank Lending Survey - April 2014
INTERIM REPORT ON OPERATIONS

Consolidated half-year financial Report as at 30th June 2014 15
The analysis of the ratio of gross bad loans to loans broken down by economic production sector10 also shows that, over the last few years, credit quality has gradually and constantly worsened, and specifically: as of April 2014 for the manufacturing sector, mining and industrial services, this ratio came to 12.4% (5.7% as of December 2010), for wholesale and retail trade and for accommodation and catering services to15.4% (7.1% as of December 2010), for the building sector to 20.9% (6.7% as of December 2010) and for agriculture, forestry and fishing to 11.5% (6.7% as of December 2010).
However, some weak signs of relenting are beginning to emerge from the data on companies’ compliance with payment terms11: in the first three months of 2014, the percentage of companies that pay their invoices when they are well past due (over 60 days) was 7.6%, decreasing from 8.6% in the fourth quarter of 2013 and from 10.8% of the fourth quarter of 2012 (the all-time high).
Moreover, the outcomes of the Asset quality review and Stress test exercise are still uncertain; this exercise has been carried out by the Supervisory Authority with the objective of assessing the soundness and quality of balance sheets and the resilience of intermediaries in potential economic/financial stress conditions, respectively. The banks that, based on the above exercise, will not comply with the set capital requirements shall mandatorily proceed to strengthen their capital with subsequent impacts on their profitability and on the attractiveness of the sector.
Based on the performance observed and estimates made, the profitability of the banking sector is expected to be modest (ROE at 0.8% in 2014). The factors supporting profitability will be the reduction in the cost of funding, by reducing the volumes of funding from customers and participating in the TLTROs launched by the ECB, as well as the review of the service model, by enhancing multichannel operations and reducing the number of branches and employees in line with the business plan objectives. Control of operating expenses will continue to be a material leverage to support profitability, thanks to an expected decrease of -2% in 2014. The ability to reduce the cost of risk will prove crucial and will be achieved by reviewing processes and by monitoring and recovering loans.
» SIGNIFICANT EVENTS IN THE HALF-YEAR
Asset Quality Review (AQR)
A significant event in the half-year is that the Cariparma Group, as a member of the international Crédit Agricole Group, prepared for the momentous change that the banking system is about to experience with the start-up of the Single Supervisory Mechanism. This preparation has consisted in the Comprehensive Assessment of the European Banking System, which was started in October 2013 by the European Central Bank and which could entail, in the future, changes in the measurement processes that are currently used.
The Cariparma Group is one of the Italian banks that are currently subject to the Comprehensive Assessment Exercise, which will last one year.
This exercise has been designed to assess capital adequacy focusing on three main targets: (1) transparency (that is, enhancing the quality of information available concerning the condition of banks); (2) repair (by identifying and implementing necessary corrective actions, if and where needed); and (3) confidence building (namely assuring all stakeholders that banks are fundamentally sound and trustworthy).
The Comprehensive Assessment is the overall process and comprises three complementary pillars: (i) a supervisory risk assessment, addressing key risks in the banks’ balance (ii) an asset quality review; (iii) a stress test providing a forward-looking view of banks’ shock-absorption capacity under stress.
To date, the first and second phases of the Asset Quality Review have been completed. In these phases, after selecting the portfolio of assets to be assessed, the reviewers carried out their exam of the quality of these assets, which also included the validation of the integrity of the data provided by the Group, a series of on-site reviews and, ultimately, the validation of collaterals, the recalculation of value adjustments and risk-weighted assets; this phase started in March 2014 and was completed in July.
INTERIM REPORT ON OPERATIONS
10 Source: Supervisory Reporting.11 Cerved: Monitor on Company Payments and Non - Payment Protests (June 2014), based on data contained in Payline - Cerved’s database that tracks the payment patterns of about 2.5 million Italian businesses

16 Consolidated half-year financial Report as at 30th June 2014
Along with the development of the Asset Quality Review, the Cariparma Group will take account in its financial reporting and in its accounts of all available data and information while the same meet the set reliability requirements.
In this perspective, even though the values recognized in this Half-year Financial Report are the result of the best possible measurements made by the Management based on the reference accounting standards, it cannot be ruled out that such measurements, even though reasonable, may be not fully confirmed where any different parameters are used to carry out the Asset Quality Review.
“Banca della Liguria” Project
In the first six months of 2014, the “Banca Liguria” Project for geographical rationalization was implemented by strengthening Carispezia in the Liguria Region.
This Project entailed the transfer to Carispezia of 16 Cariparma branches located in the Provinces of Genoa, Imperia and Savona.
The subsequent higher geographical effectiveness, resulting from better knowledge of the area of operations, is the basis for higher development, growth and enhancement of Carispezia in the Liguria Region.
Amendment to the taxation on the revaluation of Bank of Italy shares
With Legislative Decree No. 66 of 24 April 2014, the Italian Legislator amended the taxation on the revaluation of the Bank of Italy shares held, increasing the tax rate from 12%, as provided for by the legislation in force as at 31 December 2013, to 26%. This caused an additional tax paid in June and recognized on the profit for the half-year attributable to shareholders of the Parent Company amounting to approximately Euro 22 million.
» PERFORMANCE
Perimeter
The performance reference perimeter for the first half of 2014 consists of Cariparma S.p.A. (Parent Company), Banca Popolare FriulAdria S.p.A., Cassa di Risparmio della Spezia, Crédit Agricole Leasing Italia S.r.l. and the special-purpose entities Mondo Mutui Cariparma S.r.l., Cariparma OBG S.r.l. and Sliders S.r.l. that have been consolidated on a line-item basis, as well as of CA Agro-Alimentare S.p.A. that has been consolidated with the equity method.
The following remarks, relating to the Group’s performance and to the balance-sheet aggregates, refer to the reclassified financial statements included in the Note to the Financial Statements on page 36 and following ones.
The Group’s performance
In the first half of 2014, even though operating in a still very uncertain macro-economic environment, the Cariparma Crédit Agricole Group achieved a positive performance, with the profit for the period amounting to Euro 70 million. The proactivity of the distribution network and the effective management of operating expenses allowed income from operations to come to Euro 367 million, posting a significant YOY increase (up by +16.5%). The increase in this aggregate allowed the increase, even though a modest one, in the cost of credit to be absorbed.
In the first half of 2014, net operating revenues attributable to the shareholders of the Parent Company came to Euro 844 million, increasing by +3.6% vs. 30 June 2013, thanks to the performance of revenues from the traditional banking business: interest income and commission income, which together account for 99% of net operating revenues (96% as of June 2013), increased by +7.2% and +4.7%, respectively.
INTERIM REPORT ON OPERATIONS

Consolidated half-year financial Report as at 30th June 2014 17
3%
Net incomefrom financial
activities
39%
Netcommissionincome
58%
Net interestincome
39%
Netcommissionincome
59%
Net interestincome
2%
Dividend income
The increase in net interest income was due to the increase in loans to Customers and to the reduction in the cost of funding, thanks also to the Customers’ preference for more liquid funding. Conversely, the “Business with Banks” component and the contribution of hedging activities decreased.
Net commission income came to Euro 330 million, driven by income from management, intermediation and advisory services on asset management, which posted a significant YOY increase in terms of placed volumes.
Conversely, commission income from the traditional banking business was impacted by the negative trend of commission income from current accounts and commission income from debit and credit cards, which were impacted by the decrease in consumption.
Net income from financial activities came to Euro 4 million, decreasing by Euro 23 million (down by -86% vs. June 2013), mainly due to the decrease in income from trading of AFS securities, that is to say, from arbitrage reducing the portfolio duration, since, pursuant to the its internal Policy, the Group does not carry out proprietary trading but only trading on behalf of Customers. Other elements that affected performance referred to transactions on derivatives with Customers, the development of which reflected the unfavourable economic scenario.
The increase in dividend income (as at 30 June 2014 amounting to Euro 8.4 million vs. Euro 1.7 million as of June 2013) essentially reflected the dividends collected by the Group and referring to the equity investment in the Bank of Italy (Euro 1.5 million in 2013 and Euro 8.1 million in 2014).
As regards operating expenses, also in the first half of 2014 the actions that were started in previous years continued being implemented; therefore, in an environment still featuring pressure on revenues and a still significantly high cost of credit, focusing on cost control amounts to a crucial leverage for good corporate performance. Operating expenses came to Euro 477 million, decreasing by Euro -22 million (down by -4.5%), thanks to effective control on almost all expense items, while continuing to invest.
The cost structure was in line with 30 June 2013, with staff expenses accounting for approximately 61% of total expenses and other administrative expenses accounting for approximately 30% of total expenses.
8,7%
Depreciationand amortization
29,7%
Administrativeexpenses
61,6%
Staff expenses
30,2%
Administrativeexpenses
61,2%
Staff expanses
8,6%
Depreciationand amortization
INTERIM REPORT ON OPERATIONS
June 2013 June 2014
June 2013 june 2014

18 Consolidated half-year financial Report as at 30th June 2014
Staff expenses posted a decrease vs. 30 June 2013 (down by -5.5%) which reflected the decrease in the average number of staff (down by -215 YOY, subsequent to the “Solidarity Fund for income support” activated in previous periods) and effective control on the variable component.
Administrative expenses also decreased thanks to effective management of current expenses. Essentially all expense items contributed to the achievement of this result. Specifically: decreases are reported in expenses for rents of property (down by -8.4%, thanks to both an extensive renegotiation action and to the rationalization of the distribution network), in legal expenses (down by -1.9%) and in other cost components, such as utilities and expenses for advisory services.
Depreciation and amortization came to Euro 41 million, posting a YOY decrease (down by -6%) due to the end of the depreciation/amortization period of some significant investments made in previous periods.
The good performance of income and the effective action to control expenses generated a significant improvement in income from operations, which came to Euro 367 million (up by +16.5% YOY), as well as in the efficiency index (indeed, the cost/income ratio decreased from 61.3% to 56.5%).
As at 30 June 2014, net provisions for contingencies and liabilities (Euro 9.2 million) were in line with the same figure as of June 2013.
As at 30 June 2014, net impairment adjustments of loans (Euro 209 million, up by +2.3% vs. June 2013) increased but modestly, thanks to the management actions that were taken on the entire lending chain and to the industrialization of processes. This allowed the aggregate to be essentially stable, while continuing to maintain a prudential and adequate coverage ratio.
Taxes for the period, in terms of the Italian Regional Tax on Productive Activities (IRAP), were affected by a 0.45% reduction in the tax rate, pursuant to Italian Law Decree No. 66 /2014. On the one hand, this tax rate reduction allowed lower current taxes to be recognized, but, on the other hand, it required the recalculation of IRAP tax assets and liabilities resulting in an increase in taxes. Moreover, a provision was made for the higher taxes due on the revaluation of Bank of Italy shares (pursuant to Italian Law No. 147/2013). Net of the above components, the tax load decreased also thanks to the release of prudential provisions for taxes for previous periods, which were higher than the taxes actually paid.
The profit for the period came to Euro 70 million, decreasing vs. the same figure as at 30 June 2013, which, however, benefited from non-recurring positive tax components relating to the realignment of some values for tax purposes (as emerged within the transactions for the transfer of branches to Cariparma, which were made in 2011, in a tax-neutral regime). Net of this non-recurring component, net income for the period would achieve a very good performance increasing by +43%.
Comprehensive income for the first half of 2014 was significantly impacted by the volatility on the revaluation reserve on available-for-sale assets as resulting from the market performance of the underlying securities (especially Government securities) and generated a profit of Euro 157 million, mainly due to net income but also to the revaluation reserve for available-for-sale financial assets, which in the period posted a positive increase of Euro 63 million.
The Return On Equity (ROE) came to 3.1%, whereas the Return On Tangible Equity (ROTE) came to 5.2% (as at 30 June 2013 these two values were 3.9% and 6.9%, respectively).
Balance sheet aggregates
Also in the first half of 2014, the Cariparma Crédit Agricole Group pursued the development of total funding while implementing a strategy aimed at maintaining an adequate and structural balance between funding and lending.
As at 30 June 2014, loans to Customers came to Euro 36.6 billion, increasing by Euro 175 million (up by +0.5%) vs. December 2013. Lending volumes were still affected by still uncertain economic situation, especially in the shortest-term component (current account credit facilities decreased by 6.5%). The mortgage loans segment was essentially stable (-0.7%), supported by the home loans that were paid out. Indeed, in the first six months of 2014, 7,400 new home loans were paid out, increasing by +40% vs. the previous year.
INTERIM REPORT ON OPERATIONS

Consolidated half-year financial Report as at 30th June 2014 19
6,3%
Other
25,2%
Advances and credit facilities 58,3%
Mortgage loans
10,2%
C/A
7,6%
Other
25,1%
Advances and credit facilities 57,8%
Mortgage loans
9,5%
C/A
The still lingering economic uncertainty and the time lag between the beginning of the recovery and the improvement in credit quality caused impaired loans to increase also in the first half of 2014 (gross impaired exposure up by +17% vs. December 2013). Coverage policies confirmed prudential (adjustments of gross impaired loans came to 38.3%), especially on the most risky categories of doubtful loans (the coverage ratio on bad loans remained at 56%), and the ratio of problem loans to total net loans came to 7.6% (6.3% as of December 2013).
The cost of credit (the ratio of net impairment adjustments of loans to net loans to Customers) was stable compared to June 2013 (1.15% on an annual basis).
A regards performing loans, the accumulated value adjustments came to Euro 238 million, i.e. 0.7% of gross exposures: indeed, the collective write-down takes account of the new guidelines that can be inferred from the draft International Technical Standards published by EBA in October 2013 and concerning the recognition of “non performing” and “forborne” exposures, which led to higher adjustments of performing loans.
Total funding from Customers came to over Euro 90,212 million, increasing vs. 31 December 2013 (up by +3.1%), thanks to the increase in indirect funding, whose weight on this aggregate posted a further increase from 58% to 60%.
58,2%
Indirectfunding
41,8%
Direct funding
15,1%Outstandingsecurities
26,4%Depositsand c/a
0,3%Repurchas eagreementsand other
60,1%
Indirectfunding
39,9%
Direct funding
13,5%Outstandingsecurities
26,1%Depositsand c/a
0,2%Repurchas eagreementsand other
The performance of total funding in the first half of 2014, when direct funding and outstanding securities decreased, even though to a modest extent, is evidence of the Customers’ preference for better diversification of their investment portfolios, especially with asset management products. Concomitantly, the stock of more liquid products was stable, due to the on-going economic uncertainty.
Consequently, indirect funding performed well (coming to Euro 54.2 billion, up by +6,6% vs. 31 December 2013), thanks to the development in both its components. Asset management increased by +8.6%, mainly driven by the placing of collective investment schemes and SICAVs, as well as of insurance products.
INTERIM REPORT ON OPERATIONS
December 2013 June 2014
December 2013 June 2014
20 Consolidated half-year financial Report as at 30th June 2014
In the first half of 2014, assets under administration also posted an increase (up by +5.4%), partially thanks to the improvement in the quotations of securities.
Between December 2013 and June 2014, the Group’s liquidity position confirmed its soundness, with the ratio of loans to Customers to direct funding essentially balanced (the self-funding ratio came to 1.02 and it was 0.99 as of December 2013).
It is reported that, in the first half of 2014, 65 new bond issues were made at Group level. As reported for the previous period, there was a marked prevalence of fixed-rate instruments over floating-rate ones, confirming the Customers’ preference for certain coupon flows and yields in times of long-standing uncertainty and low interest rates.
Bonds were placed to the Group’s Customers for a total amount of Euro 1,767 million, while maturing bonds amounted to approximately Euro 2,154 million.
Available-for-sale financial assets (amounting to Euro 5,511 million as at 30 June 2014) are mainly composed of Government Securities held within the liquidity risk management policy and the increase posted in the first half of 2014 (up by +8.2% vs. December 2013) was almost exclusively due to the purchases made in the period and to the increase in the prices of these securities.
As at 30 June 2014, the book value of equity, including the net profit for the year, came to Euro 4,669 million, increasing (up by 1.5%) vs. December 2013. The Regulatory Capital was essentially stable, coming to Euro 3,641 million.
As known, effective from 1 January 2014, the new regulation for banks and investment firms has entered into force generating impacts on the determination of both Own Funds and of Risk-weighted Assets (RWA). The new regulatory framework is structured on three levels:1) endorsement by the European Union of the regulatory framework defined by the Basel Committee on Banking Supervision (Basel 3) with EU Regulation No. 575/2013 (“CRR”) - which is directly applicable in national legislations - and Directive 2013/36/EU (“CRD IV”) - which is subject to implementation in national legislations - of 26 June 2013;2) alignment of the Italian national legislation to the developments in the international and EU regulatory framework with Circular No. 285 “Provisions for the prudential supervision of banks” of 17 December 2013, implementing CRD IV. Circular No. 285 reports the procedures with which national discretion has been exercised as provided for by EU law to the national authorities, also in terms of temporary regime;3) the exercise by the single banks of the discretionary powers provided for by their national legislator (for example, choosing the ECAI for exposures to entities or not to include unrealized gains or losses on exposures to central governments classified in the “Available for Sale” category).
The new regulatory framework increases both the quality and the minimum regulatory requirement of Own Funds. In 2014, Banking Groups are required to comply with a Common Equity Tier 1 capital ratio of 4.5%, a Tier 1 capital ratio of 5.5% and with a Tier Total capital ratio of 8%, as well as to hold a capital conservation buffer of 2.5% of CET 1. Therefore, the minimum capital requirements for 2014 overall are 7% of Common Equity Tier 1, 8% of Tier 1 and 10.5% of Tier Total12.
Risk-weighted assets came to Euro 23,782 million, decreasing by -3% vs. March 2014.
The Group’s capital ratios confirmed to be sound (Common Equity Tier 1 and Tier 1 at 10.7%, Total Capital Ratio at 13.0%) and well above the minimum requirements for the Asset Quality Review (8% of Common Equity Tier 1). The capital ratios as at 31 December 2013, even though not comparable, were the following: the Core Tier 1 ratio at 10.4%, the Tier 1 ratio at 10.9% and the Total Capital ratio at 13.4%.
INTERIM REPORT ON OPERATIONS
12 For more exhaustive reporting on the main novelties introduced by the new regulatory framework, reference is made to the “Disclosures on Basel 3 Third Pillar as at 31 March 2014”, available on the website of the Cariparma Crédit Agricole Group (www.gruppocariparma.it).

Consolidated half-year financial Report as at 30th June 2014 21
INTERIM REPORT ON OPERATIONS
Tax-related disputes
With regard to tax-related disputes with the Agenzia delle Entrate (the Italian Inland Revenue Service), in addition to the information contained in the Annual Report and Consolidated Financial Statements as at 31 December 2013 (to which reference is made for more exhaustive information), the following developments in the first half of 2014 are to be reported:• with regard to the Notice of Settlement of Registration Taxes on the transfer of branches carried out in 2007 by Cariparma and FriulAdria, appeal court rulings were issued in favour of the Group Banks; the Agenzia delle Entrate will in all likeness appeal to the Italian Court of Cassation but, considering the favourable court decisions and in the light of specific opinions originally obtained from leading Law Firms, no provision has been made for this dispute;• litigationstartedrelatingtotheNoticesofSettlementconcerningthesimilartransactionscarriedoutin2011;alsobasedontheresults of the litigation on the 2007 transactions, no provision has been made; with regard to the general inspection carried out by the Agenzia delle Entrate on FriulAdria, reference is made to the Annual Report and Financial Statements as at 31 December 2013, pointing out that the application for composition with acceptance, as reported therein, was defined for a total of Euro 0.1 million;• CariparmawasnotifiedallegedunlawfuluseofthespecifictaxreceivablesprovidedforbyItalianDecreeLawNo.185/2008forthe amounts credited by it to Customers relating to the State contribution on floating-rate mortgage loans that were taken out by 31 October 2008, with service of the payment form. With the above Law, the Italian State provided a contribution to tax payers that took out floating-rate mortgage loans for the purchase of their home amounting to the interest paid by the same tax payers in 2009 at a rate over 4%. These amounts were actually credited by the banks that were entitled to equal tax receivables. The alleged unlawful use regards the fact that the amounts were paid to the Customers not only in 2009, but also in 2010, as also allowed by the same Law. The disputed amount and the relevant penalties, for a total of approximately Euro 1.3 million, have already been paid in order to prevent any consequence resulting from non-payment within the set terms. In the light of the Bank’s obvious grounds, as confirmed also by its advisors, the Bank has filed both appeal with the Tax Commission and a petition of reassessment (the Italian “istanza di autotutela”) with the Agenzia delle Entrate, since it believes it has solid grounds, and, therefore, no provision has been made;• Carispeziaobtainedafavourableappealcourtrulinginthedisputethatstartedin2006.
» RISKS AND UNCERTAINTIES
The policies for the monitoring, management and control of risks, whether operational risks, credit risks and market risks, in the many instances provided for by the primary and secondary legislation and regulations that apply to the Group as a lender subject to regulatory supervision, remain key and priority pillars based of which the Banks will have to pit their strength, both against one another and against domestic and international markets.
Reference is made to other sections for exhaustive reporting on the risks and uncertainties which the Group is exposed to and on the techniques implemented for their mitigation, in accordance with the legislation provisions, also of the Italian Civil Code at Article 2428, as well as of Bank of Italy Circular No. 263/2006 as updated. In this regard, it cannot but be emphasized again, briefly, what was reported in the previous periods, that is to say, the constant focus that, for quite a few years now, the Group and its Management have kept on the monitoring of risks and uncertainties, also to comply with the countless recommendations that the national and international Authorities have been issuing on this topic. The Group’s governance bodies are fully aware, now more than ever, that sustainable development and growth absolutely require an effective analysis of the risks which the Group is exposed to and of the relating uncertainties, in terms of impacts that these risks could have on the Group’s financial position, cash flows and performance. Effective management and mitigation of the same risks to acceptably low levels are another crucial requirement for sustainable growth, also in order to protect a precious resource for development and growth, that is to say, savings (and, with them, Customers’ confidence) on the one hand, and loans (healthy and drivers of growth) on the other.
Also in compliance with the legislation provisions (specific for the sector the Group belongs to, as well as of the civil and financial laws), the Management believes that the present overall performance of the domestic and international economies (financial and real) is such as to require, in addition to monetary and real policy measures to be adopted by supranational and national bodies (with the purpose of boosting the present weak recovery), also appropriate policies for constant enhancement of the monitoring of the risks and uncertainties which financial players are exposed to, such as the ones implemented by the Group.

22 Consolidated half-year financial Report as at 30th June 2014
Indeed the Group is aware that financial players must constantly implement growth and development policies that, at the same time, focus on the protection of the interests of all stakeholders, without shirking, for the same reason, the institutional role that the Group, as such, has, both in terms of support to the economic and social fabric of its Customer businesses, and in terms of enhancement of that key factor for development and success which is effective and prudent management of savings.
» DIVIDENDS DISTRIBUTED BY THE PARENT COMPANY IN THE HALF-YEAR
The Parent Company’s net profit for 2013 amounted to Euro 126,235,803. In the first half of 2014, in line with the resolution approved by the Shareholders’ General Meeting of 29 April 2014, the Parent Company Cariparma S.p.A. allocated this amount as follows:
5% to the legal reserve 6,311,790
to the charity fund 1,000,000
to shareholders 83,292,354
to extraordinary reserve 35,631,659
The dividend was paid on 5 May 2014, at Euro 0.095 for each one of the 876,761,620 ordinary shares.
INTERIM REPORT ON OPERATIONS

Consolidated half-year financial Report as at 30th June 2014 23

24 Consolidated half-year financial Report as at 30th June 2014

Consolidated half-year financial Report as at 30th June 2014 25
Interim Condensed Consolidated Financial Statements

26 Consolidated half-year financial Report as at 30th June 2014
CONSOLIDATED FINANCIAL STATEMENTS
Consolidated Financial Statements
» CONSOLIDATED BALANCE SHEET
Assets 30.06.2014 31.12.201310. Cash and cash equivalents 249,292 334,127
20. Financial assets held for trading 213,884 214,732
30. Financial assets carried at fair value 17,057 -
40. Financial assets available for sale 5,511,421 5,096,003
50. Financial assets held to maturity
60. Loans to banks 3,204,426 3,305,651
70. Loans to customers 36,566,877 36,391,853
80. Hedging derivatives 861,723 692,941
90. Value adjustment of financial assets subject to macro hedging (+/-) 9,118 1,192
100. Equity investments 18,827 19,263
110. Reinsurers' share of technical revrses - -
120. Property , plant and equipment 437,086 442,815
130. Intangible assets 1,912,724 1,927,562
of which: goodwill 1,575,536 1,575,536
140. Tax assets 1,059,934 1,196,793
a) current 251,935 360,629
b) deferred 807,999 836,164
b1) of which: Law 214/2011 714,806 721,653
150. Non-current assets or groups of assets being divested - -
160. Other assets 488,570 539,785
Total assets 50,550,938 50,162,717

Consolidated half-year financial Report as at 30th June 2014 27
Liabilities and shareholders’ equity 30.06.2014 31.12.201310. Due to banks 6,448,449 6,084,875
20. Due to customers 23,755,266 23,360,593
30. Securities issued 12,214,621 13,233,109
40. Financial liabilities held for trading 216,495 213,804
50. Financial liabilities carried at fair value - -
60. Hedging derivatives 519,899 345,373
70. Value adjustment of financial liabilities subject to macro hedging (+/-) 545,465 350,530
80. Tax liabilities 238,091 386,232
a) current 122,308 292,708
b) deferred 115,783 93,524
90. Liabilities in respect of assets being divested
100. Other liabilities 1,407,969 1,026,440
110. Employee severance benefits 157,742 151,648
120. Provisions for liabilities and contingencies 179,176 212,009
a) retirement and similar liabilities 22,453 23,151
b) other provisions 156,723 188,858
130. Technical reserves - -
140. Valutation reserves 40,856 -43,473
150. Redeemable shares
160. Equity instruments
170. Reserves 945,745 879,591
180. Share premium reserve 2,735,462 2,735,462
190. Share capital 876,762 876,762
200. Treasury shares (-) - -
210. Minority interests (+/-) 198,626 199,318
220. Net profit (loss) fo the period (+/-) 70,314 150,444
Total liabilities and shareholders’ equity 50,550,938 50,162,717
CONSOLIDATED FINANCIAL STATEMENTS
28 Consolidated half-year financial Report as at 30th June 2014
» CONSOLIDATED INCOME STATEMENT
Items 30.06.2014 30.06.201310. Interest income and similar revenues 705,620 715,932
20. Interest expense and similar charges (235,041) (265,098)
30. Net interest income 470,579 450,834
40. Commission income 319,190 296,898
50. Commission expense (14,005) (12,595)
60. Net commission income 305,185 284,303
70. Dividends and similar revenues 8,400 1,655
80. Net gain (loss) on trading activities 2,249 6,589
90. Net gain (loss) on hedging activities (1,539) (2,159)
100. Gain (loss) on disposal or repurchase of: 3,865 22,466
a) loans (4) (9)
b) financial assets available for sale 5,328 21,531
c) financial assets held to maturity - -
d) financial liabilities (1,459) 944
110. Net gain (loss) on financial assets and liabilities carried at fair value (845) -
120. Gross income 787,894 763,688
130. Net impairment adjustments of: (174,111) (184,294)
a) loans (171,960) (181,176)
b) financial assets available for sale (41) (1,665)
c) financial assets held to maturity - -
d) other financial transactions (2,110) (1,453)
140. Profit (loss) from financial operations 613,783 579,394
150. Net premiums - -
160. Other net revenues (expenses) fom insurance undertakings - -
170. Profit (loss) from financial operations and insurance undertakings - -
180. Administrative expenses: (547,667) (546,818)
a) staff expenses (291,741) (308,691)
b) other administrative expenses (255,926) (238,127)
190. Net provisions for liabilities and contingencies (9,160) (9,155)
200. Net adjustments of property, plant and equipment (13,160) (14,233)
210. Net adjustments of intangible assets (28,037) (29,557)
220. Other operating revenues (expenses) 132,314 121,373
230. Operating expenses (465,710) (478,390)
240. Gain (loss) from equity investments 147 (403)
250. Gains (losses) from property, plant and equipment and intangible assets measured at fair value - -
260. Value adjustments of goodwill - -
270. Gain (loss) on disposal of investments (4) 231
280. Gain (loss) before tax on continuing operations 148,216 100,832
290. Income tax for the period on continuing operations (73,943) (12,253)
300. Profit (loss) after tax on continuing operations 74,273 88,579
310. Profit (loss) after tax of groups of assets/liabilities under disposal - -
320. Net profit (loss) for the period 74,273 88,579
330. Net profit (loss) pertaining to minority interests (3,959) (3,740)
340. Profit (loss) for the period pertaining to the Parent Company 70,314 84,839
CONSOLIDATED FINANCIAL STATEMENTS
Consolidated half-year financial Report as at 30th June 2014 29
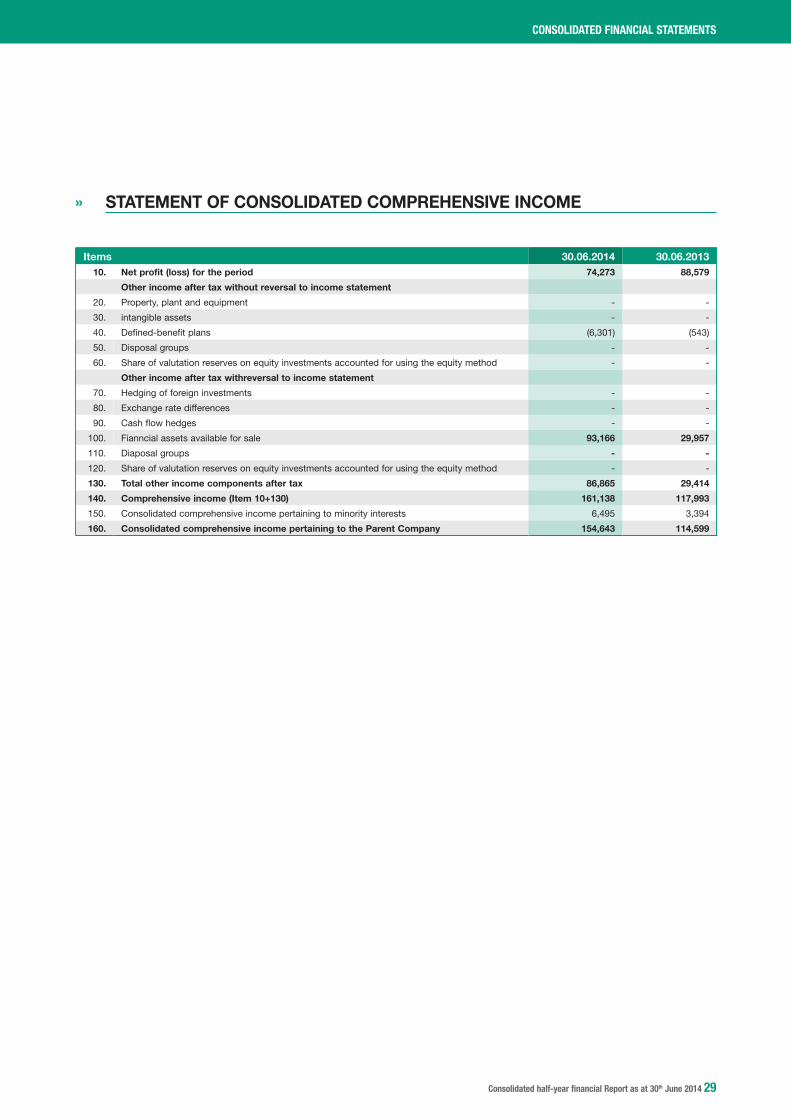
» STATEMENT OF CONSOLIDATED COMPREHENSIVE INCOME
Items 30.06.2014 30.06.201310. Net profit (loss) for the period 74,273 88,579
Other income after tax without reversal to income statement
20. Property, plant and equipment - -
30. intangible assets - -
40. Defined-benefit plans (6,301) (543)
50. Disposal groups - -
60. Share of valutation reserves on equity investments accounted for using the equity method - -
Other income after tax withreversal to income statement
70. Hedging of foreign investments - -
80. Exchange rate differences - -
90. Cash flow hedges - -
100. Fianncial assets available for sale 93,166 29,957
110. Diaposal groups - -
120. Share of valutation reserves on equity investments accounted for using the equity method - -
130. Total other income components after tax 86,865 29,414
140. Comprehensive income (Item 10+130) 161,138 117,993
150. Consolidated comprehensive income pertaining to minority interests 6,495 3,394
160. Consolidated comprehensive income pertaining to the Parent Company 154,643 114,599
CONSOLIDATED FINANCIAL STATEMENTS

30 Consolidated half-year financial Report as at 30th June 2014
» STATEMENT OF CHANGES IN CONSOLIDATED SHAREHOLDERS’ EQUITY AS AT 30th JUNE 2014
Share capital:ordinary shares
Share premium
reserve
Reserves:Valuation reserves
Net profit (loss) for
the period Equity income otherGROUP EQUITY AT 31.12.2013 876,762 2,735,462 898,779 -19,188 -43,473 150,444 4,598,786
MINORITY INTERESTS AT 31.12.2013 53,998 101,905 33,953 2,939 -202 6,725 199,318
ALLOCATION OF NET PROFIT FOR PREVIOUS PERIOD
Reserves - - 64,591 - - -64,591 -
Dividends and other allocations - - - - - -92,578 -92,578
CHANGES IN THE PERIOD
Changes in reserves - - - - - - -
Equity transactions - - - - - - -
Charity - - - - - - -
Other variations - - 1,100 - - - 1,100
Consolidation adjustments - - - - - - -
Shares and rights on shares of the Parent Company - - - - - - -
Comprehensive income - - - - 86,865 74,273 161,138
GROUP EQUITY AT 30.06.2014 876,762 2,735,462 964,933 -19,188 40,856 70,314 4,669,139
MINORITY INTERESTS AT 30.06.2014 53,998 101,905 33,490 2,939 2,335 3,959 198,626
CONSOLIDATED FINANCIAL STATEMENTS

Consolidated half-year financial Report as at 30th June 2014 31
» STATEMENT OF CHANGES IN CONSOLIDATED SHAREHOLDERS’ EQUITY AS AT 30th JUNE 2013
Share capital:ordinary shares
Share premium
reserve
Reserves:Valuation reserves
Net profit (loss) for
the period Equity income otherGROUP EQUITY AT 31.12.2012 (*) 876,762 2,735,462 793,737 -21,489 -161,391 160,026 4,383,107
MINORITY INTERESTS AT 31.12.2012 (*) 53,994 101,905 38,027 1,864 -2,512 1,653 194,931
ALLOCATION OF NET PROFIT FOR PREVIOUS PERIOD
Reserves - - 99,918 - - -99,918 -
Dividends and other allocations - - - - - -61,761 -61,761
CHANGES IN THE PERIOD
Changes in reserves - - - - - - -
Equity transactions - - - - - - -
Charity - - 1,050 - - - 1,050
Other variations - - - - - - -
Consolidation adjustments 4 - 1,942 - - - 1,946
Shares and rights on shares of the Parent Company - - - 426 - - 426
Comprehensive income - - - - 29,414 88,579 117,993
GROUP EQUITY AT 30.06.2013 876,762 2,735,462 900,430 -21,085 -131,631 84,839 4,444,777
MINORITY INTERESTS AT 30.06.2013 53,998 101,905 34,244 1,886 -2,858 3,740 192,915
(*) Restated following the final recognition of the intra-group business combination made in 2013.
CONSOLIDATED FINANCIAL STATEMENTS

32 Consolidated half-year financial Report as at 30th June 2014
» CONSOLIDATED CASH FLOW STATEMENT
Items 30.06.2014 30.06.2013A. Operating Activities
1. Operations 415,763 445,539
- net profit (loss) for the period (+/-) 70,314 84,839
- gains (losses) on financial assets held for trading and financial assets/liabilities carried at fair value (+/-) -976 -6,767
- gains (losses) on hedging activities (+/-) 3,099 3,758
- net impairment adjustments (+/-) 170,486 182,974
- net adjustments of property, plant and equipment and intangible assets (+/-) 41,197 43,790
- net provision for liabilities and contingenciess and other costs/revenues (+/-) 9,160 9,155
- unpaid taxes and duties (+) 73,943 12,253
- other adjustments (+/-) 48,540 115,537
2. Liquidity generated/absorbed by financial assets -499,524 -407,599
- financial assets held for trading 1,825 69,216
- financial assets carried at fair value -17,057 -
- financial assets available for sale -173,970 -712,823
- loans to banks: on demand 94,568 63,880
- loans to banks: other loans 6,657 116,466
- loans to customers -343,480 134,509
- other assets -68,067 -78,847
3. Liquidity generated/absorbed by financial liabilities 103,153 -5,128
- due to banks: on demand -144,907 -223,640
- due to banks: other payables 508,481 -40,087
- due to customers 394,673 674,466
- securities issued -1,030,014 -295,429
- financial liabilities held for trading 2,691 -61,193
- other liabilities 372,229 -59,245
Net liquidity generated/absorbed by operating activities 19,392 32,812
B. INVESTMENT ACTIVITIES
1. Liquidity generated by 8,983 2,007
- sale of equity investments 583 -
- dividends from equity investments 8,400 1,655
- sales of property, plant and equipment - 352
2. Liquidity absorbed by -20,630 -20,510
- purchases of property, plant and equipment -7,431 -4,649
- purchases of intangible assets -13,199 -15,861
Net liquidity generated/absorbed by investing activities -11,647 -18,503
C. FUNDING
- dividend distribution and other -92,580 -61,761
Net liquidity generated/absorbed by funding -92,580 -61,761
NET LIQUIDITY GENERATED/ABSORBED DURING THE PERIOD -84,835 -47,452
RECONCILIATIONFinancial Statement items 30.06.2014 30.06.2013Cash and cash equivalents at beginning of period 334,127 285,966
Total net liquidity generated/absorbed during the period -84,835 -47,452
Cash and cash equivalents: effect of exchange rates changes - -
Cash and cash equivalents at end of period 249,292 238,514
KEY: (+) generated (-) absorbed
CONSOLIDATED FINANCIAL STATEMENTS

Consolidated half-year financial Report as at 30th June 2014 33
NOTES TO THE CONSOLIDATED FINANCIAL STATEMENTS
Notes to the Consolidated Financial Statements
» ACCOUNTING POLICIES
Statement of compliance with the International Accounting Standards
This Half-Year Financial Report and Consolidated Financial Statements was prepared in compliance with Italian Legislative Decree No. 38 of 28 February 2005, in accordance with the International Accounting Standards issued by the International Accounting Standards Board (IASB) and the related interpretations issued by the International Financial Reporting Interpretations Committee (IFRIC) endorsed by the European Commission, as provided for by Regulation (EC) No. 1606 of 19 July 2002.
Specifically, the accounting standards used to prepare these Financial Statements are the same ones used to prepare the Annual Report and Financial Statements as at 31 December 2013 and exhaustively reported therein, except for the new standards and interpretations applicable to reporting periods starting on or after 1 January 2014, issued by the IASB and endorsed by the European Commission.
This Financial Report was also prepared in compliance with IAS 34 “Interim Financial Reporting”, on a consolidated basis, as provided for by Article 154-ter of Italian Legislative Decree No. 5 of 24 February 1998, the Italian “Consolidated Act on Financial Intermediation” (TUF).
The Half-year Financial Report and condensed consolidated Financial Statements have been subject to limited audit carried out by the Independent Auditors Reconta Ernst & Young S.p.A.
International Accounting Standards endorsed by the European Union and applicable to reporting periods starting on or after 1 January 2014
Standards, amendments or interpretations Date of endorsement Date of first application
Adoption of IFRS 10 - Consolidated Financial Statements 29 December 2012(EU No. 1254/2012) 1 January 2014
Adoption of IFRS 11 - Joint Arrangements 29 December 2012(EU No. 1254/2012) 1 January 2014
Adoption of IFRS 12 - Disclosure of Interests in Other Entities 29 December 2012(EU No. 1254/2012) 1 January 2014
Adoption of IAS 27 - Separate Financial Statements 29 December 2012(EU No. 1254/2012) 1 January 2014
Adoption of IAS 28 - Investments in Associates and Joint Ventures 29 December 2012(EU No. 1254/2012) 1 January 2014
Amendments to IFRS 10, IFRS 11, IFRS 12 5 April 2013(EU No. 313/2013) 1 January 2014
Amendments to IFRS 10, IFRS 12 on Investment Entities 21 November 2013(EU No. 1174/2013) 1 January 2014
Amendments to IAS 36 - Recoverable Amount Disclosures for Non-Financial Assets 20 December 2013(EU No. 1374/2013) 1 January 2014
Amendments to IAS 39 - Financial Instruments: Recognition and Measurement 20 December 2013(EU No. 1374/2013) 1 January 2014
The application of these new provisions did not generate material impacts on the profit (loss) and net financial position for the period.
General Preparation Principles
The Consolidated Half-year Financial Report consists of the condensed consolidated financial statements, the interim report on operations and the certification required by Article 154-bis, paragraph 5 of the “Consolidated Act on Financial Intermediation”, and was prepared using the Euro as reporting currency; figures are expressed in thousands of Euro, where not otherwise specified.

34 Consolidated half-year financial Report as at 30th June 2014
This Financial Report was prepared, as the Annual Report as at 31 December 2013, on a going-concern basis.
The Half-Year Financial Report and Condensed Consolidated Financial Statements include:• theBalanceSheet;• theIncomeStatement;• theStatementofComprehensiveIncome;• theStatementsofChangesinEquity;• theStatementofCashFlows;• theNotestotheFinancialStatements.
The preparation of the interim financial report entails the use of estimates and assumptions to determine some expense and revenue components, as well as to measure assets and liabilities. For these, reference is also made to the 2013 Annual Report. Moreover, it is stated that, generally, some measurement processes, in particular the most complex ones, such as the assessment of asset impairment, are thoroughly carried out upon preparation of the annual report, when all the necessary information is available, with the exception of those cases where significant impairment indicators require immediate measurement of any impairment.
Scope and Method of Consolidation
Scope of consolidation
In addition to the Parent Company, Cassa di Risparmio di Parma e Piacenza S.p.A., the scope of consolidation includes its subsidiaries and associated companies identified below.
In accordance with IFRS 10, subsidiaries are companies in which Cariparma, directly or indirectly, concomitantly:• hasthepowertosteerthecompany’skeyoperations;• isexposedtoand/orhasrightstovariablereturnsfromitsinvolvementwiththeinvestee;• hastheabilitytoaffectthosereturnsthroughitspowerovertheinvestee.
In practice, subsidiaries are companies in which Cariparma, directly or indirectly, holds more than 50% of the voting rights in the Shareholders’ General Meeting or in which, despite holding less than 50% of the voting rights, it has the power to appoint the majority of the directors of the investee or to determine the financial and operating policies of the same (controlling influence).
Special-purpose entities/special-purpose vehicles (SPE/SPV) have also been included, when the requirements are met, also irrespective of the existence of a majority shareholding.
Associates are companies in which the Parent Company exercises significant influence, holding, either directly or indirectly, at least 20% of the voting rights or having the power to participate in determining financial and operating policies of the investee, despite holding less than 20% of the voting rights, due to specific legal ties such as being party to a shareholders’ agreement.
The methods used for the consolidation of data of subsidiaries (consolidation on a line-item basis) and for the consolidation of associates (equity method) have remained unchanged compared to the ones used to prepare the Annual Report and Consolidated Financial Statements as at 31 December 2013.
1. Equity investments in subsidiary companies controlled both exclusively and jointly
The following table shows the equity investments included within the scope of consolidation, reporting:• themethodofconsolidation;• Typeofcontrol/shareholding;• Investeecompany;• Percentageofvotingrightsheldbytheshareholder.
NOTES TO THE CONSOLIDATED FINANCIAL STATEMENTS
Consolidated half-year financial Report as at 30th June 2014 35
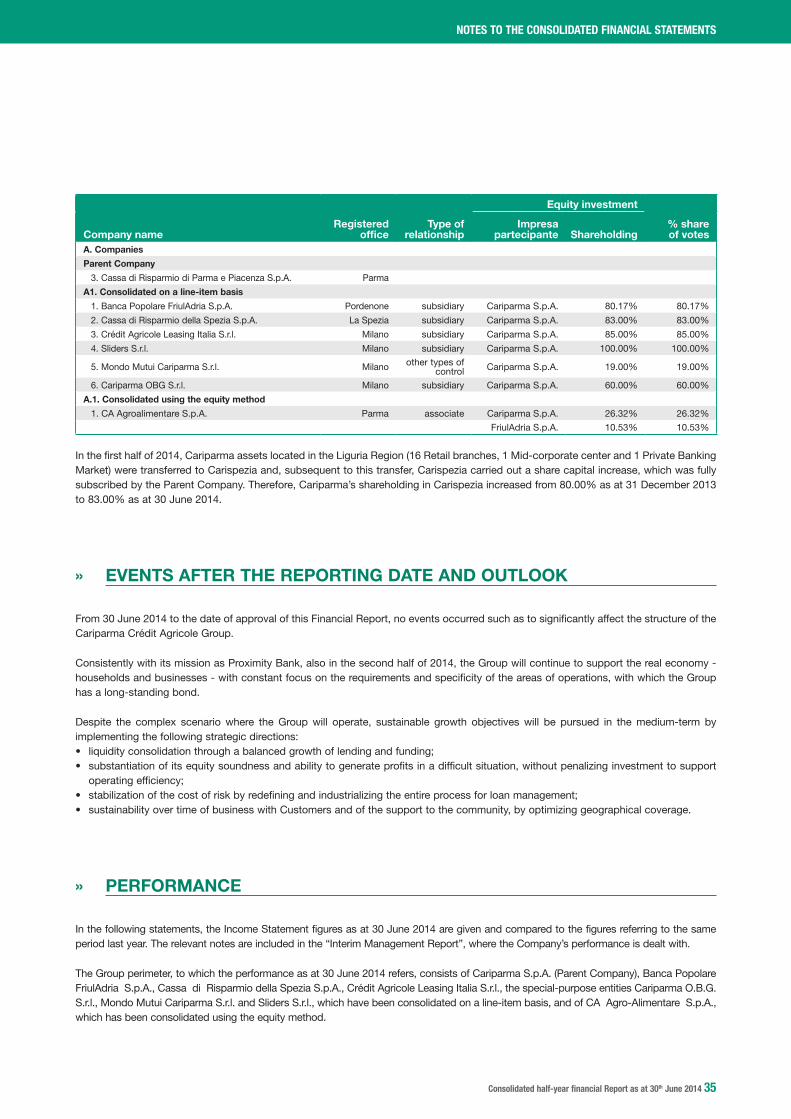
Equity investment
Company nameRegistered
officeType of
relationshipImpresa
partecipante Shareholding% shareof votes
A. Companies
Parent Company
3. Cassa di Risparmio di Parma e Piacenza S.p.A. Parma
A1. Consolidated on a line-item basis
1. Banca Popolare FriulAdria S.p.A. Pordenone subsidiary Cariparma S.p.A. 80.17% 80.17%
2. Cassa di Risparmio della Spezia S.p.A. La Spezia subsidiary Cariparma S.p.A. 83.00% 83.00%
3. Crédit Agricole Leasing Italia S.r.l. Milano subsidiary Cariparma S.p.A. 85.00% 85.00%
4. Sliders S.r.l. Milano subsidiary Cariparma S.p.A. 100.00% 100.00%
5. Mondo Mutui Cariparma S.r.l. Milano other types of control Cariparma S.p.A. 19.00% 19.00%
6. Cariparma OBG S.r.l. Milano subsidiary Cariparma S.p.A. 60.00% 60.00%
A.1. Consolidated using the equity method
1. CA Agroalimentare S.p.A. Parma associate Cariparma S.p.A. 26.32% 26.32%
FriulAdria S.p.A. 10.53% 10.53%
In the first half of 2014, Cariparma assets located in the Liguria Region (16 Retail branches, 1 Mid-corporate center and 1 Private Banking Market) were transferred to Carispezia and, subsequent to this transfer, Carispezia carried out a share capital increase, which was fully subscribed by the Parent Company. Therefore, Cariparma’s shareholding in Carispezia increased from 80.00% as at 31 December 2013 to 83.00% as at 30 June 2014.
» EVENTS AFTER THE REPORTING DATE AND OUTLOOK
From 30 June 2014 to the date of approval of this Financial Report, no events occurred such as to significantly affect the structure of the Cariparma Crédit Agricole Group.
Consistently with its mission as Proximity Bank, also in the second half of 2014, the Group will continue to support the real economy - households and businesses - with constant focus on the requirements and specificity of the areas of operations, with which the Group has a long-standing bond.
Despite the complex scenario where the Group will operate, sustainable growth objectives will be pursued in the medium-term by implementing the following strategic directions:• liquidityconsolidationthroughabalancedgrowthoflendingandfunding;• substantiationofitsequitysoundnessandabilitytogenerateprofitsinadifficultsituation,withoutpenalizinginvestmenttosupport operating efficiency;• stabilizationofthecostofriskbyredefiningandindustrializingtheentireprocessforloanmanagement;• sustainabilityovertimeofbusinesswithCustomersandofthesupporttothecommunity,byoptimizinggeographicalcoverage.
» PERFORMANCE
In the following statements, the Income Statement figures as at 30 June 2014 are given and compared to the figures referring to the same period last year. The relevant notes are included in the “Interim Management Report”, where the Company’s performance is dealt with.
The Group perimeter, to which the performance as at 30 June 2014 refers, consists of Cariparma S.p.A. (Parent Company), Banca Popolare FriulAdria S.p.A., Cassa di Risparmio della Spezia S.p.A., Crédit Agricole Leasing Italia S.r.l., the special-purpose entities Cariparma O.B.G. S.r.l., Mondo Mutui Cariparma S.r.l. and Sliders S.r.l., which have been consolidated on a line-item basis, and of CA Agro-Alimentare S.p.A., which has been consolidated using the equity method.
NOTES TO THE CONSOLIDATED FINANCIAL STATEMENTS

36 Consolidated half-year financial Report as at 30th June 2014
Income Statement reclassification
In order to present performance more effectively, a summary income statement has been prepared with appropriate reclassifications so as to report the various items on the basis of consistent operational standards.
The reclassifications concerned the following:• the recovery of the time value component on loans was reported under “Net Interest Income” rather than under “Net Impairment Adjustments of Loans”, since this arises directly from applying the amortized cost method when there are no changes in expected future cash flows;• net gains (losses) on trading activities and the net gains (losses) on hedging activities have been reallocated to gains or losses on financial activities;• gains and losses on the sale or repurchase of available-for-sale financial assets and financial liabilities have been reallocated to gains or losses on financial activities;• the recovery of expenses, taxes and levies has been posted as a direct reduction of administrative expenses, rather than being reported under other operating revenues/expenses;• expenses for the management of impaired loans and the relevant recoveries have been reclassified as net impairment adjustments of loans;• commissions for fast loan application processing have been taken to commission income rather than being recognized under other operating revenues/expenses;• net adjustments to/write-backs on impairment of available-for-sale financial assets have been reclassified under other operating revenues/expenses;• net impairment adjustment of other financial transactions, mainly relating to guarantees and commitments, have been reclassified under net impairment adjustments of loans.
The figures presented below are expressed in thousands of Euros.
Reclassified Consolidated Income Statement
Changes30.06.2014 30.06.2013 (°) Amount %
Net interest income 504,536 470,777 33,759 7.2
Net commission income 329,765 314,828 14,937 4.7
Dividends 8,400 1,655 6,745
Gain (loss) on financial activities 3,734 26,905 -23,171 -86.1
Other operating revenues (expenses) -2,881 29 -2,910
Net operating revenues 843,554 814,194 29,360 3.6
Staff expenses -291,741 -308,691 -16,950 -5.5
Administrative expenses -144,026 -146,969 -2,943 -2.0
Depreciation and amortization -41,197 -43,790 -2,593 -5.9
Operating expenses -476,964 -499,450 -22,486 -4.5
Operating profit 366,590 314,744 51,846 16.5
Net provisions for liabilities and contingencies -9,160 -9,155 5 0.1
Net adjustments of loans -209,357 -204,585 4,772 2.3
Gain (loss) from financial assets held to maturity and other investments 143 -172 315
Profit before tax on continuing operations 148,216 100,832 47,384 47.0
Income tax for the period on continuing operations -73,943 -12,253 61,690
Profit (loss) for the period 74,273 88,579 -14,306 -16.2
Net profit (loss) pertaining to minority interestes -3,959 -3,740 219 5.8
Net profit for the period pertaining to shareholders of the Group 70,314 84,839 -14,525 -17.1
(°) Restated following the reclassification of the expenses for the management of impaired loans and the relevant recoveries from the “Operating expenses” item to the “Net impairment adjustments of loans” item.
NOTES TO THE CONSOLIDATED FINANCIAL STATEMENTS

Consolidated half-year financial Report as at 30th June 2014 37
Reconciliation between the Official and Reclassified Income Statements
30.06.2014 30.06.2013 (°)
Net interest income 504,536 470,777
30. Net interest margin 470,579 450,834
130. Net impairement adjustments of: a) loans, of which time value on impaired loans 33,424 19,652
190. Net gains (IAS) pertaining to Calit 533 291
Net commissions income 329,765 314,828
60. Net commissions 305,185 284,303
190. Other operating revenues/expenses: past due commission 24,580 30,525
Dividends = item 70 8,400 1,655
Net gain (loss) on financial activities 3,734 26,905
80. Net gain (loss) on financial activities 2,249 6,589
90. Net gain (loss) on hedging activities (1,539) (2,159)
100. Gain (loss) on the disposal or repurchase of: b) financial assets available for sale 5,328 21,531
100. Gain (loss) on the disposal or repurchase of: d) financial liabilities (1,459) 944
110. Net gain (loss) on financial assets and liabilities carried at fair value (845) -
Other operating revenues (expenses) (2,881) 29
220. Other operating revenues/expenses 132,314 121,373
less: recovery of expenses (106,662) (86,332)
less: recovery of expenses agreements repurchase (3,379) (2,531)
less: past due commission (24,580) (30,525)
less: net gains (IAS) pertaining to Calit (533) (291)
130. Net impairement adjustments of: b) financial assets available for sale (41) (1,665)
Net operating revenues 843,554 814,194
Staff expenses = 180 a) (291,741) (308,691)
Administrative expenses (144,026) (146,969)
150. Administrative expenses: b) other administrative expenses (255,926) (238,127)
190. Other operating revenues/expenses: recovery of expenses 106,662 86,332
150. Administrative expenses: b) other administrative expenses: of which operating expenses agreements repurchase 5,238 4,826
Depreciation and amortization (41,197) (43,790)
170. Net adjustmants of property, plant and equipment (13,160) (14,233)
180. Net adjustments of intangible assets (28,037) (29,557)
Operating expenses (476,964) (499,450)
Net operating profit 366,590 314,744
Goodwill value adjustments = Item 230 - -
Net provisions for liabilities and contingencies = Item 160 (9,160) (9,155)
Net impairment adjustments of loans (209,357) (204,585)
100. Gain/loss on the disposal of: a) loans (4) (9)
130. Net impairment adjustments of: a) loans (171,960) (181,176)
130. Net impairment adjustments of: a) loans, of which time value on impaired loans (33,424) (19,652)
150. Administrative exspenses: b) other administrative expenses: of which expenses for management (5,238) (4,826)
190. Other operating revenues/expenses: of which recovery of expenses for the management of impaired loans 3,379 2,531
130. Net impairment adjustments of: d) other financial transactions (2,110) (1,453)
Gain (loss) from financial assets held to maturity and other investments 143 (172)
210. Gain (loss) from equity investments 147 (403)
240. Gain (loss) on disposal of investments (4) 231
Profit before tax on continuing operations 148,216 100,832
Income tax on continuing operations = Item 260 (73,943) (12,253)
Profit (loss) for the period 74,273 88,579
Net profit (loss) pertaining to minority interests -3959 -3740
Net profit for the period pertaining to shareholders of the Group 70,314 84,839
(°) Restated following the reclassification of the expenses for the management of impaired loans and the relevant recoveries from the “Operating expenses” item to the “Net impairment adjustments of loans” item.
NOTES TO THE CONSOLIDATED FINANCIAL STATEMENTS

38 Consolidated half-year financial Report as at 30th June 2014
Net interest income
ItemsChanges
30.06.2014 30.06.2013 Amount %Business with customers 512,668 472,236 40,432 8.6
Business with banks -1,921 445 -2,366
Securities issued -165,071 -184,445 -19,374 -10.5
Differences on hedging derivatives 79,054 104,463 -25,409 -24.3
Financial assets held for trading 376 24 352
Financial assets available for sale 78,033 78,080 -47 -0.1
Financial assets and liabilities carried at fair value 1,503 - 1,503
Other net interest -106 -26 80
Net interest income 504,536 470,777 33,759 7.2
Net commission income
ItemsChanges
30.06.2014 30.06.2013 Amount %- guarantees issued 3,704 5,772 -2,068 -35.8
- collection and payment services 21,456 20,632 824 4.0
- current accounts 116,625 122,410 -5,785 -4.7
- debit and credit card services 14,363 17,997 -3,634 -20.2
Commercial banking business 156,148 166,811 -10,663 -6.4
- securities intermediation and placement 61,822 61,590 232 0.4
- foreign exchange 1,774 1,676 98 5.8
- asset management 2,588 3,436 -848 -24.7
- distribution of insurance products 86,174 62,981 23,193 36.8
- other intermediation/management commissions 1,715 1,035 680 65.7
Management, intermediation and advisory services 154,073 130,718 23,355 17.9
Other net commissions 19,544 17,299 2,245 13.0
Total net commissions income 329,765 314,828 14,937 4.7
Net gains (loss) on financial activities
ItemsChanges
30.06.2014 30.06.2013 Amount %Interest rates -609 6,599 -7,208
Equities -20 13 -33
Foreign exchange 1,415 916 499 54.5
Commodities 5 5 - -
Total net gain (loss) on financial assets held for trading 791 7,533 -6,842
Total gain (loss) on hedging activities -1,540 -2,159 -619 -28.7
Gain (loss) on disposal of financial assets available for sale 5,328 21,531 -16,203 -75.3
Net gain (loss) on financial assets and liabilities carried at fair value -845 - -845
Net gain (loss) on financial activities 3,734 26,905 -23,171 -86.1
NOTES TO THE CONSOLIDATED FINANCIAL STATEMENTS

Consolidated half-year financial Report as at 30th June 2014 39
Operating expenses
ItemsChanges
30.06.2014 30.06.2013 (°) Amount %- wages and salaries -208,132 -221,361 -13,229 -6.0- social security contributions -55,833 -59,208 -3,375 -5.7- other staff expenses -27,776 -28,122 -346 -1.2Staff expenses -291,741 -308,691 -16,950 -5.5- general operating expenses -40,012 -38,700 1,312 3.4- IT services -27,510 -32,064 -4,554 -14.2- direct and indirect taxes -51,138 -42,734 8,404 19.7- facilities management -27,903 -30,477 -2,574 -8.4- legal and other professional services -6,459 -8,403 -1,944 -23.1- advertising and promotion costs -4,322 -5,069 -747 -14.7- indirect staff expenses -3,746 -4,193 -447 -10.7- other expenses -89,597 -71,658 17,939 25.0- recovery of expenses and charges 106,661 86,329 20,332 23.6Administrative expenses -144,026 -146,969 -2,943 -2.0- intangible assets -28,037 -29,557 -1,520 -5.1- property, plant and equipment -13,160 -14,233 -1,073 -7.5Depreciation and amortization -41,197 -43,790 -2,593 -5.9Operating expenses -476,964 -499,450 -22,486 -4.5
(°) Restated following the reclassification of the expenses for the management of impaired loans and the relevant recoveries from the “Operating expenses” item to the “Net impairment adjustments of loans” item.
Net impairment adjustments of loans
ItemsChanges
30.06.2014 30.06.2013 (°) Amount %- bad debts -76,108 -69,006 7,102 10.3 - Substandard loans -116,509 -113,414 3,095 2.7 - Restructured loans -14,463 -14,366 97 0.7 - Past-due loans -5,292 -3,996 1,296 32.4 - Performing loans 5,125 -2,350 7,475 Nei impairment adjustments of loans -207,247 -203,132 4,115 2.0 Net adjustments of guarantees and commitments -2,110 -1,453 657 45.2 Net adjustments of loans -209,357 -204,585 4,772 2.3
(°) Restated following the reclassification of the expenses for the management of impaired loans and the relevant recoveries from the “Operating expenses” item to the “Net impairment adjustments of loans” item.
Comprehensive income
Items 30.06.2014 30.06.201310. Net profit (loss) for the period 74,273 88,579
Other income after tax20. Property, plant and equipment - - 30. Intangible assets - - 40. Actuarial gains (losses) on defined-benefit plans -6,301 -54350. Disposal groups - - 60. Share of valutation reserves on equity investments accounted for using the equity method - -
Other income components net of taxes with reversals to Income Statement70. Hedging of foreign invesments - - 80. Exchange rate differences - - 90. Cash flow hedges - -
100. Financial assets available for sale 93,166 29,957 110. Disposal groups - - 120. Share of valutation reserves on equity investments accounted for using the equity method - - 130. Total other income components after tax 86,865 29,414 140. Comprehensive income (Item 10+130) 161,138 117,993 150. Consolidated comprehensive income pertaining to minority interests 6,495 3,394 160. Consolidated comprehensive income pertaining to the Parent Company 154,643 114,599
NOTES TO THE CONSOLIDATED FINANCIAL STATEMENTS

40 Consolidated half-year financial Report as at 30th June 2014
» BALANCE SHEET AGGREGATES
Balance sheet figures at 30 June 2014 are reported below in comparison with the previous year figures. The relevant notes are included in the “Interim Management Report”, where the Company’s performance is dealt with.
Balance Sheet Reclassification
In order to provide a more direct representation of the Company’s balance sheet and financial position, a summary balance sheet was prepared by suitably aggregating balance-sheet items. These grouping concerned:• presentationoffinancialAssets/Liabilitiesheldfortradingonanetbasis;• presentationofLoanstobanks/Duetobanksonanetbasis;• inclusionofthenetvalueofhedgeDerivativesandoftheAdjustmentofmacro-hedgedassetsandliabilitiesnowrecognizedunder Other assets/Other liabilities.• groupingofIntangibleAssetsandProperty,PlantandEquipmentintoasingleaggregate;• inclusionoftheitem“Cashandcashequivalents”inthe“OtherAssets”residualitem;• groupinginthe“Fundingfromcustomers”itemofthe“Duetocustomers”and“Outstandingsecurities”items;• groupingofspecific-purposeprovisions(i.e.employeeseverancebenefitsandprovisionsforcontingenciesandliabilities)intoasingle aggregate.
Reclassified Consolidated Balance Sheet
Assets
Changes
30.06.2014 31.12.2013 Amount %Net financial assets/liabilities held for trading 17,057 - 17,057 100.0
Financial assets available for sale 5,511,421 5,096,003 415,418 8.2
Loans to customers 36,566,877 36,391,853 175,024 0.5
Equity investments 18,827 19,263 -436 -2.3
Property, plant and equipment and intangible assets 2,349,810 2,370,376 -20,566 -0.9
Tax assets 1,059,934 1,196,793 -136,859 -11.4
Other assets 1,608,703 1,568,046 40,657 2.6
Total net assets 47,132,629 46,642,334 490,295 1.1
Liabilities and equity
Changes
30.06.2014 31.12.2013 Amount %Net due to banks 3,244,023 2,779,223 464,800 16.7
Funding from customers 35,969,887 36,593,702 -623,815 -1.7
Net financial assets/liabilities held for trading 2,612 -928 3,540
Tax liabilities 238,091 386,232 -148,141 -38.4
Other liabilities 2,473,333 1,722,343 750,990 43.6
Specific-purpose provisions 336,918 363,657 -26,739 -7.4
Share capital 876,762 876,762 - -
Reserves (net of treasury shares) 3,681,207 3,615,053 66,154 1.8
Valuation reserves 40,856 -43,473 84,329
Minority interests 198,626 199,318 -692 -0.3
Net profit (loss) for the period 70,314 150,444 -80,130 -53.3
Total net liabilities and equity 47,132,629 46,642,334 490,296 1.1
NOTES TO THE CONSOLIDATED FINANCIAL STATEMENTS

Consolidated half-year financial Report as at 30th June 2014 41
Reconciliation of the official and reclassified balance sheets
Assets 30.06.2014 31.12.2013Net gain on financial assets carried at fair value 17,057 -30. Financial assets carried at fair value 17,057 -
Financial assets available for sale 5,511,421 5,096,00340. Financial assets available for sale 5,511,421 5,096,003
Loans to banks - -Loans to customers 36,566,877 36,391,85370. Loans to customers 36,566,877 36,391,853
Equity investments 18,827 19,263100. Equity investments 18,827 19,263
Property, plant and equipment and intangible assets 2,349,810 2,370,376110. Property plant and equipment 437,086 442,815
120. Intangible assets 1,912,724 1,927,562
Tax assets 1,059,934 1,196,793140. Tax assets 1,059,934 1,196,793
Other assets 1,608,703 1,568,04610. Cash and cash equivalents 249,292 334,127
150. Other assets 488,570 539,785
80. Hedging derivatives 861,723 692,941
90. Value adjustment of financial asets sibject to macro hedging (+/-) 9,118 1,192Total net assets 47,132,629 46,642,334
Liabilities and equity 30.06.2014 31.12.2013Net interbank funding 3,244,023 2,779,22310. Loans to bank 6,448,449 6,084,875
60. Due to bank -3,204,426 -3,305,651
Funding from customers 35,969,887 36,593,70220. Due to customers 23,755,266 23,360,593
30. Securities issued 12,214,621 13,233,109
Net financial assets/liabilities held for trading 2,612 -92840. Financial liabilities held for trading 216,495 213,804
20. Financial assets held for trading -213,883 -214,732
Tax liabilities 238,091 386,23280. Tax liabilities 238,091 386,232
Liabilities in respect of assets being divested - -Other liabilities 2,473,333 1,722,343100. Other liabilities 1,407,969 1,026,440
60. Hedging derivatives 519,899 345,373
70. Adjustment of financial liabilities hedged generically (+/-) 545,465 350,530
Specific-purpose provision 336,918 363,657110. Employee severance benefits 157,742 151,648
120. Brovisions for liabilities and contingencies 179,176 212,009
Share capital 876,762 876,762180. Share capital 876,762 876,762
Reserves (net of treasury shares) 3,681,207 3,615,053160. Reserves 945,745 879,591
170. Share premium reserve 2,735,462 2,735,462
Valutation reserves 40,856 -43,473130. Valutation reserves 40,856 -43,473
Assets pertaining to minority interests 198,626 199,318210. Assets pertaining to minority interests 198,626 199,318
Net profit (loss) for the period 70,314 150,444200. Net profit (loss) for the period 70,314 150,444Total net liabilities and equity 47,132,629 46,642,334
NOTES TO THE CONSOLIDATED FINANCIAL STATEMENTS

42 Consolidated half-year financial Report as at 30th June 2014
Loans to Customers
Changes
Items 30.06.2014 31.12.2013 Amount %- Current accounts 3,474,253 3,714,912 -240,659 -6.5
- Mortgage loans 21,065,297 21,222,416 -157,119 -0.7
- Advances and other loans 9,143,301 9,152,483 -9,182 -0.1
- Impaired loans 2,761,730 2,296,530 465,200 20.3
Loans 36,444,581 36,386,341 58,240 0.2
Loans represented by securities 122,296 5,512 116,784
Loans to customers 36,566,877 36,391,853 175,024 0.5
Loans to customers: credit quality
Items
30.06.2014 31.12.2013
Gross exposure
Total writedowns
Net exposure
Gross exposure
Total writedowns
Net exposure
- Bad debts 2,269,063 1,276,166 992,897 2,103,865 1,184,845 919,020
- Substandard loans 1,399,097 353,659 1,045,438 1,056,353 288,576 767,777
- Restructured loans 541,966 75,089 466,877 430,824 56,354 374,470
- Past-due / overlimit loans 266,551 10,034 256,517 243,711 8,448 235,263
Impaired loans 4,476,677 1,714,948 2,761,729 3,834,753 1,538,223 2,296,530
Performing loans 34,043,954 238,806 33,805,148 34,354,686 259,363 34,095,323
Total 38,520,631 1,953,754 36,566,877 38,189,439 1,797,586 36,391,853
For more exhaustive reporting, reference is made to the section on credit risk on page 51.
Funding from Customers
Changes
Items 30.06.2014 31.12.2013 Amount %- Deposits 3,384,653 3,462,075 -77,422 -2.2
- Conti correnti ed altri conti 20,158,777 19,643,563 515,214 2.6
- Other items 153,763 146,148 7,615 5.2
- Repurchase agreements 58,073 108,807 -50,734 -46.6
Due to customers 23,755,266 23,360,593 394,673 1.7
Securities issued 12,214,621 13,233,109 -1,018,488 -7.7
Total direct funding 35,969,887 36,593,702 -623,815 -1.7
Indirect funding 54,242,114 50,892,431 3,349,683 6.6
Total funding 90,212,001 87,486,133 2,725,868 3.1
Indirect funding
Changes
Items 30.06.2014 31.12.2013 Amount %- Asset management products 9,361,185 8,627,449 733,736 8.5
- Insurance products 11,349,186 10,450,117 899,069 8.6
Total assets under management 20,710,371 19,077,566 1,632,805 8.6
Assets under administration 33,531,743 31,814,865 1,716,878 5.4
Indirect funding 54,242,114 50,892,431 3,349,683 6.6
NOTES TO THE CONSOLIDATED FINANCIAL STATEMENTS

Consolidated half-year financial Report as at 30th June 2014 43
Available-for-sale financial assets
Changes
Items 30.06.2014 31.12.2013 Amount %- Bonds and other debt securities 5,299,156 4,877,691 421,465 8.6
- Equity securities and units of collective investment undertakings. 2,275 2,478 -203 -8.2
Securities available for sale 5,301,431 4,880,169 421,262 8.3
- Equity investments 209,990 215,834 -5,844 -2.7
Shareholdings available for sale 209,990 215,834 -5,844 -2.7
Financial assets available for sale 5,511,421 5,096,003 415,418 8.2
Government securities held
30.06.2014
Nominal value
Book value
Valution reserves
FVTPL
Italian government bond 4 4 X
Argentina government bond 20 - X
AFS
Italian government bond 4,500,000 5,250,224 73,627
Argentina government bond 24 24 2
Total 4,500,048 5,250,252 73,629
Specific-purpose provisions
Changes
Items 30.06.2014 31.12.2013 Amount %Employee severance benefits 157,742 151,648 6,094 4.0
Provisions for liabilities and contingencies 179,176 212,009 -32,833 -15.5
- retirement and similar liabilities 22,453 23,151 -698 -3.0
- other provisions 156,723 188,858 -32,135 -17.0
Total specific-purpose provisions 336,918 363,657 -26,739 -7.4
Equity
Changes
Items 30.06.2014 31.12.2013 Amount %Share capital 876,762 876,762 - -
Share capital premium eserve 2,735,462 2,735,462 - -
Reserves 945,745 879,591 66,154 7.5
Valutation reserves of financial assets available for sale 69,318 -21,047 90,365 -
Valutation reserves of Actuarial gaings (losses) pertaining to defined-benefit pension plans -28,462 -22,426 -6,036 26.9
Net profit (loss) for the period 70,314 150,444 -80,130 -53.3
Total equity 4,669,139 4,598,786 70,353 1.5
NOTES TO THE CONSOLIDATED FINANCIAL STATEMENTS

44 Consolidated half-year financial Report as at 30th June 2014
Fair value reporting
Fair value reporting - Classification of financial instruments and non-financial assets/liabilities
Reporting on the fair value hierarchy as required by IFRS 13 applies to financial instruments and to non-financial assets/liabilities that are measured at fair value (irrespectively of whether they are measured on a recurring or non-recurring basis).
The standard categories the fair value into three different levels based on the observability of the inputs used for the measurement:• Level 1: Fair value equal to quoted prices (with no adjustments) in active markets. Level 1 includes financial instruments that are quoted on active markets. Specifically, these financial instruments are stocks and bonds quoted on active markets, investment schemes quoted on active markets and derivatives traded on regulated markets. Markets are considered active if the quotations are easily and regularly available on the stock exchange, from brokers, intermediaries, price quotation services or regulatory agencies and these prices represent actual transactions that are regularly carried out in the market on an arm’s length basis.• Level 2: Fair value determined using measurement models that are universally acknowledged and based on observable or indirectly observable market inputs. These data are directly observable or indirectly observable (for example, determining the interest rate curve based on the interest rates that can be observed directly on the market as at a reference date). Level 2 includes: • stocksandbondsthatarequotedonmarketsconsideredinactiveorthatarenotquotedonanactivemarket,butwhosefairvalueis determined using a universally acknowledged measurement model based on observable or indirectly observable inputs; • financialinstrumentswhosefairvalueisdeterminedwithmeasurementmodelsusingobservablemarketinputs.• Level 3: Financial instruments whose fair value is determined using, to a significant extent, inputs that do not meet the set observability requirements. The fair value of some complex instruments that are not traded on active markets is determined with measurement techniques that are based on assumptions not supported by observable market inputs. The above are mainly complex interest rate instruments, stock derivatives and structured loans, where the measured correlation or volatility inputs are not directly comparable to market inputs.
Fair value reporting - Fair value levels 2 and 3: measurement techniques and inputs usedLevel 2: this level includes all financial instruments for which there is no active market, but whose measurement is based on observable market inputs. Therefore, universally acknowledged measurement models have been set, which refer to market inputs.
Specifically, fixed-rate bonds relating to financial assets or liabilities are measured using the discounted cash flow method pursuant to the security contractual scheme; variable-rate bonds are measured by discounting back future cash flows estimated on the basis of the forward rates with the application of index-linking parameter.
Derivative contracts are measured using specific calculation algorithms according to the type of the different categories of transactions.
Level 3: all financial instruments for which there is no active market and whose measurement is not based on observable market inputs or using the measurement communicated by qualified market players.
Fair value reporting - Fair value hierarchy
For assets and liabilities recognized, the Financial Management Department of the Parent Company determined whether transfers between fair value levels have occurred and reviews the fair value categorization at each reporting date.
The Financial Management Departmental moves financial instruments from level 1 to level 2 only in case of financial instruments that are quoted in a regulated but not active market and that can be measured using the Group’s internal standard pricing models.
The Financial Management Departmental moves financial instruments from level 1 to level 3 only in case of financial instruments that are quoted in a regulated but not active market and that can be measured using the Group’s internal standard pricing models.
In the first half of 2014 no inter-portfolio transfers were made.
NOTES TO THE CONSOLIDATED FINANCIAL STATEMENTS

Consolidated half-year financial Report as at 30th June 2014 45
Portfolio reporting: breakdown by fair value level
Financial assets / liabilities carries at fair value
30.06.2014 31.12.2013
Level 1 Level 2 Level 3 Level 1 Level 2 Level 31. Financial liabilities held for trading 17 200,026 13,840 18 181,370 33,344
2. Financial liabilities carried at fair value - 17,057 - - - -
3. Financial assets available for sale 5,250,718 - 260,703 4,829,585 - 266,418
4. Hedging derivatives - 861,723 - - 692,941 -
Total 5,250,735 1,078,806 274,543 4,829,603 874,311 299,762
1. Financial liabilities held for trading - 203,663 12,832 - 181,625 32,179
2. Financial liabilities carried at fair value - - - - - -
3. Hedging derivatives - 299,488 220,411 - 215,689 129,684
Total - 503,151 233,243 - 397,314 161,863
Annual changes in financial assets measured at fair value level 3
Financial assets
Held for tradingCarried at fair value
Availablefor sale Hedging
1. Opening balance 33,344 - 266,418 -
2. Increases 69 - 2,320 -
2.1 Purchases - - 1,846 -
2.2 Profits recognized in: - - - -
2.2.1 Income Statement 63 - 250 -
- of which: Capital gaings 47 - - -
2.2.2 Shareholders' equity X - 224 -
2.3 Transfers from other categories - - - -
2.4 Other increases 6 - - -
3. Decreases 19,573 - 8,035 -
3.1 Sales 24 - 3,662 -
3.2 Redemptions 17,861 - - -
3.3 Losses recognized in: - - - -
3.3.1 Income Statement 1,632 - 63 -
- of which Capital losses 1,612 - - -
3.3.2 Shareholders' equity X - 4,310 -
3.4 Transfers to other categories 51 - - -
3.5 Other decreases 5 - - -
4. Final inventories 13,840 - 260,703 -
NOTES TO THE CONSOLIDATED FINANCIAL STATEMENTS

46 Consolidated half-year financial Report as at 30th June 2014
Annual changes in financial liabilities measured at fair value level 3
Financial assets
Carried at fair value
Availablefor sale Hedging
1. Opening balance 32,179 - 129,684
2. Increases 4 - 126,337
2.1 Purchases - - 108,927
2.2 Profits recognized in: - - -
2.2.1 Income Statement 4 - 17,410
- of which: Capital gaings 4 - 17,410
2.2.2 Shareholders' equity X X -
2.3 Transfers from other categories - - -
2.4 Other increases - - -
3. Decreases 19,351 - 35,610
3.1 Sales 17,865 - 35,610
3.2 Redemptions 3 - -
3.3 Losses recognized in: - - -
3.3.1 Income Statement 1,483 - -
- of which Capital losses 1,483 - -
3.3.2 Shareholders' equity X X -
3.4 Transfers to other categories - - -
3.5 Other decreases - - -
4. Final inventories 12,832 - 220,411
Regulatory Capital
Categories/amounts 30.06.2014 31.03.2014OWN FUNDS
A. Common Equity Tier 1 (CET1) 2,550,105 2,563,059
B. Additional Tier 1 capital (AT1) - -
C. Tier 1 capital (Tier 1) (A + B) 2,550,105 2,563,059
D. Tier 2 capital, (supplementary capital) (T2) 545,183 619,491
E. Total Own Funds (Total Capital) (C + D) 3,095,288 3,182,550
SUPERVISORY CAPITAL REQUIREMENTS
F. Total prudential requirements 1,902,566 1,956,919
G. Total Risk-Weighted Assets 23,782,063 24,461,488
CAPITAL RATIOS
H. Common Equity Tier 1 ratio (A / G) 10.7% 10.5%
I. Tier 1 ratio (C / G) 10.7% 10.5%
J. Total Capital ratio (E / G) 13.0% 13.0%
NOTES TO THE CONSOLIDATED FINANCIAL STATEMENTS

Consolidated half-year financial Report as at 30th June 2014 47
» OPERATIONS AND INCOME BY BUSINESS SEGMENT
Data relating to operations and income by business segment is given in compliance with IFRS 8 on Operating Segments using the management reporting approach.
Segment reporting was prepared using the multiple ITR (internal transfer rate) method, integrating the cost of liquidity in compliance with the Bank of Italy’s provisions.
The Cariparma Group operates through an organization structure that comprises: Retail and Private Banking channels designed to provide services to individuals, households and small businesses; Mid-corporate and Corporate channels designed to provide services to larger-sized companies. Segment reporting also covers data relating to the operations and income of Crédit Agricole Leasing. Therefore, given the features of the Cariparma Group, the “Other” channel is of a residual nature and specifically includes the operations of Mondo Mutui, Sliders and anything that cannot be included in the other channels, such as activities pertaining to central departments, for instance the management of proprietary securities portfolio, the net balance of hedging activities and governance exercise.
Income from the Retail and Private Banking channels came to Euro 729.9 million. This figure increased by +1.1% YOY, since the increases in net commission income and in the “other income and expenses” item were only partially offset by the decrease in the interest income component. The contribution to total revenues of the Corporate and Mid-corporate channels came to Euro 137.2 million, posting a significant increase vs. 2013 of +19.9%, thanks to the higher contribution of net interest income that benefited from the development in lending volumes and from the pricing review on short-term funding. The performance of the “Other” channel benefited from an increase in dividend income from the equity investment in the Bank of Italy.
As regards costs, the Retail and Private Banking channels were essentially stable vs. the previous year:
they were up by +0.8% due to two opposite effects: the increase in the operating expense aggregate, which was impacted by the implementation of some organizational projects including the review of the distribution model “Moser” (MOSER is the Italian acronym for service model), and, on the other hand, by a decrease in the cost of risk. Conversely, the Corporate and Mid-corporate channels posted a -1.3% decrease, mainly due to the reduction in impairment adjustment of loans and, to a lesser extent, to the reduction in administrative expenses. Expenses for the “Other” channel also decreased.
Assets by segment (point volumes) mainly consisted of loans to Customers, property, plant and equipment and intangible assets that can be directly allocated to the operating segments. As at 30 June 2014, assets of the Retail and Private Banking channels amounted to Euro 25.1 billion and posted a slight increase of +0.8% vs. 31 December 2013. The Corporate and Mid-corporate channels came essentially in line, down by -0.2%, vs. 31 December 2013, with assets amounting to Euro 13.7 billion.
Liabilities by segment (point volumes) consisted of direct funding from Customers, which can be directly allocated to the operating segments. In this aggregate, funding in the Retail and Private Banking channels came to Euro 31.6 billion, modestly decreasing by -1.1%; this performance was due to the reallocation by Customers of their investment portfolios to asset management products. The contribution of the Corporate and Mid-corporate channels came to Euro 3.8 billion, decreasing by -6.6% vs. 31 December 2013,
due to the reduction in the liquidity positions of some large Customers.
In accordance with IFRS 8, it is reported that the Group’s business operations are essentially carried out in the Italian national territory, they are not subject to periodic performance reporting to the management breaking down by foreign geographical area. The Group has not achieved revenues resulting from transactions with single external customers for amounts exceeding 10% of the income recognized in the financial statements.
NOTES TO THE CONSOLIDATED FINANCIAL STATEMENTS

48 Consolidated half-year financial Report as at 30th June 2014
Operation and Profit or Loss by segment as at 30th June 2014
Retail and Private
Corporate and Companies Other Total
Data as of 30.06.2014External operating revenuesNet interest income 377,724 92,448 407 470,579Net commission income 262,168 41,507 1,510 305,185Gain (loss) on financial activities and on financial assets carried at fair value 3,033 1,290 -2,919 1,404Dividends - - 8,400 8,400Other net operating revenues 95,332 1,032 38,275 134,640Total operating revenues 738,257 136,277 45,673 920,208Impairment adjustments of loans -70,785 -101,488 313 -171,960Impairment adjustments of AFS financial assets and other financial transactions - - -2,151 -2,151
Staff expenses, administrative expenses and depraction/amortization -475,340 -33,368 -80,156 -588,864
Provisions for risks -4,919 -2,583 -1,658 -9,160Total expenses -551,044 -137,439 -83,651 -772,134Gain (loss) from equity investments - - 147 147Goodwill value adjustments - - - -Gain (loss) on disposal of investments - - -4 -4Result by segment 187,213 -1,162 -37,835 148,217Unallocates operating expenses - - - -Operating profit - - - -
Profit before tax 187,213 -1,162 -37,835 148,216Taxes -72,607 381 -1,717 -73,943Profit for the period 114,606 -781 -39,552 74,273
Assets and liabilitiesAssets by segment (customers + intangible) 25,111,621 13,690,830 616,316 39,418,767Equity investments in associates - - 18,827 18,827Unallocated assets - - 11,113,344 11,113,344Total Assets 25,111,621 13,690,830 11,748,487 50,550,938Liabilities by segment 31,590,777 3,770,950 608,160 35,969,887Unallocated liabilities - - 9,911,912 9,911,912Total Liabilities 31,590,777 3,770,950 10,520,072 45,881,799
NOTES TO THE CONSOLIDATED FINANCIAL STATEMENTS

Consolidated half-year financial Report as at 30th June 2014 49
Operation and Profit or Loss by segment as at 30th June 2013
Retail and Private
Corporate and Companies Other Total
Data as of 30.06.2013External operating revenuesNet interest income 387,848 67,930 -4,944 450,834Net commission income 240,176 43,378 749 284,303Gain (loss) on financial activities and on financial assets carried at fair value 4,792 2,067 -270 6,589Dividends - - 1,655 1,655Other net operating revenues 89,271 1,003 51,407 141,680Total operating revenues 722,087 114,378 48,597 885,061Impairment adjustments of loans -77,983 -103,316 123 -181,176Impairment adjustments of AFS financial assets and other financial transactions - - -3,118 -3,118
Staff expenses, administrative expenses and depraction/amortization -463,653 -33,081 -93,875 -590,608
Provisions for risks -4,928 -2,845 -1,382 -9,155Total expenses -546,564 -139,242 -98,252 -784,058Gain (loss) from equity investments - - -403 -403Goodwill value adjustments - - - -Gain (loss) on disposal of investments - - 231 231Result by segment 175,523 -24,864 -49,827 100,832Unallocates operating expenses - - - -Operating profit - - - -
Profit before tax 175,523 -24,864 -49,827 100,832Taxes -82,618 11,725 58,640 -12,253Profit for the period 92,905 -13,139 8,813 88,579
Assets and liabilities 31.12.2013Assets by segment (customers + intangible) 24,907,437 13,720,535 674,042 39,302,014Equity investments in associates - - 23,513 23,513Unallocated assets - - 10,837,190 10,837,190Total Assets 24,907,437 13,720,535 11,534,745 50,162,717Liabilities by segment 31,939,910 4,036,129 617,664 36,593,703Unallocated liabilities - - 8,970,226 8,970,226Total Liabilities 31,939,910 4,036,129 9,587,890 45,563,929
» RISKS AND RISK MANAGEMENT
This section is meant to provide an update of the information on risks and risk management policies, as at 30 June 2014, to complete the reporting given in Part E of the Annual Report as at 31 December 2013.
Internal Capital Adequacy Assessment Process (ICAAP) Report
At the end of 2013, the Cariparma Crédit Agricole Group was authorized by the competent Supervisory Authorities to use advanced approaches to calculate credit risk in order to determine its capital requirements, with regard to the Retail perimeter of Cariparma e FriulAdria and effective from the reporting as at 31 December 2013. With this authorization, the Cariparma Crédit Agricole Group is a Class 1 entity for the determination of the ICAAP process.
At the end of April 2014, the Cariparma Crédit Agricole Group sent the consolidated report relating to its capital adequacy (Report) as at 31 December 2013 to the Bank of Italy.
The Report contains the strategic guidelines and the forecasting horizon considered; the description of the corporate governance, the organisational structure and the ICAAP-related control systems; risk exposure, risk measurement and aggregation methods, as well as stress testing; components, estimates and allocation methods of internal capital; reconciliation between internal capital, regulatory
NOTES TO THE CONSOLIDATED FINANCIAL STATEMENTS

50 Consolidated half-year financial Report as at 30th June 2014
requirements and regulatory capital and, finally, ICAAP self-assessment highlighting areas where the methodological model needs to be further developed.
The Internal Capital Adequacy Assessment Process (ICAAP) is the first phase in the prudential supervision process envisaged by the Second Pillar of the Capital Accord, “Basel II”, which is maintained also in the “Basel III” Capital Accord. The second phase consists of the Supervisory Review and Evaluation Process - SREP and it shall fall within the Supervisory Authority’s competence, which shall review the ICAAP and issue an overall opinion on the Group.
Internal Control System
The internal control system is the complex of the organizational, procedural and regulatory mechanisms aimed at controlling all types of activities and risks to ensure proper execution and security of operations.
The scope of the Cariparma Crédit Agricole Group’s internal control system includes all its structures, both central and of the Distribution Network, Information Technology departments, the main providers of outsourced essential services (FOI, the Italian acronym for Key Operating Functions) and the relating main providers.
In compliance with the standards of the Controlling Company, Crédit Agricole S.A., internal control is carried out with two different modalities: permanent control and periodic control.
In the Cariparma Crédit Agricole Group, the Risks and Permanent Controls Department and the Compliance Department are in charge of permanent control activities (for the subsidiary Crédit Agricole Leasing Italia, permanent control is ensured by the Risks, Permanent Controls and Compliance Departments), while the Audit Department is in charge of periodic control activities.
The regulations in force envisage that the control functions provide the management bodies having strategic responsibilities with periodic information on the single risks, both through specific reporting and taking part in specific Committees, set up at Group level: Internal Control Committee, Compliance Committee, Operational Risk Committee, Financial Risks and ALM Committee, Credit Risk Committee, New Assets and Products Committee.
On the Internal Controls System all implementation actions have been taken in order for this System to comply with the requirements and features provided for by the 15th update to Bank of Italy Circular No. 263/2006. In this regard, a specific project was started, which has been designed, through dedicated worksites, to implement the measures provided for by the regulations on four key scopes:• RAF(“RiskAppetiteFramework”):thereferenceframeworkfordeterminingriskappetite;• Governance:upgradingandenhancementofgovernancemechanisms;• ControlsSystem:upgrading,updatingandenhancementofcontrolsystems;• Outsourcing:governanceofinformationsystemandbusinesscontinuity,actionsofspecificitems(e.g.policies).
Credit Risk
The Cariparma Crédit Agricole Group attaches significant importance to the management and control of credit risk, which is a key precondition to ensure sustainable development over time, especially in the present complex economic situation.
The Cariparma Crédit Agricole Group’s lending operations are carried out setting, in compliance with the corporate strategies and objectives, lending policy directions and guidelines on lending and credit risk management, in order to selectively support the development of loans to the most worthy customers, as well as to limit and upgrade exposures to the riskiest Customers.
In the present ongoing negative economic situation, the Cariparma Crédit Agricole Group has enhanced its systematic control on the developments in the quality of the Loans-to Customers Portfolio, increasing and making even more selective the monitoring on the loan positions, from early warnings on, to promptly detect any sign of their being non-performing, and to take effective action to control credit risk.
At the same time, the Group has confirmed its commitment to support households, the real economy and the productive System, steering appropriate lending measures aimed at developing business with the most worthy Customers.
NOTES TO THE CONSOLIDATED FINANCIAL STATEMENTS

Consolidated half-year financial Report as at 30th June 2014 51
In the first half of 2014, the deterioration of the economic situation continued, which has been affecting the Mid-corporate segment to an increasing extent, with repercussions on the Households Segment, subsequent to the steady increase in the unemployment rate that has reached some of the highest levels in recent years.
The following are some of the most significant measures designed to enhance loans management and monitoring, which the Cariparma Crédit Agricole Group implemented and strengthened in the first half of 2014:• theenhancementofmonitoringonthepositionsshowingirregularperformances,throughmoreextensiveandpromptmanagement and action process, activated by early-warning indicators that steer the management of problem and non-performing loans and, in this regard, the loan control structures within the Distribution Channels have also been strengthened;• Thestrengtheningandfulloperation,atGrouplevel,oftheSpecialLoansDepartment,whichwassetuplastyearandisresponsible for identifying and defining the most effective management actions that are designed for loan support and for upgrading risk, with regard to businesses operating in the real estate and/or building sector, as well as to businesses subject to debt restructuring agreements, with specific reference to the remedies provided for by Articles 67, 182, 161 and 160 of the Italian Bankruptcy Act;• ThedesignandpreparationofanadvancedManagementElectronicProcedure,whosefullimplementationhasbeenscheduledforthe second half of 2014, having the purpose of optimizing the effectiveness of the processes for the recovery of non-performing and problem loans, for all types of Customers, and supported by specific organizational and management actions, with the objective to improve the management of the cost of credit;• Theconsolidationofastructuralreviewoflendingprocesses,impactingloangranting,management,monitoringandrecovery;• ThedevelopmentofastructuredtrainingplanforallStaffengagedinlendingprocesses,focusedonthegranting,managementand monitoring of credit risk.
Credit quality
Items
Gross exposure Changes
June 2014 December 2013 Amount %- Bad debts 2,269,063 5.9% 2,103,865 5.5% 165,198 7.9%
- Substandard loans 1,399,097 3.6% 1,056,353 2.8% 342,744 32.4%
- Restructured loans 541,966 1.4% 430,824 1.1% 111,142 25.8%
- Past-due/overlimit loans 266,551 0.7% 243,711 0.6% 22,840 9.4%
Impaired loans 4,476,677 11.6% 3,834,753 10.0% 641,924 16.7%
Performing loans 34,043,954 88.4% 34,354,686 90.0% -310,732 -0.9%
Total 38,520,631 100.0% 38,189,439 100.0% 331,192 0.9%
Items
Gross exposure Changes
June 2014 December 2013 Amount %- Bad debts 992,897 56.2% 919,020 56.3% 73,877 8.0%
- Substandard loans 1,045,439 25.3% 767,777 27.3% 277,662 36.2%
- Restructured loans 466,877 13.9% 374,470 13.1% 92,407 24.7%
- Past-due/overlimit loans 256,517 3.8% 235,263 3.5% 21,254 9.0%
Impaired loans 2,761,730 38.3% 2,296,530 40.1% 465,200 20.3%
Performing loans 33,805,148 0.7% 34,095,323 0.8% -290,175 -0.9%
Total 36,566,877 5.1% 36,391,853 4.7% 175,024 0.5%
NOTES TO THE CONSOLIDATED FINANCIAL STATEMENTS

52 Consolidated half-year financial Report as at 30th June 2014
The tables show that, in the first six months of 2014, impaired loans, net of adjustments, increased by Euro 465 million (up by +20.3%) vs. 31 December 2013. This, combined with the decrease in performing loans (down by -0.9%) translated into a higher weight of impaired assets on total loans to Customers, which increased from 10.0% to 11.6%.
All categories of impaired loans posted increases, especially substandard loans (up by +32.4%) whose total weight increased from 2.8% to 3.6% and restructured loans (up by +25.8%) since the new provisions integrated into the bankruptcy law (Article 67, 182 and 160 of the Italian Bankruptcy Act13) caused companies to make more extensive use of debt restructuring agreements.
The coverage ratio of impaired loans came to 38.3%, down by 1.8%, due to the reduction in the coverage of substandard loans, down by -2.0%, while the coverage ratio on bad loans was stable at 56.2%.
The cumulative total of writedowns of performing loans came to approximately Euro 239 million and accounted for 0.7% of the nominal value of performing all positions. The collective writedown has already taken account of the new guidelines as they can be obtained from the draft implementing International Technical Standards published by EBA in October 2013 and concerning the recognition of forbearance, non-performing and forborne exposures, which has led to higher adjustments of performing loan.
Moreover, with regard to the identification of impaired past due/overlimit loans, the Group has implemented the provisions of Article 178 of Regulation EU 575/2013 (CRR) in force as from 1 January 2014 and of the Circular issued by the Bank of Italy on 12 March 2014, which amended the credit quality definition pursuant to Bank of Italy Circular No. 272/2008 with regard to impaired past-due/overlimit loans. In this regard, it is reported that the Cariparma group has adopted, on all Customer segments, the definition of “borrower’s default” relating to the borrower’s total obligations.
Market risk
Trading Book
The Group does not engage in proprietary trading in financial and capital markets. Nevertheless, there are residual positions resulting from its placement and trading activities carried to meet customers’ requests.
Fair Value Option
The Group has adopted the so-called “fair value option”, that is to say, it has exercised the option to measure at fair value financial assets resulting from loan restructuring (“convertendo” Unipol SAI), recognizing the results of this measurement in the Income Statement.
Banking book
Asset Liability Management deals with Banking Book positions, with special focus on fixed-rate positions, The effects that interest rate fluctuations may have on the Group’s profits and economic value are taken into account.
The Cariparma Crédit Agricole Group manages, controls and monitors the interest rate risk on all assets and liabilities recognized in the Financial Statements, defining, through the adoption of internal models, the cumulative gap for each time bucket generated by the difference between the existing fixed-rate assets and liabilities. The Financial Risks and ALM Committee proposes the relevant limits to the Group Risk Management Committee of the Controlling Company Crédit Agricole S.A. by periodically submitting a Risk Strategy document, and the proposed limits are subsequently submitted for approval to the Boards of Directors of the Banks. In line with the instructions issued by Crédit Agricole S.A., a set of limits (in absolute value) on the gap was added to the global limit, defined in terms of Current Net Value (CNV) and representing the maximum risk level acceptable for the Group.
Global limits on banking book price risks are defined on the basis of the type of instrument that can be held (Italian, German, and French Government Bonds) and are expressed with reference to the maximum nominal value that can be held. Within the book, sub-limits of
13 Italian Act No. 134/2012 implementing Italian Decree Law No. 83/2012 (the so-called “Development Decree”) and Italian Act No. 98/2013 implementing Italian Decree Law No. 69/2013.
NOTES TO THE CONSOLIDATED FINANCIAL STATEMENTS

Consolidated half-year financial Report as at 30th June 2014 53
concentration by issuer are also set. In accordance with the methods used by the Group, a stress-testing model for the Banking Book has also been adopted.
Fair value hedging
The purpose of hedging interest rate risk is to immunize the Banking Book from changes in the interest rate curve or to lower the volatility of cash flows relating to a given asset/liability.
Specifically, the following have been hedged:• debentureloansissuedatfixed-rate(subjecttomicro-hedging)• fixed-rategapsshownbytheinternalmodelthroughmacro-hedging.ThehedgingsweremadebypurchasingInterestRateSwaps. The optional component of capped mortgage loans sold to Customers is subject to monitoring and, where necessary, to hedging by trading cap options on the market.
Liquidity risk
The Group manages liquidity risk using a system that includes methodologies for measuring and aggregating risks and for stress testing, in line with the mechanism adopted by the Controlling Company Crédit Agricole S.A., at the same time ensuring compliance with Italian legislative provisions.
The limit system is based on stress scenarios, with the purpose of ensuring a liquidity surplus on different time horizons and in increasingly serious scenarios. The stress assumptions used cover idiosyncratic crises, systemic crises and global crises. Moreover, the limit structure is completed by a set of management and early warning indicators provided for in the Contingency Funding Plan.
In addition to the above, and again consistently with the procedures adopted by the Controlling Company Credit Agricole S.A., standards and methods have been implemented, which are designed to calculate and monitor the Liquidity Coverage Ratio (LCR) provided for by Basel 3.
Operational risks
Breakdown of the Group’s losses
Operational losses recognized in the first half of 2014 came to approximately Euro 4.6 million.
As regards the sources of operational risk, the breakdown of losses as at the end of June by type of event (LET, “Loss Event Type”) is given below, net of recoveries and excluding boundary losses.
49,4%
Business practices
7,6%Internal fraud
7,3%External fraud
33,8%
Operationalerrors
0,4%
Technological systems
Human Resources and safety
0,0%Disasters or other events
1,3%
NOTES TO THE CONSOLIDATED FINANCIAL STATEMENTS

54 Consolidated half-year financial Report as at 30th June 2014
Main measures
As regards the management of operational risks, the activities and measures are to be reported which have been implemented in order to achieve a general improvement and the upgrading of the Internal Controls System to the provisions of the 15th update to Bank of Italy Circular No. 263/2006; specifically, the implementation concerning the Key Operating Functions (FOI) and the mechanisms to manage operational risks in order to meet the requirements to be authorized to use advanced approaches for the calculation of prudential requirements.
» BUSINESS COMBINATIONS CONCERNING COMPANIES OR BUSINESS UNITS
Transactions made in the period
In the first half of 2014, a geographical reorganization was carried out on the intra-group branch network, which entailed the transfer from the Parent Company Cariparma to the subsidiary Carispezia of 16 branches, 1 Mid-corporate center and 1 Private Banking market located in the Provinces of Savona, Genoa and Imperia; subsequently, Euro 533 million worth of gross loans to Customers, Euro 492 million worth of direct funding and Euro 948 million worth of indirect funding were also transferred.
Considering the reorganization purpose of the transaction and applying the Group accounting policy on business combinations between entities under common control, it has been recognized at book values. For the above transfer, Carispezia carried out a share capital increase of Euro 17.3 million reserved to the Parent Company. Since the accounting mismatch of the transfer assets and liabilities is zero, the recognition of the share capital increase of the subsidiary Carispezia entailed a decrease in equity reserves of the same amount. Therefore, this transaction generated no effects on the consolidated financial statements, except for the increase in the Parent Company’s shareholding in the investee’s capital from 80% to 83%.
» TRANSACTIONS WITH RELATED PARTIESThe regulation issued by the Bank of Italy on 12 December 2011, on risk activities and conflicts of interest with associated persons falls within the scope of the framework regulation concerning related parties (Article 2391-bis of the Italian Civil Code, Article 53 of the Italian Consolidated Law on Banking (TUB), CONSOB Regulation
No. 17221/10) and has been designed to “control the risk that the closeness of some persons to the Bank’s decision-making centers may compromise the objectivity and impartiality of decisions relating to loan granting and other transactions with the same persons, with possible distortions in the allocation of resources, in the Bank’s exposure to risks not adequately measured or controlled, potential damages to depositors and shareholders”.
The Cariparma Crédit Agricole Group had already adopted a Regulation on transactions with related parties implementing the original CONSOB regulation of 2010; on 11 December 2012, in accordance with the regulation issued by the Bank of Italy, Cariparma approved the Document “Regulation for Risk Assets and Conflicts of Interests with Parties associated to the Cariparma Crédit Agricole Group”, in order to give the Group a specific internal regulation that amounts to the new body of law on these issues and in order to harmonize the various regulations in force.
In addition to identifying the related parties of the Cariparma Crédit Agricole Group, this document provides for the introduction of prudential limits for risk assets towards associated parties, sets the procedures to process and approve transactions with related parties, defines specific rules with regard to transactions with related parties made by the Group companies and sets procedures and timeframe for the provision of the disclosure and appropriate documentation relating to the transactions to be resolved to (i) independent directors, as well as, where necessary, (ii) to the control bodies.
With regard to controls, the required control activities are carried out by different corporate roles, in different capacities and in the different phases of the process, in order to ensure constant compliance with the prudential limits and resolution-making procedures as provided for by the legislation, also pursuing the objective to appropriately prevent and manage potential conflicts of interests associated to transactions with associated parties.
NOTES TO THE CONSOLIDATED FINANCIAL STATEMENTS

Consolidated half-year financial Report as at 30th June 2014 55
Related parties of the Cariparma Crédit Agricole Group are the following:a) corporate officers, namely the members of the Board of Directors, of the Board of Auditors and of the SeniorManagement of the Group companies;b) the shareholder, that is to say, the natural or legal person controlling or exercising significant influence on the company;c) the person, other than a shareholder, who can appoint, on his/her/its own, one or more members of the body engaged in strategic steering functions, also based on any agreement whatsoever or clauses of the Articles of Association dealing with or providing for the exercise of the above rights and powers;d) a company or an enterprise, also set up in a legal form other than that of a company, on which a Group company can exercise control or a significant influence;e) the key staff, who, within Cariparma as at today’s date, consists of the following:• theCFO• theExecutiveattheheadoftheLendingGovernanceDepartment• theExecutiveattheheadoftheOrganizationandSystemsDepartment• theExecutiveattheheadoftheComplianceDepartment• theExecutiveattheheadoftheAuditDepartment• theExecutiveattheheadoftheRisksandPermanentControlsDepartment
Connected Persons
Persons connected to a related party are defined as follows:• companiesorenterprises,alsosetupinalegalformotherthanthatofacompany,whicharecontrolledbyarelatedparty;• personscontrollingarelatedpartyamongthoselistedatpointsbandcoftherelevantdefinition,thatistosay,entitiesthataresubject, directly or indirectly, to common control with the same related party;• closefamilymembersofarelatedpartyorthecompaniesorenterprisescontrolledbythesame.
Associated Persons
Associated persons of the Cariparma Crédit Agricole Banking Group are defined as the set consisting of a related party and of all the persons connected to the same. For application at individual level, the single Banks belonging to the Group refer to the same perimeter of associated persons as determined by the Parent Company Cariparma.
Disclosure on transactions with relates parties
Transactions with related parties consist in the transfer of resources, services or bonds between a Group company (or companies directly and/or indirectly controlled by it) and one or more related parties, independently of the whether payment was agreed or not.
Transactions carried out with related parties have followed the specific procedures provided for by the above Regulation. In the first half of 2014, no atypical or unusual transactions whose size or features might jeopardize the safety of corporate equity and the protection of minority shareholders
Transactions with related parties
Financial assets held for trading
Financial assets
available for sale
Loans to customers
Loans to banks
Due to customers
Due to banks
Guarantees issued
Holding company 2,642,811 -3,048,883 7,831
Entity exercising significant influence on company 1,165
Subsidiaries -82 17,620 2,097
Directors and key management personnel - - 2,359 - 6,655 - -
Other related parties 17,795 48,908 3,088,403 49,480 739,675 1,834,304 44,503
Total 17,877 48,908 3,090,763 2,692,291 765,114 4,883,187 54,432
NOTES TO THE CONSOLIDATED FINANCIAL STATEMENTS

56 Consolidated half-year financial Report as at 30th June 2014
CERTIFICATION OF THE INTERIM CONDENSED CONSOLIDATED FINANCIAL STATEMENTS PURSUANT TO ARTICLE 154-BIS OF LEGISLATIVE DECREE NO. 58/1998
Certification of the Interim Condensed Consolidated Financial Statements pursuant to Article 154-bis of Legislative Decree No. 58/1998

Consolidated half-year financial Report as at 30th June 2014 57
INDEPENDENT AUDITORS’ REPORT
Independent Auditors’ Report

58 Consolidated half-year financial Report as at 30th June 2014

Consolidated half-year financial Report as at 30th June 2014 59
Annexes

60 Consolidated half-year financial Report as at 30th June 2014
ANNEXES
Financial Statements of the Parent Company
» BALANCE SHEET
Assets 30.06.2014 31.12.201310. Cash and cash equivalents 163,269,439 231,187,658
20. Financial assets held for trading 200,159,202 196,670,669
30. Financial assets measured at fair value 17,056,635 -
40. Available-for-sale financial assets 4,305,267,343 3,995,029,001
50. Financial assets held to maturity - -
60. Loans to banks 3,752,062,005 3,875,190,152
70. Loans to Customers 27,459,112,881 27,965,449,390
80. Hedging derivatives 680,001,779 571,225,188
90. Value adjustment of financial assets subject to macro hedging (+/-) 5,182,248 -277,271
100. Equity investments 1,280,285,335 1,262,969,280
110. Property, plant and equipment 283,357,841 286,275,688
120. Intangible assets 1,166,582,879 1,176,262,706
of which: goodwill 922,339,723 922,339,723
130. Tax assets 880,882,321 996,547,914
(a) current 203,309,931 292,870,875
(b) deferred 677,572,390 703,677,039
b1) pursuant to Italian Law No. 214/2011 609,872,051 617,209,360
140. Non-current assets or groups of assets being divested - -
150. Other assets 370,833,301 426,270,967
Total assets 40,564,053,209 40,982,801,342

Consolidated half-year financial Report as at 30th June 2014 61
ANNEXES
Liabilities and Equity 30.06.2014 31.12.201310. Due to Banks 6,206,446,132 6,042,948,004
20. Due to Customers 17,620,554,865 17,800,758,905
30. Securities issued 9,692,384,920 10,608,250,178
40. Financial liabilities held for trading 203,845,864 198,776,635
50. Financial Liabilities measured at fair value - -
60. Hedging derivatives 388,714,684 255,284,820
70. Value adjustment of financial liabilities subject to macro-hedging (+/-) 406,670,939 275,497,360
80. Tax liabilities 169,228,262 294,119,458
(a) current 105,726,524 250,651,429
b) deferred 63,501,738 43,468,029
90. Liabilities in respect of assets being divested - -
100. Other liabilities 1,035,350,173 733,850,233
110. Employee severance benefits 118,647,227 118,015,462
120. Provisions for liabilities and contingencies 146,383,076 168,305,006
(a) retirement and similar liabilities 19,312,858 19,962,747
b) other provisions 127,070,218 148,342,259
130. Valuation reserves 42,630,046 -31,492,549
140. Redeemable shares - -
150. Equity instruments - -
160. Reserves 838,746,228 779,486,724
170. Share premium reserve 2,736,003,683 2,736,003,683
180. Share Capital 876,761,620 876,761,620
190. Treasury shares (+/-) - -
200. Net profit (loss) for the period (+/-) 81,685,490 126,235,803
Total liabilities and shareholders’ equity 40,564,053,209 40,982,801,342
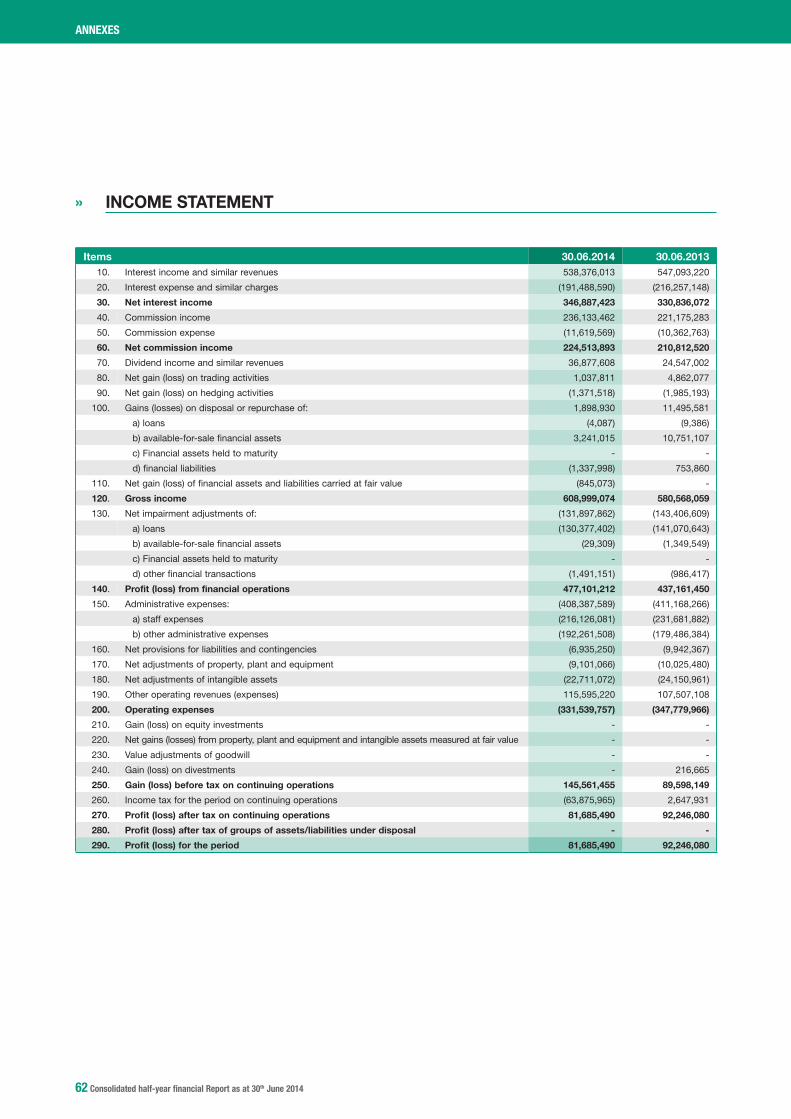
62 Consolidated half-year financial Report as at 30th June 2014
» INCOME STATEMENT
Items 30.06.2014 30.06.201310. Interest income and similar revenues 538,376,013 547,093,220
20. Interest expense and similar charges (191,488,590) (216,257,148)
30. Net interest income 346,887,423 330,836,072
40. Commission income 236,133,462 221,175,283
50. Commission expense (11,619,569) (10,362,763)
60. Net commission income 224,513,893 210,812,520
70. Dividend income and similar revenues 36,877,608 24,547,002
80. Net gain (loss) on trading activities 1,037,811 4,862,077
90. Net gain (loss) on hedging activities (1,371,518) (1,985,193)
100. Gains (losses) on disposal or repurchase of: 1,898,930 11,495,581
a) loans (4,087) (9,386)
b) available-for-sale financial assets 3,241,015 10,751,107
c) Financial assets held to maturity - -
d) financial liabilities (1,337,998) 753,860
110. Net gain (loss) of financial assets and liabilities carried at fair value (845,073) -
120. Gross income 608,999,074 580,568,059
130. Net impairment adjustments of: (131,897,862) (143,406,609)
a) loans (130,377,402) (141,070,643)
b) available-for-sale financial assets (29,309) (1,349,549)
c) Financial assets held to maturity - -
d) other financial transactions (1,491,151) (986,417)
140. Profit (loss) from financial operations 477,101,212 437,161,450
150. Administrative expenses: (408,387,589) (411,168,266)
a) staff expenses (216,126,081) (231,681,882)
b) other administrative expenses (192,261,508) (179,486,384)
160. Net provisions for liabilities and contingencies (6,935,250) (9,942,367)
170. Net adjustments of property, plant and equipment (9,101,066) (10,025,480)
180. Net adjustments of intangible assets (22,711,072) (24,150,961)
190. Other operating revenues (expenses) 115,595,220 107,507,108
200. Operating expenses (331,539,757) (347,779,966)
210. Gain (loss) on equity investments - -
220. Net gains (losses) from property, plant and equipment and intangible assets measured at fair value - -
230. Value adjustments of goodwill - -
240. Gain (loss) on divestments - 216,665
250. Gain (loss) before tax on continuing operations 145,561,455 89,598,149
260. Income tax for the period on continuing operations (63,875,965) 2,647,931
270. Profit (loss) after tax on continuing operations 81,685,490 92,246,080
280. Profit (loss) after tax of groups of assets/liabilities under disposal - -
290. Profit (loss) for the period 81,685,490 92,246,080
ANNEXES

Consolidated half-year financial Report as at 30th June 2014 63
» STATEMENT OF COMPREHENSIVE INCOME
Items 30.06.2014 30.06.201310. Gain (loss) for the period 81,685,490 92,246,080
Other income components after tax with no reversals to Income Statement
20. Property, plant and equipment - -
30. Intangible Assets - -
40. Actuarial gains (losses) on defined-benefit plans (4,967,633) 124,354
50. Non-current assets being divested - -
60. Share of Valuation Reserves on equity investments measured using the equity method - -
Other income components after tax with reversals to Income Statement
70. Hedging of foreign investments - -
80. Exchange rate differences - -
90. Cash flow hedges - -
100. Available-for-sale financial assets 79,090,228 30,996,883
110. Non-current assets being divested - -
120. Share of Valuation Reserves on equity investments measured using the equity method - -
130. Total other income components after tax 74,122,595 31,121,237
140. Comprehensive income (Item 10+130) 155,808,085 123,367,317
ANNEXES
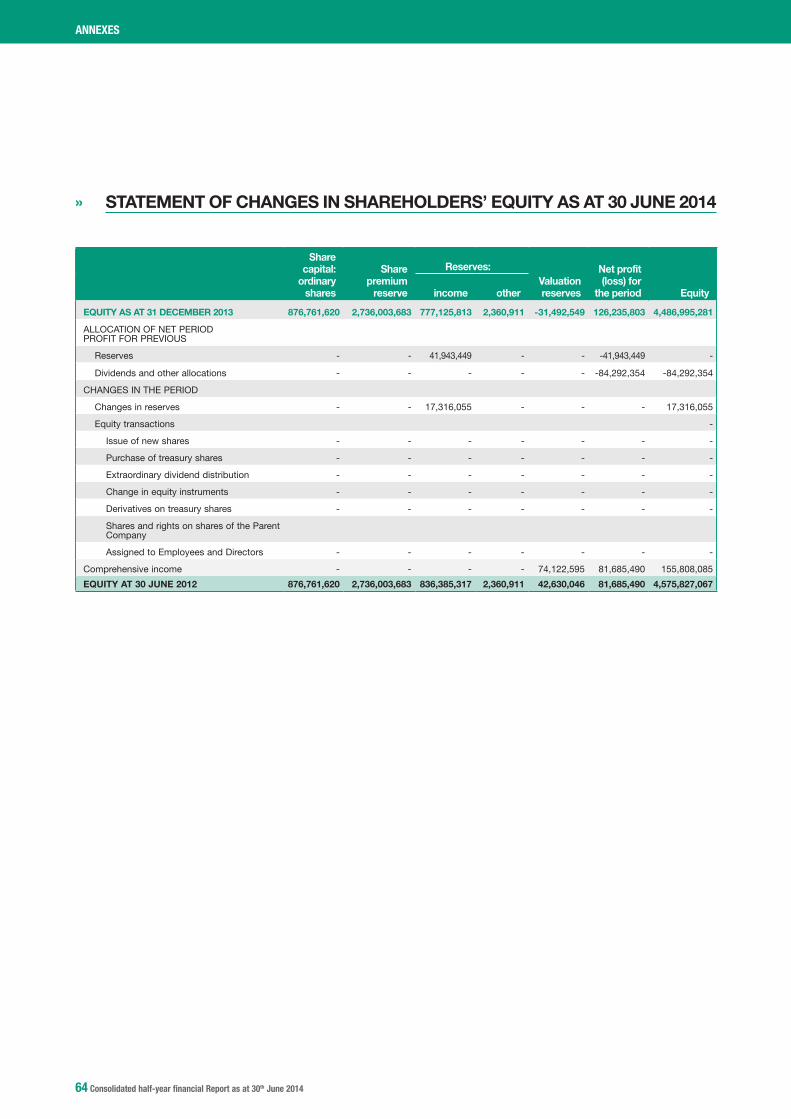
64 Consolidated half-year financial Report as at 30th June 2014
» STATEMENT OF CHANGES IN SHAREHOLDERS’ EQUITY AS AT 30 JUNE 2014
Share capital:
ordinary shares
Share premium
reserve
Reserves:Valuation reserves
Net profit (loss) for
the period Equity income other
EQUITY AS AT 31 DECEMBER 2013 876,761,620 2,736,003,683 777,125,813 2,360,911 -31,492,549 126,235,803 4,486,995,281
ALLOCATION OF NET PERIOD PROFIT FOR PREVIOUS
Reserves - - 41,943,449 - - -41,943,449 -
Dividends and other allocations - - - - - -84,292,354 -84,292,354
CHANGES IN THE PERIOD
Changes in reserves - - 17,316,055 - - - 17,316,055
Equity transactions -
Issue of new shares - - - - - - -
Purchase of treasury shares - - - - - - -
Extraordinary dividend distribution - - - - - - -
Change in equity instruments - - - - - - -
Derivatives on treasury shares - - - - - - -
Shares and rights on shares of the Parent Company
Assigned to Employees and Directors - - - - - - -
Comprehensive income - - - - 74,122,595 81,685,490 155,808,085
EQUITY AT 30 JUNE 2012 876,761,620 2,736,003,683 836,385,317 2,360,911 42,630,046 81,685,490 4,575,827,067
ANNEXES

Consolidated half-year financial Report as at 30th June 2014 65
» STATEMENT OF CHANGES IN SHAREHOLDERS’ EQUITY AS AT 30 JUNE 2013
Share capital:
ordinary shares
Share premium
reserve
Reserves:Valuation reserves
Net profit (loss) for
the period Equity income other
EQUITY AS AT 31 DECEMBER 2012 (*) 876,761,620 2,736,003,683 773,246,541 1,852,434 -140,075,454 58,861,731 4,306,650,555
ALLOCATION OF NET PERIOD PROFIT FOR PREVIOUS
Reserves - - 3,879,272 - - -3,879,272 -
Dividends and other allocations - - - - - -54,982,459 -54,982,459
CHANGES IN THE PERIOD
Changes in reserves - - - - - - -
Equity transactions -
Issue of new shares - - - - - - -
Purchase of treasury shares - - - - - - -
Extraordinary dividend distribution - - - - - - -
Change in equity instruments - - - - - - -
Derivatives on treasury shares - - - - - - -
Shares and rights on shares of the Parent Company
Assigned to Employees and Directors - - - 312,974 - - 312,974
Comprehensive income - - - - 31,121,237 92,246,080 123,367,317
EQUITY AT 30 JUNE 2013 876,761,620 2,736,003,683 777,125,813 2,165,408 -108,954,217 92,246,080 4,375,348,387
(*) Restated following the final recognition of the intra-group business combination made in 2013.
ANNEXES

66 Consolidated half-year financial Report as at 30th June 2014
» STATEMENT OF CASH FLOWS
Items 30.06.2014 30.06.2013A. OPERATING ASSETS
1. Operations 362,980,741 324,994,739
- net profit (loss) for the period (+/-) 81,685,490 92,246,080
- gains (losses) on financial assets held for trading and financial assets/liabilities carried at fair value (-/+) -713,921 -6,309,857
- gains/losses on hedging activities (+/-) 7,646,734 3,239,762
- net impairment adjustments (+/-) 129,172,580 141,994,046
- net adjustments of property, plant and equipment and intangible assets (+/-) 31,812,138 34,176,441
- net provisions for liabilities and contingencies and other costs/revenues (+/-) 6,935,250 9,942,367
- unpaid taxes and duties (+) 63,875,965 -2,647,931
- other adjustments (+/-) 42,566,505 52,353,831
2. Liquidity generated/absorbed by financial assets -219,858,319 -118,059,619
- financial assets held for trading -2,774,612 26,624,245
- financial assets carried at fair value -17,056,635 -
- financial assets available for sale -115,169,955 -640,985,376
- loans to banks: on demand 112,119,966 51,990,258
- loans to banks: other loans 11,008,181 435,911,537
- loans to customers -168,722,849 62,866,932
- other assets -39,262,415 -54,467,215
3. Liquidity generated/absorbed by financial liabilities -140,933,732 -197,284,954
- due to banks: on demand -2,695,073,814 -492,691,039
- due to banks: other payables 2,878,710,311 63,043,429
- due to customers 262,188,575 441,716,243
- securities issued -878,216,884 -233,126,807
- financial liabilities held for trading 5,069,229 -20,885,062
- financial liabilities carried at fair value - -
- other liabilities 286,388,851 44,658,282
Net liquidity generated/absorbed by operating activities 2,188,690 9,650,166
B. INVESTMENT ACTIVITIES
1. Liquidity generated by 33,634,282 24,883,142
- sale of equity investments - -
- dividends from equity investments 36,877,608 24,547,002
- sale of financial assets held to maturity - -
- sales of property, plant and equipment - 336,140
- sales of intangible assets - -
- disposal of unit business -3,243,326 -
2. Liquidity absorbed by: -19,448,837 -19,284,713
- purchases of equity investments - -6,000
- purchases of financial assets held to maturity - -
- purchases of property, plant and equipment -6,417,592 -3,615,665
- purchases of intangible assets -13,031,245 -15,663,048
- purchases of business units - -
Net liquidity generated/absorbed by investing activities 14,185,445 5,598,429
C. FUNDING
- issues/purchases of treasury shares - - - issues/purchases of capital instruments - - - dividend distribution and other -84,292,354 -54,982,459
Net liquidity generated/absorbed by funding -84,292,354 -54,982,459
NET LIQUIDITY GENERATED/ABSORBED DURING THE PERIOD -67,918,219 -39,733,864
RECONCILIATIONFinancial Statement items 30.06.2014 30.06.2013Cash and cash equivalents at beginning of period 231,187,658 194,827,573
Total net liquidity generated/absorbed during the period -67,918,219 -39,733,864
Cash and cash equivalents: effect of exchange rates changes - -
Cash and cash equivalents at end of period 163,269,439 155,093,709
KEY: (+) from (–) used
ANNEXES

Consolidated half-year financial Report as at 30th June 2014 67
» RECONCILIATION STATEMENT OF EQUITY AND NET INCOME FOR THE PERIOD OF THE PARENT COMPANY AND CONSOLIDATED EQUITY AND NET INCOME FOR THE PERIOD
30.06.2014Equity of which: Net profit
Balance of the accounts of the Parent Company 4,575,827 81,685
Effect of consolidation of subsidiaries 93,393 17,666
Effect of the measurement of significant equity investments with the equity method -81 -81
Dividends collected in the period - -28,956
Other changes - -
Balances of consolidated accounts 4,669,139 70,314
ANNEXES

Cassa di Risparmio di Parma e Piacenza S.p.A.Sede Legale: Via Università, 1 - 43121 Parma
Telefono 0521.912111Capitale Sociale € 876.761.620,00 i.v.
Iscritta al Registro Imprese di Parma, Codice Fiscale e Partita IVA n. 02113530345Aderente al Fondo Interbancario di Tutela dei Depositi e al Fondo Nazionale di Garanzia
Iscritta all’Albo delle Banche al n. 5435Capogruppo del Gruppo bancario Cariparma Crédit Agricole iscritto all’Albo dei Gruppi bancari
Soggetta all’attività di direzione e coordinamento di Crédit Agricole S.A.


![Greater Hre 2011 Consolidated Itf 263 1st Half 2[1]](https://static.documents.pub/doc/80x56/553cf048550346bd418b4c86/greater-hre-2011-consolidated-itf-263-1st-half-21.jpg)


