Shiseido Company, Limited (4911) Consolidated Settlement of Accounts for the First Quarter of the Fiscal Year Ending March 31, 2015 The figures for these Financial Statements are prepared in accordance with the accounting principles based on Japanese law. Accordingly, they do not necessarily match the figures in the Annual Report issued by the Company, which present the same statements in a form that is more familiar to foreign readers through certain reclassifications or summarization of accounts. Consolidated Settlement of Accounts for the First Quarter of the Fiscal Year Ending March 31, 2015 [Japanese Standards] Shiseido Company, Limited Listings: Tokyo Stock Exchange, First Section (Code Number: 4911) URL: http://www.shiseidogroup.com/ Representative: Masahiko Uotani, Representative Director, President & CEO Contact: Tetsuaki Shiraiwa, General Manager, Investor Relations Department Tel. +81-3-3572-5111 Filing of quarterly financial report: August 7, 2014 Start of cash dividend payments: — Supplementary quarterly materials prepared:Yes (Supplementary information will be uploaded to the corporate website on Thursday, July 31, 2014) Quarterly results information meeting held: Yes (for institutional investors, analysts, etc.) 1. Performance for the First Quarter of the Fiscal Year Ending March 31, 2015 (From April 1–June 30, 2014) * Amounts under one million yen have been rounded down. (1) Consolidated Operating Results (Millions of yen; percentage figures denote year-on-year change) Net Sales Operating Income Ordinary Income Net Income First Quarter Ended June 30, 2014 168,377 [+3.7%] 1,362 [–80.2%] 1,441 [–80.9%] (1,780) [—] First Quarter Ended June 30, 2013 162,363 [+8.6%] 6,875 [—] 7,560 [—] 2,658 [—] Note: Comprehensive income First quarter ended June 30, 2014: ¥–9,487 million [—%] First quarter ended June 30, 2013: ¥24,311 million [+52.3%] Net Income per Share (Yen) Fully Diluted Net Income per Share (Yen) First Quarter Ended June 30, 2014 (4.47) — First Quarter Ended June 30, 2013 6.68 6.67
Transcript
Shiseido Company, Limited (4911) Consolidated Settlement of Accounts for the First Quarter of the Fiscal Year Ending March 31, 2015
The figures for these Financial Statements are prepared in accordance with the accounting principles based on Japanese law. Accordingly, they do not necessarily match the figures in the Annual Report issued by the Company, which present the same statements in a form that is more familiar to foreign readers through certain reclassifications or summarization of accounts.
Consolidated Settlement of Accounts for the First Quarter of the Fiscal Year Ending March 31, 2015
[Japanese Standards] Shiseido Company, Limited
Listings: Tokyo Stock Exchange, First Section (Code Number: 4911) URL: http://www.shiseidogroup.com/ Representative: Masahiko Uotani, Representative Director, President & CEO Contact: Tetsuaki Shiraiwa, General Manager, Investor Relations Department Tel. +81-3-3572-5111 Filing of quarterly financial report: August 7, 2014 Start of cash dividend payments: — Supplementary quarterly materials prepared: Yes (Supplementary information will be uploaded to the corporate website on Thursday, July 31, 2014) Quarterly results information meeting held: Yes (for institutional investors, analysts, etc.)
1. Performance for the First Quarter of the Fiscal Year Ending March 31, 2015 (From April 1–June 30, 2014) * Amounts under one million yen have been rounded down. (1) Consolidated Operating Results
(Millions of yen; percentage figures denote year-on-year change) Net Sales Operating Income Ordinary Income Net Income
First Quarter Ended June 30, 2014 168,377 [+3.7%] 1,362 [–80.2%] 1,441 [–80.9%] (1,780) [—]
First Quarter Ended June 30, 2013 162,363 [+8.6%] 6,875 [—] 7,560 [—] 2,658 [—]
Note: Comprehensive income First quarter ended June 30, 2014: ¥–9,487 million [—%] First quarter ended June 30, 2013: ¥24,311 million [+52.3%]
Net Income per Share
(Yen)
Fully Diluted Net Income per Share
(Yen)
First Quarter Ended June 30, 2014 (4.47) —
First Quarter Ended June 30, 2013 6.68 6.67
(2) Consolidated Financial Position (Millions of yen)
Total Assets
Net Assets
Equity Ratio
(%)
First Quarter Ended June 30, 2014 739,780 334,473 42.5
Fiscal Year Ended March 31, 2014 801,346 358,707 42.2
[Reference] Equity: First quarter ended June 30, 2014: ¥314,701 million Fiscal year ended March 31, 2014: ¥338,561 million
2. Cash Dividends
Cash Dividends per Share (Yen)
First Quarter Second Quarter Third Quarter Year-End Full Year
Fiscal Year Ended March 31, 2014 — 10.00 — 10.00 20.00
Fiscal Year Ending March 31, 2015 —
Fiscal Year Ending March 31, 2015 (plan) 10.00 — 10.00 20.00
Note: Revision to dividend forecast during period: None
3. Consolidated Earnings Forecasts for the Fiscal Year Ending March 31, 2015 (From April 1, 2014–March 31, 2015)
(Millions of yen, percentage figures denote year-on-year change)
Note: Revision to consolidated earnings forecast during period: Yes
*Notes (1) Significant changes in subsidiaries during period (changes in specific subsidiaries due to change in
scope of consolidation): None (2) Special accounting treatment adopted: None (3) Changes in accounting policies; changes in accounting estimates; restatements 1) Changes in accounting policies due to amendment of accounting standards: Yes 2) Other changes in accounting policies: Yes 3) Changes in accounting estimates: Yes 4) Restatements: None
Note: For more information, please refer to “2. (3) Changes in Accounting Policies; Changes in Accounting Estimates; Restatements” on page 7.
2
(4) Shares outstanding (common stock) at term-end 1. Number of shares outstanding (including treasury stock) First quarter ended June 30, 2014: 400,000,000 Fiscal year ended March 31, 2014: 400,000,000 2. Number of treasury stocks outstanding First quarter ended June 30, 2014: 1,331,506 Fiscal year ended March 31, 2014: 1,422,159 3. Average number of shares over period First quarter ended June 30, 2014: 398,643,947
First quarter ended June 30, 2013: 398,098,079
Implementation status of quarterly audit review procedures At the time of disclosure of this report, review audit procedures for quarterly financial statements pursuant to the Financial Instruments and Exchange Act had not been completed. Appropriate use of business forecasts; other special items In this document, statements other than historical facts are forward-looking statements that reflect the Company’s plans and expectations. These forward-looking statements involve risks, uncertainties and other factors that may cause our actual results and achievements to differ from those anticipated in these statements. Please refer to “1. (2) Consolidated Forecasts and Other Forward-Looking Information” on page 6 for information on preconditions underlying the above outlook and other related information.
3
Contents
1. Analysis of Operating Results ························································································ 5 (1) Consolidated Performance ····················································································· 5 (2) Consolidated Forecasts and Other Forward-Looking Information ······································· 6 2. Summary (Note) Information ························································································· 7 (1) Significant Changes in Subsidiaries ·········································································· 7 (2) Special Accounting Treatment Adopted ······································································ 7 (3) Changes in Accounting Policies; Changes in Accounting Estimates; Restatements ··················· 7 3. Major Items Related to Ongoing Concern ·········································································· 8 (Reference) Overseas Sales ······························································································ 8 4. Consolidated Quarterly Financial Statements ······································································ 9 (1) Consolidated Quarterly Balance Sheets ······································································ 9 (2) Consolidated Quarterly Statements of Income and Consolidated Quarterly Statements of Comprehensive Income ·········································· 11 (3) Notes Concerning Consolidated Quarterly Financial Statements ······································· 13
(Note on Assumptions for Going Concern) ································································· 13 (Consolidated Quarterly Statements of Income) ··························································· 13 (Note in the Event of Major Changes in Shareholders’ Equity) ·········································· 13 (Segment Information) ························································································· 13 (Major Subsequent Event) ····················································································· 14
4
1. Analysis of Operating Results (1) Consolidated Performance In the first quarter under review (three-month period from April 1 to June 30, 2014), the economic sentiment in Japan was characterized by moderate recovery underpinned by government economic measures. Despite the remaining effects of a recoil following a rush in demand ahead of the consumption tax hike, personal consumption showed signs of a turnaround. The domestic cosmetics markets was impacted by similar factors, with the growth rate falling below previous-year levels, although the situation appears to be recovering with each passing month. Overseas cosmetics markets are closely linked with economic conditions in their respective countries. In Europe, there was negative growth, while the Americas and Asia continued enjoying moderate growth. (For overseas subsidiaries, the “first quarter” refers to the period from January 1 to March 31, 2014.) In this environment, the Shiseido Group positioned fiscal 2014 as a year of preparing for drastic reforms. In addition to formulating a new long-term vision and a medium-term business plan due to start in the next fiscal period, we are targeting three major priorities: “strengthening marketing execution and brand attractiveness from the customer’s perspective,” “reforming our organization and corporate culture,” and “reinforcing our operational foundation.” As a result, the Group posted consolidated net sales of ¥168.4 billion, up 3.7% from the previous corresponding period. In the Domestic Cosmetics Business segment, we increased shipments to address shortage of market inventories at the end of the previous fiscal year. Due to the major impact of the recoil in demand associated with the consumption tax hike, however, segment sales declined 3.3% year on year, to ¥73.3 billion. With respect to over-the-counter sales, the trend of negative differential vis-à-vis the previous corresponding month has been improving with each passing month. In the Global Business segment, we posted year-on-year sales growth in its Chinese business, with a solid performance by the AUPRES brand, featuring a renewed complexion-brightening line. In the Americas and Europe, however, the makeup artist brand NARS performed well, but sales of fragrances and the bareMinerals brand declined year on year. Accordingly, the Global Business segment posted a 1.8% decline in sales in local-currency terms. After translation into yen, however, segment sales increased 9.8%, to ¥92.6 billion. Sales in the Others segment rose 10.7%, to ¥2.5 billion, thanks largely to a healthy performance by the Frontier Science Division. Operating income fell 80.2% year on year, to ¥1.4 billion, due mainly to an increase in personnel expenses stemming from higher bonus payments. The Group posted a net loss of ¥1.8 billion for the period. This was because tax expenses increased due to smaller tax benefit related to elimination of unrealized earnings.
5
[Consolidated Performance] (Sales) (Millions of yen)
First Quarter Ended
June 2014
Share ofTotal (%)
First Quarter Ended
June 2013
Share ofTotal (%)
Year-on-Year Increase/Decrease
Amount % change
% change in local
currency terms
Domestic Cosmetics Business
73,307 43.5% 75,834 46.7% –2,527 –3.3% –3.3%
Global Business 92,582 55.0% 84,282 51.9% +8,300 +9.8% –1.8%
Others 2,487 1.5% 2,246 1.4% +240 +10.7% +10.7%
Sales Total 168,377 100.0% 162,363 100.0% +6,013 +3.7% –2.3%
Global Business (3,330) –3.6% (1,135) –1.3% –2,195 —
Others 655 18.0% 527 15.3% +128 +24.3%
Elimination/Corporate 5 ——— 345 .— –339 —
Operating Income Total 1,362 0.8% 6,875 4.2% –5,513 –80.2%
Ordinary Income 1,441 0.9% 7,560 4.7% –6,119 –80.9%
Net Income (Loss) (1,780) –1.1% 2,658 1.6% –4,438 —
*Based on sales, including intra-Group sales between reportable segments.
(2) Consolidated Forecasts and Other Forward-Looking Information In light of its performance in the first quarter under review, as well as foreign exchange trends and other factors, the Group has revised its consolidated forecasts for the first two quarters (cumulative) ending September 30, 2014 (previous forecasts announced on April 25, 2014), as shown in the table below. For the first two quarters (cumulative), the forecasts are based on exchange rates of ¥102 per U.S. dollar, ¥140 per euro, and ¥16.7 per Chinese yuan. The Group has not revised its full-year forecasts for the year ending March 31, 2015.
6
Consolidated Forecasts for First 2 Quarters (Cumulative) of Fiscal 2014 (April 1–September 30, 2014) (Millions of yen)
[Reference] Result in Previous Corresponding Period First 2 Quarters (Cumulative) of Fiscal 2013
360,504 20,391 21,021 5,377 13.51
2. Summary (Note) Information (1) Significant Changes in Subsidiaries Not applicable. (2) Special Accounting Treatment Adopted Not applicable. (3) Changes in Accounting Policies; Changes in Accounting Estimates; Restatements (Change in Accounting Policies) Application of Accounting Standard for Retirement Benefits With respect to “Accounting Standard for Retirement Benefits” (ASBJ Statement No. 26, May 17, 2012) and “Guidance on Accounting Standard for Retirement Benefits” (ASBJ Guidance No. 25, May 17, 2012), the Company has applied provisions stated in Clause 35 of the Retirement Benefits Accounting Standard and Clause 67 of the Guidance on Retirement Benefits, effective the first quarter under review. Accordingly, the Company has reassessed the method for calculating retirement benefit obligations and current service costs, and changed the period reversion method for retirement benefit estimates from a straight-line basis to a benefit calculation basis. Application of discount rate has also been amended. Under the previous method, the discount rate was determined based on the average service period up to the estimated timing of benefit payment. Under the new method, differing discount rates will be used according to the estimated timing of benefit payment. The Accounting Standard for Retirement Benefits is being applied transitionally as determined in its Clause 37. At beginning of the first quarter under review, the effect of the change in accounting standard has been reflected as an increase or decrease in retained earnings. This change caused the liability related to retirement benefits to increase by ¥16,188 million, deferred tax assets to increase by ¥5,882 million, retained earnings to decrease by ¥10,303 million, and minority interests to decrease by ¥2 million. It also caused consolidated net sales, operating income, ordinary income, and net income to each increase by ¥150 million. Change in depreciation method for property, plant and equipment To date, Shiseido Co., Ltd. and its domestic consolidated subsidiaries have mainly adopted the declining balance method for depreciation of buildings (excluding attached equipment) and property, plant and equipment (excluding leased assets). Effective the first quarter under review, however, the straight-line method has been applied.
7
The Shiseido Group expects long-term stability of equipment operation and securement of income stemming from drastic reassessments of its marketing style (including for existing fostered products) and business operational style. We also look forward to sustained growth in overseas markets, global advancement of our business, and stronger responsiveness and other factors. In order to make accounting processes consistent in this context, we conducted an examination of the depreciation method for property, plant and equipment. Accordingly, Shiseido Co., Ltd. and its domestic consolidated subsidiaries have adopted the straight-line method of depreciation used by its overseas consolidated subsidiaries. The Group believes that this method provides a more appropriate reflection of actual business conditions. In the first quarter under review, this change caused depreciation to decline by ¥227 million, and operating income, ordinary income, and income before income taxes to increase by ¥227 million. (Changes in Accounting Estimates) Change in estimation of useful lives and residual values of property, plant and equipment Following the aforementioned change in depreciation method, the Group assessed the actual status of its operations and, effective the first quarter under review, changed the method of estimating useful lives of certain property, plant and equipment to reflect such actual status. As for calculating residual values, Shiseido Co., Ltd. and its domestic consolidated subsidiaries have adopted the method of depreciating assets until the memorandum price is reached. In the first quarter under review, this change caused depreciation to increase by ¥12 million. It also caused consolidated net sales, operating income, ordinary income, and net income to each decrease by ¥12 million.
3. Major Items Related to Ongoing Concern Not applicable. (Reference) Overseas Sales
(1) Consolidated Quarterly Balance Sheets(Millions of yen)
Assets Current assets Cash and deposits 95,774 57,211 Notes and accounts receivable - trade 138,282 109,592 Securities 33,129 38,214 Inventories 90,244 99,675 Deferred tax assets 26,568 24,980 Other 20,076 17,954 Allowance for doubtful accounts (1,487) (1,530) Total current assets 402,588 346,099 Non-current assets Property, plant and equipment Buildings and structures 166,117 163,929 Accumulated depreciation (103,099) (102,904) Buildings and structures, net 63,018 61,025 Machinery, equipment and vehicles 91,092 89,247 Accumulated depreciation (78,320) (77,174) Machinery, equipment and vehicles, net 12,771 12,072 Tools, furniture and fixtures 74,194 73,189 Accumulated depreciation (52,108) (52,303) Tools, furniture and fixtures, net 22,086 20,885 Land 30,853 30,671 Leased assets 7,359 5,468 Accumulated depreciation (4,492) (2,634) Leased assets, net 2,867 2,834 Construction in progress 3,282 3,730 Total property, plant and equipment 134,879 131,220 Intangible assets Goodwill 63,377 60,709 Leased assets 586 594 Trademark right 55,173 53,868 Other 47,595 44,718 Total intangible assets 166,732 159,890 Investments and other assets Investment securities 26,889 28,956 Long-term prepaid expenses 11,994 11,327 Deferred tax assets 33,118 38,794 Other 25,200 23,546 Allowance for doubtful accounts (56) (56) Total investments and other assets 97,145 102,569 Total non-current assets 398,758 393,680 Total assets 801,346 739,780
Fiscal Year EndedMarch 2014
First Quarter EndedJune 2014
9
(Millions of yen)
Liabilities Current liabilities Notes and accounts payable - trade 50,945 48,459 Electronically recorded obligations - operating ― 8,508 Short-term loans payable 6,727 5,083 Commercial papers ― 1,749 Current portion of bonds 50,000 90,000 Current portion of long-term loans payable 5,926 5,922 Lease obligations 1,400 1,336 Accounts payable - other 48,043 34,788 Income taxes payable 17,503 5,342 Provision for sales returns 11,084 8,990 Provision for bonuses 18,094 6,611 Provision for directors' bonuses 290 174 Provisions for lisk and liabilities 486 356 Provision for structure reform 122 113 Deferred tax liabilities 35 36 Other 39,123 37,810 Total current liabilities 249,783 255,284 Non-current liabilities Bonds payable 40,000 ― Long-term loans payable 49,714 32,200 Lease obligations 2,149 2,176 Liability for retirement benefits 60,825 76,367 Provision for loss on guarantees 350 350 Provision for environmental measures 395 395 Provision for structure reform 1,061 1,061 Deferred tax liabilities 33,413 33,197 Other 4,945 4,274 Total non-current liabilities 192,855 150,023 Total liabilities 442,638 405,307Net assets Shareholders' equity Capital stock 64,506 64,506 Capital surplus 70,258 70,258 Retained earnings 203,452 187,144 Treasury shares (2,682) (2,511) Total shareholders' equity 335,535 319,398 Accumulated other comprehensive income Valuation difference on available-for-sale securities 3,544 3,935 Foreign currency translation adjustment 19,690 10,894 Accumulated adjustments for retirement benefit (20,207) (19,526) Total accumulated other comprehensive income 3,026 (4,697) Subscription rights to shares 941 956 Minority interests 19,204 18,815 Total net assets 358,707 334,473Total liabilities and net assets 801,346 739,780
Fiscal Year EndedMarch 2014
First Quarter EndedJune 2014
10
(Millions of yen)
Net sales 162,363 168,377Cost of sales 37,815 39,432Gross profit 124,548 128,945Selling, general and administrative expenses 117,672 127,582Operating income 6,875 1,362Non-operating income Interest income 197 261 Dividend income 330 284 Share of profit of entities accounted for using equity method ― 15 House rent income 202 252 Subsidy income 1 1 Foreign exchange gains 488 ― Other 233 213 Total non-operating income 1,454 1,028Non-operating expenses Interest expenses 462 363 Share of loss of entities accounted for using equity method 18 ― Foreign exchange losses ― 236 Other 288 348 Total non-operating expenses 769 948Ordinary income 7,560 1,441Extraordinary income Gain on transfer of business ― 332 Gain on sales of non-current assets 6 777 Gain on sales of investment securities 511 0 Total extraordinary income 517 1,111Extraordinary losses Structual reform expenses 326 202 Loss on disposal of non-current assets 180 228 Loss on sales of investment securities 4 17 Loss on valuation of investment securities 8 ― Total extraordinary losses 519 447Income before income taxes and minority interests 7,558 2,105Income taxes - current 2,808 1,724Income taxes - deferred 1,364 1,247Total income taxes 4,173 2,971Income (loss) before minority interests 3,385 (866)Minority interests in income 726 913Net income (loss) 2,658 (1,780)
First Quarter EndedJune 2013
First Quarter EndedJune 2014
(2) Consolidated Quarterly Statements of Income and Consolidated Quarterly Statements of Comprehensive Income
Consolidated Quarterly Statements of Income Cumulative for First Quarter
11
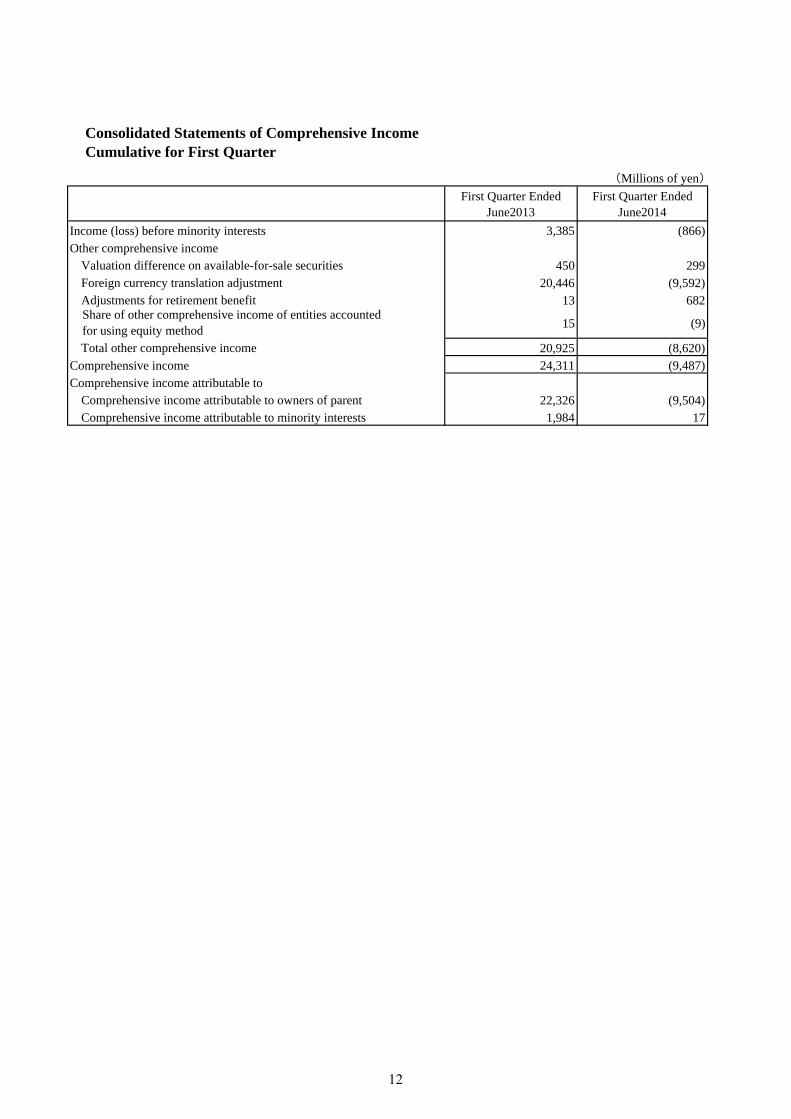
Consolidated Statements of Comprehensive Income Cumulative for First Quarter
(Millions of yen)
Income (loss) before minority interests 3,385 (866)Other comprehensive income Valuation difference on available-for-sale securities 450 299 Foreign currency translation adjustment 20,446 (9,592) Adjustments for retirement benefit 13 682 Share of other comprehensive income of entities accounted for using equity method
15 (9)
Total other comprehensive income 20,925 (8,620)Comprehensive income 24,311 (9,487)Comprehensive income attributable to Comprehensive income attributable to owners of parent 22,326 (9,504) Comprehensive income attributable to minority interests 1,984 17
First Quarter EndedJune2013
First Quarter EndedJune2014
12
(3) Notes Concerning Consolidated Quarterly Financial Statements (Note on Assumptions for Going Concern) Not applicable. (Consolidated Quarterly Statements of Income) Business Transfer Income First Quarter of Fiscal 2014 (April 1–June 30, 2014) This resulted from the transfer of assets of domestic consolidated subsidiaries related to the sale of the CARITA and DECLÉOR brands. Because overseas consolidated subsidiaries have a different fiscal year-end from the Company, transfer income, etc. of such subsidiaries is not included in business transfer income in the Consolidated Quarterly Statements of Income for the first quarter under review. Structural Reform Expenses First Quarter of Fiscal 2014 (April 1–June 30, 2014) “Structural Reform Expenses” refers to expenses related to “strengthening human resource and personnel cost management.” These are part of one-time expenses pertaining to “structural reforms” (drastic reassessments of organization, infrastructure, and business administration aimed at building a robust business structure). They consist mainly of retirement premiums paid to early retirees. (Note in the Event of Major Changes in Shareholders’ Equity) Not applicable. (Segment Information) I First Quarter of Fiscal 2013 (April 1–June 30, 2013) 1. Sales and Income/Loss by Reportable Segment
Segment Income/(Loss) 7,138 (1,135) 527 6,530 345 6,875Notes: 1. “Others” includes businesses not included in the reporting segments. These include the frontier science business
(production and sale of cosmetic raw materials, medical-use drugs, medical cosmetics, precision and analytical equipment, etc.) and the restaurant business.
2. The “Segment Income” adjustment refers to intersegment transaction eliminations amounting to ¥345 million 3. Segment income is adjusted for Operating Income described in the Consolidated Quarterly Statements of Income.
2. Information on impairment loss, goodwill, etc. on fixed assets by reportable segment
(Major impairment loss on fixed assets) Not applicable. (Major change in goodwill) Not applicable.
13
II First Quarter of Fiscal 2014 (April 1–June 30, 2014) 1. Sales and Income/Loss by Reportable Segment
Segment Income (Loss) 4,031 (3,330) 655 1,356 5 1,362Notes: 1. “Others” includes businesses not included in the reporting segments. These include the frontier science business
(production and sale of cosmetic raw materials, medical-use drugs, medical cosmetics, precision and analytical equipment, etc.) and the restaurant business.
2. The “Segment Income” adjustment refers to intersegment transaction eliminations amounting to ¥5 million 3. Segment income is adjusted for Operating Income described in the Consolidated Quarterly Statements of Income. 4. As stated in “Changes in Accounting Policies,” the Company has applied Accounting Standard for Retirement Benefits,
effective the first quarter under review (applied transitionally as determined in Clause 37 of said accounting standard). As a result, segment income in the Domestic Cosmetics Business, Global Business, and Others segments increased by ¥117 million, ¥31 million, and ¥2 million, respectively, in the first quarter under review.
5. As stated in “Changes in Accounting Policies,” the Company has changed the depreciation method for property, plant and equipment, effective the first quarter under review. As a result, segment income in the Domestic Cosmetics Business, Global Business, and Others segments increased by ¥201 million, ¥20 million, and ¥5 million, respectively, in the first quarter under review.
6. As stated in “Changes in Accounting Estimates,” the Company has changed the method of estimating useful lives and residual values of property, plant and equipment, effective the first quarter under review. As a result, segment income decreased by ¥7 million in the Domestic Cosmetics Business segment, increased by ¥4 million in the Global Business segment, and decreased by ¥9 million in the Others segment in the first quarter under review.
2. Information on impairment loss, goodwill, etc. on fixed assets by reportable segment
(Major impairment loss on fixed assets) Not applicable. (Major change in goodwill) Not applicable.
(Major Subsequent Event) Transfer of Major Businesses; Sale of Shares in Major Subsidiaries On April 30, 2014, the Company sold shares and related assets of affiliates handling the CARITA and DECLÉOR brands (centering on skincare, body care, and hair care products) to L’Oréal S.A.(in Clichy, France) 1. Reasons for the sale Going forward, the Company will focus on the fields of “hair” and “Asia” in its professional business. Since both of the aforementioned brands are not part of such focal fields, the Company determined that selling the two brands to L’Oréal was the best choice for both the Company and the brands. 2. Name of other part in agreement L’Oréal S.A. 3. Date of transfer April 30, 2014
14
4. Overview of companies subject to transfer and related assets (1) Overview of Carita
(1) Name: Carita International S.A. (2) Main business: Sale of cosmetics (3) Transactions with Company: No direct transactions (4) Net sales: ¥3,151 million (year ended December 31, 2013)
(2) Overview of FIPAL
(1) Name: FIPAL S.A.S. (2) Main business: Holding company of Decléor Group (manufacture and sale of cosmetics) (3) Transactions with Company: No direct transactions (including with Decléor Group) (4) Non-operating income: ¥193 million (year ended December 31, 2013) (5) Net sales of Decléor Group: ¥7,576 million (year ended December 31, 2013)
(3) Overview of related assets
Assets transferred from the Company to L’Oréal include inventories related to the CARITA and DECLÉOR brands, as well as store sales counters and other fixed assets. At present, the combined book value of these assets is ¥262 million. This includes related assets of domestic consolidated subsidiaries recognized as transferred during the first quarter under review.
5. Transfer price, number of shares to be transferred, equity stake after transfer (1) Transfer price
Transfer price of CARITA and DECLÉOR brands: €230 million (combined value of shares in Carita International and FIPAL and related assets)
(2) Number of shares transferred
Carita International: 148,575 FIPAL: 990,700
(3) Equity stake after transfer
The Company will have 0% equity stake in both Carita International and FIPAL (holding 0 shares) 6. Effect of transfers on the Company’s financial position, business results, and cash flows The Company expects to report a gain on the sale of the transfer of ¥22,233 million in the second quarter of the fiscal year ending March 2015.