44
CONSTANTS IN THE INDIAN ECONOMY

CONSTANTS IN THE INDIAN ECONOMY

OVERVIEW OF INDIAN ECONOMY
2007-08 2008-09 2009-10 2010-11 2011-12 2012-13
Fiscal Deficit (Central) [% of GDP] 2.5 6 6.5 4.8 5.7 5.1
Current Account [% of GDP] -0.7 -2.5 -1.9 -3.2 -3.3 -5
Trade Balance [% of GDP] -7.4 -9.8 -8.7 -7.4 -10.2
GDP Growth Rates (%) 3.9 8.5 10.5 6.3 3.2
Remittances + FDI + Service Exports [$
billion]
149
199 178 198 238 238
Inflation [CPI] 6.2 9.1 12.37 10.45 10.04 10.43*
Inflation [WPI] 4.8 8 3.6 9.56 8.94 7.55
* Projection Source: Economic Survey 2012-13; IMF; World Bank Database
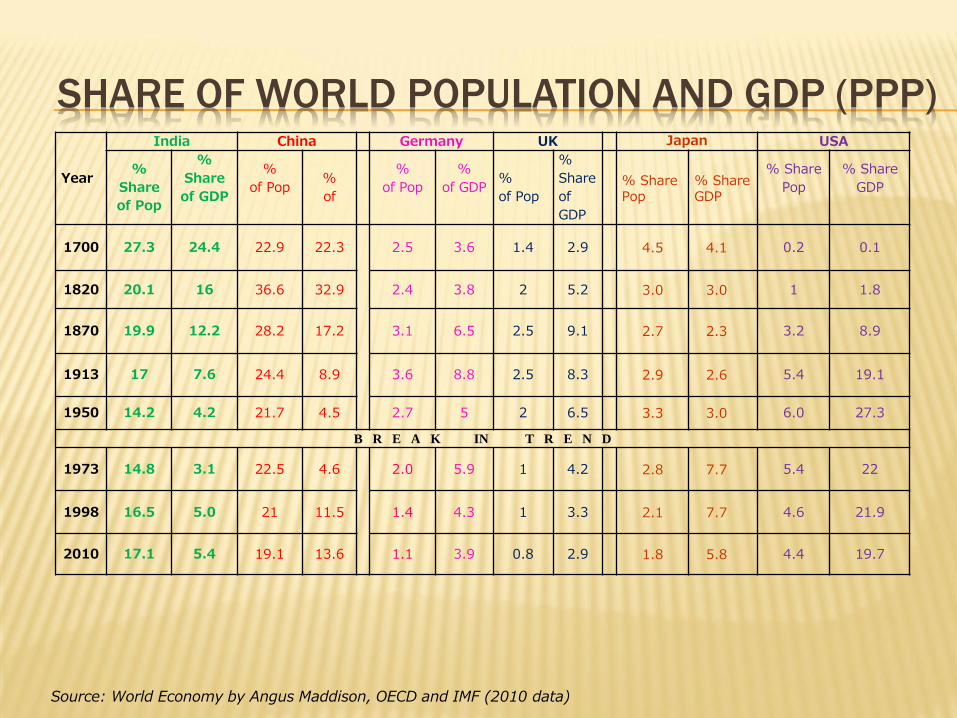
SHARE OF WORLD POPULATION AND GDP (PPP)
Year
India China Germany UK Japan USA
%
Share
of Pop
%
Share
of GDP
%
of Pop
%
of
%
of Pop
%
of GDP
%
of Pop
%
Share
of
GDP
% Share Pop
% Share GDP
% Share
Pop
% Share
GDP
1700 27.3 24.4 22.9 22.3 2.5 3.6 1.4 2.9 4.5 4.1 0.2 0.1
1820 20.1 16 36.6 32.9 2.4 3.8 2 5.2 3.0 3.0 1 1.8
1870 19.9 12.2 28.2 17.2 3.1 6.5 2.5 9.1 2.7 2.3 3.2 8.9
1913 17 7.6 24.4 8.9 3.6 8.8 2.5 8.3 2.9 2.6 5.4 19.1
1950 14.2 4.2 21.7 4.5 2.7 5 2 6.5 3.3 3.0 6.0 27.3
B R E A K IN T R E N D
1973 14.8 3.1 22.5 4.6 2.0 5.9 1 4.2 2.8 7.7 5.4 22
1998 16.5 5.0 21 11.5 1.4 4.3 1 3.3 2.1 7.7 4.6 21.9
2010 17.1 5.4 19.1 13.6 1.1 3.9 0.8 2.9 1.8 5.8 4.4 19.7
Source: World Economy by Angus Maddison, OECD and IMF (2010 data)
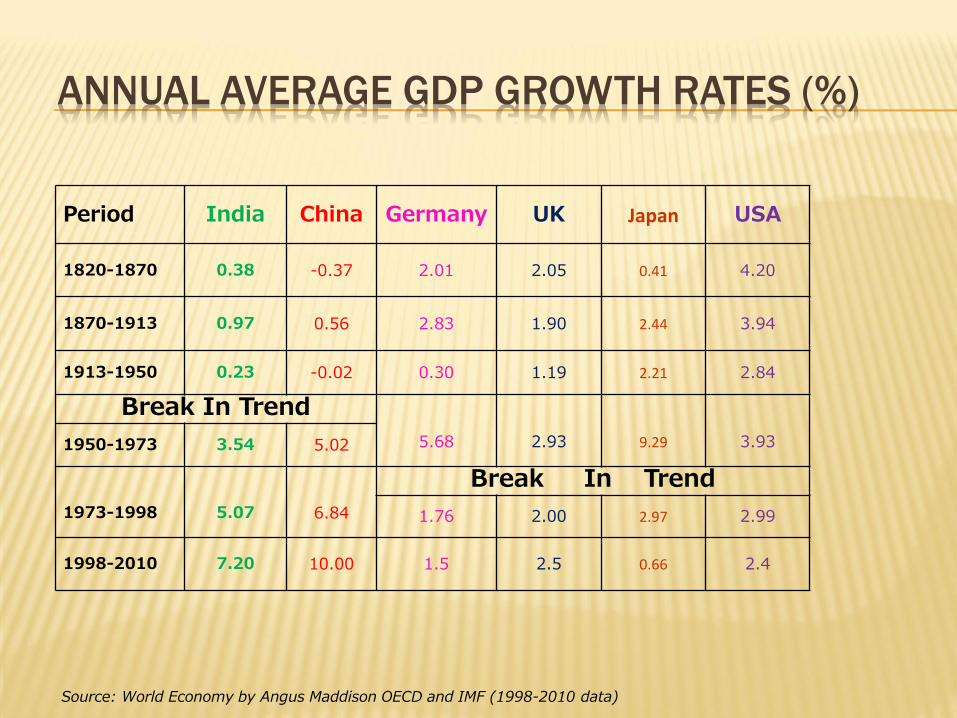
ANNUAL AVERAGE GDP GROWTH RATES (%)
Period India China Germany UK Japan USA
1820-1870 0.38 -0.37 2.01 2.05 0.41 4.20
1870-1913 0.97 0.56 2.83 1.90 2.44 3.94
1913-1950 0.23 -0.02 0.30 1.19 2.21 2.84
Break In Trend
5.68
2.93
9.29
3.93 1950-1973 3.54 5.02
1973-1998
5.07
6.84
Break In Trend
1.76 2.00 2.97 2.99
1998-2010 7.20 10.00 1.5 2.5 0.66 2.4
Source: World Economy by Angus Maddison OECD and IMF (1998-2010 data)

ANNUAL AVERAGE GDP GROWTH RATES (%)
-2
0
2
4
6
8
10
12
1820-70 1870-13 1913-50 1950-73 1973-98 1998-2010
India China Germany Japan UK USA
India
China
UK
Japan
German
Source: World Economy by Angus Maddison, OECD and IMF

INDIA PER CAPITA GDP GROWTH
Year Per capita GDP
Per capita GDP at constant 2004-05
Prices US $
1950-51 142.28
1960-61 177.78
1970-71 200.32
1980-81 214.24
1990-91 286.60
2000-01 407.24
2010-11 719.86
2012-13 1127 (Rs. 68747)
Source: Economic Survey 2012-13, Govt. of India

INDIA PER CAPITA GDP
0
200
400
600
800
1950-51 1960-61 1970-71 1980-81 1990-91 2000-01 2010-11
Per capita GDP at Constant 2004-05 prices
US$
Source: Economic Survey 2012, Govt. of India

INDIA AVERAGE ANNUAL GROWTH RATES
Period Population growth
rate GDP growth rate Trend
1900-1947 0.46 % 0.23 % Getting poorer
1947-2010 2.08 % 4.74 % Growing
Richer
Source: World Economy by Angus Maddison OECD (1900-1947) and Economic Survey 2012, Govt. of
India (1947-2010)
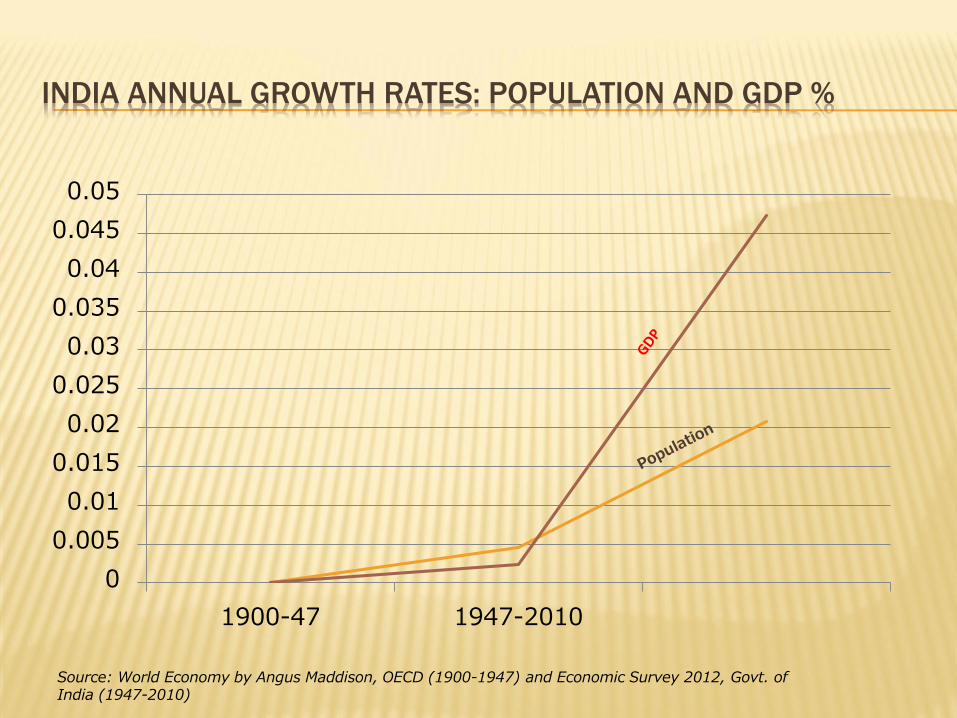
INDIA ANNUAL GROWTH RATES: POPULATION AND GDP %
0
0.005
0.01
0.015
0.02
0.025
0.03
0.035
0.04
0.045
0.05
1900-47 1947-2010
Source: World Economy by Angus Maddison, OECD (1900-1947) and Economic Survey 2012, Govt. of India (1947-2010)

SOCIAL INDICATORS - INDIA
Year Population
(millions)
Life expectancy
(Years)
Literacy rate
(%)
1950-1951 359 32.5 18.3
1970-1971 541 45.6 34.4
1990-1991 839 58.7 52.2
2010-2011 1210 63.5 74.0
Source: Economic Survey 2012, Govt. of India

INDIA SOCIAL INDICATORS
0
10
20
30
40
50
60
70
80
0
200
400
600
800
1000
1200
1400
1950-51 1970-71 1990-91 2010-2011
Lif
e E
xp
ecta
ncy,
Lit
era
cy R
ate
Pop
ula
tion
(m
illion
s)
Source: Economic Survey 2012, Govt. of India
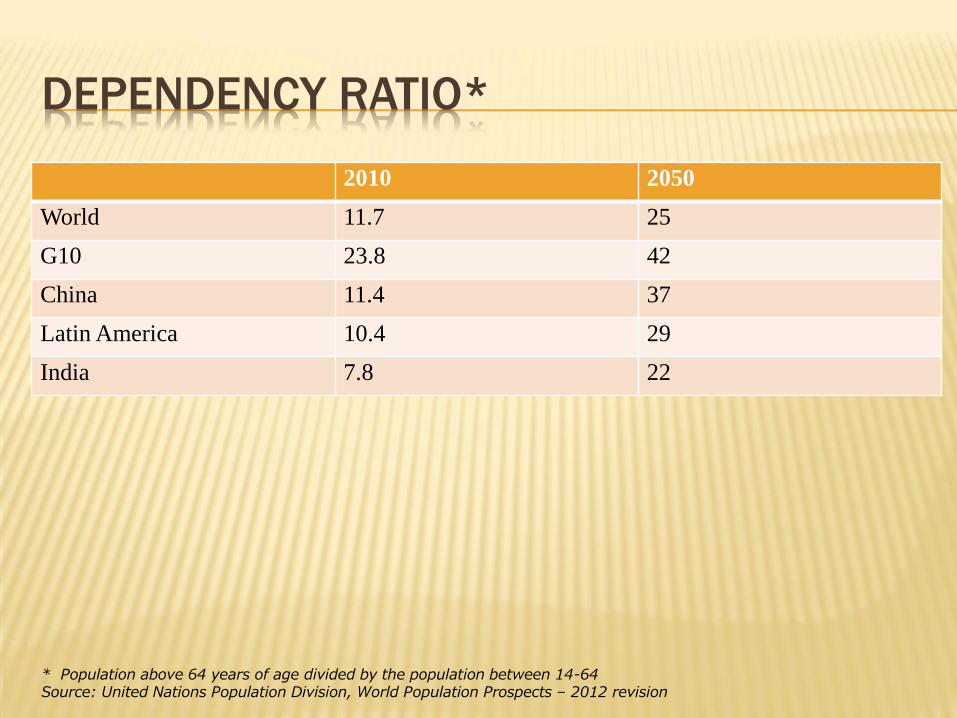
DEPENDENCY RATIO*
2010 2050
World 11.7 25
G10 23.8 42
China 11.4 37
Latin America 10.4 29
India 7.8 22
* Population above 64 years of age divided by the population between 14-64 Source: United Nations Population Division, World Population Prospects – 2012 revision

ECONOMIC INDICATORS
INDIA & EMERGING ECONOMIES
India Brazil China Indonesi
a
Mexico South
Africa
Population 2012 Millions 1,223 198 1,354 244 114 51
GDP nominal $ bn, 2012 1,824 2395 8,227 878 1,177 384
GDP PPP $ bn 2012 4684.4 2355.6 12405.7 1216.7 1759 582.4
Annual average growth rate %,
2000-2012 7.23 3.57 10.06 5.31 2.31 3.48
Budget deficit % of GDP 2012 -5.6 +2.7 -1.6 -1.9 -2.8 -5.4
Current Account Balance % of
GDP -5.1 -2.2 +2.5 -2.7 -0.7 -5.4
Source: IMF and US World Fact Book
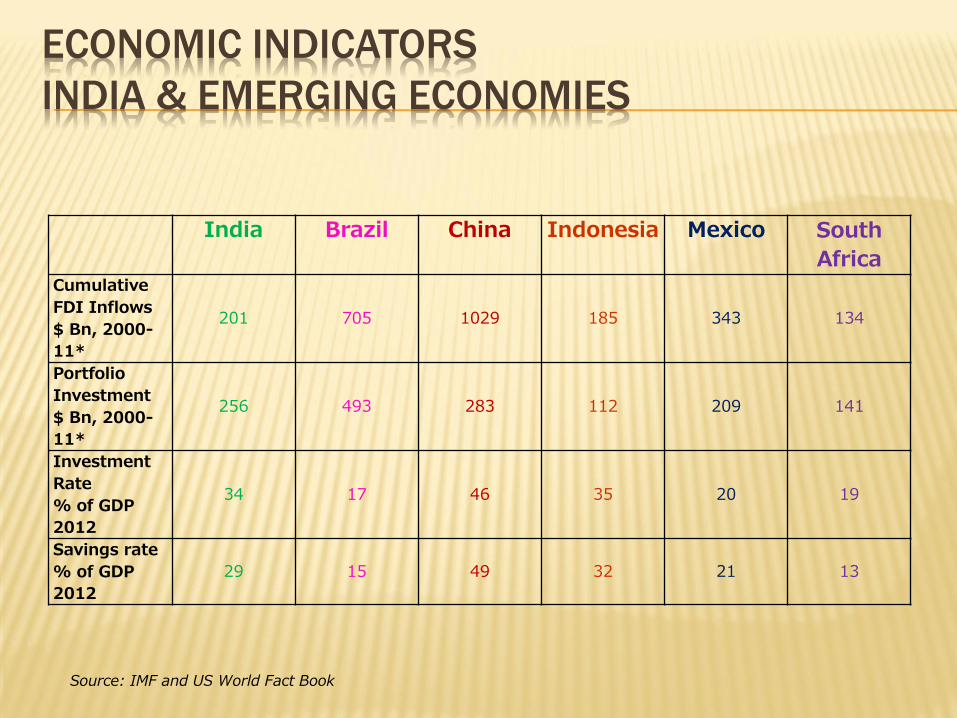
ECONOMIC INDICATORS
INDIA & EMERGING ECONOMIES
India Brazil China Indonesia Mexico South
Africa Cumulative
FDI Inflows
$ Bn, 2000-
11*
201 705 1029 185 343 134
Portfolio
Investment
$ Bn, 2000-
11*
256 493 283 112 209 141
Investment
Rate
% of GDP
2012
34 17 46 35 20 19
Savings rate
% of GDP
2012
29 15 49 32 21 13
Source: IMF and US World Fact Book

ECONOMIC INDICATORS
INDIA & DEVELOPED ECONOMIES
India Australia Germany Japan UK USA
Population 2012
Millions 1,223 22 81 127 63 314
GDP, Nominal
$ bn, 2012
1,824 1,541 3,400 5,963 2,440 15,684
GDP, PPP $bn, 2012 4,684.4 970.8 3,197.1 4,627.9 2,336.3 15,684.8
Annual average
growth rate %
2000-2012
7.23 2.99 1.25 0.86 1.76 1.82
Budget deficit % of
GDP
2012
-5.6 -0.8 +0.1 -9.1 -7.7 -7.6
Current Account
Balance
% of GDP
-5.1 -3.6 7.0 0.9 -3.5 -3.0
Source: IMF and US World Fact Book

ECONOMIC INDICATORS
INDIA & DEVELOPED ECONOMIES
India Australia Germany Japan UK USA
Cumulative FDI Inflows $Bn, 2000-11*
201 515 927 225 1063 2547
Portfolio Investment $Bn, 2000-11*
256 965 2835 1437 3469 8511
Investment Rate % of GDP 2012
34 28 17 35 14 16
Savings rate % of GDP 2012
29 25 24 32 10 10
Source: IMF and US World Fact Book

FOREX RESERVES
Figures in US Dollars Billions INDIA China Brazil South
Africa Year Foreign
Exchange reserves
External debt (End March)
FII net inflows
FDI inflows
Year FDI inflows
FDI inflows
FDI inflows
2007-08
309.72 224.40 27.43 34.72 2008 175.1 45.1 9.0
2008-09
251.98 224.49 -14.03 41.70 2009 114.2 25.9 5.7
2009-10
279.05 260.93 32.39 33.10 2010 185.0 48.5 1.2
2010-11
304.81 305.93 30.29 27.82 2011 228.6 66.7 6.0
2011-12
294.39 345.81 17.17 32.95 2012 253.4 65.3 4.6
2012-13
292.046 390.048 26.891
26.953 2013
Source: RBI & OECD
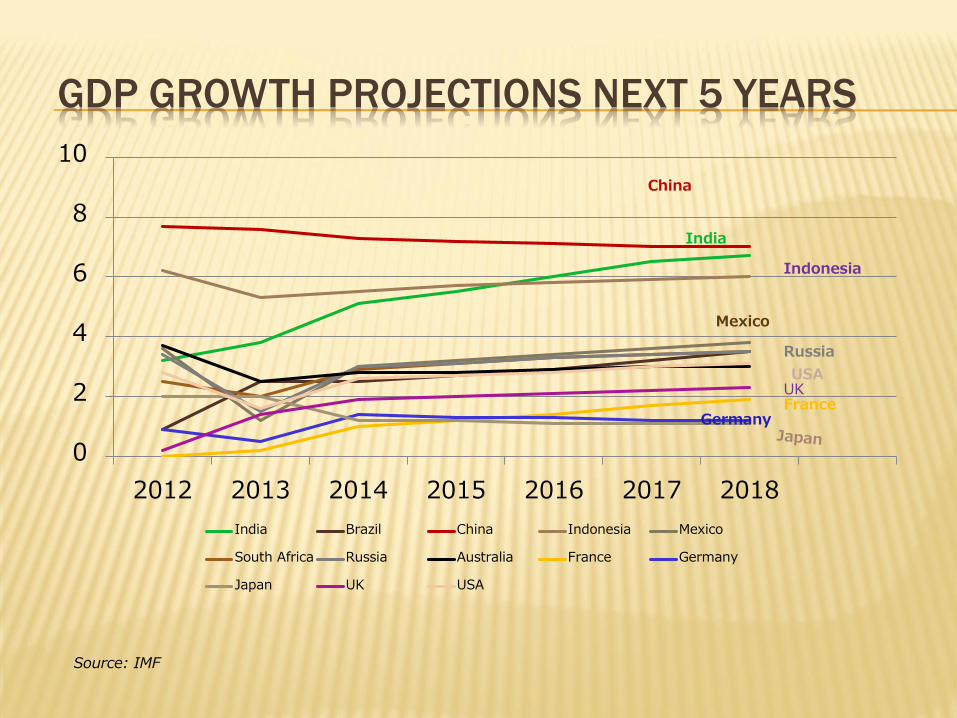
GDP GROWTH PROJECTIONS NEXT 5 YEARS
0
2
4
6
8
10
2012 2013 2014 2015 2016 2017 2018
India Brazil China Indonesia Mexico
South Africa Russia Australia France Germany
Japan UK USA
India
China
Indonesia
Mexico
Russia
USA UK France
Germany
Source: IMF

TRADE IN GOODS & SERVICES
India China France Japan UK USA
GDP PPP $ Bn,
2012 4715.6 12,261.2 2,238.1 4575.5 2,312.7 16,244.5
Exports of
Goods $ Bn
2012
309 2,500 567 798 481 1,612
Exports of
Services $ Bn
2012
293 1900 208 142 278 613
Imports of
Goods $ Bn
2012
500 1,817 659 885 646 2,357
Imports of
Services $ Bn
2012
127 281 170 174 175 405
Total Trade
Goods &
Services $ Bn
2012
1591 6498 1604 2000 1580 4987
Source: IMF, WTO

DEFENCE AND TECHNOLOGY BUDGETS
India China Franc
e Japan UK USA
Defence Budget 2011
$ Bn 38 102 48 49* 61 716
Nuclear
Power generation capacity
2013 MW
4,391 17,834 63,130
-
Pre-2011
(46,000)
9,246 101,465
Space Program Budgets 2009
$ Bn 1.06 1.79 1.06 3 0.1 64.42
* 2014 budget number
Source: IMF, IAEA, Space foundation, Japan Ministry of Defence, World Nuclear Association
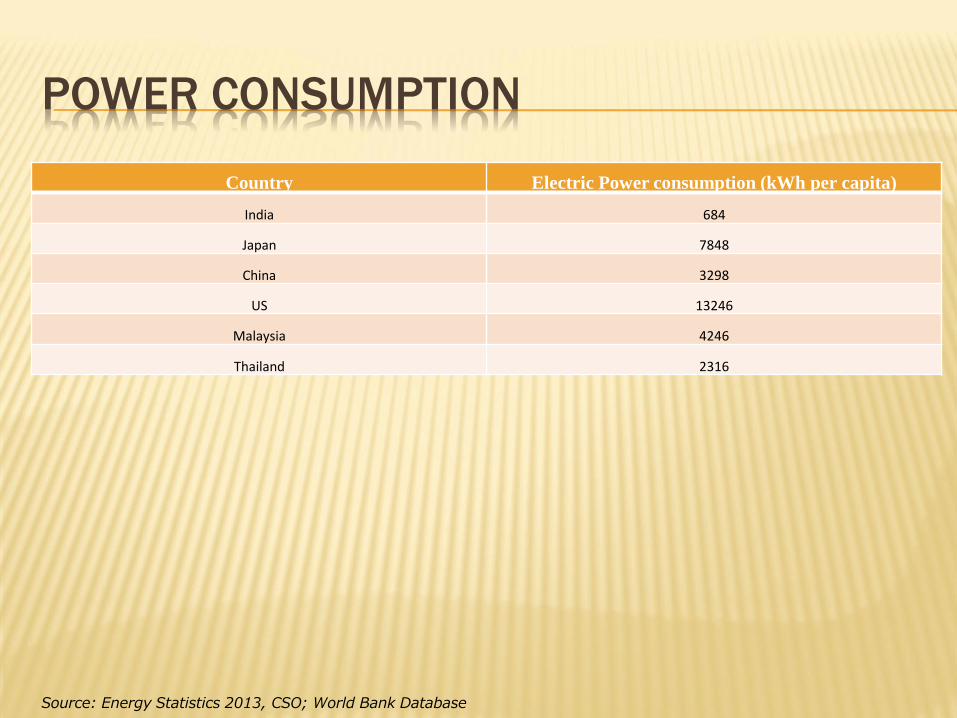
POWER CONSUMPTION
Country Electric Power consumption (kWh per capita)
India 684
Japan 7848
China 3298
US 13246
Malaysia 4246
Thailand 2316
Source: Energy Statistics 2013, CSO; World Bank Database
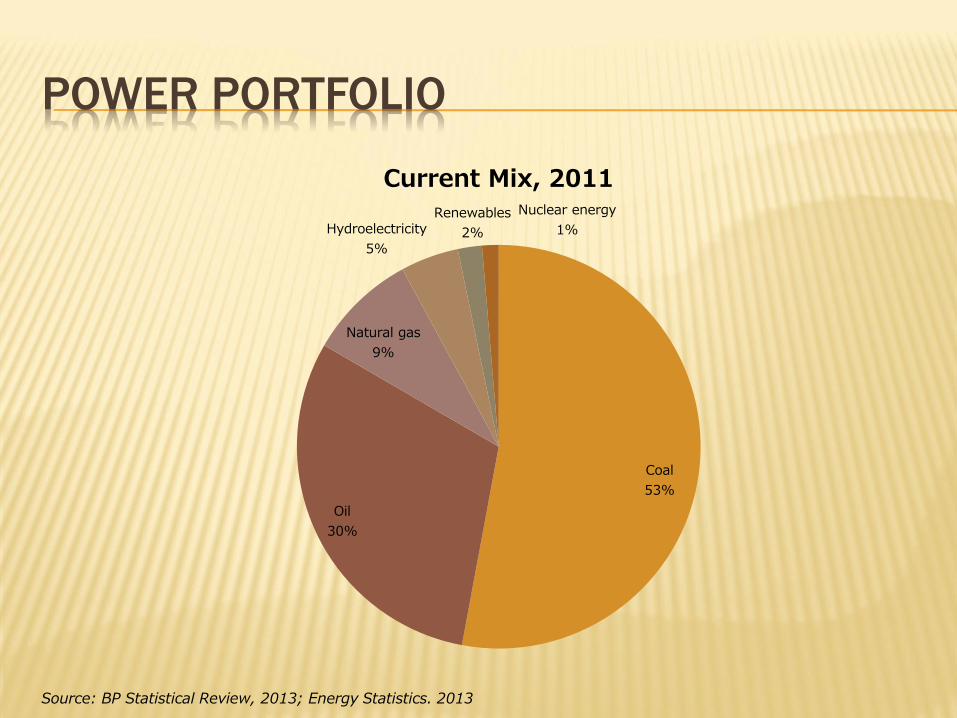
POWER PORTFOLIO
Coal
53%
Oil
30%
Natural gas
9%
Hydroelectricity
5%
Renewables
2%
Nuclear energy
1%
Current Mix, 2011
Source: BP Statistical Review, 2013; Energy Statistics. 2013
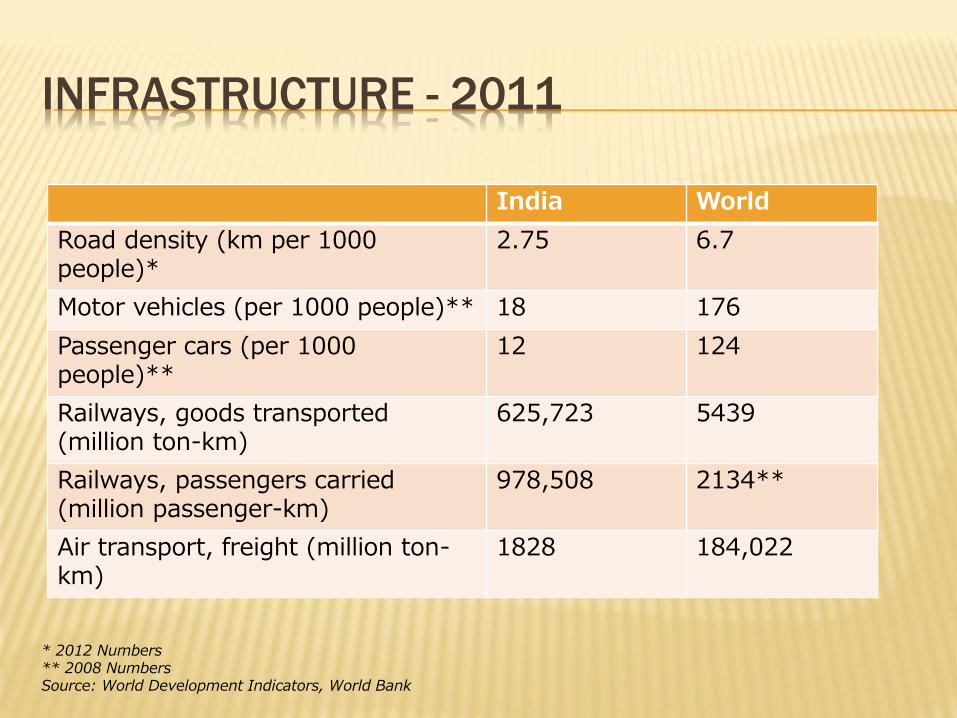
INFRASTRUCTURE - 2011
India World
Road density (km per 1000 people)*
2.75 6.7
Motor vehicles (per 1000 people)** 18 176
Passenger cars (per 1000 people)**
12 124
Railways, goods transported (million ton-km)
625,723 5439
Railways, passengers carried (million passenger-km)
978,508 2134**
Air transport, freight (million ton-km)
1828 184,022
* 2012 Numbers ** 2008 Numbers Source: World Development Indicators, World Bank

OUTSTANDING INTERNAL LIABILITIES OF
CENTRAL & STATE GOVERNMENT (INR CRORES)
Year Internal Debt Small savings,
Deposits,
Provident funds
and others
accounts
Reserve funds
and deposits
Total
Internal
Liabilities
2012-13* 4303310
(64.24)
755407
(12.57)
143517
(2.31)
5468922
(83.72)
Year Market loans + Loans from
Banks and FIs
(As % of GDP)
Total Outstanding Liabilities
minus loans and advances
from GoI
(As % of GDP)
2012-13* 17.33 35.5
Note: Figures in () represent % of GDP Source: RBI Annual Reports
Central Government
State Government

EQUITY MARKETS (% OF GDP - 2012)
Country Market
Capitalisation
Value Traded Listed Domestic
Cos
India 68.6 33.8 5191
USA 114.9 131.6 4102
Japan 61.8 60.5 3470
UK 122.2 100.7 2179
Germany 43.4 35.7 665
China 44.9 70.8 2494
Source: World Bank Database

DOMESTIC BOND MARKETS - 2012
Country Percentage of GDP (December)
India 35
Mexico 38
China 39
UK 71
Germany 77.25
Malaysia 93
USA 161
Japan 252
Source: BIS Quarterly Review Data, Table 16A

CORPORATE BOND MARKETS -2012
Country Percent of GDP
India 5
USA 98.6
Europe 46.4
Malaysia 57
Thailand 12.8
South Africa 20
China 22.8
Source: IMF

BANK LENDING – 2012
Country Lending as % of Deposits
China 133.7
UK 176.1
Malaysia 117.8
USA 183.8
India 77.7
Source: RBI; World Bank

OUTSTANDING MORTGAGE BALANCE (€ BILLION)
Source: EMF, JHF, FRB, PBOC, GHB, NHB and other country sources; Compiled by Japan Housing Finance Agency, Asian Mortgage Markets

DEBIT AND CREDIT CARD PENETRATION - 2010
Country Penetration (% of Population)
India 3
South Korea 174
Brazil 71
China 61
Thailand 54
Mexico 44
Source: India Banking 2010, McKinsey Global Institute Analysis

PENSION AUM(US$ BILLION - 2012)
Country Pension Assets % of GDP
India 5 0.27
Switzerland 766 121.5
Netherlands 1325 172
USA 11,613 71.5
Japan 1228 20.48
UK 2432 98.5
France 9.2 0.35
Germany 231 6.75
Source: OECD Global Pension Statistics

MUTUAL FUNDS AUM – 2010
Mutual Funds AUM in 2013 - $115 billion and recorded a CAGR of 23% (India)
Source: ICI Fact Book 2011; RBI

INSURANCE PENETRATION*
Name 2011 2012
Total Life Non-Life Total Life Non-Life
USA 8.1 3.6 4.5 8.2 3.7 4.5
UK 11.8 8.7 3.1 11.3 8.4 2.8
Germany 6.8 3.2 3.6 6.7 3.1 3.6
Japan 11 8.8 2.2 11.4 9.2 2.3
India 4.1 3.4 0.70 3.95 3.17 0.78
China 3 1.8 1.2 3 1.7 1.3
* Ratio of premium underwritten to the GDP Source: IRDA Annual Report 2012-13

INSURANCE DENSITY*
Name 2011 2012
Total Life Non-Life Total Life Non-Life
USA 3846.0 1716 2130 4047.3 1808.1 2239.2
UK 4535 3347 1188 4350 3255.8 1094.4
Germany 2967 1389 1578 2804.6 1299.3 1505.3
Japan 5169 4138 1031 5167.5 4142.5 1024.9
China 163 99 64 178.9 102.9 76
India 59 49 10 53.2 42.7 10.5
World 661 378 283 655.7 372.6 283.1
* Ratio of premium underwritten to the total population measured in USD Source: IRDA Annual Report 2012-13

P/E MULTIPLES OF GLOBAL INDICES - 2014
Index Country P/E Multiple as of 1 Jan
S&P 500 US 17.44
FTSE 100 UK 16.63
DAX Germany 16.24
SENSEX India 17.94
NIKKEI 225 Japan 23.54
Dow Jones industrial US 16.03
CAC 40 France 18.41
Hang Seng HK 10.57
ASX 200 Australia 21.95
Source: Bloomberg

INDIA – OPPORTUNITIES INFRASTRUCTURE
Envisaged investment was $ 1 trillion for 2012-
17 (unlikely to be achieved given low growth in
last 18 months)
World’s third largest road network 4.24 million
kms
Road freight volumes increasing at CAGR 9.08
% p.a.
Vehicle population increasing at CAGR 10.76 %
p.a.
Source: India Brand Equity Foundation

INDIA OPPORTUNITIES
INFRASTRUCTURE
Under NHDP-VI 1000 km of expressways
envisaged with investment of $ 3 billion
Expansion of port traffic from current 800 MT to
2500 MT by 2020; investment of $ 13.58 billion
during 2012-17
India’s urban population projected to reach 600
million by 2013
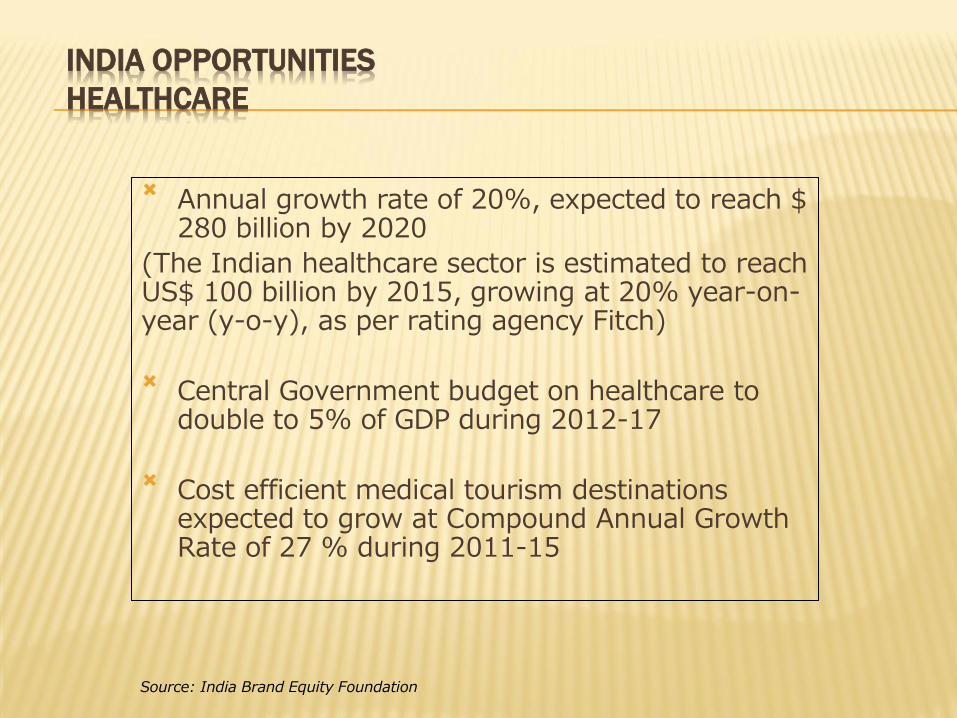
INDIA OPPORTUNITIES
HEALTHCARE
Annual growth rate of 20%, expected to reach $
280 billion by 2020
(The Indian healthcare sector is estimated to reach US$ 100 billion by 2015, growing at 20% year-on-year (y-o-y), as per rating agency Fitch)
Central Government budget on healthcare to
double to 5% of GDP during 2012-17
Cost efficient medical tourism destinations
expected to grow at Compound Annual Growth Rate of 27 % during 2011-15
Source: India Brand Equity Foundation
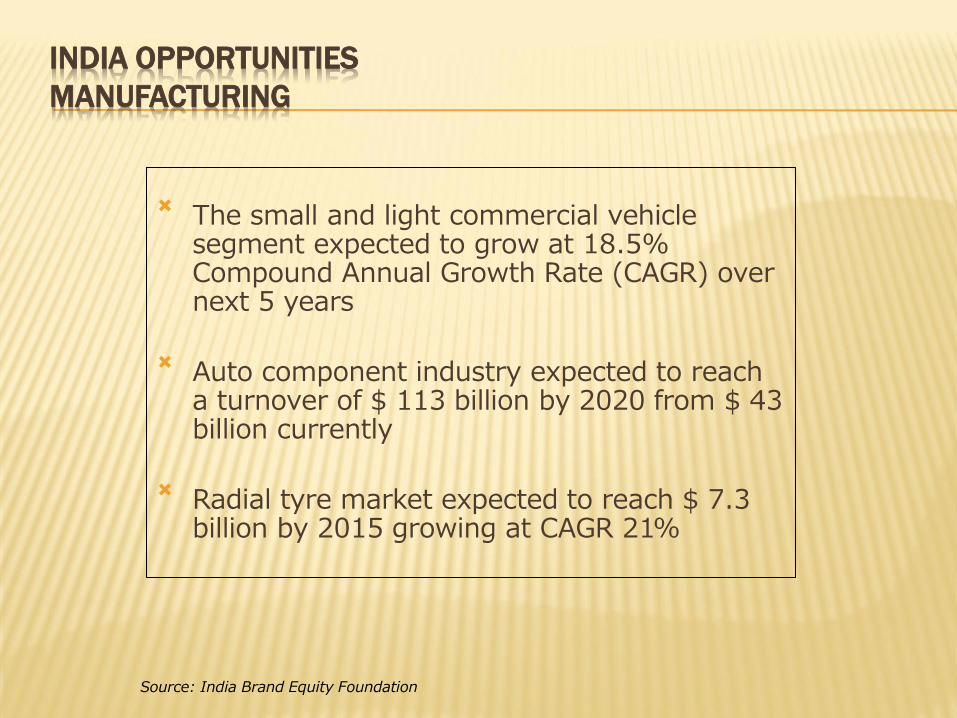
INDIA OPPORTUNITIES
MANUFACTURING
The small and light commercial vehicle
segment expected to grow at 18.5% Compound Annual Growth Rate (CAGR) over next 5 years
Auto component industry expected to reach
a turnover of $ 113 billion by 2020 from $ 43 billion currently
Radial tyre market expected to reach $ 7.3
billion by 2015 growing at CAGR 21%
Source: India Brand Equity Foundation

INDIA OPPORTUNITIES
RETAIL
Source: India Brand Equity Foundation
Food industry currently at $ 13.79 billion growing at CAGR of 17 %
Retail sector currently at $ 350 billion
growing at CAGR 20%

INDIA OPPORTUNITIES
MEDIA AND ENTERTAINMENT
Source: India Brand Equity Foundation
TV sector revenue $ 6.8 billion in 2012 growing at 12.5%
Largest film industry in the world, revenue $
2 billion in 2012
World’s third largest internet market with a
user base of 120 million, set to increase to 370 million users by 2015
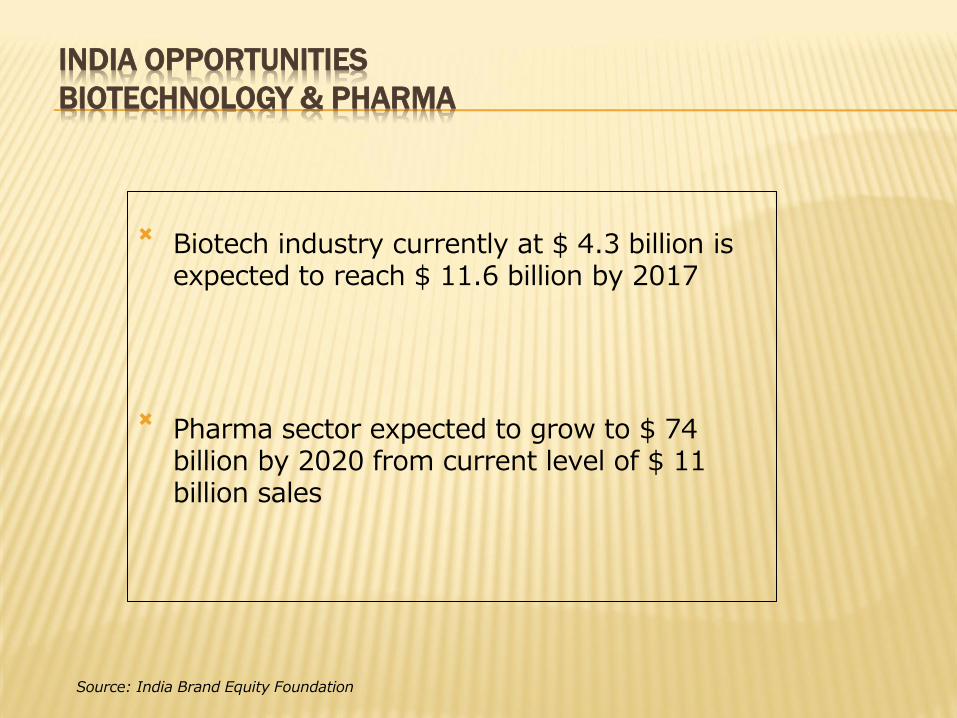
INDIA OPPORTUNITIES
BIOTECHNOLOGY & PHARMA
Source: India Brand Equity Foundation
Biotech industry currently at $ 4.3 billion is expected to reach $ 11.6 billion by 2017
Pharma sector expected to grow to $ 74
billion by 2020 from current level of $ 11 billion sales

INDIA OPPORTUNITIES
EDUCATION, RESEARCH AND DEVELOPMENT(ER&D)
Education market size expected to reach $ 112 billion by 2015
Leading offshore destination in delivering engineering R&D services with a market global share of 22%
Source: India Brand Equity Foundation

REAL GDP FORECAST AND ICOR
Median Forecast of Real GDP (Growth Rate)
2013-14 2014-15
Real GDP 4.8 5.8
Source : RBI; Business Standard


