70


Resilience Measurement Index: An indicator of critical infrastructure resilience
iii
Contents
List of Abbreviations ..................................................................................................................... vi
Acknowledgments......................................................................................................................... vii
Executive Summary ....................................................................................................................... ix
1 Introduction ..................................................................................................................................1
2 Risk, Vulnerability, and Resilience .............................................................................................3
3 Resilience Measurement Index Methodology .............................................................................7 3.1 Organization of the Resilience Measurement Index .............................................................8
3.1.1 Preparedness ...........................................................................................................9
3.1.2 Mitigation Measures ............................................................................................10
3.1.3 Response Capabilities ..........................................................................................12
3.1.4 Recovery Mechanisms .........................................................................................13 3.2 Data Collection ...................................................................................................................14
3.3 Calculation of the Resilience Measurement Index .............................................................17 3.4 Data Display........................................................................................................................19
4 Use of the Resilience Measurement Index.................................................................................23
5 Methodology Advantages and Limitations ................................................................................27
6 Conclusion .................................................................................................................................29
7 References ..................................................................................................................................31
Appendix 1: Resilience Measurement Index Structure .................................................................35
Appendix 2: Preparedness Components ........................................................................................37
Appendix 3: Mitigation Measures Components ............................................................................38
Appendix 4: Response Capabilities Components ..........................................................................41
Appendix 5: Recovery Mechanisms Components .........................................................................43
Appendix 6: Illustration of Weight Determination ........................................................................45
Appendix 7: Example of Calculation Rollup .................................................................................49

Resilience Measurement Index: An indicator of critical infrastructure resilience
iv
Tables
1 Relationship between the RMI Components and the Definition of Resilience ......................7
2 Major Level 1 and Level 2 Components Constituting the RMI .............................................9
A1 Ranks and Relative Importance Defined by SMEs for the Business
Continuity Plan Exercises Components ................................................................................45
A2 Notional Relative Importance Obtained for the Business Continuity Plan
Exercises Components ..........................................................................................................46
A3 Notional Weights Obtained for the Business Continuity Plan
Exercises Components ..........................................................................................................47
A4 Notional Weights Obtained for the RMI Level 1 Components ............................................48
A5 Business Continuity Plan Exercises Index (Illustrative Asset) .............................................49
A6 Business Continuity Plan Training/Exercises Index (Illustrative Asset) ..............................50
A7 Business Continuity Plan Index (Illustrative Asset) .............................................................51
A8 Planning Index (Illustrative Asset) .......................................................................................52
A9 Preparedness Index (Illustrative Asset) ................................................................................54
A10 Resilience Measurement Index (Illustrative Asset) ..............................................................54
Figures
1 Risk Components ....................................................................................................................3
2 Risk Management Bowtie Diagram ........................................................................................4
3 Level 1 Components of the RMI ............................................................................................8
4 Level 2 and 3 Components of the RMI Contributing to Preparedness ...................................9
5 Level 2 and 3 Components of the RMI Contributing to Mitigation Measures .....................10
6 Level 2 and 3 Components of the RMI Contributing to Response Capabilities ...................12

Resilience Measurement Index: An indicator of critical infrastructure resilience
v
Figures (Cont.)
7 Level 2 and 3 Components of the RMI Contributing to Recovery Mechanisms..................13
8 Overview of the Infrastructure Survey Tool (IST) ...............................................................15
9 RMI Dashboard Overview Screen (Illustrative Asset) .........................................................19
10 RMI Dashboard Selections: Planning/Business Continuity Plan/Content/
Procedures (Illustrative Asset) ..............................................................................................20
11 RMI Dashboard’s Brief Review Screen (Illustrative Asset).................................................21
12 Comparison of Resilience and Protective Measures Indices (Illustrative Asse t) ....23

Resilience Measurement Index: An indicator of critical infrastructure resilience
vi
List of Abbreviations
BCPEI Business Continuity Plan Exercises Index
BCPI Business Continuity Plan Index
BCPTEI Business Continuity Plan Training/Exercises Index
CMI Consequences Measurement Index
DHS U.S. Department of Homeland Security
ECIP Enhanced Critical Infrastructure Protection (program)
IMCC Incident Management & Command Center
IST Infrastructure Survey Tool
MAUT multi-attribute utility theory
MOA memoranda of agreement
MOU memoranda of understanding
NG National Guard
NIAC National Infrastructure Advisory Council
PlI Planning Index
PMI Protective Measures Index
PPD Presidential Policy Directive
PrI Preparedness Index
PSA protective security advisor
PSPrep Private Sector Preparedness Program
QA quality assurance
RI Resilience Index
RMI Resilience Measurement Index
RRAP Regional Resilience Assessment Program
SAA Significant Assets/Areas
SAV Site Assistance Visit
SEDIT Special Event/Domestic Incident Tracker
SME subject matter expert

Resilience Measurement Index: An indicator of critical infrastructure resilience
vii
Acknowledgments
The authors gratefully acknowledge the contributions of many people who helped bring this
project to its current state of development, including the Protective Security Coordination
Division management team of the U.S. Department of Homeland Security’s Office of
Infrastructure Protection. More specifically, the authors want to thank Mike Norman, Dave
Bradfield, Donald Erskine, Sean McAraw, and Liz Clifton, without whom this work would not
have been possible. The authors are particularly thankful to John Walsh. His leadership and
dedication inspired the Argonne National Laboratory team.
The authors also want to thank Cherrie Black, Louis Dabdoub, Charlene Denys, Dean R. Larson,
Pam Manning, Sean McCloskey, Bethany Netzel, Eric Phillipson, Mike Schroeder, Erik Ulmen,
Catherine Valencia, and Reed White, who participated in the weighting process; and other
Argonne colleagues who made this report possible.

Resilience Measurement Index: An indicator of critical infrastructure resilience
viii
This page intentionally left blank.

Resilience Measurement Index: An indicator of critical infrastructure resilience
ix
Executive Summary
The world faces numerous threats from both natural and man-made sources. Since the beginning
of the 21st century, in the United States alone, we have experienced several devastating events.
Incidents such as the attacks on the World Trade Center in 2001, the Northeast blackout in 2003,
Hurricane Katrina in 2005, and Superstorm Sandy in 2012 have had far-reaching impacts that
have directly affected our society’s well-being. Although current efforts that have focused on
preventing or mitigating the impact of incidents have achieved admirable results, a more
comprehensive approach is needed to improve the nation’s overall resilience. An all-hazards
methodology that emphasizes not only protection but also preparedness, mitigation, response,
and recovery programs and capabilities is desired. Presidential Policy Directive 21 defines
16 critical infrastructure sectors that are essential to the nation’s security, public health and
safety, economic vitality, and general quality of life (White House, 2013). If the operations of
these critical infrastructure sectors are essential, their protection and resilience is paramount. As
stated by President Obama, “Our goal is to ensure a more resilient Nation―one in which
individuals, communities, and our economy can adapt to changing conditions as well as
withstand and rapidly recover from disruption due to emergencies” (Department of Homeland
Security, 2010a).
Enhancing the resilience of critical infrastructure requires its owners/operators to determine the
ability of the system to withstand specific threats, minimize or mitigate potential impacts, and to
return to normal operations if degradation occurs. Thus, a resilience methodology requires the
comprehensive assessment of critical infrastructure systems/assets—from threat to consequence.
The methodology needs to support decision-making for risk management, disaster response, and
business continuity. Considering these issues, the Infrastructure Assurance Center at Argonne
National Laboratory, in partnership with the Protective Security Coordination Division of the
U.S. Department of Homeland Security (DHS), has developed an index, the Resilience
Measurement Index (RMI), to characterize the resilience of critical infrastructure.
The RMI has been formulated to capture the fundamental aspects of resilience for critical
infrastructure with respect to all hazards. The RMI methodology supports decision-making
related to risk management, disaster response, and maintenance of business continuity. It
complements other indices that have been developed―the Protective Measures Index and the
Consequences Measurement Index―and thus, in combination with other tools, allows critical
infrastructure to be compared in terms of resilience, vulnerability, consequences, and ultimately
risk. The main objective of the RMI is to measure the ability of a critical infrastructure to reduce
the magnitude and/or duration of impacts from disruptive events.
The RMI is based on multi-attribute utility theory and decision analysis principles. Resilience, in
the context of critical infrastructure, is defined as the ability of a facility or asset to anticipate,
resist, absorb, respond to, adapt to, and recover from a disturbance (Carlson et al., 2012). These
six elements are aggregated into four major (Level 1) components: preparedness, mitigation
measures, response capabilities, and recovery mechanisms.

Resilience Measurement Index: An indicator of critical infrastructure resilience
x
The Level 1 indices and overall RMI for an asset/facility are based on data collected via the DHS
Enhanced Critical Infrastructure Protection Program’s Infrastructure Survey Tool. The indices
are based on the aggregation of pertinent components in the IST. Each of these components has
been weighted by subject matter experts to indicate its relative importance to a facility’s
resilience. The value of the RMI ranges between 0 (low resilience) and 100 (high resilience).
A high RMI does not mean that a specific event will not affect the facility or have severe
consequences. Conversely, a low RMI does not mean that a disruptive event will automatically
lead to a failure of the critical infrastructure and to serious consequences. The RMI instead is
used to allow critical infrastructure facilities to compare their level of resilience against the
resilience level of other similar facilities nationwide and guide prioritization for improving
resilience.
All the data and levels of information used for the RMI, as well as the value of its four Level 1
components, are presented on an interactive, Web-based tool called the IST RMI Dashboard. The
Dashboard provides a snapshot of the resilience of a critical infrastructure at a specific point in
time. The Dashboard provides valuable information to owners/operators about their facility’s
status relative to those of similar assets. The Dashboard can be used to create scenarios and
assess the implementation of specific resilience measures or procedures that the facility
owner/operator might consider. Using the Dashboard’s interactive “Facility Scenario” function
makes it possible for the facility owner or operator to select possible resilience enhancements
and immediately see the resulting modified RMI. Policies, procedures, or operational methods
are enhancements with which the facility may increase resilience.
Combining the RMI information with other indices, such as the Protective Measures Index and
the Consequences Measurement Index, allows for a comprehensive assessment of risk that can
support decision-making about protection, business continuity, and emergency management of
critical infrastructure.

Resilience Measurement Index: An indicator of critical infrastructure resilience
1
1 Introduction
In 2009, the U.S. Department of Homeland Security (DHS) and its protective security advisors
(PSAs) began surveying critical infrastructure using the Infrastructure Survey Tool (IST) and
ultimately produced individual protective measure and vulnerability values through the
Protective Measures Index (PMI). This index identifies the protective measures posture of
individual facilities at their “weakest link,” allowing for a survey of the most vulnerable aspects
of the facilities.
As critical infrastructure continued to be surveyed using the IST and displayed using the PMI,
Argonne National Laboratory, in partnership with the DHS Protective Security Coordination
Division, developed an index for surveying the resilience of critical infrastructure―the
Resilience Index (RI).
Following initial use of the RI, additional analysis and advancements in the study of resilience
suggested that the index could be improved by better considering elements contributing to
business continuity, continuity of service, cyber risk, and resource dependencies. The first
requirement for the enhanced RI was a modification of the IST question set. Modification of the
IST provided more information on the elements contributing to dependencies on external
providers, business continuity, and emergency management.
The development of this new indicator of resilience, named the Resilience Measurement Index
(RMI), was guided by the standards used for the voluntary Private Sector Preparedness Program
(PSPrep) and National Security Directive PPD-8. The PSPrep program is based on three main
standards (British Standards Institute 25999, NFPA 1600, and ANSI/ASIS SPC.1-2009), which
provide a comprehensive management systems approach to organizational resilience,
preparedness, and business continuity (Federal Emergency Management Agency, 2013). PPD-8
focuses on national preparedness for strengthening the security and resilience of the Nation. It
promotes an all-hazards approach based on the identification of core capabilities necessary for
communities to be better prepared for significant destructive incidents (Department of Homeland
Security, 2011).
The RMI is based on the same methodologies (multi-attribute utility theory [MAUT] and
decision analysis) as the RI but organizes the components in terms of preparedness, mitigation
measures, response capabilities, and recovery mechanisms. This new organizational structure,
while still capturing the traditional components of resilience (anticipation, absorption,
adaptation, and recovery), organizes resilience measures in a way that is consistent with
emergency and risk management processes.
Combining a pre-incident focus with an improved understanding of resilience allows
owners/operators to identify better ways to decrease risk by (1) increasing preparedness for an
incident, (2) implementing redundancy to mitigate the effects of an incident, and (3) enhancing
emergency action and business continuity planning and implementation to increase the
effectiveness of response and recovery procedures. Information provided by the RMI
methodology is used by facility owners/operators to better understand how their facilities

Resilience Measurement Index: An indicator of critical infrastructure resilience
2
compare to similar sector/subsector sites and to help them make risk-informed decisions. This
information can also be used for decreasing risk and improving resilience at the regional level.
Resilience for the Nation includes both critical infrastructure and other components. As stated by
Carlson et al. (2012), “… the resilience of a community/region is a function of the resilience of
its subsystems, including its critical infrastructures, economy, civil society, governance
(including emergency services), and supply chains/dependencies.” However, additional data and
methods must be used to capture the resilience of a community/region or the nation.
This report provides an overview of the RMI methodology developed to estimate resilience and
provide resilience comparisons for critical infrastructure sectors and subsectors. The first section
explains the relation between vulnerability, risk, and resilience. The second section presents the
RMI organizational structure and explains the RMI methodology from data collection to display
of results via the RMI Dashboard. The third section presents some possible uses of the RMI. A
fourth section explains the advantages and limitations of the RMI. The appendices present the
detached structure of the RMI, outline the assessment process, and give an example of
calculation.

Resilience Measurement Index: An indicator of critical infrastructure resilience
3
2 Risk, Vulnerability, and Resilience
The DHS defines risk as “the potential for an unwanted outcome resulting from an incident,
event, or occurrence, as determined by its likelihood and the associated consequences”
(Department of Homeland Security, 2010b). Risk is thus traditionally defined as a function of
three elements: the threats to which an asset is susceptible, the vulnerabilities of the asset to the
threat, and the consequences potentially generated by the degradation of the asset (Figure 1).
Figure 1: Risk Elements
Threat is a “natural or man-made occurrence, individual, entity, or action that has or indicates
the potential to harm life, information, operations, the environment, and/or property”
(Department of Homeland Security, 2010b). Sometimes the term hazard, which can be defined as
a “natural or man-made source or cause of harm or difficulty” (Department of Homeland
Security, 2010b), is used instead of threat. However, as defined by the DHS lexicon, a “hazard
differs from a threat in that a threat is directed at an entity, asset, system, network, or
geographic area, while a hazard is not directed” (Department of Homeland Security, 2010b).
Vulnerability is a “physical feature or operational attribute that renders an entity open to
exploitation or susceptible to a given hazard” (Department of Homeland Security, 2010b).
Consequences are the “effects of an event, incident, or occurrence” (Department of Homeland
Security, 2010b).
If risk is a function of threats and hazards, vulnerabilities, and consequences, the challenge is to
define where and how resilience fits into the determination of risk. Resilience, as defined by
DHS, is the “ability to resist, absorb, recover from or successfully adapt to adversity or a change
in conditions” (Department of Homeland Security, 2010b). The DHS lexicon also states that
“Resilience can be factored into vulnerability and consequence estimates when measuring risk”
Resilience Measurement Index: An indicator of critical infrastructure resilience
4
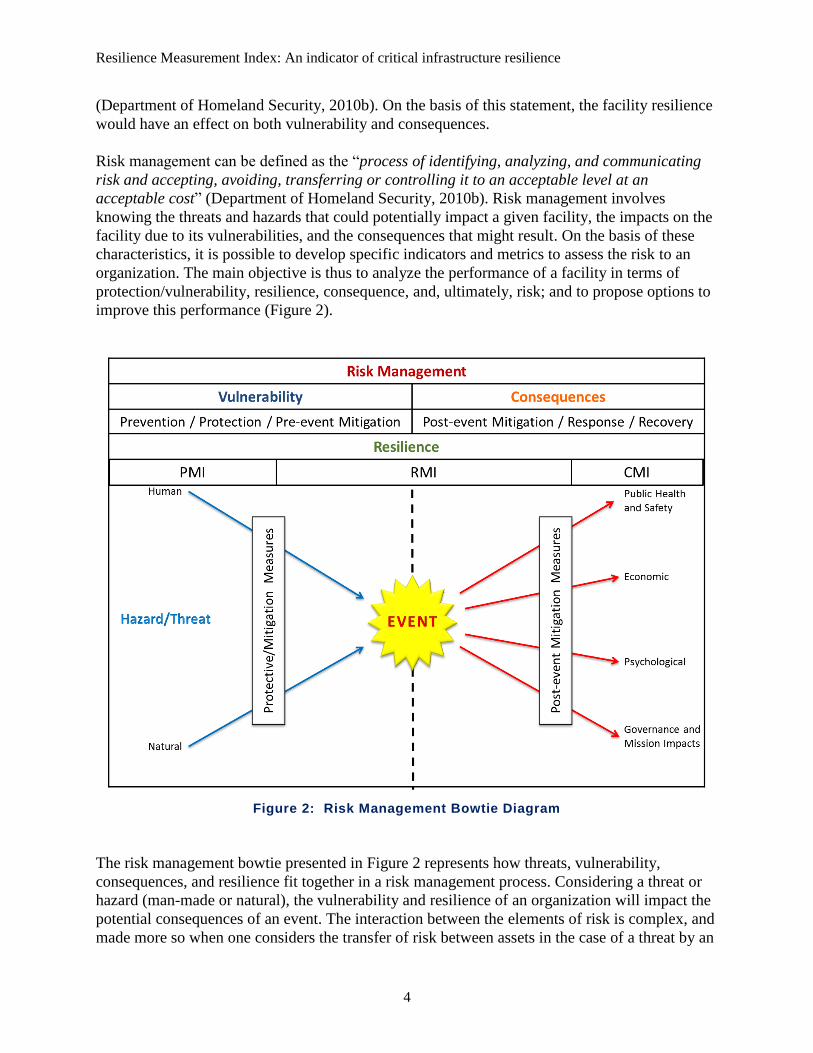
(Department of Homeland Security, 2010b). On the basis of this statement, the facility resilience
would have an effect on both vulnerability and consequences.
Risk management can be defined as the “process of identifying, analyzing, and communicating
risk and accepting, avoiding, transferring or controlling it to an acceptable level at an
acceptable cost” (Department of Homeland Security, 2010b). Risk management involves
knowing the threats and hazards that could potentially impact a given facility, the impacts on the
facility due to its vulnerabilities, and the consequences that might result. On the basis of these
characteristics, it is possible to develop specific indicators and metrics to assess the risk to an
organization. The main objective is thus to analyze the performance of a facility in terms of
protection/vulnerability, resilience, consequence, and, ultimately, risk; and to propose options to
improve this performance (Figure 2).
Figure 2: Risk Management Bowtie Diagram
The risk management bowtie presented in Figure 2 represents how threats, vulnerability,
consequences, and resilience fit together in a risk management process. Considering a threat or
hazard (man-made or natural), the vulnerability and resilience of an organization will impact the
potential consequences of an event. The interaction between the elements of risk is complex, and
made more so when one considers the transfer of risk between assets in the case of a threat by an

Resilience Measurement Index: An indicator of critical infrastructure resilience
5
intelligent adversary. For example, when protection at a site is increased, vulnerability decreases
and the risk at that site declines, but the risk at another site or sites may increase (Phillips et al.,
2012).
The first index developed as part of the DHS Enhanced Critical Infrastructure Protection (ECIP)
program was the PMI, in 2008. This index captures the protective measures in place in a given
facility (Fisher et al., 2009; Petit et al., 2011). The fourth version of this index, launched in
January 2013, addresses elements characterizing physical security, security management,
security force, information sharing, and security activity background. The PMI therefore focuses
on the left side of the risk management bowtie.
The second index, the RMI, characterizes the resilience of critical infrastructure at the center part
of the bowtie, and mitigates the otherwise maximum consequences depicted on the right side of
the bowtie. The objectives of this index are to develop a key performance indicator that
characterizes the resilience of a facility and supports the decisions of critical infrastructure
owners/operators through the comparison of like facilities. This index must be applicable to all
types of critical infrastructure sectors/subsectors, and must consider all types of hazards (man-
made, natural, and cyber), facility dependencies, and facility capabilities with respect to
emergency management.
A third index, the Consequences Measurement Index (CMI), characterizes the maximum
consequences potentially generated by an adverse event at a facility. This index includes
information on public health and safety, economic, psychological, and governance and mission
impacts from the loss of the facility. This index focuses on the right side of the risk management
bowtie.
The following section presents the methodology used for developing the RMI.

Resilience Measurement Index: An indicator of critical infrastructure resilience
6
This page intentionally left blank.
Resilience Measurement Index: An indicator of critical infrastructure resilience
7
3 Resilience Measurement Index Methodology
The current RMI is a descendent of an earlier index called the RI. Both indices support decision-
making in risk management, disaster response, and business continuity. Argonne National
Laboratory developed the RI in 2010 by using a comprehensive methodology of consistent and
uniform data collection and analysis. This index was built using the NIAC definition of critical
infrastructure resilience: Resilience is the “ability to reduce the magnitude and/or duration of
disruptive events” (NIAC, 2009). The effectiveness of a resilient infrastructure or enterprise
depends on its “ability to anticipate, absorb, adapt to, and rapidly recover from a potentially
disruptive event, whether naturally occurring or human caused” (NIAC, 2009).
The RI characterized the resilience of critical infrastructure in terms of robustness,
resourcefulness, and recovery (Fisher et al., 2010; Petit et al., 2012). The main benefit of the RI
was to give the critical infrastructure owners/operators a performance indicator of the resilience
of their facilities that could support their decisions in risk and resilience management. In early
2012, a review of the index methodology resulted in enhancements to the structure of the RI and
the information collected in order to develop a more comprehensive and informative index―the
RMI.
The first step in revising the RI was a literature search to determine how to incorporate additional
information and provide a better indicator of infrastructure resilience. This work was finished in
2012 and led to the publication of a report titled “Resilience: Theory and Applications” (Carlson
et al., 2012). This document outlined the definition of resilience used for developing the RMI:
Resilience is “the ability of an entity—e.g., asset, organization, community,
region—to anticipate, resist, absorb, respond to, adapt to, and recover from a
disturbance” (Carlson et al., 2012).
This definition of resilience is broader than the one proposed by NIAC in 2009 by considering
not only the capabilities to anticipate , absorb, adapt to and recover from a disruptive event, but
also the notions of resistance and response to the event. The RMI structures the information
collected in four categories (Preparedness, Mitigation Measures, Response Capabilities, and
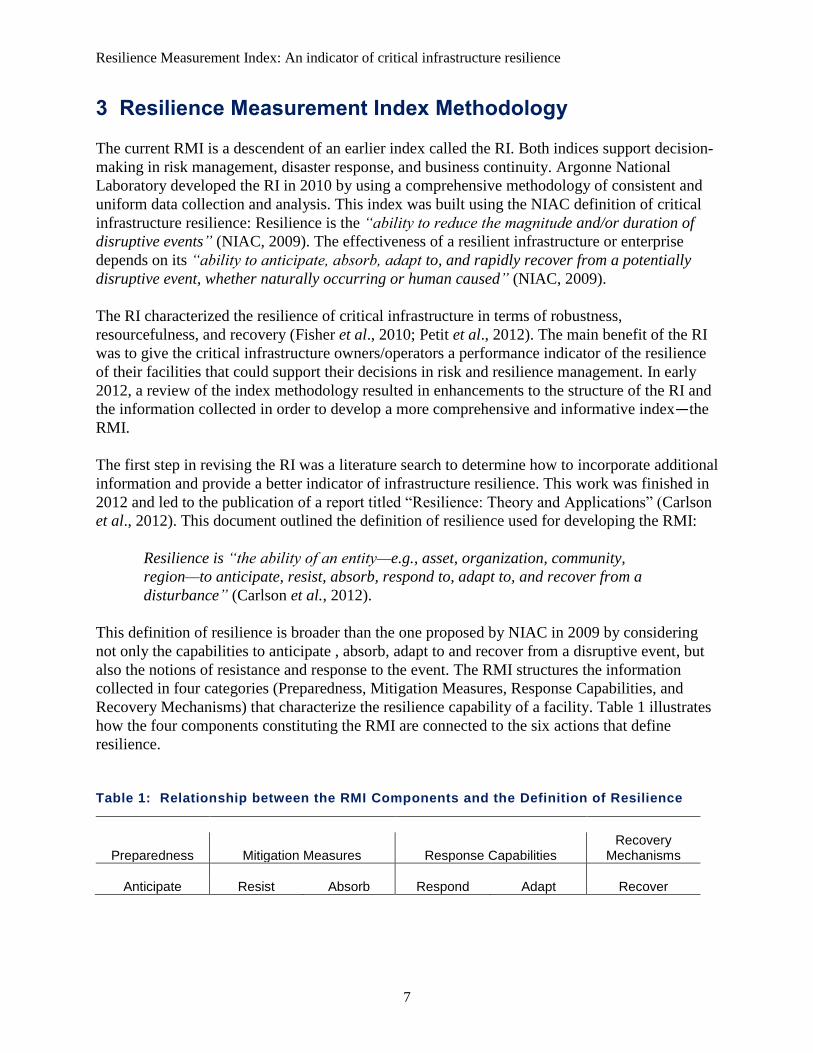
Recovery Mechanisms) that characterize the resilience capability of a facility. Table 1 illustrates
how the four components constituting the RMI are connected to the six actions that define
resilience.
Table 1: Relationship between the RMI Components and the Definition of Resilience
Preparedness Mitigation Measures Response Capabilities Recovery
Mechanisms
Anticipate Resist Absorb Respond Adapt Recover
Resilience Measurement Index: An indicator of critical infrastructure resilience
8
The RMI combines questions from the IST. These questions have been developed on the basis of
business continuity and resilience standards and specifically draw from the following:
British Standards Institute 25999 Standard on Business Continuity (BSI, 2010);
NFPA 1600 Standard on Disaster/Emergency Management and Business Continuity
Programs (NFPA, 2010);
ANSI/ASIS SPC.1-2009 Standard on Organizational Resilience (ASIS, 2009); and
ISO 22301 Societal Security – Business Continuity Management Systems –
Requirements 06-15-2012 (ISO, 2012).
Appendix 1 presents a flowchart of the RMI structure. The organization and the different
elements constituting the RMI are discussed in the following sections.
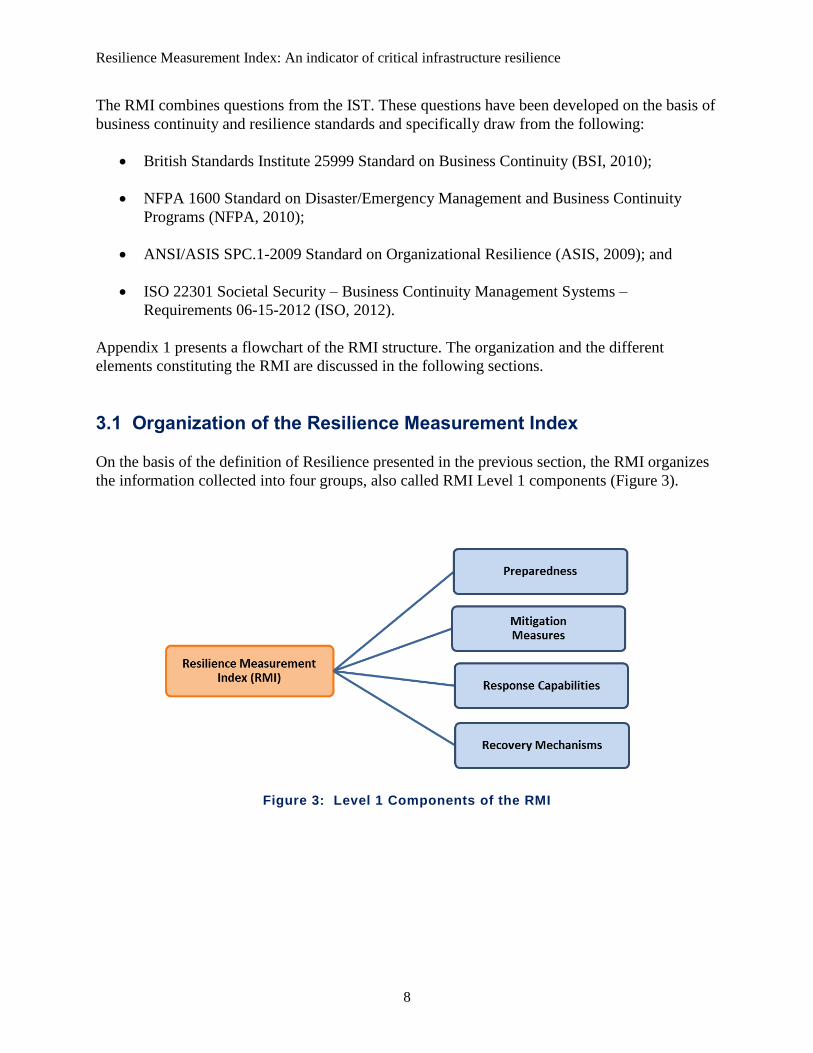
3.1 Organization of the Resilience Measurement Index
On the basis of the definition of Resilience presented in the previous section, the RMI organizes
the information collected into four groups, also called RMI Level 1 components (Figure 3).
Figure 3: Level 1 Components of the RMI

Resilience Measurement Index: An indicator of critical infrastructure resilience
9
The RMI organizes the information collected with the IST into six levels in order of increasing
specificity; raw data are gathered at Level 6 and Level 5. They are then combined further
through Levels 4, 3, 2, and finally to Level 1. Each of the Level 1 components is defined by the
aggregation of Level 2 components that allow analysts to characterize a facility. The RMI is
constituted from four Level 1 components, ten Level 2 components, and 29 Level 3 components,
as defined by subject matter experts (SMEs). The Level 1 and Level 2 components are shown in
Table 2.
Table 2: Major Level 1 and Level 2 Components Constituting the RMI
Preparedness - Level 1
Mitigation Measures - Level 1
a. Awareness – Level 2 (2)*
b. Planning – Level 2 (4)
a. Mitigating Construction – Level 2 (4)
b. Alternate Site – Level 2
c. Resources Mitigation Measures – Level 2 (8)
Response Capabilities - Level 1
Recovery Mechanisms - Level 1
a. Onsite Capabilities – Level 2 (2)
b. Offsite Capabilities – Level 2 (3)
c. Incident Management and Command Center Characteristics – Level 2 (2)
a. Restoration Agreements – Level 2 (2)
b. Recovery Time – Level 2 (2)
*( ) denotes number of subcomponents.
The following sections present the definition and overview of each Level 1 component and
associated Level 2 components that contribute to the RMI calculation.
3.1.1 Preparedness
Preparedness refers to activities undertaken by an entity in anticipation of the threats/hazards,
and the possible consequences, to which it is subject. In the RMI, Preparedness is subdivided
into two Level 2 and six Level 3 components (Figure 4).
Figure 4: Level 2 and 3 Components of the RMI Contributing to Preparedness

Resilience Measurement Index: An indicator of critical infrastructure resilience
10
Specific actions that can be undertaken to enhance awareness related to an asset include the
development of hazard-related information, including hazard assessments and information
sharing, and the implementation of various measures designed to anticipate potential natural and
man-made hazards. This element combines information drawn from responses to questions
characterizing resilience operations and information-sharing processes in place at the facility
assessed. It also addresses the type of management in place for business continuity, emergency
operations, and information technology.
Planning-related activities include mitigation planning, response/emergency action planning, and
actions undertaken to enhance continuity of operations. This element combines information
drawn from responses to questions characterizing the types of plans (business continuity,
emergency operations/emergency action, and cyber) implemented at the facility. For each type of
plan, this section of the RMI addresses its characteristics (e.g., level of development and
approval), the type of exercises and training defined in the plan, and its content.
Components contributing to Preparedness are presented in Appendix 2.
3.1.2 Mitigation Measures
Mitigation Measures characterize the facility’s capabilities to resist a threat/hazard or to absorb
the consequences from the threat/hazard. Mitigation Measures consist of activities undertaken
prior to an event to reduce the severity or consequences of a hazard. Mitigation is meant to
capture information on whether the facility’s owner or operator recognizes that the facility might
be susceptible to certain hazards (e.g., hurricanes for facilities in Florida or earthquakes for
facilities in California), has determined the possible consequences/impacts, and has undertaken
efforts to mitigate the negative impacts those hazards might impose on the facility. In the RMI,
Mitigation Measures are subdivided into three Level 2 and twelve Level 3 components (Figure
5).
Figure 5: Level 2 and 3 Components of the RMI Contributing to Mitigation Measures

Resilience Measurement Index: An indicator of critical infrastructure resilience
11
Specific mitigating construction activities include measures to offset naturally occurring adverse
events. This component combines information drawn from responses to questions characterizing
Natural Hazards (construction to mitigate impacts, specific plans/procedures for long-term and
immediate mitigation measures, deployable mitigation measures), New Mitigation Measures
(infrastructure upgrade/redundancy), Standoff Distance (e.g., limiting parking to more than 400
feet from the facility reduces impacts), and the resilience of Significant Assets/Areas (SAA)
(time before impact and level of degradation).
Mitigation Measures also address the use of an alternative site1. Key features of an alternative
site include its characterization and the percentage of the normal level of the main facility’s
production that the alternative site can maintain. This component combines information drawn
from responses to questions characterizing the type of alternative site (full capability, capability
to perform essential functions, etc.), its location, equipment, and dependencies.
Resource Mitigation Measures, which characterize an entity’s dependencies on key resources to
support its core operations, are assessed by focusing on the facility’s reliance on selected
external resources (e.g., electric power, natural gas, communications, information technology,
transportation, critical products, water, and wastewater), its susceptibility to disruption of these
resources, and any actions that have been undertaken to mitigate the loss of such resources. This
component combines information drawn from responses to questions that characterize the
resources, alternative resources and backups, and the level of impact of the loss of the different
resources supporting the facility’s core operations.
Components contributing to Mitigation Measures are presented in Appendix 3.
1 Alternate site (Level 2) is an aggregation of questions within the IST. There is no intermediate level or
subcomponent between the alternate site level and the questions used for characterizing the alternate site’s
capabilities.

Resilience Measurement Index: An indicator of critical infrastructure resilience
12
3.1.3 Response Capabilities
Response capabilities are a function of immediate and ongoing activities, tasks, programs, and
systems that have been undertaken or developed to respond and adapt to the adverse effects of an
event. In the RMI, the Response Capabilities category is subdivided into three Level 2 and seven
Level 3 components (Figure 6).
Figure 6: Level 2 and 3 Components of the RMI Contributing to Response Capabilities
The Onsite Capabilities component groups elements of security/safety/emergency management.
This section of the RMI captures a facility’s capabilities to respond to an accident without
needing an immediate response from external first responders. This component combines
information drawn from responses to questions characterizing the implementation within the last
year of new communications and incident response measures and the immediate onsite response
capability for six specific types of event (toxic industrial chemical/Hazmat release, firefighting,
explosive threat, armed response, law enforcement, and medical emergency).
The Offsite Capabilities component groups elements characterizing the interactions with the
emergency services sector to respond to an event (e.g., fire, medical problem, or law
enforcement issue) and support the facility within its boundaries. This component combines
information drawn from responses to questions characterizing the interaction with First
Preventers/Responders (law enforcement, emergency medical response, and fire response), and
the Resource Service-Level Agreements. The First Preventers/Responders Interaction section
captures the presence of interoperable communication, existing memoranda of understanding and
memoranda of agreement (MOU/MOA), and orientation visits to the facility. Service Level
Agreements with resource providers and the number of dependencies reflect the facility’s lack of
self-reliance and especially the implementation of contingency/business continuity plans with
providers for restoration and the percentage of degradation of normal business functions once a
specific resource is lost.
The Incident Management and Command Center Characteristics section groups information that
captures the facility’s capabilities for managing response, continuity, and recovery operations if

Resilience Measurement Index: An indicator of critical infrastructure resilience
13
an incident occurs. This component combines information drawn from responses to questions
characterizing the facility’s involvement with the local Emergency Operation Center and the
Facility Incident Management & Command Center (IMCC) characteristics (primary and
alternative centers).
Components contributing to Response Capabilities are presented in Appendix 4.
3.1.4 Recovery Mechanisms
The Recovery Mechanisms section includes activities and programs designed to be effective and
efficient in returning operating conditions to a level that is acceptable to the entity. In the RMI,
the Recovery Mechanisms category is subdivided into two Level 2 and four Level 3 components
(Figure 7).
Figure 7: Level 2 and 3 Components of the RMI Contributing to Recovery Mechanisms
Restoration agreements concern information relative to existing MOU/MOA with entities other
than emergency responders, as well as procedures/equipment that will support facility
restoration. This component combines information drawn from responses characterizing the
facility’s participation in Information Sharing processes with external organizations and
Restoration Resource Agreements (e.g., a priority plan for restoration in case of loss of resource
supply).
The Recovery Time section groups information characterizing the time necessary for the facility
to recover full operations after the loss of one of its significant components. This component
combines information drawn from responses characterizing the SAA (time for returning to full
operations after the loss of the SAA, and the need for specialized materials or equipment) and
Resources Recovery (time of full resumption of operations once external service is restored).
All information contributing to the four Level 1 components and ultimately the overall RMI is
collected by using the IST. The data collection process is presented in the next section.
Components contributing to Recovery Mechanisms are presented in Appendix 5.

Resilience Measurement Index: An indicator of critical infrastructure resilience
14
3.2 Data Collection
The main objective is to calculate an index that captures the performance of a facility in terms of
resilience. To do so, it is necessary to obtain high-quality data for the model.
The ECIP program, IST and Site Assistance Visits (SAVs) support surveys to gather data on the
resilience performance of critical infrastructure assets/facilities (Department of Homeland
Security, 2013a; Department of Homeland Security, 2013b). The visit usually takes about four
hours but may take up to two days to complete, depending on the complexity and size of the
facility. During this time, the assessors, who are either PSAs or a specially trained National
Guard (NG) team, meet with key facility personnel (e.g., operations manager, utilities manager,
and cyber security manager) and ask them questions relating to their resilience posture and their
emergency and business continuity activities, which are based on the questions in the IST. The
local PSA is tasked with establishing contact with a facility’s owner/operator and providing
insights into DHS activities and programs. All of these survey programs are voluntary and the
facility decides if it would like to participate. The facility also indicates how it would like to
protect the information provided to DHS.2 It is important to note that the ECIP and SAV
processes are non-regulatory and there are no repercussions from providing the information to
the Federal government. The information needed for the RMI calculation, as set forth in the
preceding sections, is collected using the online secure IST (Figure 8).
The IST is organized into 23 sections for collecting, within a limited time frame, the pertinent
information characterizing the protection, resilience, and consequences of critical infrastructure.
This tool allows the assessor to capture general information about the site visited and to highlight
commendable activities and measures, as well as identify vulnerabilities and provide options for
consideration to improve the protection and resilience of the facility.3
Eight (8) of the 23 sections are specifically used for the RMI calculation:
1. Significant Asset(s) and Area(s);
2. First Preventers/Responders;
3. Natural Hazards;
4. Information Sharing;
5. Security Activity History and Background;
6. Resilience Management Profile;
7. Parking/Delivery/Standoff; and
8. Dependencies.
The detail on how the elements of these 8 IST sections contribute to the RMI organization is
presented in Appendices 2, 3, 4, and 5.
2 Information provided during an ECIP assessment may be protected under the Protected Critical Infrastructure
Information Act and its implementing regulations. See 6 Code of Federal Regulations Section 29, available at
http://www.gpo.gov/fdsys/pkg/CFR-2013-title6-vol1/xml/CFR-2013-title6-vol1-part29.xml. 3 In its 23 sections, the IST captures information for the Protective Measures Index, the Resilience Measurement
Index and the Consequences Measurement Index.

Resilience Measurement Index: An indicator of critical infrastructure resilience
15
Figure 8: Overview of the Infrastructure Survey Tool (IST)
Three main elements allow users to ensure the uniformity and reproducibility of the data
collected:
1. “Helps” and explanations;
2. Training; and
3. Quality Assurance (QA) review.
The IST Helps explain the definition for each question and exactly what it is intended to capture.
PSAs and NG teams are trained not only in how to conduct the visits, including the interviews
with the critical infrastructure owners/operators, but also in how to understand the intent of the
different questions and how they are used to calculate the indices. Information used for the PMI
is collected for the most vulnerable point (weakest fence, entry control, etc.). Questions used for
the RMI capture the elements in place that contribute to the resilience of the facility. Finally, the
information contributing to the CMI is collected for the reasonable worst case scenario (i.e., the
consequences generated by the loss of the facility).

Resilience Measurement Index: An indicator of critical infrastructure resilience
16
The data collected are then verified at both DHS headquarters and Argonne National Laboratory
through a QA review process that comprises six steps:
1. The information is “validated” upon initial submission. An assessor cannot submit the
data about a particular facility until all required questions are answered.
2. An initial QA review is conducted by specially trained DHS or NG analysts who have
direct and immediate access to the questionnaire.
3. A second QA review is conducted by DHS or NG analysts. This second review provides
for an objective assessment of the initial QA, including refinement of the process in case
the methodology was not appropriately followed. The analysts approve or disapprove
changes made during the initial QA review.
4. The PSA then reviews the revised data to approve the changes, to further clarify the
information that will become part of the dashboard and/or assessment report, and to help
maintain consistency in the methodology.
5. After the PSA review, a final QA review is conducted by another round of SMEs. This
final review includes grammatical edits and clarification of any data that were not clearly
understood.
6. A final check is conducted during the development of the RMI (scoring process) from the
raw data to ensure that all the selected elements are properly reflected in the database.
The training, “Helps” and QA processes are an integral part of the larger methodology because
they maintain the reproducibility of the information collected and the products disseminated.
Additionally, verifying the data before producing the index reduces the overall time it takes to
return a final product to the owner/operator.
Beyond its benefits for the end product, the QA process also has several other benefits. The PSA
and NG reviews serve as continual training opportunities that reinforce, over time, a consistent
application of the methodology. The process can also highlight problems that may exist in the
question set. The questions and their potential responses can be reevaluated following
identification of a pattern of errors. Often, questions or Helps are revised to enhance their clarity
and consistency of interpretation.
After the QA review process, the data are stored in an Oracle database, allowing not only for
management and selection of the data that will be used to define the different indices (PMI, RMI,
and CMI), but also for specific studies and metrics evaluating the capabilities of critical
infrastructure in terms of vulnerabilities and resilience.

Resilience Measurement Index: An indicator of critical infrastructure resilience
17
3.3 Calculation of the Resilience Measurement Index
The RMI is based on decision analysis and MAUT. Each component of resilience is decomposed
into its individual subcomponents, which are then organized into five levels of information. The
fifth level of information groups the data that need to be collected to calculate the RMI. 4
The
RMI is defined by the aggregation (roll-up) of several indices characterizing the components and
subcomponents.
Argonne has worked in partnership with DHS and its predecessors over the past ten years to
develop a comprehensive methodology based on the principles of “decision analysis,” an
approach that helps manage risk under conditions of uncertainty (Keeney, 1992; Keeney and
Raiffa, 1976). The methodology uses a numerical representation of a value pattern by comparing
different elements of a facility and by using the relations “better than” and “equal in value to” to
define their relative importance. Another important element in this decision analysis tool is the
transitivity of the ranking. This approach produces a relational representation of a facility’s
protection alternatives by providing a numerical value assignment for each of its components.
The process characterizes a facility with respect to its component properties (e.g., content of the
business continuity plan; presence of alternatives and backup in case of loss of a critical
resource), which results in possible decisions and proposals for different alternatives or measures
to increase resilience. This method helps decision-makers to make choices in the context of a
seemingly complex issue.
A relative weight is assigned for each characteristic that contributes to the overall resilience of
the facility. The weights for a set of components depend on the ranges (worst to best) that are
included as options in the question set. Preferences for the specific values within the ranges of
single components and relative weights have been provided by SMEs and sector/subsector
representatives via a formal elicitation process. The RMI elicitation was completed by three
teams, each containing five SMEs. Each team was asked to define the relative importance of
each component compared to other components at the same level, from the raw data level to the
Level 1 components. The process of assigning weights is best explained by considering a
specific case. As illustrated in Figure 3, the RMI comprises four Level 1 components:
Preparedness, Mitigation Measures, Response Capabilities, and Recovery Mechanisms.
Considering all that comprises each component, the most important5 component is assigned a
rank of 1, the next most important is assigned a rank of 2, and so on. Next, the component ranked
first is assigned a value of 100. The component ranked second is assigned a value less than or
equal to 100, and so on until a value between 0 and 100 is assigned to each Level 1 component.
This logic applies to all levels. Once the SMEs defined the ranks and relative values for a given
set of information, a period of discussion allowed them to exchange and explain the elements
that guided their thinking. On the basis of this discussion, the SMEs could revise the ranks and
relative values. A global relative value is defined for each component on the basis of the
4 For some sections of the RMI, six levels of information exist. Depending on the rollup, the raw data collected with
the IST constitutes Level 3 (e.g., information characterizing alternate site), 4, 5, or 6 of the RMI. 5 Given that all things that comprise each Level 1 component are at their best (i.e., most effective) levels, the most
important Level 1 component is the one that makes the greatest contribution to resilience.

Resilience Measurement Index: An indicator of critical infrastructure resilience
18
responses of the three groups. The same exercise was repeated for each component in the RMI.
Thus, each type of data collected and each element comprising Levels 5 through 1 has been
weighted by the SMEs to represent the relative importance of components and subcomponents
compared with other data in the same groupings, considering their contribution to the overall
resilience of the critical infrastructure analyzed. An illustration of the process for determining the
weights is presented in Appendix 6.
The RMI is defined by the aggregation of its six levels of information. For each component, an
index corresponding to the weighted sum of its components is calculated. This process results in
an overall RMI that ranges from 0 (low resilience) to 100 (high resilience) for the critical
infrastructure analyzed, as well as an index value for each Level 1 through Level 5 component.
This method for characterizing the resilience of a critical infrastructure makes it possible to
consider the specificity of all subsectors and to compare the efficiency of different measures to
enhance resilience in the studied system. An example of the calculation process is presented in
Appendix 7.
The value of the RMI is 0 if the facility does not have any of the elements that contribute to the
index, and 100 if the facility has implemented the best option for all the elements contributing to
the RMI.6 The RMI is an indicator of the degree to which the important elements contributing to
resilience (e.g., business continuity plan, backups and alternatives, and mitigation measures)
have been implemented by a given facility. A value of 0 does not mean that the facility has no
resilient features or that every type of threat will lead to its immediate shutdown. For instance,
there are other elements not captured in the RMI calculation, such as the capabilities of the
emergency services sector that will affect the ultimate consequences to the facility. On the other
hand, an RMI of 100 does not mean that the facility can resist, respond to, and recover from all
types of events. Thus, a 50 can be interpreted as meaning that the resilience value/worth of
elements present at the facility contributes resilience features that, in total, amount to half of the
maximum RMI. However, a value of 50 does not mean that 50% of the elements considered in
the RMI calculation are in place at the facility. Indeed, an RMI of 50 can be obtained in different
ways by combining different components of resilience. If the value of the RMI increases, the
resilience capabilities of the facility in terms of preparedness, mitigation, response, and recovery
are improved.
It is important to note that the RMI is a relative measure. A high RMI does not mean that a
specific event will have minimal consequences. Simply stated, the RMI index allows comparison
of different levels of resilience of critical infrastructure. The scaling of the index7 is such that
improvement from 20 to 40 is equivalent to improvement from 60 to 80. Determining a facility’s
RMI and how different options affect the RMI can be used to determine the most effective ways
to improve a facility’s overall resilience.
6 For Dependencies, the best option is to not be dependent upon any of the eight resources (electric power, natural
gas, communications, information technology, transportation [air, road, rail, maritime, and pipeline], critical
products [chemicals, fuels, raw materials, and byproducts/wastes removal], water, and wastewater discharge
services). A value of 100 for dependencies means that the facility has no dependencies. 7 As determined from elicitations of resilience experts.

Resilience Measurement Index: An indicator of critical infrastructure resilience
19
3.4 Data Display
The comparison of a facility’s RMI value to that of other like facilities allows for an appropriate
analysis of a facility’s resilience and has a role in facility risk management.
While important in terms of the data it represents, without a frame of reference, the value
generated by the index does not convey its full meaning. For instance, without a frame of
reference for similar types of facilities, does an overall RMI value of 41 lead one to believe the
facility is quite resilient? Or possibly lacking key resilience measures? Indeed, this value is
strongly related to a specific type of sector and to the context of a facility’s operating
environment.
An individual index value becomes meaningful when compared with the index values of a set of
similar facilities. Providing the owner/operator of a facility with a detailed analysis of its RMI
and a comparison across other similar facilities is useful because it provides perspective about
where the subject facility stands relative to its peer group.
All the data and levels of information used for the calculation of the RMI, as well as the value of
the RMI and of its four Level 1 components, are presented on an interactive, Web-based tool
called the IST RMI Dashboard. At the top of the Dashboard screen, different tabs allow users to
select, from an Overview, one of the four Level 1 RMI components (Preparedness, Mitigation
Measures, Response Capabilities, and Recovery Mechanisms) or a Brief Review. Figure 9 shows
an example of the Overview Screen.
Figure 9: RMI Dashboard Overview Screen (Illustrative Asset)
The Overview Screen shows five dark blue bars, representing the existing values for the assessed
facility, and five light blue bars, which will change from the existing values to scenario values on
the basis of changes input by the user. The bars on the Overview Screen are for overall RMI and

Resilience Measurement Index: An indicator of critical infrastructure resilience
20
the four Level 1 components of the RMI (Preparedness, Mitigation Measures, Response
Capabilities, and Recovery Mechanisms). Furthermore, the sets of three dots allow the user to
visualize the comparison with other facilities in the same comparison group (e.g., sector,
subsector, segment) that have achieved low, average, and high index values, respectively.
The Dashboard is an interactive tool in that users can change the characteristics of the
components contributing to the RMI and then compare a scenario value to the existing value,
which was assessed during the visit, to see if resilience has improved. The scenario value can be
changed by selecting a tab corresponding to one Level 1 RMI. When a Level 1 component is
selected, four drop-down menus appear on the top of the screen (Figure 10). They allow the user
to select from the components of the RMI, ranging from Level 2 on down to the questions level.
The characteristics of the facility corresponding to the selection made with the drop-down menus
appear in the middle of the screen. The user can choose different characteristics and thus create
the scenario the user wants to test. At the bottom of the screen, the user can see—in real time—
the impacts of component modifications on the overall RMI value, as well as on the components
selected with the drop-down menus.
Figure 10: RMI Dashboard Selections: Planning/Business Continuity Plan/Content/Procedures (Illustrative Asset)

Resilience Measurement Index: An indicator of critical infrastructure resilience
21
In the bottom left area, two bars show the existing and the scenario values for the Overall RMI
and the Level 1 component selected (i.e., preparedness). A gauge below the bars shows the value
of the Level 2 component selected (i.e., Planning). In the bottom right area, a bar graph displays
index values for the existing facility (dark blue), scenario facility (light blue), and sector average
(grey) for the Level 3 component of the Level 2 category. In the middle of the screen, the
dashboard displays the information collected characterizing the Business Continuity Plan
procedures. For instance, the example presented in Figure 10 shows that the plan addresses
“decision process for activation and relocation” (selection of yes appears in dark blue). The plan
does not have any procedure for “plan maintenance,” but the user has tested what the effect
would be of implementing such a procedure on the facility’s preparedness and overall RMI by
selecting yes (selection of yes appears in light blue).
The last type of display available in the RMI Dashboard is the Brief Review, which is illustrated
in Figure 11. This display presents different tables combining the values (facility existing,
facility scenario, sector high, sector average, and sector low) for the two first levels (i.e., Level 1
and Level 2) that constitute the RMI. A drop-down menu allows the user to select the table to
display.
Figure 11: RMI Dashboard’s Brief Review Screen (Illustrative Asset)
The ability to change the parameters, the speed with which users can see the results, and the
possibility for assessing different scenarios all serve to make the RMI Dashboard a very
powerful tool and particularly relevant for helping to manage resilience-related decisions about
critical infrastructure facilities.
Facility-specific RMIs demonstrate the potential effectiveness of measures for a particular
facility. The list of common options identified through comparison with other like facilities is
intended to assist managers in making decisions regarding a site-specific resilience strategy. No
two facilities are alike—each facility’s safety staff and management team must determine the
appropriate combination of measures on the basis of its own assessment of risks, taking into
consideration threat, specific assets to be protected, consequences, overall vulnerability, facility
characteristics, business impacts, return on investment, and overall resilience.
Resilience Measurement Index: An indicator of critical infrastructure resilience
22
The RMI can be used by itself or in combination with other tools or indices for assessing risk at
facility or regional levels.

Resilience Measurement Index: An indicator of critical infrastructure resilience
23
4 Use of the Resilience Measurement Index
The RMI was developed for assessing the capabilities of a facility in terms of resilience. This
indicator can be used:
alone for addressing the resilience of a specific facility;
in combination with other indices (PMI and CMI) to characterize overall risk;
for addressing regional resilience; and
for guiding decisions for special events and domestic incidents.
The RMI, used independently of other indices, identifies the elements currently implemented by
the facility that contribute to resilience (preparedness, mitigation, response, and recovery),
compares these elements with what is typically in place for the same type of facility, and tests
different options for consideration of measures for improving the resilience of the facility.
In the broader context of risk assessment, the RMI can be used in combination with other indices
developed by Argonne National Laboratory, including the PMI and CMI.
Figure 12 shows how the PMI and RMI can be combined to support decision-making by critical
infrastructure owners/operators. It presents the PMI and RMI values for 12 sites.
This type of graph allows users to compare the characteristics of different facilities of the same,
or, in some cases, different types of infrastructure. Site 8, for example, presents a relatively low
PMI and high RMI. This observation may indicate that although the facility has less protection
than others, possibly owing to its location or mission, it has a relatively high resilience. This may
be by design, in that the owners realize there may be little they can do to protect the facility or
prevent an event, so they have decided to place more emphasis on being resilient and responding
Figure 12: Comparison of Resilience and Protective Measures Indices (Illustrative Asset)

Resilience Measurement Index: An indicator of critical infrastructure resilience
24
and recovering as soon as possible. For Site 2, the opposite is true. The relatively high PMI
indicates that the facility has emphasized protection and prevention while expending minimal
effort on resilience. This may be a deliberate decision due to the type of facility, or the PMI and
RMI may identify these qualities to the owner for the first time. Each facility is different and will
mitigate vulnerabilities and implement protective and resilience measures on the basis of an
individualized assessment of risks, taking into consideration threat, operational needs and other
facility characteristics. It is recognized that not all mitigation or protective measures are
appropriate at every facility. Therefore, simply raising the index by adding an item is not
necessarily directly correlated with a reduction in vulnerability or an increase in resilience for a
particular facility unless it is an appropriate measure, properly integrated with the facility's
current security and operational posture, and effectively implemented. PMIs or RMIs indicate
common protective and resilience measures in place at other like facilities. Dashboard
comparisons draw attention to facility security and resilience components that are below the
subsector average and, therefore, facility management may want to investigate ways to enhance
protective or resilience measures in those areas. There may be very good reasons why a facility
will have a component PMI or RMI that is low. For instance, at an urban facility, where parking
is allowed on the street and hence the parking standoff distance is small, the facility would
simply make note of the vulnerability, which is under the control of the local government, and
consider other protective measures enhancements (e.g., additional closed-circuit television along
the facility street-side to identify suspicious vehicles). In terms of resilience, another example
might be a facility, such as a hotel, hospital or arena that is not able to maintain an alternative
location.
For a given threat type, the risk at a site depends on (i) the threat likelihood, (ii) the site’s
vulnerability (the likelihood that the threat event will be successful), and (iii) the magnitude of
the consequences of a successful threat event. Increased resilience factors into this risk
determination by decreasing the magnitude of consequences. The RMI can therefore be used in
conjunction with other indices for risk assessment. The PMI provides a measure of vulnerability
and the CMI provides a measure of the gross (absent any resilience measures) consequences of a
successful attack at a site. The RMI can be used to modify the level of consequences to provide a
measure of the net consequences at a site due to its resilience measures. Furthermore, for man-
made threat events, the threat likelihood should be modified by the consequences at the sites that
might be attacked so as to obtain an overall assessment of site risk (see Phillips et al., 2012).
Hence, the RMI, together with the other indices, provides a comprehensive representation of
infrastructure risk.
Even if the RMI is primarily used at the facility level, this indicator is also an important part of
other DHS programs that address regional resilience. The Regional Resilience Assessment
Program (RRAP), unlike the IST or SAV, is not centered on a specific critical infrastructure
facility or asset (Department of Homeland Security, 2013c). Rather, this program provides an
analysis of the level of protection and resilience of critical infrastructure in a given geographic
area, subsector, or system. These facilities may be related through geographic proximity,
physical outputs, telecommunication/information technology relationships, or other
characteristics. By using the RMI along with additional tools such as Restore© and EPFast
(Argonne National Laboratory, 2013; Portante et al., 2011), the RRAP identifies gaps in
resilience components and provides resilience enhancement options to increase the resilience of
Resilience Measurement Index: An indicator of critical infrastructure resilience
25
the region, sector or system and offers a more detailed risk picture within the focus area of the
RRAP.
The RMI is also a major component of the Special Event/Domestic Incident Tracker (SEDIT).
SEDIT takes a regional approach; it is used not only as a steady-state planning tool, but also for
impending special events or domestic incidents in which real-time actions must be taken. This
tool is used during the advance warning period for a natural hazard, such as a hurricane, or for a
special event, such as a major sporting event, and for planning scenarios such as annual flooding.
These events can generate increased risk for critical infrastructure and may require the
establishment of new protective or resilience measures for the duration of the events or to
increase awareness of infrastructure protection and resilience components when implementing
response and recovery activities. SEDIT allows PSAs to take into account real-time threat
information and existing facility security and resilience stature, as well as temporary measures as
they are put in place, and to analyze their impact on the overall risk of the event.
All of the developed indices provide information that assist owners/operators in developing a
risk-based picture that identifies facility gaps and aids in making informed decisions concerning
the protection and resilience of their facility. The RMI is specifically used to assist critical
infrastructure owners/operators in (1) analyzing existing response and recovery methods and
programs at facilities and (2) identifying potential ways to increase resilience.

Resilience Measurement Index: An indicator of critical infrastructure resilience
26
This page intentionally left blank.

Resilience Measurement Index: An indicator of critical infrastructure resilience
27
5 Methodology Advantages and Limitations
The decision analysis methodology used to define the RMI was specifically developed to
integrate the major elements necessary to assess the resilience of critical infrastructure. The
methodology integrates not only response and recovery elements that are traditionally part of
resilience analysis methodologies but also operational elements, such as business continuity,
emergency management, and dependencies/interdependencies. The weighted values of the index
are based on a general resilience measure framework, which, through consistent application,
allows for an index that is suitable for all infrastructure sectors and subsectors.
By organizing the resilience components into different levels of information and by ranking the
relative importance of these components in terms of preparedness, mitigation, response,
recovery, and ultimately resilience, the methodology also ensures reproducible results.
Furthermore, by defining a consistent index for resilience measures, owners and operators can
compare different assets in the same sector, and oversight or coordinating bodies can formulate
regional and sector emergency planning including preparedness, mitigation, response, and
recovery. These comparisons also highlight differences in the way sectors approach resilience.
The RMI index allows comparison between critical infrastructure assets but also characterization
of most effective measures for improving resilience. The RMI Dashboard lends additional
significance to that value and what it means for a facility’s overall resilience posture. The RMI
Dashboard allows owners and operators to take the information that emerges from calculating
the indices and use it for day-to-day operations, as well as investment justification and strategic
planning. A sound resilience assessment methodology is useless if critical infrastructure owners
and operators see little or no reason to use it.
Finally, the flexibility of the methodology allows it to be used in different programs developed
by DHS to assess the resilience of an area or the risk related to a special event. It allows for
reproducible results, comparison of critical infrastructure resilience derived from consistent
methods, and a flexible approach that can be augmented to fit the individual needs of sectors,
subsectors, regions, or systems. This methodology also allows DHS to capture a more accurate
overall picture of the resilience of the Nation’s critical infrastructure.
Although the RMI has many advantages, it also presents some limitations. These limitations are
not directly related to the process of calculation or to the RMI organizational structure. The
notions of preparedness, mitigation, response, and recovery are well understood in the field of
risk and emergency management. Furthermore, MAUT and decision analysis concepts have
become standard in the domain of risk assessment and management; see, for example, the
Decision Analysis and Risk Specialty Group of the Society for Risk Analysis (SRA, 2013). The
main limitations of this tool relate to the interpretation or use of the collection tool and associated
index. First, with regards to the interpretation of the value defined with the RMI, it is important
to remember that the RMI is a relative indicator of critical infrastructure resilience based on
information collected in 4 to 8 hours. Since data collection is a voluntary program, the time taken
at the facility to answer all of the RMI questions in detail is always a factor. In addition, since the
RMI must be applicable across all infrastructure sectors, the assessor’s knowledge of a specific

Resilience Measurement Index: An indicator of critical infrastructure resilience
28
facility’s technical and operational functions is also a factor. However, the reproducibility of the
process is ensured via the training of assessors and by the QA process. Second, the RMI
characterizes resilience at a specific facility. RMI values defined for different facilities cannot
directly be used to determine the resilience of a specific region or a given sector. The RMI of
different assets in a region give an indication of the resilience of the region but other elements
characterizing the region (e.g., population, economy, environment, institutional services) also
affect regional resilience.
The RMI should be used as part of an overall risk management program. It provides important
information about the resilience of a given facility and how that facility compares to another
similar facility. Other factors such as location, specific vulnerabilities, and a cost-benefit analysis
should also be utilized to ensure that a complete resilience picture is realized.

Resilience Measurement Index: An indicator of critical infrastructure resilience
29
6 Conclusion
In 2011, Presidential Policy Directive 8 (Department of Homeland Security, 2011) underscored
national preparedness for strengthening the security and resilience of the Nation. It promoted an
all-hazards approach based on the definition of core capabilities necessary to be better prepared.
It also reaffirmed the shared responsibility of all levels of government, the private sector, and
individual citizens in the Nation for preparedness. Critical infrastructure is directly mentioned in
the document for two specific types of capabilities: protection, which refers to the “necessity to
secure the homeland against acts of terrorism and manmade or natural disasters,” and
mitigation, which is the “necessity to reduce loss of life and property by lessening the impact of
disasters.” In 2013, Presidential Policy Directive 21 (White House, 2013) has reinforced the
need to address the security and resilience of critical infrastructure in an integrated, holistic
manner to reflect interconnectedness and interdependency. This directive states that critical
infrastructure must be secure and able to withstand and rapidly recovery from all hazards. It
particularly stresses physical and cyber threats and required efforts to reduce vulnerabilities,
minimize consequences, identify and disrupt threats, and hasten response and recovery efforts.
The development of the RMI is directly aligned with this need to address the capabilities of
critical infrastructure in terms of resilience. The RMI is intended to assist DHS in analyzing the
resilience of the Nation’s critical infrastructure and identifying ways to improve it. The RMI
provides valuable information to critical infrastructure facility owners/operators about their
standing relative to similar sector assets and about various ways to enhance resilience.
Applications and uses of the RMI for DHS programs continue to evolve, and concept
improvements and additional enhancements and approaches are expected. Combining the RMI
with other indices (PMI and CMI) provides additional benefits, including allowing for an overall
view of risk. The objective is to develop better decision-making tools that facilitate comparison
of critical infrastructure and promote a proactive approach to improving preparedness,
protection, mitigation, response, and recovery capabilities.
Resilience Measurement Index: An indicator of critical infrastructure resilience
30
This page intentionally left blank.

Resilience Measurement Index: An indicator of critical infrastructure resilience
31
7 References
Argonne National Laboratory, 2013, Restore©: Modeling Interdependent Repair/Restoration
Processes, available at http://www.dis.anl.gov/projects/restore.html.
ASIS, 2009, The Organizational Resilience Standard [ASIS SPC.1-2009], available at
http://organizational-resilience.com/OrganizationalResilienceStandard.htm.
BSI, 2010, BS 25999 Business Continuity, available at http://www.bsiamerica.com/en-
us/Assessment-and-Certification-Services/Management-systems/Standards-and-Schemes/BS-
25999/.
Carlson, L., G. Bassett, W. Buehring, M. Collins, S. Folga, B. Haffenden, F. Petit, J. Phillips,
D. Verner, and R. Whitfield, 2012, Resilience Theory and Applications, Argonne National
Laboratory, Decision and Information Sciences Division, ANL/DIS-12-1, Argonne, IL, USA.
Department of Homeland Security, 2010a, Quadrennial Homeland Security Review Report:
A Strategic Framework for a Secure Homeland (February), Washington, D.C., available at
http://www.dhs.gov/xlibrary/assets/qhsr_report.pdf.
Department of Homeland Security, 2010b, DHS Risk Lexicon – 2010 edition, Washington, D.C.,
available at http://www.dhs.gov/xlibrary/assets/dhs-risk-lexicon-2010.pdf.
Department of Homeland Security, 2011, Presidential Policy Directive/PPD-8: National
Preparedness, Washington, D.C., available at http://www.dhs.gov/presidential-policy-directive-
8-national-preparedness.
Department of Homeland Security, 2013a, Protected Critical Infrastructure Information (PCII)
Program, Washington, D.C., available at http://www.dhs.gov/protected-critical-infrastructure-
information-pcii-program.
Department of Homeland Security, 2013b, Site Assistance Visits, Washington, D.C., available at
http://www.dhs.gov/site-assistance-visits.
Department of Homeland Security, 2013c, Regional Resiliency Assessment Program,
Washington, D.C., available at http://www.dhs.gov/regional-resiliency-assessment-program.
Federal Emergency Management Agency, 2013, The Voluntary Private Sector Preparedness
Program―PS-Prep™ & Small Business Preparedness, Washington, D.C., available at
http://www.fema.gov/ps-preptm-voluntary-private-sector-preparedness.
Fisher, R.E., W.A. Buehring, R.G. Whitfield, G.W. Bassett, D.C. Dickinson, R.A. Haffenden,
M.S. Klett, and M.A. Lawlor, 2009, Constructing Vulnerability and Protective Measures Indices
for the Enhanced Critical Infrastructure Protection Program, Argonne National Laboratory,
Decision and Information Sciences Division, ANL/DIS-09-4, Argonne, IL, USA.
Resilience Measurement Index: An indicator of critical infrastructure resilience
32
Fisher, R.E., G.W. Bassett, W.A. Buehring, M.J. Collins, D.C. Dickinson, L.K. Eaton,
R.A. Haffenden, N.E. Hussar, M.S. Klett, M.A. Lawlor, D.J. Miller, F.D. Petit, S.M. Peyton,
K.E. Wallace, R.G. Whitfield, and J.P. Peerenboom, 2010, Constructing a Resilience Index for
the Enhanced Critical Infrastructure Protection Program, Argonne National Laboratory,
Decision and Information Sciences Division, ANL/DIS-10-9, Argonne, IL, USA.
ISO, 2012, ISO 22301:2012 – Societal Security – Business Continuity Management Systems –
Requirements, available at http://www.iso.org/iso/catalogue_detail?csnumber=50038.
Keeney, R.L., 1992, Value-Focused Thinking: A Path to Creative Decision-making, Harvard
University Press, Cambridge, MA.
Keeney, R.L., and H. Raiffa, 1976, Decisions with Multiple Objectives: Preferences and Value
Tradeoffs, John Wiley and Sons, New York.
NFPA, 2010, NFPA 1600-Standard on Disaster/Emergency Management and Business
Continuity Programs-2010 Edition, NFPA, Quincy, MA, USA, 52 p., available at
http://www.nfpa.org/assets/files/pdf/nfpa16002010.pdf.
NIAC, 2009, Critical Infrastructure Resilience, Final Report and Recommendations,
U.S. Department of Homeland Security, Washington, D.C., available at
http://www.dhs.gov/xlibrary/assets/niac/niac_critical_infrastructure_resilience.pdf.
Petit, F., L. Eaton, R. Fisher, S. McAraw, and M. Collins, 2012, Developing an Index to Assess
the Resilience of Critical Infrastructure, International Journal of Risk Assessment and
Management (IJRAM), Inderscience Publishers, Geneva, Switzerland, Vol. 16, Nos. 1/2/3,
pp. 28–47.
Petit, F., R. Fisher, W. Buehring, R. Whitfield, and M. Collins, 2011, Protective Measures and
Vulnerability Indices for the Enhanced Critical Infrastructure Protection Program, International
Journal of Critical Infrastructures (IJCIS), Inderscience Publishers, Geneva, Switzerland, Vol. 7,
No. 3, pp. 200–219.
Phillips, J.A., G.W. Bassett, W.A. Buehring, J.L. Carlson, R.G. Whitfield, and J.P. Peerenboom,
2012, A Framework for Assessing Infrastructure Risk, M4-I Resilience Evaluation Approaches
for the Analysis of Complex Systems, Risk Analysis: Advancing Analysis, Society for Risk
Analysis, 2012 Annual Meeting, San Francisco, CA, 9–12 December.
Portante, E.C., B.A. Craig. L.T. Malone, J.A. Kavicky, S.F. Folga, and S. Cedres, 2011, EPFast:
A Model for Simulating Uncontrolled Islanding in Large Power Systems, Proceedings of the
2011 Winter Simulation Conference (WSC), Phoenix, AZ, pp. 1758–1769.
SRA, 2013, Decision Analysis and Risk Specialty Group, available at http://www.sra.org/darsg.

Resilience Measurement Index: An indicator of critical infrastructure resilience
33
White House, 2013, Presidential Policy Directive -- Critical Infrastructure Security and
Resilience, PPD-21, Washington. DC, available at http://www.whitehouse.gov/the-press-
office/2013/02/12/presidential-policy-directive-critical-infrastructure-security-and-resil.

Resilience Measurement Index: An indicator of critical infrastructure resilience
34
This page intentionally left blank.

35
Resilien
ce Measu
remen
t Index
: An in
dicato
r of critical in
frastructu
re resilience
Appendix 1: Resilience Measurement Index Structure

Resilience Measurement Index: An indicator of critical infrastructure resilience
36
This page intentionally left blank.

37
Resilien
ce Measu
remen
t Index
: An in
dicato
r of critical in
frastructu
re resilience
Appendix 2: Preparedness Components
Level 1 Level 2 Level 3 Level 4 IST Sections
Preparedness
Awareness
Resilience Operations
Business Continuity Manager
Emergency Management Manager
Information Technology Manager
QU
ES
TIO
NS
Resilience Management Profile
Dependencies Information Technology
Information Sharing General Information Sharing
Information Technology Management Dependency
Information Sharing
Resilience Management Profile
Dependencies Information Technology
Planning
New Planning Measures
Planning and Preparedness Security Activity History
and Background
Business Continuity Plan
Characteristics
Training/Exercises
Content
Resilience Management Profile
Emergency Operation/Emergency Action Plan
Characteristics
Training/Exercises
Content
Resilience Management Profile
Cyber Plan
Characteristics
Training/Exercises
Content
Dependencies Information Technology
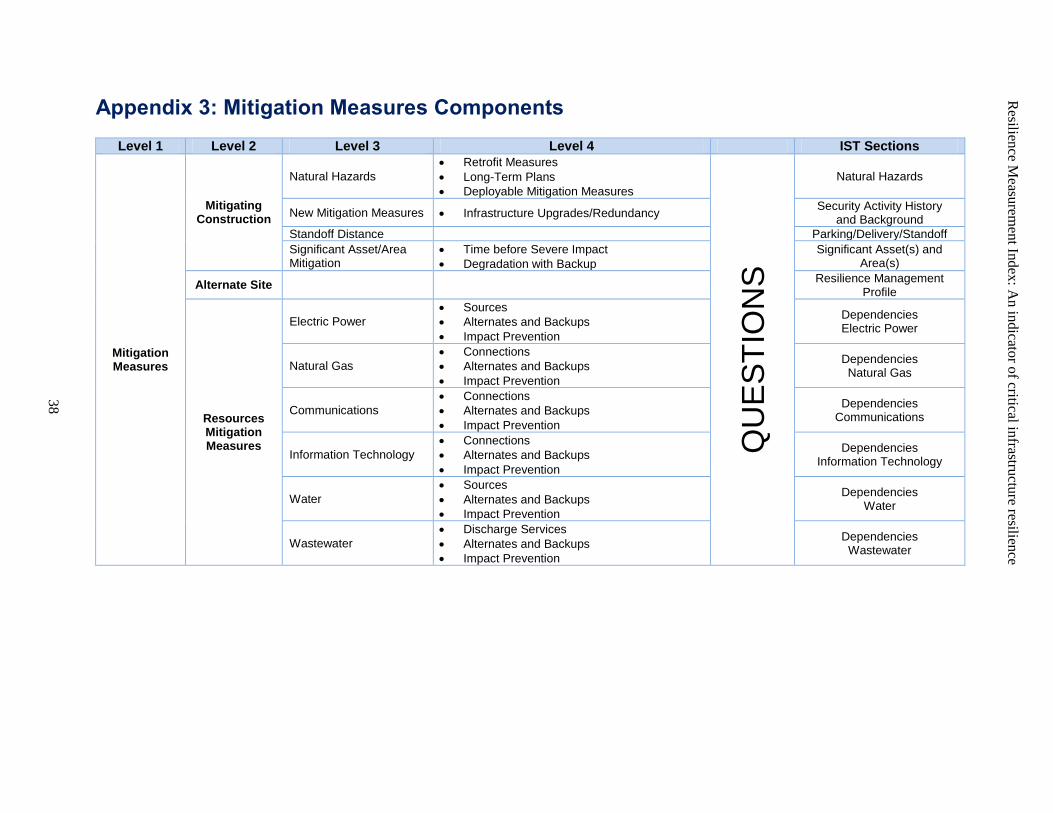
38
Resilien
ce Measu
remen
t Index
: An in
dicato
r of critical in
frastructu
re resilience
Appendix 3: Mitigation Measures Components
Level 1 Level 2 Level 3 Level 4 IST Sections
Mitigation Measures
Mitigating Construction
Natural Hazards
Retrofit Measures
Long-Term Plans
Deployable Mitigation Measures
QU
ES
TIO
NS
Natural Hazards
New Mitigation Measures Infrastructure Upgrades/Redundancy Security Activity History
and Background
Standoff Distance Parking/Delivery/Standoff
Significant Asset/Area Mitigation
Time before Severe Impact
Degradation with Backup
Significant Asset(s) and Area(s)
Alternate Site Resilience Management
Profile
Resources Mitigation Measures
Electric Power
Sources
Alternates and Backups
Impact Prevention
Dependencies Electric Power
Natural Gas
Connections
Alternates and Backups
Impact Prevention
Dependencies Natural Gas
Communications
Connections
Alternates and Backups
Impact Prevention
Dependencies Communications
Information Technology
Connections
Alternates and Backups
Impact Prevention
Dependencies Information Technology
Water
Sources
Alternates and Backups
Impact Prevention
Dependencies Water
Wastewater
Discharge Services
Alternates and Backups
Impact Prevention
Dependencies Wastewater

39
Resilien
ce Measu
remen
t Index
: An in
dicato
r of critical in
frastructu
re resilience
Appendix 3: Mitigation Measures Components (Cont.)
Level 1 Level 2 Level 3 Level 4 IST Sections
Mitigation Measures (Cont.)
Resources Mitigation Measures
(Cont.)
Transportation
Rail Alternates and
Backups
Impact Prevention
QU
ES
TIO
NS
Dependencies Transportation
Air Alternates and
Backups
Impact Prevention
Road Alternates and
Backups
Impact Prevention
Maritime Alternates and
Backups
Impact Prevention
Pipeline Alternates and
Backups
Impact prevention
Critical Products
Chemicals Alternates and
Backups
Impact Prevention
Dependencies Critical Products
Fuels Alternates and
Backups
Impact Prevention
Byproducts/Wastes Alternates and
Backups
Impact Prevention
Raw Materials Alternates and
Backups
Impact Prevention

Resilience Measurement Index: An indicator of critical infrastructure resilience
40
This page intentionally left blank.

41
Resilien
ce Measu
remen
t Index
: An in
dicato
r of critical in
frastructu
re resilience
Appendix 4: Response Capabilities Components
Level 1 Level 2 Level 3 Level 4 IST Sections
Response Capabilities
Onsite Capabilities
New Response Measures
Communications and Notification
Incident Response
QU
ES
TIO
NS
Security Activity History and Background
Incident Management Capabilities
Immediate Onsite Response
Significant Onsite Response
Resilience Management Profile
Offsite Capabilities
First Preventers/Responders Interaction
Written MOU/MOA
Onsite Visits
Communications
First Preventers/Responders
Resource Service Level Agreements
Contingency/Business Continuity Plans (Electric Power, Natural Gas, Communications, Information Technology, Critical Products, Water, Wastewater)
Dependencies
Equivalent Number of Dependencies
Dependencies
Incident Management & Command Center (IMCC) Characteristics
Local Emergency Operation Center Involvement
Resilience Management
Profile
Facility IMCC Characteristics
Primary IMCC
Backup IMCC
Resilience Management Profile

Resilience Measurement Index: An indicator of critical infrastructure resilience
42
This page intentionally left blank.

43
Resilien
ce Measu
remen
t Index
: An in
dicato
r of critical in
frastructu
re resilience
Appendix 5: Recovery Mechanisms Components
Level 1 Level 2 Level 3 Level 4 IST Sections
Recovery Mechanisms
Restoration Agreements
Information Sharing
MOU/MOA Existence
MOU/MOA Activation
After-Action Reporting
QU
ES
TIO
NS
Information Sharing
Resources Restoration Agreements
Provider Priority Plan for Restoration (Electric Power, Natural Gas, Communications, Information Technology, Transportation, Critical Products, Water, Wastewater)
Dependencies
Recovery Time
Significant Asset/Area Recovery
Time to Recover
Specialized Materials
Significant Asset(s) and Area(s)
Resources Recovery
Time before Full Resumption of Operations (Electric Power, Natural Gas, Communications, Information Technology, Transportation, Critical Products, Water, Wastewater)
Dependencies

Resilience Measurement Index: An indicator of critical infrastructure resilience
44
This page intentionally left blank.

Resilience Measurement Index: An indicator of critical infrastructure resilience
45
Appendix 6: Illustration of Weight Determination8
The RMI is defined by the aggregation of six levels of information9. Each type of data collected
and each element comprising Levels 6 through 1 have been weighted by a SME to represent the
relative importance of components and subcomponents compared with other data in the same
groupings, by considering their contribution to the overall resilience of critical infrastructure.
The weights for a set of components depend on the ranges (worst to best) of each component
compared with others in the same set. The weights represent a general sector (or subsector) and a
general threat. For example, seven elements are considered for defining the type of exercises that
can be used for the business continuity plan:
Tabletop with and without external responders;
Functional with and without external responders;
Full-scale with and without external responders; and
Post-exercise/event analysis.
Table A1 presents the ranks and relative importance defined by three teams of SMEs for these
seven elements during the elicitation process.
Table A1: Ranks and Relative Importance Defined by SMEs for the Business Continuity Plan Exercises Components
Team 1
Team 2
Team 3
Type of Exercise Rank
Relative
Importance
Rank Relative
Importance
Rank Relative
Importance
Tabletop (practical or simulated
exercise)―does not include external responders.
7 20 7 40 6 60
Tabletop―includes external responders.
6 30 5 50 5 65
Functional (walk-through or specialized exercise)―does not include external responders.
5 50 5 50 4 75
Functional―includes external responders.
4 60 4 60 2 95
Full-scale (simulated or actual event)―does not include external responders.
2 80 2 80 3 90
Full-scale―includes external responders.
1 100 1 100 1 100
Exercise or actual event results are documented; corrective actions are identified and reported to executive management.
2 80 2 80 7 30
8 This appendix demonstrates the arithmetic of the calculation. Values are shown to several decimal places to allow
the reader to follow the calculation. Use of one or more significant figures does not imply accuracy at the same
level. 9 For some sections of the RMI, six levels of information exist. Depending on the rollup, the raw data collected with
the IST constitutes Level 3 (e.g., information characterizing alternate site), 4, 5, or 6 of the RMI.

Resilience Measurement Index: An indicator of critical infrastructure resilience
46
All teams agree that the most important element in terms of resilience is the realization of full-
scale exercises in partnership with external responders. Full-scale exercise without external
responders is ranked second by two of the teams and third by team 3, which prefers functional
exercises with external responders. The main difference among the three teams is the relative
importance of the post-exercise/event analysis, which is ranked second by teams 1 and 2 and
seventh by team 3. Values vary from 20 to 100 for team 1, 40 to 100 for team 2, and 30 to 100
for team 3. Team 3 assigns relatively close values except for the one defined for post-
exercise/event analysis, which is lower, with a relative importance of 30.
Once the SME teams have defined the ranks and relative values for a given set of information, a
period of discussion allows them to exchange and explain the elements that guided their
thinking. On the basis of this discussion, the SMEs can review the ranks and relative values
defined. On the basis of the values and ranks, a global relative value is defined for each
component. Table A2 presents the overall relative importance defined for the seven elements
characterizing the business continuity plan exercises.
Table A2: Notional Relative Importance Obtained for the Business Continuity Plan Exercises Components
Type of exercise Rank Relative Importance
Tabletop (practical or simulated exercise)―does not include external responders.
7 38.3
Tabletop―includes external responders. 6 46.9
Functional (walk-through or specialized exercise)―does not include external responders.
5 57.2
Functional―includes external responders. 4 70.1
Full-scale (simulated or actual event)―does not include external responders.
2 82.9
Full-scale―includes external responders. 1 100
Exercise or actual event results are documented; corrective actions are identified and reported to executive management.
3 74.3
In terms of final ranking and relative importance values, a full-scale exercise with first
responders is still the most important component of this grouping, with a rank of one and a value
of 100. The least important element, in comparison with others in the grouping, is the tabletop
exercise without external responders, with a value of 38.3. The global relative importance values
are not a direct average of the values defined by the SMEs; they integrate the ranking and then
the relative importance of each element. For example, the relative importance for the post-
exercise/event analysis is not 63.33, which corresponds to the average of the values defined by
the SMEs, but 74.3, which incorporates the fact that two teams of SMEs ranked this element
second.

Resilience Measurement Index: An indicator of critical infrastructure resilience
47
When the relative importance of each element in a set is defined, the weights can be calculated
by using a cross multiplication. The weights vary between 0 and 1, and must add to 1 in a given
set. Table A3 presents the overall weights for the seven elements characterizing the business
continuity plan exercises.
Table A3: Notional Weights Obtained for the Business Continuity Plan Exercises Components
Level 6 Component Rank Relative Importance Weight*
Tabletop (practical or simulated exercise)―does not include external responders.
7 38.3 0.131
Tabletop―includes external responders.
6 46.9 0.161
Functional (walk-through or specialized exercise)―does not include external responders.
5 57.2 0.196
Functional―includes external responders.
4 70.1 0.241
Full-scale (simulated or actual event)―does not include external responders.
2 82.9 0.285
Full-scale―includes external responders.
1 100 0.343
Exercise or actual event results are documented; corrective actions are identified and reported to executive management.
3 74.3 0.255
Sum: 291.3 1
* In discussions of the RMI, several decimal places are shown to allow the audience to follow the arithmetic, if desired, and clarify the methodology. These are not meant to imply a high degree of precision or confidence in the value judgments elicited from SMEs or related resilience estimates.
Some options in the type of exercises are mutually exclusive. For example, a tabletop exercise
cannot be conducted both with and without external responders. Therefore, exercises without
external responders, which have lower relative importance than exercises with external
responders, are not considered for defining the sum of the relative importance. Thus, the relative
importance of exercises with external responders and post-exercise/event analysis are added to
define the overall sum that is used for calculating the weights. Indeed, the weights of these
elements add to one.
The same exercise is repeated for each component of the RMI. Table A4 presents the overall
weights obtained for the Level 1 components of the RMI.

Resilience Measurement Index: An indicator of critical infrastructure resilience
48
Table A4: Notional Weights Obtained for the RMI Level 1 Components
Level 1 Component Rank Relative Importance Weight
Preparedness 1 100 0.315
Mitigation Measures 2 92.5 0.291
Response Capabilities 3 75 0.236
Recovery Mechanisms 4 50 0.158
Sum: 317.5 1
The most important contributor to the overall RMI is Preparedness, with a relative importance of
100, followed by Mitigation Measures (92.5), Response Capabilities (75), and Recovery
Mechanisms (50).
The weights defined by the SMEs are used for the calculation of the RMI. The calculation
process is adaptive. The methodology considers the characteristics of the facility and its
environment. During the calculation process, the weights of the natural hazards and
dependencies sections are automatically adjusted if the facility is not susceptible to a hazard or if
it is not dependent on a specific resource (electric power, natural gas, communications,
information technology, water, wastewater, critical products, and transportation) considered in
the calculation. For example, if the facility is not in an area where hurricanes usually occur, the
weight for hurricanes in the calculation is given a value of 0, and the weights of other natural
hazards are adjusted on the basis of their relative importance as defined by the SMEs.

Resilience Measurement Index: An indicator of critical infrastructure resilience
49
Appendix 7: Example of Calculation Rollup10
The RMI is an aggregation of information from questions answered during a facility visit to
create an overall index. The information is collected using yes/no questions; the element is
present or not. For the calculation, if a specific element is present or if the answer to a question is
“Yes,” this element is given a value of 100. If the element is not present or if the answer to a
question is “No,” this element is given a value of 0. Table A5 presents an example of this
calculation for business continuity plan exercises.
Table A5: Business Continuity Plan Exercises Index (Illustrative Asset)
Business Continuity Plan Exercises
Components - Level 6 Answer Value Level 6 Weight
Weighted Index
Tabletop (practical or simulated exercise)―does not include external responders.
Yesa 100 0.131 13.1
Tabletop―includes external responders. Nob 0 0.161 0
Functional (walk-through or specialized exercise)―does not include external responders.
Yes 100 0.196 19.6
Functional―includes external responders. No 0 0.241 0
Full-scale (simulated or actual event)―does not include external responders.
No 0 0.285 0
Full-scale―includes external responders. No 0 0.343 0
Exercise or actual event results are documented; corrective actions are identified and reported to executive management.
Yes 100 0.255 25.5
Level 5 Business Continuity Plan Exercises Index (BCPEI) Value: 58.2 a Yes means that the element is implemented and it is given a numerical value of 100.
b No means that the element is not implemented and it is given a numerical value of 0.
Collected data are aggregated to define a Business Continuity Plan Exercises Index (BCPEI), a
Level 5 component of the RMI, by using Equation 1:
Za i
7
1ii
BCPEI (1)
where:
BCPEI = Business Continuity Plan Exercises Index, Level 5 (ranging from 0 to 100);
10
This appendix demonstrates the arithmetic of the calculation. Values are shown to several decimal places to allow
the reader to follow the calculation. Use of one or more significant figures does not imply accuracy at the same
level.

Resilience Measurement Index: An indicator of critical infrastructure resilience
50
ai = scaling constant (weight) indicating the relative importance of possibility i
(i = 1, 2, 3, 4, 5, 6, 7) for business continuity plan exercises; and
Zi = value of component i of business continuity plan exercises
(0, if not present, or 100, if present).
The facility in the example exercises its business continuity plan once a year using tabletop and
functional exercises, neither of which includes external responders. There is also a procedure for
post-exercise/events analysis. In Equation 1, the weighted values of the questions answered
affirmatively are combined to give the facility an overall BCPEI of 58.2 (Table A5).
Level 5 Components are aggregated into Level 4 components, which represent the main
characteristics of the facility studied, such as its individual dependencies and its emergency and
continuity plans. For example, the business continuity plan exercises component, Level 5, is one
component of the Level 4 business continuity plan training/exercises component (Table A6).
Table A6: Business Continuity Plan Training/Exercises Index (Illustrative Asset)
Business Continuity
Plan Training/Exercises Components - Level 5 Level 5 Index
Level 5 Weight
Weighted Index
Training 36.3 0.451 16.37
Exercises 58.2 0.549 31.95
Level 4 Business Continuity Plan Training/Exercises Index (BCPTEI) Value: 48.32
On the basis of the Level 5 weights, exercising the business continuity plan on an annual basis
(weight of 0.549) is more important than the training of personnel (weight of 0.451). The facility
in the example has procedures to train all personnel on the business continuity plan, but only at
initial employment.
Level 5 components are combined to create a Level 4 index. The Business Continuity Plan
Training/Exercises Index (BCPTEI) (Level 4) is obtained by using Equation 2:
Yb i
2
1ii
BCPTEI (2)
where:
BCPTEI = business continuity plan training/exercises index, Level 4
(ranging from 0 to 100);
bi = scaling constant (weight) indicating the relative importance of possibility i
(i = 1,2) for business continuity plan training/exercises; and
Yi = value of component i of business continuity plan training/exercises.

Resilience Measurement Index: An indicator of critical infrastructure resilience
51
The relative importance (weight) of BCPEI is 0.549. By multiplying the value of the BCPEI
(58.2) by its weight, we obtain a weighted BCPEI value of 31.95. This value is added to the other
weighted index that constitutes the Business Continuity Plan Training/Exercises component
(Level 4) to obtain an overall BCPTEI of 48.32 (Table A6).
Level 4 components are aggregated to define Level 3 components. This level represents the main
characteristics of the facility studied, such as its individual dependencies and its emergency and
continuity plans. For example, the business continuity plan training/exercises variable, Level 4,
is one component of the Level 3 business continuity plan variable (Table A7).
Table A7: Business Continuity Plan Index (Illustrative Asset)
Business Continuity Plan Components - Level 4 Level 4 Index
Level 4 Weight
Weighted Index
Business Continuity Plan Characteristics 62.14 0.238 14.80
Business Continuity Plan Training/Exercises 48.32 0.381 18.41
Business Continuity Plan Content 73.28 0.381 27.92
Level 3 Business Continuity Plan Index (BCPI) Value: 61.13
On the basis of the Level 4 weights, the content of the business continuity plan and the
training/exercises procedures (weight of 0.381) are the most important components contributing
to the Business Continuity Plan Index (BCPI). The characteristics of the plan (level of
development, senior management approval, access to the plan, and coordination with
stakeholders) are slightly less important, with a weight of 0.238. The facility in the example has
a business continuity plan developed at the facility level and approved by senior management,
and key personnel are aware of and have access to a copy of the plan. The facility has a robust
business continuity plan that only lacks specific interim and long-term mitigation measures as
well as specific measures regarding the dependencies and potential impact on the facility
environment.
The BCPI (Level 3) is obtained by using Equation 3:
Xc i
3
1ii
BCPI (3)
where:
BCPI = Business Continuity Plan Index, Level 3 (ranging from 0 to 100);
ci = scaling constant (weight) indicating the relative importance of possibility i
(i = 1,2,3) for business continuity plan; and
Xi = value of component i of business continuity plan.
The relative importance (weight) of BCPTEI is 0.381. By multiplying the value of BCPTEI
(48.32) by its weight, we obtain a weighted BCPTEI value of 18.41. This value is added to the

Resilience Measurement Index: An indicator of critical infrastructure resilience
52
other weighted indices for the other two components (Business Continuity Plan Characteristics
and Business Continuity Plan Content) that constitute Business Continuity Plan (Level 3) to
obtain an overall BCPI of 61.13 (Table A7).
Level 3 components are aggregated to define Level 2 components. Level 2 components represent
the key contributors to preparedness, mitigation measures, response capabilities, or recovery
mechanisms. Categories such as awareness and planning are Level 2 components of
Preparedness. Business Continuity Plan is one of the four Level 3 components that are
aggregated to form the planning subcomponent of preparedness (Table A8).
Table A8: Planning Index (Illustrative Asset)
Planning Components - Level 3 Level 3 Index
Level 3 Weight
Weighted Index
New Planning Measures 0 0.167 0.00
Business Continuity Plan 61.13 0.282 17.24
Emergency Operation/Emergency Action Plan 58.7 0.305 17.90
Cyber Plan 58.4 0.246 14.37
Level 2 Planning Index (PlI) Value: 49.51
On the basis of the Level 3 weights, the emergency operation/emergency action plan (weight of
0.305) is the most important component contributing to the Planning Index. Less important are
the new planning measures, which consider the implementation of new planning measures in the
last year (weight of 0.167). The relative importance of having a business continuity plan and a
cyber-plan are intermediate, with respective weights of 0.282 and 0.246. The facility in the
example did not implement new planning measures in the last year. There is an emergency
operation/emergency action plan, developed at the facility level and approved by senior
management. Key personnel are aware of and have access to a copy of the plan. All personnel
are trained at initial employment on the plan and functional exercises are realized once a year
with external responders. However, this plan lacks specific procedures for man-made hazards
such as a terrorism event, active shooter or bomb threat. The facility also has a cyber-plan. Like
the other types of plans, the facility cyber plan has been developed at the facility level and
approved by senior management, and key personnel are aware of and have access to a copy of
the plan. Only key personnel are trained on the plan and tabletop exercises are realized once a
year. The plan includes many incident response/management procedures, but it lacks measures
for controlling remote or wireless access and for security scans.

Resilience Measurement Index: An indicator of critical infrastructure resilience
53
The Planning Index (PlI) (Level 2) is obtained by using Equation 4:
Wd i
4
1ii
PlI (4)
where:
PlI = Planning Index, Level 2 (ranging from 0 to 100);
di = scaling constant (weight) indicating the relative importance of possibility i
(i = 1,2,3,4) for planning; and
Wi = component of component i of planning
The relative importance (weight) of the BCPI is 0.282. By multiplying the value of the BCPI
(61.13) by its weight, we obtain a weighted BCPI value of 17.24. This value is added to the other
weighted indices of components (New Planning Measures, Emergency Operation/Emergency
Action Plan, and Cyber Plan) that constitute Planning (Level 2) to obtain an overall PlI of 49.51
(Table A8).
Level 2 components are aggregated to define Level 1 components, which represent the four main
concepts of resilience:
Preparedness, which characterizes the capacity of anticipation. This Level 1 component
groups Level 2 components that characterize awareness and planning capabilities
(Appendix 2).
Mitigation Measures, which characterize both the capacity of resistance and adaptation.
This Level 1 component groups Level 2 components that characterize mitigating
construction, alternative site, and resources mitigation measures capabilities (Appendix
3).
Response Capabilities, which characterize both the capacity of response and absorption.
This Level 1 component groups Level 2 components that characterize onsite, offsite, and
incident management and command center capabilities (Appendix 4).
Recovery, which characterizes the capability of a system to rapidly recuperate after a
crisis. This Level 1 component groups Level 2 components that characterize restoration
agreements and recovery time capabilities (Appendix 5).
For the RMI, planning is the most important subcomponent of preparedness, with a weight of
0.532 in comparison to awareness, which has a weight of 0.468 (Table A9). The facility analyzed
in our example has an index of 67.46 for awareness, which corresponds to a facility with
dedicated managers for business continuity and emergency management. The facility also has an
IT manager, but IT management is not his primary task. The facility has implemented specific
information-sharing procedures with federal organizations (e.g., National Oceanic and
Atmospheric Administration, DHS, and United States Geological Survey) and the local
Emergency Management Agency. However, the facility does not participate in any emergency

Resilience Measurement Index: An indicator of critical infrastructure resilience
54
preparedness working groups and lacks some specific procedures related to Information
Technology information sharing.
Table A9: Preparedness Index (Illustrative Asset)
Preparedness Component - Level 2 Level 2 Index
Level 2 Weight
Weighted Index
Awareness 67.46 0.468 31.57
Planning 49.51 0.532 26.34
Level 1 Preparedness Index (PrI) Value: 57.91
The preparedness index (PrI) is calculated as the weighted sum of its two subcomponents, using
Equation 5:
Ve i
2
1ii
PrI
(5)
where:
PrI = preparedness index, Level 1 (ranging from 0 to 100);
ei = scaling constant (weight) indicating the relative importance of possibility i (i = 1,
2) of preparedness; and
Vi = index value of component i of preparedness (i.e., awareness and planning).
The relative importance (weight) of planning for preparedness is 0.532. By multiplying the value
of the PlI (49.51) by its weight, we obtain a weighted PlI of 26.34. This value is added to the
weighted index of the other subcomponent of preparedness (Level 1) to obtain a PrI of 57.91
(Table A9).
Finally, the four Level 1 components are aggregated to define an overall RMI (Table A10).
Table A10: Resilience Measurement Index (Illustrative Asset)
RMI Components - Level 1 Level 1 Index
Level 1 Weight
Weighted Index
Preparedness 57.91 0.315 18.24
Mitigation Measures 35.68 0.291 10.38
Response Capabilities 18.41 0.236 4.34
Recovery Mechanisms 51.17 0.158 8.08
Resilience Measurement Index (RMI) Value: 41.04

Resilience Measurement Index: An indicator of critical infrastructure resilience
55
According to the overall weights, preparedness is the most important component of facility
resilience, with a weight of 0.315, while recovery mechanisms are the least important, with a
weight of 0.158. Mitigation Measures and Response Capabilities have intermediate importance,
with respective weights of 0.291 and 0.236.
The facility analyzed in our example has an index of 35.68 for mitigation measures, which
corresponds to a facility located in an area susceptible to flooding and severe winter storms that
has been constructed to mitigate the potential impacts. The facility also has intermediate and
long-term plans as well as deployable measures for responding to these natural hazards. The
facility does not have any alternative site that can be used for continuity of business if the
primary site is lost. In terms of resources, the facility is dependent upon five elements: electric
power, communications, information technology, water, and wastewater. These dependencies are
collocated with other utilities and are characterized by a single point of entry in the facility.
There is no alternative in case of loss of water supply or wastewater removal service. The loss of
these two resources would impact 100% of the facility core operations. The facility has a diesel
generator that can support the full core operations for four days in case of loss of electric power
supply. In case of loss of communications or IT services, the facility can be operated manually.
However, 1–33% of core operations would be degraded.
The facility in the example has a response capabilities index of 18.41, which corresponds to a
facility with limited onsite capabilities. The facility has immediate onsite response capabilities
only for firefighting and would not be able to handle a significant incident without the aid of
external responders. The facility has interoperable communication with law enforcement,
emergency medical response, and fire response as well as contingency/business continuity plans
in case of loss of supply of electric power, communications, and information technology. Finally,
the facility does not have an incident management and command center.
The facility in the example has a recovery mechanisms index of 51.17, which corresponds to a
facility with a priority plan for restoration for three of its five dependencies (i.e., electric power,
communications, and information technology) and time before full resumption (once service is
restored) of 15 minutes for electric power and 1 hour for the other dependencies.
The overall RMI consists of a weighted sum of four Level 1 components (preparedness,
mitigation measures, response capabilities, and recovery mechanisms), as shown in Equation 6:
Uf i
4
1ii
RMI (6)
where:
RMI = relative Resilience Measurement Index (ranging from 0 to 100);
fi = scaling constant (weight; a number between 0 and 1) indicating the relative
importance of possibility I (i = 1, 2, 3, 4) of resilience; and
Ui = index value of component i of resilience (i.e., preparedness, mitigation measures,
response capabilities, and recovery mechanisms).

Resilience Measurement Index: An indicator of critical infrastructure resilience
56
The relative importance (weight) of the PrI is 0.315. By multiplying the value of the PrI (57.91)
by its weight, we obtain a weighted PrI of 18.24. This value is added to the other weighted index
values of components of resilience to obtain an overall RMI of 41.04 (Table A10).
The process results in an overall RMI that ranges from 0 (low resilience) to 100 (high resilience)
for the critical infrastructure analyzed, as well as an index value for each Level 1 through Level 5
component.


