Construction and Maintenance Looking Forward Alberta Media reports paint a dark picture as Alberta construction employment declines in the shadow of lower oil prices. These views may overstate the downside risk and miss the complex shifts that are shaping labour markets. The sheer size and complex mix of labour requirements create isolated recruiting challenges in the down market. While many projects end, large construction projects are continuing and employment, in some key cases, has not yet peaked. Expectations for rising production require planning for increased labour demands for sustaining capital 1 and maintenance 2 work. Overall, the oil price decline is driving employment lower across all construction sectors. The 2016 BuildForce scenario projects that total construction employment will fall by 13,000 jobs in 2015 and then by another 18,000 until the cycle reaches a bottom in 2019. A steady recovery from 2020 to 2025 more than restores the lost jobs as overall employment rises by 1,700 from 2016 to 2025. The cycle marks an end to a 25-year expansion. At the bottom in 2019, overall job losses are limited to 15 percent of peak employment in 2014. But the current focus is managing complex labour market conditions across the down cycle. Impacts on the local construction workforce include the loss of thousands of interprovincial workers. 3 While the evidence is incomplete, it is certain that a large proportion of this group is leaving Alberta, returning to their province of residence. These shifts are not limited to resource-related jobs. Most construction labour markets are affected by the departure of the fly-in, fly-out workforce and this is a rapid and short-term adjustment. The BuildForce labour market information (LMI) system signals the outward movement of these workers, as well as rising local unemployment as Alberta workers are displaced 2016–2025 Key Highlights BUILDFORCE’S LMI SYSTEM BuildForce Canada uses a scenario-based forecasting system to assess future labour market conditions in the oil sands and both residential and non-residential construction. This LMI system tracks measures for 34 trades and occupations. BuildForce consults with industry, including owners, contractors and labour groups, to validate the scenario assumptions and construction project lists, and seeks input from government on related analysis. 1 Sustaining capital refers to the periodic addition (or replacement) of capital, which is required to maintain operations at existing levels. 2 Maintenance refers to the process of maintaining equipment, including routine or on-stream work and turnaround/shutdown work, where an operating unit may be temporally taken out of production. 3 The term interprovincial employment was used in a Statistics Canada study of the mobile workforce that was identified through records showing their residence in one province and employment income in another. Studies since that time have refined the description of interprovincial employees into rotational or fly-in, fly-out and temporary relocation sometimes required by employers. A further consideration is the large pool of temporary foreign workers who will also be leaving as work declines.
Transcript
Construction and Maintenance Looking ForwardAlbertaMedia reports paint a dark picture as Alberta construction employment declines in the shadow of lower oil prices. These views may overstate the downside risk and miss the complex shifts that are shaping labour markets. The sheer size and complex mix of labour requirements create isolated recruiting challenges in the down market. While many projects end, large construction projects are continuing and employment, in some key cases, has not yet peaked. Expectations for rising production require planning for increased labour demands for sustaining capital1 and maintenance2 work.
Overall, the oil price decline is driving employment lower across all construction sectors. The 2016 BuildForce scenario projects that total construction employment will fall by 13,000 jobs in 2015 and then by another 18,000 until the cycle reaches a bottom in 2019. A steady recovery from 2020 to 2025 more than restores the lost jobs as overall employment rises by 1,700 from 2016 to 2025. The cycle marks an end to a 25-year expansion. At the bottom in 2019, overall job losses are limited to 15 percent of peak employment in 2014. But the current focus is managing complex labour market conditions across the down cycle.
Impacts on the local construction workforce include the loss of thousands of interprovincial workers.3 While the evidence is incomplete, it is certain that a large proportion of this group is leaving Alberta, returning to their province of residence. These shifts are not limited to resource-related jobs. Most construction labour markets are affected by the departure of the fly-in, fly-out workforce and this is a rapid and short-term adjustment.
The BuildForce labour market information (LMI) system signals the outward movement of these workers, as well as rising local unemployment as Alberta workers are displaced
2016–2025Key Highlights
BUILDFORCE’S LMI SYSTEMBuildForce Canada uses a scenario-based forecasting system to assess future labour market conditions in the oil sands and both residential and non-residential construction. This LMI system tracks measures for 34 trades and occupations. BuildForce consults with industry, including owners, contractors and labour groups, to validate the scenario assumptions and construction project lists, and seeks input from government on related analysis.
1 Sustaining capital refers to the periodic addition (or replacement) of capital, which is required to maintain operations at existing levels.2 Maintenance refers to the process of maintaining equipment, including routine or on-stream work and turnaround/shutdown work, where an operating
unit may be temporally taken out of production.3 The term interprovincial employment was used in a Statistics Canada study of the mobile workforce that was identified through records showing their
residence in one province and employment income in another. Studies since that time have refined the description of interprovincial employees into rotational or fly-in, fly-out and temporary relocation sometimes required by employers. A further consideration is the large pool of temporary foreign workers who will also be leaving as work declines.
and some interprovincial workers remain. Much of the adjustment is through the exit of interprovincial workers, leaving a relatively small increase in local unemployment. The adjustment process and the shifting mix of workers, both remaining and departed, create potential labour market challenges – not only in Alberta, but also in the provinces as skilled workers return. Industry must also address an aging workforce and the need to replace workers expected to retire over the next decade.
Interpreting labour market signals is particularly challenging under these conditions. Rankings that are intended to summarize conditions can also mask critical complexity. Attention to the trade and market-specific details offered by the BuildForce system has never been more important.
These details are set out here first for the leading oil sands markets, then for the overall non-residential and residential sectors. The 2016 BuildForce LMI system has been improved by the addition of a complete supply-side analysis for each of the residential and non-residential markets. This groundbreaking work provides the first-ever analysis of separate conditions in both markets.
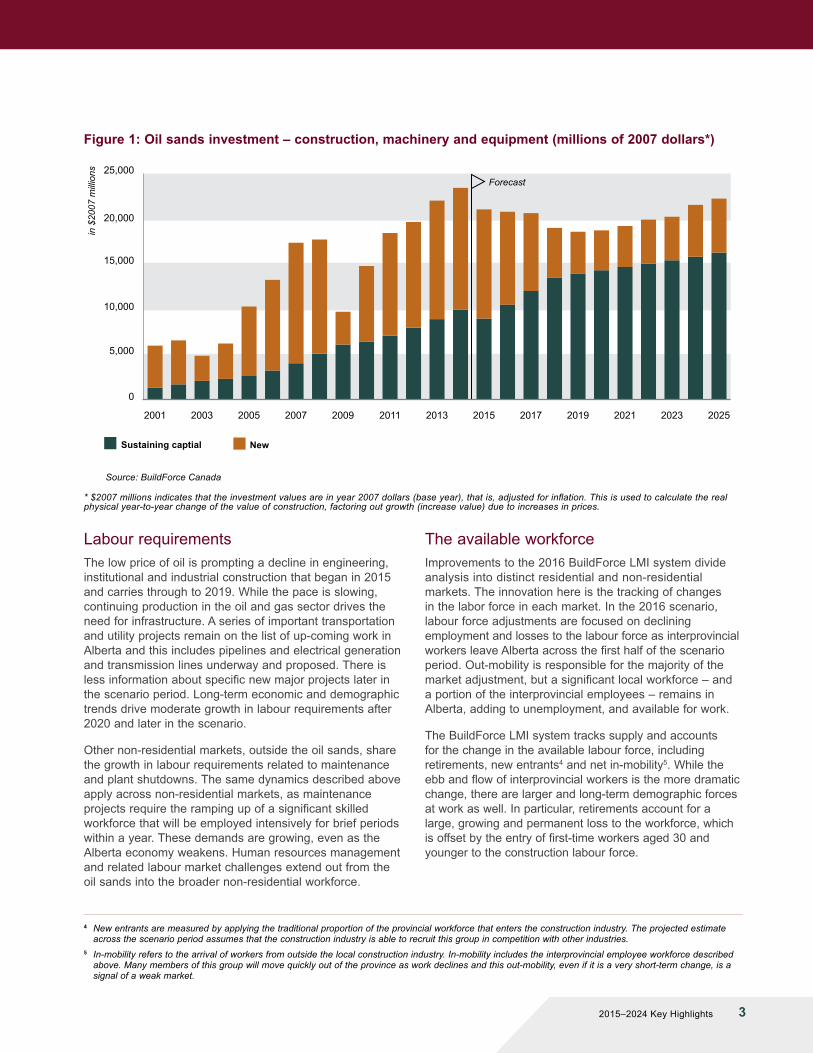
OIL SANDS CONSTRUCTION HIGHLIGHTSThe oil price decline will drive investment in new oil sands projects down by 66 percent from the start of the cycle in 2015 to 2019. This loss is the leading edge of the down cycle in Alberta construction. Declining investment and employment for new projects only describes part of the changing market dynamics. Over the last several years there has been a significant expansion of existing oil sands capacity that leaves a growing commitment to sustaining investment and maintenance. This work requires a similar group of skilled construction labour as new construction. Requirements for this work continue to rise across the scenario period – and this helps to offset some of the job losses in new projects.
Overall, labour requirements for work on the oil sands decline by 27 percent from the peak in 2014 to the bottom of the cycle in 2020. Job losses in other non-residential work and new housing are proportional and follow a similar pattern.
There are important variations in the pattern of job change. Job losses were most severe in 2015 and concentrated in in-situ, while mining-related employment was held up by the ongoing work at a major mining project. Mining and upgrader projects are scheduled to peak in 2016 and continue in 2017, and this limits the overall job loss in those years. But the weaker price of oil continues on,
prompting a second round of job losses in 2018 as current projects wind down and no new major projects are scheduled to start. The new investment cycle bottoms in 2019 and employment touches its low point in 2020.
Peaks and troughs in the new project work are partly absorbed by ongoing demands for the same skilled trades for work in sustaining capital and maintenance. Figure 1 captures the change in new investment and the steady increase in sustaining capital. These annual measures of labour requirements average the demands across the months and seasons.
Yearly averages conceal the sharp, short-term volatility in requirements for shutdowns and other maintenance work. These demands are growing larger each year as the total capacity of oil sands production increases and more and larger facilities require maintenance. The impact of these efforts presents a particular challenge in the current environment. Many of the needed skills, including boilermakers, millwrights, pipefitters and specialty welders, are part of the larger oil sands workforce and many may be drawn away as the new investment work ends. The loss of out-of-province workers may be premature in the face of these specific requirements.
A gradual increase in oil prices slowly restores confidence, and new investment in the oil sands turns up in 2020. Employment follows, rising slowly across the remainder of the scenario period to 2025. New investment does not regain past peaks, and employment lags as well. Gains in oil sands employment total 4,000 jobs from 2020 to 2025 and are more concentrated in the sustaining capital and maintenance market segments.
NON-RESIDENTIAL HIGHLIGHTS (2016 TO 2025)Non-residential investment and employment is drawn down in a path parallel to the oil sands cycle. A job loss totalling 8,000 in 2015 is followed by a series of four annual losses that total another 9,000 by 2019. As the cycle turns and markets improve after 2020, employment rises by 12,000, finishing the scenario above current levels. All non-residential markets follow this cycle with the exception of commercial building, where current project activity sustained employment in 2015 and continues into 2016 before slowing in 2017. Over the long term, commercial grows in steady increments across the remainder of the scenario period as overall economic conditions improve.
2 ALBERTA – CONSTRUCTION AND MAINTENANCE LOOKING FORWARD
Labour requirementsThe low price of oil is prompting a decline in engineering, institutional and industrial construction that began in 2015 and carries through to 2019. While the pace is slowing, continuing production in the oil and gas sector drives the need for infrastructure. A series of important transportation and utility projects remain on the list of up-coming work in Alberta and this includes pipelines and electrical generation and transmission lines underway and proposed. There is less information about specific new major projects later in the scenario period. Long-term economic and demographic trends drive moderate growth in labour requirements after 2020 and later in the scenario.
Other non-residential markets, outside the oil sands, share the growth in labour requirements related to maintenance and plant shutdowns. The same dynamics described above apply across non-residential markets, as maintenance projects require the ramping up of a significant skilled workforce that will be employed intensively for brief periods within a year. These demands are growing, even as the Alberta economy weakens. Human resources management and related labour market challenges extend out from the oil sands into the broader non-residential workforce.
The available workforceImprovements to the 2016 BuildForce LMI system divide analysis into distinct residential and non-residential markets. The innovation here is the tracking of changes in the labor force in each market. In the 2016 scenario, labour force adjustments are focused on declining employment and losses to the labour force as interprovincial workers leave Alberta across the first half of the scenario period. Out-mobility is responsible for the majority of the market adjustment, but a significant local workforce – and a portion of the interprovincial employees – remains in Alberta, adding to unemployment, and available for work.
The BuildForce LMI system tracks supply and accounts for the change in the available labour force, including retirements, new entrants4 and net in-mobility5. While the ebb and flow of interprovincial workers is the more dramatic change, there are larger and long-term demographic forces at work as well. In particular, retirements account for a large, growing and permanent loss to the workforce, which is offset by the entry of first-time workers aged 30 and younger to the construction labour force.
Figure 1: Oil sands investment – construction, machinery and equipment (millions of 2007 dollars*)
* $2007 millions indicates that the investment values are in year 2007 dollars (base year), that is, adjusted for inflation. This is used to calculate the real physical year-to-year change of the value of construction, factoring out growth (increase value) due to increases in prices.
4 New entrants are measured by applying the traditional proportion of the provincial workforce that enters the construction industry. The projected estimate across the scenario period assumes that the construction industry is able to recruit this group in competition with other industries.
5 In-mobility refers to the arrival of workers from outside the local construction industry. In-mobility includes the interprovincial employee workforce described above. Many members of this group will move quickly out of the province as work declines and this out-mobility, even if it is a very short-term change, is a signal of a weak market.
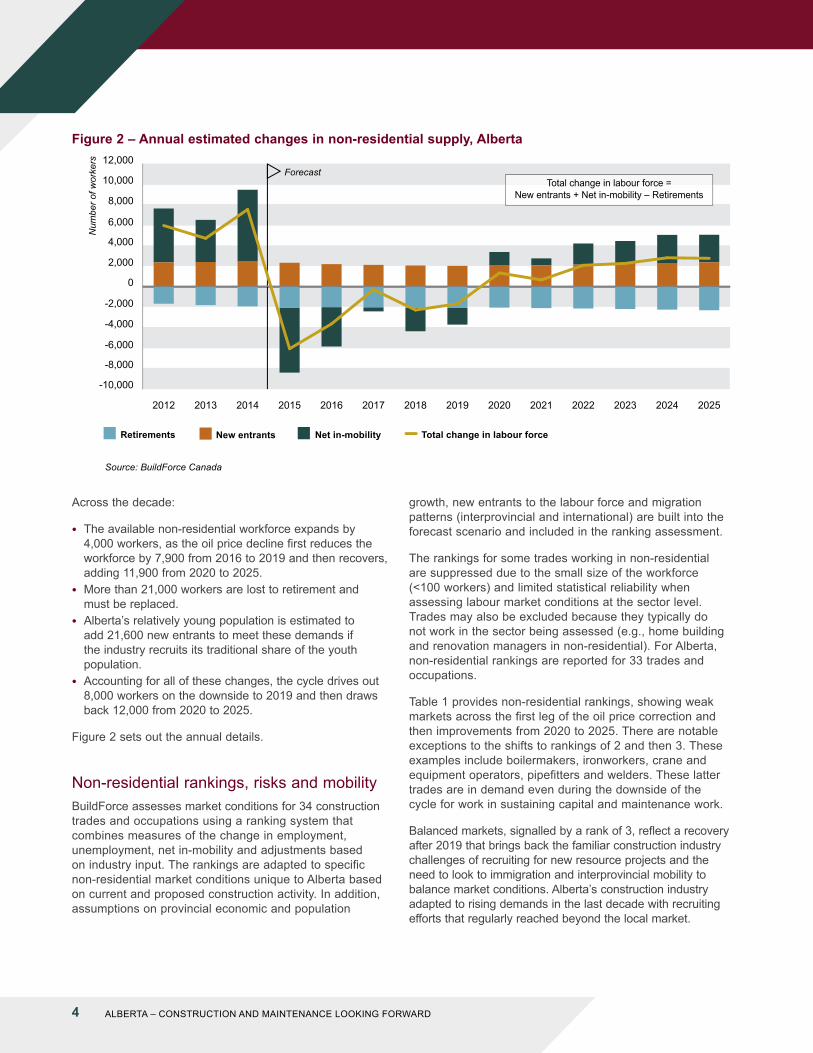
● The available non-residential workforce expands by 4,000 workers, as the oil price decline first reduces the workforce by 7,900 from 2016 to 2019 and then recovers, adding 11,900 from 2020 to 2025.
● More than 21,000 workers are lost to retirement and must be replaced.
● Alberta’s relatively young population is estimated to add 21,600 new entrants to meet these demands if the industry recruits its traditional share of the youth population.
● Accounting for all of these changes, the cycle drives out 8,000 workers on the downside to 2019 and then draws back 12,000 from 2020 to 2025.
Figure 2 sets out the annual details.
Non-residential rankings, risks and mobilityBuildForce assesses market conditions for 34 construction trades and occupations using a ranking system that combines measures of the change in employment, unemployment, net in-mobility and adjustments based on industry input. The rankings are adapted to specific non-residential market conditions unique to Alberta based on current and proposed construction activity. In addition, assumptions on provincial economic and population
growth, new entrants to the labour force and migration patterns (interprovincial and international) are built into the forecast scenario and included in the ranking assessment.
The rankings for some trades working in non-residential are suppressed due to the small size of the workforce (<100 workers) and limited statistical reliability when assessing labour market conditions at the sector level. Trades may also be excluded because they typically do not work in the sector being assessed (e.g., home building and renovation managers in non-residential). For Alberta, non-residential rankings are reported for 33 trades and occupations.
Table 1 provides non-residential rankings, showing weak markets across the first leg of the oil price correction and then improvements from 2020 to 2025. There are notable exceptions to the shifts to rankings of 2 and then 3. These examples include boilermakers, ironworkers, crane and equipment operators, pipefitters and welders. These latter trades are in demand even during the downside of the cycle for work in sustaining capital and maintenance work.
Balanced markets, signalled by a rank of 3, reflect a recovery after 2019 that brings back the familiar construction industry challenges of recruiting for new resource projects and the need to look to immigration and interprovincial mobility to balance market conditions. Alberta’s construction industry adapted to rising demands in the last decade with recruiting efforts that regularly reached beyond the local market.
Figure 2 – Annual estimated changes in non-residential supply, Alberta
Net in-mobility New entrantsRetirements Total change in labour force
Num
ber o
f wor
kers
-10,000
-8,000
-6,000
-4,000
-2,000
0
2,000
4,000
6,000
8,000
10,000
12,000
4 ALBERTA – CONSTRUCTION AND MAINTENANCE LOOKING FORWARD
Market rankings
1Workers meeting employer qualifications are available in local markets to meet an increase in demand at the current offered rate of compensation and other current working conditions. Excess supply is apparent and there is a risk of losing workers to other markets.
2 Workers meeting employer qualifications are available in local markets to meet an increase in demand at the current offered rate of compensation and other working conditions.
3The availability of workers meeting employer qualifications in the local market may be limited by large projects, plant shutdowns or other short-term increases in demand. Employers may need to compete to attract needed workers. Established patterns of recruiting and mobility are sufficient to meet job requirements.
4Workers meeting employer qualifications are generally not available in local markets to meet any increase. Employers will need to compete to attract additional workers. Recruiting and mobility may extend beyond traditional sources and practices.
5Needed workers meeting employer qualifications are not available in local markets to meet current demand so that projects or production may be delayed or deferred. There is excess demand, competition is intense and recruiting reaches to remote markets.
Table 1: Rankings for trades and occupations in non-residential construction in Alberta
RESIDENTIAL HIGHLIGHTS (2016 TO 2025)Alberta’s housing market tends to follow the cycle generated by the oil sands. Residential employment rose to a record peak level in 2014 and then began a down cycle. Employment fell by 5,000 jobs in 2015 and then falls by another 9,000 to 2019. A partial recovery after 2019 raises employment by 7,000 before the scenario ends in 2025. Housing and job losses from 2014 to 2019 are similar in magnitude to the 2008–2009 downturn, but the cycle is spread out over five years. The recovery is more moderate and this reflects the growing impact of demographic trends and declining immigration.
Labour requirementsJob losses as new housing declines will cut 11,000 jobs from the sector from 2015 to 2019 and rising housing starts will add back 5,000. The more stable renovation and maintenance markets will avoid major lob losses, adding 2,300 jobs across the scenario period. Renovation work joins commercial building as one of the few stable markets for construction employment.
In addition to labour requirements for new housing construction and renovation, the residential industry faces demands for workers to replace retirements. In Alberta, the pattern of economic development and demographic change has created a relatively young residential workforce and retirements are lower than in other provinces, but still represent a large portion of future hiring requirements.
6 ALBERTA – CONSTRUCTION AND MAINTENANCE LOOKING FORWARD
The available workforceBuildForce supply-side accounting can now be applied to assess a distinct residential market:
● The labour force declines by 2,200 workers over the scenario period – tracking the decline in employment.
● Replacement demands (retirements) total an estimated 15,000 workers.
● The estimated 12,600 new entrants offset retirement demands.
● On balance, the local residential workforce might be expected to meet requirements across the scenario if stakeholders are successful in attracting a traditional share of Alberta’s youth.
Annual changes create shifting net mobility across the years and these are set out in Figure 3.
Residential rankings, risks and mobilityThe rankings for some trades working in residential are suppressed due to the small size of the workforce (<100 workers) and limited statistical reliability when assessing labour market conditions at the sector level. Trades may also be excluded because they typically do not work in the sector being assessed (e.g., boilermakers, millwrights, etc. in residential construction). For Alberta, residential rankings are reported for 24 trades and occupations.
Low rankings in Table 2 reflect the 2015 decline in housing and the general, continuing downward trend in employment.
Balanced markets, signalled by a rank of 3, reflect a recovery after 2019 that brings back familiar conditions, with recruiting and job search capabilities that regularly reach beyond the local market.
Figure 3: Annual estimated changes in residential supply, Alberta
CONCLUSIONS AND IMPLICATIONSEven while lower resource prices and declining investment reduce long-term labour requirements, there is still momentum in the Alberta construction industry. The 2016–2025 Construction and Maintenance Looking Forward scenario anticipates continuing workforce challenges.
Recruiting challenges may emerge in markets where employment growth is expected to be moderate and stable, even as other markets decline. This includes
residential renovation, commercial and institutional building. In addition, industry will need to plan for an aging workforce and replacing retiring workers.
A larger challenge looms in meeting critical and short-term shutdowns, turnarounds and outages work. These often hard-to-fill demands for workers with specialized skills grow steadily larger across the scenario period.
8 ALBERTA – CONSTRUCTION AND MAINTENANCE LOOKING FORWARD
Timely construction forecast data is available online at www.constructionforecasts.ca. Create customized reports on a broad range of selected categories within sector, trade or province covering up to 10 years.
Funded by the Government of Canada’s Sectoral Initiatives Program
The opinions and interpretations in this publication are those of the author and do not necessarily reflect those of the Government of Canada.
For the most detailed and comprehensive construction labour market data in Canada, visit
www.constructionforecasts.ca
Developed with industry for industryCustomizable tables and graphs available for:
Data on more than 30 construction trades and occupations by province looking ahead 10 years
Macroeconomic and investment data Key economic indicators, construction investment and labour market
conditions by province and/or sector
Best viewed on tablets (or computers)
Also check out the Construction Map App for major resource construction projects mapped across Canada.
www.constructionmapapp.ca
The mobility of the workforce is at the centre of these market adjustments and related challenges. As the large and mobile workforce departs Alberta in the early stages of the oil price decline, the risk is that they will leave a skill vacuum behind. The mix of trades departing, and in some cases responding to job opportunities in other provinces, may create shortages for specialized or short-term work. Further, the age profile may be key if large numbers of displaced workers choose retirement or not returning to Alberta as growth resumes later in the scenario period.
The 2016–2025 Construction and Maintenance Looking Forward scenario anticipates continuing labour market challenges:
● Slower population growth and the shifting age profile of the workforce will create specific challenges for employers. – Recruiting young people into the industry will bring
recruiters into competition with other industries drawing from the same, limited population.
● Cyclical changes in employment may require continuing mobility in the workforce across provinces. In addition, it may also result in greater mobility between the residential and non-residential sectors.
● Local demographics restrict labour force growth, leaving in-mobility key to recruiting.
The Construction and Maintenance Looking Forward national highlights report expands on the range of worker mobility options and industry implications.