228
Evidence Report 65 October 2012 Construction, Building Services Engineering and Planning: Sector Skills Assessment 2012

Evidence Report 65October 2012
Construction, Building Services Engineering and Planning: Sector Skills Assessment 2012

Construction, Building Services Engineering and Planning: Sector Skills Assessment 2012
Sector Skills Assessment: Construction, Building Services Engineering and Planning
ConstructionSkills
Zoey Breuer
UK Commission for Employment and Skills
October 2012
Views expressed in this Evidence Report are not necessarily those of the UK Commission for Employment and Skills.

Construction, Building Services Engineering and Planning: Sector Skills Assessment 2012
i
Foreword
The UK Commission for Employment and Skills is a social partnership, led by
Commissioners from large and small employers, trade unions and the voluntary sector. Our
ambition is to transform the UK’s approach to investing in the skills of people as an intrinsic
part of securing jobs and growth. Our strategic objectives are to:
Maximise the impact of employment and skills policies and employer behaviour to
support jobs and growth and secure an internationally competitive skills base;
Work with businesses to develop the best market solutions which leverage greater
investment in skills;
Provide outstanding labour market intelligence which helps businesses and people
make the best choices for them.
The third objective, relating to intelligence, reflects an increasing outward focus to the UK
Commission’s research activities, as it seeks to facilitate a better informed labour market, in
which decisions about careers and skills are based on sound and accessible evidence.
Related, impartial research evidence is used to underpin compelling messages that promote
a call to action to increase employers’ investment in the skills of their people.
Intelligence is also integral to the two other strategic objectives. In seeking to lever greater
investment in skills, the intelligence function serves to identify opportunities where our
investments can bring the greatest leverage and economic return. The UK Commission’s
third strategic objective, to maximise the impact of policy and employer behaviour to achieve
an internationally competitive skills base, is supported by the development of an evidence
base on best practice: “what works?” in a policy context.
Our research programme provides a robust evidence base for our insights and actions,
drawing on good practice and the most innovative thinking. The research programme is
underpinned by a number of core principles including the importance of: ensuring
‘relevance’ to our most pressing strategic priorities; ‘salience’ and effectively translating
and sharing the key insights we find; international benchmarking and drawing insights
from good practice abroad; high quality analysis which is leading edge, robust and action
orientated; being responsive to immediate needs as well as taking a longer term
perspective. We also work closely with key partners to ensure a co-ordinated approach to
research.

Construction, Building Services Engineering and Planning: Sector Skills Assessment 2012
ii
Sector Skills Assessments (SSAs) are key sources of authoritative and focused sectoral
labour market intelligence (LMI), designed to inform the development of skills policy across
the UK. They combine “top-down” analysis of official data with bottom-up intelligence to
provide a consistent, comparable and rich understanding of the skills priorities within
different sectors of the economy, across the four UK nations.
Sharing the findings of our research and engaging with our audience is important to further
develop the evidence on which we base our work. Evidence Reports are our chief means of
reporting our detailed analytical work. All of our outputs can be accessed on the UK
Commission’s website at www.ukces.org.uk
But these outputs are only the beginning of the process and we are engaged in other
mechanisms to share our findings, debate the issues they raise and extend their reach and
impact. These mechanisms include our Changing Behaviour in Skills Investment seminar
series and the use of a range of online media to communicate key research results.
We hope you find this report useful and informative. If you would like to provide any
feedback or comments, or have any queries please e-mail [email protected], quoting the
report title or series number.
Lesley Giles
Deputy Director
UK Commission for Employment and Skills

Construction, Building Services, Engineering and Planning: Sector Skills Assessment 2012
iii
Table of Contents
Executive Summary ............................................................................................ xi
Introduction .......................................................................................................................... xi
Skill shortages .................................................................................................................... xii
Skill gaps ............................................................................................................................ xiii
Skills priorities ................................................................................................................... xiv
1 Introduction .................................................................................................. 1
1.1 Purpose of report .................................................................................................... 1
1.2 Defining the sector .................................................................................................. 2
1.3 Sector Skills Councils ............................................................................................. 3
1.4 Summary of methodology ...................................................................................... 4
2 Current performance of sector ................................................................... 6
Chapter Summary ................................................................................................................. 6
2.1 Economic performance........................................................................................... 7
2.1.1 The current and recent economic performance and competitive position of the sector .......................................................................................................................... 7
2.1.2 Employer profile (number of employers, size, start-ups and closures) .......... 12
2.1.3 Extent to which sector employers compete internationally ............................. 18
2.2 Employment ........................................................................................................... 20
2.2.1 Employment level .................................................................................................. 20
2.2.2 Distribution of employment (in a spatial and sub-sectoral context) ................ 21
3 The workforce ............................................................................................ 24
Chapter Summary ............................................................................................................... 24
3.1 Working patterns ................................................................................................... 25
3.1.1 Full and part-time employment ............................................................................ 25
3.1.2 Self-employment .................................................................................................... 27
3.1.3 Contract Type ........................................................................................................ 31
3.2 The jobs people do ................................................................................................ 33
3.2.1 Occupational structure ......................................................................................... 33
3.3 Workforce characteristics .................................................................................... 36

Construction, Building Services Engineering and Planning: Sector Skills Assessment 2012
iv
3.3.1 Gender .................................................................................................................... 36
3.3.2 Age profile .............................................................................................................. 38
3.3.3 Ethnicity ................................................................................................................. 43
3.3.4 Employment by country of birth .......................................................................... 44
4 Demand for, and value of, skills ............................................................... 46
Chapter Summary ............................................................................................................... 46
4.1 Introduction ............................................................................................................ 47
4.2 Nature of Skills Used ............................................................................................. 50
4.2.1 Nations Comparison ............................................................................................. 51
4.2.2 Qualification Levels from 2002 to 2010 ............................................................... 52
4.2.3 Qualification Levels by sub-sector ...................................................................... 55
4.3 Value of Skills ........................................................................................................ 56
4.3.1 Employers providing training .............................................................................. 57
4.3.2 Provision of Training ............................................................................................. 64
4.3.3 Employee training by Nation ................................................................................ 69
4.3.4 Training by Sub-Sectors ....................................................................................... 71
4.3.5 Type of Training ..................................................................................................... 72
4.3.6 Managers & Professionals ................................................................................... 75
4.3.7 Barriers to training ................................................................................................ 78
4.3.8 High performance working ................................................................................... 80
4.4 Productivity/skills utilisation ................................................................................ 84
4.4.1 Impact of training on performance ...................................................................... 85
4.4.2 Skills and sectoral performance .......................................................................... 86
5 Extent of skills mis-match ......................................................................... 89
Chapter Summary ............................................................................................................... 89
5.1 Extent and nature of vacancies ........................................................................... 90
5.1.1 Retention and Recruitment................................................................................... 95
5.2 Extent and nature of skills issues ....................................................................... 98
5.3 Extent of under-employment .............................................................................. 104
5.4 Impact of mis-matches in terms of wages and migration ............................... 105
5.4.1 Wages ................................................................................................................... 105
5.4.2 Migration .............................................................................................................. 108

Construction, Building Services Engineering and Planning: Sector Skills Assessment 2012
v
5.5 Extent to which skills deficiencies are hampering growth ............................. 112
6 Drivers of change and their skills implications ..................................... 116
Chapter Summary ............................................................................................................. 116
6.1 Drivers of change ................................................................................................ 117
6.2 Scale of different drivers .................................................................................... 119
6.2.1 Regulation and Multi-level Governance Including Environmental Change 119
6.2.2 Economics and Globalisation ............................................................................ 124
6.2.3 Technological Change ........................................................................................ 126
6.2.4 Demographic Change and Values and Identities ............................................. 128
6.2.5 Consumer demand .............................................................................................. 129
6.3 Differences in Drivers across the four nations ................................................ 130
6.3.1 Wales .................................................................................................................... 130
6.3.2 Northern Ireland ................................................................................................... 132
6.3.3 Scotland ............................................................................................................... 133
7 Future Skills Needs ................................................................................. 135
7.1 Drivers of future trends in skills needs ............................................................. 135
7.1.1 Economy .............................................................................................................. 135
7.1.2 Environment and Legislation ............................................................................. 136
7.1.3 Technology .......................................................................................................... 138
7.2 Impact on Employment and Skills ..................................................................... 138
7.3 Future Occupational Profile ............................................................................... 142
7.4 Future Skills Needs ............................................................................................. 145
7.5 How to distinguish between Current and Future Skills Needs ....................... 148
8 Priority areas for action ........................................................................... 150
8.1 Introduction .......................................................................................................... 150
8.2 Priority areas for action ...................................................................................... 150
8.3 Conclusions ......................................................................................................... 166
Appendix A: Technical Appendix ................................................................... 169
i. Summary .............................................................................................................. 169
ii. Data Collection - Literature Review ................................................................... 169

Construction, Building Services Engineering and Planning: Sector Skills Assessment 2012
vi
iii. Data Collection – Primary Data .......................................................................... 170
iv. Data Collection - The provision of core data .................................................... 171
v. Methodology for Core data supplied by the UK Commission ........................ 172
vi. Data Collection – Primary Research Methodologies ....................................... 178
vii. Data analysis and interpretation ........................................................................ 196
viii. Quality Assurance ............................................................................................... 196
Appendix B: ConstructionSkills Footprint, SIC 2007 .................................... 198
Appendix C: Glossary ...................................................................................... 200
Construction, Building Services Engineering and Planning: Sector Skills Assessment 2012
vii
Table of Graphs and Charts
Table 2.1: GVA by nation (2008) (£m in current basic prices) ............................................................. 8
Table 2.2: GVA by English region (2008) (£m in current basic prices) ............................................... 9
Table 2.3: UK GVA (1999-2008) (£m in current basic prices) ............................................................. 10
Table 2.4: Estimated workplace gross value added per employee job at current basic prices, 2009 ......................................................................................................................................................... 11
Table 2.5: Number of establishments by sector and nation (2010) .................................................. 13
Table 2.6: Number of establishments by sector and English region (2010) .................................... 14
Table 2.7: Number of establishments by sector (UK) (2006-2010) .................................................... 14
Table 2.8: Number of establishments by number employee’s whole economy (UK) (2010) .......... 15
Table 2.9: Number of establishments by number employees by sector (UK) (2010) ...................... 15
Table 2.10: Number of establishments by number employees within CBSE&P sector by nation (2010) ....................................................................................................................................................... 17
Table 2.11: Business (enterprise) start-ups and closures (UK) (2009) ............................................. 17
Table 2.12: Trade in Services (UK) (2007-2010) (£ million) ................................................................ 19
Table 2.13: Total employment by sector and nation (2010) ............................................................... 21
Table 2.14: Total employment by sector and English region (2010) (% share within region) ........ 22
Table 2.15: Total employment by sector (UK) (2002-2010) ................................................................ 23
Table 2.16: Total employment in CBSE&P sector by 2 Digit SIC 07 Code (UK) (2010) ................... 23
Table 3.1: Working hours by sector (UK) (2010) ................................................................................. 25
Table 3.2: Working hours by sector and nation (2010) ...................................................................... 26
Table 3.3: Employment status by sector (2010) .................................................................................. 27
Table 3.4: Employment status by sector and nation (2010) .............................................................. 29
Table 3.5: Employment status by sector and nation (2010) (000’s) .................................................. 30
Table 3.6: Permanent and temporary employees by sector UK (2010) ............................................ 31
Table 3.7: Employment status CBSE&P Sector by 2 Digit SIC code (2010) (‘000s) ........................ 33
Table 3.8: Employment by occupation within the Whole Economy by nation (2010) ..................... 34
Table 3.9: Employment by occupation CBSE&P Sector and All economy (UK) (2010) .................. 34
Table 3.10: Employment by occupation CBSE&P Sector by nation (UK) (2010) ............................. 35
Table 3.11: Employment by occupation CBSE&P Sector by 2 Digit SIC code (UK) (2010) ............ 36
Table 3.12: Employment by gender and nation Whole Economy (2010) .......................................... 36
Table 3.13: Employment within CBSE&P Sector by gender and nation (2010) ............................... 37
Table 3.14: Employment by gender CBSE&P Sector by 2 Digit SIC 07 Code (2010) (‘000s) .......... 37
Table 3.15: Gender profile by broad occupational group (UK) (2010) .............................................. 38
Table 3.16: Age profile of Whole Economy workforce by nation (2010) (‘000s) (% share) ............ 39
Table 3.17: Age profile of Whole Economy workforce (UK) (2002-2010) ......................................... 39

Construction, Building Services Engineering and Planning: Sector Skills Assessment 2012
viii
Table 3.18: Age profile of CBSE&P Sector workforce by nation (2010) ........................................... 40
Table 3.19: Age profile of CBSE&P Sector workforce (UK) (2002-2010) ('000s) .............................. 40
Table 3.20: Employment by age of CBSE&P Sector by 2 Digit SIC 07 Code (2010) ('000s) (%share) .................................................................................................................................................. 42
Table 3.21: Ethnicity of workforce across whole economy by nation (2010) .................................. 43
Table 3.22: Ethnicity of workforce within sectors UK (2010) (‘000s) (% share) ............................... 43
Table 3.23: Employment by country of birth (Whole Economy) (UK) (2010) ................................... 44
Table 3.24: Employment by country of birth and sector (UK) (2010) ............................................... 45
Table 3.25: Employment by country of birth CBSE&P Sector by 2 Digit SIC code (UK) (2010) ..... 45
Figure 4.1: Workplace job growth by occupation within the CBSE&P sector, percentage shares, UK .............................................................................................................................................. 48
Table 4.1: UK and Regional Average Annual Recruitment Requirement 2012 - 2016 .................... 49
Table 4.2: Qualification profile of workforces with sectors, UK (2010) ............................................ 51
Table 4.3 Skill levels by occupation ..................................................................................................... 51
Table 4.4: Qualification levels within the CBSE&P sector by nation (2010) .................................... 52
Table 4.5: Qualification levels within the CBSE&P sector, UK (2002-2010) ..................................... 53
Figure 4.2 Qualification Levels (percentages) for CBSE&P Sector, UK (2002-2010) ...................... 53
Figure 4.3: Qualification levels within the CBSE&P Sector, UK (2002-2010) ................................... 54
Figure 4.4: Qualification levels within the CBSE&P Sector ............................................................... 56
Table 4.6: Employers with a training plan ........................................................................................... 57
Table 4.7: Employers with a training budget ....................................................................................... 57
Table 4.8: Employers providing training by sector ............................................................................ 58
Table 4.9: Employers providing training to employees by occupational group ............................. 60
Figure 4.5: Employers providing training to employees by occupational group ............................ 61
Table 4.10: Top ten construction contracting occupation groups affected by need to acquire new skills or knowledge in the next year ............................................................................................ 62
Table 4.11: Top ten professional services occupation groups affected by need to acquire new skills or knowledge in the next year .................................................................................................... 63
Table 4.12: Employees receiving training by sector .......................................................................... 65
Table 4.13: Employees receiving training by occupational group ................................................... 66
Figure 4.6: Employees receiving training by occupational group .................................................... 67
Table 4.14: Employees receiving training in last 4 weeks, 2002-2010 (UK) ..................................... 68
Table 4.15: Employees receiving training in last 13 weeks, 2002-2010 (UK) ................................... 68
Figure 4.7: Employees receiving training in last 13 weeks in the CBSE&P Sector 2002-2010 (UK) .......................................................................................................................................................... 69
Table 4.16: Employees receiving training in last 4 weeks, 2010 (all nations) .................................. 70
Table 4.17: Employees receiving training in last 13 weeks, 2010 (all nations) ................................ 71

Construction, Building Services Engineering and Planning: Sector Skills Assessment 2012
ix
Figure 4.8: Employees receiving training in last 4 weeks and 13 weeks in the CBSE&P Sector by SIC Code ............................................................................................................................................ 72
Table 4.18: Type of training funded or arranged for employees ....................................................... 73
Figure 4.9: Type of training funded or arranged for employees (percentages) .............................. 74
Table 4.19: Managers and professionals in the CBSE&P Sector without Level 4 or higher qualifications 2002-2010 (UK) ............................................................................................................... 75
Table 4.20: Managers and professionals (whole economy) without Level 4 or higher qualifications 2002-2010 (UK) ............................................................................................................... 75
Table 4.21: Managers and professionals without Level 4 or higher qualifications (% of all managers and professionals) ............................................................................................................... 76
Figure 4.10: Managers and professionals in the CBSE&P Sector without Level 4 or higher qualifications 2002-2010 2010 (UK, percentages) ............................................................................... 77
Figure 4.11: Managers and professionals in the CBSE&P Sector without Level 4 or higher qualifications 2002-2010 (UK) ............................................................................................................... 77
Table 4.22: Barriers to training within the CBSE&P sector ............................................................... 80
Table 4.23: Whether establishment has formal processes in place to identify 'high potential' or talented individuals ................................................................................................................................ 82
Table 4.24: Extent to which employees have variety in their work ................................................... 82
Table 4.25: Extent to which employees have discretion over how they do their work .................. 83
Table 4.26: Extent to which employees at establishment have access to flexible working .......... 84
Table 5.1: Profile of vacancies by sector ............................................................................................. 90
Table 5.2: Profile of vacancies by sector and nation ......................................................................... 92
Table 5.3: Profile of vacancies by occupation within the CBSE&P sector ...................................... 93
Table 5.4: CBSE&P employers reporting vacancies by occupation and nation ............................. 94
Table 5.5: Distribution of vacancies, hard-to-fill vacancies and skill shortage vacancies by sector (UK) .............................................................................................................................................. 94
Table 5.6: Retention problems, by sector and nation ........................................................................ 95
Table 5.7: Recruitment of young people by sector and nation ......................................................... 97
Table 5.8: Skills lacking in Skills Shortage Vacancies ....................................................................... 99
Table 5.9: Impact of hard-to-fill vacancies within the CBSE&P sector by geography .................... 99
Table 5.10: Measures taken by CBSE&P employers to overcome hard-to-fill vacancies by geography ............................................................................................................................................. 100
Table 5.11: Employers and employees with skills gaps by sector ................................................. 101
Table 5.12: Employers and employees with skill gaps by nation (CBSE&P) ................................. 101
Table 5.13: Skills gaps by occupation ............................................................................................... 102
Table 5.14: Effects of skills gaps on employers within the CBSE&P sector by geography ........ 103
Table 5.15: Steps CBSE&P employers have taken to overcome skills gaps ................................. 103
Table 5.16: Underemployment – The extent to which workforce is ‘over qualified’ and ‘over skilled’ by sector .................................................................................................................................. 104

Construction, Building Services Engineering and Planning: Sector Skills Assessment 2012
x
Table 5.17: Average hourly wage by sector (UK) ............................................................................. 106
Table 5.18: Average hourly wage by nation (all sectors) ................................................................. 106
Table 5.19: Average hourly wage by Sector - 2 digit SIC data (UK) ................................................ 107
Table 5.20: Gross hourly pay by employee jobs – selected occupations (UK) ............................. 107
Table 5.21: Employment by country of birth and sector, UK (2010) ............................................... 109
Table 5.22: Employment by country of birth and nation, 2010 ........................................................ 109
Table 5.23: Sub-sector employment by country of birth and nation, 2010 .................................... 110
Table 5.24: Employment by country of birth – Construction, Building Services Engineering & Planning sector from 2002 – 2010. ..................................................................................................... 110
Table 5.25: Employment by country of birth – Construction, Building Services Engineering & Planning sector and All sectors from 2002 – 2010. .......................................................................... 111
Table 5.26: Impact of having hard-to-fill vacancies, whole economy compared to Construction, Building Services Engineering & Planning (CBSE&P) sector ................................ 114
Table 5.27: Consequences of skills gaps, whole economy compared to Construction, Building Services Engineering & Planning (CBSE&P) sector ........................................................................ 114
Table 6.1 – Main Government Strategies for Addressing Energy Efficiency ................................. 119
Table 6.2: Key Legislative Competence Orders relating to the CBSE&P sector in Wales: .......... 130
Table 6.3: Key Legislative Competence Orders relating to the CBSE&P sector in Northern Ireland .................................................................................................................................................... 132
Table 6.4: Recent Legislative Competence Orders relating to the CBSE&P sector in Scotland: 133
Table 7.1 Workplace job growth by occupation within CBSE&P – United Kingdom .................... 139
Table 7.2 Largest occupation groups within the sector (UK) 2010 ................................................. 140
Table 7.3 Workplace job growth by occupation within the CBSE&P sector - England ................ 141
Table 7.4 Workplace job growth by occupation within the CBSE&P sector - Scotland ............... 141
Table 7.5 Workplace job growth by occupation within the CBSE&P sector - Wales .................... 142
Table 7.6 Workplace job growth by occupation within the CBSE&P sector – Northern Ireland . 142
Table 7.7 Workplace job growth by occupation within the Whole Economy, by geography –United Kingdom ................................................................................................................................... 143
Table 7.8 Workplace job growth by occupation within the Whole Economy - England ............... 144
Table 7.9 Workplace job growth by occupation within the Whole Economy –Scotland .............. 144
Table 7.10 Workplace job growth by occupation within the Whole Economy – Wales ................ 145
Table 7.11 Workplace job growth by occupation within the Whole Economy – Northern Ireland145
Table 7.12 Green Deal Measures ........................................................................................................ 146
Table 8.1 Priority action matrix ........................................................................................................... 154
Construction, Building Services Engineering and Planning: Sector Skills Assessment 2012
xi
Executive Summary
Introduction
This is the first Sector Skills Assessment for the UK construction, building services
engineering and planning (CBSE&P) sector. It is one of a suite of reports for the sector
which together cover the UK and each of its countries (England, Northern Ireland, Scotland
and Wales). This report offers a narrative of the main current and future skills needs of the
CBSE&P sector.
Business and economic environment
In spite of the recession, the CBSE&P sector remains a key component of the UK economy
not only in terms of economic contribution and employment, but also in terms of wider job
creation and wealth generation. In 2008 in the UK the broad Construction sector Gross
Value Added (GVA) was almost £81 billion, which accounted for just over six per cent of
total UK GVA; making the sector the seventh largest out of 15 broad sectors. However, the
sector accounts for nine per cent of the UK workforce (2.9 million workers) making it the third
largest UK sector by employment. The sector is characterised a relatively low incidence of
higher-level qualifications across the workforce and skills deficiencies and productivity levels
that lag behind some areas of the economy.
This assessment suggests that the CBSE&P sector has performed well in the recent past,
but also that it has enormous potential for growth as a result of growing demand for its
products and services. The UK Construction sector almost doubled (increase of 91 per
cent) in GVA from just over £42 billion in 1999 to approaching £81 billion in 2008. Historical
data demonstrates that the sector is a critical component of the UK economy overall and
within the separate home nations whilst forecast growth and identifiable opportunities for
workforce development suggest that it has significant potential for wealth generation and
employment creation in the future. The sector has a large number of dependencies resulting
from a substantial supply chain, and it is essential in terms of underpinning and enabling
growth in other sectors.
Construction, Building Services Engineering and Planning: Sector Skills Assessment 2012
xii
Additionally, whilst not discussed explicitly or at length in this assessment the CBSE&P
sector makes a significant contribution to the health and social wellbeing of UK society. It is
increasingly recognised that the nature of the built environment and the process of
construction affects both the natural and social environment. Certainly this is implied in
opportunities that exist in relation to job creation, training and skills acquisition underpinning
greater social mobility, and the challenge to decarbonise the UKs building stock and the
construction process itself.
The CBSE&P sector has undoubtedly suffered as a result of the recession. A combination of
weak demand, rising costs and falling tender prices have made for difficult trading conditions
throughout the sector and resulted in high levels of redundancy and business failure.
However, it might also be the case that long-standing ambitions to modernise the industry
will result from being triggered by the recession. Certainly the structure of the industry is
changing both in terms of its composition, operation and skill requirements.
Skill shortages
Whilst vacancy levels across the CBSE&P sector are comparable to other sectors it has an
above average share of both Hard to Fill Vacancies (HtFVs) (40 per cent of vacancies as
compared to 23 percent for the whole economy) and Skill-shortage Vacancies as a
percentage of all vacancies (26 percent as compare to 16 per cent for the whole economy).
This suggests there is a supply-side issue in terms of the availability of adequately skilled
individuals in the available labour pool (i.e. those whose status is currently economically
inactive) and / or those coming out of full-time education and training. In many respects this
seems counter-intuitive in respect of the large number of individuals that have left the sector
since the start of the recession, although the assumption is that most employers will have
tried to retain their most skilled staff for as long as possible. This view is supported by the
finding that the majority of CBSE&P employers report that HtFVs result from a lack of skills,
experience or qualifications of those applying to work in the sector.
Significant opportunities also exist to improve the skills and competence of the existing
workforce, to increase productivity, reduce reliance on lower skilled or migrant workers, and
support the uptake of new technologies and methods. In addition to experiencing skill
deficiencies within the external workforce, employers in the sector also encounter skills
issues within their internal workforce, which are manifested as skills gaps.

Construction, Building Services Engineering and Planning: Sector Skills Assessment 2012
xiii
Skill gaps
One in ten employers across the CBSE&P sector report that they employed staff whom they
considered not fully proficient, amounting to four per cent of the workforce. Whilst this is
lower than the UK average for the wider economy, sector employers reporting skill gaps
described half of their employees (50 per cent) as lacking full proficiency in job-specific skills
and gaps exist across all of the major occupational areas.
The most common causes of skill gaps according to employers across the CBSE&P sector
is that staff have only partially completed their training (50 per cent) and that they are new to
the role (43 per cent). These findings serve to demonstrate the extent to which informal
routes of entry into the industry exist and points towards one of the most significant limiting
factors upon productivity performance across the sector.
One immediate consequence of skills gaps is an increase in workload for other staff and
increased operating costs. Clearly this affects sector productivity, but also has significant
implications in the medium to long-term, particularly in respect of introducing new working
practices. This is a specific concern within the CBSE&P sector as it is experiencing great
change in its working practices, and the expectation is that it has a central role to play in the
delivery of a low carbon economy. The UK was recently found to be in the top three
countries in the world in terms of working toward zero carbon in the built environment (RICS,
2011). Further investment in skills will be required to improve or maintain this position, and
deliver very challenging targets on carbon reduction.
Opportunities for growth
The available evidence suggests that there are direct and indirect links between innovation,
performance and skills. The suggestion is that low carbon working (encompassing the
design, construction and operation of buildings) will not only result in a more sustainable
sector, but will also impact positively on productivity. It will also necessitate the acquisition of
new skills.
The UK’s prosperity and national growth is in large measure dependent on an efficient
CBSE&P sector. At the same time, the UK’s commitment to reducing carbon and other
greenhouse gas emissions is now a matter of legal obligation. Under the Climate Change
Act 2008, emissions are targeted to fall by 26 per cent by 2020 and by no less than 80 per
cent to 2050. The built environment is one of the largest contributors to greenhouse
emissions, and therefore the sector has a major role to play in addressing the challenge,
through its changing systems and processes and the skills that support them.

Construction, Building Services Engineering and Planning: Sector Skills Assessment 2012
xiv
For the CBSE&P sector to progress and positively contribute towards a more efficient low
carbon economy a significant skills-led cultural change in the sector is required to drive it
towards a long-sought industry target of integrated and inter-disciplinary working.
Indeed, there is a growing recognition that multi-skilled employees represent a significant
benefit for businesses, enabling them to operate and interact across several sectors and
activities. Whilst this has, in part, been driven by structural changes imposed by the
recession, it is backed by a growing body of empirical evidence.
Skills priorities
New skills will be needed to meet the high specification and low energy requirements of
future buildings and infrastructure. The introduction of collaborative Building Information
Modelling and Management (BIM) and increased growth in offsite manufacturing are both
set to play a pivotal role as the industry moves from recession to recovery.
Changes in skills needs are particularly relevant for management and professional
occupations, with increasing demand for higher level skills. Greater skills will be required by
managers needing to operate businesses profitably in a competitive environment, and make
the best use of the skills of their current workforce, whilst professionals will have to learn
how to account for carbon using principles normally the preserve of accountants and
economists.
In general there will be a need for site supervisors and site labour that has an understanding
of modern terminology, the ability to read, understand and follow instructions on new
materials and components.
For professional services, in addition to an understanding of how new components will
operate over the life time of a building, off-site manufacture of components will require
increased need for CAD/CAM trained building technicians to work on off-site design and
application in factory conditions.
New ways of working will not always require new skills or create new jobs, but will often be
in addition to or an amalgam of existing workers’ skill sets. Increased multi-skilling is also
predicted.
In the short-term the challenge is to respond to the recession and there is ongoing pressure
to survive, but long-term skills’ planning is essential.

Construction, Building Services Engineering and Planning: Sector Skills Assessment 2012
xv
Although skills deficiencies do not appear to be significantly hampering growth in the sector
at the moment, this position could change. If there was a stronger than expected recovery in
macro-economic conditions this would lead to increased employment demand, which in turn
would impact upon vacancies, wages and migration.

Construction, Building Services Engineering and Planning: Sector Skills Assessment 2012
1
1 Introduction
1.1 Purpose of report
The aim of this report is to provide authoritative labour market intelligence (LMI) for the
construction, building services engineering and planning (CBSE&P) sector to inform the
strategic decision making of national governments in the development of employment and
skills policy. It is one of 15 UK Sector Skills Assessment (SSA) reports produced by Sector
Skills Councils1 and the UK Commission for Employment and Skills.
SSAs combine top-down data from official sources with bottom-up sectoral intelligence to
provide a consistent, comparable and rich understanding of the skills priorities within sectors
across the four UK nations. The reports have been produced to a common specification
(developed by the UK Commission in consultation with the four UK governments) and follow
a consistent structure.
Reports have been produced for the following sectors of the economy:
Agriculture, forestry and fishing
Energy production and utilities
Manufacturing
Construction, building services engineering and planning
Wholesale and retail trade
Transportation and storage
Hospitality, tourism and sport
Information and communication technologies
Creative media and entertainment
Financial, insurance & other professional services
Real estate and facilities management
Government
Education
Health
Care
1 Please note, the Education report was produced by LSIS who are not a licensed Sector Skills Council

Construction, Building Services Engineering and Planning: Sector Skills Assessment 2012
2
The reports contain intelligence on sectors and sub-sectors of particular interest to the four
UK governments. As each nation has different ‘key sectors’, that are defined in different
ways, it hasn’t be possible define the SSA sectors in a way that matches precisely the key
sectors identified by each nation government. Therefore, as far as possible, data has been
reported in such a way that it can be aggregated to produce an overall picture for key
sectors of interest. In some cases this will involve gathering information from more than one
SSA report.
The reports are designed to provide sectoral intelligence at a relatively broad level for
strategic decision making purposes. Whilst they do contain some sub-sectoral and
occupational intelligence, further intelligence at a more granular level may be available from
individual Sector Skills Councils.
In addition to the main UK reports, executive summaries have been produced for Scotland,
Wales and Northern Ireland. The UK reports contain information on key regional variations
between the four UK nations and within England where appropriate (for example if sectoral
employment is focused in a particular geographic area). However, the reports are not
designed to provide a comprehensive assessment of sectoral skills issues beyond the
national level.
1.2 Defining the sector
Construction, building services engineering and planning (CBSE&P) as a discrete sector
encompasses all business activities related to the planning, design, construction, operation,
and maintenance of the built environment. In this respect CBSE&P represents a wide variety
of business types and occupations, from construction contracting firms to professional
consultancies, and their workforces of skilled trades through to building professionals.
The sector covers both private and public organisations, and a wide range of business from
sole traders and micro-businesses, through to small and medium-sized enterprises, and up
to large national and international conglomerates.
The CBSE&P footprint is built on the grouping of four 2-digit SIC codes:
41 Construction of buildings
42 Civil engineering
43 Specialised construction activities
71 Architectural and engineering activities; technical testing and analysis.

Construction, Building Services Engineering and Planning: Sector Skills Assessment 2012
3
To meet consistency requirements, analysis of national datasets are undertaken at a 2-digit
SIC code level (or by combining 2-digit SIC codes where appropriate).
The CBSE&P sector is fairly well served in respect of SIC codes reflecting sectoral activity
and in terms of the robustness of the data at the 2-digit level.
With the exception is data on total employment and employment trends sub-sectoral data
from national datasets at a 4-digit SIC code level is not reported here, but where possible
this assessment reflects sub-sectoral differences and issues. Sub-sectoral analysis where
present utilises 4-digit SIC code definitions, details of which can be found in Appendix B.
It should be noted that throughout this report the information collected and analysed from
SSC commissioned research does not always conform to the SIC definition of the sector.
The reasons for this vary, but largely results from the research being commissioned by the
separate contributing SSCs and because the terminology that employers recognise and use
is not always consistent with SIC definitions. Every effort has been made to include
alternative meaningful analysis although the constraints and limitations of such analysis are
clearly noted.
In addition to SIC codes the sector is as much defined by the main occupations that work
within it. These hold a significant degree of currency with employers and also reflect the
strong federation presence within the sector. As a result occupational definitions are also
often viewed by employers and sector stakeholders as sub-sectors in their own right. This is
particularly true of activities within specialist contracting sector and professional services
sector, and is reflected in employer-based research commissioned by SSCs. However,
every effort has been made to minimise the use of such definitions in reference to sub-
sectors and provide a clear explanation of why such terminology is employed.
1.3 Sector Skills Councils
Sector Skills Councils (SSCs) provide employers with a unique forum to express the skills
and productivity needs pertinent to their sector. Each SSC is an employer-led, independent
organisation, covering a specific sector across the UK.
While each SSC is responsible for a specific sector or footprint (as defined by SIC codes
specified within their contract), many have cross sector interests and share common
strategic objectives. This is particularly evident across the built environment, and is reflected
in the composition of the construction, building services engineering and planning (CBSE&P)
sector.
Construction, Building Services Engineering and Planning: Sector Skills Assessment 2012
4
Four SSCs have an immediate interest in the CBSE&P sector, or parts thereof in terms of
SIC coverage set out in their respective licenses. Each has contributed to the production of
this assessment, or been consulted in its production. The relevant SSCs are:
ConstructionSkills the SSC for construction. As a partnership between
CITB-ConstructionSkills, the Construction Industry Council and CITB-Northern Ireland, it
covers the construction industry from crafts through to building professionals.
SummitSkills the SSC for the building services engineering sector, covering electro-
technical, heating, ventilation, air-conditioning, refrigeration and plumbing.
Asset Skills the SSC for the management and maintenance of the built environment,
which encompasses property, housing, facilities management and cleaning.
Semta the SSC for the science, engineering and manufacturing industries.
In addition to the contribution made to this assessment details of the research commissioned
by each individual SSC can be accessed via their respective websites:
ConstructionSkills http://www.cskills.org/sectorskills/researchfromssc/index.aspx
SummitSkills http://www.summitskills.org.uk/research/181
Asset Skills http://www.assetskills.org/Research/Research.aspx
Semta http://www.semta.org.uk/about us/media centre/labour market information.aspx
1.4 Summary of methodology
This report combines top-down data with bottom-up intelligence to provide a rich
assessment of sectoral skills priorities that is consistent and comparable with assessments
produced for other sectors of the economy.
Three main types of information have been drawn on in the preparation of this report:
Economy-wide quantitative data from core labour market information sources (such as
the Labour Force Survey and the UK Commission’s Employer Skills Survey).
Sectoral, sub-sectoral and occupational specific quantitative data generated by SSCs /
sector bodies and others (including Government departments and agencies, academics
and professional associations).
Qualitative information collected by SSCs / sector bodies and other organisations.

Construction, Building Services Engineering and Planning: Sector Skills Assessment 2012
5
To ensure consistency and comparability across all 15 SSA reports, data from core labour
market information sources was centrally collected, processed and formatted. It was then
distributed by the UK Commission to Sector Skills Councils / sector bodies for inclusion
within the reports. This data was quality assured by contractors, the UK Commission and by
Sector Skills Councils.
To meet consistency requirements, sub-sector analysis of data from core sources has
primarily been undertaken at a 2-digit Standard Industrial Classification (SIC) code level (or
by combining 2-digit SIC codes where appropriate).
Data from core sources has been supplemented within the report with data from sector
specific sources.
Sector Skills Councils commission primary research, in areas where gaps in knowledge or
sectoral coverage have been identified and where current information is lacking detail and /
or scarce. Nationally available data whilst allowing comparability between sectors,
particularly at the 2-digit and 3-digit SIC level, is much less robust in its coverage at a sub-
sectoral level and can lack currency in terms of reflecting recent changes to occupations and
activities. In this respect SSC research is designed to supplement and expand on the
existing evidence-base and information that might be gleaned from secondary sources.
The report also draws on qualitative research that has been undertaken to explore sectoral
skills issues in more detail. Qualitative research with small samples of employers (and
others); most commonly through interviews and focus groups, seeks to provide rich and
detailed understanding and insight, rather than measurement. Samples tend to be designed
to be broadly representative of the wider population, to gather a range of views. In terms of
skills research with employers, size and sector tend to be key drivers of demand and
therefore these are usually the main characteristics that are taken into account when
designing samples.
The report synthesises and contextualises information from the sources identified above
and, by undertaking a rigorous analysis of it, turns the information into intelligence.
Further information
Further methodological information is provided within Annex A. This includes descriptions of
the main quantitative and qualitative sources used within the report.
Construction, Building Services Engineering and Planning: Sector Skills Assessment 2012
6
2 Current performance of sector
Chapter Summary
In 2008 in the UK the broad Construction sector Gross Value Added (GVA) was almost
£81 billion, which accounted for just over six per cent of total UK GVA. This level of
contribution at UK level means in terms of GVA the Construction sector was the
seventh largest of the 15 broad sectors.
An economic study conducted by L.E.K. Consulting suggested that in 2009 the
Construction sector contributed £109 billion (directly c. 7.8 per cent, rising to c. 13 per
cent overall when the entire value chain is considered) to UK GDP. The study
suggested that £1 spent on construction output generates a total of £2.84 in total
economic activity (i.e. GDP increase).
The UK Construction sector almost doubled (increase of 91 per cent) in GVA from just
over £42 billion in 1999 to approaching £81 billion in 2008 (in current price terms).
There is general agreement that productivity in the CBSE&P sector lags behind some
other areas of the economy and compares poorly with other countries, particularly the
United States.
In 2010 in the UK CBSE&P sector there were just over 358,000 establishments which
accounted for 14 per cent of all establishments across all sectors in the economy.
In 2010 in the UK just under 95 per cent of establishments in the sector had less than
25 employees, which was the highest proportion of any sector except for the
Agriculture, forestry and fishing sector.
In 2009 the CBSE&P sector had the second highest number of business enterprise
start-ups at around 36,000 which accounted for 15 per cent of all economy business
enterprise start-ups. The sector had, however, the highest number of enterprise
business closures with just over 51,000 which accounted for 18 per cent of all business
enterprise closures. It should be noted that 2009 was not a typical year because of the
impact of the recession.

Construction, Building Services Engineering and Planning: Sector Skills Assessment 2012
7
In 2010 UK residents provided construction services with value of £1.22 billion outside
the UK, although non-UK residents provided construction services with an almost
identical value of £1.23 billion to the UK hence the balance of payments was -£11
million (i.e. more services were imported than exported).
According to a 2011 report published by Oxford Economics and Global Construction
Perspectives the global Construction market is forecast to grow to £7.5 trillion by 2020,
up by £3 trillion from £4.5 billion in 2010. By 2020 construction output is forecast to
account for about 13 per cent of the world’s GDP - with some of the larger emerging
markets such as China, India, Russia, Brazil and Poland driving growth, along with the
US.
Almost 2.7 million people were employed in the CBSE&P sector in 2010. The sector
accounted for nine per cent of total UK employment and was the fourth largest UK
sector (of 15) in terms of employment.
2.1 Economic performance
2.1.1 The current and recent economic performance and competitive position of the sector
Gross Value Added2 (GVA) represents the amount that individual businesses, industries or
sectors contribute to the economy. Broadly, this is measured by the income generated by
the business, industry or sector less their immediate consumption of goods and services
used up to produce their output.
Table 2.1 shows 2008 GVA in current basic prices both values and proportions by broad
sector for the UK and by devolved nation. In 2008 in the UK the broad Construction sector
GVA value was almost £81 billion, which accounted for just over six per cent of all sectors
GVA. This level of contribution at UK level means in terms of GVA the Construction sector
was the seventh largest of the 15 broad sectors.
2 Gross Value Added is the difference between the value of the output produced by a sector or region and its intermediate consumption. Intermediate consumption is the cost of raw materials and other inputs that are used up in the production process. (2010) The National Strategic Skills Audit for England. Volume 2: The Evidence Report, UK Commission.

Construction, Building Services Engineering and Planning: Sector Skills Assessment 2012
8
Table 2.1: GVA by nation (2008) (£m in current basic prices)
Note(s): Data is not organised by SSA sectors. This is because data is not available at a 2-digit (division) level. Therefore, the list of sectors presented in the table are those used in Regional Accounts. Source: Regional Accounts, Office National Statistics, 2010.
There is slight variation in the proportion of all sectors GVA that Construction accounted for
across the nations – ranging from just over six per cent in England and Wales to just over
seven per cent in Scotland and almost eight per cent in Northern Ireland. In terms of
contribution to all sectors GVA Construction was the sixth largest sector in Scotland and
Northern Ireland and seventh largest in England and Wales.
A study3 conducted by L.E.K. Consulting suggested that in 2009 the Construction sector
contributed £109 billion (directly c. 7.8 per cent, rising to c. 13 per cent overall when the
entire value chain is considered) to UK GDP. The study noted that Construction has been a
significant contributor to historical UK output growth and the Construction industry is a driver
of growth in other sectors due to its heavy reliance on an extended and varied supply chain.
The study suggested that £1 spent on construction output generated a total of £2.84 in total
economic activity (i.e. GDP increase). In addition to the economic benefits, every £1
invested in construction provides financial returns to the treasury in tax income and benefit
saving.
Table 2.2 shows 2008 GVA in current basic prices by English region. The proportion of all
sectors GVA that Construction accounted for varied by region from just over four per cent in
London to between six per cent and seven per cent in all other regions. An explanation for
the lower relative proportion that Construction accounts for in London is the high level of
contribution from Real estate, renting and business activities, Financial intermediation and
Other services sectors in this region.
3 L.E.K. consulting for UKCG (2009) Construction in the UK economy – the benefits of investment available at: http://www.ukcg.org.uk/fileadmin/documents/UKCG/pamphlets/UKCGfina.pdf, [Accessed 21st November 2011]. The report is based on economic analysis of national datasets, outline details of the calculation used to calculate the £2.84 figure are provided on p.10 of the report. The report has been widely published and cited in the industry.
UK England Scotland Wales
Northern
Ireland UK England Scotland Wales
Northern
Ireland
£m £m £m £m £m % % % % %
Agriculture, hunting, forestry & fishing 9,715 7,982 1,180 145 407 0 8% 0.7% 1.1% 0.3% 1.4%
Mining and quarrying of energy producing materials 2,661 1,298 1,277 60 27 0 2% 0.1% 1.2% 0.1% 0.1%
Other mining and quarrying 2,365 1,777 282 134 173 0 2% 0.2% 0.3% 0.3% 0.6%
Manufacturing 150,298 124,860 13,555 7,734 4,149 11 9% 11.5% 13.1% 17.0% 14.4%
Electricity, gas and water supply 21,342 17,414 2,653 729 545 1.7% 1.6% 2.6% 1.6% 1 9%
Construction 80,756 68,247 7,328 2,924 2,256 6.4% 6.3% 7.1% 6.4% 7 8%
Wholesale and retail trade (including motor trade) 147,158 127,900 10,441 5,166 3,651 11.7% 11.8% 10.1% 11.4% 12.7%
Hotels and restaurants 36,428 30,938 3,297 1,424 770 2 9% 2.9% 3.2% 3.1% 2.7%
Transport, storage and communication 91,347 80,262 7,065 2,529 1,491 7 2% 7.4% 6.8% 5.6% 5 2%
Financial intermediation 116,801 104,574 8,501 2,305 1,422 9 3% 9.7% 8.2% 5.1% 4 9%
Real estate, renting and business activities 303,179 268,770 20,829 8,380 5,200 24 0% 24.8% 20.1% 18.4% 18 0%
Public administration and defence 63,281 51,275 6,148 3,275 2,583 5 0% 4.7% 5.9% 7.2% 9 0%
Education 76,493 64,478 6,322 3,502 2,191 6.1% 6.0% 6.1% 7.7% 7.6%
Health and social work 93,775 76,336 9,851 4,788 2,800 7.4% 7.0% 9.5% 10.5% 9.7%
Other services 65,563 57,177 4,804 2,420 1,162 5 2% 5.3% 4.6% 5.3% 4 0%
All sectors 1,261,162 1,083,288 103,533 45,515 28,827 100 0% 100.0% 100.0% 100.0% 100 0%
Construction, Building Services Engineering and Planning: Sector Skills Assessment 2012
9
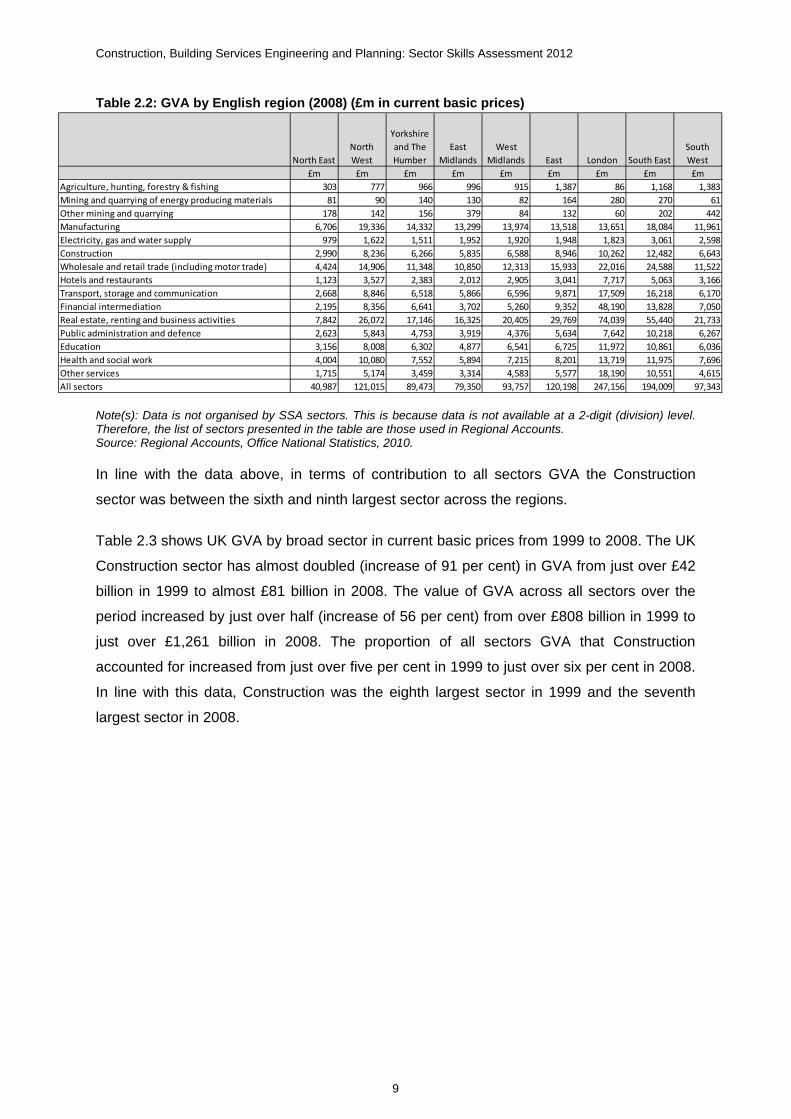
Table 2.2: GVA by English region (2008) (£m in current basic prices)
Note(s): Data is not organised by SSA sectors. This is because data is not available at a 2-digit (division) level. Therefore, the list of sectors presented in the table are those used in Regional Accounts. Source: Regional Accounts, Office National Statistics, 2010.
In line with the data above, in terms of contribution to all sectors GVA the Construction
sector was between the sixth and ninth largest sector across the regions.
Table 2.3 shows UK GVA by broad sector in current basic prices from 1999 to 2008. The UK
Construction sector has almost doubled (increase of 91 per cent) in GVA from just over £42
billion in 1999 to almost £81 billion in 2008. The value of GVA across all sectors over the
period increased by just over half (increase of 56 per cent) from over £808 billion in 1999 to
just over £1,261 billion in 2008. The proportion of all sectors GVA that Construction
accounted for increased from just over five per cent in 1999 to just over six per cent in 2008.
In line with this data, Construction was the eighth largest sector in 1999 and the seventh
largest sector in 2008.
North East
North
West
Yorkshire
and The
Humber
East
Midlands
West
Midlands East London South East
South
West
£m £m £m £m £m £m £m £m £m
Agriculture, hunting, forestry & fishing 303 777 966 996 915 1,387 86 1,168 1,383
Mining and quarrying of energy producing materials 81 90 140 130 82 164 280 270 61
Other mining and quarrying 178 142 156 379 84 132 60 202 442
Manufacturing 6,706 19,336 14,332 13,299 13,974 13,518 13,651 18,084 11,961
Electricity, gas and water supply 979 1,622 1,511 1,952 1,920 1,948 1,823 3,061 2,598
Construction 2,990 8,236 6,266 5,835 6,588 8,946 10,262 12,482 6,643
Wholesale and retail trade (including motor trade) 4,424 14,906 11,348 10,850 12,313 15,933 22,016 24,588 11,522
Hotels and restaurants 1,123 3,527 2,383 2,012 2,905 3,041 7,717 5,063 3,166
Transport, storage and communication 2,668 8,846 6,518 5,866 6,596 9,871 17,509 16,218 6,170
Financial intermediation 2,195 8,356 6,641 3,702 5,260 9,352 48,190 13,828 7,050
Real estate, renting and business activities 7,842 26,072 17,146 16,325 20,405 29,769 74,039 55,440 21,733
Public administration and defence 2,623 5,843 4,753 3,919 4,376 5,634 7,642 10,218 6,267
Education 3,156 8,008 6,302 4,877 6,541 6,725 11,972 10,861 6,036
Health and social work 4,004 10,080 7,552 5,894 7,215 8,201 13,719 11,975 7,696
Other services 1,715 5,174 3,459 3,314 4,583 5,577 18,190 10,551 4,615
All sectors 40,987 121,015 89,473 79,350 93,757 120,198 247,156 194,009 97,343

Construction, Building Services Engineering and Planning: Sector Skills Assessment 2012
10
Table 2.3: UK GVA (1999-2008) (£m in current basic prices)
Note(s): Data is not organised by SSA sectors. This is because data is not available at a 2-digit (division) level. Therefore, the list of sectors presented in the table are those used in Regional Accounts. Source: Regional Accounts, Office National Statistics, 2010.
Table 2.4 shows the GVA per employee job by sector and nation in 2009. In 2009 the
CBSE&P sector value of £65,000 per employee job exceeded that of the average for the
economy of £46,000. The sector is ranked fifth out of 15 sectors on this measure. This
pattern was similar across the devolved nations where the sector had the same ranking in
England, Wales and Northern Ireland, falling to sixth in Scotland.
It should be noted, however, that these estimates overstate productivity in the sector to
some exten0074, since the denominator for the productivity ratio is employee jobs and there
is a significant number of self-employed workers in the construction sector.
1999 2000 2001 2002 2003 2004 2005 2006 2007 2008
£m £m £m £m £m £m £m £m £m £m
Agriculture, hunting, forestry & fishing 9,022 8,532 8,333 9,007 9,807 10,670 7,530 7,792 8,632 9,715
Mining and quarrying of energy producing materials 2,059 1,998 1,874 1,661 1,456 1,643 2,055 2,297 1,861 2,661
Other mining and quarrying 1,700 1,784 1,750 1,469 1,519 1,848 2,115 2,145 2,291 2,365
Manufacturing 151,157 150,009 149,223 146,308 144,845 145,689 148,110 151,455 154,726 150,298
Electricity, gas and water supply 15,703 15,798 15,660 16,052 16,405 16,106 16,685 20,279 21,884 21,342
Construction 42,236 45,626 50,526 54,684 59,522 66,029 69,868 74,619 80,675 80,756
Wholesale and retail trade (including motor trade) 99,509 103,410 110,249 113,777 120,520 127,367 129,810 135,366 141,735 147,158
Hotels and restaurants 24,146 25,605 26,928 28,639 30,120 31,870 32,902 34,594 35,962 36,428
Transport, storage and communication 64,961 69,201 70,502 73,064 76,587 79,020 80,889 83,655 88,280 91,347
Financial intermediation 48,545 44,989 48,202 63,367 71,530 75,117 79,553 90,807 103,731 116,801
Real estate, renting and business activities 173,329 188,361 204,041 214,849 232,204 248,677 260,116 276,108 296,955 303,179
Public administration and defence 39,891 41,645 43,855 46,212 49,768 53,779 58,229 60,385 61,503 63,281
Education 44,914 48,111 51,675 55,099 58,328 61,934 65,739 68,926 72,766 76,493
Health and social work 51,577 55,282 59,549 64,492 70,593 75,154 79,965 85,965 89,381 93,775
Other services 39,821 42,085 44,560 48,311 51,804 54,947 57,961 60,166 62,824 65,563
All sectors 808,570 842,436 886,927 936,991 995,008 1,049,850 1,091,527 1,154,559 1,223,206 1,261,162

Construction, Building Services Engineering and Planning: Sector Skills Assessment 2012
11
Table 2.4: Estimated workplace gross value added per employee job at current basic prices, 2009
SSA Sector UK England Wales Scotland Northern Ireland
£000s £000s £000s £000s £000s Agriculture, forestry and fishing 35 41 11 21 25Energy production and utilities 131 134 118 127 107Manufacturing 52 51 49 61 53Construction, building services engineering and planning 65 66 54 60 56Wholesale and retail trade 33 33 27 29 27Transportation and storage 50 51 44 50 41Hospitality, tourism and sport 23 23 21 22 20Information and communication technologies 83 84 72 77 63Creative media and entertainment 45 49 30 12 38Financial, insurance & other professional services 86 89 57 69 63Real estate and facilities management 85 86 103 67 98Government services 39 40 33 35 40Education 33 33 32 36 33Health 27 27 26 25 23Care 30 30 28 31 26Not within scope 32 33 27 35 30All sectors 46 47 38 43 38
Source: UK Commission estimates based on Regional Accounts; Annual Business Survey; Business Register and Employment Survey (BRES). See technical appendix for basis for estimates. Notes: Figures for Real estate and facilities management sector include contribution from owner-occupier imputed rental. All figures exclude Extra-Regio element. Estimates will tend to overstate the level of GVA per job in those sectors with high levels of self-employment.
The CBSE&P sector remains a relatively labour-intensive sector and this explains why the
GVA per person employed figure is lower than other less labour-intensive sectors such as
energy production and utilities.
The Working Futures model (Wilson and Homenidou, 2011) provides historic estimates of
productivity (output per job) by sector on a constant price (chained volume measure) basis.
This analysis indicates an average rate of productivity growth for the UK construction sector
for the first half of the last decade (2000-2005) of 0.6 per cent per annum. This is much
lower than the average rate for the wider UK economy of 1.4 per cent. According to Working
Futures the relatively slow rate of growth in construction productivity can be linked to the
sustained growth in employment levels in the sector over the period in question.
Arguments about the completeness of macro indicators aside the consensus that the
greatest ‘drain’ on productivity in construction relates to poor planning, which prevents the
efficient use of the workforce and creates re-work due to preventable errors. There has been
over the last decade a major drive to fix the problems by changing the way the industry
operates. This has had, and will have, implications for the managers in larger companies
Construction, Building Services Engineering and Planning: Sector Skills Assessment 2012
12
who have to adapt their skills set to deal with greater risk, wider involvement in the whole
construction cycle and a partnering culture.
In 2011 ConstructionSkills commissioned a study 4 into Productivity in the Construction
Sector which comprised of 150 telephone interviews with construction managers and
supervisors across a range of companies working within the construction sector. Its aim was
to understand what productivity means to the industry through a series of depth and
extended telephone interviews across five categories of firm: civil engineering, house
builders, general building, specialist trades and repair and maintenance (R&M). Overall the
research found that there is not one clearly established definition of productivity, the term
has various meanings and is interpreted differently by different respondents. Comparison is
almost always in terms of what the individual company has done before, with no reference to
any industry standard.
Respondents were asked spontaneously how they define productivity; the research found
the most common response (34 per cent) was productivity tends to be defined against
targets, estimates or programmes of work. Just over one in ten (11 per cent) equate
productivity with profitability, with smaller numbers defining it in terms of units produced
(seven per cent), man hours per task or unit (seven per cent) or as turnover (six per cent).
When prompted with definitions of productivity and asked which most closely matched their
definition (respondents could select more than one definition) respondents tended to select
several definitions. The largest single answer was to define productivity in terms of man
hours per task/unit (61 per cent). Around half (50 per cent) define it as the total project cost
divided by the number of man hours needed to complete that project and number of units
produced in a certain time period (47 per cent), with around two fifths each mentioning
resources taken to produce a unit of production (41 per cent) or value of output per person
per hour (39 per cent).
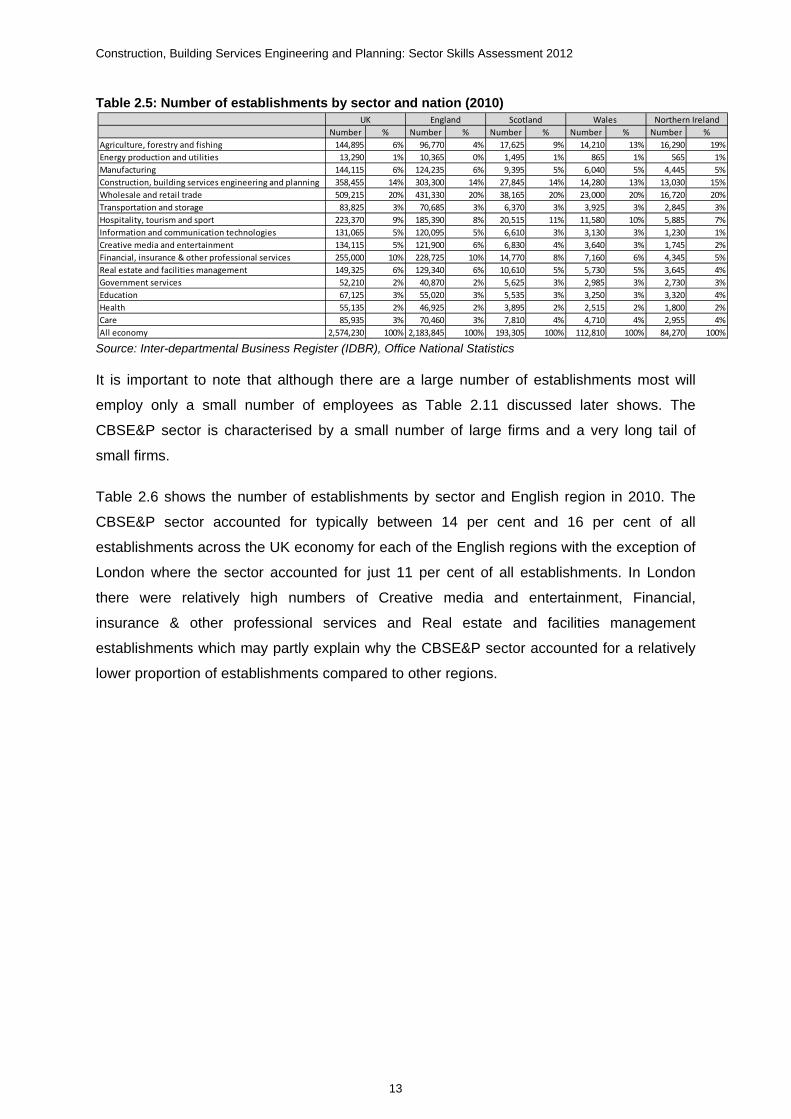
2.1.2 Employer profile (number of employers, size, start-ups and closures)
Table 2.5 shows the number of establishments by sector and UK nation in 2010. In 2010 in
the UK CBSE&P sector there were just over 358,000 establishments which accounted for 14
per cent of all establishments across all sectors in the economy. This proportion is the same
or within one percentage point of the level in each of the UK nations. In terms of the total
number of establishments the CBSE&P sector had the second highest number across
sectors and was second only to Wholesale and retail trade sector.
4 ConstructionSkills (2011) Productivity in the Construction Sector. Not published yet.
Construction, Building Services Engineering and Planning: Sector Skills Assessment 2012
13
Table 2.5: Number of establishments by sector and nation (2010)
Source: Inter-departmental Business Register (IDBR), Office National Statistics
It is important to note that although there are a large number of establishments most will
employ only a small number of employees as Table 2.11 discussed later shows. The
CBSE&P sector is characterised by a small number of large firms and a very long tail of
small firms.
Table 2.6 shows the number of establishments by sector and English region in 2010. The
CBSE&P sector accounted for typically between 14 per cent and 16 per cent of all
establishments across the UK economy for each of the English regions with the exception of
London where the sector accounted for just 11 per cent of all establishments. In London
there were relatively high numbers of Creative media and entertainment, Financial,
insurance & other professional services and Real estate and facilities management
establishments which may partly explain why the CBSE&P sector accounted for a relatively
lower proportion of establishments compared to other regions.
Number % Number % Number % Number % Number %
Agriculture, forestry and fishing 144,895 6% 96,770 4% 17,625 9% 14,210 13% 16,290 19%
Energy production and utilities 13,290 1% 10,365 0% 1,495 1% 865 1% 565 1%
Manufacturing 144,115 6% 124,235 6% 9,395 5% 6,040 5% 4,445 5%
Construction, building services engineering and planning 358,455 14% 303,300 14% 27,845 14% 14,280 13% 13,030 15%
Wholesale and retail trade 509,215 20% 431,330 20% 38,165 20% 23,000 20% 16,720 20%
Transportation and storage 83,825 3% 70,685 3% 6,370 3% 3,925 3% 2,845 3%
Hospitality, tourism and sport 223,370 9% 185,390 8% 20,515 11% 11,580 10% 5,885 7%
Information and communication technologies 131,065 5% 120,095 5% 6,610 3% 3,130 3% 1,230 1%
Creative media and entertainment 134,115 5% 121,900 6% 6,830 4% 3,640 3% 1,745 2%
Financial, insurance & other professional services 255,000 10% 228,725 10% 14,770 8% 7,160 6% 4,345 5%
Real estate and facilities management 149,325 6% 129,340 6% 10,610 5% 5,730 5% 3,645 4%
Government services 52,210 2% 40,870 2% 5,625 3% 2,985 3% 2,730 3%
Education 67,125 3% 55,020 3% 5,535 3% 3,250 3% 3,320 4%
Health 55,135 2% 46,925 2% 3,895 2% 2,515 2% 1,800 2%
Care 85,935 3% 70,460 3% 7,810 4% 4,710 4% 2,955 4%
All economy 2,574,230 100% 2,183,845 100% 193,305 100% 112,810 100% 84,270 100%
Northern IrelandUK England Scotland Wales

Construction, Building Services Engineering and Planning: Sector Skills Assessment 2012
14
Table 2.6: Number of establishments by sector and English region (2010)
Source: Inter-departmental Business Register (IDBR), Office National Statistics
Table 2.7 shows the number of establishments by sector in the UK from 2006-2010. Across
the whole economy the total number of establishments increased by a very small proportion
(two per cent) over the period. The number of establishments in the CBSE&P sector
increased by over half (55 per cent) over the same period. This strong level of growth was
the fourth highest across all sectors ranking after Education (132 per cent), Care (114 per
cent) and Health (113 per cent) over the same period. In 2006 the sector accounted for just
over nine per cent of all establishments and in 2010 almost 14 per cent of all establishments.
Table 2.7: Number of establishments by sector (UK) (2006-2010)
Note: Data for 2006-2008 is based on SIC 2003 whereas data beyond this uses SIC 2007. Some of the data for 2006-2008 is based on estimates. Source: Inter-departmental Business Register (IDBR), Office National Statistics.
North
East
North
West
Yorkshire
and The
Humber
East
Midlands
West
Midlands East London
South
East
South
West
Agriculture, forestry and fishing 3,870 11,305 11,205 10,770 11,880 12,170 935 11,785 22,850
Energy production and utilities 475 1,460 1,155 1,025 1,065 1,320 950 1,605 1,310
Manufacturing 4,650 15,950 13,100 12,915 15,930 15,235 13,350 20,025 13,080
Construction, building services engineering and planning 10,845 35,520 26,035 24,975 28,750 41,485 42,520 58,785 34,385
Wholesale and retail trade 16,630 55,955 41,975 36,895 45,695 48,635 67,620 71,850 46,075
Transportation and storage 2,610 8,775 7,270 6,830 7,930 9,305 9,190 11,570 7,205
Hospitality, tourism and sport 8,395 23,095 17,600 14,030 16,700 19,290 32,470 31,885 21,925
Information and communication technologies 2,325 10,885 6,685 6,900 9,260 14,735 29,655 28,805 10,845
Creative media and entertainment 2,660 10,035 6,735 6,215 7,425 12,210 43,255 22,760 10,605
Financial, insurance & other professional services 5,440 23,475 14,900 14,950 18,300 23,850 61,915 45,495 20,400
Real estate and facilities management 4,185 14,800 10,225 9,390 11,925 15,045 27,475 22,980 13,315
Government services 1,815 4,810 4,260 4,270 4,040 4,215 6,495 6,340 4,625
Education 2,495 6,890 4,965 4,810 5,465 6,330 8,215 9,925 5,925
Health 2,010 6,255 4,265 3,830 4,570 4,850 8,045 8,280 4,820
Care 3,575 9,340 6,950 6,110 6,940 7,210 10,725 11,700 7,910
All economy 75,975 255,705 187,810 174,700 210,065 253,120 392,540 394,505 239,425
2006 2007 2008 2009 2010
%
Change
2006‐
2010
Agriculture, forestry and fishing 146,485 158,080 163,715 146,620 144,895 ‐1%
Energy production and utilities 18,170 18,260 11,435 12,980 13,290 ‐27%
Manufacturing 165,675 163,525 167,335 151,165 144,115 ‐13%
Construction, building services engineering and planning 230,610 240,535 258,055 374,320 358,455 55%
Wholesale and retail trade 533,105 532,905 532,060 520,070 509,215 ‐4%
Transportation and storage 70,425 70,750 71,665 86,680 83,825 19%
Hospitality, tourism and sport 219,770 222,920 227,430 229,690 223,370 2%
Information and communication technologies 136,395 140,505 144,080 134,805 131,065 ‐4%
Creative media and entertainment 125,100 130,185 131,180 132,225 134,115 7%
Financial, insurance & other professional services 271,310 283,920 287,015 256,915 255,000 ‐6%
Real estate and facilities management 180,305 191,195 201,915 155,855 149,325 ‐17%
Government services 159,395 164,690 54,875 52,060 52,210 ‐67%
Education 28,935 28,880 66,055 66,725 67,125 132%
Health 25,860 25,810 53,300 53,900 55,135 113%
Care 40,150 40,075 82,755 83,675 85,935 114%
All economy 2,533,855 2,600,065 2,643,215 2,634,790 2,574,230 2%
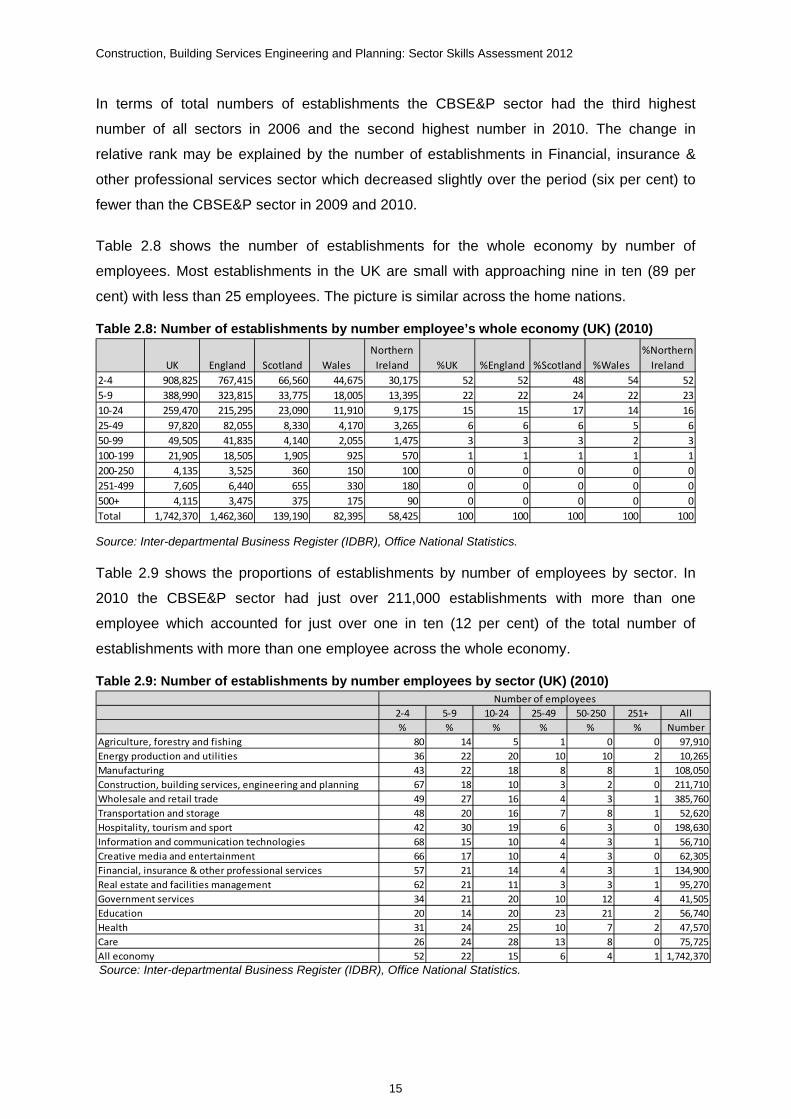
Construction, Building Services Engineering and Planning: Sector Skills Assessment 2012
15
In terms of total numbers of establishments the CBSE&P sector had the third highest
number of all sectors in 2006 and the second highest number in 2010. The change in
relative rank may be explained by the number of establishments in Financial, insurance &
other professional services sector which decreased slightly over the period (six per cent) to
fewer than the CBSE&P sector in 2009 and 2010.
Table 2.8 shows the number of establishments for the whole economy by number of
employees. Most establishments in the UK are small with approaching nine in ten (89 per
cent) with less than 25 employees. The picture is similar across the home nations.
Table 2.8: Number of establishments by number employee’s whole economy (UK) (2010)
Source: Inter-departmental Business Register (IDBR), Office National Statistics.
Table 2.9 shows the proportions of establishments by number of employees by sector. In
2010 the CBSE&P sector had just over 211,000 establishments with more than one
employee which accounted for just over one in ten (12 per cent) of the total number of
establishments with more than one employee across the whole economy.
Table 2.9: Number of establishments by number employees by sector (UK) (2010)
Source: Inter-departmental Business Register (IDBR), Office National Statistics.
UK England Scotland Wales
Northern
Ireland %UK %England %Scotland %Wales
%Northern
Ireland
2‐4 908,825 767,415 66,560 44,675 30,175 52 52 48 54 52
5‐9 388,990 323,815 33,775 18,005 13,395 22 22 24 22 23
10‐24 259,470 215,295 23,090 11,910 9,175 15 15 17 14 16
25‐49 97,820 82,055 8,330 4,170 3,265 6 6 6 5 6
50‐99 49,505 41,835 4,140 2,055 1,475 3 3 3 2 3
100‐199 21,905 18,505 1,905 925 570 1 1 1 1 1
200‐250 4,135 3,525 360 150 100 0 0 0 0 0
251‐499 7,605 6,440 655 330 180 0 0 0 0 0
500+ 4,115 3,475 375 175 90 0 0 0 0 0
Total 1,742,370 1,462,360 139,190 82,395 58,425 100 100 100 100 100
2‐4 5‐9 10‐24 25‐49 50‐250 251+ All
% % % % % % Number
Agriculture, forestry and fishing 80 14 5 1 0 0 97,910
Energy production and utilities 36 22 20 10 10 2 10,265
Manufacturing 43 22 18 8 8 1 108,050
Construction, building services, engineering and planning 67 18 10 3 2 0 211,710
Wholesale and retail trade 49 27 16 4 3 1 385,760
Transportation and storage 48 20 16 7 8 1 52,620
Hospitality, tourism and sport 42 30 19 6 3 0 198,630
Information and communication technologies 68 15 10 4 3 1 56,710
Creative media and entertainment 66 17 10 4 3 0 62,305
Financial, insurance & other professional services 57 21 14 4 3 1 134,900
Real estate and facilities management 62 21 11 3 3 1 95,270
Government services 34 21 20 10 12 4 41,505
Education 20 14 20 23 21 2 56,740
Health 31 24 25 10 7 2 47,570
Care 26 24 28 13 8 0 75,725
All economy 52 22 15 6 4 1 1,742,370
Number of employees

Construction, Building Services Engineering and Planning: Sector Skills Assessment 2012
16
The CBSE&P sector contains a high proportion of establishments that employ small
numbers of employees. In 2010 at UK level just under 95 per cent of establishments in the
sector had less than 25 employees, which was the highest proportion of any sector except
for Agriculture, forestry and fishing which had 99 per cent with less than 25 employees.
Exactly five per cent of establishments in the sector employed between 25 and 250
employees, the smallest proportion of all sectors with the exception of Agriculture, forestry
and fishing which had one per cent with between 25 and 250 employees. As might be
expected the sector had a very low proportion of establishments with more than 250
employees, 0.2 per cent of establishments were of this size, the lowest proportion of all
sectors with the exception of Agriculture, forestry and fishing which had 0.03 per cent with
this number of employees.
It is important to note that although the sector is characterised by a large number of small
firms employing less than 25 employees (95 per cent) the large firms that do exist within the
sector carry out a disproportionate share of the work by value. In addition a large proportion
(36 per cent) of the sector workforce is self-employed.
Table 2.10 shows the number and proportion of establishments by employee size band by
nation for the CBSE&P sector in 2010. The distribution by size band is fairly similar (within
six percentage points) across the home nations. Scotland contains a slightly lower
proportion of very small establishments, 61 per cent have two to four employees compared
to 67 per cent for UK. The difference may be explained by the slightly higher proportion of
larger establishments - those with ten to 250 employees which accounted for 19 per cent of
establishments in Scotland compared to 15 per cent of those across UK.

Construction, Building Services Engineering and Planning: Sector Skills Assessment 2012
17
Table 2.10: Number of establishments by number employees within CBSE&P sector by nation (2010)
Source: Inter-departmental Business Register (IDBR), Office National Statistics.
Table 2.11 shows the number and proportion of business enterprise start-ups and closures
by sector in 2009. The CBSE&P sector had the second highest number of business
enterprise start-ups at almost 36,000 which accounted for 15 per cent of all economy
business enterprise start-ups and was second only to Wholesale and retail trade which had
nearly 39,000 accounting for 16 per cent of all business enterprise start-ups. The sector had,
however, the highest number of enterprise business closures with just over 51,000 in 2009
which accounted for 18 per cent of all business enterprise closures.
The ratio of closures to start-ups, at 1.4 for the sector, is slightly higher than the average for
the whole economy (1.2).
Table 2.11: Business (enterprise) start-ups and closures (UK) (2009)
Source: Business Demography - Enterprise Births, Deaths and Survivals 2009, Office National Statistics.
In comparison Wholesale, retail and trade in 2009 had just over 47,000 which accounted for
17 per cent of all business enterprise closures.
Number % Number % Number % Number %
2‐4 121,140 68 10,105 61 6,120 66 5,415 65
5‐9 30,910 17 3,230 19 1,785 19 1,695 20
10‐24 16,395 9 2,020 12 905 10 880 10
25‐49 5,055 3 695 4 255 3 270 3
50‐250 3,570 2 525 3 185 2 120 1
251+ 345 0 65 0 20 0 5 0
Total 177,415 100 16,640 100 9,270 100 8,385 100
England Scotland Wales Northern Ireland
Start‐ups Closures
Number Number
Agriculture, forestry and fishing (SIC 75 only) 285 190
Energy production and utilities 1,270 408
Manufacturing 10,570 15,445
Construction, building services engineering and planning 35,835 51,040
Wholesale and retail trade 38,760 47,090
Transportation and storage 6,980 10,805
Hospitality, tourism and sport 23,345 28,030
Information and communication technologies 16,120 19,935
Creative media and entertainment 24,290 20,805
Financial, insurance & other professional services 25,640 25,765
Real estate and facilities management 12,805 16,275
Government services (SIC 94 only) 1,010 1,260
Education 3,485 3,160
Health 4,135 3,110
Care 2,745 2,165
Other sectors 28,750 32,135
All economy 236,025 277,618
Sector

Construction, Building Services Engineering and Planning: Sector Skills Assessment 2012
18
This high level of business start-ups suggests an entrepreneurial spirit in the sector and may
reflect people setting up business on their own as self-employed workers following a period
working for a larger company. The high level of business failures, however, recognises that
the sector is volatile and competitive, although it should be noted that business conditions
were particularly difficult in 2009 as a result of the impact of the recession. It may be that
many people whose businesses fail leave the sector to work elsewhere and do not return.
The high level of business failures in the CBSE&P sector may indicate that additional
support is needed for new businesses, it could be that some of the workforce lack the
managerial or business skills needed to make a transition to self-employment.
2.1.3 Extent to which sector employers compete internationally
Construction is a site-specific process and as such it is relatively difficult to measure the size
of its export market. Many UK firms work overseas and vice versa, although they often
employ local staff and often set up local subsidiaries. The picture has also been clouded by
the acquisition of many UK firms by international conglomerates. However, of those UK
construction companies that work overseas the majority tend to do so in the Middle East and
the United States rather than Europe. The situation is slightly more complicated in respect of
professional services, as they can work on a UK project in Singapore, for example, and vice
versa.
With the exception of professional services the construction sector has previously been
relatively immune to off shoring, although increasing levels of technological change might
hasten a move away from traditional construction methods towards manufacturing, which
could be undertaken outside the UK. The aggregation of firms through mergers and
acquisitions, prompted in some cases as a means of surviving the recession, and often
involving non-UK companies, might itself result in certain construction activities being moved
away from the UK. The impact of such actions in terms of their environmental cost may
conspire to safeguard certain construction activities, certainly those involving significant
levels of labour input.
The Pink Book5 provides headline statistics for UK construction trade in services - the
provision of services by UK residents to non-residents and vice versa. Construction services
covers work done on construction projects and installations by employees of an enterprise in
locations outside the resident economic territory of the enterprise.
5 United Kingdom Balance of Payments: The Pink Book. Office National Statistics (2011)

Construction, Building Services Engineering and Planning: Sector Skills Assessment 2012
19
Table 2.12 shows the trade in services for the UK construction sector from 2007-2010. In
2010 UK residents provided construction services with value of £1.22 billion outside the UK,
although non-UK residents provided construction services with an almost identical value of
£1.23 billion to the UK hence the balance of payments was -£11 million (more services were
imported than exported). In the three years prior to 2010 the sector had positive net export
values (more value was exported than imported) with an average value of £186 million. It is
very likely that the global recession has led to decreased imports and exports for
construction services in 2010 compared to 2009. Indeed, the worldwide decline in
construction activity has most notably impacted on UK professional services, and has been
particularly visible in the reduced demand across the Middle East and Asia.
UK construction export has tended to focus on high-value services such as engineering
consultancy and design, architectural activities, and property management, which have been
hit particularly hard during the recession.
Table 2.12: Trade in Services (UK) (2007-2010) (£ million)
Source: United Kingdom Balance of Payments: The Pink Book (Office National Statistics 2011)
At the end of 2011 Building magazine published a white paper6 which included findings from
a survey and face to face interviews with 75 CEOs across the built environment.
The CEO of a quantity surveyor with a turnover of more than £150 million said: ‘I expect to
see a greater focus on globalisation – people will look outside the UK for growth. Davis
Langdon, Turner & Townsend, EC Harris and the like are all pretty global already but the
next tier down are dependent on the UK for revenues and will have a tough time.’ Although
using a low survey base size the survey indicates that small and medium firms are less able
to compete globally and are more reliant on UK revenues.
Most of the 75 surveyed were also aware of the potential threats of globalisation given that
almost 40 per cent said they were either fairly or very concerned about the threat of
international competitors winning work in the UK.
According to a 2011 report 7 published by Oxford Economics and Global Construction
Perspectives the global Construction market is forecast to grow to £7.5 trillion by 2020, up
6 White Papers: 03/CEO State of the Nation, www.building.co.uk (2011) 7 Global Construction 2020, Oxford Economics and Global Construction Perspectives (2011). All construction output forecasts in the report use a model of the global construction sector. This model is linked to Oxford Economics Global Economic Model – a widely used commercial model of world economics.
2007 2008 2009 2010 2007 2008 2009 2010 2007 2008 2009 2010
Construction 996 1,246 1,561 1,218 805 1,095 1,346 1,229 191 151 215 -11
Exports Imports Balance of PaymentsSector
Construction, Building Services Engineering and Planning: Sector Skills Assessment 2012
20
by £3 trillion from 2010 £4.5 billion. By 2020 construction output is forecast to account for
about 13 per cent of the world’s GDP - with some of the larger emerging markets such as
China, India, Russia, Brazil and Poland driving growth, along with the US.
According to the research China alone was expected to be responsible for almost a third of
the growth over the period, and its construction market has already overtaken that of the US
as a result of investment in power generation and other infrastructure along with high speed
rail.
The wider Asia Pacific region and specifically Vietnam and Indonesia are also a major
source of growth, averaging more than seven per cent over the next decade. Other
developing countries expected to see significant construction spending include India,
Turkey, Romania, Nigeria and Qatar while in the developed world, Australia, Canada and
the US are all forecast to see substantial growth.
2.2 Employment
2.2.1 Employment level
Table 2.13 shows that in 2010 almost 2.7 million people were employed in the CBSE&P
sector across the whole of the UK. The CBSE&P sector accounted for nine per cent of UK
employment (nine per cent England, Wales and Northern Ireland and ten per cent Scotland
employment) and in terms of total employment numbers it was the fourth largest UK sector.
Around 84 per cent of the sector workforce was employed in England, nine per cent in
Scotland, four per cent in Wales and three per cent in Northern Ireland.
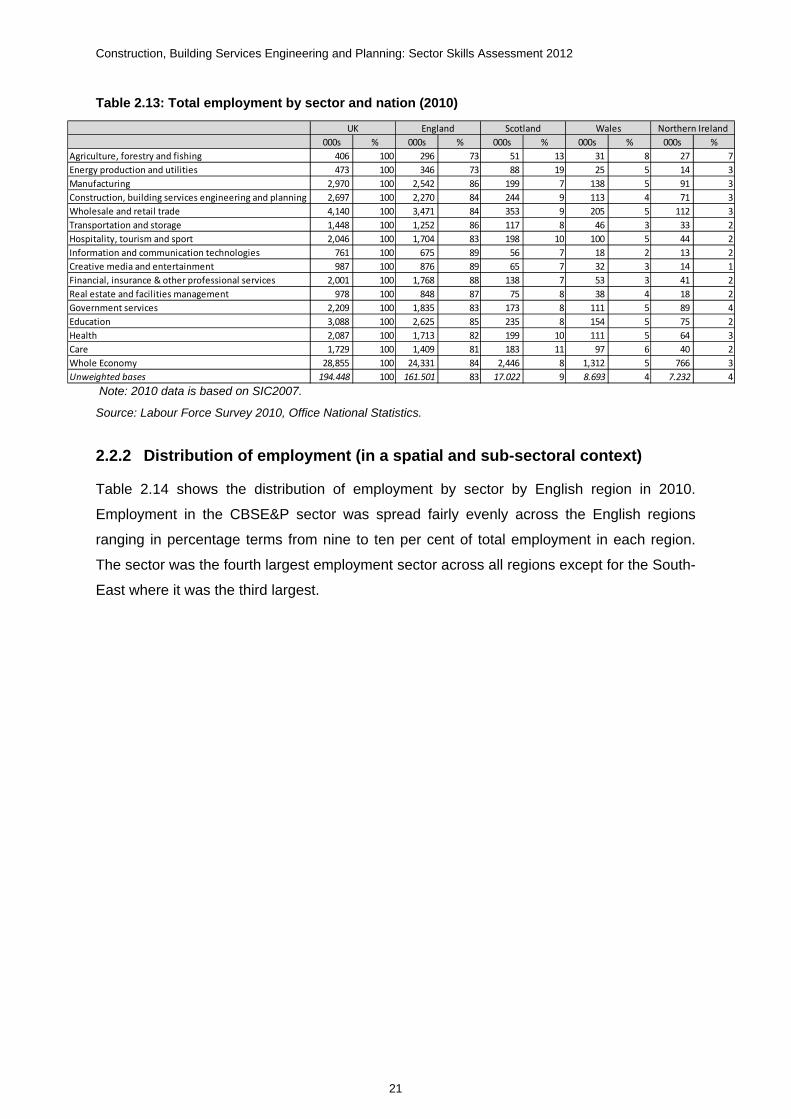
Construction, Building Services Engineering and Planning: Sector Skills Assessment 2012
21
Table 2.13: Total employment by sector and nation (2010)
Note: 2010 data is based on SIC2007.
Source: Labour Force Survey 2010, Office National Statistics.
2.2.2 Distribution of employment (in a spatial and sub-sectoral context)
Table 2.14 shows the distribution of employment by sector by English region in 2010.
Employment in the CBSE&P sector was spread fairly evenly across the English regions
ranging in percentage terms from nine to ten per cent of total employment in each region.
The sector was the fourth largest employment sector across all regions except for the South-
East where it was the third largest.
000s % 000s % 000s % 000s % 000s %
Agriculture, forestry and fishing 406 100 296 73 51 13 31 8 27 7
Energy production and utilities 473 100 346 73 88 19 25 5 14 3
Manufacturing 2,970 100 2,542 86 199 7 138 5 91 3
Construction, building services engineering and planning 2,697 100 2,270 84 244 9 113 4 71 3
Wholesale and retail trade 4,140 100 3,471 84 353 9 205 5 112 3
Transportation and storage 1,448 100 1,252 86 117 8 46 3 33 2
Hospitality, tourism and sport 2,046 100 1,704 83 198 10 100 5 44 2
Information and communication technologies 761 100 675 89 56 7 18 2 13 2
Creative media and entertainment 987 100 876 89 65 7 32 3 14 1
Financial, insurance & other professional services 2,001 100 1,768 88 138 7 53 3 41 2
Real estate and facilities management 978 100 848 87 75 8 38 4 18 2
Government services 2,209 100 1,835 83 173 8 111 5 89 4
Education 3,088 100 2,625 85 235 8 154 5 75 2
Health 2,087 100 1,713 82 199 10 111 5 64 3
Care 1,729 100 1,409 81 183 11 97 6 40 2
Whole Economy 28,855 100 24,331 84 2,446 8 1,312 5 766 3
Unweighted bases 194.448 100 161.501 83 17.022 9 8.693 4 7.232 4
UK England Scotland Wales Northern Ireland
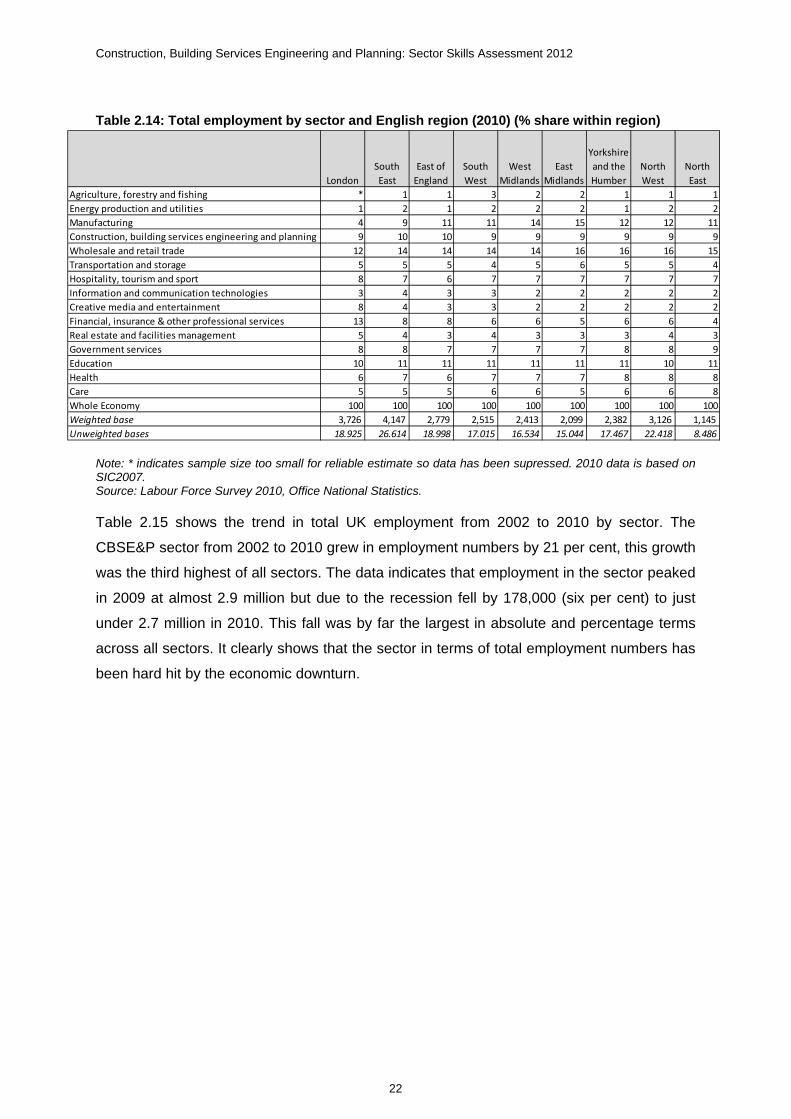
Construction, Building Services Engineering and Planning: Sector Skills Assessment 2012
22
Table 2.14: Total employment by sector and English region (2010) (% share within region)
Note: * indicates sample size too small for reliable estimate so data has been supressed. 2010 data is based on SIC2007. Source: Labour Force Survey 2010, Office National Statistics.
Table 2.15 shows the trend in total UK employment from 2002 to 2010 by sector. The
CBSE&P sector from 2002 to 2010 grew in employment numbers by 21 per cent, this growth
was the third highest of all sectors. The data indicates that employment in the sector peaked
in 2009 at almost 2.9 million but due to the recession fell by 178,000 (six per cent) to just
under 2.7 million in 2010. This fall was by far the largest in absolute and percentage terms
across all sectors. It clearly shows that the sector in terms of total employment numbers has
been hard hit by the economic downturn.
London
South
East
East of
England
South
West
West
Midlands
East
Midlands
Yorkshire
and the
Humber
North
West
North
East
Agriculture, forestry and fishing * 1 1 3 2 2 1 1 1
Energy production and utilities 1 2 1 2 2 2 1 2 2
Manufacturing 4 9 11 11 14 15 12 12 11
Construction, building services engineering and planning 9 10 10 9 9 9 9 9 9
Wholesale and retail trade 12 14 14 14 14 16 16 16 15
Transportation and storage 5 5 5 4 5 6 5 5 4
Hospitality, tourism and sport 8 7 6 7 7 7 7 7 7
Information and communication technologies 3 4 3 3 2 2 2 2 2
Creative media and entertainment 8 4 3 3 2 2 2 2 2
Financial, insurance & other professional services 13 8 8 6 6 5 6 6 4
Real estate and facilities management 5 4 3 4 3 3 3 4 3
Government services 8 8 7 7 7 7 8 8 9
Education 10 11 11 11 11 11 11 10 11
Health 6 7 6 7 7 7 8 8 8
Care 5 5 5 6 6 5 6 6 8
Whole Economy 100 100 100 100 100 100 100 100 100
Weighted base 3,726 4,147 2,779 2,515 2,413 2,099 2,382 3,126 1,145
Unweighted bases 18.925 26.614 18.998 17.015 16.534 15.044 17.467 22.418 8.486
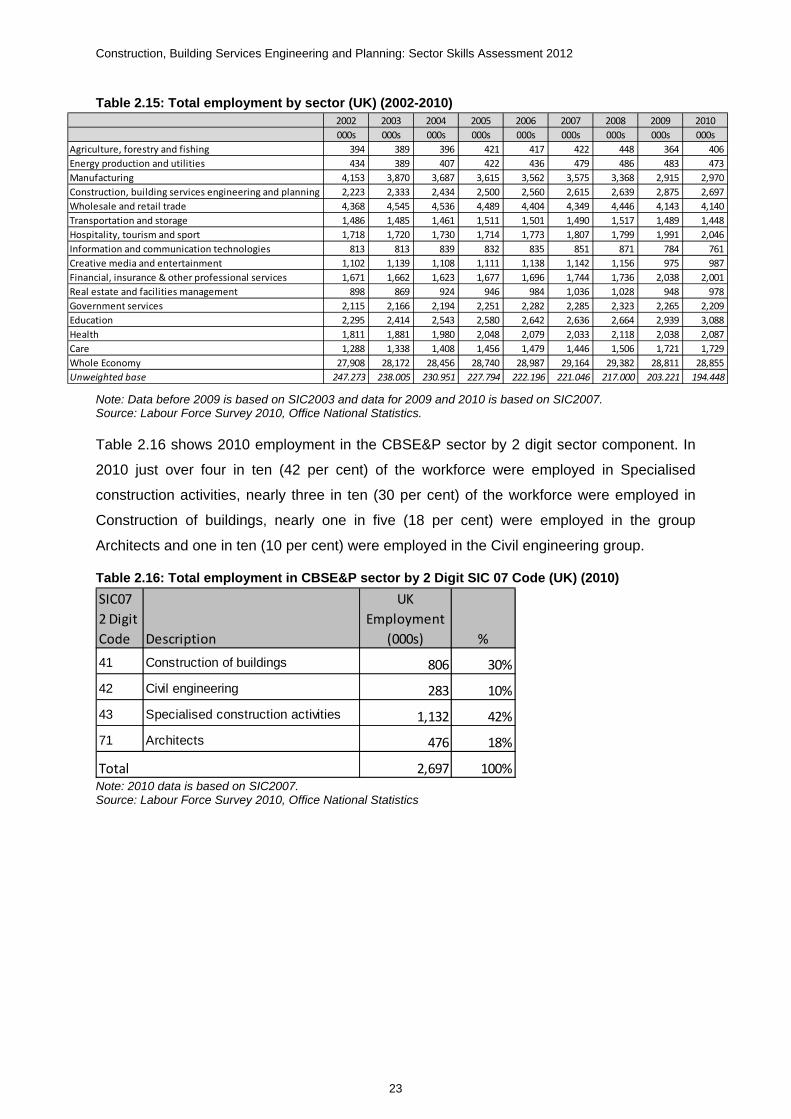
Construction, Building Services Engineering and Planning: Sector Skills Assessment 2012
23
Table 2.15: Total employment by sector (UK) (2002-2010)
Note: Data before 2009 is based on SIC2003 and data for 2009 and 2010 is based on SIC2007. Source: Labour Force Survey 2010, Office National Statistics.
Table 2.16 shows 2010 employment in the CBSE&P sector by 2 digit sector component. In
2010 just over four in ten (42 per cent) of the workforce were employed in Specialised
construction activities, nearly three in ten (30 per cent) of the workforce were employed in
Construction of buildings, nearly one in five (18 per cent) were employed in the group
Architects and one in ten (10 per cent) were employed in the Civil engineering group.
Table 2.16: Total employment in CBSE&P sector by 2 Digit SIC 07 Code (UK) (2010)
Note: 2010 data is based on SIC2007. Source: Labour Force Survey 2010, Office National Statistics
2002 2003 2004 2005 2006 2007 2008 2009 2010
000s 000s 000s 000s 000s 000s 000s 000s 000s
Agriculture, forestry and fishing 394 389 396 421 417 422 448 364 406
Energy production and utilities 434 389 407 422 436 479 486 483 473
Manufacturing 4,153 3,870 3,687 3,615 3,562 3,575 3,368 2,915 2,970
Construction, building services engineering and planning 2,223 2,333 2,434 2,500 2,560 2,615 2,639 2,875 2,697
Wholesale and retail trade 4,368 4,545 4,536 4,489 4,404 4,349 4,446 4,143 4,140
Transportation and storage 1,486 1,485 1,461 1,511 1,501 1,490 1,517 1,489 1,448
Hospitality, tourism and sport 1,718 1,720 1,730 1,714 1,773 1,807 1,799 1,991 2,046
Information and communication technologies 813 813 839 832 835 851 871 784 761
Creative media and entertainment 1,102 1,139 1,108 1,111 1,138 1,142 1,156 975 987
Financial, insurance & other professional services 1,671 1,662 1,623 1,677 1,696 1,744 1,736 2,038 2,001
Real estate and facilities management 898 869 924 946 984 1,036 1,028 948 978
Government services 2,115 2,166 2,194 2,251 2,282 2,285 2,323 2,265 2,209
Education 2,295 2,414 2,543 2,580 2,642 2,636 2,664 2,939 3,088
Health 1,811 1,881 1,980 2,048 2,079 2,033 2,118 2,038 2,087
Care 1,288 1,338 1,408 1,456 1,479 1,446 1,506 1,721 1,729
Whole Economy 27,908 28,172 28,456 28,740 28,987 29,164 29,382 28,811 28,855
Unweighted base 247.273 238.005 230.951 227.794 222.196 221.046 217.000 203.221 194.448
SIC07
2 Digit
Code Description
UK
Employment
(000s) %
41 Construction of buildings 806 30%
42 Civil engineering 283 10%
43 Specialised construction activities 1,132 42%
71 Architects 476 18%
2,697 100%Total

Construction, Building Services Engineering and Planning: Sector Skills Assessment 2012
24
3 The workforce
Chapter Summary
Note all figures in this chapter summary are 2010 at UK level unless otherwise
specified.
Skilled trades occupations accounted for 44 per cent of employment in the CBSE&P
sector compared to the all economy proportion of 11 per cent.
The largest occupational groups within the CBSE&P sector were Carpenters and
joiners, Construction trades not elsewhere classified and Managers in construction
which each accounted for seven per cent of the workforce respectively.
90 per cent of the CBSE&P sector workforce was employed full-time with the remaining
10 per cent part-time. This level of full-time employment is high compared to the
average across all sectors in the economy (73 per cent) although similar to sectors
such as Manufacturing (91 per cent) and Energy production and utilities (92 per cent).
At 36 per cent the CBSE&P sector workforce had the second highest proportion of self-
employment of all the sectors, second only to Agriculture, forestry and fishing (50 per
cent). This proportion was much higher than the average across the whole economy
workforce of 14 per cent self-employment.
The figures indicate that in the CBSE&P sector there were 13,000 unpaid family
workers which accounted for almost half a percentage of the workforce (0.47 per cent).
Temporary workers accounted for a small share of the sector’s workforce, four per cent
in 2010. This proportion was similar to comparable sectors such as Manufacturing (four
per cent) although much lower than that recorded in Education (11 per cent) and
Hospitality, tourism and sport (10 per cent) and lower than the whole economy average
(six per cent).
The CBSE&P sector workforce had the fourth highest proportion of all sectors of
employment of those born in the UK (91 per cent) compared to the whole economy
average (87 per cent). The sector had the same proportion of employment born in the
rest of Europe (EU 27) as the whole economy average (five per cent). As might be
expected the corresponding proportion of employment for those born in the rest of the
world in the sector (five per cent) was slightly lower than the whole economy average
(eight per cent).

Construction, Building Services Engineering and Planning: Sector Skills Assessment 2012
25
In the CBSE&P sector just over one in ten of the sector workforce (13 per cent) was
female compared to the whole economy average of almost half (46 per cent). In
comparison to other sectors the sector had the lowest proportion of female
employment of all sectors.
3.1 Working patterns
3.1.1 Full and part-time employment
Table 3.1 shows working hours by sector in the UK in 2010 (full-time work is defined as
more than or equal to 30 hours per week). Nine in ten (90 per cent) of the CBSE&P sector
workforce were employed full-time with the remainder one in ten (10 per cent) part-time. This
level of full-time employment was high compared to the average across all sectors in the
economy (73 per cent) although similar to sectors such as Manufacturing (91 per cent) and
Energy production and utilities (92 per cent).
Table 3.1: Working hours by sector (UK) (2010)
Note: 2010 data is based on SIC2007. Source(s): Labour Force Survey 2010, Office National Statistics.
Table 3.2 shows working hours by sector and nation in 2010. The proportion of full-time
employment for the CBSE&P sector was fairly even across the home nations ranging from
90 per cent to 93 per cent. This level of variation across the nations (maximum of three
percentage points) was one of the smallest across all of the sectors.
Full‐time Part‐time Full‐time Part‐time
Weighted
base
Unweighte
d base
000s 000s % % 000s 000s
Agriculture, forestry and fishing 326 79 80 20 406 3
Energy production and utilities 435 38 92 8 473 3
Manufacturing 2,688 281 91 9 2,969 20
Construction, building services engineering and planning 2,435 260 90 10 2,695 18
Wholesale and retail trade 2,549 1,590 62 38 4,139 28
Transportation and storage 1,218 229 84 16 1,447 10
Hospitality, tourism and sport 1,127 920 55 45 2,046 13
Information and communication technologies 682 79 90 10 761 5
Creative media and entertainment 737 249 75 25 986 6
Financial, insurance & other professional services 1,623 377 81 19 2,001 13
Real estate and facilities management 643 334 66 34 977 7
Government services 1,800 408 82 18 2,208 15
Education 1,872 1,215 61 39 3,087 22
Health 1,344 742 64 36 2,086 15
Care 1,056 672 61 39 1,728 12
All economy 21,083 7,760 73 27 28,843 194

Construction, Building Services Engineering and Planning: Sector Skills Assessment 2012
26
Table 3.2: Working hours by sector and nation (2010)
Notes: 2010 data is based on SIC2007.* indicates sample size too small for reliable estimate. Source: Labour Force Survey 2010, Office National Statistics.
Full‐time Part‐time
Weighted
base
Unweight
ed base Full‐time Part‐time
Weighted
base
Unweight
ed base Full‐time Part‐time
Weighted
base
Unweigh
ted base Full‐time Part‐time
Weighte
d base
Unweigh
ted base
% % 000s 000s % % 000s 000s % % 000s 000s % % 000s 000s
Agriculture, forestry and fishing 79 21 296 2.112 83 17 51 0.385 85 * 31 0.198 88 * 27 0.281
Energy production and utilities 92 8 346 2.336 91 9 88 0.620 96 * 25 0.157 92 * 14 0.131
Manufacturing 90 10 2,541 17.233 92 8 199 1.431 93 7 138 0.905 93 * 91 0.831
Construction, building services engineering and planning 90 10 2,268 14.834 93 7 244 1.702 93 7 112 0.717 93 * 71 0.664
Wholesale and retail trade 62 38 3,469 22.822 58 42 352 2.369 57 42 205 1.325 63 37 112 1.055
Transportation and storage 84 16 1,251 8.292 83 17 117 0.822 80 23 46 0.308 87 * 33 0.307
Hospitality, tourism and sport 55 45 1,704 10.849 52 48 198 1.295 51 49 100 0.636 62 38 44 0.403
Information and communication technologies 90 10 675 4.269 89 11 56 0.377 88 * 18 0.114 88 * 13 0.115
Creative media and entertainment 75 25 875 5.406 68 32 64 0.436 70 23 32 0.214 72 * 14 0.130
Financial, insurance & other professional services 82 18 1,768 11.123 78 22 138 0.948 77 22 53 0.358 81 19 41 0.375
Real estate and facilities management 65 35 847 5.623 73 27 75 0.519 63 35 38 0.254 74 * 18 0.165
Government services 81 19 1,835 12.302 84 16 173 1.210 81 23 111 0.744 84 16 89 0.842
Education 60 40 2,624 18.075 64 36 234 1.677 66 32 154 1.059 67 33 75 0.726
Health 64 36 1,712 11.931 65 35 198 1.409 67 31 111 0.771 71 29 64 0.631
Care 61 39 1,409 9.629 60 40 183 1.308 61 40 97 0.665 62 38 40 0.399
All economy 73 27 24,321 161.435 73 27 2,444 17.008 72 27 1,311 8.689 77 23 766 7.231
Wales Northern IrelandEngland Scotland
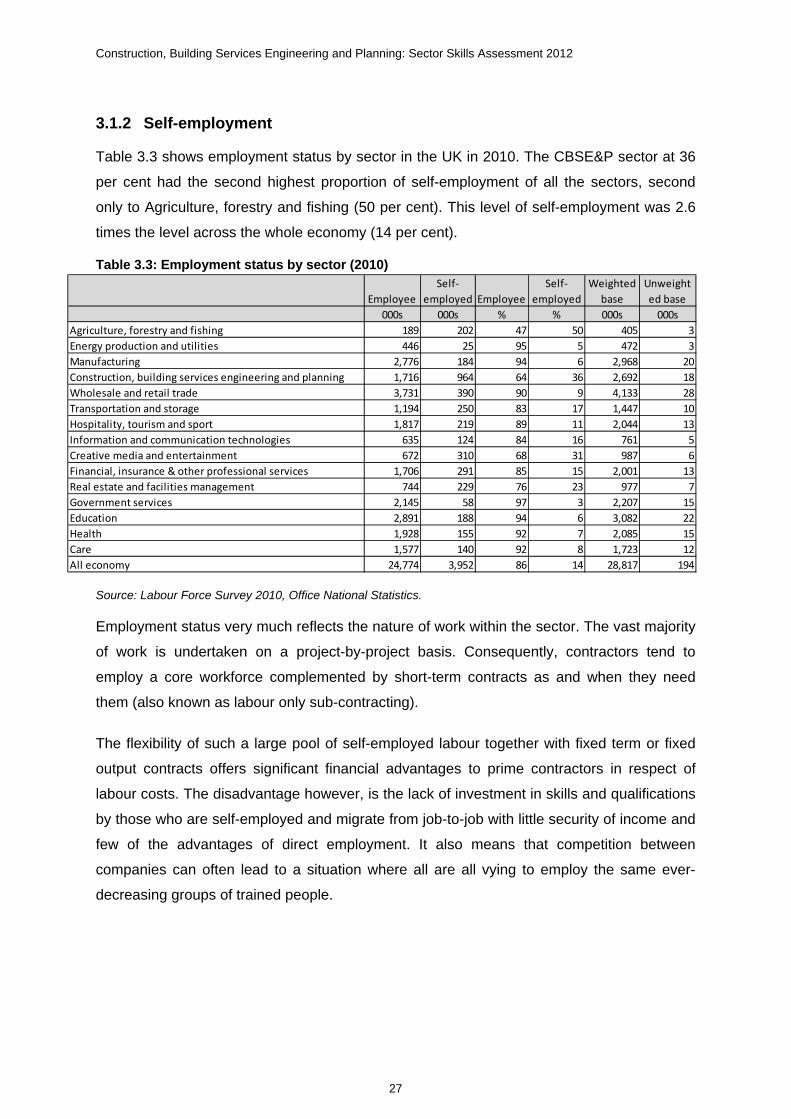
Construction, Building Services Engineering and Planning: Sector Skills Assessment 2012
27
3.1.2 Self-employment
Table 3.3 shows employment status by sector in the UK in 2010. The CBSE&P sector at 36
per cent had the second highest proportion of self-employment of all the sectors, second
only to Agriculture, forestry and fishing (50 per cent). This level of self-employment was 2.6
times the level across the whole economy (14 per cent).
Table 3.3: Employment status by sector (2010)
Source: Labour Force Survey 2010, Office National Statistics.
Employment status very much reflects the nature of work within the sector. The vast majority
of work is undertaken on a project-by-project basis. Consequently, contractors tend to
employ a core workforce complemented by short-term contracts as and when they need
them (also known as labour only sub-contracting).
The flexibility of such a large pool of self-employed labour together with fixed term or fixed
output contracts offers significant financial advantages to prime contractors in respect of
labour costs. The disadvantage however, is the lack of investment in skills and qualifications
by those who are self-employed and migrate from job-to-job with little security of income and
few of the advantages of direct employment. It also means that competition between
companies can often lead to a situation where all are all vying to employ the same ever-
decreasing groups of trained people.
Employee
Self‐
employed Employee
Self‐
employed
Weighted
base
Unweight
ed base
000s 000s % % 000s 000s
Agriculture, forestry and fishing 189 202 47 50 405 3
Energy production and utilities 446 25 95 5 472 3
Manufacturing 2,776 184 94 6 2,968 20
Construction, building services engineering and planning 1,716 964 64 36 2,692 18
Wholesale and retail trade 3,731 390 90 9 4,133 28
Transportation and storage 1,194 250 83 17 1,447 10
Hospitality, tourism and sport 1,817 219 89 11 2,044 13
Information and communication technologies 635 124 84 16 761 5
Creative media and entertainment 672 310 68 31 987 6
Financial, insurance & other professional services 1,706 291 85 15 2,001 13
Real estate and facilities management 744 229 76 23 977 7
Government services 2,145 58 97 3 2,207 15
Education 2,891 188 94 6 3,082 22
Health 1,928 155 92 7 2,085 15
Care 1,577 140 92 8 1,723 12
All economy 24,774 3,952 86 14 28,817 194

Construction, Building Services Engineering and Planning: Sector Skills Assessment 2012
28
Uncertainty around future levels of work also means that employers are apprehensive about
investment in the workforce and there is a fear that they would pay for training and then see
their trainees go and work for rival firms, or set themselves up as sole traders. Long-term
planning of construction investment, by clients including Government, is crucial in terms of
providing a solid foundation for companies to maintain high levels of investment in the whole
workforce. The introduction of framework agreements and public procurement requirements
will be essential to further developing a training culture.
There is a strong tendency for career progression to lead towards self-employment,
particularly in the main construction trades, where the financial rewards are perceived as
being greater. ConstructionSkills’ research8 showed that the incidence of self-employment
rises from around one in five (19 per cent) among people with one to two years’ experience
to around one in three (32 per cent) among people with five or more years’ experience. This
has obvious implications on the future training of both the individuals moving to
self-employment, and the ability for the industry to provide sufficient opportunities for those
wishing to join the industry and train.
Table 3.4 shows employment status in 2010 by sector and nation. In the UK in 2010 36 per
cent of the CBSE&P sector workforce was self-employed, England 37 per cent, Scotland 23
per cent, Wales 35 per cent and Northern Ireland 45 per cent. Across the UK economy 14
per cent of the workforce was self-employed.
8 ConstructionSkills (2007) Workforce Mobility and Skills in the Construction Sector in the UK and Republic of Ireland. Available: http://www.cskills.org/sectorskills/researchfromssc/mobility_and_skills2007.aspx. [Accessed 21st November 2011]. The survey sample included face to face interviews with 3,877 workers across 312 sites in the UK/ROI, refer to the methodology section for more details.

Construction, Building Services Engineering and Planning: Sector Skills Assessment 2012
29
Table 3.4: Employment status by sector and nation (2010)
Notes: Weighted & unweighted bases also include unpaid family worker. * indicates sample size too small for reliable estimate. Source: Labour Force Survey 2010, Office National Statistics.
Employee
Self‐
employed
Weighted
base
Unweight
ed base Employee
Self‐
employed
Weighted
base
Unweighte
d base Employee
Self‐
employed
Weighted
base
Unweighte
d base Employee
Self‐
employed
Weighted
base
Unweigh
ted base
% % 000s 000s % % 000s 000s % % 000s 000s % % 000s 000s
Agriculture, forestry and fishing 50 46 295 2.110 49 50 51 0.385 33 62 31 0.197 * 75 27 0.281
Energy production and utilities 94 6 346 2.334 95 * 87 0.619 99 * 25 0.157 95 * 14 0.130
Manufacturing 93 6 2,540 17.229 95 5 199 1.432 94 6 138 0.905 93 7 91 0.831
Construction, building services engineering and planning 63 37 2,266 14.822 77 23 244 1.701 65 35 112 0.717 55 45 70 0.657
Wholesale and retail trade 91 9 3,466 22.800 91 9 351 2.359 86 14 204 1.323 84 16 112 1.052
Transportation and storage 83 17 1,252 8.294 85 15 117 0.820 76 23 46 0.308 77 23 33 0.307
Hospitality, tourism and sport 89 10 1,702 10.836 89 11 198 1.295 87 12 100 0.634 82 17 44 0.403
Information and communication technologies 84 16 674 4.266 82 18 56 0.377 77 * 18 0.113 87 * 13 0.115
Creative media and entertainment 68 32 875 5.409 76 24 65 0.438 60 39 32 0.214 75 * 14 0.130
Financial, insurance & other professional services 85 15 1,768 11.122 90 10 138 0.948 81 19 53 0.359 92 * 41 0.375
Real estate and facilities management 75 24 847 5.624 85 15 75 0.520 78 21 37 0.252 67 * 18 0.165
Government services 97 3 1,834 12.298 97 3 173 1.209 97 * 111 0.742 99 * 89 0.842
Education 94 6 2,619 18.049 95 5 234 1.676 96 4 153 1.056 95 * 75 0.726
Health 92 8 1,712 11.930 94 6 199 1.410 92 8 111 0.769 95 * 64 0.631
Care 91 9 1,404 9.601 93 6 183 1.306 95 * 97 0.665 90 * 40 0.399
All economy 86 14 24,301 161.314 89 11 2,442 16.995 85 14 1,309 8.674 84 16 765 7.217
Northern IrelandEngland Scotland Wales

Construction, Building Services Engineering and Planning: Sector Skills Assessment 2012
30
Table 3.5: Employment status by sector and nation (2010) (000’s)
Note: * indicates sample size too small for reliable estimate. Source: Labour Force Survey 2010, Office National Statistics.
Employee
Self‐
employed
Unpaid
family
worker Employee
Self‐
employed
Unpaid
family
worker Employee
Self‐
employed
Unpaid
family
worker Employee
Self‐
employed
Unpaid
family
worker Employee
Self‐
employed
Unpaid
family
worker
Agriculture, forestry and fishing 189 202 14 149 136 11 25 26 * 10 19 * * 21 *
Energy production and utilities 446 25 * 325 21 * 83 * * 25 * * 13 * *
Manufacturing 2,776 184 8 2,372 161 8 190 9 * 130 8 * 84 6 *
Construction, building services engineering and planning 1,716 964 13 1,417 838 11 187 55 * 73 39 * 39 31 *
Wholesale and retail trade 3,731 390 12 3,141 314 11 320 30 * 176 28 * 94 18 *
Transportation and storage 1,194 250 * 1,035 215 * 99 18 * 35 10 * 25 7 *
Hospitality, tourism and sport 1,817 219 8 1,518 177 7 176 22 * 87 12 * 36 8 *
Information and communication technologies 635 124 * 564 108 * 46 10 * 14 * * 12 * *
Creative media and entertainment 672 310 * 592 279 * 49 16 * 19 13 * 11 * *
Financial, insurance & other professional services 1,706 291 * 1,501 264 * 125 13 * 43 10 * 38 * *
Real estate and facilities management 744 229 * 639 204 * 64 11 * 29 8 * 12 * *
Government services 2,145 58 * 1,783 48 * 167 * * 108 * * 88 * *
Education 2,891 188 * 2,451 166 * 222 12 * 147 6 * 71 * *
Health 1,928 155 * 1,579 131 * 187 11 * 102 9 * 61 * *
Care 1,577 140 6 1,278 120 * 171 12 * 92 * * 36 * *
All economy 24,774 3,952 92 20,853 3,370 79 2,164 273 * 1,118 185 * 639 124 *
UK England Scotland Wales Northern Ireland
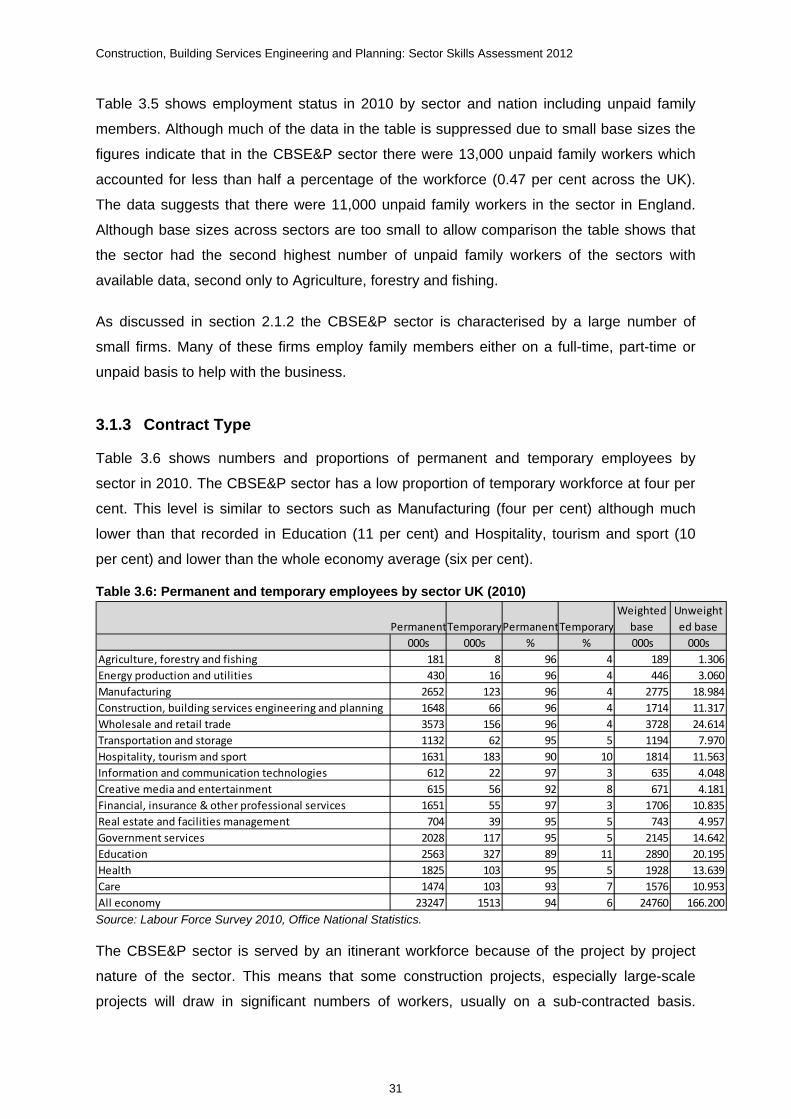
Construction, Building Services Engineering and Planning: Sector Skills Assessment 2012
31
Table 3.5 shows employment status in 2010 by sector and nation including unpaid family
members. Although much of the data in the table is suppressed due to small base sizes the
figures indicate that in the CBSE&P sector there were 13,000 unpaid family workers which
accounted for less than half a percentage of the workforce (0.47 per cent across the UK).
The data suggests that there were 11,000 unpaid family workers in the sector in England.
Although base sizes across sectors are too small to allow comparison the table shows that
the sector had the second highest number of unpaid family workers of the sectors with
available data, second only to Agriculture, forestry and fishing.
As discussed in section 2.1.2 the CBSE&P sector is characterised by a large number of
small firms. Many of these firms employ family members either on a full-time, part-time or
unpaid basis to help with the business.
3.1.3 Contract Type
Table 3.6 shows numbers and proportions of permanent and temporary employees by
sector in 2010. The CBSE&P sector has a low proportion of temporary workforce at four per
cent. This level is similar to sectors such as Manufacturing (four per cent) although much
lower than that recorded in Education (11 per cent) and Hospitality, tourism and sport (10
per cent) and lower than the whole economy average (six per cent).
Table 3.6: Permanent and temporary employees by sector UK (2010)
Source: Labour Force Survey 2010, Office National Statistics.
The CBSE&P sector is served by an itinerant workforce because of the project by project
nature of the sector. This means that some construction projects, especially large-scale
projects will draw in significant numbers of workers, usually on a sub-contracted basis.
PermanentTemporaryPermanentTemporary
Weighted
base
Unweight
ed base
000s 000s % % 000s 000s
Agriculture, forestry and fishing 181 8 96 4 189 1.306
Energy production and utilities 430 16 96 4 446 3.060
Manufacturing 2652 123 96 4 2775 18.984
Construction, building services engineering and planning 1648 66 96 4 1714 11.317
Wholesale and retail trade 3573 156 96 4 3728 24.614
Transportation and storage 1132 62 95 5 1194 7.970
Hospitality, tourism and sport 1631 183 90 10 1814 11.563
Information and communication technologies 612 22 97 3 635 4.048
Creative media and entertainment 615 56 92 8 671 4.181
Financial, insurance & other professional services 1651 55 97 3 1706 10.835
Real estate and facilities management 704 39 95 5 743 4.957
Government services 2028 117 95 5 2145 14.642
Education 2563 327 89 11 2890 20.195
Health 1825 103 95 5 1928 13.639
Care 1474 103 93 7 1576 10.953
All economy 23247 1513 94 6 24760 166.200

Construction, Building Services Engineering and Planning: Sector Skills Assessment 2012
32
These workers are likely to be from other parts of the country, or from abroad. Indeed,
research9 indicates that the construction workforce is very mobile with just over half of
workers (54 per cent) having worked on sites outside the current nation/region and for one in
five (20 per cent), half or less of their time has been spent working on sites in their current
nation/region.
Those currently working in Scotland and in Northern Ireland were particularly likely to have
spent all their time in construction on sites within the same nation or region (68 per cent and
64 per cent respectively). By contrast, in London and the East Midlands around a quarter
had spent all their time on sites within the region (28 per cent and 26 per cent respectively).
Overall seven per cent of workers interviewed were based at a temporary address to get to
work. Workers employed on a temporary basis were more likely to say they were living at a
temporary address (12 per cent of temporary workers versus six per cent of permanent
workers), as were workers who haven’t been in the industry long (18 per cent of those with
less than a year’s experience versus six per cent of those with five or more year
experience).
The mean average distance travelled to work (each way) was 24 miles and the median
average was 18 miles. A quarter of workers (24 per cent) reported travelling less than five
miles with three in five (64 per cent) travelling less than 25 miles. One in ten (10 per cent)
were travelling over fifty miles each way to work. Workers in the Republic of Ireland,
Scotland and the South West were most likely to report that they travel five miles or less.
One in ten workers (10 per cent) reported travelling over 50 miles to work; such long
journeys were most prevalent in the East of England and the South East.
Table 3.7 shows employment status numbers and proportions in 2010 for the CBSE&P
sector by sub-sector (as defined by 2 digit SIC codes). The data highlights a low proportion
of part-time employment (seven per cent) for the Civil engineering group compared to the
sector average (10 per cent). The proportions of self-employment for the groups Architects
(28 per cent) and Civil engineering (15 per cent) are much lower than the sector average (36
per cent).
9 ConstructionSkills (2007) Workforce Mobility and Skills in the Construction Sector in the UK and Republic of Ireland. Available: http://www.cskills.org/sectorskills/researchfromssc/mobility_and_skills2007.aspx. [Accessed 21st November 2011]. The survey sample included face to face interviews with 3,877 workers across 312 sites in the UK/ROI, refer to the methodology section for more details.

Construction, Building Services Engineering and Planning: Sector Skills Assessment 2012
33
Table 3.7: Employment status CBSE&P Sector by 2 Digit SIC code (2010) (‘000s)
Note: * indicates sample size too small for reliable estimate. Source: Labour Force Survey 2010, Office National Statistics.
This data reflects the structure and nature of work undertaken by businesses within the sub-
sectors (as defined by 2 digit SIC codes). The professional side of the workforce which
includes the groups Architects and Civil engineering is much more likely to be employed on
a permanent basis at regular offices. There is more flexibility in these roles for a proportion
of the workforce to be employed on a part-time basis. On the more traditional side of the
workforce many workers will include skilled hands-on tradespeople who are more likely
although not exclusively to be self-employed and are needed on-site on a more full-time
basis. A higher proportion of these workers may be employed on a temporary project-by-
project basis.
3.2 The jobs people do
3.2.1 Occupational structure
Table 3.8 shows employment within the whole economy by occupation and nation in 2010.
Proportions of employment by occupation are generally comparable across the home
nations. The greatest difference in proportion (six percentage points maximum) occurs for
Skilled Trade Occupations (16 per cent) in Northern Ireland compared to England (10 per
cent).
SIC07 2
Digit Code Description Full time Part‐time Employee
Self‐
employed
Unpaid
family
worker Permanent Temporary
41 Construction of buildings 728 78 503 296 * 477 2642 Civil engineering 265 18 246 37 * 235 1243 Specialised construction activities 1031 100 596 528 * 579 1671 Architects 411 65 370 103 * 357 12
2,435 260 1,716 964 * 1,648 66
41 Construction of buildings 90.3% 9.7% 63.0% 37.0% * 94.8% 5.2%42 Civil engineering 93.8% 6.2% 87.0% 13.0% * 95.3% 4.7%43 Specialised construction activities 91.2% 8.8% 53.0% 47.0% * 97.2% 2.8%71 Architects 86.4% 13.6% 78.2% 21.8% * 96.7% 3.3%
90.4% 9.6% 64.0% 36.0% * 96.1% 3.9%
Total
Total
000s
%
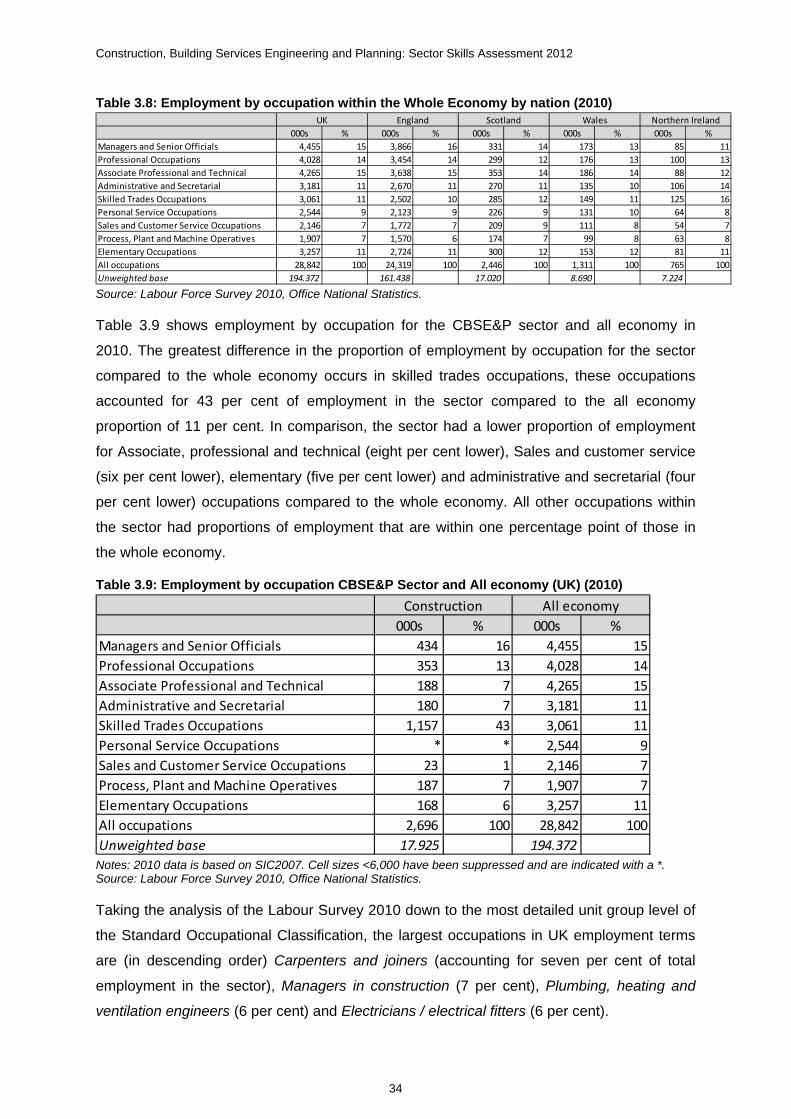
Construction, Building Services Engineering and Planning: Sector Skills Assessment 2012
34
Table 3.8: Employment by occupation within the Whole Economy by nation (2010)
Source: Labour Force Survey 2010, Office National Statistics.
Table 3.9 shows employment by occupation for the CBSE&P sector and all economy in
2010. The greatest difference in the proportion of employment by occupation for the sector
compared to the whole economy occurs in skilled trades occupations, these occupations
accounted for 43 per cent of employment in the sector compared to the all economy
proportion of 11 per cent. In comparison, the sector had a lower proportion of employment
for Associate, professional and technical (eight per cent lower), Sales and customer service
(six per cent lower), elementary (five per cent lower) and administrative and secretarial (four
per cent lower) occupations compared to the whole economy. All other occupations within
the sector had proportions of employment that are within one percentage point of those in
the whole economy.
Table 3.9: Employment by occupation CBSE&P Sector and All economy (UK) (2010)
Notes: 2010 data is based on SIC2007. Cell sizes <6,000 have been suppressed and are indicated with a *. Source: Labour Force Survey 2010, Office National Statistics.
Taking the analysis of the Labour Survey 2010 down to the most detailed unit group level of
the Standard Occupational Classification, the largest occupations in UK employment terms
are (in descending order) Carpenters and joiners (accounting for seven per cent of total
employment in the sector), Managers in construction (7 per cent), Plumbing, heating and
ventilation engineers (6 per cent) and Electricians / electrical fitters (6 per cent).
000s % 000s % 000s % 000s % 000s %
Managers and Senior Officials 4,455 15 3,866 16 331 14 173 13 85 11
Professional Occupations 4,028 14 3,454 14 299 12 176 13 100 13
Associate Professional and Technical 4,265 15 3,638 15 353 14 186 14 88 12
Administrative and Secretarial 3,181 11 2,670 11 270 11 135 10 106 14
Skilled Trades Occupations 3,061 11 2,502 10 285 12 149 11 125 16
Personal Service Occupations 2,544 9 2,123 9 226 9 131 10 64 8
Sales and Customer Service Occupations 2,146 7 1,772 7 209 9 111 8 54 7
Process, Plant and Machine Operatives 1,907 7 1,570 6 174 7 99 8 63 8
Elementary Occupations 3,257 11 2,724 11 300 12 153 12 81 11
All occupations 28,842 100 24,319 100 2,446 100 1,311 100 765 100
Unweighted base 194.372 161.438 17.020 8.690 7.224
UK WalesEngland Scotland Northern Ireland
000s % 000s %
Managers and Senior Officials 434 16 4,455 15
Professional Occupations 353 13 4,028 14
Associate Professional and Technical 188 7 4,265 15
Administrative and Secretarial 180 7 3,181 11
Skilled Trades Occupations 1,157 43 3,061 11
Personal Service Occupations * * 2,544 9
Sales and Customer Service Occupations 23 1 2,146 7
Process, Plant and Machine Operatives 187 7 1,907 7
Elementary Occupations 168 6 3,257 11
All occupations 2,696 100 28,842 100
Unweighted base 17.925 194.372
Construction All economy

Construction, Building Services Engineering and Planning: Sector Skills Assessment 2012
35
Table 3.10 shows employment by occupation for the CBSE&P sector by nation. Although
some cells have been suppressed due to small base sizes the proportions of employment by
occupation for most occupations are broadly comparable across the nations.
Table 3.10: Employment by occupation CBSE&P Sector by nation (UK) (2010)
Notes: 2010 data is based on SIC2007. Cell sizes <6,000 have been suppressed and are indicated with a *. Source: Labour Force Survey 2010, Office National Statistics.
The main difference appears to occur for skilled trades occupations where Northern Ireland
had a higher proportion (60 per cent) employed in this occupation than the UK average (43
per cent). Base sizes are too small for many of the other occupations but a likely explanation
may be that as for the whole economy Northern Ireland had a lower proportion of
employment by occupation within managers and senior officials and associate professional
and technical occupations.
Table 3.11 shows employment by occupation for the CBSE&P sector by 2 digit SIC
component. The data indicates that the groups construction of buildings and specialised
construction activities contain a higher than average proportion of employment by
occupation for Skilled trades occupations than the sector average (31 per cent and 63 per
cent) respectively compared to UK average (43 per cent). This is likely to reflect the higher
levels of tradespeople employed in these groups.
000s % 000s % 000s % 000s %
Managers and Senior Officials 379 17 37 15 13 12 * 7
Professional Occupations 302 13 32 13 13 11 7 10
Associate Professional and Technical 157 7 22 9 8 7 * *
Administrative and Secretarial 154 7 15 6 * * * 7
Skilled Trades Occupations 967 43 94 39 53 47 43 60
Personal Service Occupations * * * * * * * *
Sales and Customer Service Occupations 18 * * * * * * *
Process, Plant and Machine Operatives 151 7 21 9 10 9 * 7
Elementary Occupations 137 6 20 8 8 7 * *
All occupations 2269 100 244 100 113 100 71 100
England Scotland Wales Northern Ireland

Construction, Building Services Engineering and Planning: Sector Skills Assessment 2012
36
Table 3.11: Employment by occupation CBSE&P Sector by 2 Digit SIC code (UK) (2010)
Note: 2010 data is based on SIC2007. Cell sizes <6,000 have been suppressed and are indicated with a *. Source: Labour Force Survey 2010, Office National Statistics.
3.3 Workforce characteristics
3.3.1 Gender
Table 3.12 shows employment by gender and nation for the whole economy. Just over half
of employment for the UK whole economy was male (54 per cent). There was limited
variation between nations (a maximum of three percentage point’s difference). Time series
data from 2002 to 2010 indicates levels of employment by gender for UK have been
remained static over the period varying by a maximum of 0.5 percentage points.
Table 3.12: Employment by gender and nation Whole Economy (2010)
Source: Labour Force Survey 2010, Office National Statistics.
Table 3.13 shows employment by gender and nation in 2010 for the CBSE&P sector. Just
over one in ten of the sector workforce (13 per cent) was female compared to the whole
economy average of approaching half (46 per cent). In comparison to other sectors (not
shown here) the sector had the lowest proportion of female employment of all sectors.
Levels of female employment within the sector were broadly similar across the nations
ranging from seven per cent in Northern Ireland to 15 per cent in Scotland. Time series data
from 2002 to 2010 indicated the proportion of females in the sector at UK level increased by
0.6 per cent over the period to 13.2 per cent in 2010.
SIC07 2
Digit
Code Description
Managers
and Senior
Officials
Professional
Occupations
Associate
Professional
and Technical
Administrative
and Secretarial
Skilled
Trades
Occupations
Personal
Service
Occupations
Sales and
Customer
Service
Occupations
Process,
Plant and
Machine
Operatives
Elementary
Occupations Total 41 Construction of buildings 171 51 37 52 360 * * 47 78 79642 Civil engineering 55 55 25 24 37 * * 51 34 28143 Specialised construction
activities 115 50 32 66 734 * 10 76 49 113271 Architects 94 197 94 37 26 * * 13 7 469
434 353 188 180 1,157 * 10 187 168 2,678Total
Male Female Total Male Female Total Unweighted base
000s 000s 000s % % % 000s
UK 15,439 13,416 28,855 54 46 100 194.448
England 13,081 11,250 24,331 54 46 100 161.501
Scotland 1,257 1,189 2,446 51 49 100 17.022
Wales 692 620 1,312 53 47 100 8.693
Northern Ireland 409 358 766 53 47 100 7.232

Construction, Building Services Engineering and Planning: Sector Skills Assessment 2012
37
Table 3.13: Employment within CBSE&P Sector by gender and nation (2010)
Source: Labour Force Survey 2010, Office National Statistics.
Table 3.14 shows employment by gender by 2 digit SIC code in 2010 for the CBSE&P
sector. The proportion of women was much higher for the group Architects (24 per cent)
than the sector average (13 per cent). The proportion of women for Specialised construction
activities was lower (nine per cent) than the sector average (13 per cent). These differences
are likely to reflect the nature of the work involved in each of these groups for example work
in Specialised construction activities may be more physically demanding than other sectors
and there may be more capacity for part-time work in the group Architects which may make
the sectors more or less appealing to female workers.
Table 3.14: Employment by gender CBSE&P Sector by 2 Digit SIC 07 Code (2010) (‘000s)
Source: Labour Force Survey 2010, Office National Statistics.
Table 3.15 shows employment by gender by broad occupational group for the CBSE&P
sector and whole economy in 2010. Similar to the previous tables in this section the data
indicates a higher proportion of males employed in the sector compared to the whole
economy for all broad occupational groups with the exception of administrative and
secretarial occupations (15 per cent) compared to whole economy figure for this
occupational group (22 per cent) and personal service occupations for which the base size is
too low for reliable estimates.
Male Female Total Male Female Total Unweighted base
000s 000s 000s % % % 000s
UK 2,342 356 2,697 87 13 100 17.93
England 1,968 302 2,270 87 13 100 14.843
Scotland 208 36 244 85 15 100 1.703
Wales 100 13 113 89 11 100 0.719
Northern Ireland 66 5 71 93 7 100 0.665
SIC07
2 Digit
Code Description Male Female Total %Male %Female41 Construction of buildings
702 104 806 87% 13%42 Civil engineering
243 41 283 86% 14%43 Specialised construction
activities 1,036 96 1,132 91% 9%71 Architects
361 114 476 76% 24%
2,342 356 2,697 87% 13%Total

Construction, Building Services Engineering and Planning: Sector Skills Assessment 2012
38
Table 3.15: Gender profile by broad occupational group (UK) (2010)
Note: * indicates sample size too small for reliable estimate. Source: Labour Force Survey 2010, Office National Statistics.
The data indicates that there were a higher proportion of males in the sector for most hands-
on type roles such as skilled trade occupations, process, plant and machine operatives and
elementary occupations. In other more managerial roles including managers and senior
officials, professional occupations and associate professional and technical occupations
there were a higher proportion of females employed although levels are not as high as those
across the whole economy.
3.3.2 Age profile
Table 3.16 shows the age profile of the whole economy workforce by nation in 2010. The
proportions of the workforce by age bracket across the home nations were fairly similar
(within five percentage points). The greatest difference from the UK average was found in
Northern Ireland where the proportion of those aged 25 to 34 was three percentage points
higher than the UK average, suggesting the whole economy workforce was slightly younger
in Northern Ireland in comparison to that of the UK workforce.
Male Female Total Male Female Total
% % 000s % % 000s
1 Managers and Senior Officials 82 18 434 65 35 4,455
2 Professional occupations 89 11 353 56 44 4,028
3 Associate Professional and Technical 73 27 188 50 50 4,265
4 Administrative and Secretarial 15 85 180 22 78 3,181
5 Skilled Trades Occupations 99 1 1,157 92 8 3,061
6 Personal Service Occupations * * 5 17 83 2,544
7 Sales and Customer Service Occupations 38 62 23 35 65 2,146
8 Process, Plant and Machine Operatives 99 * 187 88 12 1,907
9 Elementary Occupations 95 5 168 55 45 3,257
All occupations 87 13 2,696 54 46 28,842
Construction, building services
engineering and planning All economy

Construction, Building Services Engineering and Planning: Sector Skills Assessment 2012
39
Table 3.16: Age profile of Whole Economy workforce by nation (2010) (‘000s) (% share)
Note: * indicates sample size too small for reliable estimate. Source: Labour Force Survey 2010, Office National Statistics.
Table 3.17 shows the age profile of the whole economy workforce from 2002-2010. Although
the total number employed in 2010 was very similar to that in 2002 there have been some
slight shifts in proportions by age bracket. The proportion of the whole economy workforce
by age bracket aged 44 or under decreased over the period by almost five per cent, whilst
the proportion aged 45 and over increased by the same level over the period. The greatest
increase over the period was in the proportion of the workforce aged 45 to 59 (two per cent)
and 60 to 64 (1.7 per cent) whilst the greatest decrease was in the proportion of those aged
35 to 44 (1.9 per cent decrease).
Table 3.17: Age profile of Whole Economy workforce (UK) (2002-2010)
Source: Labour Force Survey 2010, Office National Statistics.
Table 3.18 shows the age profile by nation in 2010 for the CBSE&P sector. The UK age
profile of the sector was very similar (within one percentage point) to that of the whole
economy.
Number % Number % Number % Number % Number %
Under 16 * * * * * * * * * *
16‐18 673 2 569 2 58 2 35 3 10 1
19‐24 3,037 11 2,541 10 274 11 136 10 85 11
25‐34 6,324 22 5,365 22 500 20 267 20 192 25
35‐44 7,029 24 5,932 24 589 24 311 24 197 26
45‐59 9,331 32 7,826 32 834 34 434 33 236 31
60‐64 1,631 6 1,394 6 129 5 79 6 30 4
65 + 831 3 702 3 62 3 49 4 17 2
Total 28,855 100 24,331 100 2,446 100 1,312 100 766 100
Unweighted base 194.448 161.501 17.022 8.693 7.232
UK England Scotland Wales Northern Ireland
2002 2003 2004 2005 2006 2007 2008 2009 2010
000s 000s 000s 000s 000s 000s 000s 000s 000s
Under 18 1,078 1,076 1,077 1,028 976 938 925 765 673
19‐24 2,948 2,973 3,072 3,097 3,179 3,224 3,221 3,048 3,037
25‐34 6,505 6,361 6,279 6,289 6,250 6,242 6,279 6,186 6,324
35‐44 7,317 7,416 7,490 7,525 7,533 7,528 7,442 7,241 7,029
45‐59 8,474 8,638 8,748 8,915 9,017 9,046 9,171 9,182 9,331
60‐64 1,107 1,186 1,252 1,306 1,405 1,545 1,652 1,650 1,631
65 + 479 522 538 580 625 641 693 739 831
Total 27,908 28,172 28,456 28,740 28,987 29,164 29,382 28,811 28,855
Unweighted base 247.273 238.005 230.951 227.794 222.196 221.046 217.000 203.221 194.448

Construction, Building Services Engineering and Planning: Sector Skills Assessment 2012
40
Table 3.18: Age profile of CBSE&P Sector workforce by nation (2010)
Note: * indicates sample size too small for reliable estimate. Source: Labour Force Survey 2010, Office National Statistics.
Although some of the data has been suppressed due to small base sizes the data illustrates
that there were some differences in the profile of the CBSE&P sector workforce by age
bracket across the home nations (greatest difference is nine percentage points). Similar to
the profile of the whole economy the greatest differences compared to the UK sector
average occurred within Northern Ireland (six percentage points higher for those aged 25 to
34 and six percentage points lower for those aged 40 to 59). Similar to the whole economy
this suggests that the sector workforce in Northern Ireland was younger than that in the
other home nations.
Table 3.19 shows the same data using more aggregated age brackets for the sector over
the period 2002 to 2010. Similar to the whole economy the picture for the sector over the
period 2002 to 2010 was one of an ageing workforce. The proportion of the workforce aged
60+ increased by four per cent, the proportion aged 45 to 59 increased by three per cent, the
proportion aged 35 to 44 decreased three per cent, the proportion aged 25 to 34 decreased
by one per cent and the proportion aged under 25 decreased by three per cent.
Table 3.19: Age profile of CBSE&P Sector workforce (UK) (2002-2010) ('000s)
Note: * indicates sample size too small for reliable estimate. Source: Labour Force Survey 2010, Office National Statistics.
000s % 000s % 000s % 000s % 000s %
Under 16 * * * * * * * * * *
16‐18 34 1 28 1 * * * * * *
19‐24 260 10 222 10 18 7 12 11 9 12
25‐34 586 22 490 22 54 22 22 19 20 28
35‐44 657 24 551 24 63 26 26 23 17 25
45‐59 892 33 750 33 84 34 40 35 19 27
60‐64 192 7 164 7 16 7 9 8 * *
65 + 75 3 66 3 * * * * * *
Total 2,697 100 2,270 100 244 100 113 100 71 100
UK England Scotland Wales Northern Ireland
2002 2003 2004 2005 2006 2007 2008 2009 2010
000s 000s 000s 000s 000s 000s 000s 000s 000s
Under 25 302 325 342 363 387 403 382 335 295
25‐34 512 510 519 528 551 571 555 627 586
35‐44 601 642 642 694 679 683 695 742 657
45‐59 675 709 756 733 750 748 784 904 892
60+ 132 148 175 182 193 210 223 267 267
Total 2,223 2,333 2,434 2,500 2,560 2,615 2,639 2,875 2,697
Unweighted base (000s) 19.570 19.587 19.631 19.517 19.234 19.377 19.103 19.919 17.930

Construction, Building Services Engineering and Planning: Sector Skills Assessment 2012
41
If the proportions aged under 45 and 45 or over are combined then the proportion aged
under 45 decreased by approaching seven per cent (compared to whole economy average
of five per cent decrease) and the proportion aged 45 or over increased by almost seven per
cent (compared to whole economy average of five per cent increase) over the period 2002 to
2010.
Table 3.20 shows the age profile by 2 digit SIC component in 2010 for the CBSE&P sector.
The age profiles of the workforce across the 2 digit sector components are broadly
comparable (the greatest difference was for the group Architects which had a lower
proportion aged 19 to 24 by six percentage points compared to the Specialised construction
activities group). In line with this, the Civil engineering and Architects groups tend to have a
slightly lower proportion (two percentage points and five percentage points respectively) of
workers aged 19 to 24 than the UK sector average. This is likely to reflect those who may be
studying for three and four years degrees to enter these sectors. It is also worthy of note that
the proportion of Civil engineers aged 35 to 44 was seven percentage points greater than
the UK sector average.

Construction, Building Services Engineering and Planning: Sector Skills Assessment 2012
42
Table 3.20: Employment by age of CBSE&P Sector by 2 Digit SIC 07 Code (2010) ('000s) (%share)
Note: * indicates sample size too small for reliable estimate. Source: Labour Force Survey 2010, Office National Statistics.
SIC07 2
Digit
Code Description Under 16 16‐18 19‐24 25‐34 35‐44 45‐59 60‐64 65 + Total
%Under
16 %16‐18 %19‐24 %25‐34 %35‐44 %45‐59 %60‐64 %65 + %Total
Weighted
base
Unweighted
base41 Construction of buildings
* 12 82 171 197 263 58 23 806 * 2% 10% 21% 24% 33% 7% 3% 100% 806.234 5.35742 Civil engineering
* * 24 60 79 95 20 * 283 * * 8% 21% 28% 34% 7% * 100% 283.177 1.90643 Specialised construction
activities * 18 130 247 264 370 79 24 1,132 * 2% 11% 22% 23% 33% 7% 2% 100% 1132.303 7.48371 Architects
* * 24 108 118 164 36 23 476 * * 5% 23% 25% 34% 8% 5% 100% 475.515 3.184
* 30 260 586 657 892 192 71 2,697 * 1% 10% 22% 24% 33% 7% 3% 100% 2,697 18Total

Construction, Building Services Engineering and Planning: Sector Skills Assessment 2012
43
3.3.3 Ethnicity
Table 3.21 shows the ethnicity profile of the workforce across the whole economy in 2010 by
nation. In 2010 just over nine in ten of the UK whole economy workforce was white (91 per
cent) with nearly one in ten from Black, Asian and Minority Ethnic (BAME) groups (nine per
cent). The proportion of BAME in the workforce was highest in England (11 per cent) with
lower proportions across the home nations – Scotland three per cent, Wales three per cent
and Northern Ireland two per cent.
Table 3.21: Ethnicity of workforce across whole economy by nation (2010)
Source: Labour Force Survey 2010, Office National Statistics
Table 3.22 shows the ethnicity profile of the UK workforce in 2010 by sector. The CBSE&P
sector workforce had one of the lowest proportions of BAME (five per cent) of all sectors
compared to the average across the whole economy (nine per cent). The proportion in the
CBSE&P sector was comparable to that in Manufacturing (seven per cent) and Energy
production and utilities (four per cent).
Table 3.22: Ethnicity of workforce within sectors UK (2010) (‘000s) (% share)
Notes: * Sample size too small for reliable estimate. Figures in the shaded column %BAME have a low base and should be treated with caution.
Source: Labour Force Survey 2010, Office National Statistics.
White BAME Total White BAME Total Unweighted base
000s 000s 000s % % % 000s
UK 26,151 2,686 28,837 91 9 100 194.336
England 21,755 2,558 24,313 89 11 100 161.395
Scotland 2,370 76 2,445 97 3 100 17.019
Wales 1,272 40 1,312 97 3 100 8.691
Northern Ireland 754 12 766 98 2 100 7.231
White BAME Total White BAME Total
'000 '000 '000 % % %
Agriculture, forestry and fishing 402 * 402 100 * 100
Energy production and utilities 453 20 472 96 4 100
Manufacturing 2,769 199 2,968 93 7 100
Construction, building services engineering and planning 2,567 130 2,697 95 5 100
Wholesale and retail trade 3,722 416 4,139 90 10 100
Transportation and storage 1,266 180 1,445 88 12 100
Hospitality, tourism and sport 1,766 280 2,045 86 14 100
Information and communication technologies 660 100 760 87 13 100
Creative media and entertainment 913 73 986 93 7 100
Financial, insurance & other professional services 1,776 224 2,000 89 11 100
Real estate and facilities management 852 125 977 87 13 100
Government services 2,037 171 2,208 92 8 100
Education 2,875 210 3,085 93 7 100
Health 1,814 272 2,086 87 13 100
Care 1,526 200 1,726 88 12 100
All economy 26,151 2,686 28,837 91 9 100

Construction, Building Services Engineering and Planning: Sector Skills Assessment 2012
44
The absolute number of BAME employed in the CBSE&P sector has doubled over the
period 2002 to 2010 from approximately 63,000 in 2002 to 130,000 in 2010. In 2002 BAME
accounted for almost three per cent of the workforce and in 2010 almost five per cent.
3.3.4 Employment by country of birth
Table 3.23 shows employment by country of birth across the whole economy in 2010.
Almost nine in ten (87 per cent) of the UK workforce was born in the UK, almost one in ten
(nine per cent) born in the rest of world and one in twenty (five per cent) born in the rest of
Europe (EU 27). The pattern of employment by country of birth was fairly similar across the
nations although Scotland (93 per cent), Wales (94 per cent) and Northern Ireland (92 per
cent) had slightly higher proportions of the workforce employed that are born in the UK
compared to the UK average (87 per cent) and correspondingly lower proportions born in the
rest of the world. The proportion of the workforce employed born in the rest of Europe (EU
27) was broadly similar across the nations.
Table 3.23: Employment by country of birth (Whole Economy) (UK) (2010)
Source: Labour Force Survey 2010, Office National Statistics.
Table 3.24 shows employment by country of birth for the CBSE&P sector compared to other
sectors and the whole economy. The sector workforce had the fourth highest proportion of
all sectors of employment of those born in the UK (91 per cent) compared to the whole
economy average (87 per cent). The sector had the same proportion of employment born in
the rest of Europe (EU 27) as the whole economy average (five per cent). As might be
expected the corresponding proportion of employment for those born in the rest of the world
in the sector (five per cent) was slightly lower than the whole economy average (nine per
cent).
000s % 000s % 000s % 000s % 000s %UK 25,054 87 20,856 86 2,264 93 1,228 94 706 92Rest of Europe (EU 27) 1,340 5 1,176 5 85 3 37 3 42 5Rest of world 2,457 9 2,295 9 96 4 47 4 18 2Total 28,851 100 24,327 100 2,446 100 1,312 100 766 100
Unweighted base 194 161 17 9 7
UK England Scotland Wales Northern Ireland

Construction, Building Services Engineering and Planning: Sector Skills Assessment 2012
45
Table 3.24: Employment by country of birth and sector (UK) (2010)
Source: Labour Force Survey 2010, Office National Statistics.
Table 3.25 shows employment by country of birth by 2 digit SIC code for the CBSE&P sector
in 2010. The proportions of employment by country of birth were fairly similar across the
sector groups with the exception of the group Architects which had a lower proportion of the
workforce born in the UK (87 per cent) compared to the sector average (91 per cent) and
correspondingly higher proportion of the workforce born in the rest of the world (eight per
cent) compared to the sector average (five per cent). The proportion of the workforce born in
Europe (EU 27) was the same as the sector average (five per cent).
Table 3.25: Employment by country of birth CBSE&P Sector by 2 Digit SIC code (UK) (2010)
Source: Labour Force Survey 2010, Office National Statistics.
UK
Rest of Europe (EU 27)
Rest of world Total UK
Rest of Europe (EU 27)
Rest of world Total
'000 '000 '000 '000 % % % %
Agriculture, forestry and fishing 377 21 8 406 93 5 2 100
Energy production and utilities 431 15 26 472 91 3 6 100
Manufacturing 2,567 210 193 2,969 86 7 6 100
Construction, building services engineering and planning 2,446 124 126 2,696 91 5 5 100
Wholesale and retail trade 3,644 177 318 4,140 88 4 8 100
Transportation and storage 1,213 77 158 1,448 84 5 11 100
Hospitality, tourism and sport 1,630 156 260 2,046 80 8 13 100
Information and communication technologies 640 33 88 761 84 4 12 100
Creative media and entertainment 850 51 87 987 86 5 9 100
Financial, insurance & other professional services 1,719 79 202 2,001 86 4 10 100
Real estate and facilities management 808 55 114 978 83 6 12 100
Government services 2,011 46 152 2,208 91 2 7 100
Education 2,769 106 213 3,088 90 3 7 100
Health 1,737 83 266 2,086 83 4 13 100
Care 1,490 65 174 1,729 86 4 10 100
Other sectors 722 43 71 836 86 5 9 100
All economy 25,054 1,340 2,457 28,851 87 5 9 100
UKEurope (EU 27)
Rest of world Total UK
Europe (EU 27)
Rest of world Total
'000 '000 '000 '000 % % % %
41 Construction of buildings 724 45 37 805 90 6 5 100
42 Civil engineering 260 11 12 283 92 4 4 100
43 Specialised construction activities 1049 42 41 1132 93 4 4 100
71 Architects 414 25 36 475 87 5 8 100
2,446 124 126 2,696 91 5 5 100
SIC07 2
Digit Code Description
Total
Construction, Building Services Engineering and Planning: Sector Skills Assessment 2012
46
4 Demand for, and value of, skills
Chapter Summary
The professional occupations group is the one forecast to experience the most growth
in the UK during the forecast period, both in the CBSE&P sector and in the whole
economy.
The numbers of individuals holding Level 1 and 2 qualifications in the CBSE&P sector
has generally been declining each year whilst numbers of individuals with Level 4+
qualifications has generally been increasing.
Despite the recession firms in the sector are still training and planning training for the
forthcoming year.
The occupational groupings employers believed would be affected by the need to
acquire new skills within the next year were: professional services occupations
(architects, building engineers and landscape designers) and construction contracting
occupations (electricians and scaffolders).
Areas of training employers anticipate will be required in the next year are mainly
health and safety or legislation/regulation related.
In the sector 53 per cent of employers carry out training, a significant proportion of
which do so without a formal training plan or budget.
The vast majority of employers who do not train believe their employees to be fully
proficient.
In both the CBSE&P sector and the whole economy employers in Scotland are more
likely to have training plans and carry out training than employers in the other nations.
Investment in skills and training of the workforce can bring significant financial
rewards and is suited to pursuing a strategy of quality and customer service over a
strategy of competing on price.
Construction, Building Services Engineering and Planning: Sector Skills Assessment 2012
47
4.1 Introduction
This section starts by looking at the latest data from Working Futures10 to build a picture of
the demand for certain skills. By looking at the future demand for occupations we can get an
indication of the demand for the associated training/qualifications.
Looking at the UK economy overall the professional occupations grouping is the one to
experience the highest level of growth at 869,000 over the forecast period, followed by
managers, directors and senior officials which is forecast to grow by 544,000. Occupational
groups to suffer significant decline are administrative and secretarial (-387,000) and skilled
trades occupations (-230,000). Looking at the percentage shares across the occupational
groupings these are fairly well spread with most of the groups having a percentage share of
around 10 to 15 per cent (see table 2.18).
When we look at the figures specific to the CBSE&P sector for the UK (see Table 2.19)
professional occupations again comes out as being the group with the highest forecast
growth at 91,000 and the administrative and secretarial group suffers negative growth as in
the whole economy. However when we look at the percentage shares for each occupational
group there is a different pattern to that of the whole economy, with the skilled trade
occupations being significantly higher than the other occupational groups at around 44 per
cent (compared to between one and six per cent), as can be clearly seen in Figure 4.1.
These forecasts suggest that there will be an increase in demand for occupations which fall
in the following categories; managers, directors and senior officials; professional
occupations; associate professional and technical and skilled trade occupations.
10 Working Futures 2010-2020, Wilson and Homenidou (2011)
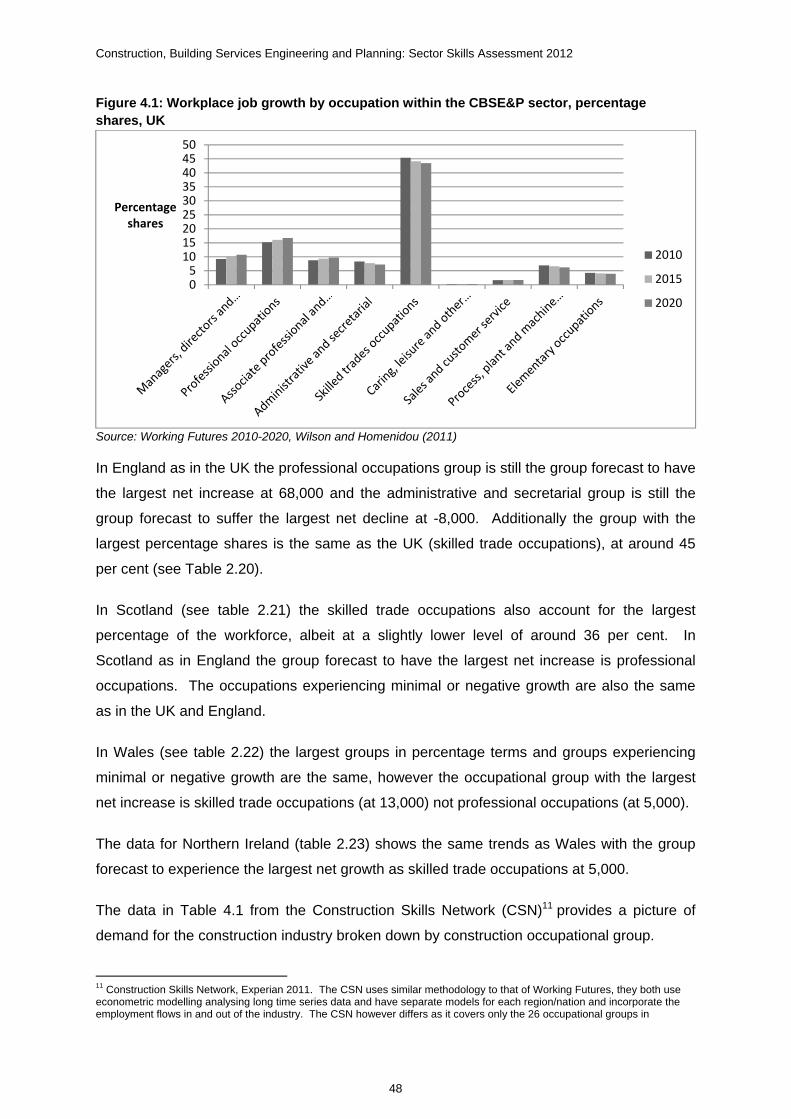
Construction, Building Services Engineering and Planning: Sector Skills Assessment 2012
48
Figure 4.1: Workplace job growth by occupation within the CBSE&P sector, percentage shares, UK
Source: Working Futures 2010-2020, Wilson and Homenidou (2011)
In England as in the UK the professional occupations group is still the group forecast to have
the largest net increase at 68,000 and the administrative and secretarial group is still the
group forecast to suffer the largest net decline at -8,000. Additionally the group with the
largest percentage shares is the same as the UK (skilled trade occupations), at around 45
per cent (see Table 2.20).
In Scotland (see table 2.21) the skilled trade occupations also account for the largest
percentage of the workforce, albeit at a slightly lower level of around 36 per cent. In
Scotland as in England the group forecast to have the largest net increase is professional
occupations. The occupations experiencing minimal or negative growth are also the same
as in the UK and England.
In Wales (see table 2.22) the largest groups in percentage terms and groups experiencing
minimal or negative growth are the same, however the occupational group with the largest
net increase is skilled trade occupations (at 13,000) not professional occupations (at 5,000).
The data for Northern Ireland (table 2.23) shows the same trends as Wales with the group
forecast to experience the largest net growth as skilled trade occupations at 5,000.
The data in Table 4.1 from the Construction Skills Network (CSN)11 provides a picture of
demand for the construction industry broken down by construction occupational group.
11 Construction Skills Network, Experian 2011. The CSN uses similar methodology to that of Working Futures, they both use econometric modelling analysing long time series data and have separate models for each region/nation and incorporate the employment flows in and out of the industry. The CSN however differs as it covers only the 26 occupational groups in
05
101520253035404550
Percentageshares
2010
2015
2020

Construction, Building Services Engineering and Planning: Sector Skills Assessment 2012
49
Table 4.1: UK and Regional Average Annual Recruitment Requirement 2012 - 2016
Source: Construction Skills Network, Experian 2011
Occupations with the largest recruitment requirements are labourers (not elsewhere
classified) at 5,230, non-construction professional technical and IT and other office based
staff (3,640), construction managers (3,380) and wood trades and interior fit out (3,210).
Non- construction operatives is showing a zero recruitment requirement overall and the
lowest figure is for building envelope specialists which has an annual average recruitment
requirement of just 410 across the UK.
The majority of trades are forecast to have increased in the levels required for 2016, the top
three are non-construction professional technical and IT and other office based staff, wood
trades and interior fit-out and construction managers.
ConstructionSkills footprint whereas Working Futures covers the whole economy and occupational groups are much broader. Further methodological information is contained in the methodology section.
Annual Recruitment Requirement
2010 2012 2016 2012-2016
Senior, executive, and business process managers 128,300 126,270 138,060 1,100
Construction managers 252,280 255,340 282,190 3,380Non-construction professional, technical, IT, and other office-based staff 311,690 307,050 324,300 3,640
Wood trades and interior fit-out 270,050 263,290 277,770 3,210
Bricklayers 65,560 66,840 63,120 2,570
Building envelope specialists 95,780 94,760 100,390 410
Painters and decorators 118,890 116,060 112,540 2,280
Plasterers and dry Liners 50,220 49,450 51,470 2,430
Roofers 41,490 39,250 40,250 1,020
Floorers 32,970 33,220 33,700 1,560
Glaziers 28,740 28,130 26,940 1,740
Specialist building operatives nec* 52,870 54,980 52,990 1,300
Scaffolders 19,550 20,180 20,300 980
Plant operatives 43,710 43,380 44,570 2,510
Plant mechanics/fitters 38,410 36,720 34,120 1,080
Steel erectors/structural 30,120 29,480 29,630 880
Labourers nec* 92,980 86,170 89,720 5,230
Electrical trades and installation 201,810 195,110 209,290 610
Plumbing and HVAC Trades 175,130 175,490 177,400 560
Logistics 35,620 36,280 39,280 2,970
Civil engineering operatives nec* 53,880 53,550 55,110 1,690
Non–construction operatives 37,870 36,760 36,350 -
Civil engineers 50,550 46,900 51,630 1,280
Other construction professionals and technical staff 183,260 177,420 194,160 1,680
Architects 39,330 37,860 39,850 950
Surveyors 67,500 66,980 73,000 1,180
Total (SIC 45) 2,177,920 2,147,760 2,239,490 41,150
Total (SIC 45 & 74.2) 2,518,560 2,476,920 2,598,130 46,240
Employment

Construction, Building Services Engineering and Planning: Sector Skills Assessment 2012
50
In conclusion the professional occupations group is the one forecast to experience the most
growth in the UK during the forecast period, both in the CBSE&P sector and the whole
economy.
The occupational grouping with by far the largest share of employment in the sector is the
skilled trades occupations, it is also one of the groups forecast to have the most growth at 27
per cent of the overall forecast net growth.
The rate of change for each occupational group throughout the forecast period is generally
slow and homogenous across the nations, with no steep increases or decreases in
employment growth.
4.2 Nature of Skills Used
In the CBSE&P sector there are just over 2.8 million individuals with qualifications versus
189,000 with no qualifications, interestingly the CBSE&P sector ranks fourth in terms of the
number of individuals with qualifications across all sectors. The number of individuals with
no qualifications in the CBSE&P sector is somewhat higher than the all sector average of
around 123,000.
In percentage terms the CBSE&P sector has average levels of individuals with no
qualifications at seven per cent (as shown in Table 4.2). The sector also has a significantly
below average percentage of individuals with Level 4+ qualifications (27 per cent versus an
average of 37 per cent).

Construction, Building Services Engineering and Planning: Sector Skills Assessment 2012
51
Table 4.2: Qualification profile of workforces with sectors, UK (2010)
Source: Labour Force Survey 2010 (ONS)
Table 4.3 gives a brief summary of the skill levels required by broad occupational group in
the CBSE&P sector.
Table 4.3 Skill levels by occupation
Source: ConstructionSkills
4.2.1 Nations Comparison
In the CBSE&P sector England has by far the highest number of individuals with Level 1
qualifications (530,000); the numbers for each level qualification generally follow the same
pattern across the nations with England having the highest numbers overall followed by
Scotland, Wales and then Northern Ireland (as shown in Table 4.4).
No qualifications Level 1 Level 2 Level 3 Level 4 + Total Unweighted base
% % % % % '000s '000s
Agriculture, forestry and fishing 18 21 22 15 24 406 2.978
Energy production and utilities 6 16 22 22 33 473 3.244
Manufacturing 9 19 21 22 29 2,969 20.404
Construction, building services, engineering and planning 7 16 23 28 27 2,697 17.927
Wholesale and retail trade 11 22 26 22 19 4,140 27.582
Transportation and storage 11 26 29 19 16 1,447 9.732
Hospitality, tourism and sport 10 20 27 22 20 2,046 13.183
Information and communication technologies 2 10 15 18 55 761 4.874
Creative media and entertainment 3 10 14 14 59 987 6.193
Financial, insurance & other professional services 2 12 18 17 52 2,001 12.805
Real estate and facilities management 14 23 22 17 23 978 6.565
Government services 2 12 19 20 46 2,209 15.100
Education 3 9 12 13 63 3,088 21.544
Health 3 10 14 12 61 2,087 14.749
Care 5 12 23 24 36 1,729 12.006
All economy 7 16 21 20 37 28,854 194.437
Broad Occupational Group Sector Occupations
Predominate Level of skil required
Predominate type of skill required
Minimum qualification level typically required
Managers, directors and senior officials
Senior, executive and business process managers, site supervisors, construction managers Higher skills
Transferable strategic, management, leadership and communication skills, technical skills Level 3/4
Professional occupations
architects, building engineers, landscape designers, building surveyors, quantity surveyors, civil engineers, mechanical engineers, technicians
Higher and intermediate skills, employability skills Job-specific technical skills Level 4/5
Associate professional and technical
Other construction professionals and technical staff, non-construction professional, technical, IT and other office based staff
Basic skills, intermediate skills, employability skills Job-specific technical skills Level 3
Administrative and secretarial non-construction office based staff Basic skills, employability skills
Job-specific technical skills, customer service skills Level 2
Skilled trades occupations
Skilled trades e.g. bricklayers, painters and decorators, plasterers and dry liners, roofers, glaziers, building envelope specialists, wood trades and interior fit-out, specialist building operatives (nec), scaffolders, steel erectors/structural, electrical trades and installation, plumbing and HVAC trades, logistics, non-construction operatives
Basic skills, intermediate skills, employability skills Job-specific technical skills Level 2
Personal service occupations n/a n/a n/a n/aSales and customer service occupations n/a n/a n/a n/aProcess, plant and machine operatives
Plant operatives, plant mechanics, fitters
Basic skills, intermediate skills, employability skills Job-specific technical skills Level 2
Elementary OccupationsLabourers, civil engineering operatives Employability skills and basic skills Transferable communication skills Health and Safety training

Construction, Building Services Engineering and Planning: Sector Skills Assessment 2012
52
When looking at qualification levels within the CBSE&P sector Level 3 and Level 4+
qualifications account for the highest percentage of qualifications in each nation. Given that
Level 2 qualifications are the construction industries adopted competence standard it is
surprising to note that in England the percentage of individuals holding Level 2 qualifications
is the same as those holding Level 1 qualifications.
Scotland has the highest percentage of Level 3 qualifications, which is not surprising
considering this is the level that the Scottish construction industry has traditionally set and
recognises as their standard of competence, unlike the rest of the UK where as previously
mentioned Level 2 is the standard.
Table 4.4: Qualification levels within the CBSE&P sector by nation (2010)
Source: Labour Force Survey 2010 (ONS)
4.2.2 Qualification Levels from 2002 to 2010
Data from the Labour Force Survey 2010 shows that numbers of individuals holding Level 1
qualifications had been steadily increasing from 2004 to 2007 (see Table 4.5), since then it
has been declining gradually.
In percentage terms there has been a decrease of seven per cent between 2002 and 2010
which may be a reflection of the industry increasingly seeing individuals with Level 2
qualifications as being work ready and competent whilst Level 1 qualifications are regarded
as being entry level qualifications only.
UK England Scotland Wales
Northern
Ireland
% % % % %
Level 4 + 25 26 33 26 19
Level 3 26 27 31 28 29
Level 2 21 23 20 26 28
Level 1 and below 28 23 16 20 24
Total 100 100 100 100 100
Weighted base (000s) 2,886 2,269 244 113 71
Unweighted base (000s) 17.927 14.840 1.703 0.719 0.665
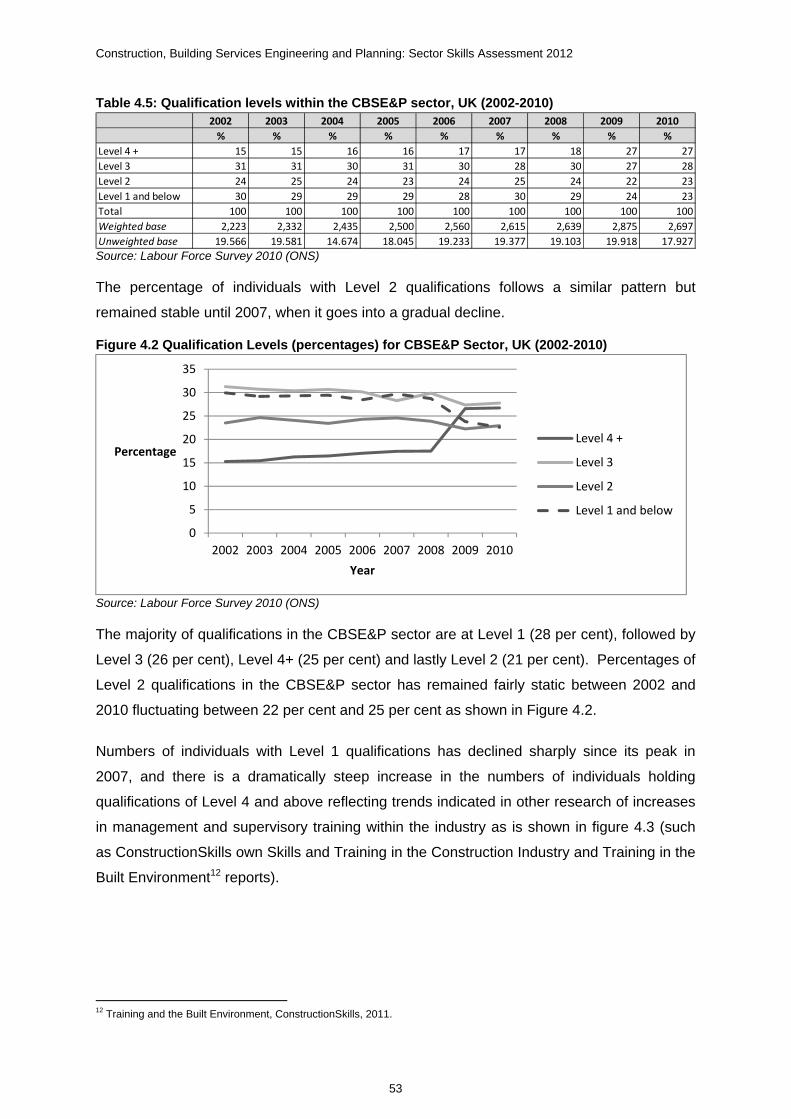
Construction, Building Services Engineering and Planning: Sector Skills Assessment 2012
53
Table 4.5: Qualification levels within the CBSE&P sector, UK (2002-2010)
Source: Labour Force Survey 2010 (ONS)
The percentage of individuals with Level 2 qualifications follows a similar pattern but
remained stable until 2007, when it goes into a gradual decline.
Figure 4.2 Qualification Levels (percentages) for CBSE&P Sector, UK (2002-2010)
Source: Labour Force Survey 2010 (ONS)
The majority of qualifications in the CBSE&P sector are at Level 1 (28 per cent), followed by
Level 3 (26 per cent), Level 4+ (25 per cent) and lastly Level 2 (21 per cent). Percentages of
Level 2 qualifications in the CBSE&P sector has remained fairly static between 2002 and
2010 fluctuating between 22 per cent and 25 per cent as shown in Figure 4.2.
Numbers of individuals with Level 1 qualifications has declined sharply since its peak in
2007, and there is a dramatically steep increase in the numbers of individuals holding
qualifications of Level 4 and above reflecting trends indicated in other research of increases
in management and supervisory training within the industry as is shown in figure 4.3 (such
as ConstructionSkills own Skills and Training in the Construction Industry and Training in the
Built Environment12 reports).
12 Training and the Built Environment, ConstructionSkills, 2011.
2002 2003 2004 2005 2006 2007 2008 2009 2010
% % % % % % % % %
Level 4 + 15 15 16 16 17 17 18 27 27
Level 3 31 31 30 31 30 28 30 27 28
Level 2 24 25 24 23 24 25 24 22 23
Level 1 and below 30 29 29 29 28 30 29 24 23
Total 100 100 100 100 100 100 100 100 100
Weighted base 2,223 2,332 2,435 2,500 2,560 2,615 2,639 2,875 2,697
Unweighted base 19.566 19.581 14.674 18.045 19.233 19.377 19.103 19.918 17.927
0
5
10
15
20
25
30
35
2002 2003 2004 2005 2006 2007 2008 2009 2010
Percentage
Year
Level 4 +
Level 3
Level 2
Level 1 and below

Construction, Building Services Engineering and Planning: Sector Skills Assessment 2012
54
Figure 4.3: Qualification levels within the CBSE&P Sector, UK (2002-2010)
Source: Labour Force Survey 2010 (ONS)
Amongst the 15 sectors the CBSE&P workforce has the fourth highest share of individuals
with no qualifications, third highest share of individuals with Level 1, 2 and 3 qualifications
(numbers are double that of the all sector mean), and seventh in terms of individuals with
Level 4 plus qualifications. Figures 4.2 and 4.3 demonstrate the trend over time for each
qualification level.
ConstructionSkills research 13 found that for NVQ/SVQ training Level 2 was the most
common with 47 per cent of employers offering this level of training followed by 23 per cent
who mainly provided Level 3 training and only 15 per cent mainly providing Level 4 training,
confirming that Level 2 is the sectors industry standard. The study also found that larger
organisations (those with 100 plus employees) predominantly provide NVQ/SVQ training at
higher levels, this may be because they often have a larger training budget and there may
be more opportunities for progression and development than in smaller organisations.
13 Training and Skills in the Construction Sector, ConstructionSkills, 2011. 1207 quantitative telephone interviews comprising 157 sole traders and 1050 employers within the construction industry, results are weighted to be representative of the industries business profile.
‐
100
200
300
400
500
600
700
800
900
2002 2003 2004 2005 2006 2007 2008 2009 2010
Number (000's)
Year
Level 4 +
Level 3
Level 2
Level 1 and below

Construction, Building Services Engineering and Planning: Sector Skills Assessment 2012
55
Recent research undertaken by the CBI14 found that forecasts for UK employment showed
that demand to fill jobs in more highly skilled occupations is growing. Of the 13.5 million jobs
that will need to be filled by 2017, over half will be for managers, professionals and
associate professionals and technical occupations. The report states that the UK will need
to develop its technical and managerial capabilities at intermediate and higher levels to meet
this demand.
4.2.3 Qualification Levels by sub-sector
Within the CBSE&P sector it is not surprising that the Architectural and Engineering
Activities sector (SIC 71), has the highest numbers of individuals with Level 4 plus
qualifications by some considerable margin. ConstructionSkills research 15 also found a
marked difference between the construction contracting sector and the professional services
sector with only 13 per cent of the former providing Level 4+ training compared to 40 per
cent of the latter, which reflects the requirement for those in the professional sector to have
professional qualifications. Interestingly the sector with the lowest levels of Level 4 plus
qualifications is the civil engineering sector (SIC 42).
Overall the sector with the highest numbers of qualifications is specialised construction
services (SIC 43); which has 1041,000 individuals with qualifications, however with only 92
per cent of its workforce with qualifications the sector does not have the highest percentage
of qualified individuals. In contrast the architectural and engineering sector (SIC 71) has 98
per cent of its 476,000 workforce holding qualifications.
14 Building for Growth: business priorities for education and skills, Education and skills survey 2011, CBI. Survey of 566 employers covering 2.2 million employees. The sample covered organisations from all sectors of the economy including public and private sectors and organisations of all sizes, results have been weighted using data from the ONS to ensure they accurately reflect practices in all sectors of the economy. 15 Training and Skills in the Construction Sector, ConstructionSkills, 2011
Construction, Building Services Engineering and Planning: Sector Skills Assessment 2012
56
Figure 4.4: Qualification levels within the CBSE&P Sector
Source: Labour Force Survey 2010 (ONS) SIC 41: Construction of Buildings; SIC 42: Civil Engineering; SIC 43: Specialised Construction Activities SIC 71: Architectural and Engineering Activities
In summary, the CBSE&P sector ranks fourth in terms of the number of individuals with
qualifications across all sectors. The recession seems to have decreased the numbers of
individuals with level 1 and 2 qualifications and significantly increased numbers holding
Level 4 plus qualifications. This is possibly a reflection of reduced training budgets as firms
in the sector struggle for survival as well as the reduced funding for lower level qualifications
and the use of management and supervisory level qualifications (Level 3 upwards) as a tool
to help businesses survive the recession. ConstructionSkills also has anecdotal evidence
that suggests that employers are attempting to retain skilled workers for as long as possible,
and that many employers are operating with reduced working hours in an effort to retain
workers and their skills.
4.3 Value of Skills
Using data from the 2011 UK Commission’s Employer Skills Survey on training plans and
training budgets it is possible to get an indication of how much employers value skills and
the extent to which they invest in their workforce.
Table 4.6 shows the number of employers in who have training plans in both the CBSE&P
sector and all economy. The percentages of employers with training plans across the
nations is similar in profile for the CBSE&P sector as that for all of the economy. In
percentage terms Scotland has the greatest proportion of firms with training plans both in the
sector and across the whole economy.

Construction, Building Services Engineering and Planning: Sector Skills Assessment 2012
57
The CBSE&P sector has the second lowest percentage of firms with a training plan out of all
the sectors (at 27 per cent), half the all sector average of 42 per cent.
Table 4.6: Employers with a training plan
Base: All employers Source: UK Commission’s Employer Skills Survey 2011 (Davies et al, 2012)
Table 4.7 shows that the percentages of firms with a training budget in the CBSE&P sector
are consistently and significantly lower than the percentages for the whole economy, except
in Scotland where there is only a three percentage point difference. Scotland again has the
highest percentages of firms with training budgets and indeed at a level twice that of the rest
of the nations.
With only 19 per cent of employers in the CBSE&P sector having a training budget this is
also considerably less than the all sector average of 29 per cent. The sector has one of the
lowest proportions of firms with a training budget e.g. in the education sector 67 per cent of
firms have a training budget. This would imply that the employers in the CBSE&P sector do
not consider training as important an investment as employers in other sectors do.
Table 4.7: Employers with a training budget
Base: All employers Source: UK Commission’s Employer Skills Survey 2011 (Davies et al, 2012)
The CBI survey16 (previously mentioned) found that 41 per cent of firms surveyed (in the
whole economy) planned to increase their investment in training and over half of the
employers were involved in apprenticeships with 17 per cent planning to become involved
with apprenticeships in the next few years, this is particularly important as apprenticeships
are one of the main qualification routes in the sector.
4.3.1 Employers providing training
This section examines the amount of employers providing training which can be used as a
further gauge of the importance employers give to training.
16 Building for Growth: business priorities for education and skills, Education and skills survey 2011, CBI
Number % Number % Number % Number % Number %
Construction, Building Services
Engineering & Planning 84,115 27 67,305 26 9,885 46 3,996 30 2,930 27
All economy 863,494 38 721,499 37 79,173 45 37,719 38 25,099 37Weighted base 2,299,921 1,960,298 175,115 98,952 65,558Unweighted base 87,572 75,053 2,503 6,012 4,004
UK England Scotland Wales Northern Ireland
UK England Scotland Wales Northern Ireland
Number % Number % Number % Number % Number %
Construction, Building Services
Engineering & Planning 59,489 19 49,098 19 6,428 30 2,230 17 1,733 16
All economy 657,040 29 554,765 28 57,270 33 25,624 26 19,380 30
Weighted base 2,299,921 1,960,298 175,115 98,952 65,558
Unweighted base 87,572 75,053 2,503 6,012 4,004

Construction, Building Services Engineering and Planning: Sector Skills Assessment 2012
58
Table 4.8: Employers providing training by sector
UK England Scotland Wales Northern Ireland
Number % Number % Number % Number % Number %
Agriculture, forestry and fishing 58,869 53 42,577 54 †7,737 †58 3,536 34 5,019 71
Energy production and utilities 8,743 69 6,858 69 1,040 81 554 67 291 54
Manufacturing 73,972 57 61,935 55 6,629 71 3,464 64 1,944 51
Construction 163,641 53 137,473 53 13,506 63 7,193 55 5,469 51
Wholesale and retail trade 261,948 56 218,681 55 23,692 67 11,347 54 8,228 58
Transportation and storage 55,004 45 46,106 43 5,633 70 2,103 50 1,161 52
Accommodation, food and tourism activities 134,314 61 108,618 60 15,665 71 6,570 58 3,461 59
Information and communication 39,090 54 34,418 52 †2,974 †83 1,215 62 483 44
Creative media and entertainment 74,069 52 63,945 51 †5,976 †54 2,690 57 1,457 71
Financial, insurance & other professional services 114,074 67 101,640 66 5,354 64 4,605 80 2,474 73
Real estate and facilities management 95,068 57 85,826 57 †6,652 †55 1,340 44 1,249 67
Government 41,608 76 32,980 74 4,715 85 2,343 87 1,571 77
Education 55,629 86 45,309 85 4,348 97 2,941 92 3,031 92
Health 44,797 86 38,133 85 3,208 99 2,216 79 1,239 84
Care 73,669 84 60,516 84 6,798 81 3,562 81 2,793 86
All economy 1,361,250 59 1,141,560 58 119,847 68 58,171 59 41,668 64
Weighted base 2,299,921 1,960,298 175,115 98,952 65,558
Unweighted base 87,572 75,053 2,503 6,012 4,004
Base: All establishments. Source: UK Commission’s Employer Skills Survey 2011 (Davies et al, 2012). † Treat figures with caution due to small base size of 50-99 establishments in Scotland

Construction, Building Services Engineering and Planning: Sector Skills Assessment 2012
59
Table 4.8 shows that there are just over 1.3m employers (whole economy) and 163,641
employers in the CBSE&P sector who provide training in the UK. Just over half of the
CBSE&P sector employers provide training (53 per cent), compared to the sector average of
59 per cent. This percentage is significantly higher than the percentages of firms in the
sector who have a training plan or a training budget, which may mean that there is a
significant proportion of employers in the sector who do provide training but it is not formally
planned (either in financial terms or in the form of a training plan).
Scotland once again has the highest percentage of firms in the sector who provide training,
at 63 per cent and Northern Ireland has the lowest at 51 per cent – although the range
between them is only 12 percentage points. Interestingly the percentage of firms in the
whole economy in Northern Ireland who provide training is one of the highest percentages at
64 per cent, so it appears that the country’s CBSE&P sector employers invest less in training
than employers in the economy as a whole.
Table 4.9 shows that 45 per cent of employers in the CBSE&P sector (compared to 52 per
cent of employers in the whole economy) arrange training for all categories of staff employed
and 55 per cent arrange training for some categories of staff employed.
The occupational group which the largest numbers of employers provide training to is
managers, directors and senior officials at 90,196 accounting for 55 per cent of the training
given by all establishments who provide training in the construction sector.

Construction, Building Services Engineering and Planning: Sector Skills Assessment 2012
60
Table 4.9: Employers providing training to employees by occupational group
Base: All establishments providing training * suppressed due to base size <25 ** denotes a figure greater than 0% but less than 0.5% Source: UK Commission’s Employer Skills Survey 2011 (Davies et al, 2012)
Figure 4.5 shows the percentages of employers which provide training for each occupational
group, it shows that the group to receive the second largest proportion of training in the
CBSE&P sector is skilled trade occupations at 34 per cent, however in the economy as a
whole it is the administrative and secretarial occupations at 27 per cent.
The occupational groups with the third largest percentages are administrative and secretarial
22 per cent (in the CBSE&P sector) and sales and customer service occupations at 19 per
cent (in the whole economy).
Number % Number %
Managers, Directors and senior officials occupations 90,196 55 825,928 61
Professional occupations 14,619 9 152,106 11
Associate professional and technical occupations 14,484 9 124,610 9
Administrative and secretarial occupations 36,088 22 372,218 27
Skilled trades occupations 55,962 34 192,480 14
Personal service occupations * * 129,265 9
Sales and customer service occupations 8,426 5 261,082 19
Process, plant and machine operatives 11,204 7 96,592 7
Elementary occupations 17,682 11 217,981 16
Other 6,093 4 35,410 3
Don't know 2,966 2 20,638 2
Arrange training for all categories of staff employed 74,399 45 714,095 52
Arrange training for some categories of staff employed 89,242 55 647,154 48
Weighted base 163,641 1,361,249
Unweighted base 6,250 66,916
Construction All economy

Construction, Building Services Engineering and Planning: Sector Skills Assessment 2012
61
Figure 4.5: Employers providing training to employees by occupational group
Source: UK Commission’s Employer Skills Survey 2011 (Davies et al, 2012)
ConstructionSkills research17 found that all employers surveyed expected someone in their
business would need to acquire new skills or knowledge in the next year in response to
external stimulus. Of the employers surveyed 45 per cent expected that new regulatory or
legislative requirements would have an impact upon their skills and knowledge needs for the
coming year, other factors cited by employers (in order of number of mentions) were:
the introduction of new working practices (eco/energy saving etc.);
the introduction of new technologies or equipment;
the development of new products and services;
increased competitive pressure;
new eco or energy-saving design/build methods;
environmental regulations.
Tables 4.10 and 4.11 show the occupations employers felt would be affected by the need to
acquire new skills or knowledge in the next year and the skills that they felt would need
improving or updating next year.
The tables show that the professional service occupation groups are those that are
perceived to be likely to be affected most by needs for upskilling, namely architects, building
engineers and landscape designers. Within the construction contracting sector, electricians
and scaffolders are among the occupations most cited.
17 ConstructionSkills, Training and Skills in the Construction Sector, 2011. Base 157 sole traders, 1050 employers totalling 1207 construction industry employers.
010203040506070
Percentage
Occupational Group
Construction
All economy
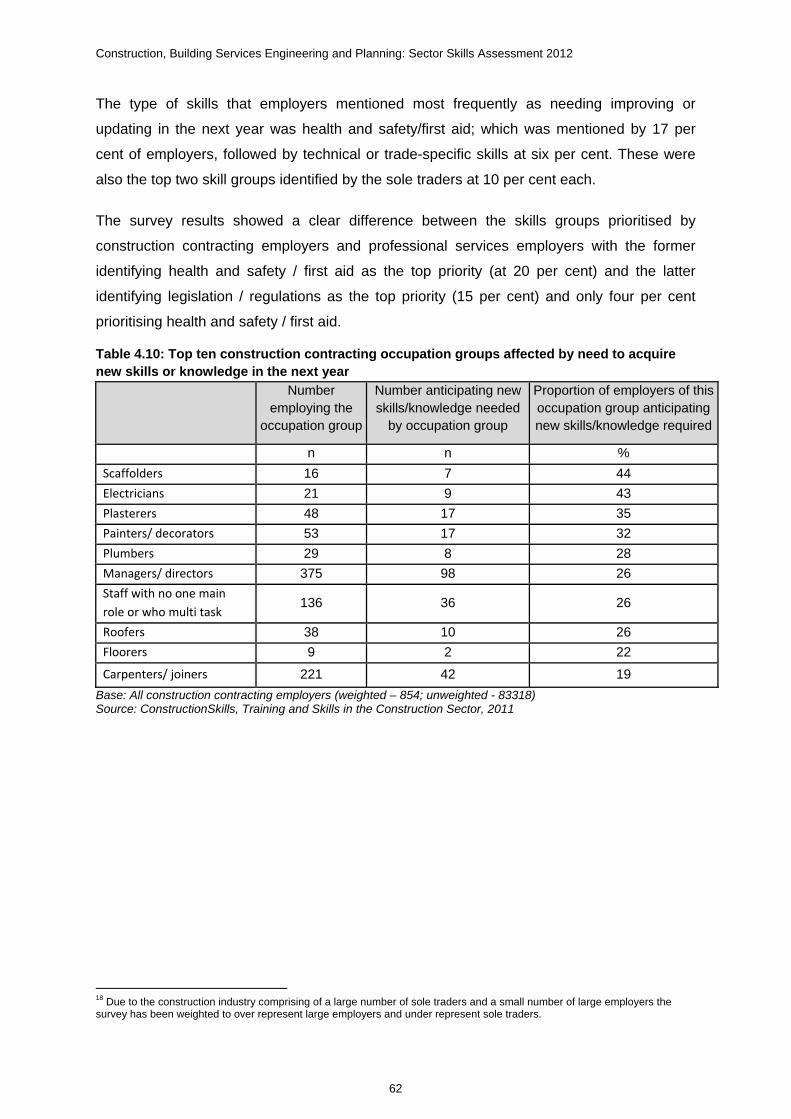
Construction, Building Services Engineering and Planning: Sector Skills Assessment 2012
62
The type of skills that employers mentioned most frequently as needing improving or
updating in the next year was health and safety/first aid; which was mentioned by 17 per
cent of employers, followed by technical or trade-specific skills at six per cent. These were
also the top two skill groups identified by the sole traders at 10 per cent each.
The survey results showed a clear difference between the skills groups prioritised by
construction contracting employers and professional services employers with the former
identifying health and safety / first aid as the top priority (at 20 per cent) and the latter
identifying legislation / regulations as the top priority (15 per cent) and only four per cent
prioritising health and safety / first aid.
Table 4.10: Top ten construction contracting occupation groups affected by need to acquire new skills or knowledge in the next year
Number employing the
occupation group
Number anticipating new skills/knowledge needed
by occupation group
Proportion of employers of this occupation group anticipating new skills/knowledge required
n n %
Scaffolders 16 7 44
Electricians 21 9 43
Plasterers 48 17 35
Painters/ decorators 53 17 32
Plumbers 29 8 28
Managers/ directors 375 98 26
Staff with no one main
role or who multi task 136 36 26
Roofers 38 10 26
Floorers 9 2 22
Carpenters/ joiners 221 42 19
Base: All construction contracting employers (weighted – 854; unweighted - 83318) Source: ConstructionSkills, Training and Skills in the Construction Sector, 2011
18 Due to the construction industry comprising of a large number of sole traders and a small number of large employers the survey has been weighted to over represent large employers and under represent sole traders.

Construction, Building Services Engineering and Planning: Sector Skills Assessment 2012
63
Table 4.11: Top ten professional services occupation groups affected by need to acquire new skills or knowledge in the next year
Number employing the occupation
group
Number anticipating new skills/knowledge
needed by occupation group
Proportion of employers of this occupation group
anticipating new skills/knowledge required
n n % Architects 88 63 72 Building service engineers
10 6 60
Building surveyors 8 4 50 Landscape designers 4 2 50 Quantity surveyors 7 3 43 Civil engineers 15 6 40 Mechanical engineers 10 4 40 Technicians 22 7 32 Other engineers 29 9 31 Town planners 7 2 29 Base: All professional services employers (weighted – 196; unweighted - 21719) Source: ConstructionSkills, Training and Skills in the Construction Sector, 2011
Levels of training in the CBSE&P sector have remained static or been in decline since 2009,
some of this may be attributed to the prolonged down turn (and resultant cuts to training
budgets), reduction in industry training grants and the reduction in funding from the
government, via schemes such as Train to Gain.
The training data seems to indicate that employers do value skills and training and are
willing to invest, echoing the findings of the CBI 20 survey which found that employers
recognise the value of skills and invest some £39bn a year in training their staff (whole
economy). This amounted to 109 million days of training covering 12.8 million workers in
2009. The survey also found strong support for apprenticeship programmes with 55 per
cent of respondents currently providing apprenticeship training. The 2010 employer and
skills survey found 99 per cent of firms saw skills as important or very important to achieving
their strategic objectives.
The report also found that 44 per cent of employers wanted to see measures to support
larger firms who are willing to train more apprentices than they need to allow smaller firms in
their sector/supply-chain to benefit from apprenticeship training. This included 53 per cent of
firms in construction where the industry is dominated by small firms, often working on short
term contracts and without the capacity to invest in the long-term training of an apprentice.
19 Due to the construction industry comprising of a large number of sole traders and a small number of large employers the survey has been weighted to over represent large employers and under represent sole traders. 20 Building for Growth: business priorities for education and skills, Education and skills survey 2011, CBI

Construction, Building Services Engineering and Planning: Sector Skills Assessment 2012
64
4.3.2 Provision of Training
Table 4.12 shows that almost 14.4 million of the employees in the whole economy of the UK
have received training, this equates to 53 per cent of all employees.
In the UK CBSE&P sector 48 per cent of the sectors employees have received training,
percentages across the nations are also around this level. This indicates that the numbers of
employees receiving training in the sector is below average.

Construction, Building Services Engineering and Planning: Sector Skills Assessment 2012
65
Table 4.12: Employees receiving training by sector
UK England Scotland Wales Northern Ireland
Number % Number % Number % Number % Number %
Agriculture, forestry and fishing 198,736 43 152,352 43 †25,724 †47 8,993 29 11,667 51
Energy production and utilities 167,507 50 120,687 49 32,976 55 11,072 66 2,772 38
Manufacturing 1,146,654 45 934,516 44 93,562 48 74,719 54 43,857 52
Construction 1,072,552 48 884,923 48 116,140 47 39,666 44 31,826 46
Wholesale and retail trade 2,340,353 50 1,960,109 49 201,879 55 109,603 55 68,761 48
Transportation and storage 538,494 41 448,580 39 49,954 44 22,489 58 17,468 63
Accommodation, food and tourism activities 1,221,736 53 1,017,791 53 124,328 55 48,807 49 30,809 50
Information and communication 233,240 38 205,944 37 †15,377 †51 5,255 28 6,663 65
Creative media and entertainment 524,081 48 451,335 47 †30,017 †43 24,215 69 18,513 69
Financial, insurance & other professional services 1,109,888 54 949,712 52 101,444 73 32,505 60 26,224 69
Real estate and facilities management 560,354 47 492,799 47 †36,284 †49 19,985 60 11,286 50
Government 1,004,866 56 835,514 58 82,550 47 49,901 53 36,901 59
Education 1,598,280 63 1,354,826 63 116,696 62 84,527 72 42,231 58
Health 1,300,684 65 1,032,851 64 187,638 81 58,505 49 21,690 52
Care 969,487 64 780,108 64 89,130 63 52,831 84 47,414 64
All economy 14,476,138 53 12,050,111 52 1,337,833 56 661,045 56 427,137 54
Weighted base 27,547,123 23,198,475 2,381,601 1,182,314 784,732
Unweighted base 2,816,693 2,345,213 201,868 178,922 90,690
Source: UK Commission’s ESS 2011 (Davies et al, 2012). Base: All employment. † Treat figures with caution due to small base size of 50-99 establishments in Scotland

Construction, Building Services Engineering and Planning: Sector Skills Assessment 2012
66
Table 4.13 shows that the occupational group with the highest number of employees
receiving training is skilled trades occupations at 310,536; although this group is the largest
overall it is not the one with the highest percentage of employees receiving training.
The occupational group with the highest proportion of employees receiving training is
process, plant and machinery operatives at 60 per cent, followed by professional
occupations at 58 per cent and then skilled trades’ occupations at 55 per cent.
Table 4.13: Employees receiving training by occupational group
Base: All employees receiving training Source: UK Commission’s Employer Skills Survey 2011 (Davies et al, 2012) *Suppressed due to base size <25
As can be seen in figure 4.6 the profile of employees receiving training across the
occupations in the sector is similar to that for the whole economy.
Number % Number %
Managers, Directors and senior officials occupations 226,342 38 2,413,145 45
Professional occupations 127,395 58 1,904,780 61
Associate professional and technical occupations 76,132 48 1,022,510 56
Administrative and secretarial occupations 99,336 36 1,607,984 45
Skilled trades occupations 310,536 55 1,041,373 55
Personal service occupations * * 1,606,254 70
Sales and customer service occupations 33,201 46 1,937,670 55
Process, plant and machine operatives 100,716 60 902,782 47
Elementary occupations 81,052 48 1,938,793 48
Other 16,368 n/a 100,845 n/a
All occupations 1,072,552 14,476,137
Weighted base 1,072,552 14,476,137
Unweighted base 73,960 1,517,802
Construction All economy

Construction, Building Services Engineering and Planning: Sector Skills Assessment 2012
67
Figure 4.6: Employees receiving training by occupational group
Source: UK Commission’s Employer Skills Survey 2011 (Davies et al, 2012)
Looking at training received in the last four weeks the levels for all industries have fluctuated
but mostly within a narrow range. The CBSE&P sector has been gradually increasing from
2002 to a peak of 250,000 in 2009. The mean value for the sector is 234,000, which is
around the all sector average. Over time the amount of training in the sector has hardly
altered (ranging from 218,000 to 250,000) but is consistently below the all economy
average. In percentage terms there has been very little change and again the percentage of
employees receiving training in the sector is lower than most other sectors as shown in
Table 4.14.
01020304050607080
Percentages
Occupational Group
Construction
All economy

Construction, Building Services Engineering and Planning: Sector Skills Assessment 2012
68
Table 4.14: Employees receiving training in last 4 weeks, 2002-2010 (UK)
Source: Labour Force Survey 2010, ONS
The level of training within the sector in real terms is generally close to the all economy
average, however in percentage terms the sector does not perform well compared to the
other sectors but it does remain consistent (as shown in Table 4.15).
Table 4.15: Employees receiving training in last 13 weeks, 2002-2010 (UK)
Source: Labour Force Survey 2010, ONS
2002 2003 2004 2005 2006 2007 2008 2009 2010
% % % % % % % % %Agriculture, forestry and fishing 7 7 6 6 6 6 6 6 6Energy production and utilities 15 14 13 13 13 13 12 11 12Manufacturing 10 9 9 10 9 9 9 9 9Construction, building services engineering and planning 10 9 10 9 9 9 9 9 8Wholesale and retail trade 11 10 10 10 10 10 9 8 8Transporta ion and storage 10 10 9 9 8 8 8 7 7Hospitality, tourism and sport 13 12 12 11 11 10 10 10 11Information and communication technologies 13 12 12 11 11 10 10 10 10Creative media and entertainment 13 12 12 12 11 11 10 9 8Financial, insurance & other professional services 18 17 17 16 15 15 15 14 15Real estate and facilities management 14 13 14 12 13 12 12 7 8Government services 20 20 20 20 19 18 19 19 17Education 22 21 21 21 20 20 20 20 18Heal h 24 25 25 25 24 23 22 24 24Care 24 25 25 25 24 23 22 21 20All economy 15 14 14 14 14 13 13 13 13Weighted base (000s) 4,095 3,987 4,074 4,061 3,949 3,863 3,834 3,685 3,642
Unweighted base (000s) 35.781 33.324 32.626 31.674 29.781 28.888 27.829 25.468 24.012
2002 2003 2004 2005 2006 2007 2008 2009 2010
% % % % % % % % %Agriculture, forestry and fishing 15 13 14 13 13 12 13 13 13Energy production and utilities 33 31 30 28 28 28 26 25 27Manufacturing 21 20 19 20 19 20 19 18 18Construction, building services engineering and planning 19 19 20 19 19 19 19 19 18Wholesale and retail trade 20 20 20 20 18 18 18 16 16Transportation and storage 21 21 20 19 19 18 18 17 18Hospitality, tourism and sport 24 22 22 21 21 20 19 19 19Information and communication technologies 27 25 24 23 23 22 21 21 20Creative media and entertainment 24 24 23 23 23 21 21 18 17Financial, insurance & other professional services 35 33 32 33 30 30 29 29 29Real estate and facilities management 27 26 27 26 26 25 24 15 16Government services 40 41 40 39 38 37 36 37 35Education 44 42 42 42 40 39 40 39 38Health 45 46 46 47 46 44 44 47 46Care 45 46 46 47 46 44 44 41 40All economy 28 28 28 28 27 26 26 26 26Weighted base (000s) 7,952 7,873 7,917 8,037 7,883 7,681 7,669 7,382 7,359
Unweighted base (000s) 69.767 65.973 63.658 63.118 59.87 57.81 56.008 51.497 48.93

Construction, Building Services Engineering and Planning: Sector Skills Assessment 2012
69
These findings are corroborated by the findings of ConstructionSkills research21 which found
that during the last year 41 per cent of employer establishments surveyed had arranged
some sort of training for at least one member of staff and that on average employers had
provided training to at least half of their workers (54 per cent) – which has increased from 39
per cent in 2009. The study also found that the proportions of employees provided with
training were closely balanced (16 per cent saying ‘decreased’ and 14 per cent saying
‘increased’), with a net decrease of just two per cent in 2011, compared to a net decrease of
16 per cent in 2009. Demonstrating that within the sector the amount of training employers
are carrying out and the numbers of employees receiving training has increased since 2009
as shown in Figure 4.7.
Figure 4.7: Employees receiving training in last 13 weeks in the CBSE&P Sector 2002-2010 (UK)
Source: Labour Force Survey 2010, ONS
4.3.3 Employee training by Nation
Although the number of employees receiving training in the last four weeks in England is
significantly higher than the devolved nations when the data is converted to percentages
there is only a variation of two percentage points and the proportion of training occurring in
Scotland and Wales (Northern Ireland figure suppressed due to sample size) is actually
higher than England which is eight per cent (see Table 4.16).
21 Training and Skills in the Construction Sector, ConstructionSkills, 2011
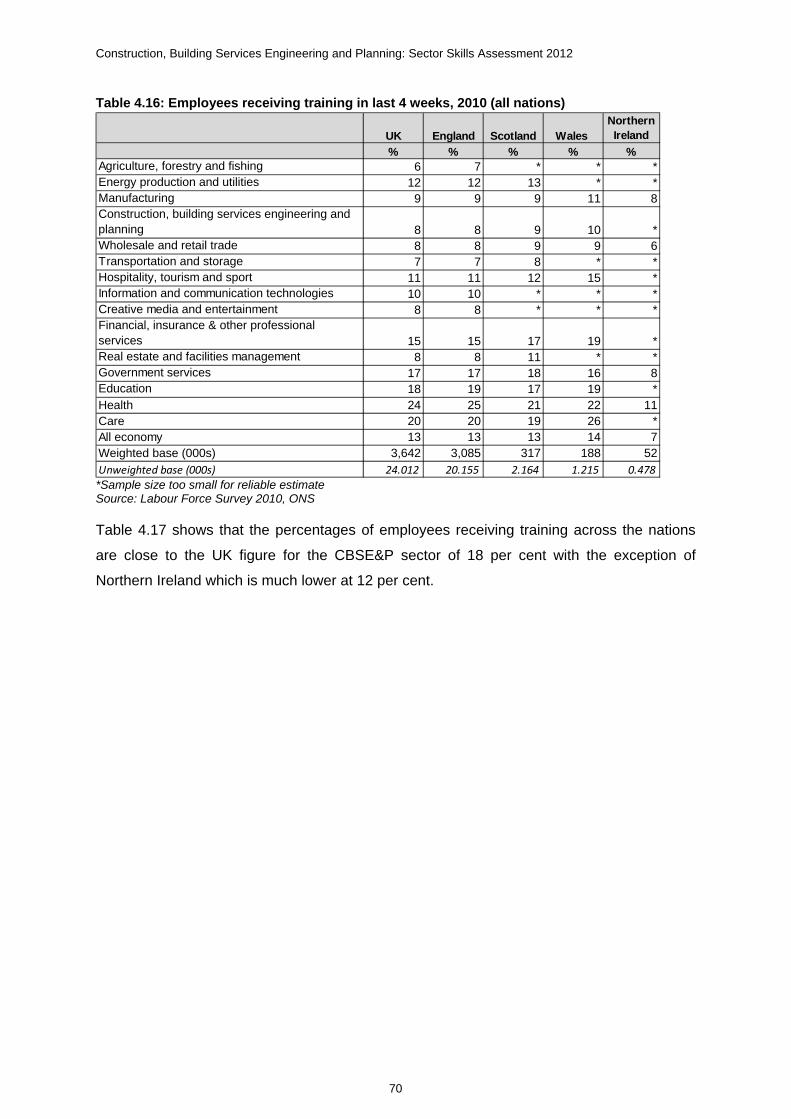
Construction, Building Services Engineering and Planning: Sector Skills Assessment 2012
70
Table 4.16: Employees receiving training in last 4 weeks, 2010 (all nations)
*Sample size too small for reliable estimate Source: Labour Force Survey 2010, ONS
Table 4.17 shows that the percentages of employees receiving training across the nations
are close to the UK figure for the CBSE&P sector of 18 per cent with the exception of
Northern Ireland which is much lower at 12 per cent.
UK England Scotland Wales Northern Ireland
% % % % %Agriculture, forestry and fishing 6 7 * * *Energy production and utilities 12 12 13 * *Manufacturing 9 9 9 11 8Construction, building services engineering and planning 8 8 9 10 *Wholesale and retail trade 8 8 9 9 6Transportation and storage 7 7 8 * *Hospitality, tourism and sport 11 11 12 15 *Information and communication technologies 10 10 * * *Creative media and entertainment 8 8 * * *Financial, insurance & other professional services 15 15 17 19 *Real estate and facilities management 8 8 11 * *Government services 17 17 18 16 8Education 18 19 17 19 *Health 24 25 21 22 11Care 20 20 19 26 *All economy 13 13 13 14 7Weighted base (000s) 3,642 3,085 317 188 52Unweighted base (000s) 24.012 20.155 2.164 1.215 0.478

Construction, Building Services Engineering and Planning: Sector Skills Assessment 2012
71
Table 4.17: Employees receiving training in last 13 weeks, 2010 (all nations)
*Sample size too small for reliable estimate Source: Labour Force Survey 2010, ONS
4.3.4 Training by Sub-Sectors
Specialised construction services (SIC 43) is the sector which has carried out the most
training over both time scales – 78,000 employees received training in the last four weeks
and 174,000 in the last 13 weeks (a total of 252,000).
The construction contracting sector (SIC41) has the second highest amount of training at
190,000, closely followed by the professionals (SIC71) at 172,000. ConstructionSkills 2011
survey on Training and Skills in the Construction Sector also found that a greater proportion
of professional services firms had funded or arranged some sort of training for at least one
member of staff in the last year (52 per cent compared to 38 per cent in the construction
contracting sector).
Interestingly the civil engineering sector (SIC42) had lower numbers of training than the
construction sector (SIC 41).
UK England Scotland Wales Northern Ireland
% % % % %Agriculture, forestry and fishing 13 15 12 * *Energy production and utilities 27 27 30 * *Manufacturing 18 18 18 20 18Construction, building services engineering and planning 18 18 21 18 12Wholesale and retail trade 16 17 17 15 13Transportation and storage 18 18 19 16 *Hospitality, tourism and sport 19 19 20 21 *Information and communication technologies 20 20 22 * *Creative media and entertainment 17 17 18 20 *Financial, insurance & other professional services 29 29 28 32 17Real estate and facilities management 16 16 23 18 *Government services 35 35 35 34 24Education 38 39 34 38 26Health 46 47 42 44 32Care 40 40 40 46 27All economy 25 25 27 24 18Weighted base (000s) 7,181 6,065 668 312 137Unweighted base (000s) 48.93 40.947 4.41 2.282 1.291

Construction, Building Services Engineering and Planning: Sector Skills Assessment 2012
72
Figure 4.8: Employees receiving training in last 4 weeks and 13 weeks in the CBSE&P Sector by SIC Code
Source: Labour Force Survey 2010, ONS
4.3.5 Type of Training
Table 4.18 shows the spread across different types of training, the profile for construction is
very similar to that across the whole economy (as shown in figure 4.9), with the main four
types of training in the CBSE&P sector being:
Job specific training (77 per cent of employers funding or providing this type of training)
Health & Safety / first aid (72 per cent of employers funding for or providing this type of
training)
Induction training (44 per cent of employers funding or providing this type of training)
Training in new technology (44 per cent of employers funding or providing this type of
training).
This would suggest that these four areas are considered to be the most important and given
the lower levels of management and supervisory training it looks like these are seen as
being less important which is interesting considering that the labour force survey data shows
that nearly all of the employers surveyed recognised skills gaps in their management teams.

Construction, Building Services Engineering and Planning: Sector Skills Assessment 2012
73
These findings are corroborated by ConstructionSkills research 22 which found the most
frequently required training was health and safety/first aid and technical or trade specific
skills. It seems that this kind of training is always in demand in the construction sector.
Table 4.18: Type of training funded or arranged for employees
Base: All establishments providing training ** denotes a figure greater than 0% but less than 0.5% Source: UK Commission’s Employer Skills Survey 2011 (Davies et al, 2012)
It is interesting to note and perhaps surprising that the percentage of firms carrying out
health and safety training is virtually the same in the CBSE&P sector as in the whole
economy given that health and safety is a significant focus for legislators and employers in
the CBSE&P sector. One possible reason for this relates to the composition of the sector.
The expectation being that a more significant proportion of firms employing site-based
occupations in the CBSE&P sector would have provided health and safety training
compared to those whose activity is largely office-based, such is the case with architectural
practice. This sub-sectoral variation is undoubtedly hidden in the figures for the CBSE&P
sector as a whole. There would also be considerable difference in the level and content of
health and safety training received by CBSE&P employees in the sector compared to other
sectors.
22 Training and Skills in the Construction Sector, ConstructionSkills, 2011. Survey consisted of 1207 telephone interviews with construction industry employers, 157 of which were sole traders and 1050 employers.
Number % Number %
Job specific training 126,513 77 1,149,860 84
Health and safety/first aid training 118,404 72 970,183 71
Induction training 72,601 44 702,846 52
Training in new technology 71,557 44 641,023 47
Management training 33,335 20 457,763 34
Supervisory training 39,494 24 437,577 32
Personal Development Training* 3,891 2 45,451 3
Other 184 ** 4,101 **
None of these 1,856 1 8,809 1
Don't know 148 ** 2,412 **
Weighted base 163,641 1,361,249
Unweighted base 6,250 66,916
Construction All economy

Construction, Building Services Engineering and Planning: Sector Skills Assessment 2012
74
Figure 4.9: Type of training funded or arranged for employees (percentages)
Source: UK Commission’s Employer Skills Survey 2011 (Davies et al, 2012)
In the CBSE&P sector apprenticeships play a significant role in qualification and skills
development particularly in the construction contracting sector with apprentices making up
more than two in every 100 employees. Recent research undertaken by ConstructionSkills23
has shown an increase in the numbers of employers employing an apprentice since 2009
with 13 per cent of employers having staff undertaking an apprenticeship compared to seven
per cent in 2009. Larger firms were found to be much more likely to utilise apprenticeships
and organisations offering apprenticeships were more likely to have filled their posts in 2011
than they were in 2009.
Despite the recession firms are still training and planning training for the forthcoming year
and the top three factors employers in the sector expected would influence their future skills
needs were:
new regulatory or legislative requirements
the introduction of new working practices
the introduction of new technologies or equipment.
The occupations employers believed would be affected by the need to acquire new skills
within the next year were:
Professional Services occupations – architects, building engineers and landscape
designers
Construction Contracting occupations – electricians and scaffolders.
23 Training and Skills in the Construction Sector, ConstructionSkills, 2011
‐10 20 30 40 50 60 70 80 90
Percentage
Type of Training
Construction
All economy

Construction, Building Services Engineering and Planning: Sector Skills Assessment 2012
75
Areas of training employers anticipate will be required in the next year are mainly health and
safety or legislation/regulation related.
4.3.6 Managers & Professionals
In the UK the percentage share of managers/professionals without a Level 4 (or above)
qualification peaked in 2006/7 at around 60 per cent which drops during the recession to
around 50 per cent (see Table 4.19). In comparison looking at the whole economy (see
Table 4.20) the share of managers without Level 4 or above qualifications is much lower in
2010 at 39 per cent compared to 50 per cent in the CBSE&P sector.
Although the overall numbers without these qualifications has actually increased by around
100,000 from 2008 to the 2009 level of 422,000.
Table 4.19: Managers and professionals in the CBSE&P Sector without Level 4 or higher qualifications 2002-2010 (UK)
Source: Labour Force Survey 2010 (ONS) Table 4.20: Managers and professionals (whole economy) without Level 4 or higher qualifications 2002-2010 (UK)
Source: Labour Force Survey 2010 (ONS)
Table 4.21 shows higher numbers of managers or professionals without a Level 4
qualification in England than the other nations. Levels have remained fairly consistent over
time in all nations except England which has ranged from 217,000 in 2002 increasing each
year (generally) to a peak of 370,000 in 2009 with a slight decline in 2010. The results for
Northern Ireland can only be taken as indicative but they suggest that there may be less
managers or professionals without a Level 4 or higher qualification in Northern Ireland than
in the other nations.
2002 2003 2004 2005 2006 2007 2008 2009 2010
000s 253 263 217 268 311 308 335 422 393% 61 62 46 54 61 59 60 51 50
Weighted base (number of
managers and professionals) 000s 416 428 475 493 507 518 556 835 787
Managers or professionals without L4 or higher
qualifications
2002 2003 2004 2005 2006 2007 2008 2009 2010Managers or professionals
without L4 or higher qualifications 000s 3,239 3,336 2,554 3,023 3,460 3,471 3,496 3,371 3,283
% 45 45 33 38 43 42 42 40 39Weighted base (number of
managers and professionals) 000s 7,214 7,481 7,726 7,866 8,123 8,201 8,356 8,406 8,483
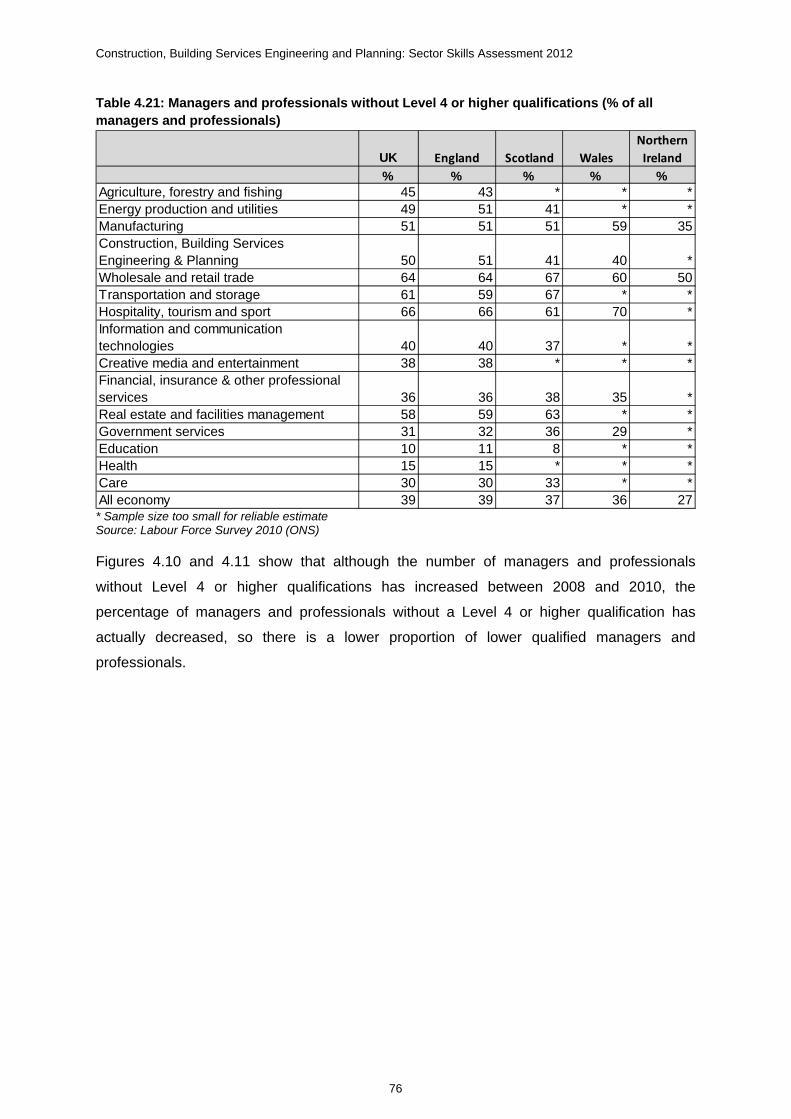
Construction, Building Services Engineering and Planning: Sector Skills Assessment 2012
76
Table 4.21: Managers and professionals without Level 4 or higher qualifications (% of all managers and professionals)
* Sample size too small for reliable estimate Source: Labour Force Survey 2010 (ONS)
Figures 4.10 and 4.11 show that although the number of managers and professionals
without Level 4 or higher qualifications has increased between 2008 and 2010, the
percentage of managers and professionals without a Level 4 or higher qualification has
actually decreased, so there is a lower proportion of lower qualified managers and
professionals.
UK England Scotland Wales
Northern
Ireland
% % % % %Agriculture, forestry and fishing 45 43 * * *Energy production and utilities 49 51 41 * *Manufacturing 51 51 51 59 35Construction, Building Services Engineering & Planning 50 51 41 40 *Wholesale and retail trade 64 64 67 60 50Transportation and storage 61 59 67 * *Hospitality, tourism and sport 66 66 61 70 *Information and communication technologies 40 40 37 * *Creative media and entertainment 38 38 * * *Financial, insurance & other professional services 36 36 38 35 *Real estate and facilities management 58 59 63 * *Government services 31 32 36 29 *Education 10 11 8 * *Health 15 15 * * *Care 30 30 33 * *All economy 39 39 37 36 27

Construction, Building Services Engineering and Planning: Sector Skills Assessment 2012
77
Figure 4.10: Managers and professionals in the CBSE&P Sector without Level 4 or higher qualifications 2002-2010 2010 (UK, percentages)
Source: Labour Force Survey 2010 (ONS)
Figure 4.11: Managers and professionals in the CBSE&P Sector without Level 4 or higher qualifications 2002-2010 (UK)
Source: Labour Force Survey 2010 (ONS)
ConstructionSkills own research 24 into management and supervisory skills in the
construction sector found that a quarter of managerial staff were reported as having a level
4 or 5 qualification and three fifths have at least a level 3 qualification with only seven per
24 ConstructionSkills, Management & Supervisory Skills Research, 2011. Survey consisted of 22 federation interviews, 1450 quantitative interviews with industry employers who belonged to 20 specified federations and qualitative interviews with 5 federations and 15 employers who were selected on the basis of specific experiences. Survey results are grossed up to the approximate number of employers within each federation.
0
10
20
30
40
50
60
70
2002 2003 2004 2005 2006 2007 2008 2009 2010
Percentage
Year
0
50
100
150
200
250
300
350
400
450
2002 2003 2004 2005 2006 2007 2008 2009 2010
Numbers (000's)
Year

Construction, Building Services Engineering and Planning: Sector Skills Assessment 2012
78
cent having no formal qualifications. Although this research differs significantly from the LFS
in methodology (as it was a one off piece of research as opposed to a four quarter average,
for which respondents were employers not households), both surveys found that the
proportion of managers without Level 4 or above qualifications was relatively low.
Directors, senior managers and middle managers were the most likely to hold a level 4 or
higher qualification and supervisors were the most likely to hold level 2 qualifications. Larger
firms tend to have more management staff with qualifications. The survey found that the
number of firms who had provided training or development (formal and non-formal) for any
of their managerial staff was at a similar level to that shown in the 2007 survey, so it would
appear the recession has had little effect on overall levels of managerial training. Managers
and supervisors were more likely to have received training in the last 12 months than
directors and senior managers, perhaps indicating that firms in the sector place less
importance on the latter’s training. The survey also found that managerial training tended to
be focussed on immediate and job-specific issues rather than strategic or broad
management issues aimed at improving business performance.
The survey found that nearly all of the employers recognised skill gaps in their management
teams. These were most commonly reported as being in the areas of understanding the
importance and implication of ‘green’ issues and sustainability; keeping up with legislation;
IT skills; identifying and winning new business opportunities and risk management.
However those mentioned most frequently are not necessarily the most important, those that
were of high incidence and importance were found to be delegation; identifying new
markets/clients; new business skills; maximising staff productivity; time management and
communication.
4.3.7 Barriers to training
In terms of barriers to training the pattern for the CBSE&P sector is very similar to that of the
economy as a whole with over 60 per cent of the employers who do not carry out training
stating that this was because they believed that all of their staff were fully proficient (64 per
cent for the UK whole economy, between 60 & 71 per cent in the CBSE&P sector),
SummitSkills research 25 corroborates this and they state in their 2010 Sector Skills
Assessment that according to their employers the vast majority of operatives in the sector
have all the skills they need and interestingly the number of firms with this opinion increased
from 2008 to 2009.
25 SummitSkills, Sector Skills Assessment, 2010

Construction, Building Services Engineering and Planning: Sector Skills Assessment 2012
79
The second highest barrier cited was no money available for training (10 per cent for the UK
whole economy and between 10 to 18 per cent in the CBSE&P sector) and the third most
commonly stated barrier was that the organisations did not consider training to be a priority
(nine per cent in the UK whole economy and between 10 to 18 per cent in the CBSE&P
sector). Table 4.22 shows a breakdown for the CBSE&P sector. As you would expect in the
current economic climate the number of firms citing lack of time to train/be trained/organise
training is negligible.
Generally the other issues/barriers stated had values of less than five per cent each in each
nation.
Scotland differs slightly when looking at the percentages for the sector as none of its
employers stated that training was not considered to be a priority, but 17 per cent of
employers in Scotland gave no particular reason for not providing training.
It is also interesting to note that the share of firms stating that they are a small firm and
therefore training is not required, is no higher than two per cent, so it would seem that firms
in the industry still value training even if the organisation is small. It is also encouraging in
respect of training provision as only very small numbers of firms have experienced issues
around course provision or location of training courses.
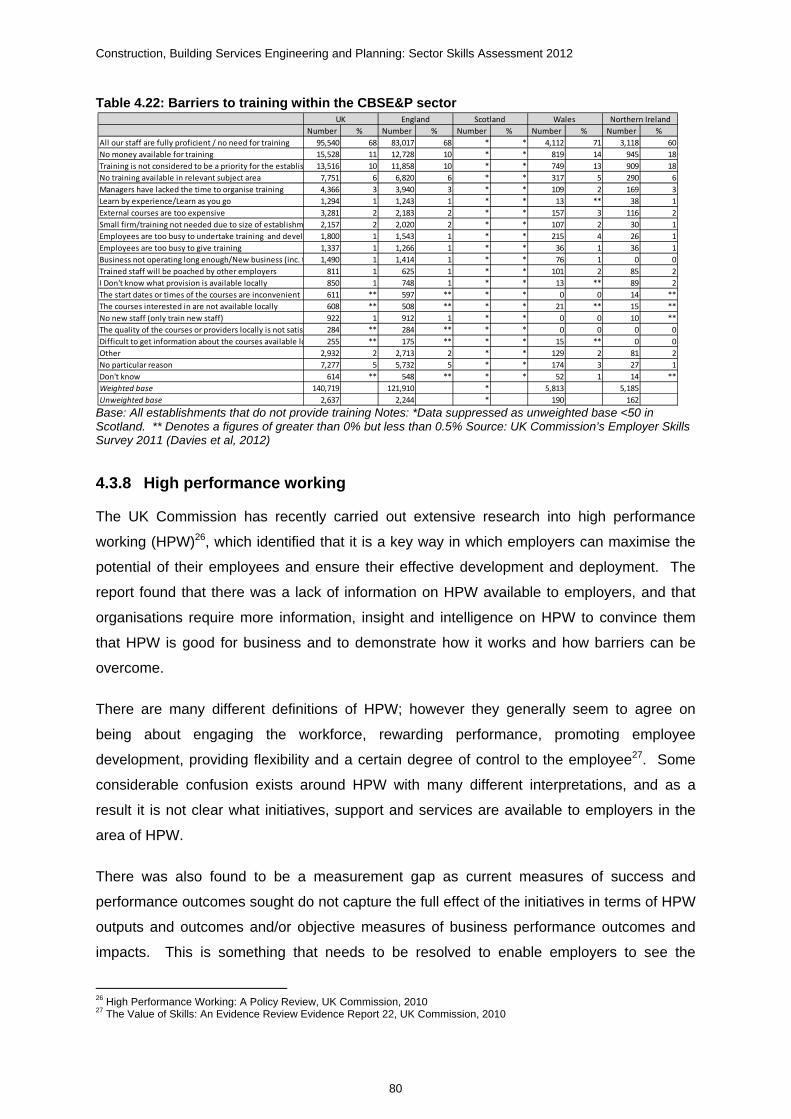
Construction, Building Services Engineering and Planning: Sector Skills Assessment 2012
80
Table 4.22: Barriers to training within the CBSE&P sector
Base: All establishments that do not provide training Notes: *Data suppressed as unweighted base <50 in Scotland. ** Denotes a figures of greater than 0% but less than 0.5% Source: UK Commission’s Employer Skills Survey 2011 (Davies et al, 2012)
4.3.8 High performance working
The UK Commission has recently carried out extensive research into high performance
working (HPW)26, which identified that it is a key way in which employers can maximise the
potential of their employees and ensure their effective development and deployment. The
report found that there was a lack of information on HPW available to employers, and that
organisations require more information, insight and intelligence on HPW to convince them
that HPW is good for business and to demonstrate how it works and how barriers can be
overcome.
There are many different definitions of HPW; however they generally seem to agree on
being about engaging the workforce, rewarding performance, promoting employee
development, providing flexibility and a certain degree of control to the employee27. Some
considerable confusion exists around HPW with many different interpretations, and as a
result it is not clear what initiatives, support and services are available to employers in the
area of HPW.
There was also found to be a measurement gap as current measures of success and
performance outcomes sought do not capture the full effect of the initiatives in terms of HPW
outputs and outcomes and/or objective measures of business performance outcomes and
impacts. This is something that needs to be resolved to enable employers to see the
26 High Performance Working: A Policy Review, UK Commission, 2010 27 The Value of Skills: An Evidence Review Evidence Report 22, UK Commission, 2010
Number % Number % Number % Number % Number %
All our staff are fully proficient / no need for training 95,540 68 83,017 68 * * 4,112 71 3,118 60
No money available for training 15,528 11 12,728 10 * * 819 14 945 18
Training is not considered to be a priority for the establis 13,516 10 11,858 10 * * 749 13 909 18
No training available in relevant subject area 7,751 6 6,820 6 * * 317 5 290 6
Managers have lacked the time to organise training 4,366 3 3,940 3 * * 109 2 169 3
Learn by experience/Learn as you go 1,294 1 1,243 1 * * 13 ** 38 1
External courses are too expensive 3,281 2 2,183 2 * * 157 3 116 2
Small firm/training not needed due to size of establishm 2,157 2 2,020 2 * * 107 2 30 1
Employees are too busy to undertake training and devel 1,800 1 1,543 1 * * 215 4 26 1
Employees are too busy to give training 1,337 1 1,266 1 * * 36 1 36 1
Business not operating long enough/New business (inc. t 1,490 1 1,414 1 * * 76 1 0 0
Trained staff will be poached by other employers 811 1 625 1 * * 101 2 85 2
I Don't know what provision is available locally 850 1 748 1 * * 13 ** 89 2
The start dates or times of the courses are inconvenient 611 ** 597 ** * * 0 0 14 **
The courses interested in are not available locally 608 ** 508 ** * * 21 ** 15 **
No new staff (only train new staff) 922 1 912 1 * * 0 0 10 **
The quality of the courses or providers locally is not satis 284 ** 284 ** * * 0 0 0 0
Difficult to get information about the courses available lo 255 ** 175 ** * * 15 ** 0 0
Other 2,932 2 2,713 2 * * 129 2 81 2
No particular reason 7,277 5 5,732 5 * * 174 3 27 1
Don't know 614 ** 548 ** * * 52 1 14 **
Weighted base 140,719 121,910 * 5,813 5,185
Unweighted base 2,637 2,244 * 190 162
UK England Scotland Wales Northern Ireland
Construction, Building Services Engineering and Planning: Sector Skills Assessment 2012
81
tangible benefits of adopting HPW practices and processes and encourage them to
participate28.
UK Commission’s research indicates that organisations who implement a range of HPW
practices are likely to perform better on a range of key indicators. The research also found
that employers in a wide range of sectors could benefit from the introduction of integrated
Human Resource Management systems or HPW. The research found a compelling amount
of evidence that HPW can have a positive impact on productivity, added-value per employee
and profitability. At the time of the report adoption of HPW in the UK was estimated to be no
more than a third of all UK firms at best.
There was also considerable evidence that management is one of the most influential
factors in achieving higher performance and that companies that apply accepted
management practices perform significantly better than those who do not. In the current
climate the majority of organisations (particularly in the CBSE&P sector) are focusing on
survival and have neither the time nor the resources to explore the benefits of HPW and
skills utilisation.
To build a picture of the situation in the CBSE&P sector this report examines how employers
identify talent, the extent of variety employees have in their work, autonomy levels and
flexible working opportunities.
Identifying talent
As shown in table 4.23, only seven per cent of firms in the CBSE&P sector have a formally
documented process for identifying high potential or talented individuals, 29 per cent have
an informal way of identifying these individuals, so in total only 36 per cent of firms in the
sector have ways of identifying potential talent. The overwhelming majority of firms in the
sector have no mechanisms for recognising high potential or talented individuals, which
would suggest that it is not important to the majority of the sectors employers. The CBSE&P
sector has one of the lowest percentages of firms with formal ways of identifying high
potential or talented individuals at seven per cent with the all economy average being double
that of the industry at 14 per cent.
28 High Performance Working: A Policy Review, Evidence Report 18, May 2010, UK Commission
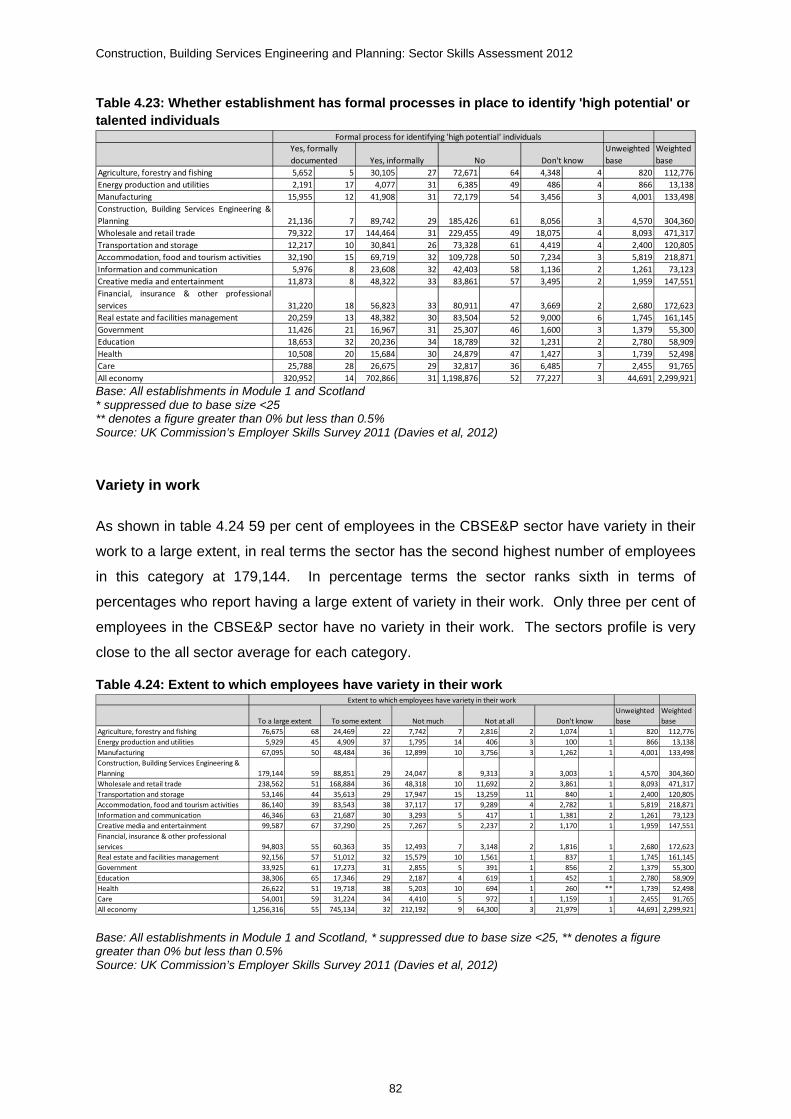
Construction, Building Services Engineering and Planning: Sector Skills Assessment 2012
82
Table 4.23: Whether establishment has formal processes in place to identify 'high potential' or talented individuals
Base: All establishments in Module 1 and Scotland * suppressed due to base size <25 ** denotes a figure greater than 0% but less than 0.5% Source: UK Commission’s Employer Skills Survey 2011 (Davies et al, 2012)
Variety in work
As shown in table 4.24 59 per cent of employees in the CBSE&P sector have variety in their
work to a large extent, in real terms the sector has the second highest number of employees
in this category at 179,144. In percentage terms the sector ranks sixth in terms of
percentages who report having a large extent of variety in their work. Only three per cent of
employees in the CBSE&P sector have no variety in their work. The sectors profile is very
close to the all sector average for each category.
Table 4.24: Extent to which employees have variety in their work
Base: All establishments in Module 1 and Scotland, * suppressed due to base size <25, ** denotes a figure greater than 0% but less than 0.5% Source: UK Commission’s Employer Skills Survey 2011 (Davies et al, 2012)
Unweighted
base
Weighted
base
Agriculture, forestry and fishing 5,652 5 30,105 27 72,671 64 4,348 4 820 112,776
Energy production and utilities 2,191 17 4,077 31 6,385 49 486 4 866 13,138
Manufacturing 15,955 12 41,908 31 72,179 54 3,456 3 4,001 133,498
Construction, Building Services Engineering &
Planning 21,136 7 89,742 29 185,426 61 8,056 3 4,570 304,360
Wholesale and retail trade 79,322 17 144,464 31 229,455 49 18,075 4 8,093 471,317
Transportation and storage 12,217 10 30,841 26 73,328 61 4,419 4 2,400 120,805
Accommodation, food and tourism activities 32,190 15 69,719 32 109,728 50 7,234 3 5,819 218,871
Information and communication 5,976 8 23,608 32 42,403 58 1,136 2 1,261 73,123
Creative media and entertainment 11,873 8 48,322 33 83,861 57 3,495 2 1,959 147,551
Financial, insurance & other professional
services 31,220 18 56,823 33 80,911 47 3,669 2 2,680 172,623
Real estate and facilities management 20,259 13 48,382 30 83,504 52 9,000 6 1,745 161,145
Government 11,426 21 16,967 31 25,307 46 1,600 3 1,379 55,300
Education 18,653 32 20,236 34 18,789 32 1,231 2 2,780 58,909
Health 10,508 20 15,684 30 24,879 47 1,427 3 1,739 52,498
Care 25,788 28 26,675 29 32,817 36 6,485 7 2,455 91,765
All economy 320,952 14 702,866 31 1,198,876 52 77,227 3 44,691 2,299,921
Yes, formally
documented No Don't knowYes, informally
Formal process for identifying 'high potential' individuals
Unweighted
base
Weighted
base
Agriculture, forestry and fishing 76,675 68 24,469 22 7,742 7 2,816 2 1,074 1 820 112,776
Energy production and utilities 5,929 45 4,909 37 1,795 14 406 3 100 1 866 13,138
Manufacturing 67,095 50 48,484 36 12,899 10 3,756 3 1,262 1 4,001 133,498
Construction, Building Services Engineering &
Planning 179,144 59 88,851 29 24,047 8 9,313 3 3,003 1 4,570 304,360
Wholesale and retail trade 238,562 51 168,884 36 48,318 10 11,692 2 3,861 1 8,093 471,317
Transportation and storage 53,146 44 35,613 29 17,947 15 13,259 11 840 1 2,400 120,805
Accommodation, food and tourism activities 86,140 39 83,543 38 37,117 17 9,289 4 2,782 1 5,819 218,871
Information and communication 46,346 63 21,687 30 3,293 5 417 1 1,381 2 1,261 73,123
Creative media and entertainment 99,587 67 37,290 25 7,267 5 2,237 2 1,170 1 1,959 147,551
Financial, insurance & other professional
services 94,803 55 60,363 35 12,493 7 3,148 2 1,816 1 2,680 172,623
Real estate and facilities management 92,156 57 51,012 32 15,579 10 1,561 1 837 1 1,745 161,145
Government 33,925 61 17,273 31 2,855 5 391 1 856 2 1,379 55,300
Education 38,306 65 17,346 29 2,187 4 619 1 452 1 2,780 58,909
Health 26,622 51 19,718 38 5,203 10 694 1 260 ** 1,739 52,498
Care 54,001 59 31,224 34 4,410 5 972 1 1,159 1 2,455 91,765
All economy 1,256,316 55 745,134 32 212,192 9 64,300 3 21,979 1 44,691 2,299,921
Don't know
Extent to which employees have variety in their work
To a large extent To some extent Not much Not at all

Construction, Building Services Engineering and Planning: Sector Skills Assessment 2012
83
Autonomy levels
Table 4.25 examines the extent to which employees are able to use their discretion on how
they do their work. The CBSE&P sector follows the general pattern of the all economy
averages with roughly the same percentages in each category. In the CBSE&P sector 89
per cent of employees have autonomy to some or a large extent, only 3 per cent of the
employees are not able to influence how they do their work. Again the CBSE&P sector has
the second highest number of employees who have a large extent of control over how they
do their work, indeed the number is between two and three times that of most of the other
sectors.
Table 4.25: Extent to which employees have discretion over how they do their work
Base: All establishments in Module 1 and Scotland * suppressed due to base size <25 ** denotes a figure greater than 0% but less than 0.5% Source: UK Commission’s Employer Skills Survey 2011 (Davies et al, 2012)
Flexible working
When measuring the extent to which employees have access to flexible working 46 per cent
of CBSE&P employees responded ‘to a large extent’, a pattern almost identical to that of the
all economy average. Only nine per cent of respondents had no access to flexible working.
Unweighted
base
Weighted
base
Agriculture, forestry and fishing 61,757 55 39,087 35 6,625 6 2,485 2 2,821 3 820 112,776
Energy production and utilities 5,809 44 4,957 38 1,467 11 557 4 348 3 866 13,138
Manufacturing 63,859 48 49,442 37 11,926 9 5,326 4 2,945 2 4,001 133,498
Construction, Building Services Engineering &
Planning 167,066 55 103,337 34 18,624 6 10,627 3 4,706 2 4,570 304,360
Wholesale and retail trade 222,298 47 182,574 39 44,174 9 13,608 3 8,663 2 8,093 471,317
Transportation and storage 60,073 50 38,390 32 12,736 11 8,160 7 1,446 1 2,400 120,805
Accommodation, food and tourism activities 88,190 40 87,712 40 28,331 13 9,926 5 4,712 2 5,819 218,871
Information and communication 48,851 67 20,130 28 3,082 4 614 1 446 1 1,261 73,123
Creative media and entertainment 94,306 64 39,623 27 5,912 4 3,212 2 4,498 3 1,959 147,551
Financial, insurance & other professional
services 88,150 51 62,426 36 15,688 9 5,292 3 1,068 1 2,680 172,623
Real estate and facilities management 95,298 59 48,171 30 11,255 7 4,656 3 1,765 1 1,745 161,145
Government 32,235 58 17,718 32 3,674 7 810 1 863 2 1,379 55,300
Education 27,530 47 26,592 45 3,231 5 660 1 897 2 2,780 58,909
Health 22,195 42 21,678 41 6,472 12 1,544 3 608 1 1,739 52,498
Care 48,843 53 36,123 39 3,779 4 1,532 2 1,488 2 2,455 91,765
All economy 1,188,767 52 814,655 35 185,638 8 71,823 3 39,037 2 44,691 2,299,921
Extent to which employees have discretion over how they do their work
To a large extent To some extent Not much Not at all Don't know

Construction, Building Services Engineering and Planning: Sector Skills Assessment 2012
84
Table 4.26: Extent to which employees at establishment have access to flexible working
Base: All establishments in Module 1 and Scotland, * suppressed due to base size <25, ** denotes a figure greater than 0% but less than 0.5% Source: UK Commission’s Employer Skills Survey 2011 (Davies et al, 2012)
4.4 Productivity/skills utilisation
The UK’s productivity performance has historically lagged behind that of other major
industrial countries, however in recent years the gap has narrowed and the UK now ranks
11th out of the 30 Organisation for Economic Cooperation and Development (OECD)
countries in terms of productivity29.
ConstructionSkills has recently completed research into productivity in the construction
industry30 which comprised of 150 telephone interviews with construction managers and
supervisors across a range of companies working within the construction sector. This
section comprises a brief summary of the findings of this research.
The agency carrying out this research found that there was a widespread lack of interest in
taking part in research looking at productivity which resulted in a significantly low level of
responses, meaning that the results can only be taken as indicative.
Of the firms interviewed 70 per cent carry out productivity research across their
organisations, and this is most common in the repair and maintenance sector, which is not
surprising as it is generally twice as labour-intensive as new work. The most common
measure of productivity was output with almost a third (32 per cent) stating they measure
productivity in terms of output, with a variety of approaches including man hours (eight per
cent) and checking against estimates (seven per cent).
A fifth of the respondents (equivalent to 30 respondents) focus on training and development
as a method of improving productivity, however the majority did not believe that current
29 High Performance Working: A Policy Review, Evidence Report 18, May 2010, UK Commission 30 Productivity in Construction, ConstructionSkills, 2011
Unweighted
base
Weighted
base
Agriculture, forestry and fishing 48,869 43 41,468 37 12,485 11 8,004 7 1,950 2 820 112,776
Energy production and utilities 4,781 36 4,419 34 2,431 19 1,450 11 58 ** 866 13,138
Manufacturing 52,687 39 44,362 33 17,955 13 16,667 12 1,827 1 4,001 133,498
Construction, Building Services Engineering &
Planning 139,674 46 101,224 33 33,585 11 26,266 9 3,610 1 4,570 304,360
Wholesale and retail trade 176,251 37 168,909 36 64,843 14 56,324 12 4,991 1 8,093 471,317
Transportation and storage 44,233 37 38,327 32 16,329 14 20,683 17 1,233 1 2,400 120,805
Accommodation, food and tourism activities 99,272 45 77,239 35 22,537 10 17,703 8 2,120 1 5,819 218,871
Information and communication 42,992 59 20,273 28 5,342 7 4,226 6 289 ** 1,261 73,123
Creative media and entertainment 83,200 56 44,734 30 10,011 7 7,602 5 2,004 1 1,959 147,551
Financial, insurance & other professional
services 89,019 52 55,484 32 15,828 9 11,747 7 546 ** 2,680 172,623
Real estate and facilities management 77,691 48 52,389 33 16,393 10 13,861 9 811 1 1,745 161,145
Government 34,229 62 15,040 27 3,343 6 1,865 3 823 1 1,379 55,300
Education 14,445 25 21,754 37 12,772 22 9,545 16 393 1 2,780 58,909
Health 14,407 27 23,130 44 9,761 19 5,025 10 174 ** 1,739 52,498
Care 38,920 42 35,210 38 9,701 11 6,858 7 1,075 1 2,455 91,765
All economy 1,012,366 44 783,411 34 264,071 11 216,701 9 23,372 1 44,691 2,299,921
Employees have access to flexible working
To a large extent To some extent Not much Not at all Don't know
Construction, Building Services Engineering and Planning: Sector Skills Assessment 2012
85
training (NVQs and Apprenticeships) equips construction employees with the appropriate
skills to work effectively on site, they believe that manufacturers and in-house training is
more effective. The deficiency of qualifications to provide productivity training will have
implications in terms of skills utilisation of employees.
The occupations considered to have lower productivity were;
Painting and decorating, 19 per cent
Plumbers, 13 per cent
Plasterers, 10 per cent
Tilers, six per cent
Groundworkers, six per cent
Professionals (including architects and designers), six per cent.
Additionally 13 per cent of respondents noted that it was often the working conditions (such
as confined spaces, bad weather), which determines productivity rather than the occupation.
Respondents considered the role of industry bodies and government in improving
productivity to be largely training related, e.g. providing funding, assisting firms willing to
train.
Scotland differs to the rest of the UK as they have been emphasising the importance of skills
utilisation since 2007 and it features within their Skills Strategy and they have an established
Skills Utilisation Leadership Group which comprises of employers, government and other
industry stakeholders.31
4.4.1 Impact of training on performance
The data from the UK Commission’s Employer Skills Survey32 shows that approximately half
of the employers in the CBSE&P sector (87,580 firms) assess the performance of
employees who have received training, compared to 65 per cent of employers in the
economy as a whole. The CBSE&P sector ranks third in terms of overall numbers of firms
assessing training but 12th in percentage terms. The impact of training is assessed by much
higher proportions of firms in the education, health and care sectors. This may suggest that
these sectors are more aware of the value and impacts of training. The CBSE&P sector
31 High Performance Working: A Policy Review, Evidence Report 18, May 2010, UK Commission 32 UK Commission’s Employer Skills Survey 2011 (Davies et al, 2012)

Construction, Building Services Engineering and Planning: Sector Skills Assessment 2012
86
needs to be made aware of the benefits of assessing the impact of training, for example:
ensuring that training meets the firm’s requirements and assessing the return on investment.
ConstructionSkills own research 33 found that the construction contracting sector has a
greater proportion of firms assessing the impact of training (41 per cent) than the
professionals sector (29 per cent). Larger companies are also much more likely to formally
assess the impact of training on staff performance. This may be a reflection of the tendency
for larger organisations to be more bureaucratic and have processes for keeping track of
spending and analysing investments and whether they are still beneficial to the organisation.
4.4.2 Skills and sectoral performance
Research undertaken by UK Commission into the value of skills34 found that:
The level of product market strategy and average skill level within establishments are
positively correlated: the higher the product market strategy, the higher the average
level of skill required within the workforce
The higher the product market strategy and skill level, the less likely it is that the
establishment will suffer from skill gaps
There is some evidence that development of higher product market strategies may be
constrained by skill gaps, particularly if these skill gaps involve managers
The higher the product market strategy and the skill level of the workforce, the higher
will be perceived future up-skilling needs.
A recent report commissioned by the Department for Business Innovation and Skills35 was
based on a global study designed to ‘examine whether a wider take up of engagement
approaches could impact positively on UK competitiveness and performance and meet the
challenges of increased global competition’. The report defines employee engagement
strategies as
A strategy that will enable people to be the best they can at work, recognising that this can only happen if they feel respected, involved, heard, well led and valued by those they work for and with.
33 Training and Skills in the Construction Sector, ConstructionSkills, 2011 34 The Value of Skills: An Evidence Review Evidence Report 22, UK Commission, 2010 35 Engaging for Success: Enhancing performance through employee engagement, David Macleod & Nita Clarke, 2009

Construction, Building Services Engineering and Planning: Sector Skills Assessment 2012
87
This report cites amongst others research carried out in 2006 by Tower Perrins-ISR36 which
found that firms with a highly engaged workforce improved their operating income by 19.2
per cent over a 12 month period, whereas those with low engagement scores saw their
operating income decline by 32.7 per cent.
Over the 12 month period the firms with high engagement scores demonstrated a 13.7 per
cent improvement in net income growth whilst those with low engagement saw net income
growth decline by 3.8 per cent. Further to this research by Gallup37 found that firms in the
top quartile of engagement scores had 27 per cent higher profitability than those in the
bottom half.
The report also contains many supporting case studies, two of which are construction
companies, Amey and JCB, each of whom took different approaches.
Amey’s chief executive said:
Employee engagement is a critical issue for Amey if we are to continually improve our service to the customer and ultimately the public. Line managers are essential to improving engagement, so supporting them to truly engage with their teams is a priority for Amey.
Amey’s engagement strategy utilised an engagement survey and an action process that had
taken root throughout the business. The firm also obtained Investors in People accreditation
which also gave them a competitive edge in winning work and attracting new employees.
The rewards experienced include; a decreasing staff attrition rate, reduction of lost
productivity hours and lower recruitment and training costs.
JCB utilised employee engagement practices (regular face to face briefings, union
consultation) to work with staff to develop a strategy to survive the recession and avoid
redundancies and also enlist the employees’ participation in a company-wide cost reduction
exercise necessary to survive the difficult market conditions. This is proof of the assertion
that employee engagement approaches can help organisations deal with the challenges of
recession made in the report by David Macleod and Nita Clarke, because by establishing
trust employers can unlock more of the knowledge and commitment of individual employees,
for example in improving efficiency and effectiveness, as demonstrated by the JCB case
study.
By engaging their employees JCB were able to make difficult decisions whilst still
maintaining the support of their workforce.
36 The ISR Employee Engagement Report, Towers Perrin-ISR, 2006 37 Engagement Predicts Earnings Per Share, Gallup Organisation, 2006

Construction, Building Services Engineering and Planning: Sector Skills Assessment 2012
88
The research also found that many organisations have been working closely and
collaboratively with staff to mitigate the effects of scarce credit and collapsing markets on the
workforce as well as trying to maintain training and development of staff despite the cost
pressures.
The research concludes that investment in the skills and training of the workforce can bring
significant financial rewards and is suited to pursuing a strategy of quality and customer
service over a strategy of competing on price.
Further to this UK Commission research38 confirms that there are relationships between an
organisations product strategy (quality vs. price), and employee skill gaps and skill updating
needs. Organisations with a high end product strategy tend to have higher skill level
requirements and also tend to be more aware of skill updating needs. The report also found
that a firm’s ability to move from a low end product strategy to a higher one may possibly be
constrained by the shortage of skills required to achieve this as although business strategies
and firm levels of resources/capabilities tend to co-evolve over time their ability to move to a
higher end product strategy is influenced by the resources and capabilities available to them.
In summary research into high performance working and employee engagement practices
suggests that there is a link between the level of product market strategy and the level of
skill required by the workforce, and having a highly engaged workforce is likely to increase
profitability and can also be beneficial to ensuring the firms survival through difficult
circumstances, such as the current economic climate. Based on the indicative results of
ConstructionSkills productivity survey it seems that some of the employers in the sector do
not believe that current training equips employees to work effectively on site and that for
productivity to improve government and industry bodies should focus on training and
assisting the industry to train. The research also indicates that firms in the CBSE&P sector
do not assess the impact of training on individual performance; therefore they cannot
quantify the effect it has had.
38 Product Strategies, Skill Shortages and Skill Updating Needs in England: New evidence from the National employer Skills Survey, 2009, evidence report 30, UK Commission, 2011.

Construction, Building Services Engineering and Planning: Sector Skills Assessment 2012
89
5 Extent of skills mis-match
Chapter Summary
In 2011 vacancies were reported by seven per cent of employers across the UK
Construction, Building Services Engineering and Planning (CBSE&P) sector
according to the UK Commission’s Employer Skills Survey 2011 (Davies et al, 2012).
This equates to two per cent of total employment within the sector which is
comparable to the UK economy.
Compared to all sectors, the CBSE&P sector has an above average share of both
Hard to Fill (HTF) Vacancies and Skill Shortage Vacancies (SSV), as a percentage of
all vacancies.
Employers within the CBSE&P sectors in England, Scotland and Wales have above
average SSVs as a share of vacancies whereas employers in Northern Ireland are
below average.
The greatest volume of vacancies within the UK CBSE&P sector were for both skilled
trades and professional occupations.
Once a vacancy is filled the sector does not have a problem retaining staff, CBSE&P
employers were below the all sector average when reporting retention difficulties.
Job specific and technical/practical skills are the most frequently reported types of skill
lacking within the CBSE&P.
In numeric terms skilled trades are the most likely to have skills gaps, however as a
share of employment, workers employed in unskilled or semi-skilled occupations are
the most likely to be described as lacking full proficiency.
Three-quarters of UK CBSE&P employers reporting skill gaps have responded by
either increasing the amount of training or increasing the amount spent on training.
Four in ten employers across the UK CBSE&P sector reported under-employment
within their workforces, which is less than the national average.
Average wages are higher than the comparable all economy figure, however growth
in hourly wages has remained below the all economy level.
Five per cent of CBSE&P employment comes from the Rest of Europe (EU27), which
is on a par with the level across all sectors.

Construction, Building Services Engineering and Planning: Sector Skills Assessment 2012
90
Although skills deficiencies do not appear to be hampering growth in the sector at the
moment, this position could change if there was a stronger than expected economic
recovery.
5.1 Extent and nature of vacancies
In 2011 vacancies were reported by seven per cent of employers across the UK
Construction, Building Services Engineering and Planning (CBSE&P) sector according to the
UK Commission’s Employer Skills Survey 2011 (Davies et al, 2012). In volume terms, the
number of vacancies was around 47,000, which equated to two per cent of total employment
within the sector, comparable to the proportion for the whole UK economy (also two per
cent) as shown in Table 5.1.
CBSE&P employers reported just over 19,000 hard-to-fill vacancies (HtFVs), which
represent 40 per cent of all vacancies. Two-thirds (65 per cent) of HtFVs are considered to
be skill shortage vacancies (SSVs) and account for a quarter (26 per cent) of all vacancies.
Compared to the total for all sectors, CBSE&P has an above average share of both HtFVs
and SSVs as a percentage of all vacancies. Along with the Agriculture, Forestry and Fishing
sector, CBSE&P are ranked in the top two on both these measures.
Table 5.1: Profile of vacancies by sector
Source: UK Commission’s Employer Skills Survey 2011 (Davies et al, 2012)
Vacancies HTF vacancies
SSV
(prompted
and
unprompted)
Vacancies as
a %
employment
HTF
vacancies
as a %
vacancies
SSV as a %
vacancies
Weighted
base
Unweighted
base
Agriculture, Forestry & Fishing 14,641 5,785 4,238 3 40 29 466,870 19,506
Energy Production & Utilities 9,343 1,590 1,236 3 17 13 333,050 47,228
Manufacturing 40,252 11,834 9,711 2 29 24 2,541,188 291,593
Construction, Building Services
Engineering and Planning 47,241 19,103 12,394 2 40 26 2,235,270 150,111
Wholesale & Retail Trade 95,390 17,441 12,619 2 18 13 4,674,684 514,820
Transportation and Storage 25,734 4,739 3,182 2 18 12 1,320,126 114,658
Hospitality, Tourism and Sport 73,886 18,245 11,179 3 25 15 2,313,487 258,524
Information and Communication
Technologies 29,361 5,449 4,937 5 19 17 614,641 53,681
Creative Media & Entertainment 37,885 6,824 5,502 3 18 15 1,086,978 87,953
Financial, Insurance & other Professional
Services 58,847 11,732 10,623 3 20 18 2,052,039 112,945
Real Estate & Facilities Management 31,155 5,773 4,252 3 19 14 1,183,601 91,204
Government Services 35,917 9,330 5,938 2 26 17 1,780,058 223,796
Education 34,684 4,984 3,729 1 14 11 2,538,545 387,221
Health 27,811 5,281 3,330 1 19 12 2,004,436 219,765
Care 37,494 5,924 3,335 2 16 9 1,504,729 157,681
Not Within Scope 36,266 9,533 7,248 4 26 20 897,422 86,007
Total 635,907 143,564 103,453 2 23 16 27,547,123 2,816,693
Volume %

Construction, Building Services Engineering and Planning: Sector Skills Assessment 2012
91
Geographical analysis of the profile of vacancies by sector shows a consistency across
nations within the CBSE&P sector when comparing vacancies as a share of employment, as
highlighted in Table 5.2. These findings are also comparable to the national averages (two
per cent). However a divergence between nations emerges when both HtFVs and SSVs as
a share of vacancies are measured. A similarity exists between CBSE&P employers in
England and Wales when their HtFV are analysed as a share of vacancies (42 per cent and
41 per cent respectively) much higher than the findings in Scotland and Northern Ireland (29
per cent and 27 per cent respectively). However, all nations, with the exception of Northern
Ireland are above the national averages; most prominently in England where employers in
the CBSE&P sector have the highest incidence of HtFVs as a share of vacancies than all
other sectors. Similarly employers within the CBSE&P sectors in England, Scotland and
Wales also have above average SSVs as a share of vacancies whereas employers in
Northern Ireland are below average.

Construction, Building Services Engineering and Planning: Sector Skills Assessment 2012
92
Table 5.2: Profile of vacancies by sector and nation
Vacancies as a % employment HTF vacancies as a % vacancies SSV as a % vacancies
England Scotland Wales NI England Scotland Wales NI England Scotland Wales NI Agriculture, forestry & fishing 3 †4 2 0 36 †45 87 0 28 †22 85 0 Energy production & utilities 2 7 4 1 11 22 32 49 9 17 22 25 Manufacturing 2 1 2 2 28 39 30 33 23 36 27 29 Construction, Building Services Engineering and Planning 2 2 2 1 42 29 41 27 26 24 34 16 Wholesale & retail trade 2 2 2 2 18 17 23 32 13 10 12 18 Transportation and Storage 2 2 3 1 17 6 48 60 12 3 29 11 Hospitality, Tourism and Sport 3 3 4 2 23 25 56 29 13 17 41 23 Information and Communication Technologies 5 †5 3 3 18 †35 19 13 16 †28 17 13 Creative media & entertainment 3 †2 5 11 20 †1 18 7 16 †0 16 4 Financial, Insurance & other Professional Services
3 2 2 11 19 7 12 44 17 6 12 44 Real estate & facilities management 3 †1 2 1 18 †29 17 0 14 †22 12 0 Government services 2 1 2 2 25 10 46 43 17 5 4 36 Education 1 2 1 1 16 6 6 16 12 2 5 11 Health 2 1 1 1 19 19 17 27 12 9 13 27 Care 3 1 3 3 16 19 20 13 9 16 13 3
Total 2 2 2 2 22 20 36 44 16 14 22 22
Weighted base 23,198,476 2,381,601 1,182,314 784,732 545,064 45,749 25,542 19,552 545,064 45,749 25,542 19,552
Unweighted base 2,345,213 201,868 178,922 90,690 43,960 3,186 2,999 1,759 43,960 3,186 2,999 1,759 Source: UK Commission’s Employer Skills Survey 2011 (Davies et al, 2012). Bases vary. Vacancies as a % of employment based on all employment. Hard-to-fill vacancies as a % of vacancies based on all vacancies. SSVs as a % of vacancies based on all vacancies. † Treat figures with caution due to small establishment base size of 50-99 in Scotland.
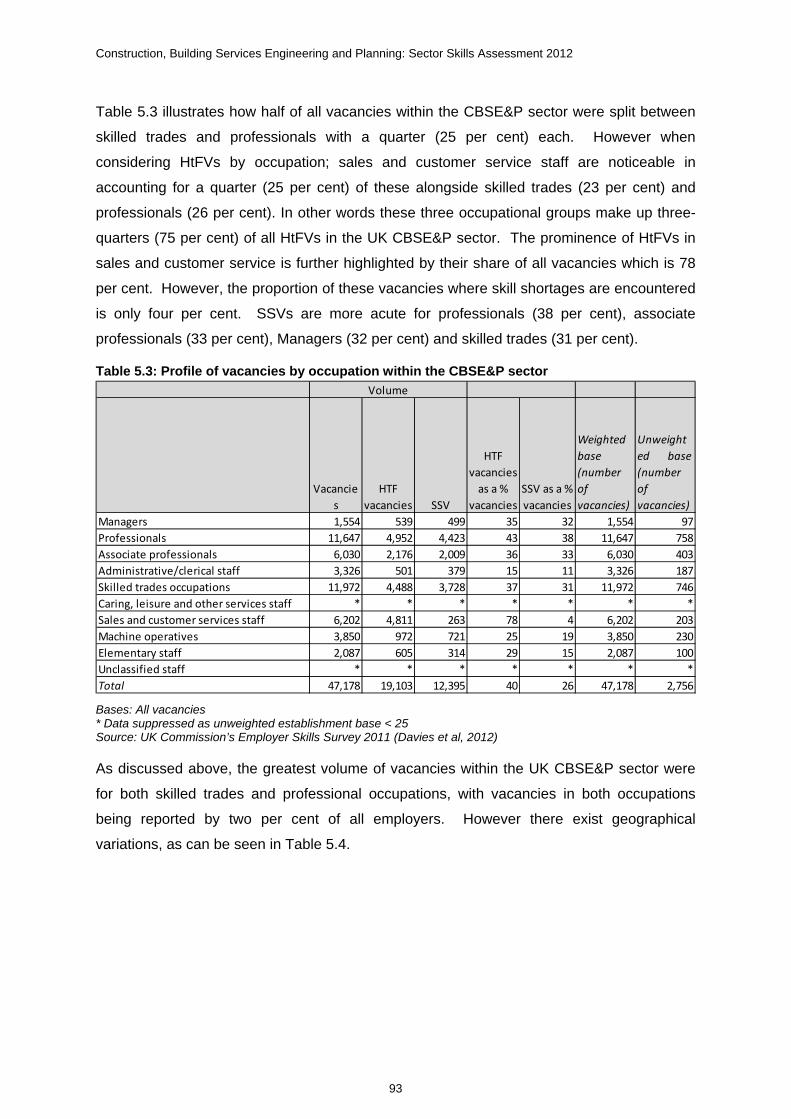
Construction, Building Services Engineering and Planning: Sector Skills Assessment 2012
93
Table 5.3 illustrates how half of all vacancies within the CBSE&P sector were split between
skilled trades and professionals with a quarter (25 per cent) each. However when
considering HtFVs by occupation; sales and customer service staff are noticeable in
accounting for a quarter (25 per cent) of these alongside skilled trades (23 per cent) and
professionals (26 per cent). In other words these three occupational groups make up three-
quarters (75 per cent) of all HtFVs in the UK CBSE&P sector. The prominence of HtFVs in
sales and customer service is further highlighted by their share of all vacancies which is 78
per cent. However, the proportion of these vacancies where skill shortages are encountered
is only four per cent. SSVs are more acute for professionals (38 per cent), associate
professionals (33 per cent), Managers (32 per cent) and skilled trades (31 per cent).
Table 5.3: Profile of vacancies by occupation within the CBSE&P sector
Bases: All vacancies * Data suppressed as unweighted establishment base < 25 Source: UK Commission’s Employer Skills Survey 2011 (Davies et al, 2012)
As discussed above, the greatest volume of vacancies within the UK CBSE&P sector were
for both skilled trades and professional occupations, with vacancies in both occupations
being reported by two per cent of all employers. However there exist geographical
variations, as can be seen in Table 5.4.
Vacancie
s
HTF
vacancies SSV
HTF
vacancies
as a %
vacancies
SSV as a %
vacancies
Weighted
base
(number
of
vacancies)
Unweight
ed base
(number
of
vacancies)
Managers 1,554 539 499 35 32 1,554 97
Professionals 11,647 4,952 4,423 43 38 11,647 758
Associate professionals 6,030 2,176 2,009 36 33 6,030 403
Administrative/clerical staff 3,326 501 379 15 11 3,326 187
Skilled trades occupations 11,972 4,488 3,728 37 31 11,972 746
Caring, leisure and other services staff * * * * * * *
Sales and customer services staff 6,202 4,811 263 78 4 6,202 203
Machine operatives 3,850 972 721 25 19 3,850 230
Elementary staff 2,087 605 314 29 15 2,087 100
Unclassified staff * * * * * * *
Total 47,178 19,103 12,395 40 26 47,178 2,756
Volume

Construction, Building Services Engineering and Planning: Sector Skills Assessment 2012
94
Table 5.4: CBSE&P employers reporting vacancies by occupation and nation
Source: UK Commission’s Employer Skills Survey 2011 (Davies et al, 2012)
Table 5.5 shows how the different types of vacancy are distributed across the sectors of the
UK economy.
Table 5.5: Distribution of vacancies, hard-to-fill vacancies and skill shortage vacancies by sector (UK)
Base: All employers Source: UK Commission’s Employer Skills Survey 2011 (Davies et al, 2012)
Table 5.5 highlights the impact of both HtFVs and SSVs across the CBSE&P sector. Whilst
only accounting for eight per cent of all vacancies, CBSE&P employers report a much higher
incidence of both HtFVs (13 per cent) and SSVs (14 per cent).
Number % Number % Number % Number % Number %
Managers 931 ** 827 ** 85 ** 6 ** 14 **
Professionals 5,624 2 5,270 2 234 1 91 1 28 **
Associate professionals 4,087 1 3,765 1 146 1 106 1 71 1
Administrative/clerical staff 3,000 1 2,640 1 197 1 53 * 110 1
Skilled trades occupations 7,562 2 6,534 3 570 3 370 3 88 1
Caring, leisure and other services staff 9 ** 9 ** 0 0 0 0 0 0
Sales and customer services staff 938 ** 824 ** 96 ** 18 ** 0 0
Machine operatives 2,071 1 1,869 1 27 ** 85 1 89 1
Elementary staff 1,529 ** 1,286 ** 18 ** 103 1 122 1
Unclassified staff 227 ** 183 ** 28 ** 0 0 16 **
Weighted base 306,403 261,155 21,346 13,161 10,742
Unweighted base 8,961 7,538 300 660 463
UK England Scotland Wales Northern Ireland
Number % Number % Number %
Weighted
base
Unweighted
base
Agriculture, Forestry & Fishing 8,285 3 4,141 5 2,660 4 110,220 1,547
Energy Production & Utilities 1,783 1 635 1 532 1 12,610 1,614
Manufacturing 17,423 6 7,684 8 6,040 9 130,709 7,776
Construction, Building Services
Engineering and Planning 22,972 8 11,596 13 9,607 14 306,403 8,961
Wholesale & Retail Trade 50,681 18 13,499 15 9,778 14 470,200 16,150
Transportation and Storage 13,036 5 4,127 5 2,662 4 122,058 4,735
Hospitality, Tourism and Sport 32,674 12 11,656 13 7,435 11 220,055 11,318
Information and Communication
Technologies 9,146 3 3,596 4 3,386 5 72,281 2,510
Creative Media & Entertainment 16,182 6 5,506 6 4,746 7 143,772 3,762
Financial, Insurance & other
Professional Services 21,794 8 5,310 6 4,556 7 170,887 5,343
Real Estate & Facilities Management 17,403 6 4,651 5 3,956 6 166,486 3,424
Government Services 8,185 3 1,877 2 1,204 2 54,687 2,605
Education 14,466 5 3,220 4 2,386 4 64,540 5,439
Health 9,577 3 2,820 3 1,842 3 52,370 3,398
Care 15,589 6 3,956 4 2,054 3 87,899 4,763
Not in scope 15,583 6 6,497 7 5,121 8 114,744 4,227
Total 274,779 100 90,771 100 67,965 100 2,299,921 87,572
Vacancies HTF vacancies SSV

Construction, Building Services Engineering and Planning: Sector Skills Assessment 2012
95
5.1.1 Retention and Recruitment
The evidence presented thus far emphasises how both HtFVs and SSVs are an issue within
the CBSE&P sector; however the data also suggests that once a vacancy is filled the sector
does not have a problem retaining staff, with only four per cent of employers reporting
retention problems. This varied considerably between the nations from five per cent in
Wales to only one per cent in Northern Ireland. Compared to all sectors CBSE&P
employers were below average in reporting retention problems. In fact in Northern Ireland
the CBSE&P sector had the least retention problems compared to all sectors.
Table 5.6: Retention problems, by sector and nation
Source: UK Commission’s Employer Skills Survey 2011 (Davies et al, 2012)
The main reason given by CBSE&P employers for a retention problem was that there are
not enough people interested in doing this type of work (46 per cent). Although this is not an
issue specific to the CBSE&P sector as it was also the main reason across all the sectors
both on a UK level and within each nation.
Number % Number % Number % Number %
Agriculture, Forestry & Fishing 4,954 5 4,236 5 360 3 358 5
Energy Production & Utilities 555 5 484 5 62 8 9 2
Manufacturing 6,493 5 5,883 5 433 8 177 5
Construction, Building Services
Engineering and Planning 10,569 4 9,710 4 722 5 138 1
Wholesale & Retail Trade 18,192 4 16,682 4 891 4 619 4
Transportation and Storage 5,676 5 5,240 5 321 8 115 5
Hospitality, Tourism and Sport 18,345 9 16,670 9 1,126 10 548 9
Information and Communication
Technologies 3,084 4 2,948 4 57 3 79 7
Creative Media & Entertainment 5,303 4 4,891 4 306 7 106 5
Financial, Insurance & other
Professional Services 6,271 4 5,876 4 339 6 55 2
Real Estate & Facilities
Management 5,826 4 5,649 4 139 5 38 2
Government Services 2,496 5 2,200 5 208 8 88 4
Education 2,925 5 2,493 5 267 8 165 5
Health 3,297 7 2,961 7 249 9 87 6
Care 5,134 6 4,615 6 327 7 191 6
Not within scope 6,810 6 6,476 6 247 6 87 3
Whole Economy 105,929 5 97,014 5 6,054 6 2,860 4
Weighted base 2,124,807 1,960,298 98,952 65,558
Unweighted base 85,069 75,053 6,012 4,004
UK (excl. Scotland) England Wales Northern Ireland

Construction, Building Services Engineering and Planning: Sector Skills Assessment 2012
96
Where retention problems were identified employers across the UK CBSE&P sector
(excluding Scotland) reported that more strain on the management of existing staff in
covering the shortage was the main consequence (70 per cent). Although in Wales
increased running costs were considered the biggest impact (70 per cent). Overall
employers had taken measures to address retention problems, with nearly a third (31 per
cent) across the UK introducing further training/development opportunities. Although this
was not the situation across each nation of the CBSE&P sector; most notably in Wales
where over half of employers (56 per cent) had not taken any measures to overcome
retention difficulties.
On average a fifth (22 per cent) of employers across the CBSE&P sector had recruited
young people (aged under 24 years) into their first job in the last three years, in-line with the
overall national findings (24 per cent). The main exception within the CBSE&P sector was
employers in Scotland who were more likely to have recruited young people (30 per cent)
than their national average (25 per cent).
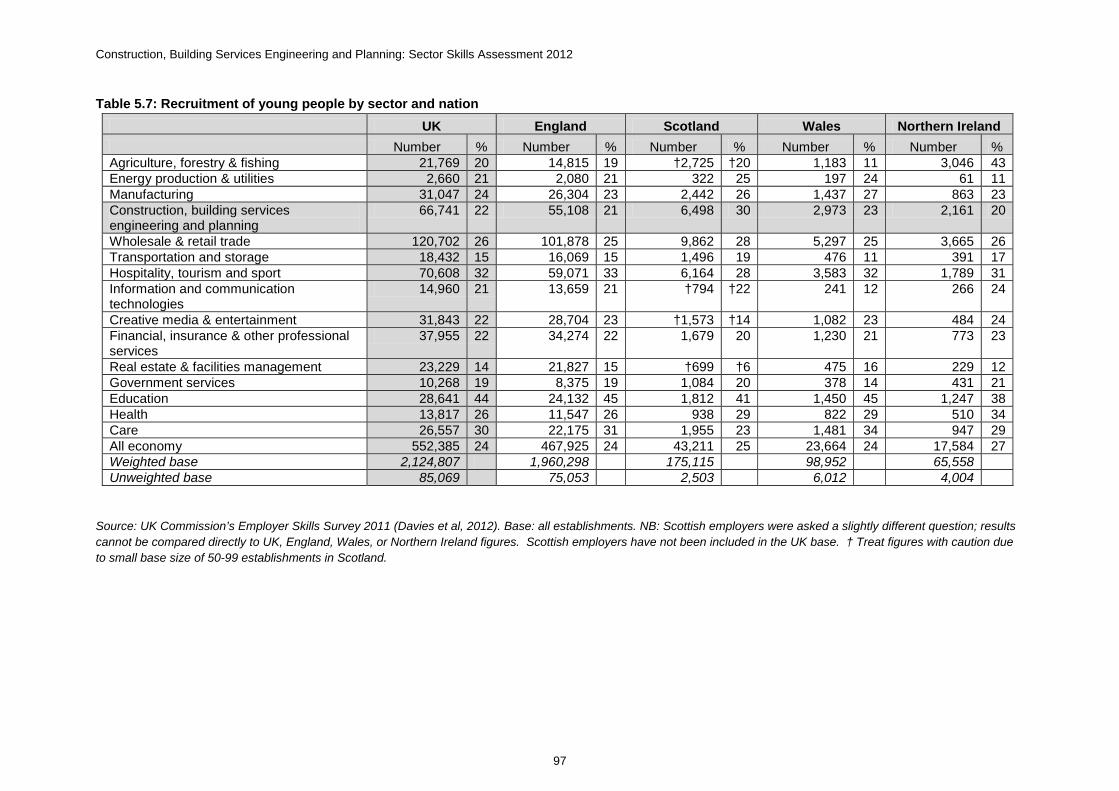
Construction, Building Services Engineering and Planning: Sector Skills Assessment 2012
97
Table 5.7: Recruitment of young people by sector and nation
UK England Scotland Wales Northern Ireland
Number % Number % Number % Number % Number % Agriculture, forestry & fishing 21,769 20 14,815 19 †2,725 †20 1,183 11 3,046 43 Energy production & utilities 2,660 21 2,080 21 322 25 197 24 61 11 Manufacturing 31,047 24 26,304 23 2,442 26 1,437 27 863 23 Construction, building services engineering and planning
66,741 22 55,108 21 6,498 30 2,973 23 2,161 20
Wholesale & retail trade 120,702 26 101,878 25 9,862 28 5,297 25 3,665 26 Transportation and storage 18,432 15 16,069 15 1,496 19 476 11 391 17 Hospitality, tourism and sport 70,608 32 59,071 33 6,164 28 3,583 32 1,789 31 Information and communication technologies
14,960 21 13,659 21 †794 †22 241 12 266 24
Creative media & entertainment 31,843 22 28,704 23 †1,573 †14 1,082 23 484 24 Financial, insurance & other professional services
37,955 22 34,274 22 1,679 20 1,230 21 773 23
Real estate & facilities management 23,229 14 21,827 15 †699 †6 475 16 229 12 Government services 10,268 19 8,375 19 1,084 20 378 14 431 21 Education 28,641 44 24,132 45 1,812 41 1,450 45 1,247 38 Health 13,817 26 11,547 26 938 29 822 29 510 34 Care 26,557 30 22,175 31 1,955 23 1,481 34 947 29 All economy 552,385 24 467,925 24 43,211 25 23,664 24 17,584 27 Weighted base 2,124,807 1,960,298 175,115 98,952 65,558 Unweighted base 85,069 75,053 2,503 6,012 4,004
Source: UK Commission’s Employer Skills Survey 2011 (Davies et al, 2012). Base: all establishments. NB: Scottish employers were asked a slightly different question; results cannot be compared directly to UK, England, Wales, or Northern Ireland figures. Scottish employers have not been included in the UK base. † Treat figures with caution due to small base size of 50-99 establishments in Scotland.

Construction, Building Services Engineering and Planning: Sector Skills Assessment 2012
98
5.2 Extent and nature of skills issues
Just over half (51 per cent) of all HtFVs across the UK CBSE&P sector are described by
employers as caused, at least in part by a lack of skills amongst applicants. This finding was
replicated in England and Wales, but Scottish employers considered a lack of work
experience as the biggest concern (33 per cent). Overall however 83 per cent of CBSE&P
employers reported that HtFVs are the result of a skills-related reason (a lack of skills,
experience or qualifications). This balance between skills, experience and qualification
equates to a skill-shortage vacancy (SSV).
Figure 5.1 below shows a breakdown of the top six causes of HtFVs across the UK CBSE&P
sector split by nation which highlights the different concerns raised by employers in Scotland
– in addition to the issue raised above, no employers in the Scottish CBSE&P sector
reported a low number of applicants with the required attitude, motivation or personality to
be a concern.
Figure 5.1: Causes of hard-to-fill vacancies
Source: UK Commission’s Employer Skills Survey 2011 (Davies et al, 2012)
Employers were asked which particular skills they found difficult to obtain where SSVs
existed. Table 5.8 shows results based on the total number of SSVs.

Construction, Building Services Engineering and Planning: Sector Skills Assessment 2012
99
Table 5.8: Skills lacking in Skills Shortage Vacancies
Base: All skills shortage vacancies *Suppressed due to establishment base size <25 (<50 in Scotland) Notes: Column percentages sum to more than 100 since multiple responses were allowed.
Source: UK Commission’s Employer Skills Survey 2011 (Davies et al, 2012) Job specific
and technical/practical skills are the most frequently reported types of skill lacking within the
CBSE&P sector. These findings are in-line with the national results for all sectors.
An increased workload for other staff is the most common impact of recruitment difficulties,
and was reported by just over four-fifths (82 per cent) of employers across the UK CBSE&P
sector. While half of these employers also considered the loss of business/orders to
competitors and increased operating costs as impacts. Across each nation within the
CBSE&P sector there was some variation in the hierarchy of impacts as illustrated in Table
5.9 below.
Table 5.9: Impact of hard-to-fill vacancies within the CBSE&P sector by geography
Base: All employers with hard-to fill-vacancies Source: UK Commission’s Employer Skills Survey 2011 (Davies et al, 2012) *Suppressed due to establishment base size <25 (<50 in Scotland) **Denotes a figure greater than 0% but less than 0.5%. Column percentages sum to more than 100 since multiple responses were allowed.
Clearly recruitment difficulties have a significant impact on CBSE&P employers; with only
one in twenty-five employers across the UK stating there were no negative impacts as a
Number % Number % Number % Number % Number %
Basic computer literacy / using IT 2,056 17 1,876 17 * * * * * *
Advanced IT or software skills 2,502 20 2,282 21 * * * * * *
Oral communication skills 4,769 38 4,128 38 * * * * * *
Written communication skills 4,823 39 4,154 38 * * * * * *
Customer handling skills 4,510 36 3,855 35 * * * * * *
Team working skills 3,507 28 3,002 28 * * * * * *
Written Welsh language skills 24 0 0 * * * * * *
Oral Welsh language skills 34 0 0 * * * * * *
Foreign language skills 1,894 15 1,511 14 * * * * * *
Problem solving skills 5,166 42 4,542 42 * * * * * *
Planning and Organisation skills 6,361 51 5,642 52 * * * * * *
Strategic Management skills 4,465 36 3,795 35 * * * * * *
Numeracy skills 2,640 21 2,376 22 * * * * * *
Literacy skills 3,036 24 2,726 25 * * * * * *
Office admin skills 1,777 14 1,627 15 * * * * * *
Technical or practical skills 7,586 61 6,626 61 * * * * * *
Job specific skills 9,442 76 8,277 76 * * * * * *
Experience/lack of product knowledge 21 21 * * * * * *
Personal attributes e.g. motivation, work ethos, common 84 1 84 1 * * * * * *
Other 214 2 214 2 * * * * * *
No particular skills difficulties 409 3 377 3 * * * * * *
Don't know 194 2 194 2 * * * * * *
Weighted base 12,394 10,899 * * *
Unweighted base 740 595 * * *
UK England Scotland Wales Northern Ireland
Number % Number % Number % Number % Number %
Increase workload for other staff 9,509 82 8,722 83 * * 295 71 * *
Have difficulties meeting customer services objectives 4,820 42 4,280 41 * * 200 48 * *
Lose business or orders to competitors 5,741 50 5,264 50 * * 235 56 * *
Delay developing new products or services 5,119 44 4,700 45 * * 205 49 * *
Experience increased operating costs 5,827 50 5,385 51 * * 140 34 * *
Have difficulties meeting quality standards 3,353 29 3,018 29 * * 104 25 * *
Have difficulties introducing new working practices 2,816 24 2,344 22 * * 249 60 * *
Outsource work 4,149 36 3,859 37 * * 153 37 * *
Withdraw from offering certain products or services altog 3,268 28 3,036 29 * * 137 33 * *
Have difficulties introducing technological change 2,362 20 2,036 19 * * 199 48 * *
None 484 4 380 4 * * 39 9 * *
Don't know 35 ** 10 ** * * 0 0 * *
Weighted base 11,596 10,530 * 417 *
Unweighted base 468 398 * 34 *
UK England Scotland Wales Northern Ireland
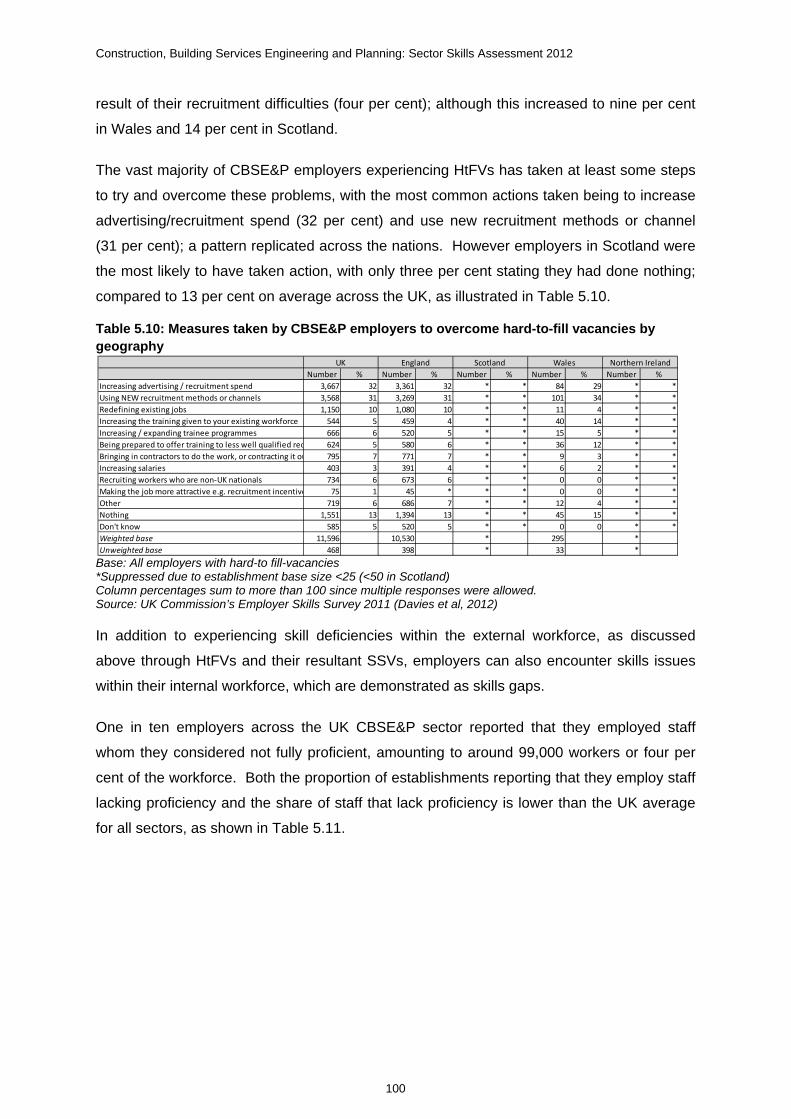
Construction, Building Services Engineering and Planning: Sector Skills Assessment 2012
100
result of their recruitment difficulties (four per cent); although this increased to nine per cent
in Wales and 14 per cent in Scotland.
The vast majority of CBSE&P employers experiencing HtFVs has taken at least some steps
to try and overcome these problems, with the most common actions taken being to increase
advertising/recruitment spend (32 per cent) and use new recruitment methods or channel
(31 per cent); a pattern replicated across the nations. However employers in Scotland were
the most likely to have taken action, with only three per cent stating they had done nothing;
compared to 13 per cent on average across the UK, as illustrated in Table 5.10.
Table 5.10: Measures taken by CBSE&P employers to overcome hard-to-fill vacancies by geography
Base: All employers with hard-to fill-vacancies *Suppressed due to establishment base size <25 (<50 in Scotland) Column percentages sum to more than 100 since multiple responses were allowed. Source: UK Commission’s Employer Skills Survey 2011 (Davies et al, 2012)
In addition to experiencing skill deficiencies within the external workforce, as discussed
above through HtFVs and their resultant SSVs, employers can also encounter skills issues
within their internal workforce, which are demonstrated as skills gaps.
One in ten employers across the UK CBSE&P sector reported that they employed staff
whom they considered not fully proficient, amounting to around 99,000 workers or four per
cent of the workforce. Both the proportion of establishments reporting that they employ staff
lacking proficiency and the share of staff that lack proficiency is lower than the UK average
for all sectors, as shown in Table 5.11.
Number % Number % Number % Number % Number %
Increasing advertising / recruitment spend 3,667 32 3,361 32 * * 84 29 * *
Using NEW recruitment methods or channels 3,568 31 3,269 31 * * 101 34 * *
Redefining existing jobs 1,150 10 1,080 10 * * 11 4 * *
Increasing the training given to your existing workforce 544 5 459 4 * * 40 14 * *
Increasing / expanding trainee programmes 666 6 520 5 * * 15 5 * *
Being prepared to offer training to less well qualified rec 624 5 580 6 * * 36 12 * *
Bringing in contractors to do the work, or contracting it ou 795 7 771 7 * * 9 3 * *
Increasing salaries 403 3 391 4 * * 6 2 * *
Recruiting workers who are non‐UK nationals 734 6 673 6 * * 0 0 * *
Making the job more attractive e.g. recruitment incentive 75 1 45 * * * 0 0 * *
Other 719 6 686 7 * * 12 4 * *
Nothing 1,551 13 1,394 13 * * 45 15 * *
Don't know 585 5 520 5 * * 0 0 * *
Weighted base 11,596 10,530 * 295 *
Unweighted base 468 398 * 33 *
UK England Scotland Wales Northern Ireland

Construction, Building Services Engineering and Planning: Sector Skills Assessment 2012
101
Table 5.11: Employers and employees with skills gaps by sector
Bases: All establishments, all employees Source: UK Commission’s Employer Skills Survey 2011 (Davies et al, 2012)
CBSE&P analysis by nation shows that employers in Scotland and Wales are the most likely
to be experiencing skill gaps (both 12 per cent) whereas employers in Northern Ireland were
the least likely (five per cent). While the proportion of CBSE&P staff that lack proficiency is
relatively consistent across the nations, employers in Northern Ireland were also the least
likely to report employees with skills gaps (two per cent).
Table 5.12: Employers and employees with skill gaps by nation (CBSE&P)
Bases: All establishments, all employees Source: UK Commission’s Employer Skills Survey 2011 (Davies et al, 2012)
The occupational profile of staff lacking proficiency in the UK CBSE&P sector is illustrated in
Table 5.13 below.
In absolute numeric terms skilled trades are the most likely to have skills gaps, however as a
share of employment, workers employed in what are traditionally described as unskilled or
semi-skilled occupations (elementary positions) are the most likely to be described as
lacking full proficiency, while those in more highly skilled occupational areas, such as
managers and professionals, are the least likely to be described as having skills gaps. This
analysis provides a very different picture to occupational skill deficiencies within the existing
Number %
Weighted
base
Unweight
ed base Number %
Weighted
base
Unweighte
d base
Agriculture, Forestry & Fishing 10,665 10 110,220 1,547 20,149 4 466,870 19,506
Energy Production & Utilities 2,000 16 12,610 1,614 17,250 5 333,050 47,228
Manufacturing 21,520 16 130,709 7,776 148,007 6 2,541,188 291,593
Construction, Building Services
Engineering and Planning 31,925 10 306,403 8,961 99,184 4 2,235,270 150,111
Wholesale & Retail Trade 72,233 15 470,200 16,150 300,344 6 4,674,684 514,820
Transportation and Storage 11,540 9 122,058 4,735 55,391 4 1,320,126 114,658
Hospitality, Tourism and Sport 43,000 20 220,055 11,318 193,549 8 2,313,487 258,524
Information and Communication
Technologies 6,647 9 72,281 2,510 34,775 6 614,641 53,681
Creative Media & Entertainment 9,155 6 143,772 3,762 41,091 4 1,086,978 87,953
Financial, Insurance & other
Professional Services 20,954 12 170,887 5,343 92,599 5 2,052,039 112,945
Real Estate & Facilities
Management 13,185 8 166,486 3,424 64,302 5 1,183,601 91,204
Government Services 7,980 15 54,687 2,605 94,735 5 1,780,058 223,796
Education 12,304 19 64,540 5,439 94,884 4 2,538,545 387,221
Health 9,776 19 52,370 3,398 101,986 5 2,004,436 219,765
Care 14,886 17 87,899 4,763 78,458 5 1,504,729 157,681
Whole economy 300,941 13 2,299,921 87,572 1,489,540 5 27,547,123 2,816,693
Employers with skills gaps Employees with skills gaps
Number % Number % Number % Number % Number %
Employers with skills gaps 31,925 10 27,202 10 2,606 12 1,633 12 484 5
Employees with skills gaps 99,184 4 85,162 5 9,525 4 3,187 4 1,311 2
Employer weighted base 306,403 261,155 21,346 13,161 10,742
Employer unweighted base 8,961 7,538 300 660 463
Employment weighted base 2,235,270 1,826,590 249,158 91,003 68,519
Employment unweighted base 150,111 119,856 14,453 10,713 5,089
UK England Scotland Wales Northern Ireland
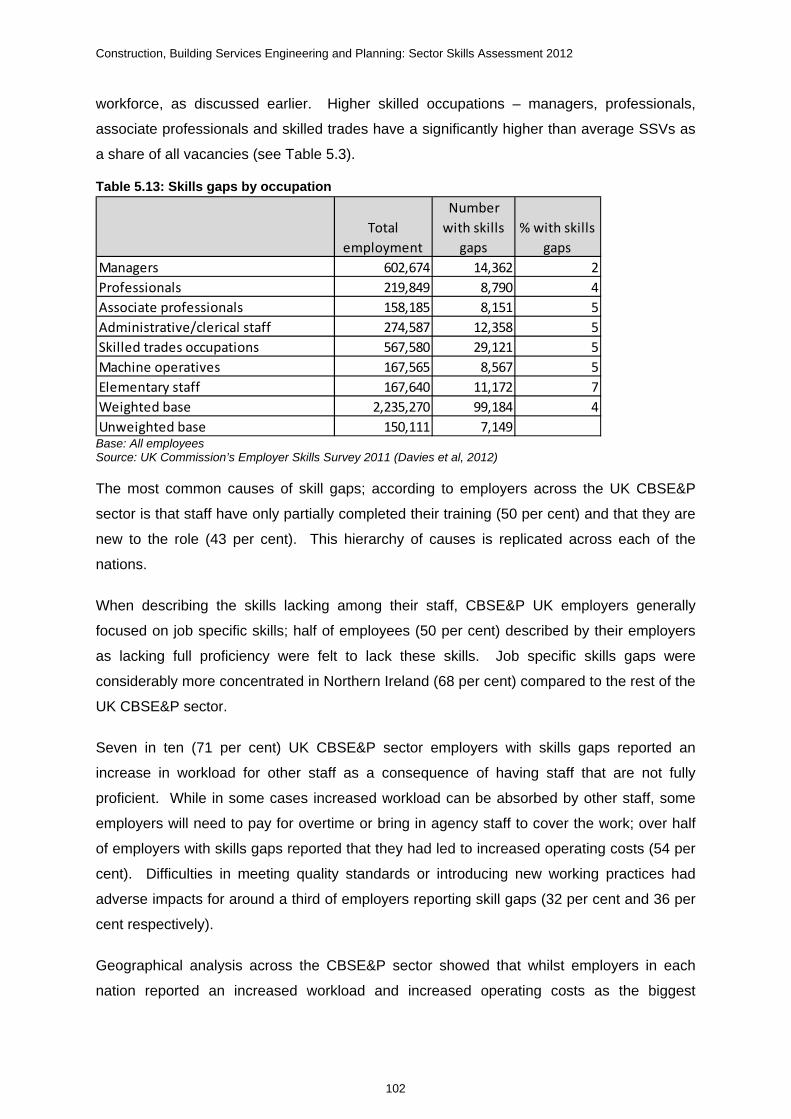
Construction, Building Services Engineering and Planning: Sector Skills Assessment 2012
102
workforce, as discussed earlier. Higher skilled occupations – managers, professionals,
associate professionals and skilled trades have a significantly higher than average SSVs as
a share of all vacancies (see Table 5.3).
Table 5.13: Skills gaps by occupation
Base: All employees Source: UK Commission’s Employer Skills Survey 2011 (Davies et al, 2012)
The most common causes of skill gaps; according to employers across the UK CBSE&P
sector is that staff have only partially completed their training (50 per cent) and that they are
new to the role (43 per cent). This hierarchy of causes is replicated across each of the
nations.
When describing the skills lacking among their staff, CBSE&P UK employers generally
focused on job specific skills; half of employees (50 per cent) described by their employers
as lacking full proficiency were felt to lack these skills. Job specific skills gaps were
considerably more concentrated in Northern Ireland (68 per cent) compared to the rest of the
UK CBSE&P sector.
Seven in ten (71 per cent) UK CBSE&P sector employers with skills gaps reported an
increase in workload for other staff as a consequence of having staff that are not fully
proficient. While in some cases increased workload can be absorbed by other staff, some
employers will need to pay for overtime or bring in agency staff to cover the work; over half
of employers with skills gaps reported that they had led to increased operating costs (54 per
cent). Difficulties in meeting quality standards or introducing new working practices had
adverse impacts for around a third of employers reporting skill gaps (32 per cent and 36 per
cent respectively).
Geographical analysis across the CBSE&P sector showed that whilst employers in each
nation reported an increased workload and increased operating costs as the biggest
Total
employment
Number
with skills
gaps
% with skills
gaps
Managers 602,674 14,362 2
Professionals 219,849 8,790 4
Associate professionals 158,185 8,151 5
Administrative/clerical staff 274,587 12,358 5
Skilled trades occupations 567,580 29,121 5
Machine operatives 167,565 8,567 5
Elementary staff 167,640 11,172 7
Weighted base 2,235,270 99,184 4
Unweighted base 150,111 7,149
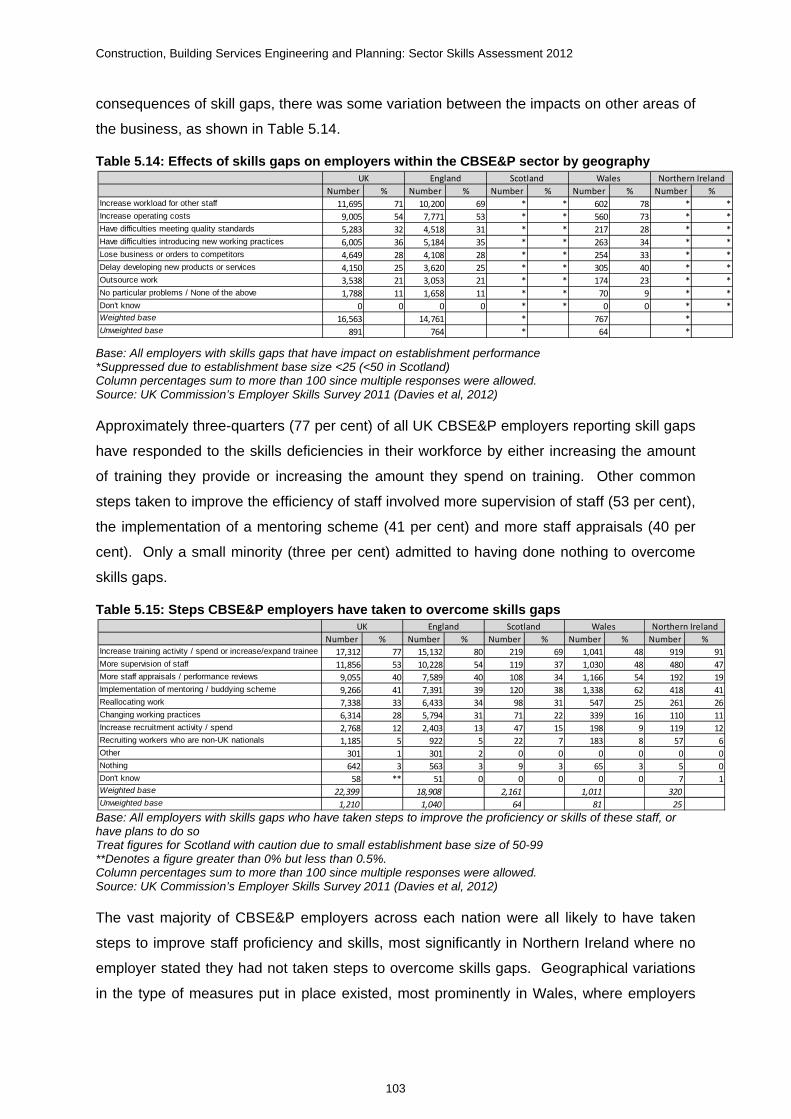
Construction, Building Services Engineering and Planning: Sector Skills Assessment 2012
103
consequences of skill gaps, there was some variation between the impacts on other areas of
the business, as shown in Table 5.14.
Table 5.14: Effects of skills gaps on employers within the CBSE&P sector by geography
Base: All employers with skills gaps that have impact on establishment performance *Suppressed due to establishment base size <25 (<50 in Scotland) Column percentages sum to more than 100 since multiple responses were allowed. Source: UK Commission’s Employer Skills Survey 2011 (Davies et al, 2012)
Approximately three-quarters (77 per cent) of all UK CBSE&P employers reporting skill gaps
have responded to the skills deficiencies in their workforce by either increasing the amount
of training they provide or increasing the amount they spend on training. Other common
steps taken to improve the efficiency of staff involved more supervision of staff (53 per cent),
the implementation of a mentoring scheme (41 per cent) and more staff appraisals (40 per
cent). Only a small minority (three per cent) admitted to having done nothing to overcome
skills gaps.
Table 5.15: Steps CBSE&P employers have taken to overcome skills gaps
Base: All employers with skills gaps who have taken steps to improve the proficiency or skills of these staff, or have plans to do so Treat figures for Scotland with caution due to small establishment base size of 50-99 **Denotes a figure greater than 0% but less than 0.5%. Column percentages sum to more than 100 since multiple responses were allowed. Source: UK Commission’s Employer Skills Survey 2011 (Davies et al, 2012)
The vast majority of CBSE&P employers across each nation were all likely to have taken
steps to improve staff proficiency and skills, most significantly in Northern Ireland where no
employer stated they had not taken steps to overcome skills gaps. Geographical variations
in the type of measures put in place existed, most prominently in Wales, where employers
Number % Number % Number % Number % Number %Increase workload for other staff 11,695 71 10,200 69 * * 602 78 * *Increase operating costs 9,005 54 7,771 53 * * 560 73 * *Have difficulties meeting quality standards 5,283 32 4,518 31 * * 217 28 * *Have difficulties introducing new working practices 6,005 36 5,184 35 * * 263 34 * *Lose business or orders to competitors 4,649 28 4,108 28 * * 254 33 * *Delay developing new products or services 4,150 25 3,620 25 * * 305 40 * *Outsource work 3,538 21 3,053 21 * * 174 23 * *No particular problems / None of the above 1,788 11 1,658 11 * * 70 9 * *Don't know 0 0 0 0 * * 0 0 * *Weighted base 16,563 14,761 * 767 *Unweighted base 891 764 * 64 *
UK England Scotland Wales Northern Ireland
Number % Number % Number % Number % Number %Increase training activity / spend or increase/expand trainee p 17,312 77 15,132 80 219 69 1,041 48 919 91More supervision of staff 11,856 53 10,228 54 119 37 1,030 48 480 47More staff appraisals / performance reviews 9,055 40 7,589 40 108 34 1,166 54 192 19Implementation of mentoring / buddying scheme 9,266 41 7,391 39 120 38 1,338 62 418 41Reallocating work 7,338 33 6,433 34 98 31 547 25 261 26Changing working practices 6,314 28 5,794 31 71 22 339 16 110 11Increase recruitment activity / spend 2,768 12 2,403 13 47 15 198 9 119 12Recruiting workers who are non-UK nationals 1,185 5 922 5 22 7 183 8 57 6Other 301 1 301 2 0 0 0 0 0 0Nothing 642 3 563 3 9 3 65 3 5 0Don't know 58 ** 51 0 0 0 0 0 7 1Weighted base 22,399 18,908 2,161 1,011 320Unweighted base 1,210 1,040 64 81 25
UK England Scotland Wales Northern Ireland

Construction, Building Services Engineering and Planning: Sector Skills Assessment 2012
104
were more likely to implement the mentoring scheme (62 per cent) and in Northern Ireland
whose employers tended to reallocate work (26 per cent) rather than provide more
appraisals (26 per cent).
5.3 Extent of under-employment
Approximately four in ten employers (42 per cent) across the UK CBSE&P sector reported
under-employment within their workforces, equating to 17 per cent of all employees being
considered over qualified and over-skilled. Someone may be described as being over-
qualified if the qualifications they have are higher than the qualifications someone needs to
get into their job, while over-skilled refers to individuals having little opportunity to use their
past experience, skill or abilities in their current job.
Table 5.16: Underemployment – The extent to which workforce is ‘over qualified’ and ‘over skilled’ by sector
Bases: "Employers" columns based on all establishments; "employees" columns based on all employment. Source: UK Commission’s Employer Skills Survey 2011 (Davies et al, 2012)
Compared to the extent of under-employment across the whole UK workforce, CBSE&P
employers were less likely to report its existence than the national average (42 per cent v 49
per cent), however when asked to state how many of their employees were under-employed
the results were more comparable (17 per cent v 16 per cent). By nation the findings are
also similar with the exception of Scotland, where CBSE&P employers appear to have a
lower amount of under-employment within their workforce, when compared to both the whole
Scottish economy and across each nation of the CBSE&P sector, as illustrated in Figure 5.2.
Number %
Weighted
base
Unweigh
ted base Number %
Weighted
base
Unweigh
ted base
Agriculture, Forestry & Fishing 42,111 38 110,220 1,547 88,613 19 466,870 19,506
Energy Production & Utilities 5,458 43 12,610 1,614 43,319 13 333,050 47,228
Manufacturing 56,009 43 130,709 7,776 252,633 10 2,541,188 291,593
Construction, Building Services
Engineering and Planning 129,922 42 306,403 8,961 369,923 17 2,235,270 150,111
Wholesale & Retail Trade 241,146 51 470,200 16,150 846,216 18 4,674,684 514,820
Transportation and Storage 61,038 50 122,058 4,735 202,809 15 1,320,126 114,658
Hospitality, Tourism and Sport 131,526 60 220,055 11,318 566,562 24 2,313,487 258,524
Information and Communication
Technologies 33,764 47 72,281 2,510 93,637 15 614,641 53,681
Creative Media & Entertainment 66,845 46 143,772 3,762 205,573 19 1,086,978 87,953
Financial, Insurance & other
Professional Services 76,826 45 170,887 5,343 312,906 15 2,052,039 112,945
Real Estate & Facilities Management 81,744 49 166,486 3,424 217,791 18 1,183,601 91,204
Government Services 29,384 54 54,687 2,605 256,006 14 1,780,058 223,796
Education 34,623 54 64,540 5,439 341,455 13 2,538,545 387,221
Health 23,566 45 52,370 3,398 225,183 11 2,004,436 219,765
Care 47,114 54 87,899 4,763 258,385 17 1,504,729 157,681
Whole economy 1,118,691 49 2,299,921 87,572 4,456,192 16 27,547,123 2,816,693
Weighted base 2,299,921 27,547,123
Unweighted base 87,572 2,816,693
Employers with employees who are over
qualified and over skilled
Employees who are over qualified and over
skilled
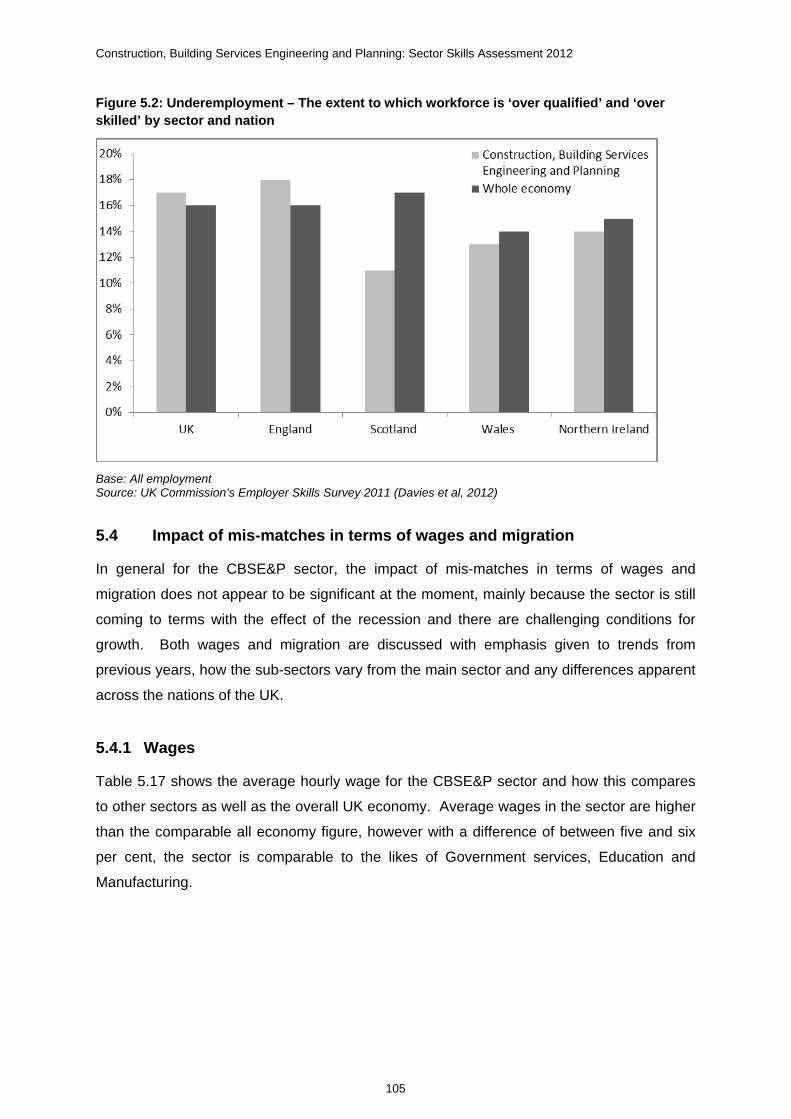
Construction, Building Services Engineering and Planning: Sector Skills Assessment 2012
105
Figure 5.2: Underemployment – The extent to which workforce is ‘over qualified’ and ‘over skilled’ by sector and nation
Base: All employment Source: UK Commission’s Employer Skills Survey 2011 (Davies et al, 2012)
5.4 Impact of mis-matches in terms of wages and migration
In general for the CBSE&P sector, the impact of mis-matches in terms of wages and
migration does not appear to be significant at the moment, mainly because the sector is still
coming to terms with the effect of the recession and there are challenging conditions for
growth. Both wages and migration are discussed with emphasis given to trends from
previous years, how the sub-sectors vary from the main sector and any differences apparent
across the nations of the UK.
5.4.1 Wages
Table 5.17 shows the average hourly wage for the CBSE&P sector and how this compares
to other sectors as well as the overall UK economy. Average wages in the sector are higher
than the comparable all economy figure, however with a difference of between five and six
per cent, the sector is comparable to the likes of Government services, Education and
Manufacturing.

Construction, Building Services Engineering and Planning: Sector Skills Assessment 2012
106
Table 5.17: Average hourly wage by sector (UK)
Source: Annual Survey of Hours and Earnings, 2010 (ONS)
Although sectors such as Education and Health have seen increases above the all economy
figure from 2008 to 2010, growth in CBSE&P hourly wages has remained just below this
level. This highlights the challenging operating conditions that the sector is facing with
increased operating costs, very competitive tendering and reducing margins limiting wage
rises.
Table 5.18 gives a breakdown of the average hourly wage by nation, although not by sector,
which shows that wages in England are highest while those in Wales and Northern Ireland
are lower. Hourly wages in Northern Ireland were the only nation to show a decrease in
2010, with a change of -0.7 per cent compared to a 1.5 per cent increase for the UK.
Table 5.18: Average hourly wage by nation (all sectors)
Source: Annual Survey of Hours and Earnings, 2010 (ONS)
When looking in more detail at the sector using the 2-digit SIC sub-sector breakdown shown
in Table 5.19, it is specialised construction activities that has the lowest average hourly
wages, whereas the architect sub-sector has the highest. This difference across sub-sectors
will be reflective of the nature of work, skill levels and general supply/demand forces than
impact wages across all sectors.
2008 2009 2010 2008 ‐ 2009 2009‐2010
£ £ £ % %
Financial, insurance & other professional services 21.06 21.45 21.99 1.8% 2.5%
Information and communication technologies 20.05 20.26 20.40 1.0% 0.7%
Creative media and entertainment 17.14 17.29 17.50 0.8% 1.2%
Energy production and utilities 15.93 16.41 16.62 3.0% 1.3%
Health 14.97 15.79 16.45 5.5% 4.2%
Education 14.67 15.39 15.71 4.9% 2.1%
Government services 14.40 14.87 15.62 3.3% 5.0%
Construction, building services, engineering and planning 14.66 15.29 15.39 4.3% 0.7%
Manufacturing 13.86 14.28 14.37 3.1% 0.6%
Transportation and storage 12.44 13.16 13.21 5.8% 0.4%
Real estate and facilities management 11.36 11.64 11.71 2.5% 0.6%
Wholesale and retail trade 11.00 11.27 11.36 2.5% 0.8%
Care 10.21 10.30 10.49 0.9% 1.9%
Agriculture, forestry and fishing 10.42 11.18 10.38 7.3% ‐7.2%
Hospitality, tourism and sport 9.14 9.35 9.52 2.3% 1.8%
All economy 13.94 14.39 14.60 3.2% 1.5%
Annual change
2008 2009 2010 2008‐2009 2009‐2010
£ £ £ % %
England 14.19 14.63 14.85 3.1% 1.5%
Scotland 13.05 13.61 13.88 4.3% 2.0%
Wales 12.13 12.48 12.68 2.9% 1.6%
Northern Ireland 12.06 12.59 12.50 4.4% ‐0.7%
United Kingdom 13.94 14.39 14.60 3.2% 1.5%
Annual change

Construction, Building Services Engineering and Planning: Sector Skills Assessment 2012
107
Table 5.19: Average hourly wage by Sector - 2 digit SIC data (UK)
Source: Annual Survey of Hours and Earnings, 2010 (ONS)
Table 5.19 shows that there is less variation in the average hourly wage within the CBSE&P
sector (at only £5 per hour across the four sub-sectors), than other sectors such as energy
production and utilities which has a much greater variation of £22 per hour across its sub-
sectors.
Average hourly wages in the sector can be illustrated by looking at selected jobs identified in
the Annual Survey of Hours and Earnings (2010) that would predominately be involved in
work across the CBSE&P sector, and where there is sufficient data. This is shown in Table
5.20.
Table 5.20: Gross hourly pay by employee jobs – selected occupations (UK)
Source: Annual Survey of Hours and Earnings, 2010 (ONS) Note: * indicates figures with a coefficient of variation (CV) of > 5% and <=10%. All other figures have a CV of >5%
With this list of jobs there is noticeable variation in the average salary, changes that have
occurred between 2009 and 2010, and differences between the upper and lower ends of the
scales.
It is not unexpected that labourers have the lowest average gross hourly pay, while
managers in construction have the highest, however of the eight jobs listed, which cover
some of the main employment numbers in the sector, only two are above the sector average
of £15.39.
2010
SIC07 Definition £
41 Construction of buildings 16
42 Civil engineering 15
43 Specialised construction activities 13
71 Architects 18
25% 75%
£ % £ £
Managers in construction 1122 22.58 2.70 14.46 26.68*
Civil engineers 2121 18.00 ‐2.20 13.41 22.04*
Electricians, electrical fitters 5241 13.94 3.10 11.35 15.96
Bricklayers, masons 5312 11.78 2.80 9.70 12.69*
Plumbers, heating and ventilating engineers 5314 13.51 1.80 10.72 15.54
Carpenters and joiners 5315 11.32 ‐0.20 9.36 12.73
Painters and decorators 5323 11.10 3.30 9.27 11.97*
Labourers in building and woodworking trades 9121 9.49 1.60 7.19 10.54
Employee percentileAnnual
change
(2009‐2010)
Description SOC(2000)
Average

Construction, Building Services Engineering and Planning: Sector Skills Assessment 2012
108
When looking at the annual change in gross hourly pay from 2009 to 2010, civil engineers
and carpenters and joiners both showed a decline in average gross hourly pay, while
managers in construction, electricians, bricklayers and painters and decorators all increased.
For some jobs this increase was more than double the all economy figure of 1.5 per cent
and noticeably more than the sector figure of 0.7 per cent.
The variation between the upper and lower ends of the hourly rates is illustrated by the
difference in rates between employees in the lower 25 per cent of the range against those in
the upper 25 per cent. For jobs such as labourers, painters and decorators, bricklayers and
carpenters, the variation is around +/- 25 to 35 per cent of the average hourly rate, while for
civil engineers and managers in construction this variation increases to around +/- 50 per
cent of average hourly pay.
These details highlight that although the sector and sub-sector wages illustrate general
trends and allow comparisons to be made with other sectors, the dynamics of wages at
employee levels can show significant variations. It should also be noted that the sector has
wage rate agreements between employers and union bodies which influence hourly rates
and at the time of writing, these rates have not yet been agreed between employers and
unions in the Building Services Engineering sub-sector.
5.4.2 Migration
Construction, Building Services Engineering and, to a slightly lesser extent, Planning work
has always involved a level of migration as there is an expectation that people will go where
the work is located. This applies to foreign nationals entering the UK labour market, UK
citizens finding work abroad and flows of people within the UK itself. This flow of labour
means that while the sector has exported the skills and expertise of the UK CBSE&P
workforce, it has also benefited from the migration of foreign nationals. The current view of
employment by country of birth across different sectors of the UK economy is shown in
Table 5.21. Around five per cent of CBSE&P employment comes from the Rest of Europe
(EU27), which is on a par with the level seen across all sectors. The percentage of the
workforce coming from the Rest of the World is also around five per cent; however this is
slightly lower than the corresponding figure across all sectors of nine per cent.
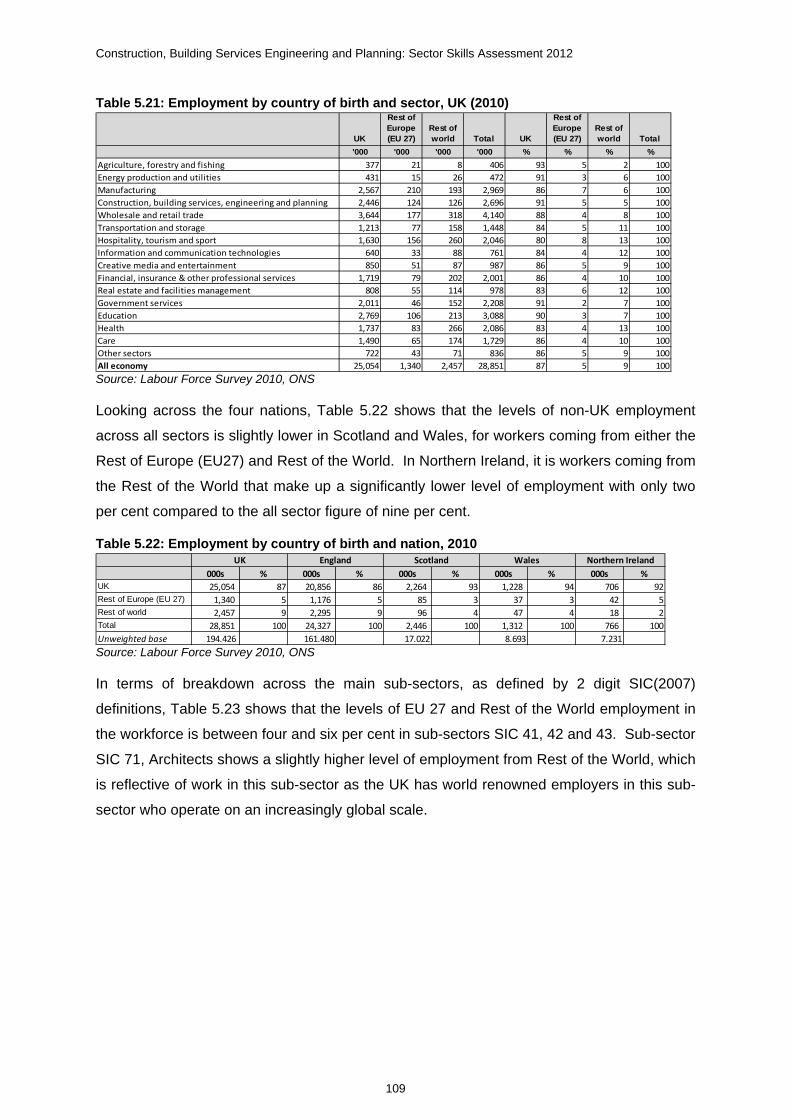
Construction, Building Services Engineering and Planning: Sector Skills Assessment 2012
109
Table 5.21: Employment by country of birth and sector, UK (2010)
Source: Labour Force Survey 2010, ONS
Looking across the four nations, Table 5.22 shows that the levels of non-UK employment
across all sectors is slightly lower in Scotland and Wales, for workers coming from either the
Rest of Europe (EU27) and Rest of the World. In Northern Ireland, it is workers coming from
the Rest of the World that make up a significantly lower level of employment with only two
per cent compared to the all sector figure of nine per cent.
Table 5.22: Employment by country of birth and nation, 2010
Source: Labour Force Survey 2010, ONS
In terms of breakdown across the main sub-sectors, as defined by 2 digit SIC(2007)
definitions, Table 5.23 shows that the levels of EU 27 and Rest of the World employment in
the workforce is between four and six per cent in sub-sectors SIC 41, 42 and 43. Sub-sector
SIC 71, Architects shows a slightly higher level of employment from Rest of the World, which
is reflective of work in this sub-sector as the UK has world renowned employers in this sub-
sector who operate on an increasingly global scale.
UK
Rest of Europe (EU 27)
Rest of world Total UK
Rest of Europe (EU 27)
Rest of world Total
'000 '000 '000 '000 % % % %
Agriculture, forestry and fishing 377 21 8 406 93 5 2 100
Energy production and utilities 431 15 26 472 91 3 6 100
Manufacturing 2,567 210 193 2,969 86 7 6 100
Construction, building services, engineering and planning 2,446 124 126 2,696 91 5 5 100
Wholesale and retail trade 3,644 177 318 4,140 88 4 8 100
Transportation and storage 1,213 77 158 1,448 84 5 11 100
Hospitality, tourism and sport 1,630 156 260 2,046 80 8 13 100
Information and communication technologies 640 33 88 761 84 4 12 100
Creative media and entertainment 850 51 87 987 86 5 9 100
Financial, insurance & other professional services 1,719 79 202 2,001 86 4 10 100
Real estate and facilities management 808 55 114 978 83 6 12 100
Government services 2,011 46 152 2,208 91 2 7 100
Education 2,769 106 213 3,088 90 3 7 100
Health 1,737 83 266 2,086 83 4 13 100
Care 1,490 65 174 1,729 86 4 10 100
Other sectors 722 43 71 836 86 5 9 100
All economy 25,054 1,340 2,457 28,851 87 5 9 100
000s % 000s % 000s % 000s % 000s %UK 25,054 87 20,856 86 2,264 93 1,228 94 706 92Rest of Europe (EU 27) 1,340 5 1,176 5 85 3 37 3 42 5Rest of world 2,457 9 2,295 9 96 4 47 4 18 2Total 28,851 100 24,327 100 2,446 100 1,312 100 766 100
Unweighted base 194.426 161.480 17.022 8.693 7.231
UK England Scotland Wales Northern Ireland
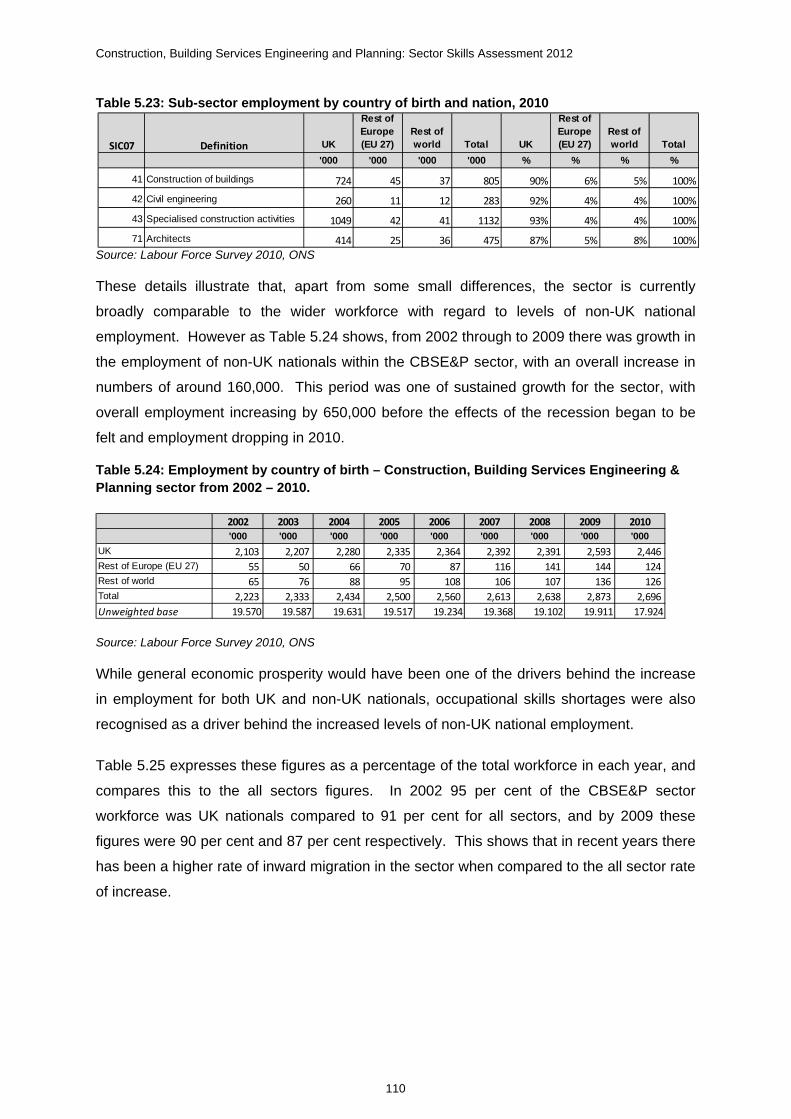
Construction, Building Services Engineering and Planning: Sector Skills Assessment 2012
110
Table 5.23: Sub-sector employment by country of birth and nation, 2010
Source: Labour Force Survey 2010, ONS
These details illustrate that, apart from some small differences, the sector is currently
broadly comparable to the wider workforce with regard to levels of non-UK national
employment. However as Table 5.24 shows, from 2002 through to 2009 there was growth in
the employment of non-UK nationals within the CBSE&P sector, with an overall increase in
numbers of around 160,000. This period was one of sustained growth for the sector, with
overall employment increasing by 650,000 before the effects of the recession began to be
felt and employment dropping in 2010.
Table 5.24: Employment by country of birth – Construction, Building Services Engineering & Planning sector from 2002 – 2010.
Source: Labour Force Survey 2010, ONS
While general economic prosperity would have been one of the drivers behind the increase
in employment for both UK and non-UK nationals, occupational skills shortages were also
recognised as a driver behind the increased levels of non-UK national employment.
Table 5.25 expresses these figures as a percentage of the total workforce in each year, and
compares this to the all sectors figures. In 2002 95 per cent of the CBSE&P sector
workforce was UK nationals compared to 91 per cent for all sectors, and by 2009 these
figures were 90 per cent and 87 per cent respectively. This shows that in recent years there
has been a higher rate of inward migration in the sector when compared to the all sector rate
of increase.
SIC07 Definition UK
Rest of Europe (EU 27)
Rest of world Total UK
Rest of Europe (EU 27)
Rest of world Total
'000 '000 '000 '000 % % % %
41 Construction of buildings 724 45 37 805 90% 6% 5% 100%
42 Civil engineering 260 11 12 283 92% 4% 4% 100%
43 Specialised construction activities 1049 42 41 1132 93% 4% 4% 100%
71 Architects 414 25 36 475 87% 5% 8% 100%
2002 2003 2004 2005 2006 2007 2008 2009 2010'000 '000 '000 '000 '000 '000 '000 '000 '000
UK 2,103 2,207 2,280 2,335 2,364 2,392 2,391 2,593 2,446Rest of Europe (EU 27) 55 50 66 70 87 116 141 144 124Rest of world 65 76 88 95 108 106 107 136 126Total 2,223 2,333 2,434 2,500 2,560 2,613 2,638 2,873 2,696
Unweighted base 19.570 19.587 19.631 19.517 19.234 19.368 19.102 19.911 17.924
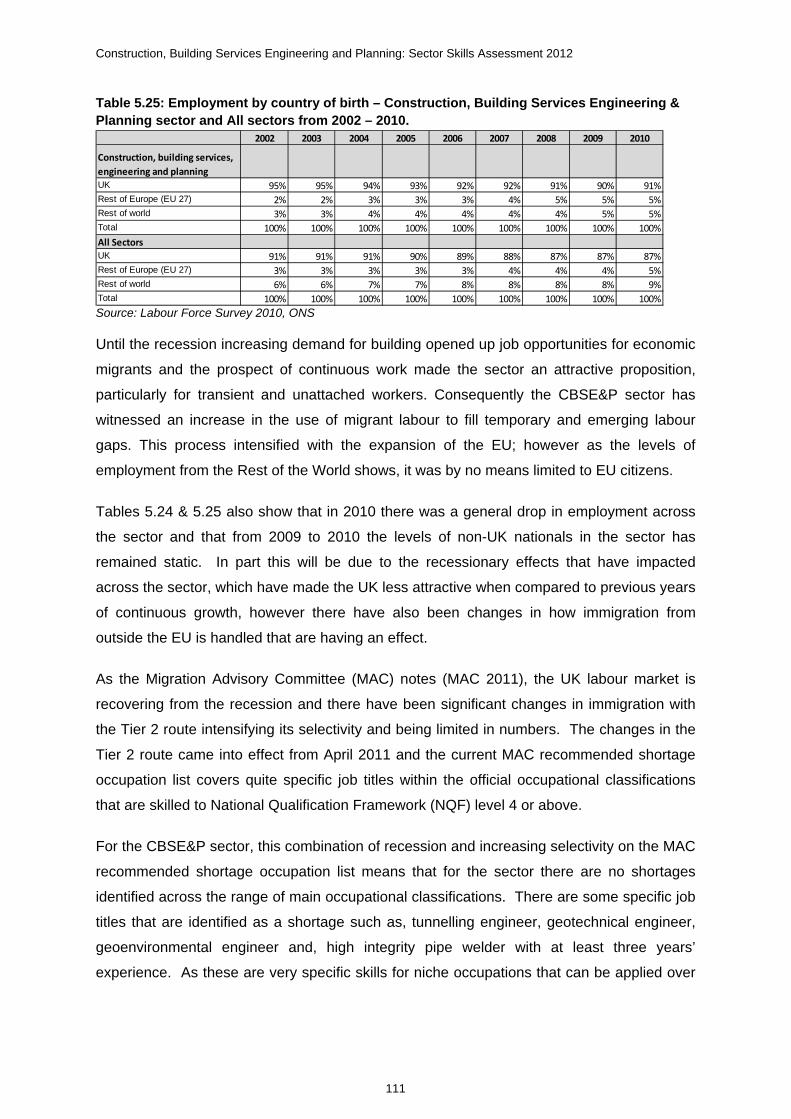
Construction, Building Services Engineering and Planning: Sector Skills Assessment 2012
111
Table 5.25: Employment by country of birth – Construction, Building Services Engineering & Planning sector and All sectors from 2002 – 2010.
Source: Labour Force Survey 2010, ONS
Until the recession increasing demand for building opened up job opportunities for economic
migrants and the prospect of continuous work made the sector an attractive proposition,
particularly for transient and unattached workers. Consequently the CBSE&P sector has
witnessed an increase in the use of migrant labour to fill temporary and emerging labour
gaps. This process intensified with the expansion of the EU; however as the levels of
employment from the Rest of the World shows, it was by no means limited to EU citizens.
Tables 5.24 & 5.25 also show that in 2010 there was a general drop in employment across
the sector and that from 2009 to 2010 the levels of non-UK nationals in the sector has
remained static. In part this will be due to the recessionary effects that have impacted
across the sector, which have made the UK less attractive when compared to previous years
of continuous growth, however there have also been changes in how immigration from
outside the EU is handled that are having an effect.
As the Migration Advisory Committee (MAC) notes (MAC 2011), the UK labour market is
recovering from the recession and there have been significant changes in immigration with
the Tier 2 route intensifying its selectivity and being limited in numbers. The changes in the
Tier 2 route came into effect from April 2011 and the current MAC recommended shortage
occupation list covers quite specific job titles within the official occupational classifications
that are skilled to National Qualification Framework (NQF) level 4 or above.
For the CBSE&P sector, this combination of recession and increasing selectivity on the MAC
recommended shortage occupation list means that for the sector there are no shortages
identified across the range of main occupational classifications. There are some specific job
titles that are identified as a shortage such as, tunnelling engineer, geotechnical engineer,
geoenvironmental engineer and, high integrity pipe welder with at least three years’
experience. As these are very specific skills for niche occupations that can be applied over
2002 2003 2004 2005 2006 2007 2008 2009 2010
Construction, building services,
engineering and planning UK 95% 95% 94% 93% 92% 92% 91% 90% 91%Rest of Europe (EU 27) 2% 2% 3% 3% 3% 4% 5% 5% 5%Rest of world 3% 3% 4% 4% 4% 4% 4% 5% 5%Total 100% 100% 100% 100% 100% 100% 100% 100% 100%
All SectorsUK 91% 91% 91% 90% 89% 88% 87% 87% 87%Rest of Europe (EU 27) 3% 3% 3% 3% 3% 4% 4% 4% 5%Rest of world 6% 6% 7% 7% 8% 8% 8% 8% 9%Total 100% 100% 100% 100% 100% 100% 100% 100% 100%

Construction, Building Services Engineering and Planning: Sector Skills Assessment 2012
112
a number of sectors, the MAC (2011) indicates very little migration from outside the EU at
the moment in CBSE&P.
While the MAC recommended shortage list covers the UK, there is also a list published for
Scotland. Although having a level of devolved government power, the general economic
and recessionary pressures in Scotland have been similar to that of the UK and the labour
market is facing similar challenges. For the CBSE&P sector in Scotland the view mirrors
that of the UK in terms of shortage occupations.
The view from looking at the tables on employment by nationality and from the current MAC
list is reflected in research carried out by Sector Skills Councils that support the CBSE&P
sector. In building engineering services, recent research carried out by SummitSkills (2011)
shows that there has been an overall decline in employment of migrant labour between 2008
and 2011. However within subsets of building engineering services there has been an
increase in migrant labour within electrotechnical and plumbing industries, while air
conditioning and refrigeration industries and the heating and ventilation industries have
shown a reduction in levels of migrant workers.
5.5 Extent to which skills deficiencies are hampering growth
At the moment it is general economic conditions and business environment that are having
the main impact upon hampering growth in the sector. As noted earlier, the sector has seen
a decline in output and employment in recent years, which when combined with uncertainty
about the rate of future growth, results in fragile confidence for the sector as a whole.
Low sector growth rates and failing employment levels are reflected in the wages and
migration details set out in Section 5.4 which show that the sector is not experiencing
significant mis-matches in either of these areas. Wage growth is lower than the all economy
average figure, while migration levels in the workforce are static and no occupations are
identified on the MAC list.
When looking at vacancy levels, recruitment of young people, retention of people within the
workplace and underemployment, again the sector is performing in line with the general
economy and does not appear to be experiencing any pressures in these areas.
There does however look to be a mis-match when it comes to hard-to-fill and skill-shortage
vacancies within the sector, with levels in both of these areas higher when compared to
other sectors, ref Table 5.1. This points to a small number of vacancies being difficult to fill
for which the reason is mainly a lack of job specific, technical or practical skills.

Construction, Building Services Engineering and Planning: Sector Skills Assessment 2012
113
Earlier, Tables 5.9 and 5.14 show the impact that these hard-to-fill vacancy and skill gaps
are having on businesses within the sector and Tables 5.26 and 5.27 below highlight the
main differences when comparing the sector specific details to the corresponding whole
economy details.
The sector is comparable to the overall economy in that having hard-to-fill vacancies
increases the workload for other staff; however for the sector there is more of an impact
reported in relation to losing business to competitors, increasing costs and outsourcing of
work.
Outsourcing of work is a definite feature of the sector which has extended main contractor,
sub-contractor supply chains, while increased competition for work has been evident in
employer feedback received by sector skills councils.
At a time when conditions are challenging, any impact that increases costs or reduces
competitive advantage would therefore hamper growth, and this does seem to be occurring
for employers that report a hard-to-fill vacancy and/or a skills gap.

Construction, Building Services Engineering and Planning: Sector Skills Assessment 2012
114
Table 5.26: Impact of having hard-to-fill vacancies, whole economy compared to Construction, Building Services Engineering & Planning (CBSE&P) sector
Base: All employers with hard to fill vacancies ** Denotes a figures of greater than 0% but less than 0.5% Source: UK Commission’s Employer Skills Survey 2011 (Davies et al, 2012) Table 5.27: Consequences of skills gaps, whole economy compared to Construction, Building Services Engineering & Planning (CBSE&P) sector
Base: All employers with skills gaps that have impact on establishment performance ** Denotes a figures of greater than 0% but less than 0.5% Source: UK Commission’s Employer Skills Survey 2011 (Davies et al, 2012)
When looking to overcome skills gaps, sector employers have increased the amount of
training provided, increased the amount spent on training, implemented a mentoring scheme
or undertaken more supervision of staff. This is similar to how skills gaps have been
overcome across all sectors, however for the CBDE&P sector there are some differences
when looking at steps taken at a national level with employers in Wales noting a reduction in
training spend.
Number % Number % % points
Increase workload for other staff 75,165 83 9,509 82 ‐1
Have difficulties meeting customer services objectives 40,550 45 4,820 42 ‐3
Lose business or orders to competitors 37,879 42 5,741 50 8
Delay developing new products or services 37,635 41 5,119 44 3
Experience increased operating costs 35,766 39 5,827 50 11
Have difficulties meeting quality standards 30,498 34 3,353 29 ‐5
Have difficulties introducing new working practices 29,065 32 2,816 24 ‐8
Outsource work 23,666 26 4,149 36 10
Withdraw from offering certain products or services altog 23,180 26 3,268 28 2
Have difficulties introducing technological change 19,905 22 2,362 20 ‐2
None 5,476 6 484 4 ‐2
Don't know 361 ** 35 **
Weighted base 90,770 11,596
Unweighted base 5,160 468
All economy ‐
Sector
Difference
UK UK
All economy CBSE & P Sector
Number % Number % % points
Increase workload for other staff 144,234 78 11,695 71 ‐7
Increase operating costs 82,833 45 9,005 54 9
Have difficulties meeting quality standards 74,405 40 5,283 32 ‐8
Have difficulties introducing new working practices 70,317 38 6,005 36 ‐2
Lose business or orders to competitors 59,139 32 4,649 28 ‐4
Delay developing new products or services 46,767 25 4,150 25 0
Outsource work 28,173 15 3,538 21 6
No particular problems / None of the above 14,285 8 1,788 11 3
Don't know 344 ** 0 0
Weighted base 184,733 16,563
Unweighted base 12,943 891
UK UK All economy ‐
Sector diferenceAll economy CBSE & P Sector

Construction, Building Services Engineering and Planning: Sector Skills Assessment 2012
115
Although skills deficiencies do not appear to be significantly hampering growth in the sector
at the moment, this position could change. If there was a stronger than expected recovery in
macro-economic conditions this would lead to increased employment demand, which in turn
would impact upon vacancies, wages and migration, putting constraints on the sector’s own
performance and growth.

Construction, Building Services Engineering and Planning: Sector Skills Assessment 2012
116
6 Drivers of change and their skills implications
Chapter Summary
This chapter discusses the main drivers of change in the Construction, Building
Services Engineering, and Planning industry, and what impact these changes may
have on the demand for employment and skills.
The drivers that will have the greatest impact on the sector are the economic
downturn, Government policies for the environment, and increasing use of off-site
manufacturing.
The skills required for surviving tough economic conditions are different to those
needed when the economy is performing well. There is a benefit for businesses and
employees to be multi-skilled so that they operate across several sectors and
occupations.
When the economy returns to growth a priority for the industry will be to recover the
large swathe of skills which have been lost as a result of the recession.
Greater management skills will be required as firms attempt to be as flexible as
possible, operate profitably in a competitive environment, and make the best use of
the skills of their current workforce.
Low carbon skills will have to be fully embedded into the sector. At present few
companies in the non-domestic sector are able to deliver zero-carbon properties.
CBSE&P professionals will have to learn how to account for carbon using principles
normally associated with accountants and economists such as discount rates which
are generally used with reference to financial cost.
The widespread adoption of Building Information Modelling and Management (BIM)
could bring about increased collaborative working, thereby driving greater innovation
and efficient working.
For professional services off-site manufacture of components will require increased
need for CAD/CAM trained building technicians to work on off-site design and
application in factory conditions.

Construction, Building Services Engineering and Planning: Sector Skills Assessment 2012
117
6.1 Drivers of change
The UK is currently experiencing one of the fastest paces of economic and social change in
modern times, with the economic downturn, growing environmental concerns, a globalised
workforce, and technological advances working together to bring this about. This chapter
looks at how these factors will change the Construction, Building Services Engineering and
Planning sector, and provides an overview of the implications these may have for both
employment and skills. It follows the format of the National Strategic Skills Audit in taking a
structured view of the areas in which change will occur covering politics, economics, the
environment, society, technology, and demography. The purpose is to indicate the nature
and direction of major types of change, and provide a broad analysis of how they may
influence skills demand and supply within the CBSE&P sector.
Figure 6.1 illustrates the seven main drivers for skills change. These can briefly be
summarised as:
i. Regulation and Governance: While national and devolved legislation and regulation can
influence skills demand and supply in many ways, for example by setting education
requirements, codifying training, product or service standards, and regulating
procurement processes, it is presently of particular importance in setting the pace of the
‘Green Agenda’.
ii. Demographic and population change: covers changes in the age profile of populations
and the effects of migration.
iii. Environmental change: for the CBSE&P sector this is specifically about climate change
and minimising the emission of Green House gases; the primary driver here will be the
Green Deal.
iv. Economics: including rate of overall economic growth, particularly in response to the
Coalitions package of ‘Austerity Measures’, and the on-going unwillingness of banks to
lend to small businesses.
v. Technological change: primarily through greater use of off-site development and
manufacturing of components. The development of technologies may also create
demands for skills at higher levels in research and development (R&D), and at lower
levels in manufacturing new products.
vi. Changing values: this will include attitudes to work and may therefore affect labour
supply through influencing perceptions about the image and conditions of work within the
Construction, Building Engineering Services, and Planning sector.
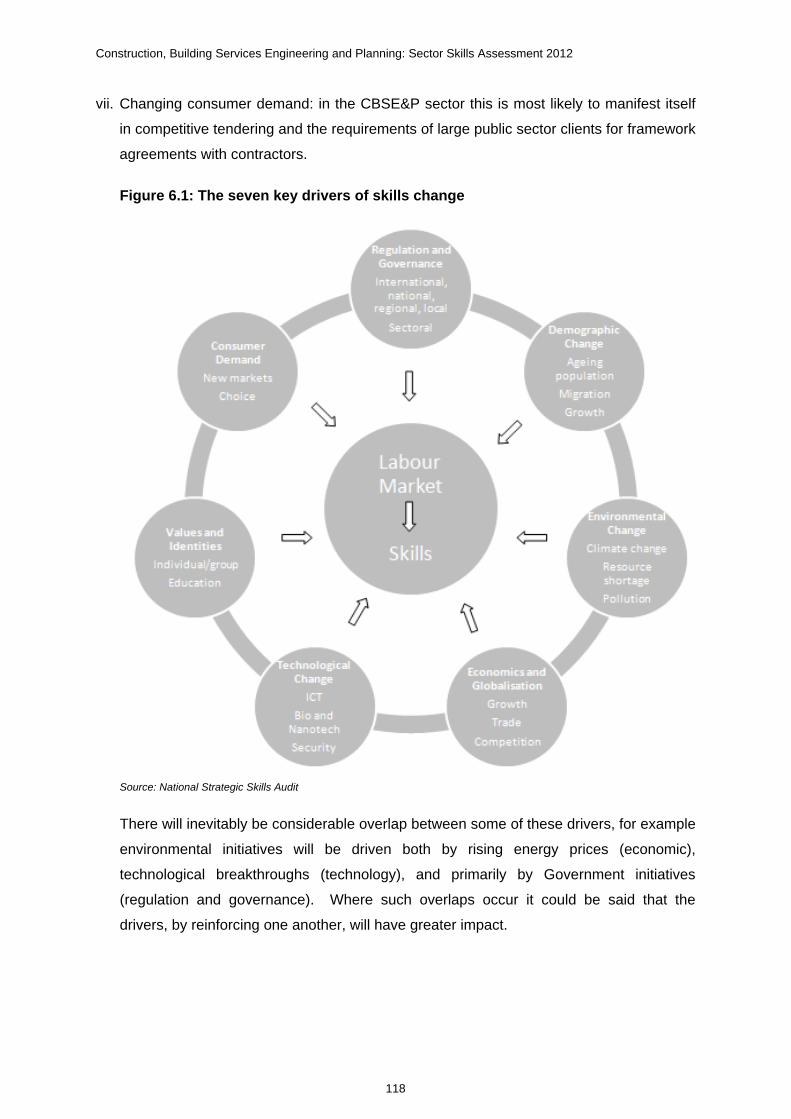
Construction, Building Services Engineering and Planning: Sector Skills Assessment 2012
118
vii. Changing consumer demand: in the CBSE&P sector this is most likely to manifest itself
in competitive tendering and the requirements of large public sector clients for framework
agreements with contractors.
Figure 6.1: The seven key drivers of skills change
Source: National Strategic Skills Audit
There will inevitably be considerable overlap between some of these drivers, for example
environmental initiatives will be driven both by rising energy prices (economic),
technological breakthroughs (technology), and primarily by Government initiatives
(regulation and governance). Where such overlaps occur it could be said that the
drivers, by reinforcing one another, will have greater impact.

Construction, Building Services Engineering and Planning: Sector Skills Assessment 2012
119
6.2 Scale of different drivers
Taking each of the above mentioned factors in turn, the remainder of this chapter will
examine what the change is, and what its implications might be for skills in the Construction,
Building Services Engineering, and Planning Sector. Where multiple drivers reinforce the
same change in employment and skills, then they are discussed together to avoid repetition.
6.2.1 Regulation and Multi-level Governance Including Environmental Change
The growing awareness of the impact that the built environment has upon the environment
means that its activities are becoming increasingly governed by legislation - primarily
concerning the implementation of low and zero carbon targets. Consequently, these drivers
are reviewed together.
Table 6.1 – Main Government Strategies for Addressing Energy Efficiency
Strategies Details
The Green Deal The Energy Act 2011 includes provisions for the new
‘Green Deal’, which aims to reduce carbon emissions
by improving the energy efficiency of Buildings
Building Regulations Changes to part L (energy efficiency) came into effect
in England in October 2010. They will be further
reviewed in 2013 and 2016, in line with the energy
requirements of the Code for Sustainable Homes.
Code for Sustainable
Homes
Sets new standards for energy efficiency (above those
in current building regulations) and sustainability which
are not mandatory under current building regulations
but represent important developments towards limiting
the environmental impact of housing.
Climate Change Planning
Policy Statement
Puts climate change at the centre of what Government
expects from good planning. The PPS is underpinned
by the Planning Act which places a duty on local
planning authorities to take action on climate change.
This includes Spatial Planning to minimise the
emission of greenhouse gases through the location,
scale, mix and character of development.
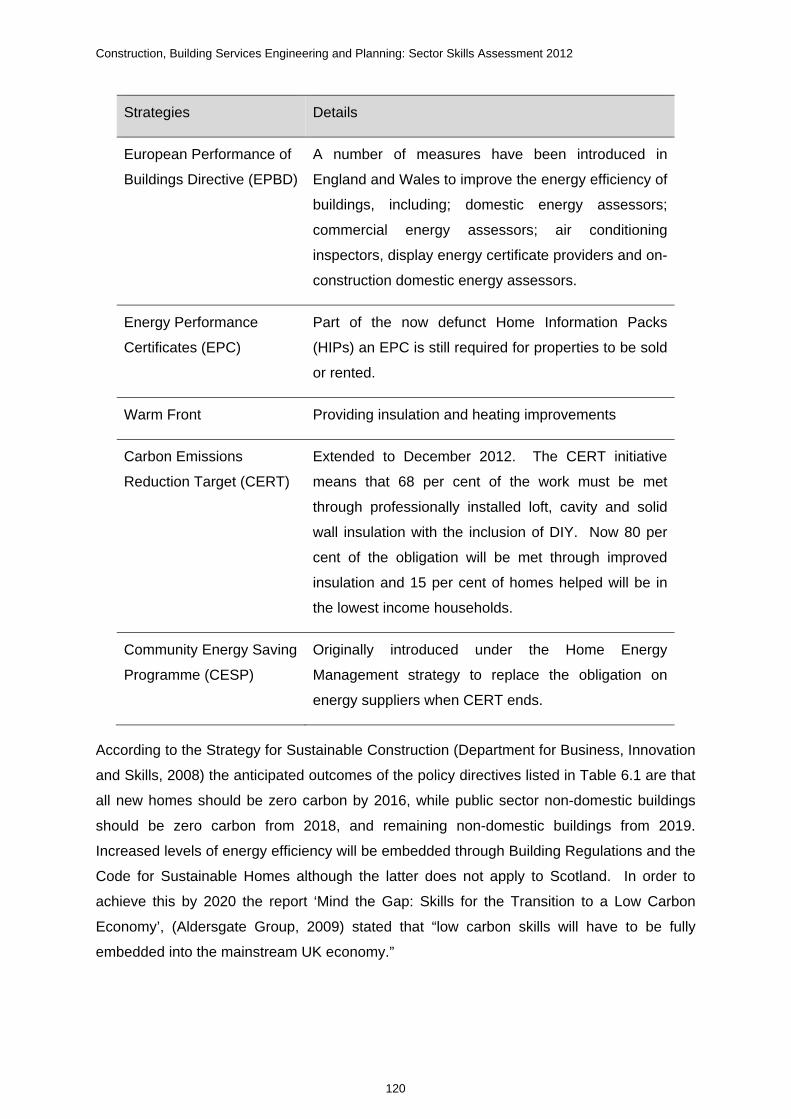
Construction, Building Services Engineering and Planning: Sector Skills Assessment 2012
120
Strategies Details
European Performance of
Buildings Directive (EPBD)
A number of measures have been introduced in
England and Wales to improve the energy efficiency of
buildings, including; domestic energy assessors;
commercial energy assessors; air conditioning
inspectors, display energy certificate providers and on-
construction domestic energy assessors.
Energy Performance
Certificates (EPC)
Part of the now defunct Home Information Packs
(HIPs) an EPC is still required for properties to be sold
or rented.
Warm Front Providing insulation and heating improvements
Carbon Emissions
Reduction Target (CERT)
Extended to December 2012. The CERT initiative
means that 68 per cent of the work must be met
through professionally installed loft, cavity and solid
wall insulation with the inclusion of DIY. Now 80 per
cent of the obligation will be met through improved
insulation and 15 per cent of homes helped will be in
the lowest income households.
Community Energy Saving
Programme (CESP)
Originally introduced under the Home Energy
Management strategy to replace the obligation on
energy suppliers when CERT ends.
According to the Strategy for Sustainable Construction (Department for Business, Innovation
and Skills, 2008) the anticipated outcomes of the policy directives listed in Table 6.1 are that
all new homes should be zero carbon by 2016, while public sector non-domestic buildings
should be zero carbon from 2018, and remaining non-domestic buildings from 2019.
Increased levels of energy efficiency will be embedded through Building Regulations and the
Code for Sustainable Homes although the latter does not apply to Scotland. In order to
achieve this by 2020 the report ‘Mind the Gap: Skills for the Transition to a Low Carbon
Economy’, (Aldersgate Group, 2009) stated that “low carbon skills will have to be fully
embedded into the mainstream UK economy.”
Construction, Building Services Engineering and Planning: Sector Skills Assessment 2012
121
A recent survey by the Royal Institute of Chartered Surveyors: Global Zero Carbon Capacity
Index (RICS, 2011) found the UK was in the top three countries in the world (out of 34
industrialised countries measured) in terms of working toward zero carbon in the built
environment (just behind Norway and Brazil). Despite this the Government’s targets still
present a major challenge to the CBSE&P sector, the scale of which is outlined by the
findings from the Employer Panel: Employer Attitudes and Motivations to Learning and
Training (Wave 10), (ConstructionSkills, 2010). This research found that few companies in
the non-domestic construction sector are currently able to deliver zero-carbon properties,
indeed 51 per cent of respondents stated that they had low or very low knowledge of low
carbon legislation and directives. As this awareness grows there will be considerable
demand for even comparatively basic skills in low and zero carbon technologies and green
products.
Just what these skills are is discussed in the report ‘Building a low-carbon economy – the
UK’s innovation challenge’ (Committee on Climate Change, 2010) which states that “A
combination of improved energy efficiency through insulation and increased penetration of
renewable heat, particularly but not solely from heat pumps, will be required to cut emissions
from buildings in the next decades. Most insulation materials and renewable heat
technologies are reasonably mature technologies, but have not been deployed at a large
scale in a UK context.”
It is the retrofitting of existing building stock which poses the greatest challenge to the
industry. UK legislation developed in response to the climate change agenda includes the
Energy Act 2011 and its provisions for the forthcoming Green Deal, which aims to reduce
carbon emissions through improvements to the energy efficiency of British properties. The
Green Deal is the Coalition Government’s flagship policy for improving the energy efficiency
of buildings in Great Britain and will be available from autumn 2012. It will establish a new
financial mechanism that will allow a range of measures, such as insulation, heating or
lighting, to be installed in people’s homes and businesses at no upfront cost. From the
autumn of 2012, providers will be able to offer customers a Green Deal pay as you save
plan, which will enable them to secure finance for the installation of measures to support
energy efficiency - such as insulation, new forms of heating or lighting systems or other
developments as new technologies emerge.
Accredited Green Deal advisors will identify the changes required to support the transition to
more energy efficient buildings, whereupon accredited installers will undertake the work. To
ensure that real savings can be made, the energy saving measures recommended for
properties will need to be both appropriate to the age and construction of the property and
Construction, Building Services Engineering and Planning: Sector Skills Assessment 2012
122
correctly installed. Clearly therefore, a competent property assessment and installation
workforce is essential for the success of the Green Deal.
Recent research commissioned by the Green Deal Skills Alliance: ‘Research to support the
development of a Green Deal Competence Framework‘ (Green Deal Skills Alliance, 2012)
revealed that the majority of employers within the CBSE&P sector consider that the existing
workforce will – for the most part – need to enhance current skill levels, rather than acquire
brand new skills. To a large extent, respondents believe the emphasis within training will
need to be on the application of existing skills within the context of Green Deal – making the
acquisition of relevant knowledge a high priority.
Skills required to implement the Green Deal will be a mix of technical skills – such as
physical installation of measures – combined with softer skills around customer service and
engagement. In particular the role of the energy assessor will require skills to carry out a
comprehensive and effective property assessment as well as the communication style to be
able to explain to and advise the customer on the most effective solutions. Understanding
the customer journey will enable the workforce to offer appropriate quality of customer
service.
Specific skills needs have been identified as:
Health & safety – notably personal protection, working at heights and dealing with
asbestos found in buildings
Basic skills – literacy, numeracy and ICT
Customer service and customer care
Assessment/surveying of building fabric performance in relation to estimated energy and
costs savings, and identification of the most effective solution for different building fabrics
and ages
Installation – of solar, ground and air source heat pumps, biomass heating systems and
insulation of all types (particularly in the context of needs of different building
fabrics/ages)
Maintenance of energy efficiency measures once installed
Use of software required in property assessment, and estimation of cost/energy savings
Project management and estimating skills to schedule and complete projects to time and
budget
Construction, Building Services Engineering and Planning: Sector Skills Assessment 2012
123
Calculation of realistic predictions of energy/cost savings and reduction in carbon
emissions for different types of building fabric/age dependent on energy efficiency
measure installed.
In addition to the new regulations coming into force it will also require research and
development for new technologies, investment, and willingness on the part of the CBSE&P
sector to embrace change. The payback for this willingness would be in the form of job
creation – it has been forecast in ‘Meeting the Low Carbon Skills Challenge: A Consultation
on Equipping People with the Skills to take Advantage of Opportunities in the Low Carbon
and Resource Efficient Economy’, (Department for Business, Innovation and Skills &
Department of Energy and Climate Change, 2010) that providing retrofit installation and
advice services to the domestic sector could create up to 65,000 jobs in the UK over the
next 40 years.
Meeting the Government’s targets will also require an increase in infrastructure projects,
specifically new nuclear power stations and both tidal and wind energy infrastructure. The
report ‘Towards a Low Carbon Economy – economic analysis and evidence for a low carbon
industrial strategy’, (Department for Business, Innovation and Skills, 2009) forecast that
achieving this will require the industry to apply existing skills and knowledge to new types of
building (e.g. new nuclear generation plants potentially to start coming online by 2017).
More local renewable and local low-carbon sources of energy will be key to delivering the
Government’s targets. Local energy will include both micro-generation serving individual
buildings, and community level schemes such as combined heat and power. The approach
set out in the Climate Change PPS is intended to help make the most of opportunities for
decentralised and renewable or low-carbon energy. The skills needed to deliver this are
Energy management, Energy efficiency, Energy advice and support for carbon reduction
measures, Sustainable use of resources, Renewable energy, Sustainable procurement,
Knowledge of funding and financial inclusion, Customer service skills, Keeping up to date
with legislation, Management and leadership skills (coaching and supporting staff, problem
solving, engaging and involving staff).
For professional services the impact of many of these legislative changes will be felt at the
design and planning stage by the likes of architects, planners and assessors. Plans and
designs for developments would need to take into account relevant changes in building
regulations as well as incorporating adaptations to build methods for improved energy
efficiency, requiring skills in interpreting legislation, knowledge of modern materials and
methods for their use.

Construction, Building Services Engineering and Planning: Sector Skills Assessment 2012
124
A 2009 Press Release from Atkins Global (www.atkinsglobal.com/en/media-centre/news-
releases/2009/2009-07-23) makes the point that engineers, architects and surveyors will
have to learn how to account for carbon using principles normally associated with
accountants and economists such as discount rates which are generally used with reference
to financial cost.
6.2.2 Economics and Globalisation
By far the biggest impact upon construction will be felt from fluctuations in the wider
economy, primarily the on-going effects of the recent recession, and the possibility of
another in early 2012. The recession brought with it massive job losses to the CBSE&P
sector, and despite officially ending in the fourth quarter of 2009 the onset of economic
recovery did not mark a recovery in employment. A priority for the industry in the
medium-term, therefore, will be to recover the large swathe of basic occupational skills, from
craft to professional and managerial that have been lost.
Since the ‘Credit Crunch’ banks have become more cautious in their lending to support
construction and property development - especially concerning technologies that are not
tried and tested, in the sense that they have not been widely adopted by the consumer. As
will be discussed later in this section, so called Modern Methods of Construction (MMC)
which utilise these new technologies are expected to drive long-term skills change in some
sectors of the industry, in the short to medium terms however this commercial factor will act
as a brake on their adoption, especially amongst small businesses.
So what are the implications of the continued economic uncertainty for skills in the sector?
Research carried out in 2009 ‘The Impact of the Recession on Construction Professionals –
A View from the Front Line’, (Construction Industry Council & ConstructionSkills, 2009),
examined how construction firms were coping with the recession. While the focus of the
survey was on Professional Services, one particular conclusion was pertinent for the whole
sector and that was that the skills required for surviving difficult economic conditions are
different to those needed when the economy is performing well.
Whereas in a strong economy there is some benefit to be gained from being a specialist in a
particular field, commanding higher prices for the greater knowledge and skills that this
implies, in more difficult economic times when different parts of the industry may experience
markedly contrasting fortunes, there is merit in operating across a range of sub-sectors. The
advantage this brings is that a downturn in one poorly performing area can be offset by
relatively better performance in another, enabling a more steady work and cash flow.
Construction, Building Services Engineering and Planning: Sector Skills Assessment 2012
125
The same principle operates at the level of the individual employee. The report
‘Understanding Productivity in the Construction Industry’, (ConstructionSkills, unpublished)
suggests that firms are training operatives to be proficient in a number of trades so that
fewer workers are required to complete a given project. While this is a short-term response
to the present economic circumstances, it is expected that the increased cost effectiveness
and productivity will ensure that it becomes a more permanent feature within the main
manual trades in the CBSE&P sector.
Further analysis of the challenges thrown up by the economic downturn is highlighted in the
research ‘Understanding Future Change in Construction’ (ConstructionSkills 2010).
Successful planning was mentioned by many employers in the survey as an area of difficulty
in times of economic uncertainty. Greater management skills will be required as firms
attempt to be as flexible as possible, operate profitably in a competitive environment, and
make the best use of the skills of their current workforce. Against this backdrop firms will
also need to consider, and plan for, how they will train the next generation of construction
workers. There is a real risk that in the medium-term, as the industry begins to recover,
there will be a shortage of skilled staff. If this is not addressed by increasing training and
apprenticeships (and it can take up to three years to train an apprentice, longer still until they
are able to work unsupervised and fully proficiently on site), then it is likely that we will see a
return of the skills shortages that marked the early years of the 2000s.
The economic impact of the recession upon the Professional Services sector has been as
significant, if not more so, than in the contracting sector, although it has attracted less media
attention. According to the survey of professional practices by the Construction Industry
Council (CIC) & ConstructionSkills already cited, 46 per cent of professional practices had
made redundancies since the onset of the recession, a figure backed up by claimant count
data from the ONS, which saw a 400 per cent rise for construction professionals between
November 2007 and November 2009.
While there is also evidence of significant ‘underemployment’ among professionals – the
CIC & ConstructionSkills Research survey indicated that 27 per cent of firms had resorted to
shorter working hours – there is a risk that a return to growth in the industry will see a
shortage of management and professional skills in the workforce.
In the longer-term, professional practices will have to work hard to overcome the damage
that has been done to the image of job security. Should this lead to fewer undergraduates
applying for degree courses, then deep-seated and systemic skills shortages may develop
leading to spikes in wage levels.

Construction, Building Services Engineering and Planning: Sector Skills Assessment 2012
126
6.2.3 Technological Change
Although there are many new and innovative trends in the building process, so called
Modern Methods of Construction, the one that is likely to have the biggest impact on skills is
off-site manufacture of components that are later installed on site. Although innovation has
not been a key aspect of the industry in previous years, it is suggested in ‘2020 Vision: The
Future of UK Construction’ (Experian and SAMI Consulting, 2008) that this could be
improved by ‘greater internationalism, greater competition, and greater integration in the
supply chain’. Also, as one of its benefits is increased energy efficiency, it is likely that its
use will become more widespread as Environmental and Sustainability Legislation becomes
more stringent.
According to The Callcutt Review of Housebuilding and Delivery (Department for
Communities & Local Government, 2007),, some 70 per cent of homes built in the UK could
include some modern methods of construction by 2016 much of it driven by tightly controlled
processes to improve construction efficiency, improve productivity, and minimise waste,
particularly on new build sites. By comparison in 2005 the proportion of homes using such
methods stood at 24 per cent, the majority of which were timber frame or light metal frame.
In the short to medium-term, the impact of technological change on new-build is likely to be
greater on larger, new work, building projects where repetition of components will justify the
investment in off-site methods.
Currently 12 per cent of all construction activity is manufactured offsite and this requires on-
going skills links with the manufacturing sector. The implications for site-based skills arising
from off-site manufacture could be significant over the period to 2020, but there are limits to
its application. The CBSE&P sector covers a vast range of industries and many small firms
will not currently require or utilise innovative methods, as the traditional parts of the industry
will co-exist alongside the emerging ‘green’ industrial markets.
Off-site manufacturing of components is not widely considered to have a very significant
effect on the repair and maintenance market, which accounts for over 40 per cent of the
sectors output, and in employment terms, around 60-70 per cent of the workforce. Civil
engineering projects are also not likely to be greatly affected as they already use a
significant proportion of pre-cast components, whether manufactured on-site or off-site, in
contrast, new housing offers significant opportunities.
Technically, off-site manufacture of components for building homes is already achievable
and already occurs on a more significant scale in some overseas markets; a combination of
cost, skill, inertia, required levels of investment, and level of demand, and the attitude of
Construction, Building Services Engineering and Planning: Sector Skills Assessment 2012
127
home buyers and developers appear to be the main constraints on greater use in the UK at
present. Where off-site manufacture is used the main implications on skills demand in the
future will be:
Greater mechanisation and automation on-site. Although much of this can be achieved
by wider use of existing tools and techniques, it will require skills, particularly in Health
and Safety, focused towards heavy lifting, handling large loads and logistics on-site.
Off-site manufacture will involve a very substantial shift of building skills from building
sites to a factory environment. This may mean a substantial reduction in bricklayers,
plasterers, tilers, electricians, plumbers etc. on-site. Initially many of these trades will still
be required in the off-site factories, but eventually, possibly rapidly, the level of skill
needed will be reduced by the advantages of factory conditions and methods, in
particular by having one skilled operator supervising a number of less skilled operators.
New skill needs will be along the lines of a better understanding of the composition and
purpose of components and assemblies and how they can be moved and lifted.
With a wide range of substantially different components, site workers will need a greater
understanding of general building issues such as tolerances, air/water-tightness, and the
interaction between components.
For professional services, in addition to this an understanding of how new components will
operate over the life time of a building, off-site manufacture of components will require
integration of construction processes from design through construction to maintenance,
which in turn implies a need for cross-disciplinary education for design teams.
At the forefront of collaborative working and industry innovation is Building Information
Modelling and Management (BIM). BIM is defined in the Strategy Paper for the Government
Construction Client Group (BIS, 2011) as the ‘digital representation of physical and
functional characteristics of a facility creating a shared knowledge resource for information
about it forming a reliable basis for decisions during its life cycle, from earliest conception to
demolition.’ The report also stated that “BIM has the greatest potential to transform the
habits and eventually the structure of the industry.” BIM is seen as the biggest behavioural
change to occur within the construction industry and was hinted at in Latham’s Report,
Constructing the Team (Latham, 1994) and Egan’s Report, Rethinking Construction
(Egan, 1998). Latham’s aspiration was to see a 30 per cent improvement in productivity.

Construction, Building Services Engineering and Planning: Sector Skills Assessment 2012
128
BIM could enable a completely collaborative approach whereby the whole design and
construction process can be shared using a single electronic ‘model’ of the development.
This will necessitate a significant culture change in the industry and drive it towards a long-
sought industry target of integrated and inter-disciplinary working and increased efficiency
and productivity across the industry.
The implementation of BIM received a significant boost with the publication of the
Government's Construction Strategy (Cabinet Office, 2011), which sets out a move towards
the mandatory use of BIM in public sector projects. The strategy sets out a requirement that
projects must use BIM Level 2 by 2016. This level equates to providing fully collaborative 3D
BIM, but the key advantages at project implementation stage flow from the ability to model
4D (time) , 5D (cost) and beyond.
The momentum towards BIM has certainly been increasing over the last 12 months and the
tipping point is not too far away for model based processes becoming the norm. It is
anticipated that the uptake of BIM will follow a similar growth arch of CAD/CAM only over a
much shorter timeframe. Indeed, the benefits of BIM in terms of enabling maximum
efficiency in use of materials and efficient build-ability, and thus underpinning increased
competitiveness means that it will ultimately become as commonplace as CAD/CAM.
There will also be increased need for CAD/CAM trained building technicians to work on off-
site design and application in factory conditions. Overall an understanding of manufacturing
methods will need to be combined with an understanding of construction methods.
6.2.4 Demographic Change and Values and Identities
Changes in values and identity are partly driven by demographic changes, including
increased female and older worker participation in the labour market, so they will be
reviewed together in this report.
Like many sectors within the UK economy, the CBSE&P sector has an ageing workforce,
and in future employers will have to adapt to this to an even greater extent than at present.
A recent Chartered Institute of Personnel and Development survey, Employee Outlook:
focuses on the ageing workforce (CIPD, 2010) has found that 41 per cent of employees plan
to work beyond the state retirement age. Among those employees, the survey found that
financial reasons, people’s needs and aspirations to continue using their skills and
experience, benefits from social interaction in the workplace and self-esteem were the main
reasons why people planned to work beyond their normal retirement age.
Construction, Building Services Engineering and Planning: Sector Skills Assessment 2012
129
Evidence presented already in this report shows that women make up only a small
proportion of all workers in the CBSE&P sector, and a tiny proportion of workers in the
manual trades. Based on historic trends this pattern is unlikely to change in the foreseeable
future.
From the above analysis the skills implications of demographic change and values and
identities are: greater requirement for measures addressing equal opportunities, managers
who are more able to manage an ageing workforce, greater emphasis on firms retaining and
attracting staff, and a general move to more flexible ways of working.
6.2.5 Consumer demand
Many of the changes outlined in this section are likely to translate into Local Authority
contractual requirements - meaning that procurement processes are expected to become
another important driver for skills demand as companies will have no choice but to respond.
Already pre-qualification questionnaires (PQQs) are placing increased importance on
environmental and sustainability policies held by tendering organisations; as well as quality
standards and experience and skills relating to specific materials and processes, including
waste management. Changes to procurement processes are therefore expected to act as a
conduit for businesses to drive through changes within their organisation in order to adapt
and survive in a competitive market.
Over the medium to longer-term, procurement requirements are expected to become even
more stringent for all parts of the sector – in part led by regulations introduced by the EU.
This will have a particularly strong impact on SMEs, as the costs and time incurred to pass
through PQQ stage, even for relatively small contracts, are continually increasing.
In order to demonstrate compliance with regulations at both pre-qualification and building
stages there will be a greater need for recording and documentation of processes and
materials. This in turn will require additional written, communication, and presentational
skills and may even require an understanding of addressing legal requirements and
contractual skills which may be costly and time consuming for SMEs who will have to
achieve this in addition to their day to day operations.
Amongst large clients the recession is driving moves towards reducing costs, which in the
CBSE&P sector means a move towards standardisation and design and building
repeatability.

Construction, Building Services Engineering and Planning: Sector Skills Assessment 2012
130
Finally, the importance of good interpersonal, communication and customer-facing skills will
remain high, especially to meet expectations of consumers who are increasingly more
demanding and vocal in expressing their needs. Greater flexibility to adapt and customise
products and services to individual customer needs may also be required.
6.3 Differences in Drivers across the four nations
In a market as large and as homogenous as the UK there are few differences in drivers
across the nations. What differences there are result from the various policy and legislative
differences between national Parliaments and Assemblies and the Westminster
Government. While these differences will be covered in more detail in each nations SSA
they are summarised here.
6.3.1 Wales
Table 6.2: Key Legislative Competence Orders relating to the CBSE&P sector in Wales:
Strategies Details
Building Regulations
powers set to
transferred to Wales
on 31 December
2011
The Assembly Government has set a 55 per cent
improvement (over the 2006 Building Regulations) as the
target for the first changes to devolved Building Regulations.
It aims to bring forward detailed proposals for consultation
during 2012 with a view to implementation in 2013.
The National
Assembly for Wales
(Legislative
Competence)
(Housing and Local
Government) Order
2010
The proposed LCO would extend the field of legislative
competence in relation to housing and local government.
The competence within the LCO would cover the regulation
of social landlords, disposals by social landlords, social
housing tenancies, homelessness, housing allocations,
housing-related support, the provision of Gypsy and
Traveller sites, empty homes and Council Tax for second
homes.

Construction, Building Services Engineering and Planning: Sector Skills Assessment 2012
131
Strategies Details
The National
Assembly for Wales
(Legislative
Competence)
(Environment) Order
2010;
New powers in this field will enable the Welsh Assembly
Government to bring forward proposals for Measures with
the aim of creating sustainable communities. Three specific
areas in which these powers will be used are: improving
local environmental quality, increasing recycling and
improving waste management; and strengthening pollution
controls.
The work of the UK Government, the UK Zero Carbon Hub, in particular in relation to fabric
efficiency standards and primary energy use, and discussions through the Wales Low Zero
Carbon Hub has informed thinking which builds on national planning policy set out in
Planning Policy Wales. This currently sets an expectation of a 31 per cent improvement
against the 2006 baseline for housing developments of 5 or more dwellings (with all
dwellings from 1st September 2010). The 55 per cent represents a further improvement of
24 per cent against that policy.
For non-residential developments national planning policy, set out in Planning Policy Wales,
currently sets an expectation for the BREEAM 'Very Good' standard with an ‘Excellent’ score
for energy/CO2 to be achieved on all applications with a floorspace of 1,000m2 or more. For
Assembly Government funded projects the expectation is for the ‘BREEAM Excellent’
standard to be met in full.
The added difficult for Welsh housing in achieving these targets is the higher than average
number of stone built , rural, and pre-1919 housing in the country. While these initiatives will
not require any different skills from those set out in the rest of this report they may place
greater demands on the workforce to achieve them.

Construction, Building Services Engineering and Planning: Sector Skills Assessment 2012
132
6.3.2 Northern Ireland
Table 6.3: Key Legislative Competence Orders relating to the CBSE&P sector in Northern Ireland
Strategies Details
Everyone’s Involved –
Sustainable Development
Strategy
The Executive’s strategy to provide Northern Ireland
with a framework for the sustainability agenda.
Sustainable Development
Strategy Implementation
Plan
Details the actions to be taken by Government and
others in support of achieving the strategic objectives
within the Sustainable Development Strategy.
Success through Skills 2 This is the Skills Strategy for NI and provides an
overarching framework for the development of skills by
looking at the current skills base, examining the skills
needed in the future to grow the economy and
highlighting the areas for action. Its vision is one of
achieving a skilled workforce by 2015.
These underpin the Investment Strategy for Northern Ireland with excellence in construction
programmes that integrate Sustainable Development principles. It aims to ensure that public
sector housing and public properties are constructed or refurbished to maximise
sustainability and flexibility of use.
Current work towards achieving these targets creates a significant opportunity for
occupations likely to be involved in the creation, installation and maintenance of products
and services – e.g. designers, specifiers, building services engineers and planners.
Key targets are to increase the skills and qualifications of the Northern Ireland workforce,
(including the Essential Skills of numeracy, literacy and ICT), and to encourage higher value-
added jobs and enhancements to productivity. There is an aim to address the under-
representation of graduates in key sectors in the economy, including construction, which has
resulted in under representation of managerial and professional occupations. If successful
these should see a proportionally greater demand of high level management and
professional skills that in the UK as a whole.

Construction, Building Services Engineering and Planning: Sector Skills Assessment 2012
133
6.3.3 Scotland
The Scottish Parliament has arguably the most devolved power of all the nations. One of
the areas where this has been used is in the large number of strategies and policies aimed
at progressing to a low carbon, more energy efficient built environment including: Energy
Efficiency Action Plan, Renewables Action Plan, Renewable Heat Action Plan; The Scottish
Sustainable Procurement Action Plan, Scotland’s Zero Waste Plan.
Table 6.4: Recent Legislative Competence Orders relating to the CBSE&P sector in Scotland:
Strategies Details
Scottish Government
Economic Strategy 2011
Covers priority areas such as low carbon, renewable
energy and infrastructure. Although CBSE&P tends
not to be mentioned explicitly, it is recognised as an
enabling sector that underpins a lot of the others.
Low Carbon Economic
Strategy for Scotland
Section 2.3 focuses on the economic opportunities
across the built environment as a consequence of the
moving to a low carbon economy. It also outlines the
corresponding Strategic Objectives with associated
actions.
All these policies are designed to deliver the more stretching greenhouse gas emissions
targets set out in the Climate Change (Scotland) Act. This is enabling legislation which sets
out the broad aims and targets for the reduction of carbon emissions in Scotland and gives
power to local authorities and to the Scottish Ministers to require improvements to the
energy performance of domestic and non-domestic buildings. The Act introduces targets to
reduce carbon emissions in Scotland by at least 80 per cent by 2050 with an interim target
reduction of 42 per cent by 2020. There are specific provisions in the Act which relate
property in Scotland and which are likely to affect businesses.
Section 63 of the Act introduces a new requirement for assessment of the energy
performance of and emissions from non-domestic buildings. The details of this requirement
include provisions for the assessment of the energy performance of non-domestic buildings
obliging owners to implement the recommendations in the assessment that will improve the
energy efficiency of the buildings and reduce greenhouse gas emissions. This could include
improving insulation, taking measures to reduce draughts, improving the efficiency of

Construction, Building Services Engineering and Planning: Sector Skills Assessment 2012
134
equipment within buildings, and once new technologies become more cost effective,
introducing low and zero carbon equipment.
The scale of the task is significant, going well beyond that of the UK as a whole, and will
require a skilled workforce of significantly greater size than at present if it is to be achieved.

Construction, Building Services Engineering and Planning: Sector Skills Assessment 2012
135
7 Future Skills Needs
Chapter Summary
There are number of key drivers which could impact on the future skill needs these
include the economy, environment, legislation and new and emerging technologies.
The current issues with the economy are likely to cause a fall in construction output in
the short term although in the longer term the industry will return to growth.
Employment in the industry is likely to fall in the short term but will return to growth in
the longer term. However this is a cause for concern as much of the focus for the
industry is on short term survival rather than longer term recovery and growth.
The Construction, Building Services Engineering and Planning Sector differs from the
workforce of the whole economy in that skilled craft occupations form a much larger
proportion of the workforce. However in the future within Construction, Building
Services Engineering and Planning there is going to be small shift away from skilled
craft occupation to managers and professionals having a larger share of the industry.
Many of the future skill needs of the sector are likely to be a development of existing
roles rather than a requirement for new skills. Knowledge and understanding of new
and emerging products and processes will be essential to the delivering of a low
carbon sector.
7.1 Drivers of future trends in skills needs
The drivers of change which will impact upon the CBSE&P sector are outlined in detail in
section 6 of this report. This section will focus on a number of these drivers which could
have a bearing on the future skills needs of the sector.
7.1.1 Economy
The impact of the contraction of the UK economy will cause output in the CBSE&P sector to
fall particularly in the short term. Construction output is likely to fall with a predicted drop of
three per cent 39 in 2012 in the UK as a whole. It will gradually pick up for the remainder of
the Construction Skills Network forecast period of 2012 - 2016 to give an annual average
growth rate of one point four per cent.
39 Construction Skills Network (2012) Blueprint for UK Construction 2012-2016. ConstructionSkills

Construction, Building Services Engineering and Planning: Sector Skills Assessment 2012
136
It is likely that private housing, commercial and industrial will be the key drivers for future
output. Public sector housing and non-housing will continue to contract over the forecast
period due to the public sector cuts.
In Scotland in the short term the forecast contraction for construction output is larger than
the UK as a whole with a fall of five per cent in 2012. However it will rise sharply in 2013,
and then improve steadily for the remainder of the forecast period. This will give a predicted
annual average increase of 1.3 per cent, just below the UK figure. The key sectors driving
output will be infrastructure followed by private housing and commercial.
Wales too is forecast for a short term fall in output in 2012 of four per cent and then output
will rise from 2013 onwards to give a predicted annual average increase of 1.3 per cent over
the five year forecast period. Key drivers of output in Wales are industrial followed by private
housing and commercial.
Northern Ireland is forecast to see a one per cent rise in construction output in 2012 and its
annual average increase predicted to be 1.4 per cent, in line with the UK as a whole. Key
drivers of output for Northern Ireland are commercial, followed by private new housing and
housing repair and maintenance.
7.1.2 Environment and Legislation
The transition to a low carbon economy remains a key priority for the UK Government in
order to meet the legally binding targets of a reduction of carbon emissions of 80 per cent by
2050 and 34 per cent by 202040 and to ensure a more stable supply of energy. A number of
policies and legislative processes are in place or are being developed to help deliver this
transition.
The Energy Act 201141, one such piece of legislation, gained Royal Assent in 2011 and will
pave the way for the launch of the Green Deal in October 2012. Green Deal is the UK
Government’s flag ship initiative to improve the energy efficiency of existing buildings. It
provides a finance mechanism which will enable improvements to the energy efficiency of
households and non-domestic buildings with no up-front costs
40 Climate Change Act 2008 – Department of Energy and Climate Change 41 Energy Act 2011 – Department of Energy and Climate Change

Construction, Building Services Engineering and Planning: Sector Skills Assessment 2012
137
In addition to Green Deal the Energy Act also covers the Energy Company Obligation
(ECO) which will replace Carbon Emissions Reduction Target (CERT) and Community
Energy Saving Programme (CESP). ECO will work alongside Green Deal and will provide
additional support for energy efficiency measures for low income families or for hard to treat
properties.
The Energy Act 2011 and the subsequent Green Deal are both UK wide initiatives. In
addition to this both Scotland and Wales have their own polices for energy efficiency.
Scotland has the Climate Change Act (Scotland) 2009 which sets its own targets for Carbon
Reduction of 80 per cent by 2050 and 42 per cent by 2020. Scotland also has its Energy
Efficiency Action Plan which details a number of actions including improving the energy
efficiency of all housing stock and developing a public sector that leads way through
exemplary energy performance.
The Welsh Government too has its own Climate Change Strategy and is committed to
reducing emissions by three per cent per year in the areas it controls. It has developed an
Energy Efficiency Savings Plan to help deliver its Climate Change Strategy by including
actions to reduce emissions and to improve the energy efficiency of buildings.
Northern Ireland is currently scoping for a new energy bill which is likely to be consulted on
in the spring. It is likely to contain provisions relating to a feed-in tariff (FIT) and issues
related to energy efficiency.
In addition to reducing emissions through the improvement of existing buildings there is also
the focus to improve the energy efficiency of new homes. In England this will be through the
Code for Sustainable Homes and stepped improvements in Part L of the Building
Regulations in 2011, 2013 and 2016, with the aim of homes being deemed zero carbon by
2016 as per the Governments definition of zero carbon42.
From December 2011 powers to set Building Regulations will be passed to the Welsh
Government. It has set a target to deliver a 55 per cent reduction in carbon emissions from
new build by 2013 (based on a 1990 baseline). New housing that the Welsh Government
influences, through grant funding investment or land disposals, will be required to meet at
least Level 3 of the Code for Sustainable Homes moving as quickly as possible to Level 4.
Scotland too has the goal of net zero carbon for heating, lighting and ventilation by
2016/2017 and will also use staged revisions to the energy standards within the Scottish
Building Standards to deliver this. 42 The Rt Hon Grant Shapps MP- Buildings and the Environment Statement 17 May 2011

Construction, Building Services Engineering and Planning: Sector Skills Assessment 2012
138
Reducing carbon emissions is all about mitigating the impact of climate change however
despite the action being taken now and in the future, scientists are predicting that there will
still be changes to the climate such as warmer and wetter winters, hotter and drier summers
and unusual weather conditions such as prolonged rain or stronger winds. There will be a
requirement to adapt to any climate change, this is particularly crucial for the CBSE&P
sector given the life expectancy of buildings. This will require the adaptation of the existing
Built Environment to deal with a climate that may be significantly different from that in which
it evolved.
Within the UK Government the Department for Food and Rural Affairs (DEFRA) are
undertaking their first Climate Change Risk Assessment; this will include a skills audit for
climate change adaptation. The Department for Communities and Local Government
(DCLG) are also looking at over-heating issues for inclusion in future building regulations
and codes for new buildings.
The Welsh Government has an Adaptation Framework and Adaptation Delivery Plan as part
of its Climate Change Strategy. Key to the framework will be in understanding the impacts
of climate change and what needs to be done to meet these changes. Scotland too has a
Climate Change Adaptation Framework which will play a role in building Scotland’s
resilience to the changing climate.
7.1.3 Technology
The UK Government through the Department for Business Innovation and Skills plans to
introduce a progressive programme of mandated use of fully collaborative Building
Information Modelling (BIM) for Government projects by 2016 43 with a phased roll out from
2012.
BIM is a managed approach to the collection and management of all information across
project. At the centre of BIM is a computer-generated model containing all the graphical and
tabular information about the design, construction, installation and operation of a building.
7.2 Impact on Employment and Skills
Taking the drivers and trends outlined above the potential impact on UK employment for the
sector is illustrated by Working Futures 2010-2020 (Wilson and Homenidou, 2011) details
shown in Table 7.1.
43 Government Construction Strategy May 2011 – Cabinet Office
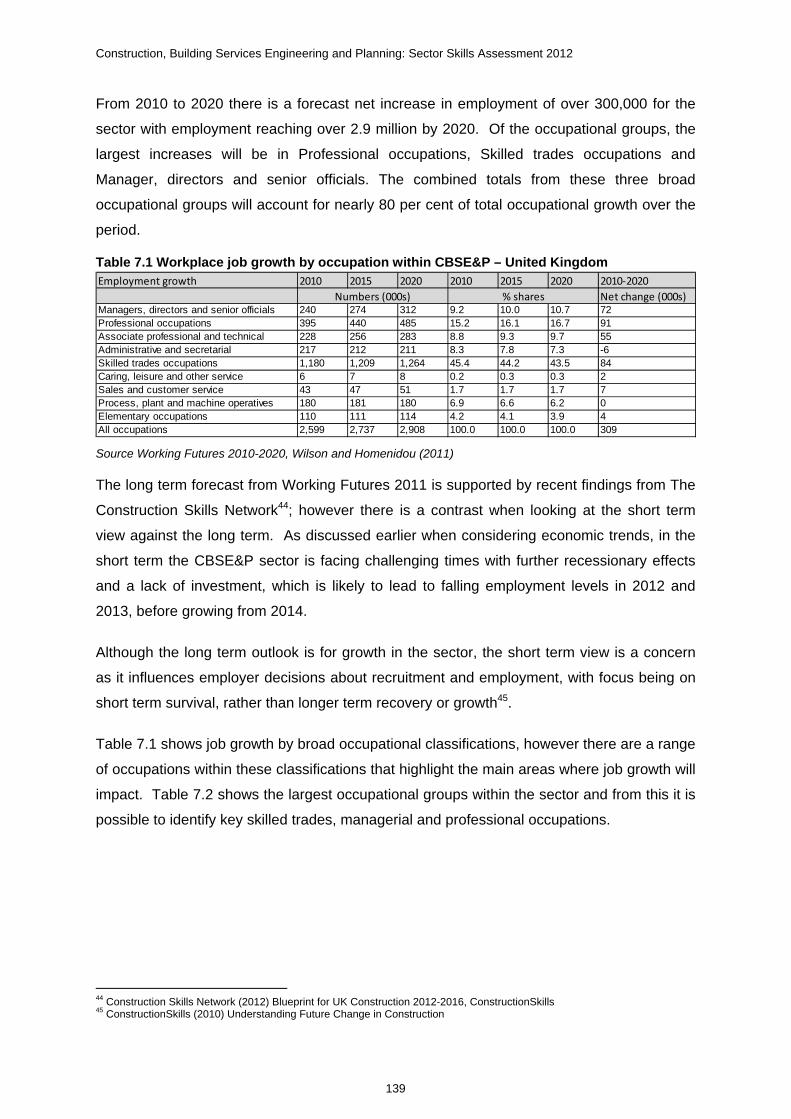
Construction, Building Services Engineering and Planning: Sector Skills Assessment 2012
139
From 2010 to 2020 there is a forecast net increase in employment of over 300,000 for the
sector with employment reaching over 2.9 million by 2020. Of the occupational groups, the
largest increases will be in Professional occupations, Skilled trades occupations and
Manager, directors and senior officials. The combined totals from these three broad
occupational groups will account for nearly 80 per cent of total occupational growth over the
period.
Table 7.1 Workplace job growth by occupation within CBSE&P – United Kingdom
Source Working Futures 2010-2020, Wilson and Homenidou (2011)
The long term forecast from Working Futures 2011 is supported by recent findings from The
Construction Skills Network44; however there is a contrast when looking at the short term
view against the long term. As discussed earlier when considering economic trends, in the
short term the CBSE&P sector is facing challenging times with further recessionary effects
and a lack of investment, which is likely to lead to falling employment levels in 2012 and
2013, before growing from 2014.
Although the long term outlook is for growth in the sector, the short term view is a concern
as it influences employer decisions about recruitment and employment, with focus being on
short term survival, rather than longer term recovery or growth45.
Table 7.1 shows job growth by broad occupational classifications, however there are a range
of occupations within these classifications that highlight the main areas where job growth will
impact. Table 7.2 shows the largest occupational groups within the sector and from this it is
possible to identify key skilled trades, managerial and professional occupations.
44 Construction Skills Network (2012) Blueprint for UK Construction 2012-2016, ConstructionSkills 45 ConstructionSkills (2010) Understanding Future Change in Construction
Employment growth 2010 2015 2020 2010 2015 2020 2010‐2020
Net change (000s)Managers, directors and senior officials 240 274 312 9.2 10.0 10.7 72Professional occupations 395 440 485 15.2 16.1 16.7 91Associate professional and technical 228 256 283 8.8 9.3 9.7 55Administrative and secretarial 217 212 211 8.3 7.8 7.3 -6Skilled trades occupations 1,180 1,209 1,264 45.4 44.2 43.5 84Caring, leisure and other service 6 7 8 0.2 0.3 0.3 2Sales and customer service 43 47 51 1.7 1.7 1.7 7Process, plant and machine operatives 180 181 180 6.9 6.6 6.2 0Elementary occupations 110 111 114 4.2 4.1 3.9 4All occupations 2,599 2,737 2,908 100.0 100.0 100.0 309
Numbers (000s) % shares

Construction, Building Services Engineering and Planning: Sector Skills Assessment 2012
140
Table 7.2 Largest occupation groups within the sector (UK) 2010
Source Labour Force Survey 2010, ONS
Table 7.2 shows largest occupation groups within the CBSE&P sector as per the Labour
Force Survey in 2010. The largest group are the skill trades occupations with a total of
851,000 with managers 251,000 and professions 157,000.
In the short term the contraction of the economy is likely to have a negative effect on the
levels of employment within the CBSE&P sector. The ConstructionSkills Network predicts a
fall in total employment in the short term before starting to grow again in 2014. The Working
Futures 2010-2020 data also supports this, as shown by table 7.1
Through the Working Futures 2010-2020 data (Wilson and Homenidou, 2011) it is not
possible to identify how each of these main occupations will be affected as they are grouped
together rather than showing each of the occupations separately for example carpenter,
bricklayers etc. are brought together as skilled trade occupations. However some insight
can be given from the Construction Skills Network forecast which indicates that the
employment numbers for managers in construction will increase. However with the skilled
craft trades, although employment is predicted to increase overall, some of the trades such
as bricklaying and painting are forecast to fall in numbers.
Looking in more detail at the nations within the UK, there are some differences in job growth.
Rank Occupation 000s % workforce
1 5315 Carpenters and joiners 199 7
2 5319 Construction trades n.e.c. 194 7
3 1122 Managers in construction 186 7
4 5314 Plumbing, heating & ventilating engineers 156 6
5 5241 Electricians, electrical fitters 153 6
6 9121 Labourers build & woodworking trades 122 5
7 5323 Painters and decorators 95 4
8 5312 Bricklayers, masons 77 3
9 1121 Prod. works & maintenance managers 65 2
10 5321 Plasterers 54 2
11 2121 Civil engineers 54 2
12 4150 General office assistants or clerks 54 2
13 8149 Construction operatives n.e.c. 49 2
14 2431 Architects 45 2
15 2434 Chartrd surveyors (not qntity surv) 45 2
Other occupations 1150 43
Total workforce 2,696 100
Unweighted base (000s) 17.925
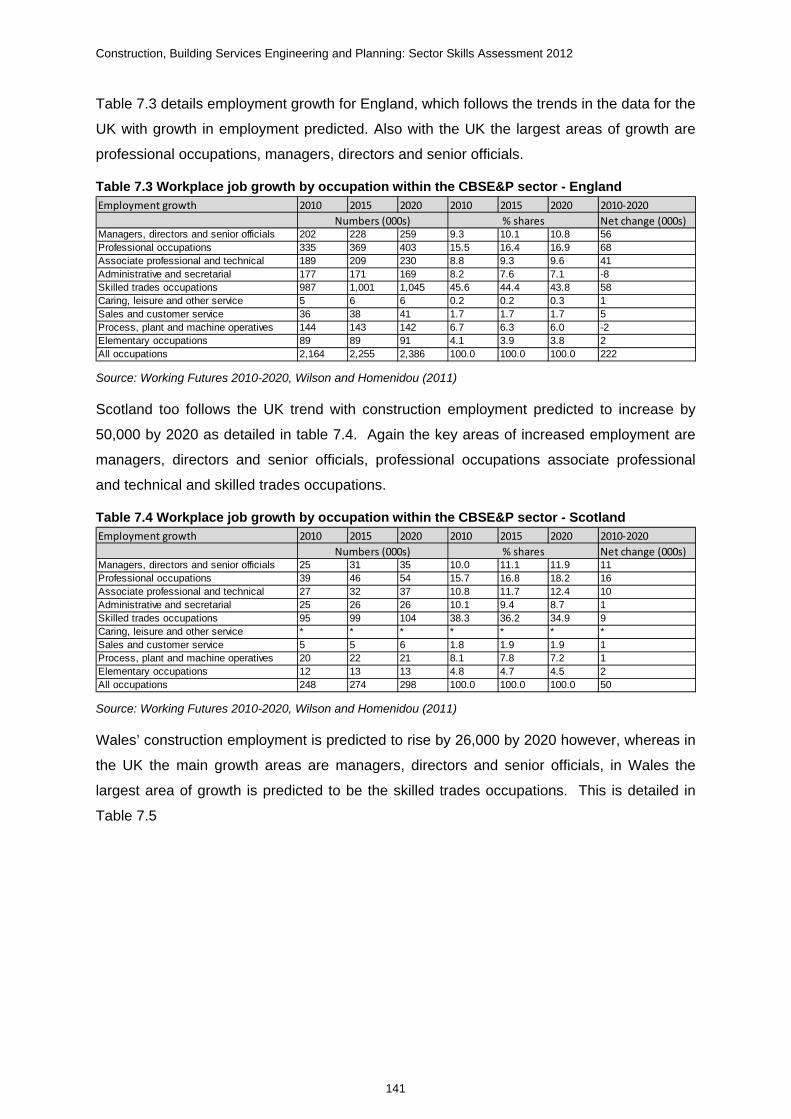
Construction, Building Services Engineering and Planning: Sector Skills Assessment 2012
141
Table 7.3 details employment growth for England, which follows the trends in the data for the
UK with growth in employment predicted. Also with the UK the largest areas of growth are
professional occupations, managers, directors and senior officials.
Table 7.3 Workplace job growth by occupation within the CBSE&P sector - England
Source: Working Futures 2010-2020, Wilson and Homenidou (2011)
Scotland too follows the UK trend with construction employment predicted to increase by
50,000 by 2020 as detailed in table 7.4. Again the key areas of increased employment are
managers, directors and senior officials, professional occupations associate professional
and technical and skilled trades occupations.
Table 7.4 Workplace job growth by occupation within the CBSE&P sector - Scotland
Source: Working Futures 2010-2020, Wilson and Homenidou (2011)
Wales’ construction employment is predicted to rise by 26,000 by 2020 however, whereas in
the UK the main growth areas are managers, directors and senior officials, in Wales the
largest area of growth is predicted to be the skilled trades occupations. This is detailed in
Table 7.5
Employment growth 2010 2015 2020 2010 2015 2020 2010‐2020
Net change (000s)Managers, directors and senior officials 202 228 259 9.3 10.1 10.8 56Professional occupations 335 369 403 15.5 16.4 16.9 68Associate professional and technical 189 209 230 8.8 9.3 9.6 41Administrative and secretarial 177 171 169 8.2 7.6 7.1 -8Skilled trades occupations 987 1,001 1,045 45.6 44.4 43.8 58Caring, leisure and other service 5 6 6 0.2 0.2 0.3 1Sales and customer service 36 38 41 1.7 1.7 1.7 5Process, plant and machine operatives 144 143 142 6.7 6.3 6.0 -2Elementary occupations 89 89 91 4.1 3.9 3.8 2All occupations 2,164 2,255 2,386 100.0 100.0 100.0 222
Numbers (000s) % shares
Employment growth 2010 2015 2020 2010 2015 2020 2010‐2020
Net change (000s)Managers, directors and senior officials 25 31 35 10.0 11.1 11.9 11Professional occupations 39 46 54 15.7 16.8 18.2 16Associate professional and technical 27 32 37 10.8 11.7 12.4 10Administrative and secretarial 25 26 26 10.1 9.4 8.7 1Skilled trades occupations 95 99 104 38.3 36.2 34.9 9Caring, leisure and other service * * * * * * *Sales and customer service 5 5 6 1.8 1.9 1.9 1Process, plant and machine operatives 20 22 21 8.1 7.8 7.2 1Elementary occupations 12 13 13 4.8 4.7 4.5 2All occupations 248 274 298 100.0 100.0 100.0 50
Numbers (000s) % shares

Construction, Building Services Engineering and Planning: Sector Skills Assessment 2012
142
Table 7.5 Workplace job growth by occupation within the CBSE&P sector - Wales
Source: Working Futures 2010-2020, Wilson and Homenidou (2011)
In Northern Ireland employment is predicted to rise by 11,000 by 2020, it follows the pattern
for Wales where the largest area of growth is in the Skilled trade occupations. This is
detailed in Table 7.6.
Table 7.6 Workplace job growth by occupation within the CBSE&P sector – Northern Ireland
Source: Working Futures 2010-2020, Wilson and Homenidou (2011)
7.3 Future Occupational Profile
In addition to employment growth it is also important to understand how the occupational
profile for the sector will change in future years and how CBSE&P compares to the wider UK
view. Table 7.7 shows the workforce profile for the UK economy has a whole and when
comparing this against Table 7.1, shown earlier there are a number of notable points.
Employment growth 2010 2015 2020 2010 2015 2020 2010‐2020
Net change (000s)Managers, directors and senior officials 9 10 12 7.3 7.8 8.3 3Professional occupations 15 17 19 12.1 12.5 13.3 5Associate professional and technical 9 10 11 7.2 7.5 7.9 3Administrative and secretarial 10 11 11 8.4 8.0 7.5 1Skilled trades occupations 59 67 72 49.8 50.0 49.7 13Caring, leisure and other service * * * * * * *Sales and customer service 2 2 3 1.8 1.8 1.7 0Process, plant and machine operatives 11 11 11 9.0 8.3 7.5 0Elementary occupations 5 5 5 4.3 3.9 3.7 0All occupations 120 134 145 100.0 100.0 100.0 26
Numbers (000s) % shares
Employment growth 2010 2015 2020 2010 2015 2020 2010‐2020
Net change (000s)Managers, directors and senior officials 4 5 6 6.0 6.8 7.4 2Professional occupations 7 8 9 9.8 10.6 11.1 2Associate professional and technical 4 4 5 5.2 5.5 5.9 1Administrative and secretarial 5 5 6 7.3 7.2 6.9 1Skilled trades occupations 38 41 43 56.5 55.0 54.3 5Caring, leisure and other service * * * * * * *Sales and customer service * 1 1 * 1.4 1.5 *Process, plant and machine operatives 5 5 6 8.1 7.4 6.9 0Elementary occupations 4 4 4 5.7 5.8 5.6 1All occupations 68 74 79 100.0 100.0 100.0 11
Numbers (000s) % shares
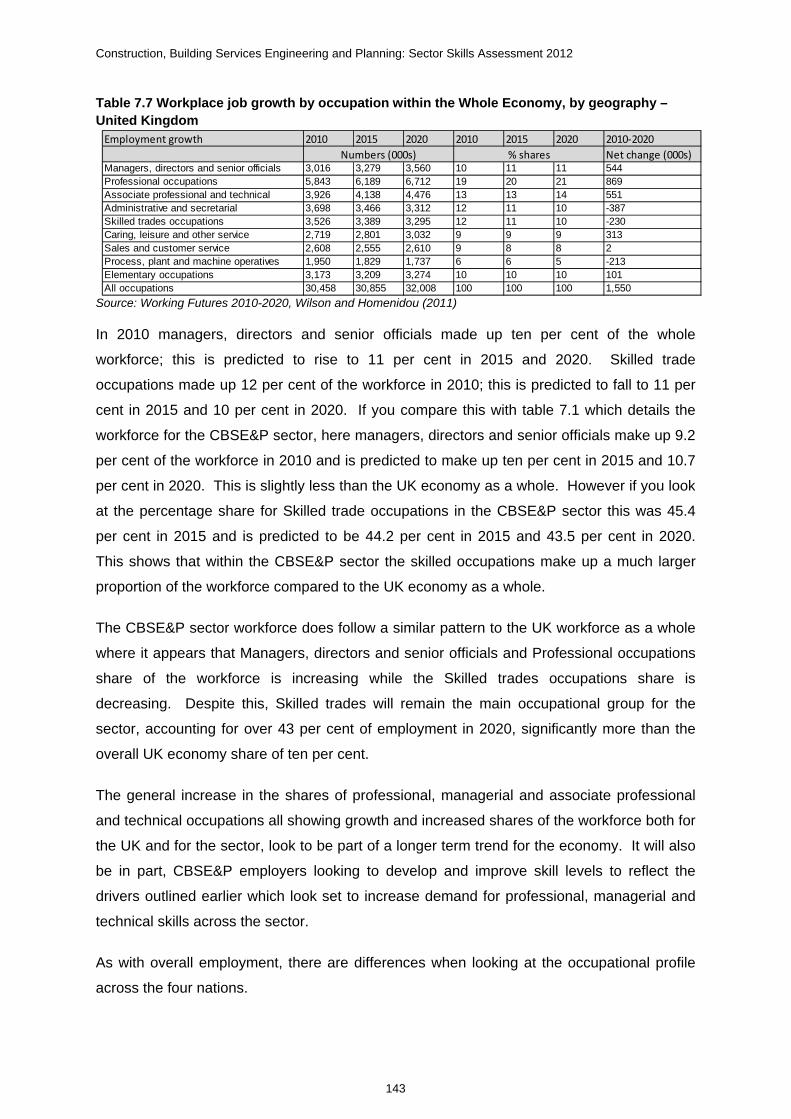
Construction, Building Services Engineering and Planning: Sector Skills Assessment 2012
143
Table 7.7 Workplace job growth by occupation within the Whole Economy, by geography –United Kingdom
Source: Working Futures 2010-2020, Wilson and Homenidou (2011)
In 2010 managers, directors and senior officials made up ten per cent of the whole
workforce; this is predicted to rise to 11 per cent in 2015 and 2020. Skilled trade
occupations made up 12 per cent of the workforce in 2010; this is predicted to fall to 11 per
cent in 2015 and 10 per cent in 2020. If you compare this with table 7.1 which details the
workforce for the CBSE&P sector, here managers, directors and senior officials make up 9.2
per cent of the workforce in 2010 and is predicted to make up ten per cent in 2015 and 10.7
per cent in 2020. This is slightly less than the UK economy as a whole. However if you look
at the percentage share for Skilled trade occupations in the CBSE&P sector this was 45.4
per cent in 2015 and is predicted to be 44.2 per cent in 2015 and 43.5 per cent in 2020.
This shows that within the CBSE&P sector the skilled occupations make up a much larger
proportion of the workforce compared to the UK economy as a whole.
The CBSE&P sector workforce does follow a similar pattern to the UK workforce as a whole
where it appears that Managers, directors and senior officials and Professional occupations
share of the workforce is increasing while the Skilled trades occupations share is
decreasing. Despite this, Skilled trades will remain the main occupational group for the
sector, accounting for over 43 per cent of employment in 2020, significantly more than the
overall UK economy share of ten per cent.
The general increase in the shares of professional, managerial and associate professional
and technical occupations all showing growth and increased shares of the workforce both for
the UK and for the sector, look to be part of a longer term trend for the economy. It will also
be in part, CBSE&P employers looking to develop and improve skill levels to reflect the
drivers outlined earlier which look set to increase demand for professional, managerial and
technical skills across the sector.
As with overall employment, there are differences when looking at the occupational profile
across the four nations.
Employment growth 2010 2015 2020 2010 2015 2020 2010‐2020
Net change (000s)Managers, directors and senior officials 3,016 3,279 3,560 10 11 11 544Professional occupations 5,843 6,189 6,712 19 20 21 869Associate professional and technical 3,926 4,138 4,476 13 13 14 551Administrative and secretarial 3,698 3,466 3,312 12 11 10 -387Skilled trades occupations 3,526 3,389 3,295 12 11 10 -230Caring, leisure and other service 2,719 2,801 3,032 9 9 9 313Sales and customer service 2,608 2,555 2,610 9 8 8 2Process, plant and machine operatives 1,950 1,829 1,737 6 6 5 -213Elementary occupations 3,173 3,209 3,274 10 10 10 101All occupations 30,458 30,855 32,008 100 100 100 1,550
Numbers (000s) % shares

Construction, Building Services Engineering and Planning: Sector Skills Assessment 2012
144
Table 7.8 details employment growth in England for the whole economy and as with the UK
skilled trades percentage share of the whole workforce is much lower than when compared
to the CBSE&P sector as shown in tables 7.1 and 7.3. England also follows the trend in the
UK where the percentage share of the total workforce is increasing for managers and is
decreasing for skilled craft occupations.
Table 7.8 Workplace job growth by occupation within the Whole Economy - England
Source: Working Futures 2010-2020, Wilson and Homenidou (2011)
Table 7.9 details the workplace job growth within the whole economy for Scotland. When
comparing this table with tables 7.1 and 7.4, Scotland follows the UK trend for skilled craft
occupations in the whole economy to have a much lower percentage of the total workforce
then the CBSE&P sector. Also as with the trend in the UK the percentage of managers in
the CBSE&P workforce in Scotland is increasing whilst the skilled craft occupations is falling.
Table 7.9 Workplace job growth by occupation within the Whole Economy –Scotland
Source: Working Futures 2010-2020, Wilson and Homenidou (2011)
Table 7.10 details the workplace job growth within the whole economy for Wales. When
comparing this table with tables 7.1 and 7.5, Wales follows the UK trend for skilled craft
occupations in the whole economy to have a much lower percentage of the total workforce
then the CBSE&P sector. Also as with the trend in the UK the percentage of managers in
the CBSE&P workforce in Wales is increasing whilst the skilled craft occupations is falling.
Employment growth 2010 2015 2020 2010 2015 2020 2010‐2020
Net change (000s)Managers, directors and senior officials 2616 2853 3098 10.1 10.9 11.4 482Professional occupations 4989 5289 5741 19.4 20.2 21.1 752Associate professional and technical 3405 3596 3889 13.2 13.7 14.3 484Administrative and secretarial 3126 2925 2797 12.1 11.2 10.3 -329Skilled trades occupations 2905 2784 2699 11.3 10.6 9.9 -206Caring, leisure and other service 2310 2393 2593 9.0 9.2 9.5 283Sales and customer service 2191 2148 2184 8.5 8.2 8.0 -7Process, plant and machine operatives 1619 1519 1449 6.3 5.8 5.3 -170Elementary occupations 2614 2646 2709 10.1 10.1 10.0 95All occupations 25775 26153 27158 100.0 100.0 100.0 1383
Numbers (000s) % shares
Employment growth 2010 2015 2020 2010 2015 2020 2010‐2020
Net change (000s)Managers, directors and senior officials 222 234 252 8.8 9.3 9.8 31Professional occupations 477 499 536 18.9 19.8 20.8 58Associate professional and technical 289 301 325 11.4 11.9 12.6 35Administrative and secretarial 316 296 279 12.5 11.7 10.8 -37Skilled trades occupations 317 302 293 12.5 12.0 11.4 -24Caring, leisure and other service 191 189 203 7.5 7.5 7.9 13Sales and customer service 215 207 212 8.5 8.2 8.2 -3Process, plant and machine operatives 176 162 150 7.0 6.4 5.8 -26Elementary occupations 325 333 328 12.9 13.2 12.7 3All occupations 2528 2523 2579 100.0 100.0 100.0 51
Numbers (000s) % shares

Construction, Building Services Engineering and Planning: Sector Skills Assessment 2012
145
Table 7.10 Workplace job growth by occupation within the Whole Economy – Wales
Source: Working Futures 2010-2020, Wilson and Homenidou (2011)
Table 7.11 details the workplace job growth within the whole economy for Northern Ireland.
When comparing this table with tables 7.1 and 7.6, Northern Ireland follows the UK trend for
skilled craft occupations in the whole economy to have a much lower percentage of the total
workforce then the CBSE&P sector. Also as with the trend in the UK for the percentage of
managers in the CBSE&P workforce in Northern Ireland is increasing whilst the skilled craft
occupations is falling.
Table 7.11 Workplace job growth by occupation within the Whole Economy – Northern Ireland
Source: Working Futures 2010-2020, Wilson and Homenidou (2011)
7.4 Future Skills Needs
Having looked at the key drivers which could impact on the future skills of the industry, along
with how employment and the occupation profiles may change, an understanding of what
the future skills may be is required. Will there be specific new skills required or will current
skills need adapting to meet the requirements of the economy, the environment, changing
policies and legislation and new and emerging technologies? One of the key future skills
needs will be skills relating to low carbon, energy efficiency measures, in particular the
Green Deal which is due to be implemented from October 2012. Table 7.12 outlines the
main Green Deal Measures and in which sector they belong.
Employment growth 2010 2015 2020 2010 2015 2020 2010‐2020
Net change (000s)Managers, directors and senior officials 108 116 126 8.1 8.6 9.0 18Professional occupations 230 245 265 17.3 18.2 18.9 35Associate professional and technical 139 144 157 10.5 10.7 11.2 18Administrative and secretarial 154 145 138 11.6 10.8 9.9 -15Skilled trades occupations 185 190 192 13.9 14.1 13.7 7Caring, leisure and other service 128 129 140 9.6 9.6 10.0 11Sales and customer service 124 124 136 9.4 9.3 9.7 11Process, plant and machine operatives 105 100 92 7.9 7.4 6.6 -13Elementary occupations 156 151 155 11.7 11.2 11.1 -1All occupations 1330 1344 1401 100.0 100.0 100.0 71
Numbers (000s) % shares
Employment growth 2010 2015 2020 2010 2015 2020 2010‐2020
Net change (000s)Managers, directors and senior officials 70 76 84 8.5 9.1 9.6 13Professional occupations 147 156 171 17.8 18.7 19.6 24Associate professional and technical 92 97 106 11.2 11.6 12.1 13Administrative and secretarial 103 100 97 12.4 12.0 11.2 -6Skilled trades occupations 119 113 111 14.4 13.5 12.8 -8Caring, leisure and other service 90 90 96 10.9 10.7 11.0 6Sales and customer service 77 76 78 9.4 9.1 9.0 1Process, plant and machine operatives 50 47 46 6.0 5.7 5.3 -4Elementary occupations 77 80 82 9.4 9.6 9.4 5All occupations 826 836 870 100.0 100.0 100.0 44
Numbers (000s) % shares
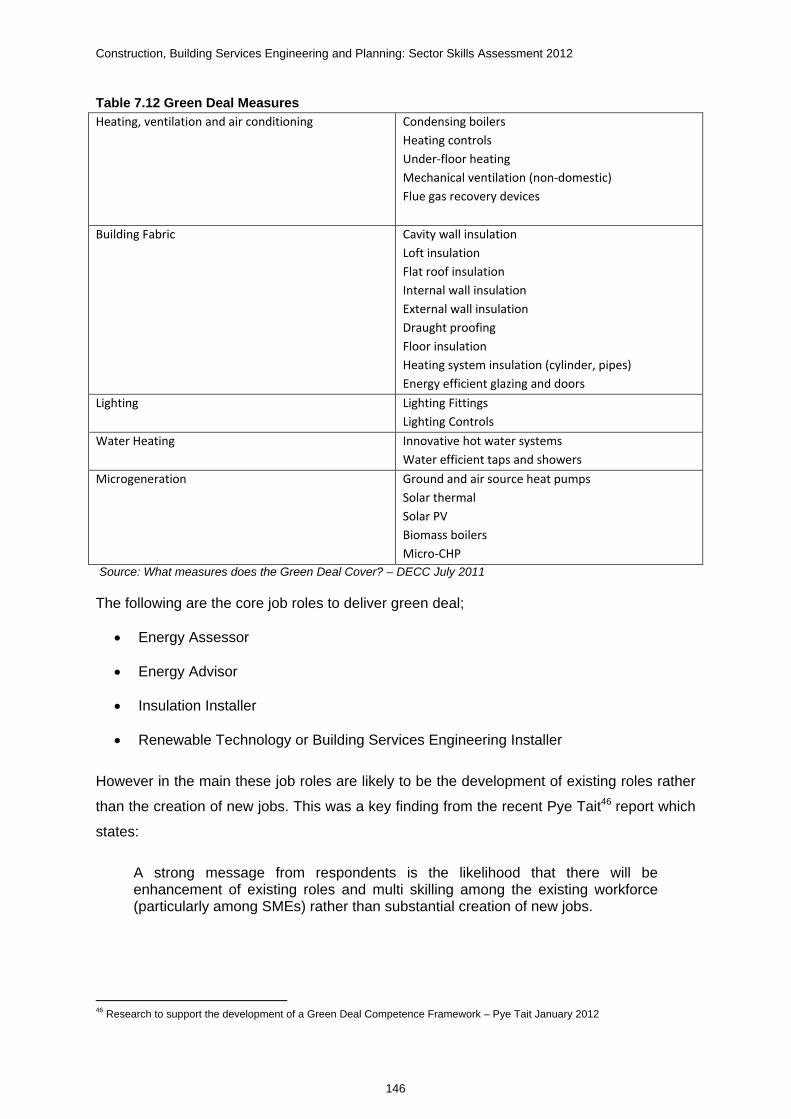
Construction, Building Services Engineering and Planning: Sector Skills Assessment 2012
146
Table 7.12 Green Deal Measures Heating, ventilation and air conditioning
Condensing boilers
Heating controls
Under‐floor heating
Mechanical ventilation (non‐domestic)
Flue gas recovery devices
Building Fabric Cavity wall insulation
Loft insulation
Flat roof insulation
Internal wall insulation
External wall insulation
Draught proofing
Floor insulation
Heating system insulation (cylinder, pipes)
Energy efficient glazing and doors
Lighting Lighting Fittings
Lighting Controls
Water Heating Innovative hot water systems
Water efficient taps and showers
Microgeneration Ground and air source heat pumps
Solar thermal
Solar PV
Biomass boilers
Micro‐CHP
Source: What measures does the Green Deal Cover? – DECC July 2011
The following are the core job roles to deliver green deal;
Energy Assessor
Energy Advisor
Insulation Installer
Renewable Technology or Building Services Engineering Installer
However in the main these job roles are likely to be the development of existing roles rather
than the creation of new jobs. This was a key finding from the recent Pye Tait46 report which
states:
A strong message from respondents is the likelihood that there will be enhancement of existing roles and multi skilling among the existing workforce (particularly among SMEs) rather than substantial creation of new jobs.
46 Research to support the development of a Green Deal Competence Framework – Pye Tait January 2012
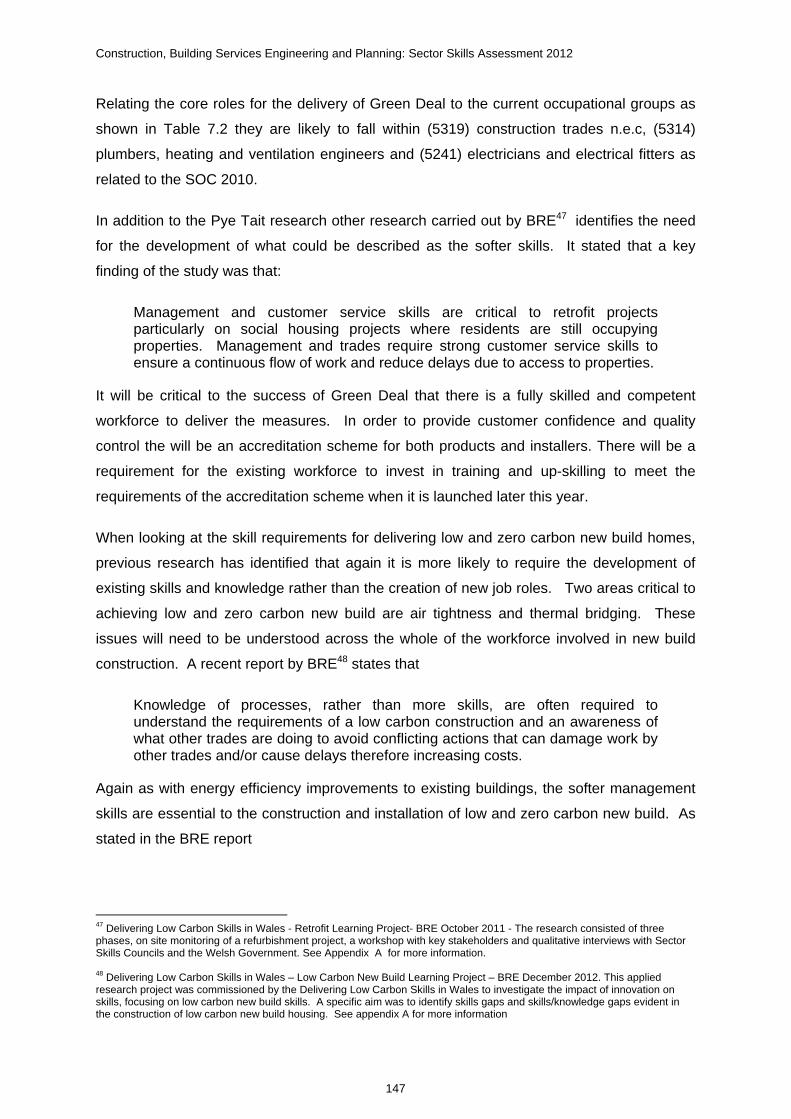
Construction, Building Services Engineering and Planning: Sector Skills Assessment 2012
147
Relating the core roles for the delivery of Green Deal to the current occupational groups as
shown in Table 7.2 they are likely to fall within (5319) construction trades n.e.c, (5314)
plumbers, heating and ventilation engineers and (5241) electricians and electrical fitters as
related to the SOC 2010.
In addition to the Pye Tait research other research carried out by BRE47 identifies the need
for the development of what could be described as the softer skills. It stated that a key
finding of the study was that:
Management and customer service skills are critical to retrofit projects particularly on social housing projects where residents are still occupying properties. Management and trades require strong customer service skills to ensure a continuous flow of work and reduce delays due to access to properties.
It will be critical to the success of Green Deal that there is a fully skilled and competent
workforce to deliver the measures. In order to provide customer confidence and quality
control the will be an accreditation scheme for both products and installers. There will be a
requirement for the existing workforce to invest in training and up-skilling to meet the
requirements of the accreditation scheme when it is launched later this year.
When looking at the skill requirements for delivering low and zero carbon new build homes,
previous research has identified that again it is more likely to require the development of
existing skills and knowledge rather than the creation of new job roles. Two areas critical to
achieving low and zero carbon new build are air tightness and thermal bridging. These
issues will need to be understood across the whole of the workforce involved in new build
construction. A recent report by BRE48 states that
Knowledge of processes, rather than more skills, are often required to understand the requirements of a low carbon construction and an awareness of what other trades are doing to avoid conflicting actions that can damage work by other trades and/or cause delays therefore increasing costs.
Again as with energy efficiency improvements to existing buildings, the softer management
skills are essential to the construction and installation of low and zero carbon new build. As
stated in the BRE report
47 Delivering Low Carbon Skills in Wales - Retrofit Learning Project- BRE October 2011 - The research consisted of three phases, on site monitoring of a refurbishment project, a workshop with key stakeholders and qualitative interviews with Sector Skills Councils and the Welsh Government. See Appendix A for more information. 48 Delivering Low Carbon Skills in Wales – Low Carbon New Build Learning Project – BRE December 2012. This applied research project was commissioned by the Delivering Low Carbon Skills in Wales to investigate the impact of innovation on skills, focusing on low carbon new build skills. A specific aim was to identify skills gaps and skills/knowledge gaps evident in the construction of low carbon new build housing. See appendix A for more information

Construction, Building Services Engineering and Planning: Sector Skills Assessment 2012
148
Professional skills development is of equal importance as trade and installer skills development, with the need for more professionals to acquire key technical skills including the use of technical methodologies such as Standard Assessment Performance (SAP) and thermal bridging.
Adapting to climate change will require a review of techniques, materials and fixings to
ensure that new buildings are weatherproof and robust. Designers will need to able to
consider innovative solutions to ensure buildings are suitable and comfortable for people to
live and work in.
New ways of working on site may need to be adopted which could involve having to manage
the laying of concrete in hotter summers or managing drainage on site in extreme wet
weather. With warmer winters less heating may be required in buildings but if summer heat
is much more extreme passive design features will be important as may be some form of
active cooling. This will still all have to be achieved within the requirement of reducing
carbon emissions.
7.5 How to distinguish between Current and Future Skills Needs
While there are some clear drivers and trends outlined, there is also the question about the
extent that current and future skills requirements can be distinguished. As research
shows49, in 2010 two of the short term drivers were a focus on surviving the recession while
trying to understand potential commercial opportunities across the sector and their
associated costs.
Going into 2012, both of these drivers remain paramount given the limited prospects for
growth in the sector, public sector cuts, sluggish private sector investment and wider
concern over the Eurozone50.
When this is linked to uncertainty about what measures such as Green Deal will deliver in
the future, with aspects of the legislation being worked on at the moment, it makes it very
challenging for employers to be able to clearly separate current and future skills needs.
Current needs are still focused on surviving the recession, and this short term view is a
definite barrier when it comes to planning future skills needs as it requires employers to
make investment decisions on skills at a time when margins are being squeezed and costs
increasing.
49 ConstructionSkills (2010) Understanding the Future Change in Construction 50 ConstructionSkills (2012) Blueprint for UK Construction 2012-2016

Construction, Building Services Engineering and Planning: Sector Skills Assessment 2012
149
Ultimately the changes occurring across the CBSE&P sector should result in a leaner, more
efficient, more productive, multi-skilled workforce with increased cross-sector collaboration.
However before employers are able to realise this there will need to be some stabilisation
and growth within the sector to generate confidence about long term prospects for
investment in future skills needs.

Construction, Building Services Engineering and Planning: Sector Skills Assessment 2012
150
8 Priority areas for action
8.1 Introduction
The Sector Skills Assessment for construction, building services engineering and planning
(CBSE&P) has identified current and likely future trends in the demand for skills and
employment in UK over the coming five to 10 years, using a range of available national data
sources, and supplemented by sectoral research and insight provided by the contributing
Sector Skills Councils.
This final chapter draws together the material analysed so far to set out key strategic areas
for action in the short, medium and long-term. We focus, more specifically, on the
occupations and issues where most attention is required if we are to ensure that the
CBSE&P sector has the necessary skills to play a positive role in delivering economic
growth that underpins UK prosperity over the longer-term. However, the aim of improving
sector performance is not solely to improve economic prosperity, but also to achieve greater
social inclusion and wellbeing. In this respect, we also attempt to reflect on the social
contribution of the sector, specifically its contribution to securing a more sustainable future.
8.2 Priority areas for action
In this final part of the assessment, we seek to identify the skills which are strategic priorities
for action, both currently and in the future. In particular, we focus attention on the most
pressing areas that have been identified in the analysis.
In prioritising the areas for action, we draw on the risk-based approach adopted in Australia
(Skills Australia, 2008). This approach enables us to identify the key occupations, and in turn
related issues, where there are most likely to be important strategic skills needs, which risk
not being effectively met without specific and target intervention. The risk based approach
uses the following criteria:
Degree of certainty – this essentially considers the likelihood of the drivers of the skills
demand materialising, and, the risk of supply failure, with assessments ranging from
‘unknown certainty’ to the outcome being definite. It also includes consideration of the
significance of the skill deficit.

Construction, Building Services Engineering and Planning: Sector Skills Assessment 2012
151
Magnitude – this considers the scale of action required based on the magnitude of skills
needs. Essentially, this is broadly based on the numbers of jobs that need filling, but also
considers the potential number of training interventions required within the current
workforce. Future assessments of magnitude capture total employment and training
demand, and incorporate both replacement demand as well as new jobs. The rating varies
from small to large, with the highest scale covering demand for at least 100,000 workers, the
medium scale for 50,000 to 100,000 workers and the small scale applying where demand is
for less than 50,000 workers.
Lead time – this seeks to assess the length of time taken to rectify the skills deficit. In doing
so, it also considers whether there is an absence of alternative preferred strategies to
overcome the deficit. It deploys categories ranging from short to long term, with: the long
lead time being more than five years, three-five years capturing the medium lead time, and
less than three years applying to the short lead time. This measure includes both the
learning time required for individuals and the set up time for any new training or educational
provision.
Criticality – this seeks to assess the potential risk to economic growth and development
according to:
1 where the opportunity costs of skills deficits could be high to the economy;
2 where the consequences of skills deficits could be high within the sector, even if the
numbers of jobs involved are small.
Thus, some of the likely deficits are about capacity – i.e. insufficient numbers of people with
the necessary skills and knowledge, and others are about capability – the numbers of people
exist, but their skill sets needs to change in order to meet changing needs.
Depending on how these factors combine, each skills deficit is then given an importance
rating or ‘traffic light’ colour, indicating how much of a priority it is for action. The only
weighting given to these factors is whether the opportunity costs of skills deficits could be
high to the economy overall and require immediate action. Where this is most severe it
automatically results in a top priority rating, which is signified with the colour red. More
specifically, the ratings used are:
Red, reflecting skills deficits which are of critical importance to the economy and require
immediate action, either because there are current skills needs already not being met and/or
because lead times are such that early action is required to fully optimise economic growth
potential and avoid deficits in future.

Construction, Building Services Engineering and Planning: Sector Skills Assessment 2012
152
Pink, reflecting skills deficits which are again of critical importance to the economy or a
particular part of the economy or sector, in terms of expansion, survival and/or optimising
returns, but which may be smaller in scale and have a shorter lead time than for those rated
as red.
Amber, reflecting skills deficits which are important to the economy and/or a distinct sector
rather than critical (although the degree of certainty may be less clear and hence the true
impact unknown, where the skills needs are connected to a developing or emerging sector in
the economy). Furthermore, skills deficits are either moderate in scale and/or can be filled in
a medium to short time frame.
Green ratings are not separately identified as these represent areas where generally there is
a better alignment between supply and demand and hence less pressing skills issues
requiring additional action.
Table 8.1 presents a summary of the results of the priorities analysis. The table is organised
under broad skill/occupational priority headings (these are illustrated in the white rows in the
table).
A number of key trends and structural considerations provide the context for the analysis of
skills priorities within the sector:
The CBSE&P sector presents a particular challenge in that it is served by an itinerant
workforce because of the project by project nature of the sector. This is especially the
cases amongst skilled trades, but also applies (albeit to a lesser extent) to professional
services that are the subject of internal transfers within firms, particularly between
international offices. This means that some construction sites – especially large-scale
projects – will draw in workers, usually on a sub contracted basis. These are likely to be
from other parts of the country, or abroad. Indeed, with self-employment representing
over a third (36 per cent) of the available industry labour geographic and occupational
mobility is high.

Construction, Building Services Engineering and Planning: Sector Skills Assessment 2012
153
The flexibility of such a large pool of self-employed labour offers significant financial
advantages to clients. The disadvantage however, is the lack of investment in skills and
qualifications by those who are self-employed. There is a strong tendency for career
progression to lead towards self-employment, particularly in the main construction
trades, where the financial rewards are perceived as being greater. This has obvious
implications on the future training of both the individuals moving to self-employment, and
the ability for the industry to provide sufficient opportunities for those wishing to join the
sector.
Skills and training issues are further complicated by the fact that large parts of the
construction contracting section of the sector is biased towards lower level qualifications
than the overall UK workforce and that employers’ perception of competence is not
necessarily consistent with qualification attainment, particularly in the construction
contracting sub-sector. Of course many parts of the CBSE&P sector are characterised
by relatively high levels of qualifications even amongst skilled trades. For, example
plumbing and heating engineers and electricians generally hold Level 3 qualifications,
although this is driven by a degree of occupational regulation and competent person
schemes. However, for the wider construction contracting sector it is often the case that
time served measures are considered more important and meaningful than
qualifications. Whilst the picture is changing it remains a persistent issue within the
sector and might ultimately represent the most significant barrier to achieving the higher
skills (Level 3 and beyond) goal within the sector more broadly.

Key:
Red – high priority skills needs for immediate action
Pink – high priority skills needs which are of importance rather than critical to the economy and/or distinct sectors but where deficits are smaller in scale and require a shorter lead time to rectify than for those rated red
Amber – medium priority skills needs of moderate scale and/or time frame for action where the degree of certainty of their impact may be less critical
154
Table 8.1 Priority action matrix Skill/occupational priority
Degree of certainty – definite,
likely, possible, unknown?
Magnitude – large,
medium, small? (current
and future)
Lead time –
short/medium/long?
Criticality to
a) the CBSE&P sector
b) UK economy through
GVA and/or job volume?
Management roles
Greater management skills
will be required as firms
need greater flexibility to
operate profitably in a
competitive environment,
and make the best use of the
skills of their current
workforce. This is
particularly the case for Site
Managers
Definite
Significant current as well as
future demand; and current
evidence of deficits e.g. gaps
Future trends accentuate
demand e.g. organisations
expected to need to be
increasingly ‘lean’ and ‘agile’ to
cope with market change,
increasing competition, and
adopt HPW – change
management and leadership key
amongst core management
population
Large
Significant demand for these
skills/jobs
Increase of 30 per cent
between 2010 and 2020
Medium
Critical especially in the sector
as businesses need to operate
more efficiently during
recessionary conditions and
there is a real risk that in the
medium-term, as the industry
begins to recover, there will be
a shortage of skilled managers

Key:
Red – high priority skills needs for immediate action
Pink – high priority skills needs which are of importance rather than critical to the economy and/or distinct sectors but where deficits are smaller in scale and require a shorter lead time to rectify than for those rated red
Amber – medium priority skills needs of moderate scale and/or time frame for action where the degree of certainty of their impact may be less critical
155
Skill/occupational priority
Degree of certainty – definite,
likely, possible, unknown?
Magnitude – large,
medium, small? (current
and future)
Lead time –
short/medium/long?
Criticality to
a) the CBSE&P sector
b) UK economy through
GVA and/or job volume?
Management skills and
capability in exploitation of
general purpose and specific
technologies
Definite/likely
Given rate of on-going
technological change and
its importance as a driver
of business development
etc.
Whilst the type of
technology and its
application very difficult to
predict the current trends
would suggest that
collaborative software and
principles of social
networking
The structure of the
industry (large number of
micro and small
enterprises) may mitigate
Large
Effects potentially pervasive
and large scale given
importance of on-going
technological developments
across economy
Medium
Increasing the number of
manager qualified to level 4
or above is only part of the
solution
Developing management
capability through mix of on-
the-job and off-the-job
development is essential in
terms of gaining practical
experience
Anticipated to be critical to
maximising productivity across
the sector and the UK
economy – job creation
potential unknown
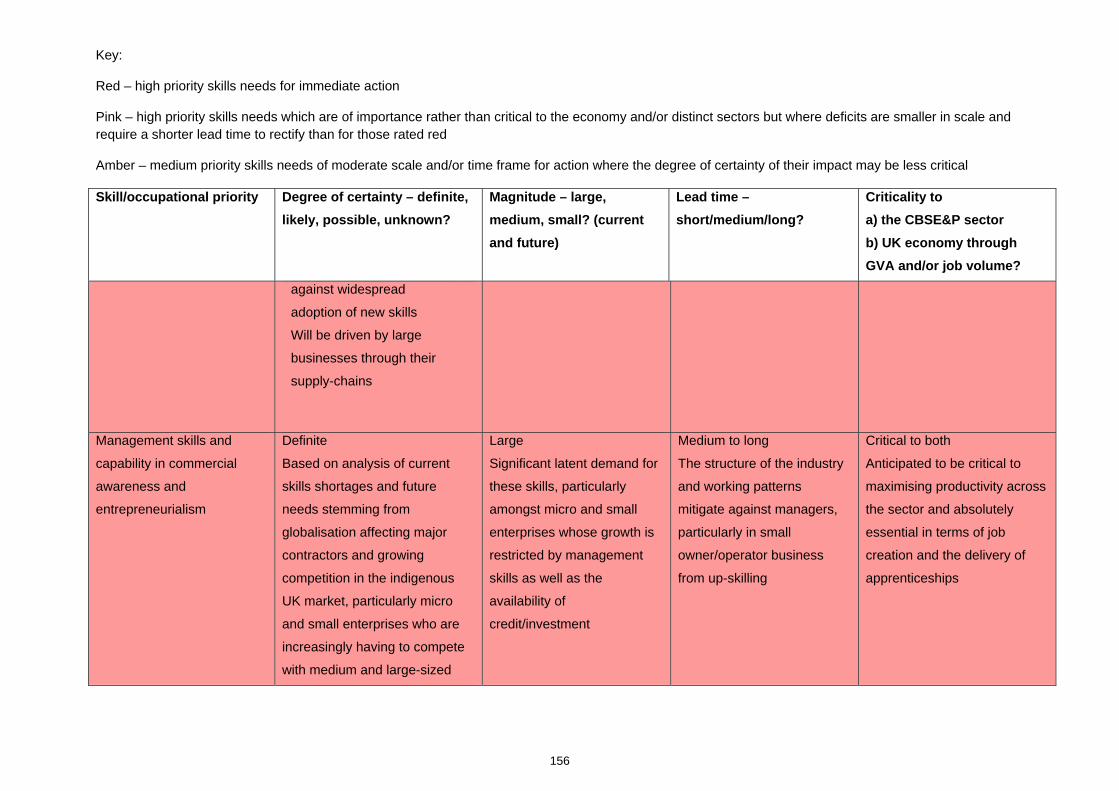
Key:
Red – high priority skills needs for immediate action
Pink – high priority skills needs which are of importance rather than critical to the economy and/or distinct sectors but where deficits are smaller in scale and require a shorter lead time to rectify than for those rated red
Amber – medium priority skills needs of moderate scale and/or time frame for action where the degree of certainty of their impact may be less critical
156
Skill/occupational priority
Degree of certainty – definite,
likely, possible, unknown?
Magnitude – large,
medium, small? (current
and future)
Lead time –
short/medium/long?
Criticality to
a) the CBSE&P sector
b) UK economy through
GVA and/or job volume?
against widespread
adoption of new skills
Will be driven by large
businesses through their
supply-chains
Management skills and
capability in commercial
awareness and
entrepreneurialism
Definite
Based on analysis of current
skills shortages and future
needs stemming from
globalisation affecting major
contractors and growing
competition in the indigenous
UK market, particularly micro
and small enterprises who are
increasingly having to compete
with medium and large-sized
Large
Significant latent demand for
these skills, particularly
amongst micro and small
enterprises whose growth is
restricted by management
skills as well as the
availability of
credit/investment
Medium to long
The structure of the industry
and working patterns
mitigate against managers,
particularly in small
owner/operator business
from up-skilling
Critical to both
Anticipated to be critical to
maximising productivity across
the sector and absolutely
essential in terms of job
creation and the delivery of
apprenticeships

Key:
Red – high priority skills needs for immediate action
Pink – high priority skills needs which are of importance rather than critical to the economy and/or distinct sectors but where deficits are smaller in scale and require a shorter lead time to rectify than for those rated red
Amber – medium priority skills needs of moderate scale and/or time frame for action where the degree of certainty of their impact may be less critical
157
Skill/occupational priority
Degree of certainty – definite,
likely, possible, unknown?
Magnitude – large,
medium, small? (current
and future)
Lead time –
short/medium/long?
Criticality to
a) the CBSE&P sector
b) UK economy through
GVA and/or job volume?
firms that have been forced to
retrench and refocus operations
as a result of the recession
Specific management skills
Managers will need to
acquire new knowledge of
end-to-end processes. This
will require increased need
for BIM trained managers,
but more fundamentally a
greater appreciation of the
whole building process and
the interrelatedness of
processes (i.e. design and
planning through to
construction and
subsequently building
Likely
Based on analysis of trends
to date
The structure of the industry
(large number of micro and
small enterprises) means this
applies in the first instance to
large businesses, but will be
driven down to wider industry
through their supply-chains
Small to medium
Initially restricted to large
businesses and their
extended supply-chains, but
in aggregate more significant
demand, particularly
amongst micro and small
enterprises who lack
exposure to much
construction outside of the
domestic repair and
maintenance sector
Medium to long Critical to ensuring a more
efficient and productive sector,
particularly in the delivery of
very large projects that are
delivered over a long
timeframe and requiring
phased activity (i.e. transport
and energy infrastructure
projects)
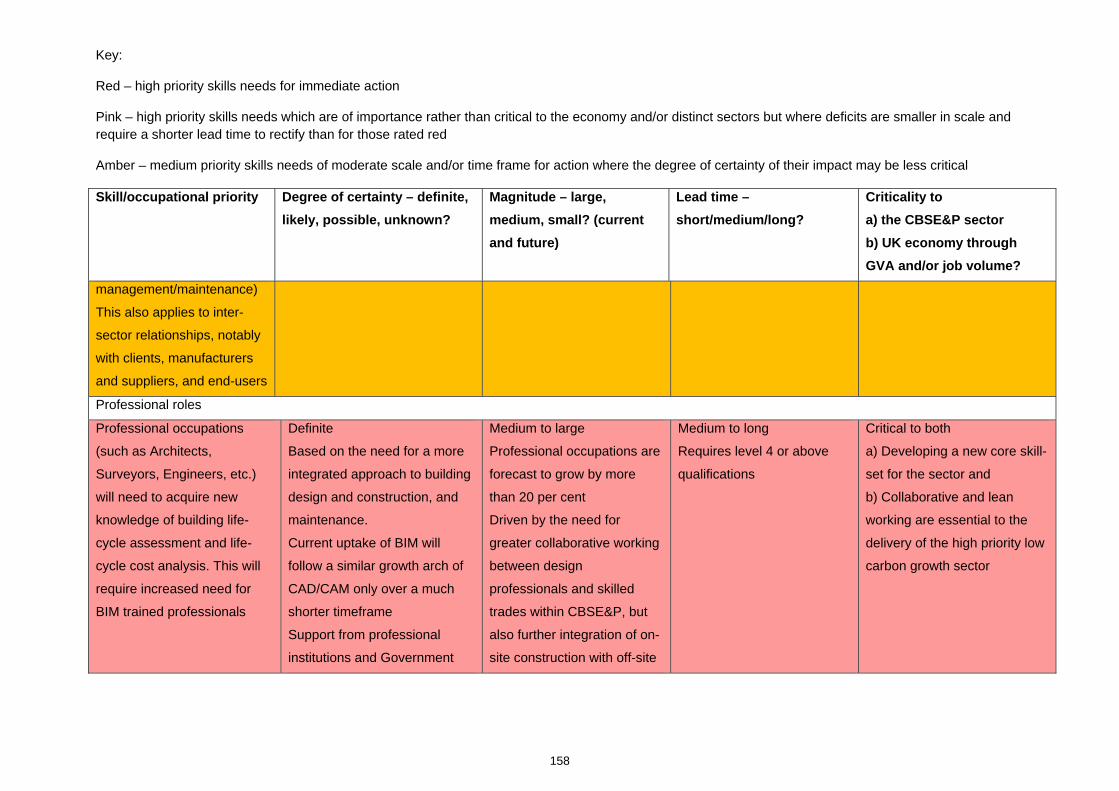
Key:
Red – high priority skills needs for immediate action
Pink – high priority skills needs which are of importance rather than critical to the economy and/or distinct sectors but where deficits are smaller in scale and require a shorter lead time to rectify than for those rated red
Amber – medium priority skills needs of moderate scale and/or time frame for action where the degree of certainty of their impact may be less critical
158
Skill/occupational priority
Degree of certainty – definite,
likely, possible, unknown?
Magnitude – large,
medium, small? (current
and future)
Lead time –
short/medium/long?
Criticality to
a) the CBSE&P sector
b) UK economy through
GVA and/or job volume?
management/maintenance)
This also applies to inter-
sector relationships, notably
with clients, manufacturers
and suppliers, and end-users
Professional roles
Professional occupations
(such as Architects,
Surveyors, Engineers, etc.)
will need to acquire new
knowledge of building life-
cycle assessment and life-
cycle cost analysis. This will
require increased need for
BIM trained professionals
Definite
Based on the need for a more
integrated approach to building
design and construction, and
maintenance.
Current uptake of BIM will
follow a similar growth arch of
CAD/CAM only over a much
shorter timeframe
Support from professional
institutions and Government
Medium to large
Professional occupations are
forecast to grow by more
than 20 per cent
Driven by the need for
greater collaborative working
between design
professionals and skilled
trades within CBSE&P, but
also further integration of on-
site construction with off-site
Medium to long
Requires level 4 or above
qualifications
Critical to both
a) Developing a new core skill-
set for the sector and
b) Collaborative and lean
working are essential to the
delivery of the high priority low
carbon growth sector

Key:
Red – high priority skills needs for immediate action
Pink – high priority skills needs which are of importance rather than critical to the economy and/or distinct sectors but where deficits are smaller in scale and require a shorter lead time to rectify than for those rated red
Amber – medium priority skills needs of moderate scale and/or time frame for action where the degree of certainty of their impact may be less critical
159
Skill/occupational priority
Degree of certainty – definite,
likely, possible, unknown?
Magnitude – large,
medium, small? (current
and future)
Lead time –
short/medium/long?
Criticality to
a) the CBSE&P sector
b) UK economy through
GVA and/or job volume?
manufacture
CBSE&P professionals will
have to learn how to account
for carbon using principles
normally the preserve of
accountants and economists
Definite/Likely
But scale heavily dependent on
speed and scale of growth in
low carbon legislation and
related enforcement
Small to moderate
Growth in professional
occupations is significant, but
delivery may be offset by
activity being delivered by
associate professional
technicians with the CBSE&P
sector or actuaries and
financial professionals from
the Financial, insurance &
other professional services
sector and the Real estate
and facilities management
sector
Medium to long
Requires level 4 or above
qualifications
Critical to both
Essential to the sector and
long-term prosperity of the UK
economy. Carbon accounting
will provide a factual ground
for carbon-related
decision-making.
Associate professional technician roles

Key:
Red – high priority skills needs for immediate action
Pink – high priority skills needs which are of importance rather than critical to the economy and/or distinct sectors but where deficits are smaller in scale and require a shorter lead time to rectify than for those rated red
Amber – medium priority skills needs of moderate scale and/or time frame for action where the degree of certainty of their impact may be less critical
160
Skill/occupational priority
Degree of certainty – definite,
likely, possible, unknown?
Magnitude – large,
medium, small? (current
and future)
Lead time –
short/medium/long?
Criticality to
a) the CBSE&P sector
b) UK economy through
GVA and/or job volume?
Technician roles
Specific skills related to
understanding and
implementation of lean and
agile construction principles
and whole product/process
lifecycle. The widespread
adoption of BIM.
Likely/definite
But dependent on the adoption
of new technologies. Reduced
operating costs resulting from
more efficient on-site working
and less rework might provide
competitive advantage, which
in turn may drive faster
adoption.
BIM will eventually become as
commonplace as CAD.
Medium to large
Professional occupations are
forecast to grow by more
than 25 per cent between
2010 and 2020
but delivery may be offset by
activity being delivered by
associate professional
technicians working in the
Manufacturing sector
Medium to long
Requires level 4 or above
qualifications
Essential to sector
performance and delivery of
UK low carbon targets,
although over the long-term it
may result in a decreasing
demand for skilled trades
In addition to this an
understanding of how new
components will operate over
the life time of a building, off-
site manufacture of
components will require
Likely Medium Medium to long
Requires level 4 or above
qualifications
Critical to both
a) Developing a new core skill-
set for the sector and
b) Collaborative and lean
working are essential to the
delivery of the high priority low
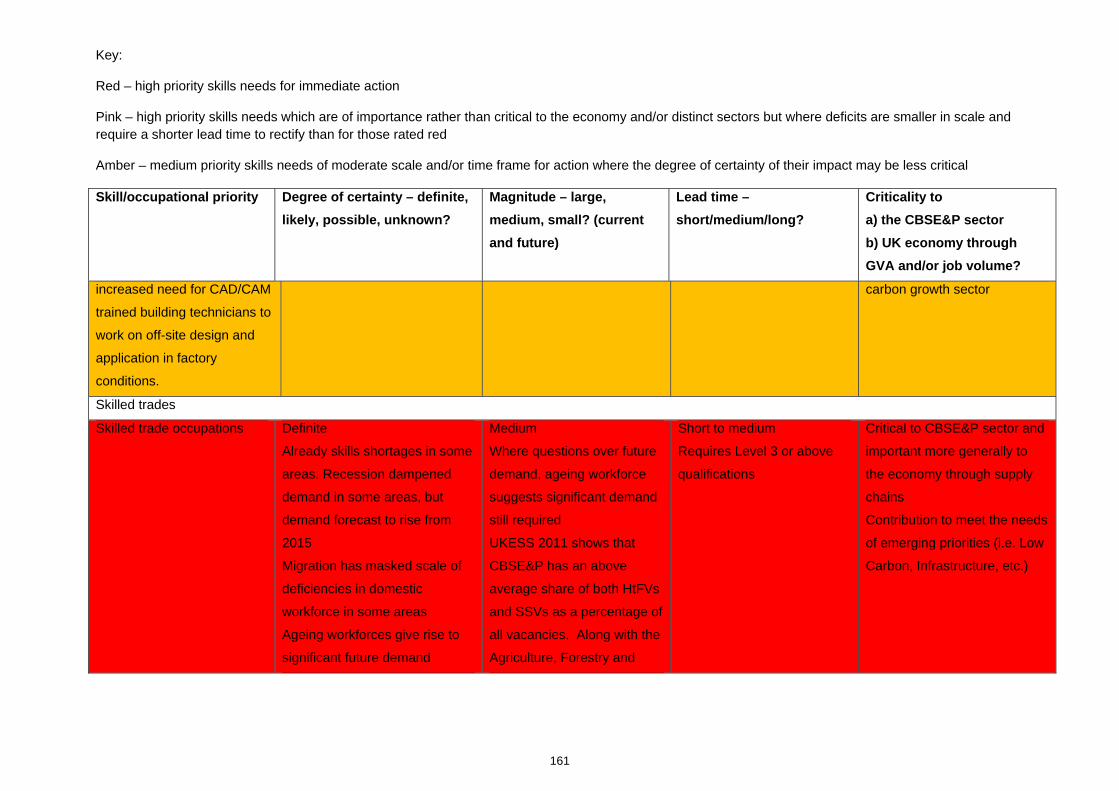
Key:
Red – high priority skills needs for immediate action
Pink – high priority skills needs which are of importance rather than critical to the economy and/or distinct sectors but where deficits are smaller in scale and require a shorter lead time to rectify than for those rated red
Amber – medium priority skills needs of moderate scale and/or time frame for action where the degree of certainty of their impact may be less critical
161
Skill/occupational priority
Degree of certainty – definite,
likely, possible, unknown?
Magnitude – large,
medium, small? (current
and future)
Lead time –
short/medium/long?
Criticality to
a) the CBSE&P sector
b) UK economy through
GVA and/or job volume?
increased need for CAD/CAM
trained building technicians to
work on off-site design and
application in factory
conditions.
carbon growth sector
Skilled trades
Skilled trade occupations Definite
Already skills shortages in some
areas. Recession dampened
demand in some areas, but
demand forecast to rise from
2015
Migration has masked scale of
deficiencies in domestic
workforce in some areas
Ageing workforces give rise to
significant future demand
Medium
Where questions over future
demand, ageing workforce
suggests significant demand
still required
UKESS 2011 shows that
CBSE&P has an above
average share of both HtFVs
and SSVs as a percentage of
all vacancies. Along with the
Agriculture, Forestry and
Short to medium
Requires Level 3 or above
qualifications
Critical to CBSE&P sector and
important more generally to
the economy through supply
chains
Contribution to meet the needs
of emerging priorities (i.e. Low
Carbon, Infrastructure, etc.)
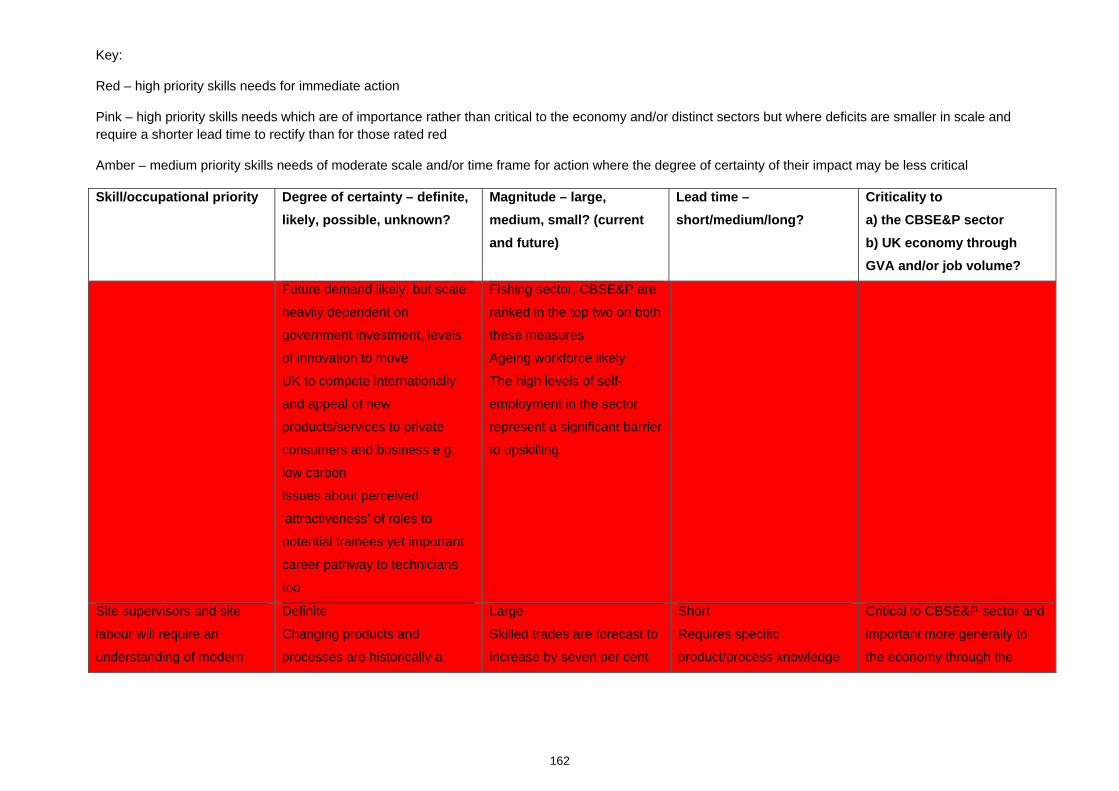
Key:
Red – high priority skills needs for immediate action
Pink – high priority skills needs which are of importance rather than critical to the economy and/or distinct sectors but where deficits are smaller in scale and require a shorter lead time to rectify than for those rated red
Amber – medium priority skills needs of moderate scale and/or time frame for action where the degree of certainty of their impact may be less critical
162
Skill/occupational priority
Degree of certainty – definite,
likely, possible, unknown?
Magnitude – large,
medium, small? (current
and future)
Lead time –
short/medium/long?
Criticality to
a) the CBSE&P sector
b) UK economy through
GVA and/or job volume?
Future demand likely, but scale
heavily dependent on
government investment, levels
of innovation to move
UK to compete internationally
and appeal of new
products/services to private
consumers and business e.g.
low carbon
Issues about perceived
‘attractiveness’ of roles to
potential trainees yet important
career pathway to technicians
too
Fishing sector, CBSE&P are
ranked in the top two on both
these measures
Ageing workforce likely
The high levels of self-
employment in the sector
represent a significant barrier
to upskilling
Site supervisors and site
labour will require an
understanding of modern
Definite
Changing products and
processes are historically a
Large
Skilled trades are forecast to
increase by seven per cent
Short
Requires specific
product/process knowledge
Critical to CBSE&P sector and
important more generally to
the economy through the

Key:
Red – high priority skills needs for immediate action
Pink – high priority skills needs which are of importance rather than critical to the economy and/or distinct sectors but where deficits are smaller in scale and require a shorter lead time to rectify than for those rated red
Amber – medium priority skills needs of moderate scale and/or time frame for action where the degree of certainty of their impact may be less critical
163
Skill/occupational priority
Degree of certainty – definite,
likely, possible, unknown?
Magnitude – large,
medium, small? (current
and future)
Lead time –
short/medium/long?
Criticality to
a) the CBSE&P sector
b) UK economy through
GVA and/or job volume?
terminology, the ability to
read, understand and follow
instructions on new materials
and components.
common feature of the CBSE&P
sector and there is no
suggestion that this will change
moving forward
between 2010 and 2020,
however a significant
proportion of the current
workforce (perhaps as high
as 50 per cent) will need to
acquire new knowledge/skills
in relation to new materials
and components
and
short-duration/manufacturer
training
delivery of Green Deal
Cross-cutting skills
Employability and basic skills
(communication, literacy,
numeracy, team working,
problem-solving)
Particularly important for
skilled trades and
elementary roles
Low carbon retro-fit and
Definite
The presence of basic skills
underpins the acquisition of
specific job-related skills
Current projects to retro-fit
public housing have already
demonstrated the need for such
skills in terms of customer care.
Large
UKESS 2011 shows that
after job-specific/technical
skills the lack of basic skills
(particularly communication
skills and customer handling
skills) form a considerable
component of SSVs in the
Short Critical role to industry to
enhance service quality
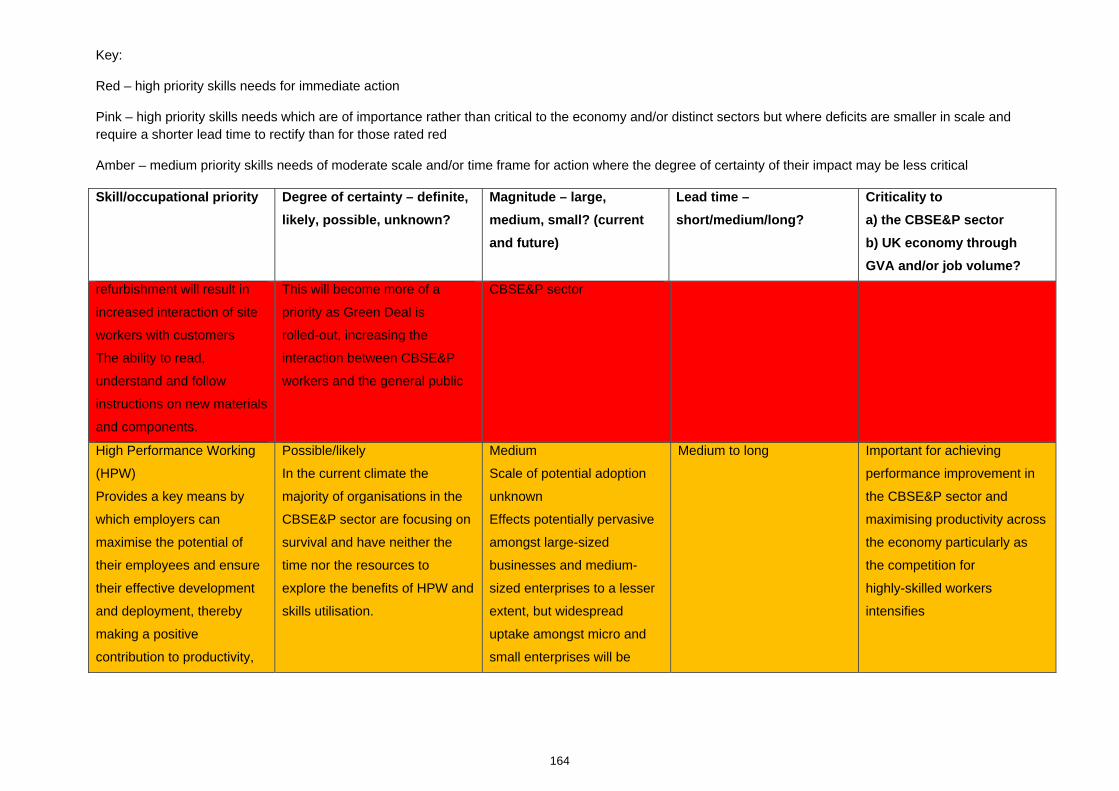
Key:
Red – high priority skills needs for immediate action
Pink – high priority skills needs which are of importance rather than critical to the economy and/or distinct sectors but where deficits are smaller in scale and require a shorter lead time to rectify than for those rated red
Amber – medium priority skills needs of moderate scale and/or time frame for action where the degree of certainty of their impact may be less critical
164
Skill/occupational priority
Degree of certainty – definite,
likely, possible, unknown?
Magnitude – large,
medium, small? (current
and future)
Lead time –
short/medium/long?
Criticality to
a) the CBSE&P sector
b) UK economy through
GVA and/or job volume?
refurbishment will result in
increased interaction of site
workers with customers
The ability to read,
understand and follow
instructions on new materials
and components.
This will become more of a
priority as Green Deal is
rolled-out, increasing the
interaction between CBSE&P
workers and the general public
CBSE&P sector
High Performance Working
(HPW)
Provides a key means by
which employers can
maximise the potential of
their employees and ensure
their effective development
and deployment, thereby
making a positive
contribution to productivity,
Possible/likely
In the current climate the
majority of organisations in the
CBSE&P sector are focusing on
survival and have neither the
time nor the resources to
explore the benefits of HPW and
skills utilisation.
Medium
Scale of potential adoption
unknown
Effects potentially pervasive
amongst large-sized
businesses and medium-
sized enterprises to a lesser
extent, but widespread
uptake amongst micro and
small enterprises will be
Medium to long Important for achieving
performance improvement in
the CBSE&P sector and
maximising productivity across
the economy particularly as
the competition for
highly-skilled workers
intensifies
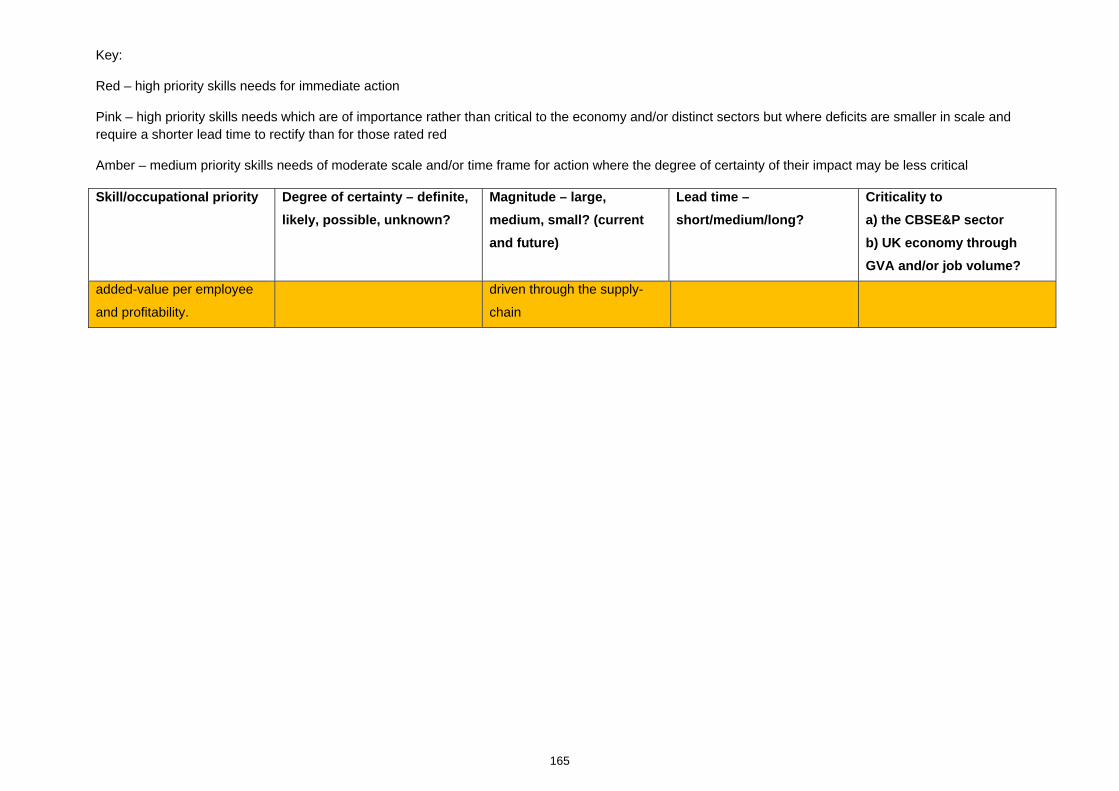
Key:
Red – high priority skills needs for immediate action
Pink – high priority skills needs which are of importance rather than critical to the economy and/or distinct sectors but where deficits are smaller in scale and require a shorter lead time to rectify than for those rated red
Amber – medium priority skills needs of moderate scale and/or time frame for action where the degree of certainty of their impact may be less critical
165
Skill/occupational priority
Degree of certainty – definite,
likely, possible, unknown?
Magnitude – large,
medium, small? (current
and future)
Lead time –
short/medium/long?
Criticality to
a) the CBSE&P sector
b) UK economy through
GVA and/or job volume?
added-value per employee
and profitability.
driven through the supply-
chain

166
8.3 Conclusions
Reflecting on the evidence-base and areas for priority action, at least five key messages
emerge from this assessment:
Understanding and anticipating skills needs requires detailed intelligence
The need for relevant and accessible Labour Market Intelligence (LMI) is paramount in
helping sector stakeholders understand the current situation and plan for the future. The
production of this assessment has not only involved the compilation and analysis of existing
research, it has also involved limited consultation with industry and stakeholders. What has
emerged is that stakeholders need and demand sector specific LMI at much more granular
level than even this assessment provides. This is particularly true of the Devolved
Administrations. Certainly there is a need for a common methodology for collating, analysing
and disseminating LMI, but comparability with other sectors is not paramount for all sector
stakeholders, and this is particularly true for employers. Sector Skills Councils (SSCs) have
a pivotal role in the delivery of detailed sector specific LMI.
Performance matters
The CBSE&P sector plays a pivotal role in the UK economy in terms of delivering and
enabling significant levels of employment and strong economic output over the long-term.
However, there is a body of evidence that suggests productivity in the sector lags behind
other areas of the economy and compares poorly with other countries, particularly the United
States. Recent research suggests that most companies in the construction industry do not
recognise productivity as a priority; mainly because it is poorly understood. Nevertheless,
research with the employers on this issue over the past 10 years very much supports the link
between skills and productivity. Indeed, employees’ skills can have dramatic impact on
levels of performance in term of the volume and quality of output. However, it also highlights
challenges in terms of establishing robust benchmarks that link the operational performance
of businesses in the sector with macro indicators that allow consistent and meaningful
sectoral and international comparisons.
Whilst there has been over the last decade a major drive to fix the problems by changing the
way the industry operates there remains a need to support employer and industry
competitiveness through up-skilling and improved levels of health, safety, competence and
efficiency.

167
New markets present new opportunities
Responding to the Low Carbon challenge is fundamental to the future success of the
CBSE&P sector. There is a need to clearly articulate the skills that will be needed and
whether these sit within existing frameworks or where new frameworks need to be
developed. Increased demand for specialist, technical and professional skills to meet high
specification and low carbon requirements.
This assessment highlights the growing importance of professionals and technicians, driven
by growing technological complexity. This calls for vocational knowledge and workers with
the ability to apply an in-depth understanding of a particular (often technical) field in a
practical setting. This, in turn, places a growing emphasis on strengthening the intermediate
vocational career pathways (from Level 3) to ensure that the skill requirements for these jobs
can be met and people can progress into these areas, perhaps from other related sectors
(such as manufacturing) and through higher apprenticeships.
The present shapes the future
Like most sectors of the UK economy CBSE&P has an aging workforce. It has also suffered
as a result of the recession, particularly in respect of large scale redundancies. Whilst many
employers have striven to retain skilled staff and preserve capacity for the upturn, typically
through reduced working hours, key skills have undoubtedly been lost through the significant
numbers leaving the industry through redundancy and retirement. This could undermine the
long-term stability of the sector in two ways. Firstly, there is significant excess capacity to be
made up before future growth leads to increases employment. Secondly, the pool of
unemployed workers will impact youth recruitment in an upturn as employers will typically
seek out experienced workers before those without. Whilst the sector has been suffering the
effects of the recession the numbers of young people coming through training has remained
relatively buoyant, thus creating an oversupply of aspiring new entrants. The challenge on
youth recruitment is to keeping the pipeline of talented new entrants flowing. This means
creating opportunities for young people to join the sector whilst simultaneously promoting the
sector to potential entrants. The ageing workforce and associated decline in the number of
15 to 24 year olds also means that we will increasingly be dependent in the future on up
skilling older workers already in the labour market to meet our skills needs.
Skills and training matter
Asking employers themselves about skill shortages and gaps is a vital means of identifying
skill deficiencies. However, measuring skill shortages, in particular, is not straightforward
168
and there are other important indicators of ‘shortage’. The SSV and HtfV measures used in
the UK Commission’s Employer Skills Survey (UK Commission’s ESS) (Davies et al, 2012)
suggests that compared with other sectors CBSE&P has an above average share of both
Hard to Fill (HTF) Vacancies and Skill Shortage Vacancies (SSV), as a percentage of all
vacancies, although the incidence of skill shortages as employers perceive them has
decreased significantly across the construction industry and is currently not considered a
constraint on activity. However, it does raise other questions about the accuracy and validity
of such measures. Research commissioned by ConstructionSkills has indicated that the
contracting sector's perception of a skills shortage is not always consistent different from that
conveyed by national skills surveys. In such surveys vacancies are regarded as a skills
shortage vacancy if there are a low number of applicants with the required skills; applicants
lack work experience; and applicants lack qualifications. However, it is often the case that
when construction industry employers talk of skills shortages they refer to quite specific and
short-run recruitment difficulties. These include not being able to get a particular trade on-
site for a period on a self-employed basis rather than not being able to recruit an actual
vacancy. The situation is similar for architects and other professionals (particularly the
smaller firms), many of whom are working at the limits of their capacity – providing lead
times for those who want to engage their services. In neither case does this constitute a
skills shortage.
Accepting though that there are certain skills deficiencies within the sector the challenge is
keeping in close contact with employers so that we understand their skills needs and shape
solutions accordingly.

169
Appendix A: Technical Appendix
i. Summary
This report was written by ConstructionSkills Research Team (as detailed in section vii),
each member of the team was assigned parts of the report (based on their specialist areas
or particular pieces of research they were project managing) which they would be
responsible for researching and writing.
The core data provided by the UK Commission (LFS data, ONS data, Working Futures etc.)
provided a starting point for analysis of the basic characteristics of the sector. This data was
examined for trends, patterns, similarities, comparisons and anomalies, and also quality
checking based on statistical analysis and industry knowledge. Once this data had been
analysed other research (existing industry/sector research and ConstructionSkills primary
research) was used to supplement this data and turn it into intelligence, explaining
trends/abnormalities etc. and identifying where action needs to be taken. The team held
regular meetings to discuss the SSA and any issues that arose, this approach ensured that
all members of the team were included in discussions and aware of decisions made as well
as enabling us to track progress and content of the report. Once all of the sections where
written they were combined to produce the full report.
Each member of the team carried out quality assurance checks on all of the data they used
in the report to ensure that it met the robustness requirements given by the UK Commission,
as detailed in section viii.
ii. Data Collection - Literature Review
In addition to the systematic analysis of official data ConstructionSkills has investigated
numerous available sources of information regarding skills and employment issues,
including nationally available data from the various national skills surveys, Government
departments, acts and reports, and public policy forums. This has been further
supplemented with extensive searches of market reports, news feeds and opinion pieces.
Whilst these searches provide much useful information, it tends to be background material
or in some cases lacks the desired currency. For this reason ConstructionSkills regularly
consults with industry commentators and recognised experts in the field of economic
forecasting and futures thinking. Consequently, for the production of this report the desk-

170
based review was widened to include interview consultations and personal communications
with relevant individuals.
ConstructionSkills also consulted with a number of stakeholders and employers via the
Construction Skills Network (CSN) Observatories, which were being undertaken during
October and November in parallel with the production of this assessment. This consultation
allowed ConstructionSkills to test scenarios, gauge current levels of activity within the sector,
and reality check anecdotal information. The Observatories provide a number of benefits not
least gathering employer reaction on current and future issues.
iii. Data Collection – Primary Data
In recognising there is already a wealth of existing labour market and skills information
ConstructionSkills’ primary focus is, first, to pool, interrogate and synthesise the existing
research and literature to learn as much as possible from the current knowledge base. Only
then does ConstructionSkills undertake new primary research, in areas where gaps have
been identified and current information is inadequate and/or needs up-dating. In this sense
ConstructionSkills seeks to achieve an appropriate balance between fully exploiting existing
evidence and undertaking new research.
ConstructionSkills undertakes a comprehensive annual programme of primary research
designed to supplement and expand on the existing evidence-base and information that
might be gleaned from secondary sources. The programme of research comprises projects
based on identified needs with priority given to more strategic issues having a wide impact.
ConstructionSkills’ primary research can be divided into four main categories of activity:
Employer skills surveys focussing on both current and future skills needs.
Forecasts of labour and skill requirements
Consultation with employers and other stakeholders on key issues and priorities, such
as economic, demographic and technological change.
Evaluation and benchmarking of sector performance.
Details of the primary research sources utilised in the production of the Skills Assessment
are presented in section vi. This provides further details on the sources used in the
compilation of this report together with specific methodological detail, including sample size
and coverage.

171
iv. Data Collection - The provision of core data
To ensure consistency and comparability across all 15 SSA reports, data from core labour
market information sources was centrally collected, processed and formatted. It was then
distributed by the UK Commission to Sector Skills Councils for inclusion within the reports.
Core data was centrally produced from the following sources:
The Labour Force Survey
The UK Commission’s Employer Skills Survey 2011
Working Futures 2010-2020
Regional Accounts (information on Gross Value Added)
Mid-Year Population Estimates
European Continuing Vocational Training Survey
Business Demography Statistics
Data from the Labour Force Survey, regional accounts and mid-year population estimates
was collated, processed and formatted by Cambridge Econometrics and the Institute for
Employment Research (IER), Warwick.
Data from the UK Commission’s Employer Skills Survey 2011 was collated and processed
by IFF Research and formatted by the UK Commission.
Data from Working Futures was collated, processed and formatted by IER.
Data from the European Continuing Vocational Training Survey and Business Demography
Statistics was collated, processed and formatted by the UK Commission.
All data was quality assured by contractors, the UK Commission and by Sector Skills
Councils.
It has been necessary to suppress some data within the reports to adhere to official
guidelines regarding data quality. The details of suppression strategies applied to data from
specific sources are described in more detail below. Data for Scotland, Wales and Northern
Ireland for the three smallest SSA sectors is most likely to be suppressed. These are:
Agriculture, forestry and fishing
Energy production and utilities

172
Information and communication technologies.
v. Methodology for Core data supplied by the UK Commission
Method used to derive estimates of gross value added (GVA) per employee job by
SSA sector and nation
No official estimates are currently available for the level of productivity by sector and UK
nation. The figures presented in this report have therefore been estimated by the UK
Commission using the following process.
Levels of workplace gross value added at current basic prices by SIC 2007 Section were
derived from the official estimates published by the Office for National Statistics as part of its
Regional Accounts series. Levels of employee jobs were taken from the Business Register
and Employment Survey for 2009.
The sectoral “footprint” definitions used as the basis for the SSA reports are not coterminous
with SIC Sections, however, and in some cases draw on 2-digit SIC divisions. At present
the official GVA estimates for nations and regions are only available at a SIC section level.
To overcome this an approach was adopted which has been developed by Welsh
Government to derive gross value added estimates for its priority sectors. This approach
was applied to the UK and all four nations. Approximate estimates of GVA at 2-digit level
are available for much of the economy from the Annual Business Survey (ABS). These
were used to allocate GVA at the 2-digit level with the results being constrained to the official
GVA totals by SIC section taken from the Regional Accounts. For those areas of the
economy not covered by the ABS, shares of employment at the 2-digit level were used
instead, taken from the Annual Population Survey.
173
Labour Force Survey
About the survey
One of the key data sources used within this report is the Office for National Statistics’
(ONS) Labour Force Survey (LFS). The LFS is a survey of households living at private
addresses (plus in NHS accommodation and student halls of residence) in the UK.
The survey is carried on a quarterly basis. The sample is made up of around 41,000
responding (or imputed) households in Great Britain every quarter, and around 1,600
households in Northern Ireland. The LFS uses a rotational sampling design which means
that, once selected; a household is kept in the sample for a total of five consecutive quarters.
Interviewers can take answers to questions by proxy if a respondent is unavailable. This is
usually from another related adult who is a member of the same household. About a third of
LFS responses are collected by proxy. Information on individuals aged 16 – 19 most likely
to be obtained by proxy.
Full user guidance can be accessed here: http://www.ons.gov.uk/ons/guide-method/user-
guidance/labour-market-statistics/index.html
Preparation of LFS data for this report
The UK Commission provided report authors with a core set of tables based on LFS data for
mandatory inclusion within Sector Skills Assessment reports. The data within these tables
was prepared by two contractors: Cambridge Econometrics (CE) and Warwick Institute for
Employer Research (IER).
Data was prepared in three stages:
3 The original survey data was gathered and coded by IER to the categories and
classifications required for the SSA tables. This was then sent to CE
4 CE used the data prepared by IER and derived the indicators and aggregated the data to
the dimensions required for the tables
5 The UK Commission checked tables and distributed to report authors
Annual data presented within this report is based on an average of four consecutive quarters
of data. Data prior to 2009 is based on SIC2003 and data for 2009 and 2010 is based on
SIC2007 codes.

174
Reporting of LFS data
In line with ONS convention, annual LFS data presented within this report has been
suppressed if individual cell sizes fall below 6,000. This is because cell sizes of fewer than
6,000 are deemed to be low quality estimates.
Analysis of employment uses all four categories of employments status within the LFS:
employee, self-employed, government scheme & unpaid family worker.
Please note: some tables present a total for All sectors while others present a total for Whole
economy. The values for these totals are different because the Whole economy total
includes the ‘Not within scope’ category (i.e. sectors that don’t fall within an SSA sector),
whereas All sectors is the total for just the 15 SSA sectors.
UK Commission’s Employer Skills Survey 2011
The UK Commission’s Employer Skills Survey 2011 (UK Commission’s ESS 11) was the
first large-scale economy-wide employer skills survey to be conducted across the whole of
the UK. The survey was managed by the UK Commission for Employment and Skills and
was conducted by three contractors: IFF Research, BMG Research and Ipsos Mori (Davies
et al, 2012). The project steering group included representatives from all four nation
governments, the Alliance of Sector Skills Councils, the Department for Work and Pensions
and the Skills Funding Agency.
Fieldwork was carried out from March to July 2011. Two waves of interviews were
conducted. The main survey involved telephone interviews with approximately 87,600
employers and a follow-up survey focusing on investment in training was undertaken with
over 11,000 respondents. The data presented within this report draws only on information
gathered from the main survey.
The table below provides information on the number of employers interviewed by sector and
nation for the main survey.
SSA sector England Scotland Wales NI UK Agriculture, forestry and fishing 1,270 99 133 45 1,547Energy production and utilities 1,306 106 133 69 1,614Manufacturing 6,774 182 470 350 7,776Construction 7,538 300 660 463 8,961Wholesale and retail trade 13,919 333 1,129 769 16,150Transportation and storage 4,078 152 300 205 4,735Accommodation, food and tourism activities 9,630 324 909 455 11,318Information and communication 2,262 56 111 81 2,510
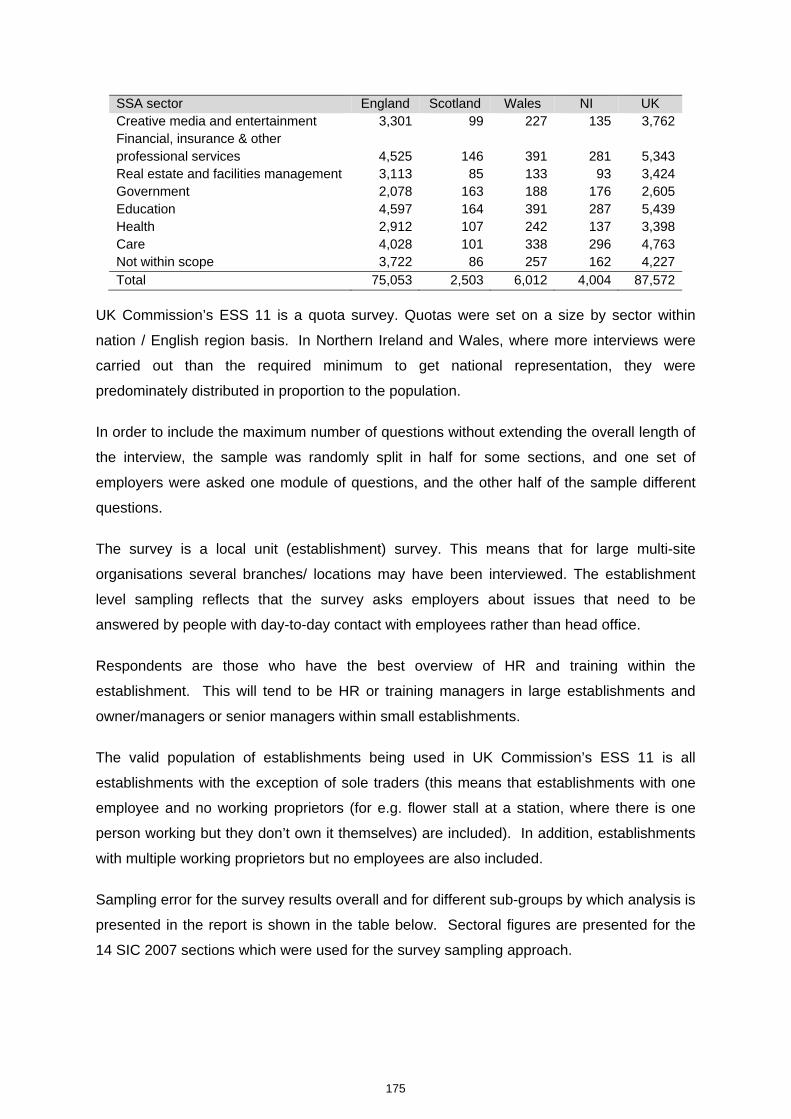
175
SSA sector England Scotland Wales NI UK Creative media and entertainment 3,301 99 227 135 3,762Financial, insurance & other professional services 4,525 146 391 281 5,343Real estate and facilities management 3,113 85 133 93 3,424Government 2,078 163 188 176 2,605Education 4,597 164 391 287 5,439Health 2,912 107 242 137 3,398Care 4,028 101 338 296 4,763Not within scope 3,722 86 257 162 4,227Total 75,053 2,503 6,012 4,004 87,572
UK Commission’s ESS 11 is a quota survey. Quotas were set on a size by sector within
nation / English region basis. In Northern Ireland and Wales, where more interviews were
carried out than the required minimum to get national representation, they were
predominately distributed in proportion to the population.
In order to include the maximum number of questions without extending the overall length of
the interview, the sample was randomly split in half for some sections, and one set of
employers were asked one module of questions, and the other half of the sample different
questions.
The survey is a local unit (establishment) survey. This means that for large multi-site
organisations several branches/ locations may have been interviewed. The establishment
level sampling reflects that the survey asks employers about issues that need to be
answered by people with day-to-day contact with employees rather than head office.
Respondents are those who have the best overview of HR and training within the
establishment. This will tend to be HR or training managers in large establishments and
owner/managers or senior managers within small establishments.
The valid population of establishments being used in UK Commission’s ESS 11 is all
establishments with the exception of sole traders (this means that establishments with one
employee and no working proprietors (for e.g. flower stall at a station, where there is one
person working but they don’t own it themselves) are included). In addition, establishments
with multiple working proprietors but no employees are also included.
Sampling error for the survey results overall and for different sub-groups by which analysis is
presented in the report is shown in the table below. Sectoral figures are presented for the
14 SIC 2007 sections which were used for the survey sampling approach.

176
Figures have been based on a survey result of 50 per cent (the ‘worst’ case in terms of
statistical reliability), and have used a 95 per cent confidence level. Where the table
indicates that a survey result based on all respondents has a sampling error of +/- 0.32 per
cent, this should be interpreted as follows: ‘for a question asked of all respondents where the
survey result is 50 per cent, we are 95 per cent confident that the true figure lies within the
range 49.68 per cent to 50.32 per cent’.
As a note, the calculation of sampling error has taken into account the finite population
correction factor to account for cases where we are measuring a significant portion of the
population universe (i.e. even if two sample sizes are the same, the sampling error will be
lower if in one case a far higher proportion of the population was covered).
These confidence intervals are based on the assumption of a normal distribution of
responses.
Sampling error (at the confidence 95 per cent level) associated with findings of 50 per cent
Population Number of interviews
(Maximum) Sampling
Error Overall 2,299,921 87,572 +/-0.32 By country England 1,960,298 75,053 +/-0.35
Northern Ireland 65,559 4,004 +/-1.5
Scotland 175,114 2,503 +/-1.94
Wales 98,950 6,012 +/-1.22 By size of establishment 1-4 1,466,397 18,955 +/-0.99
5-24 648,446 47,770 +/-0.61
25-99 147,319 15,951 +/-1.03
100-249 25,945 3,270 +/-2.27
250+ 11,814 1,626 +/-3.12 By sector Agriculture 98,458 939 +/-3.18 Mining & Quarrying 2,222 188 +/-6.84 Manufacturing 128,255 7,704 +/-1.08 Electricity, Gas and Water 10,583 1,426 +/-3.35 Construction 241,429 6,654 +/-1.18 Wholesale and Retail 441,365 15,340 +/-0.78 Hotels & Restaurants 167,215 8,471 +/-1.04 Transport and Communications 210,801 7,885 +/-1.08 Financial Services 52,381 1,881 +/-2.22 Business Services 551,612 14,488 +/-0.80 Public Administration 26,058 1,617 +/-2.36 Education 65,499 5,439 +/-1.27 Health and Social Work 140,269 8,161 +/-1.05 Community, Social and Personal Services
163,774 7,379 +/-1.11
177
Looking specifically at sampling error for SSA sectors at national level, Agriculture in
Scotland provides an illustrative example. 99 interviews were completed for this sub-group.
Applying the assumptions outlined above, this gives a maximum sampling error of around +/-
10 percentage points. This demonstrates the indicative nature of the detailed survey
estimates for smaller sectors.
Within the report, data based on unweighted bases of less than 25 have therefore been
suppressed for quality reasons. In addition, data based on unweighted bases of between 25
and 50 have been marked as indicative. More stringent thresholds have been applied in
Scotland because of the lower total number of interviews that were conducted than in other
nations. Estimates based on unweighted bases of fewer than 50 have been suppressed,
whilst estimates based on bases of 50-99 are marked as indicative in the relevant tables.
Finally, occupations within the survey are defined by 2010 Standard Occupational
Classification codes and sectors are defined by 2007 Standard Industrial Classification
codes.
Please visit the UK Commission’s Employer Surveys website for further information
including the full survey report and questionnaire. https://ness.ukces.org.uk/default.aspx
Working Futures
Working Futures 2010-2020 (Wilson and Homenidou, 2011) is the latest in a series of
detailed projections of UK employment, productivity, labour supply and skills. The
projections have been prepared by the Institute for Employment Research (IER) and
Cambridge Econometrics (CE) on behalf of the UK Commission for Employment and Skills
(UK Commission).
The projections are calculated from a number of different data sources, including the Annual
Business Inquiry, the Business Register and Employment Survey, and the Labour Force
Survey. The results provide a picture of employment prospects up to 2020 by industry,
occupation, qualification level, gender and employment status for the UK as a whole, the
four nations, and English regions.
178
As with all projections and forecasts, the results presented in Working Futures should be
regarded as indicative of likely trends and orders of magnitude given a continuation of past
patterns of behaviour and performance, rather than precise forecasts of the future. At a time
of great uncertainty about the short to medium term prospects for the economy, it is
important to stress the value of Working Futures in aiding understanding of likely prospects
for employment in the longer term (i.e. in 2020). Readers should therefore focus on the
relative position of sectors, and occupations in 2020 and treat the projected values as broad
indicators of scale rather than exact predictions.
Further methodological details can be found on the UK Commission’s website -
http://www.ukces.org.uk/publications/working-futures-technical-report
vi. Data Collection – Primary Research Methodologies
BRE, Delivering Low Carbon Skills in Wales, Retrofit Learning Project (October 2011)
The aims and objectives of the research were to investigate the impact of retrofitting existing
homes on skills needs. In particular it sought to identify the skills shortages and skills and
knowledge gaps in delivering energy improvements to social housing stock in Wales. It was
delivered by BRE.
Sample Frame and Sample Size
The research consisted of three phases, on site monitoring of a refurbishment project which
involved fitting of new heating systems, including solar panels and air source heat pumps
and external wall insulation, a workshop with key stakeholders and qualitative interviews
with Sector Skills Councils and the Welsh Government.
Sample Strategy

179
The onsite monitoring process took place over a period of four weeks and data was
collected using BRE’s CALIBRE tool, this allowed for detailed data collection during working
hours on site using a handheld computer, The CALIBRE tool was used to activity sample the
processes on the housing estate. A work breakdown structure was used to define activities
that were taking place according to added value, non-added value, support or statutory
activities. Non added value activities are defined by the work breakdown structure that forms
the basis for the activity sampling methodology using CALIBRE.
The Workshop discussed skills and qualification gaps prior to the project starting, during the
project and future skills needed for sustainable retrofit. The discussions were based around
two housing sites in Wales, one of which was the site where data was collected using the
CALIBRE tool.
The final part of the case study concentrated on feedback from the Sector Skills Councils.
Interviews were undertaken with representatives from the four Sector Skills Councils who
delivered the Delivering Low Carbon Skills Programme; Asset Skills, SummitSkills,
ConstructionSkills and Energy and Utilities Skills. The aim was to gain an insight into skills
issues and priorities in sustainable retrofit with reference to the Arbed project when
applicable.
Reliability
This research was undertaken with selected industry specialists and opinions expressed
represent the views of individuals and are not necessarily representative of their
organisation or stakeholder group as a whole
BRE, Delivering Low Carbon Skills in Wales, New Build Learning Project (December 2011)
This applied research project was commissioned by the Delivering Low Carbon Skills in
Wales to investigate the impact of innovation on skills, focusing on low carbon new build
skills. A specific aim was to identify skills gaps and skills/knowledge gaps evident in the
construction of low carbon new build housing. The project was delivered by BRE.
Sample Frame and Sample Size

180
The research consisted of three phases, a period of on-site monitoring, stakeholder
workshops and a literature review which included a previous pilot for the code for
sustainable homes.
Sample Strategy
The onsite monitoring process took place over a period of four weeks and data was
collected using BRE’s CALIBRE tool, this allowed for detailed data collection during working
hours on site using a handheld computer, The CALIBRE tool was used to activity sample the
processes on the new build housing development which was being construction to code
level 4 of the Code for Sustainable Homes. A work breakdown structure was used to define
activities that were taking place according to added value, non-added value, support or
statutory activities. Non added value activities are defined by the work breakdown structure
that forms the basis for the activity sampling methodology using CALIBRE.
The first workshop involved key stakeholders from the delivery of low carbon building in
Wales, including those who had taken part in the code pilot programme. It discussed skills
and qualifications gaps relating to the delivery of low carbon new build projects delivery to
the Code Standard. The second workshop focused on the product manufacturers and
suppliers who shared issues and learning gained from their experiences of skills for the
installation of their products on low carbon developments in Wales and the UK generally.
The final part of the research focused on feedback from other initiatives focusing on low
carbon new build in Wales. Structured discussions were held with the Low Carbon
Research Institute and Academic Expertise for Business representatives to gain an insight
into skills issues and priorities in low carbon new build.
Construction Industry Council and ConstructionSkills, Impact of the Recession on Construction Professionals – A view from the front line. (2009)
The objective of this research was to provide an understanding of how the current recession
was impacting on the UK professional services sector, including:
• How employers have responded to current changes in the economy; and
• To what extent employers are planning for future growth.
The research was carried out by Experian (Analysis of official data combined with
Construction Skills Network data) and IFF Research Ltd (Primary research - Interviews and
analysis). Interviews were held between 19 August 2009 and 19 October 2009.

181
Sample Frame & Sample Size
The sample frame was based on ConstructionSkills Employer Panel supplemented using
Experian’s database. The research involved an initial qualitative phase, involving 30
teledepths with firms within the professional services sector, followed by a quantitative
survey of 301 professional services firms employing 5 or more staff across the UK.
Sample Strategy
For the quantitative phase, quotas were set to ensure a reasonable spread across the
industry by region and size.
Topic Areas:
Impact of the recession on the size and nature of the workforce
Steps taken to meet the recession
Any changes in the skills needed by the firm
Extent to which the recession has impacted on recruitment overall and specifically on
graduates
The current volume of Built Environment graduates, including how many are
seeking/have found employment in the sector & how many are likely to come through
higher education in the medium term.
Reliability
The research involved 30 in-depth interviews with employers and a quantitative
survey of 301 telephone interviews with professional services firms, the latter being
conducted in the first half of October 2009. It is worth noting that statistical reliability
on a sample size of 301 (in the worst case scenario from a reliability point of view of a
survey result of 50 per cent) is +/- 6 per cent (i.e. we are 95 per cent confident that the
true result, if views had been obtained from all employers rather than a sample, lies
within 6 per cent of the survey finding). The statistical reliability is a lot lower where we
report results among sub-groups of the sample (for example by region, size of
employer or sub-sector, or where we look at results among those that have reduced
staff numbers or taken particular action). In these cases results should be treated with
some caution, and may best be regarded as indicative only.
ConstructionSkills, Employer Panel: Employer Attitudes and Motivations to Learning and
Training (Wave 10: October 2010)

182
The Employer Panel seeks to complement and enhance ConstructionSkills’ existing
research by providing an open and regular programme of employer consultation, allowing a
reality check for anecdotal reports and enabling employer reactions to be gained on ‘hot
topics’ of the moment. A particular aim was to enable a more comprehensive understanding
of actual behavioural issues influencing the decision(s) to train, the route(s) taken and the
method(s) used. This piece of work is undertaken by IFF Research Ltd and there are
currently four waves per year.
Sample Frame and Sample Size
Wave 10 comprised 30 semi-structured qualitative interviews and 1,511 structured
quantitative interviews (both conducted by telephone) with employers and the self-employed
covering the traditional building sector (SIC 45) and Professional Services Firms (falling
within SIC 74.2).
Sample Strategy
Much of the sample for wave 10 came from those agreeing at previous waves to take part in
further research (overall 64 per cent of the 1,511 quantitative interviews were conducted with
those who had taken part in earlier waves) supplemented with fresh sample from the same
sources as described above. For the quantitative phase, quotas were set by region / country,
and size (number of staff employed directly in the UK) and by whether they were in the
Construction or Professional Services sector. Results for the quantitative element were then
weighted to ensure that on these variables survey results were representative. (With the
exception of the self- employed because of the huge numbers, see explanation in the
reports introduction).
By region / country, there was intentional oversampling of the smallest regions to ensure
close to 100 interviews were conducted in each. The weighting process then adjusted the
regions back to their correct proportions.
Reliability

183
For the quantitative phase, quotas are set by region / country, size (number of staff
employed directly in the UK) and by whether they were in the Construction or Professional
Services sector. An overall target of 1,500 responses is set per wave of research, which
provides a reasonable level of statistical accuracy (+/- 2.5 per cent on a survey result of 50
per cent based on 95 per cent confidence levels). The statistical reliability is lower where we
report results among sub-groups of the sample (for example by region, size of employer or
sub-sector, or where we look at results among those that have reduced staff numbers or
taken particular action). In these cases results should be treated with some caution, but can
largely be regarded as indicative of the issues in this sector as a whole.
Results (for the quantitative element) are weighted to ensure that on these variables survey
results were representative. The one exception is the self-employed. Because of the vast
number of self-employed, if these were weighted to their correct proportions the overall
survey results would be completely dominated by the findings among this group. Hence they
are weighted to a negligible proportion of the total sample (less than 0.5 per cent) and in
effect where overall results are reported these are based on all employers (i.e. those
currently employing other staff and hence excluding sole traders / the self-employed).
However, results do specifically reference the self-employed, where this occurs these are
based on approximately 100 interviews conducted among this group.
ConstructionSkills and Experian, Construction Skills Network, 2012-2016 (2012)
The aim of the Construction Skills Network (CSN) is to assist the industry and its
stakeholders with planning to meet future employment and skills requirements, by providing
sector intelligence based upon robust data and analysing capacity, productivity and skills.
The CSN is co-ordinated by ConstructionSkills in conjunction with Experian, who provide
information and analytical services. The CSN has over 700 members (including
representatives from Government, Federations and Employers) who attend observatory
meetings and contribute their skills and knowledge.
At the heart of the CSN are a number of forecasting models which generate forecasts of
employment requirements within the industry for a range of occupational groups. The
models are designed and managed by Experian under the independent guidance and
validation of the Technical Reference Group, comprised of statisticians and modelling
experts.
Methodology
184
The model approach relies on a combination of primary research and views from the CSN to
facilitate it. National data is used as the basis for the assumptions that augment the models,
which are then adjusted with the assistance of the Observatories and National Group. Each
English region, Wales, Scotland and Northern Ireland has a separate model (although all
models are inter-related due to labour movements) and, in addition, there is one national
model that acts as a constraint to the individual models and enables best use to be made of
the most robust data (which is available at the national level). The models work by
forecasting demand and supply of skilled workers separately. The difference between
demand and supply forms the employment requirement.
Reliability
The Construction Skills Network (CSN) forecast against outturn was +2 per cent at the UK
level and on average +3 per cent at the region / nation level. The results for the nations /
regions ranged from -2 per cent to +9 per cent. These are well within the agreed
performance limits for the UK (+/- 5 per cent) and all nations / regions (+/- 10 per cent).
ConstructionSkills and Foras Áiseanna Saothair (FÁS). Workforce Mobility and Skills in the
UK Construction Sector (2007)
The overall aim of the study was to provide reliable data on the nature of the construction
workforce in regard to their competence/qualification levels and the extent of occupational
and geographic mobility within the workforce. More specifically, the key objectives of the
research were to examine:
the qualification and skill levels of the construction workforce in the UK and ROI
the extent to which the workforce in each nation/region is constituted of workers
originating or living in other parts of the UK/ROI (or further afield), and general
mobility and travel to work issues
the nature of the mobile workforce/’imported’ workforce in terms of their occupations
and their competence/qualification levels
the scale and extent of occupational mobility within the construction workforce to see
how workers in construction occupations change or keep their occupations over time,
and related to this the extent to which managers have received training specifically to
enhance their managerial skills

185
The focus for the survey was on site-based manual occupations, thus excluding associated
clerical and sales occupations and professions such as architects, surveyors and engineers.
This research was carried out by BMRB Limited and in 2007 where interviews were held
between February and July.
Sample frame and sample size
For the UK projects were selected from the Glenigan project database as this does not cover
the Republic of Ireland the sample frame was based on those who attend Safepass
awareness training. Face to face interviews with 3,877 workers across 312 sites in the
UK/ROI
Sample Strategy
The sample was selected from the Glenigan database of construction projects. This
database contained 39,993 records. The following steps were taken before selecting the
sample:
• 1,040 sites with a value of less than £250,000 were removed
• 24,983 sites were removed because their contract stage was not ‘start on site’, ‘contract
awarded’ or ‘bills called’
• 6,979 sites were removed because they were not due to be active during the fieldwork
period.
This left a total of 6,991 sites which were eligible to take part in the research. The sample
was then stratified by value and region. Ninety-nine postcode sectors were selected, and
within each sector, six sites were selected, providing a total of 594 sites. An additional 860
sites were selected and held in reserve. During the telephone fieldwork stage, it became
clear that due to a high level of ineligible sites and incomplete contact details (see section
1.5); all of the selected sites would be needed in order to achieve the target number of
interviews. Therefore the reserve sample was added, increasing the total sample to 1,454
sites.
Reliability
In order to make the research representative, strict quotas were set on value of site and
region. A total of 292 sites were visited in the UK. After excluding a small number of
questionnaires which were unusable, a total of 3,621 questionnaires were completed. Eighty

186
per cent of the questionnaires were interviewer administered, with the remainder being self-
completed. The results were not grossed or weighted. The total sample provides an
acceptable level of statistical accuracy (+/- 1.6 per cent on a survey result of 50 per cent
based on 95 per cent confidence levels). The statistical reliability is lower where we report
results among sub-groups of the sample (for example by region, size of employer or sub-
sector, or where we look at results among reduced demographic groups). In these cases
results should be treated with some caution, but can largely be regarded as indicative of
employment in this sector as a whole.
ConstructionSkills Skills and Training in the Construction Industry, 2011. (2011)
Topic Areas;
Output Constraints
Recruitment activity and difficulties
Skills gaps and upskilling the workforce
Workforce training and development
Apprenticeships and recruiting young people
This research was undertaken by Babcock between February and April 2011.
Sample Frame and Sample Size
The study was UK-wide and covered the full ConstructionSkills footprint (professional
services SIC74.2) and the construction contracting sector (SIC45, excluding plumbing and
electrical firms (SIC 45.31 and 45.33, which fall within the footprint of SummitSkills, the
Sector Skills Council for the Building Services Engineering). The sample frame was obtained
by Babcock from Sample Answers Ltd using their UKBiz multi-source business database,
filtered by ConstructionSkills SSC footprint definition (using SIC2007).
A total of 1,207 interviews were conducted via a quantitative telephone survey across the
UK.
Reliability
The survey included sole traders / self-employed as well as employers, involved in
construction contracting and professional services. Quotas were set to ensure that equal
numbers of interviews were conducted in each of the nine regions of England, and the three
remaining nations of the UK (Northern Ireland, Scotland and Wales), to provide an

187
appropriate base for simple regional analysis. Quotas also controlled the number of
interviews conducted with establishments of various sizes, and for construction contracting
establishments and professional services establishments. Targets over-represented large
employers because of their low incidence, coupled with the large proportion of construction
sector workers employed, thereby ensuring a sufficient base for confidence in the data
collected. Weighting of data adjusted findings to represent the current profile of businesses
in the sector.
Survey responses collected from employers were weighted using a matrix developed by
interlocking data for employee numbers and region of businesses within the footprint SICs
from the Inter Departmental Business Register (IDBR) 2010. While we explored applying a
three-way interlocked weighting scheme which would also re-balance ‘construction
contracting’ against ‘professional services’ within region and size band, it was agreed with
ConstructionSkills that some weighting cells would be based upon small numbers of
achieved interviews, and only make minor readjustments as the balance of interviews
achieved in each sub-sector was very close to the true sub-sectoral splits.
Survey responses (from employers) were also weighted to represent employees for a small
number of questions, and grossed up to represent all employees in the construction sector in
the UK. An interlocking employee weighting matrix was developed using data from the
Annual Business Inquiry (ABI) employee analysis (2008) for ConstructionSkills’ footprint
SICs. ABI data related to Great Britain only, hence the assumption was made that the profile
of employees in Northern Ireland match the rest of the UK. Factors used for this employee
weighting were the region/nation and the sub sector (construction contracting / professional
services).
The total sample provides an acceptable level of statistical accuracy (+/- 2.8 per cent on a
survey result of 50 per cent based on 95 per cent confidence levels). The statistical reliability
is lower where we report results among sub groups of the sample (for example by region,
size of employer or sub-sector, or where we look at results among reduced demographic
groups). In these cases results should be treated with some caution, but can largely be
regarded as indicative of employment and skills in this sector as a whole.
ConstructionSkills Training and the Built Environment (2011)
Topic areas
This annual project aims to measure the number of people entering construction training
across Great Britain and covers these key areas:
188
Attracting and retaining talent
Developing talent
Improving business performance
Strengthening the skills infrastructure across nations
This research was produced in house by ConstructionSkills between February and March
2011.
Section 1: trainee numbers survey 2010/2011 presents data collected from colleges, private
training providers and construction industry training centres across Great Britain on the
number of people entering construction training. These include those coming through
CITB-ConstructionSkills’ own managing agency and those entering other formal certificated
training at craft and technical level.
Section 2: forecasted demand for craft and technical construction training 2011–2015
analyses this training data alongside the projected demand for skilled construction workers
over the forecast period 2011–2015 (using the ConstructionSkills & Experian Construction
Skills Network Forecasts), in order to assess the adequacy of current training provision in
terms of quantity.
Section 3: Construction Training Capacity 2010/2011 summarises the findings of the
capacity questions from the Trainee Numbers Survey, which aimed to discover the total
capacity for skilled manual trades training that is currently available.
Section 4: Higher Education in the Built Environment presents data from HESA on student
enrolments on built environment degree courses in the academic year 2009/2010.
Sample Frame and Sample Size
The postal questionnaire is sent to all training providers across Great Britain (168 on this
occasion) who provide formal certificated training at craft and technical level, identified
through in house desk research and updated annually.
Reliability
This is an annual survey of training providers across GB, which provides a snapshot of
entrants onto construction training. CITB-ConstructionSkills has collected data on new
entrants on an annual basis for 30+ years, and the current survey has been running
continuously for 20+ years. It is completely voluntary and participation relies on the goodwill

189
of training providers. No weighting is employed as part of the methodology. It does not
claim to be representative of all training being undertaken, but it is the only data source
available which provides up-to-date training data on an annual basis (i.e. data is available in
the same year as new entrants start training). The results can be considered as being
broadly indicative and outturn analysis against official data suggests that the survey provides
a reliable indicator of trends within the sector as a whole.
ConstructionSkills, Understanding Future Change in Construction (2010)
The aim of this research is to establish an evidence base for ConstructionSkills on future
skills across the construction sector. The research carried out by Pye Tait Limited,
investigates the following areas;
Innovation
Renewables
Zero Carbon
Low Carbon
Change
Environment
Interviews were held between March and June 2010.
A multi-faceted approach to data collection was adopted, to gather data through a range of
separate routes:
Phase 1 - Literature review
Phase 2 – Four Focus Groups across Great Britain - attended by representatives from
nearly 70 stakeholder organisations including those within, as well as impacting upon, the
construction sector
Phase 3 - In-depth qualitative telephone interviews - 10 in England, 10 in Scotland and 9 in
Wales with key stakeholders in the construction sector
Sample Strategy
For the focus groups a wide range of stakeholders from all sub-sectors of the industry were
invited to the events with the objective of gathering a broad variety of views from
190
all aspects of the industry; of those that agreed to attend, participants spanned employers,
training providers, Assembly representatives, Government bodies (including Sector Skills
Councils and Regional Development Agencies) and representative bodies.
For the individual interviews a wide range of organisations – spanning SMEs to larger
companies - were asked to provide their views, in order to gain robust input from a
representative sample across all sub-sectors within the construction industry. Of those that
agreed to take part, interviews were carried out with 10 stakeholders based in England, 10
stakeholders based in Scotland and 9 stakeholders based in Wales.
Reliability
This research was undertaken with selected industry specialists and opinions expressed
represent the views of individuals and are not necessarily representative of their
organisation or stakeholder group as a whole
ConstructionSkills, Management & Supervisory Skills (2011)
The aim of this research is to:
Identify, quantify and analyse the size, qualifications, training activity and skill needs
of the management and supervisory workforce of employers represented by the
construction federations, focussing particularly on innovation and sustainability
Identify how managers’ skill needs have changed and are changing over time
Explore the impact that MSDP has played in supporting training
The research was carried out by IFF Research and interviews were held between November
2010 and February 2011.
Sample Frame & Sample Size
The research consisted of 22 interviews with federations, a quantitative structured telephone
survey of 1,450 employers that are members of one of 20 federations covered by the
research (listed in the report). A further qualitative survey was also undertaken which
included 5 interviews with federations about specific projects for which they had received
funding through MSDP, 8 employers who had attended MSDP-funded training that had been
organised by federations and 7 employers that had received MSDP funding direct.
Sample Strategy

191
The sample of employers was initially drawn from CITB-ConstructionSkills’ levy database.
Part of the interview with each federation involved a discussion as to whether the number of
employers this generated matched their membership figures or was sufficiently close, or
whether their own membership lists were more comprehensive and could be used instead or
alongside that provided by CITB-ConstructionSkills. Some federations passed on their
membership list, in some cases their website listed their membership and this was used to
supplement the list from the levy database or was used instead, and in others the federation
contact checked the levy list to update it (e.g. with companies that had gone out of
business).
Reliability
The quantitative survey involved telephone interviews with 1,450 employers that were
members of the 20 federations covered by the research. This sample size provides a
reasonable level of statistical accuracy (±2.6 per cent on a survey result of 50 per cent
based on 95 per cent confidence level). The statistical reliability is lower where we report
results among sub-groups of the sample (for example by region, size of employer or sub-
sector, or where we look at results among those that have reduced staff numbers or taken
particular action). In these cases results should be treated with some caution, but can largely
be regarded as indicative of the situation in this sector as a whole.
Although the federations differ greatly in terms of the size of the membership, the aim was to
achieve a broadly even spread of interviews across the different federations. The survey
data was then grossed up to the approximate number of employers within each federation.
ConstructionSkills, Productivity in the Construction Sector (2011)
The objectives for the research are to identify and discuss the following:
how firms define productivity and how (if at all) they measure it
whether responses allow meaningful comparisons with the high-level indicators used
by BIS and UK Commission
how firms communicate with their workers about productivity and whether incentives
are offered
importance of productivity for firms, both on a project and overall basis, and what
efforts are being made to improve it
responsibility within firms for improving productivity and steps taken to achieve this
192
split of responsibility for raising productivity between main and subcontractors
events that have affected productivity levels within the industry over the past five
years
whether firms approach productivity in terms of competitive advantage
willingness to work with clients, suppliers, and even competitors to improve
productivity
whether employees have the necessary skills and training to work in a more
productive manner
the role of the client and the process of competitive tendering in raising or lowering
firms’ productivity levels
The research was carried out by Enterprise Planning & Research Limited in 2011.
Sample Frame & Sample Size
Samples were drawn from the ConstructionSkills levy database and 20 depth interviews
conducted with experts and contractors, a programme of 20 personal and 10 telephone
depth interviews with decision-making directors and managers to explore in depth the issues
surrounding productivity and 150 extended telephone interviews with construction managers
and supervisors across a range of companies working in the construction sector.
Sample Strategy
In order to structure the sample, it was decided to use five categories of firm: civil
engineering, housebuilders, general building, specialist trades and repair & maintenance
(R&M). Samples were drawn from the CS levy database, split between the three CS size
categories: large medium and small. The aim was to get equal numbers in each size
category within each sector but this was not always possible. The sample was selected by
taking every “nth” organisation from the lists.
Respondent organisations were then classified in terms of size (number of employees) and
turnover.
Reliability
Due to the small sample size the results of this survey can be taken as indicative only.

193
Green Deal Skills Alliance, Research to Support the Development of a Green Deal
Competency Framework, (2012)
The remit of the Green Deal Skills Alliance (GDSA), comprising the Sector Skills Councils
ConstructionSkills, Asset Skills and SummitSkills, is to develop new training and
accreditation for the energy assessment, advice and installation workforce. In 2011 the
GDSA was awarded £500,000 of funding from the Employer Investment Fund (EIF) to build
an infrastructure to support the implementation and delivery of the Green Deal.
The Green Deal is the Coalition Government’s flagship policy for improving the energy
efficiency of buildings in Great Britain and will be available from autumn 2012. It will
establish a new financial mechanism to permit a range of measures, such as insulation,
heating or lighting, to be installed in people’s homes and businesses at no upfront cost. The
Green Deal is based on the principle that many energy efficiency related changes to
properties pay for themselves. Householders and businesses will be able to obtain finance
to fund appropriate energy efficiency measures through the Green Deal, which will be paid
back through the savings on fuel bills resulting from their installation.
The core aims of this research were to identify specific skills and knowledge that will be
required by workers to deliver the Green Deal; assess the scale of the Green Deal workforce
and the skills and knowledge they have compared with what is required; and to assess the
capacity of training providers to deliver them. The work has also included an analysis of a
number of Green Deal implementation scenarios and their likely impact on skills
development. An additional requirement was to identify what could enable the supply chain
to engage with and deliver the Green Deal. Finally the project has included an evaluation of
six Green Deal pilot training programmes.
This work will provide data that will enable the GDSA to develop a Green Deal Competency
Framework, National Occupational Standards and qualifications and training required to
deliver the Green Deal.
The research was carried out by Pye Tait in 2011.
Sample Frame & Sample Size
This research commenced in September 2011 and had to be completed by the end of
January 2012 to align with the timescales of the GDSA, for completing development of
National Occupational Standards, qualifications and the Green Deal Competency
Framework preparatory to its launch in October 2012. A combination of primary and

194
secondary research methodologies have been used to generate robust and comprehensive
data to inform this report. Desk-based research at the outset of the project was carried out
to establish detail around general policy and strategy linked to the Green Deal, drivers for
climate change, skills and knowledge requirements for a low carbon economy already
identified, and Government guidance as to how the scheme will operate which is captured
within the report in Section 2.2 above.
Interviews subsequently took place with 38 industry stakeholders identified by the GDSA
(see Appendix 2 of the report for details).
Against a background of significant change within the external environment at the time the
research was taking place the employer survey gathered some 400 completions spanning
respondents in England, Wales and Scotland. An online survey was also developed for
training providers. It was recognised that only informed respondents would be capable of
providing reliable and valuable feedback and we found that there were very few in the
provider realm who felt sufficiently knowledgeable to respond with confidence. Nevertheless
we acquired good feedback from twenty five providers across the sample target-frame
(contact details were supplied by the GDSA).
Sample Strategy
The sample frame for the employer survey was developed in conjunction with the GDSA and
was designed to span all GDSA sector footprints where business activities were in scope of
the Green Deal process as described above. Table 2 below shows the activities and
Standard Industrial Classification (SIC) codes used to develop the sample frame.
The table below shows the SIC codes and business activities in scope to this research.51
51 The sample frame also included Asset Skills business activities of ‘renting and operating of own or leased real estate’ or ‘management of real estate on a fee or contract basis’ however where interviews took place within these sub-sectors respondents had extremely limited knowledge and understanding of the Green Deal and the majority were unable to provide detailed responses thus when establishing the size of the workforce these activities have been excluded.

195
Lead SSC SIC 2007 code Business Activity
ConstructionSkills 41.20 Construction of commercial and domestic buildings
ConstructionSkills 43.29 Other construction installation
ConstructionSkills 43.34 Painting and glazing
ConstructionSkills 43.91 Roofing activities
ConstructionSkills 71.11; 74.9052 Architectural activities; Other professional, scientific and
technical activities n.e.c
SummitSkills 43.21 Electrical Installation
SummitSkills 43.22 Plumbing, heating and air conditioning
Asset Skills N/A Energy assessment and advice
Of the 400 respondents to the employer survey, over half were SMEs with between 1 and 10
employees, reflecting the high proportion of SMEs that comprise the sector footprints for this
work. Just over 90 per cent of organisations interviewed operated from one single site, with
just 8 per cent having multiple sites.
Concurrently evaluation was undertaken of six Green Deal pilot training programmes, which
were developed in conjunction with the GDSA with the main objective of testing initial draft
qualification units. These units were developed by the GDSA in conjunction with an expert
steering group including employers, training providers and representatives from the
Department of Energy and Climate Change (DECC). Pilots were delivered by providers
identified by the GDSA that had capacity to test out the training. Training took place towards
the end of 2011 in the following locations: Kilmarnock (Scotland), Liverpool, Tredegar (South
Wales), Taunton, Crumlin (Northern Ireland) and London.
Reliability
This research was undertaken with selected industry specialists and opinions expressed
represent the views of individuals and are not necessarily representative of their
organisation or stakeholder group as a whole
Report Availability
52 SIC 2007 codes 71.11 and 74.90 are grouped together in this and subsequent Tables. This is because the employer survey contacts were selected using SIC 2003 categories where these activities are combined.

196
All ConstructionSkills reports (except the Employer Panel and Productivity in the
Construction Industry, which are unpublished) can be accessed from ConstructionSkills
website at http://www.cskills.org/sectorskills/researchfromssc/national_reports.aspx.
vii. Data analysis and interpretation
The Sector Skills Assessment brings together bespoke analysis of existing data (provided by
UK Commission to all SSC’s), which includes data from the following sources;
Labour Force Survey
Office for National Statistics
Inter-Departmental Business Register
Annual Survey of Hours and Earnings
Employer Skills Survey
National Employer Skills Survey.
The resultant data provides the foundation for understanding the size and composition of the
sector as well as providing a basic insight into the characteristics of the sector in terms of
business activities and working patterns.
For this report this analysis was combined with the results of research commissioned by
ConstructionSkills, as well as a wider desk-based review of existing research. As such this
report presents a comprehensive review of the available Labour Market Information (that is,
descriptive data, such as statistics or survey results) and Labour Market Intelligence (which
includes analysis, interpretation, conclusions and policy recommendations).
This Sector Skills Assessment was compiled by ConstructionSkills Research Team (Lee
Bryer, Kirsty Woolsey, Adam Evans, Martin Turner, Karen Hazleden, Ian Hill and Emma
Link), with contributions from SummitSkills. Each member of the ConstructionSkills research
team took responsibility for a section and for researching that particular area.
viii. Quality Assurance
Quality assurance was carried out throughout the compilation of the report starting with the
data supplied by UK Commission which each team member was responsible for checking
the data to be used in their section. The checks applied included statistical analysis and
checking of totals (to ensure they added up to 100) as well as sense checking them with
sector knowledge and/or other research. For data not supplied by UK Commission each

197
researcher was responsible for ensuring that the data used adhered to the guidelines set by
UK Commission regarding sample size, robustness and representativeness. Where data
was used that was based on small sample sizes or could not be taken as representative this
was clearly stated. Further to this the team held fortnightly meeting where any issues
relating to the report and data could be discussed action to be taken could be agreed by the
team, ensuring that everyone had an input to and was aware of decisions made regarding
the report and handling of data.
Further quality assurance of the report as a whole has been undertaken by the team to
ensure continuity, fluidity and accuracy of the report and data contained within it.
Further detail to be added by UK Commission.
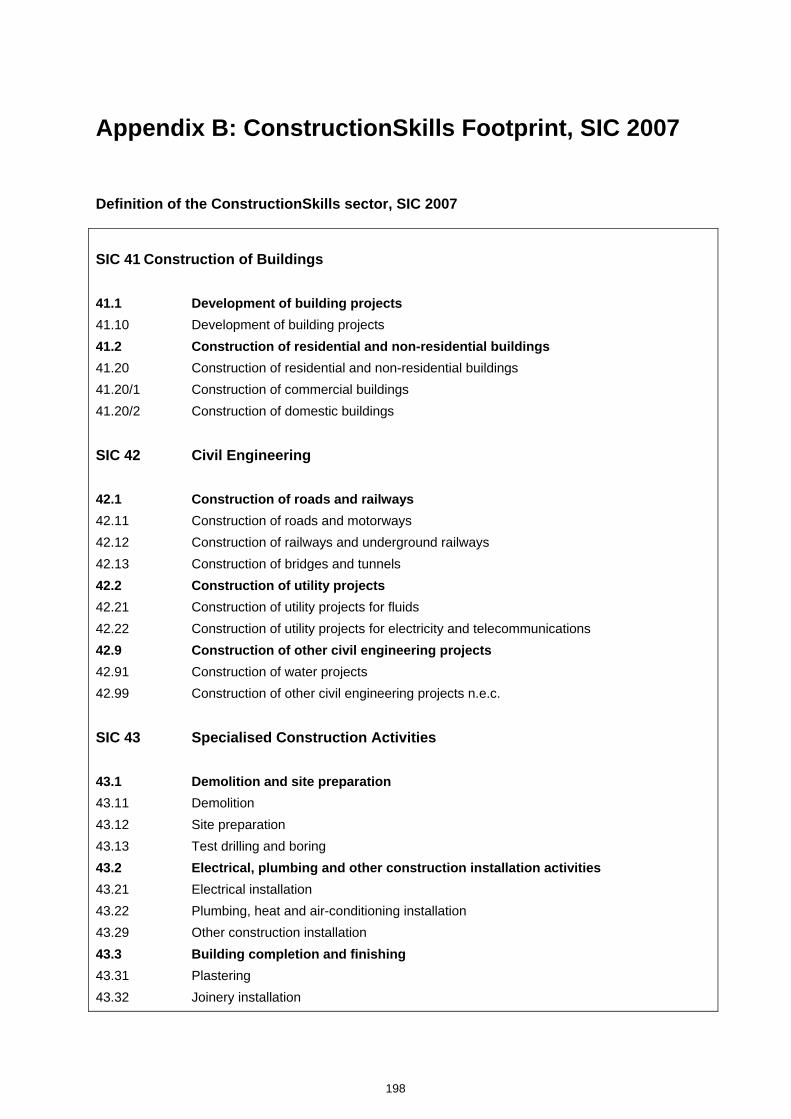
198
Appendix B: ConstructionSkills Footprint, SIC 2007
Definition of the ConstructionSkills sector, SIC 2007
SIC 41 Construction of Buildings
41.1 Development of building projects
41.10 Development of building projects
41.2 Construction of residential and non-residential buildings
41.20 Construction of residential and non-residential buildings
41.20/1 Construction of commercial buildings
41.20/2 Construction of domestic buildings
SIC 42 Civil Engineering
42.1 Construction of roads and railways
42.11 Construction of roads and motorways
42.12 Construction of railways and underground railways
42.13 Construction of bridges and tunnels
42.2 Construction of utility projects
42.21 Construction of utility projects for fluids
42.22 Construction of utility projects for electricity and telecommunications
42.9 Construction of other civil engineering projects
42.91 Construction of water projects
42.99 Construction of other civil engineering projects n.e.c.
SIC 43 Specialised Construction Activities
43.1 Demolition and site preparation
43.11 Demolition
43.12 Site preparation
43.13 Test drilling and boring
43.2 Electrical, plumbing and other construction installation activities
43.21 Electrical installation
43.22 Plumbing, heat and air-conditioning installation
43.29 Other construction installation
43.3 Building completion and finishing
43.31 Plastering
43.32 Joinery installation

199
43.33 Floor and wall covering
43.34 Painting and glazing
43.34/1 Painting
43.34/2 Glazing
43.39 Other building completion and finishing
43.9 Other specialised construction activities n.e.c.
43.91 Roofing activities
43.99 Other specialised construction activities n.e.c.
43.99/1 Scaffold erection
43.99/9 Specialised construction activities (other than scaffold erection) n.e.c.
SIC 71 Architectural and Engineering Activities; Technical Testing and Analysis
71.1 Architectural and engineering activities and related technical consultancy
71.11 Architectural activities
71.11/1 Architectural activities
71.11/2 Urban planning and landscape architectural activities
71.12 Engineering activities and related technical consultancy
71.12/1 Engineering design activities for industrial process and production
71.12/2 Engineering related scientific and technical consulting activities
71.12/9 Other engineering activities (not including engineering design for industrial process and production or engineering related scientific and technical consulting activities)
71.2 Technical testing and analysis
71.20 Technical testing and analysis
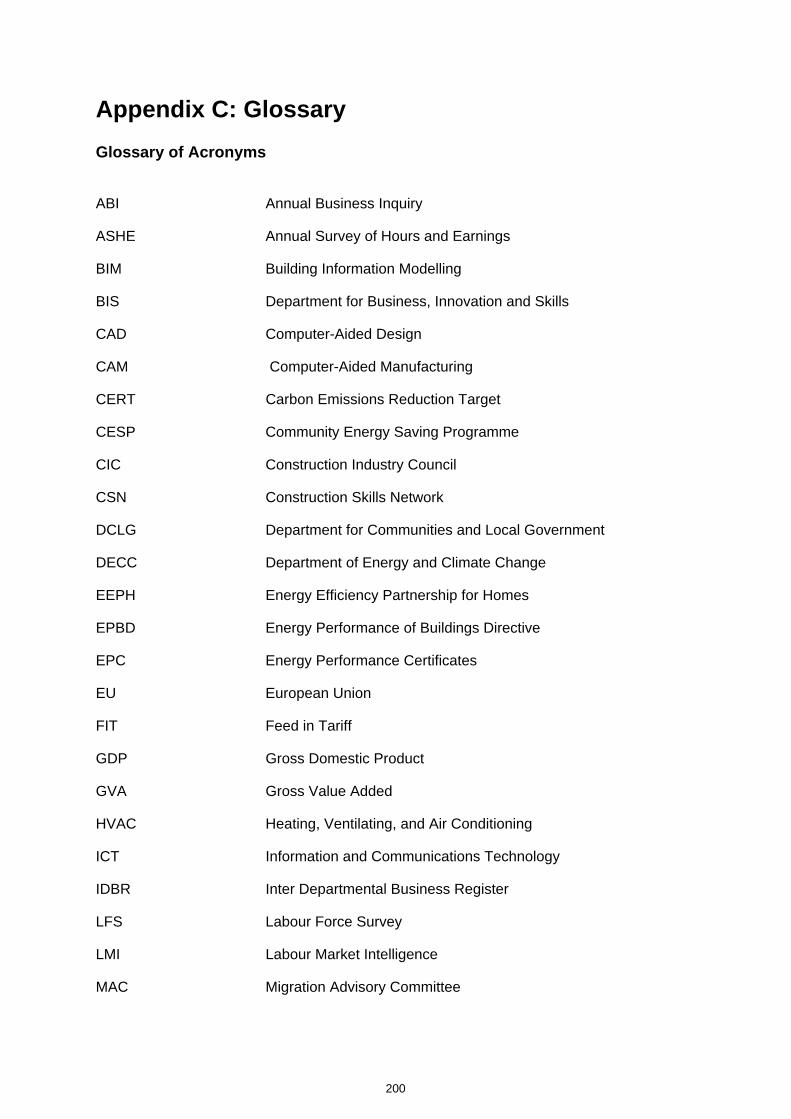
200
Appendix C: Glossary
Glossary of Acronyms
ABI Annual Business Inquiry
ASHE Annual Survey of Hours and Earnings
BIM Building Information Modelling
BIS Department for Business, Innovation and Skills
CAD Computer-Aided Design
CAM Computer-Aided Manufacturing
CERT Carbon Emissions Reduction Target
CESP Community Energy Saving Programme
CIC Construction Industry Council
CSN Construction Skills Network
DCLG Department for Communities and Local Government
DECC Department of Energy and Climate Change
EEPH Energy Efficiency Partnership for Homes
EPBD Energy Performance of Buildings Directive
EPC Energy Performance Certificates
EU European Union
FIT Feed in Tariff
GDP Gross Domestic Product
GVA Gross Value Added
HVAC Heating, Ventilating, and Air Conditioning
ICT Information and Communications Technology
IDBR Inter Departmental Business Register
LFS Labour Force Survey
LMI Labour Market Intelligence
MAC Migration Advisory Committee

201
MMC Modern Method of Construction
NI Northern Ireland
NVQ National Vocational Qualification
ONS Office for National Statistics
PFI Private Finance Initiative
PQQ Pre-Qualification Questionnaire
R&M Repair and Maintenance
SIC Standard Industrial Classification
SME Small and Medium-sized Enterprise
SOC Standard Occupational Classification
SSA Sector Skills Agreement
SSC Sector Skills Council
SVQ Scottish Vocational Qualification
UK Commission UK Commission for Employment and Skills
UKCG UK Contractors Group
UK Commission’s ESS United Kingdom Employer Skills Survey for England
VAT Value Added Tax
Glossary of Terms Term Description
Craft trades/occupations Refers to skilled trades/occupations requiring skill in any of
certain kinds of work done with the hands, as distinguished
from unskilled work or from a profession or business.
Manual worker Defined as those working within SOC 2000 Major Groups 5, 8
and 9
Microgeneration The small‐scale generation of heat and power by individuals,
small businesses and communities to meet their own needs, as
alternatives to traditional centralized grid‐connected power.
Non‐manual worker Defined as those working within SOC 2000 Major Groups 1, 2,
3, 4 and 7
Output Contractor’s output is defined as the amount chargeable to
customers for building and civil engineering work done in the
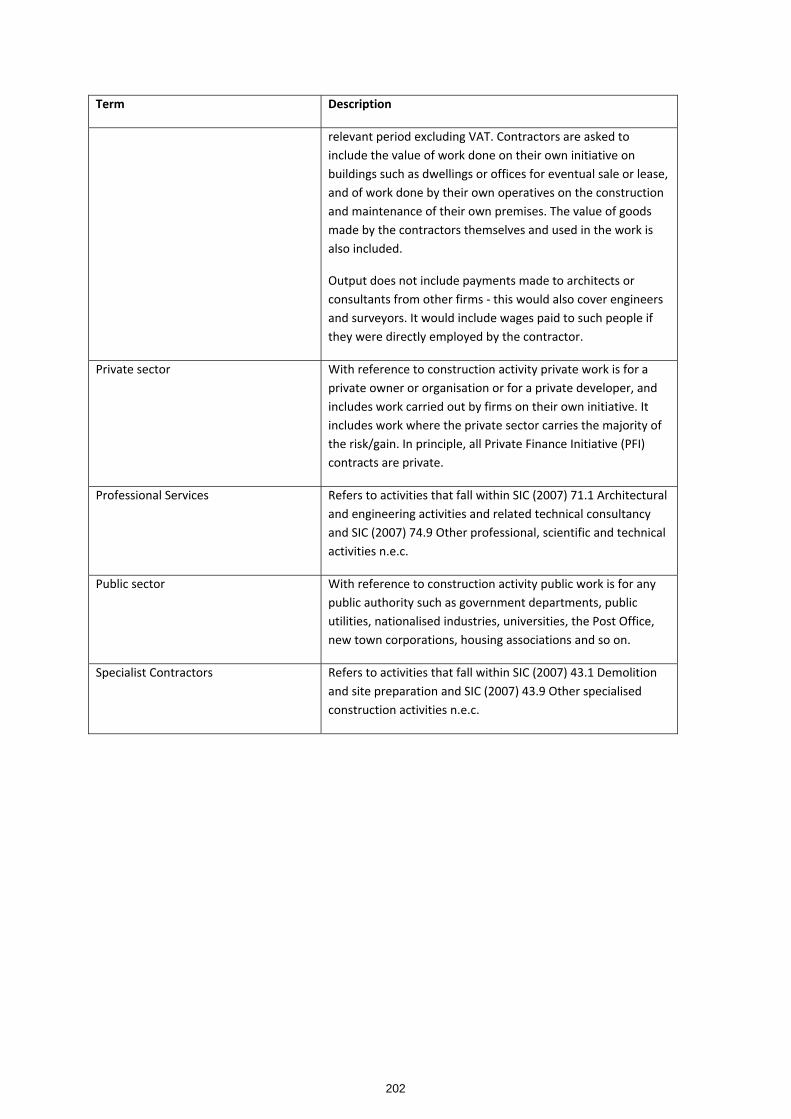
202
Term Description
relevant period excluding VAT. Contractors are asked to
include the value of work done on their own initiative on
buildings such as dwellings or offices for eventual sale or lease,
and of work done by their own operatives on the construction
and maintenance of their own premises. The value of goods
made by the contractors themselves and used in the work is
also included.
Output does not include payments made to architects or
consultants from other firms ‐ this would also cover engineers
and surveyors. It would include wages paid to such people if
they were directly employed by the contractor.
Private sector
With reference to construction activity private work is for a
private owner or organisation or for a private developer, and
includes work carried out by firms on their own initiative. It
includes work where the private sector carries the majority of
the risk/gain. In principle, all Private Finance Initiative (PFI)
contracts are private.
Professional Services Refers to activities that fall within SIC (2007) 71.1 Architectural
and engineering activities and related technical consultancy
and SIC (2007) 74.9 Other professional, scientific and technical
activities n.e.c.
Public sector With reference to construction activity public work is for any
public authority such as government departments, public
utilities, nationalised industries, universities, the Post Office,
new town corporations, housing associations and so on.
Specialist Contractors Refers to activities that fall within SIC (2007) 43.1 Demolition
and site preparation and SIC (2007) 43.9 Other specialised
construction activities n.e.c.

203
Bibliography
Aldersgate Group (2009) Mind The Gap: Skills for the Transition to a Low Carbon Economy.
Atkins Group (2009) Atkins calls for new industrial revolution to secure low carbon future
Available: www.atkinsglobal.com/en/media-centre/news-releases/2009/2009-07-23
[Accessed 6th February 2012].
BRE (2011) Delivering Low Carbon Skills in Wales – Low Carbon New Build Learning
Project
BRE (2011) Delivering Low Carbon Skills in Wales – Retrofit Learning Project
Building Magazine (2011) White Papers: 03/CEO State of the Nation Available:
http://www.building.co.uk/home/white-papers/ceo-white-paper/5025906.article
[Accessed 6th February 2012].
Cabinet Office (2011) Government Construction Strategy, May 2011
CBI (2011) Building for Growth: business priorities for education and skills, education and
skills survey
Chartered Institute of Personnel and Development (2010) Employee Outlook
Committee on Climate Change (2010) Building a Low-carbon Economy – the UK’s
Innovation Challenge
Construction Industry Council and ConstructionSkills (2009) The Impact of the Recession on
Construction Professionals – A View from the Front Line
ConstructionSkills (2007) Workforce Mobility and Skills in the Construction Sector in the UK
and Republic of Ireland
ConstructionSkills (2010) Employer Panel: Employer Attitudes and Motivations to Learning
and Training (Wave 10) [unpublished]
ConstructionSkills (2011) Management and Supervisory Skills Research
ConstructionSkills (2011) Sector Skills Assessment for the Construction Sector 2010
ConstructionSkills (2011) Training and Skills in the Construction Sector

204
ConstructionSkills (2011) Training and the Built Environment
ConstructionSkills (2010) Understanding Future Change in Construction
ConstructionSkills and Experian, (2011) Construction Skills Network Blueprint for UK
Construction Skills 2012-2016.
ConstructionSkills (2011) Productivity in the Construction Sector. [Unpublished paper].
Davies, B. et al (2012) UK Commission’s Employer Skills Survey 2011: UK Results, Evidence Report 45, UK Commission for Employment and Skills, Wath-upon-Dearne
Department for Business, Innovation and Skills & Department of Energy and Climate
Change, (2010) Meeting the Low Carbon Skills Challenge: A Consultation on
Equipping People with the Skills to take Advantage of Opportunities in the Low Carbon
and Resource Efficient Economy
Department for Business, Innovation & Skills, (2008) Strategy for Sustainable Construction
and Skills
Department for Business, Innovation & Skills, (2009) Towards a Low Carbon Economy –
economic analysis and evidence for a low carbon industrial strategy
Department for Business, Innovation & Skills (2011), BIM management for value, cost and
carbon improvement, A report commissioned by the Department of Business,
Innovation and Skills, July, 2011
Department for Communities and Local Government, (2007) The Callcutt Review of
Housebuilding delivery
Department of Energy and Climate Change (2008) Climate Change Act 2008
Department of Energy and Climate Change (2011) Energy Act 2011
Egan, J. (1998) Rethinking Construction: Report of the Construction Task Force, London:
HMSO
Experian and SAMI Consulting (2008) 2020 Vision – The Future of UK Construction,
Gallup Organisation (2006) Engagement Predicts Earnings per Share
Green Deal Skills Alliance (2012) Research to support the development of a Green Deal
Competence Framework

205
Hammond, M.J. (2012) Trends in Migrant Labour in the Building Services Engineering
Sector 2008-2011 Milton Keynes, SummitSkills
Latham, M. (1994) Constructing the Team, London: HMSO
L.E.K. Consulting, (2009) Construction in the UK Economy. Available:
http://www.ukcg.org.uk/fileadmin/documents/UKCG/pamphlets/UKCGfina.pdf
[Accessed 21st November 2011]
Macleod, D. and Clarke, N. (2009) Engaging for Success: Enhancing performance through
employee engagement
Migration Advisory Committee (2012) Analysis of the impacts of Migration
Migration Advisory Committee (2011), Skilled Shortage Sensible
National Assembly for Wales (2010), Legislative Competence, Housing and Local
Government Order
National Assembly for Wales (2010), Legislative Competence, Environment
Office for National Statistics, (2010) Annual Business Inquiry, Provisional Results
Office for National Statistics (2011) Annual Survey of Hours and Earnings 2010 – Revised
Office for National Statistics (2010) Labour Force Survey
Office National Statistics, (2010) Regional Accounts
Office for National Statistics, (2011) United Kingdom Balance of Payments: The Pink Book
Oxford Economics and Global Construction Perspectives (2011) Global Construction 2020.
Royal Institute of Chartered Surveyors (2011) Global Zero Carbon Capacity Index.
RT Hon Grant Shapps MP (2011) Buildings and the Environment Statement 17 May 2011
Scottish Government (2007) Skills for Scotland: A Lifelong Skills Strategy
Scottish Government (2009) Climate Change (Scotland) Act 2009
Scottish Government (2009) The Scottish Sustainable Procurement Action Plan
Scottish Government (2010) Conserve and Save: The Energy Efficiency Action Plan

206
Scottish Government (2010) Low Carbon Economic Strategy for Scotland
Scottish Government (2010) Scotland’s Zero Waste Plan
Scottish Government (2010) Skills for Scotland: Accelerating the Recovery and Increasing
Sustainable Economic Growth
Scottish Government (2011) Economic Strategy
Scottish Government (2011) Renewable Heat Action Plan Update
Scottish Government (2011) Renewables Action Plan: Update 4
Scottish Government (2011) Review of Post-16 Education and Vocational Training in
Scotland
Skills Australia (2008) Workforce Futures: What Does the Future Hold: Meeting Australia’s
Future. Skills Australia, Canberra
Summit Skills (2011) Sector Skills Assessment 2010
Towers Perrin-ISR (2006) The ISR Employee Engagement Report
UK Commission for Employment and Skills (2011) Product Strategies, Skill Shortages and
Skill Updating Needs in England: New evidence from the National Employer Skills
Survey 2009 evidence report 30
UK Commission for Employment and Skills (2010) High Performance Working: A Policy
Review Evidence Report 18
UK Commission for Employment and Skills (2010) The National Strategic Skills Audit for
England. Volume 2: The Evidence Report
UK Commission for Employment and Skills (2010) The Value of Skills: An Evidence Report
22
Wilson, R.A. and Homenidou, K. (2011) Working Futures 2010-2020. Evidence Report 41. Wath: UKCES. http://www.ukces.org.uk/assets/bispartners/ukces/docs/publications/evidence-report-41-working-futures-2010-2020.pdf

207
List of previous publications
Executive summaries and full versions of all these reports are available from
www.ukces.org.uk
Evidence Report 1 Skills for the Workplace: Employer Perspectives Evidence Report 2 Working Futures 2007‐2017 Evidence Report 3 Employee Demand for Skills: A Review of Evidence & Policy Evidence Report 4 High Performance Working: A Synthesis of Key Literature Evidence Report 5 High Performance Working: Developing a Survey Tool Evidence Report 6 Review of Employer Collective Measures: A Conceptual Review from a Public Policy Perspective Evidence Report 7 Review of Employer Collective Measures: Empirical Review Evidence Report 8 Review of Employer Collective Measures: Policy Review Evidence Report 9 Review of Employer Collective Measures: Policy Prioritisation Evidence Report 10 Review of Employer Collective Measures: Final Report Evidence Report 11 The Economic Value of Intermediate Vocational Education and Qualifications Evidence Report 12 UK Employment and Skills Almanac 2009 Evidence Report 13 National Employer Skills Survey 2009: Key Findings Evidence Report 14 Strategic Skills Needs in the Biomedical Sector: A Report for the National Strategic Skills Audit for England, 2010 Evidence Report 15 Strategic Skills Needs in the Financial Services Sector: A Report for the National Strategic Skills Audit for England, 2010

208
Evidence Report 16 Strategic Skills Needs in the Low carbon Energy generation Sector: A Report for the National Strategic Skills Audit for England, 2010 Evidence Report 17 Horizon Scanning and Scenario Building: Scenarios for Skills 2020
Evidence Report 18 High Performance Working: A Policy Review Evidence Report 19 High Performance Working: Employer Case Studies Evidence Report 20 A Theoretical Review of Skill Shortages and Skill Needs Evidence Report 21 High Performance Working: Case Studies Analytical Report Evidence Report 22 The Value of Skills: An Evidence Review Evidence Report 23 National Employer Skills Survey for England 2009: Main Report Evidence Report 24 Perspectives and Performance of Investors in People: A Literature Review Evidence Report 25 UK Employer Perspectives Survey 2010
Evidence Report 26 UK Employment and Skills Almanac 2010 Evidence Report 27 Exploring Employer Behaviour in relation to Investors in People Evidence Report 28 Investors in People ‐ Research on the New Choices Approach Evidence Report 29 Defining and Measuring Training Activity Evidence Report 30 Product strategies, skills shortages and skill updating needs in England: New evidence from the National Employer Skills Survey, 2009 Evidence Report 31 Skills for Self‐employment
209
Evidence Report 32 The impact of student and migrant employment on opportunities for low skilled people Evidence Report 33 Rebalancing the Economy Sectorally and Spatially: An Evidence Review Evidence Report 34 Maximising Employment and Skills in the Offshore Wind Supply Chain Evidence Report 35 The Role of Career Adaptability in Skills Supply Evidence Report 36 The Impact of Higher Education for Part‐Time Students Evidence Report 37 International approaches to high performance working Evidence Report 38 The Role of Skills from Worklessness to Sustainable Employment with Progression Evidence Report 39 Skills and Economic Performance: The Impact of Intangible Assets on UK Productivity Growth Evidence Report 40 A Review of Occupational Regulation and its Impact Evidence Report 41 Working Futures 2010‐2020 Evidence Report 42 International Approaches to the Development of Intermediate Level Skills and Apprenticeships Evidence Report 43 Engaging low skilled employees in workplace learning Evidence Report 44 Developing Occupational Skills Profiles for the UK Evidence Report 45 UK Commission’s Employer Skills Survey 2011: UK Results Evidence Report 46 UK Commission’s Employer Skills Survey 2011: England Results Evidence Report 47 Understanding Training Levies Evidence Report 48 Sector Skills Insights: Advanced Manufacturing

210
Evidence Report 49 Sector Skills Insights: Digital and Creative Evidence Report 50 Sector Skills Insights: Construction Evidence Report 51 Sector Skills Insights: Energy Evidence Report 52 Sector Skills Insights: Health and Social Care Evidence Report 53 Sector Skills Insights: Retail Evidence Report 54 Research to support the evaluation of Investors in People: Employer Survey Evidence Report 55 Sector Skills Insights: Tourism Evidence Report 56 Sector Skills Insights: Professional and Business Services Evidence Report 57 Sector Skills Insights: Education Evidence Report 58 Agriculture, Forestry & Fishing: Sector Skills Assessment 2012 Evidence Report 59 Evaluation of Investors in People: Employer Case Studies Evidence Report 60 An Initial Formative Evaluation of Best Market Solutions Evidence Report 61 Employer Skills Survey 2011: Northern Ireland Report Evidence Report 62 Energy Production and Utilities: Sector Skills Assessment 2012 Evidence Report 63 Creative Media and Entertainment: Sector Skills Assessment 2012

Evidence Reports present detailed findings of the research produced by the UK Commission
for Employment and Skills. The reports contribute to the accumulation of knowledge
and intelligence on skills and employment issues through the review of existing evidence or through primary research. All of the outputs
of the UK Commission can be accessed on our website at www.ukces.org.uk
Produced by ConstructionSkills for the UK
Commission for Employment and Skills.
UKCESRenaissance House
Adwick ParkWath-upon-Dearne
RotherhamS63 5NB
T +44 (0)1709 774 800F +44 (0)1709 774 801
UKCESSanctuary Buildings
Great Smith St.Westminster
LondonSW1P 3BT
T +44 (0)20 7227 7800
This document is available atwww.ukces.org.uk
under ‘Publications’
ISBN 978-1-908418-29-6© UKCES 1st Ed


