ENGINEERING MAINTENANCE NON-RESIDENTIAL INVESTMENT ICI BUILDING RENOVATIONS MAINTENANCE RESIDENTIAL INVESTMENT NEW HOUSING BuildForce Canada uses a scenario-based forecasting system to assess future labour market conditions in the oil sands and both residential and non-residential construction. This labour market information (LMI) system tracks measures for 34 trades and occupations. BuildForce consults with industry, including owners, contractors and labour groups, to validate the scenario assumptions and construction project lists, and seeks input from government on related analysis. The system distills labour market conditions into ranks to provide signals to industry employers. BuildForce’s LMI System -2.5% 2.3% -2% -3% 0.2% 2.2% 0.8% 0.9% CONSTRUCTION & MAINTENANCE LOOKING FORWARD ALBERTA A “new normal” for Alberta’s construction industry HIGHLIGHTS 2017–2026 10-YEAR WORKFORCE OUTLOOK FOR ALBERTA At the start of the scenario period in 2017, low oil prices limit new capital investment and growth. The slowdown, which began in 2015, has resulted in the repatriation of thousands of skilled non-resident construction workers to all regions of Canada. Meanwhile, continued declines in engineering and residential construction are dis- placing resident workers, leading many to seek opportunities in other construction markets both within and outside of Alberta. The anticipated completion of several large construction projects still underway will likely see a second wave of job losses before recovery. Slower growth, rising unemployment rates compared to the last decade, and a greater reliance on a local workforce is expected to translate into a “new normal” for Alberta across the 2017‒2026 scenario period. DISTRIBUTION OF CONSTRUCTION EMPLOYMENT IN 2017, ALBERTA 2026 2017 2017 SECTOR INVESTMENT GROWTH OUTLOOK FOR ALBERTA (% change) 2017 32,500 36,200 2,100 (-1.2%) NEW ENTRANTS RETIREMENTS EMPLOYMENT CHANGE AVERAGE UNEMPLOYMENT RATE 9.4% HIGHLIGHTS ■ A complex transition of Alberta’s labour market presents both opportunities and risks for industry and has impli- cations for how future labour demands are met. ■ The 2017‒2026 outlook scenario projects that total construction employment will fall by an additional 11,000 jobs as major projects are completed, before the bottom is reached in 2018. ■ Residential requirements stabilize in 2017, while com- mercial and other industrial, commercial and institutional (ICI) building activity slows before resuming moderate growth after 2018. ■ With slower new oil sands investment, there is increased emphasis on meeting labour requirements to sustain capacity and maintain facilities and equipment. ■ A staggered recovery is expected to begin in 2018, but will not reach all sectors of construction until 2024. NON-RESIDENTIAL MAINTENANCE ENGINEERING OIL SANDS RESIDENTIAL INDUSTRIAL, COMMERCIAL, INSTITUTIONAL (ICI)
BuildForce Canada uses a scenario-based forecasting system to assess future labour market conditions in the oil sands and both residential and non-residential construction. This labour market information (LMI) system tracks measures for 34 trades and occupations. BuildForce consults with industry, including owners, contractors and labour groups, to validate the scenario assumptions and construction project lists, and seeks input from government on related analysis. The system distills labour market conditions into ranks to provide signals to industry employers.
BuildForce’s LMI System
-2.5% 2.3%-2% -3%0.2% 2.2%0.8% 0.9%
CONSTRUCTION & MAINTENANCE LOOKING FORWARD
ALBERTAA “new normal” for Alberta’s construction industry
HIGHLIGHTS2017–2026
10-YEAR WORKFORCE OUTLOOK FOR ALBERTA
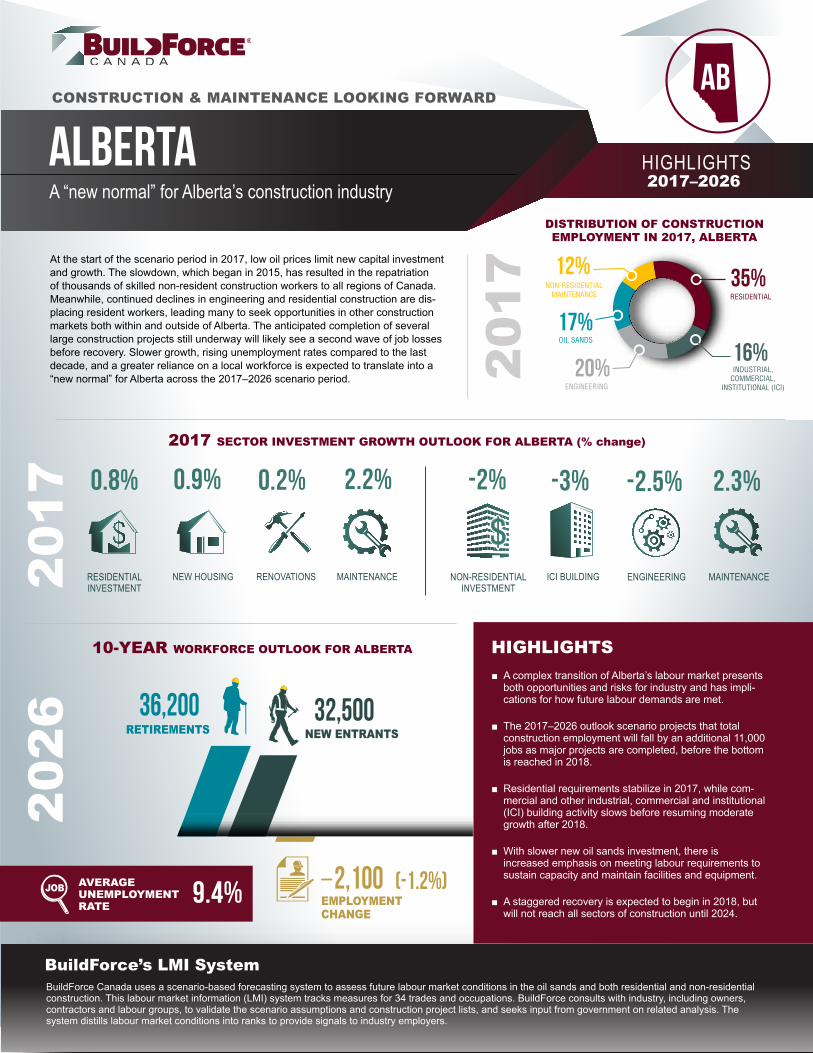
At the start of the scenario period in 2017, low oil prices limit new capital investment and growth. The slowdown, which began in 2015, has resulted in the repatriation of thousands of skilled non-resident construction workers to all regions of Canada. Meanwhile, continued declines in engineering and residential construction are dis-placing resident workers, leading many to seek opportunities in other construction markets both within and outside of Alberta. The anticipated completion of several large construction projects still underway will likely see a second wave of job losses before recovery. Slower growth, rising unemployment rates compared to the last decade, and a greater reliance on a local workforce is expected to translate into a “new normal” for Alberta across the 2017‒2026 scenario period.
DISTRIBUTION OF CONSTRUCTION EMPLOYMENT IN 2017, ALBERTA
2026
2017
2017 SECTOR INVESTMENT GROWTH OUTLOOK FOR ALBERTA (% change)
2017
32,50036,200
2,100 (-1.2%)
NEW ENTRANTSRETIREMENTS
EMPLOYMENTCHANGE
AVERAGEUNEMPLOYMENT RATE 9.4%
HIGHLIGHTS ■ A complex transition of Alberta’s labour market presents both opportunities and risks for industry and has impli-cations for how future labour demands are met.
■ The 2017‒2026 outlook scenario projects that total construction employment will fall by an additional 11,000 jobs as major projects are completed, before the bottom is reached in 2018.
■ Residential requirements stabilize in 2017, while com-mercial and other industrial, commercial and institutional (ICI) building activity slows before resuming moderate growth after 2018.
■ With slower new oil sands investment, there is increased emphasis on meeting labour requirements to sustain capacity and maintain facilities and equipment.
■ A staggered recovery is expected to begin in 2018, but will not reach all sectors of construction until 2024.
NON-RESIDENTIALMAINTENANCE
ENGINEERING
OIL SANDS
RESIDENTIAL
INDUSTRIAL,COMMERCIAL,
INSTITUTIONAL (ICI)
2 ALBERTA – HIGHLIGHTS 2017–2026
ALBERTA – CONSTRUCTION AND MAINTENANCE LOOKING FORWARD
ALBERTA CONSTRUCTION OUTLOOKA smaller second wave of employment declines is expected over the near term as current major projects wind down and continued weakness in the oil and gas sector spreads across all construction labour markets. Non-residential employment is estimated to decline a further 11,000 jobs by 2018. A staggered recovery is expected to begin in 2018 in the residential sector, but will not reach all con-struction sectors until 2024. When it does, labour markets in the post-recovery era will feel very different than before.
The pace of overall employment declines is expected to slow in 2017, though non-residential employment losses will likely continue to mount. Declines in engineering requirements persist, and slowing activity in the commercial and industrial segments of ICI building, offset only small anticipated gains in residential. Further weakening of oil sands construction is expected, as current major projects wind down releasing workers in 2018 and 2019, adding to job losses.
A residential recovery is anticipated to take hold in 2019, coincid-ing with improved economic conditions and increased migration to Alberta. A recovery in non-residential ICI building follows. A sustained recovery in the oil sands and other engineering-related employment is not expected until 2024, with investment and employment remaining well below 2014 peak levels.
The initial impact of the current downturn was partly absorbed by out-of-province workers, thousands of which have now left or are leaving as current projects end. This is evidenced by rising rates of construction unemployment in many provinces outside Alberta. As projects wind down and proposed new projects are delayed or cancelled, unemployment increases for the local workforce across all construction sectors. A second anticipated wave of employment declines related to major engineering project completions through 2019 may lead to some Albertans leaving the province in search of work.
The long-term outlook anticipates higher average rates of unemployment and a transition to a “new normal” for Alberta’s construction workforce, with patterns of recruitment more consis-tent with that of other provinces. Increased labour market slack provides opportunities for a decreased reliance on out-of-province workers to meet seasonal demand peaks and shutdown/turn-around and maintenance requirements.
Industry must still contend with replacing an aging workforce. This task is made more difficult as the risk of losing younger workers increases as construction activity declines and new job opportuni-ties slow. BuildForce estimates that 36,200 retiring skilled workers will exit the Alberta construction industry over the next decade. Attracting and training young workers during and following a downturn in sufficient numbers to meet these demands may pose a formidable challenge.
SECTOR INSIGHTSThe following sections provide sector-specific insights into the oil sands, non-residential and residential labour markets. The 2017 BuildForce LMI system provides an overview of market drivers and detailed occupational demand- and supply-side analysis of labour market conditions in each sector for 34 trades and occupations tracked by BuildForce.
OIL SANDS CONSTRUCTION
The oil price decline in 2015 and changing global market condi-tions halted Alberta’s 15-year oil sands expansion. New project cancellations and delays have resulted in sharp declines in new capital investment, with related job losses. Continued uncertainty regarding Alberta’s future outlook reflects the changing global supply of oil, including the United States’ recent increase in oil production and weaker world economic growth. Under these con-ditions, oil-sands-related engineering construction employment is expected to contract by a further 9,300 jobs through 2023, or 30 percent from already diminished employment in 2016.
Weakening workforce requirements and labour market conditions sent large numbers of the out-of-province workforce home in 2015 and 2016. Over the medium term, there is a high level of uncertainty for workers that remain due to a number of current major oil sands and upgrader projects preparing to wind down and uncertainty around the timing of proposed new oil sands development projects.
A gradual increase in oil prices is expected to slowly restore confi-dence, with renewed oil sands investment expected between 2023 and 2026. It is estimated that 3,600 of the almost 18,000 oil sands construction jobs lost by Albertans since the peak in 2014 are recovered by the end of the scenario in 2026.
Declining investment and employment for new projects only describes part of the complex changing market dynamics. Sustaining capital1 and maintenance work2, which increased steadily across the last decade, continues to rise moderately across the scenario period as the total capacity of oil sands production increases. Sustaining and maintenance work requirements become an increasingly import-ant source of employment, offsetting some of the job losses in new oil sands projects. Figure 1 captures the change in new investment and the steady increase in sustaining capital.
The rise in shutdown/turnaround and maintenance demands is expected to result in isolated, but recurring, recruiting challenges during seasonal peak periods for boilermakers, pipefitters, specialty welders and other workers with specialized skills and work experience.
1 Sustaining capital refers to the periodic addition (or replacement) of capital, which is required to maintain operations at existing levels.
2 Maintenance refers to the process of maintaining equipment, including routine or on-stream work and turnaround/shutdown work, where an operating unit may be temporally taken out of production.
ALBERTA – HIGHLIGHTS 2017–2026 3
CONSTRUCTION AND MAINTENANCE LOOKING FORWARD – ALBERTA
* $2007 millions indicates that the investment values are in year 2007 dollars (base year), that is, adjusted for inflation. This is used to calculate the real physical year-to-year change of the value of construction, factoring out growth (increase value) due to increases in prices.
Sustaining capital New investment
Figure 1: Alberta oil sands investment – construction, machinery and equipment(millions of 2007 dollars*)
NON-RESIDENTIAL SECTOR
The setting in of a long-term low oil price outlook has brought resource development plans to a halt, resulting in the delay and cancellation of new projects. Job losses thus far have been significant, abrupt and concentrated in the non-residential engi-neering sector.
Figure 2 tracks the change in employment by sector for key ref-erence points across the scenario period, including the start in 2017, at the expected peak in 2021 and then at the end of the period in 2026.
Looking forward, the impact of the marked end of the decade-long resource expansion extends employment declines to other con-struction sectors and the broader economy.
Commercial and institutional building, the few bright spots in 2015 and 2016, are expected to drop off in 2017 and 2018 as current projects wind down, office vacancy rates rise and government revenues decline.
Engineering-sector requirements are expected to decline through 2023 as existing projects are completed and oil producers and transporters (i.e., pipelines) continue to control spending in antici-
pation of weak oil prices and slower new production growth across the scenario period. Slowing road, highway and bridge activity and other engineering investment compound engineering employment losses in 2017 and 2018, with overall declines partially offset by infrastructure stimulus investment.
Declines in oil and gas capital expenditures, alongside an expected weakening in ICI building in 2017 and 2018, contribute to enduring near-term declines in non-residential employment.
Continuing growth in sustaining and maintenance work require-ments will be an important source of employment opportunities. Workforce requirements have swelled with expansion over the last decade, rising 70 percent since 2006. Over the next decade, workforce demands are expected to increase at a more moderate pace as investment in new capacity slows. The intensive seasonal nature of some shutdown and turnaround maintenance employment requirements may continue to challenge recruiting for skilled work-ers during peak periods.
Table 1 summarizes the percent change in employment by sector across two periods: the first captures the down cycle to 2019 and the second shows the remainder of the scenario period as overall conditions improve.
ALBERTA – CONSTRUCTION AND MAINTENANCE LOOKING FORWARD
4 ALBERTA – HIGHLIGHTS 2017–2026
Figure 3 shows the employment trends by sector for non-residential construction.
THE AVAILABLE WORKFORCE
Alberta’s non-residential construction industry has relied heavily on in-migration and out-of-province workers to meet rising employment demands for much of the last decade. The strong decline in work-force requirements in 2015 and 2016 resulted in many non-resident workers returning home. This trend continues in 2017 and 2018.
During the prolonged period of falling employment requirements, rates of unemployment are anticipated to double, averaging around 9 percent, well above average levels of the recent past. This transi-tion will likely impact patterns of recruitment and retention and how industry meets construction requirements over the coming decade.
NON-RESIDENTIAL HIGHLIGHTS
■ A number of large transportation, pipeline, and electrical generation and transmission line projects still underway are nearing completion.
■ Non-residential employment is anticipated to decline by a further 12,000 jobs through 2019. A recovery adds back 4,100 jobs across the remainder of the scenario period.
■ Declines in road, highway and bridge activity and other engineer-ing projects compound losses in the engineering sector in 2017 and 2018 as projects wind down.
■ Non-residential ICI building demands, which continued to rise in 2015 and 2016, decline in 2017 and 2018, pulled down by falling industrial and commercial requirements.
Source: Statistics Canada, BuildForce Canada
15%
12%
6%
16%
12%
5%
33%
2017 2014 2026
19%
10%
4%
21%
13%7%
27%
19%
11%
4%
22%
12%6%
25%
106,200 121,200
104,300
Figure 2: Non-residential employment distribution by sector, Alberta, 2014, 2017 and 2026
MAINTENANCE
OTHER HEAVYINDUSTRIAL
HIGHWAYS &BRIDGES
COMMERCIAL &INSTITUTIONAL
OIL SANDS
OTHER ENGINEERING
INDUSTRIAL
PEAK START END
Source: Statistics Canada, BuildForce Canada
Total non-residential employment -11% 4%
ICI
Industrial 7% -7%
Commercial, institutional and government
-4% 8%
Engineering
Highways and bridges -24% 3%
Oil sands -27% 12%
Other heavy industrial 12% -6%
Other engineering -20% 2%
Maintenance 2% 2%
Table 1: Change in non-residential employment by sector, Alberta
SECTOR % CHANGE 2017–2021
% CHANGE 2022–2026
ALBERTA – HIGHLIGHTS 2017–2026 5
CONSTRUCTION AND MAINTENANCE LOOKING FORWARD – ALBERTA
The BuildForce LMI system tracks labour supply and accounts for the change in the available labour force, including retirements, new entrants3 and net in-mobility4. While the exodus of interprovincial workers is a dramatic change, there are larger and longer-term demographic forces at work as well. In particular, retirements account for a large, growing and permanent loss to the workforce. First-time new entrants into the construction workforce, aged 30 and younger, partly offset labour force requirements; however, attracting young workers during a prolonged down-cycle poses new challenges.
Table 2 provides a summary of changes in the provincial non- residential workforce in 2016, the five year period between 2017 and 2021, and across the full scenario period.
Alberta’s construction workforce has not experienced this type of downturn since the late 1970s. The down-cycle in 2009 was similar in magnitude, but shorter in duration. The abrupt upturn in 2010 allowed both employers and the interprovincial workforce to renew patterns of fly-in, fly-out and other arrangements from the previous decade. The current scale of decline is larger, and the duration is expected to be significantly longer. At the same time, maintenance and sustaining investment demands are growing, but at a more moderate pace. The industry is faced with meeting these demands with an aging and much depleted local labour force.
The BuildForce ranking system isolates market conditions specific to non-residential construction. The results are summarized in Table 3.
3 New entrants are measured by applying the traditional proportion of the provincial workforce that enters the construction industry. The projected estimate across the scenario period assumes that the construction industry is able to recruit this group in competition with other industries.
4 In-mobility refers to the arrival of workers from outside the local construction industry. In-mobility includes the interprovincial employee workforce described above. Many members of this group will move quickly out of the province as work declines and this out-mobility, even if it is a very short-term change, signals a weak market.
NON-RESIDENTIAL RANKINGS, RISKS AND MOBILITY
BuildForce assesses market conditions for 34 construction trades and occupations using a ranking system that combines measures of the change in employment, unemployment, net in-mobility and adjustments based on industry input. The rankings reflect non-residential market conditions unique to Alberta based on cur-rent and proposed construction activity. In addition, assumptions on provincial economic and population growth, new entrants to the labour force and migration patterns (interprovincial and inter-national) are built into the forecast scenario and included in the ranking assessment.
The rankings for some trades working in the non-residential sector are suppressed due to the small size of the workforce (<100 work-ers) and limited statistical reliability when assessing labour market conditions at the sector level. Trades may also be excluded because they typically do not work in the sector being assessed (e.g., home building and renovation managers in non-residential). For Alberta, non-residential rankings are reported for 33 trades and occupations.
Table 3 provides non-residential rankings for Alberta, showing weak labour markets across the first leg of the scenario period. Market conditions for trades involved in building construction weaken in 2017 and 2018. As overall economic conditions improve, moderate increased non-residential activity returns most markets to balance ‒ signalled by a rank of 3 ‒ at the start of a period of modest growth after 2019.
Source: Statistics Canada, BuildForce Canada
Figure 3: Non-residential construction employment growth outlook, Alberta
Maintenance Total industrial, commercial, institutional (ICI) Engineering
ALBERTA – CONSTRUCTION AND MAINTENANCE LOOKING FORWARD
6 ALBERTA – HIGHLIGHTS 2017–2026
MARKET RANKINGS
Needed workers meeting employer qualifications are not available in local markets to meet current demand so that projects or production may be delayed or deferred. There is excess demand, competition is intense and recruiting reaches to remote markets.
Workers meeting employer qualifications are generally not available in local markets to meet any increase. Employers will need to compete to attract additional workers. Recruiting and mobility may extend beyond traditional sources and practices.
The availability of workers meeting employer qualifications in the local market may be limited by large projects, plant shutdowns or other short-term increases in demand. Employers may need to compete to attract needed workers. Established patterns of recruiting and mobility are sufficient to meet job requirements.
Workers meeting employer qualifications are available in local markets to meet an increase in demand at the current offered rate of compensation and other working conditions.
Workers meeting employer qualifications are available in local markets to meet an increase in demand at the current offered rate of compensation and other current working conditions. Excess supply is apparent and there is a risk of losing workers to other markets.
The labour market assessment for some trades is limited by the small size of the workforce (<100 employed). In consultation with the provincial LMI committee, the rank is suppressed because of limited statistical reliability.
Source: BuildForce Canada
Employment -4,700 -12,200 -7,900
DemandLabour force change -2,400 -14,200 -9,100
Retirements -2,100 -10,600 -21,600
SupplyNew entrants 2,400 10,400 21,000
Net mobility -2,700 -13,900 -8,500
2016 5 years 2017–2021NON-RESIDENTIAL WORKFORCE ADJUSTMENT
10 years 2017–2026
Table 2: Change in the non-residential workforce, Alberta
ALBERTA – HIGHLIGHTS 2017–2026 7
CONSTRUCTION AND MAINTENANCE LOOKING FORWARD – ALBERTA
Source: BuildForce Canada
Boilermakers 2 2 2 2 3 3 3 3 3 3 3
Bricklayers 2 2 2 2 3 3 3 3 3 3 3
Carpenters 2 2 2 3 3 3 3 3 3 3 3
Concrete finishers 3 2 2 3 3 3 3 3 3 3 3
Construction estimators 2 2 2 2 3 3 3 3 3 3 3
Construction managers 3 2 2 2 3 3 3 3 3 3 3
Construction millwrights and industrial mechanics 2 2 2 3 2 3 3 3 3 3 3
Contractors and supervisors 2 2 2 3 3 3 3 3 3 3 3
Crane operators 2 2 3 3 3 3 3 3 3 3 3
Drillers and blasters 3 2 3 3 3 3 3 3 3 3 3
Electrical power line and cable workers 2 3 3 2 2 3 3 3 3 3 3
Electricians 2 2 2 3 3 3 3 3 3 3 3
Elevator constructors and mechanics 3 3 2 3 3 3 3 3 3 3 3
ALBERTA – CONSTRUCTION AND MAINTENANCE LOOKING FORWARD
8 ALBERTA – HIGHLIGHTS 2017–2026
Source: Statistics Canada, BuildForce Canada
Figure 4: Residential construction employment growth outlook, Alberta
Maintenance Renovations New housing
80,000
70,000
60,000
50,000
40,000
30,000
20,000
10,000
Figure 4 shows the employment trends by sector for residential construction.
THE AVAILABLE WORKFORCE
Falling residential requirements have resulted in a significant rise in unemployment and have forced thousands of workers to leave the residential workforce. At the same time, workers released from engineering and other non-residential work are seeking employ-ment opportunities. The 2017–2026 outlook suggests that these market dynamics will translate into a long-term rise in average rates of unemployment. While long-term growth is expected to be more moderate, industry must still contend with an aging workforce and the need to replace an estimated 14,600 workers exiting the resi-dential workforce over the coming decade. Attracting new entrants during periods of decline may pose challenges.
RESIDENTIAL HIGHLIGHTS
■ Housing starts in 2016 were down 40 percent compared to 2014 levels.
■ A slowing rate of out-migration from the province provides greater stability to residential employment in 2017 and 2018.
■ A recovery in new housing activity is projected to take hold in 2018 and is expected to increase in 2019 due to rising immigra-tion and household formations as the overall economy recovers.
■ Residential recovery is projected to add back 10,000 of the estimated 18,600 jobs lost between 2014 and 2016. By 2026, employment is 10 percent above 2016 levels, but remains well below the 2014 peak.
5 Household formation refers to the change in the number of households (persons living under one roof or occupying a separate housing unit) from one year to the next. It is the means by which population growth is transformed into demand for new housing.
RESIDENTIAL SECTOR
Alberta’s housing market was an early casualty of the oil price collapse. Increased uncertainty, rising unemployment and out- migration significantly weakened the housing market in 2015 and 2016, reducing new housing investment and renovation activity. Since the 2014 peak, employment has contracted by 25 percent, or 18,600 jobs.
The pace of employment decline slows in 2017 as housing starts and renovation activities stabilize. A partial recovery is expected after 2017 with slowing out-migration. An anticipated increase in household formations5 and moderate population growth help sus-tain a modest up-cycle in new housing construction between 2018 and 2022.
ALBERTA – HIGHLIGHTS 2017–2026 9
CONSTRUCTION AND MAINTENANCE LOOKING FORWARD – ALBERTA
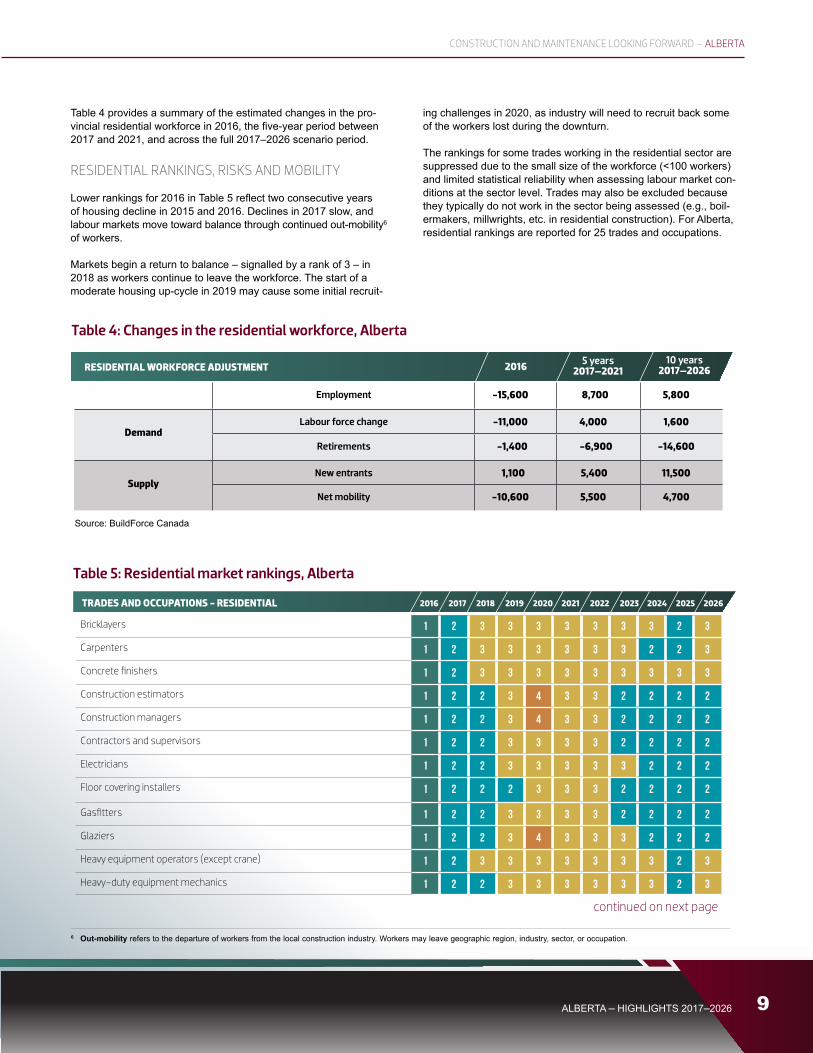
Employment -15,600 8,700 5,800
DemandLabour force change -11,000 4,000 1,600
Retirements -1,400 -6,900 -14,600
SupplyNew entrants 1,100 5,400 11,500
Net mobility -10,600 5,500 4,700
2016 5 years 2017–2021RESIDENTIAL WORKFORCE ADJUSTMENT
10 years 2017–2026
Table 4: Changes in the residential workforce, Alberta
Source: BuildForce Canada
6 Out-mobility refers to the departure of workers from the local construction industry. Workers may leave geographic region, industry, sector, or occupation.
Table 4 provides a summary of the estimated changes in the pro-vincial residential workforce in 2016, the five-year period between 2017 and 2021, and across the full 2017–2026 scenario period.
RESIDENTIAL RANKINGS, RISKS AND MOBILITY
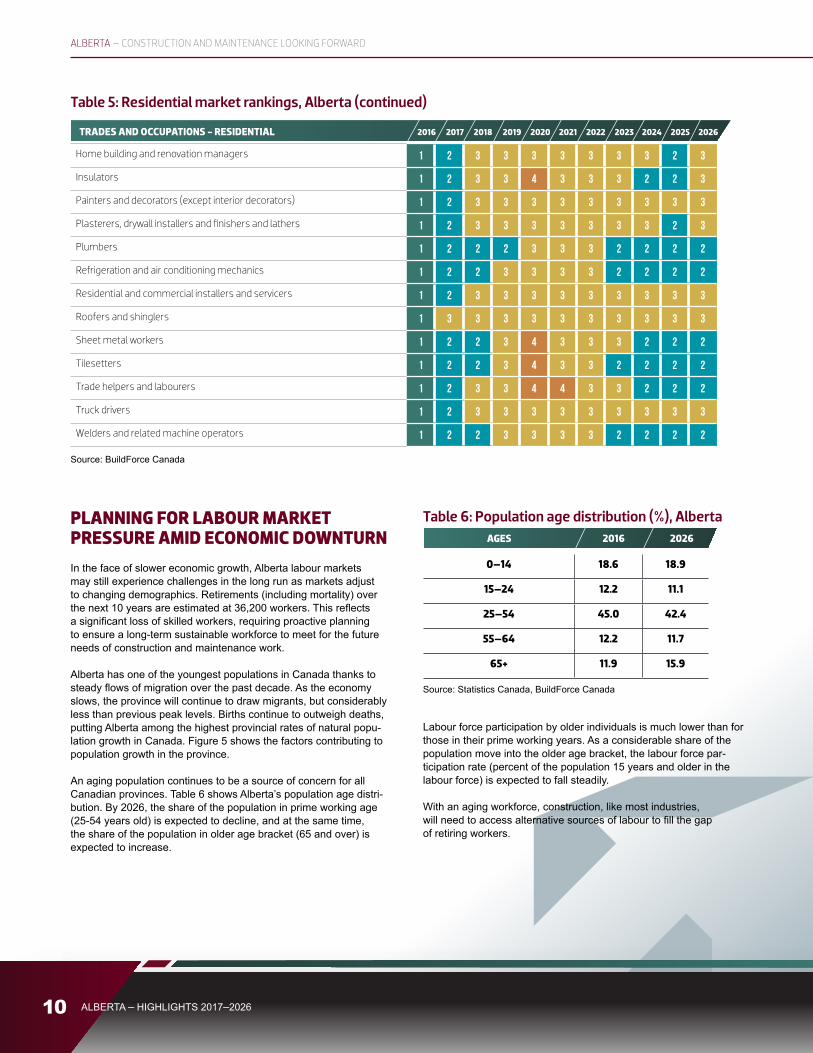
Lower rankings for 2016 in Table 5 reflect two consecutive years of housing decline in 2015 and 2016. Declines in 2017 slow, and labour markets move toward balance through continued out-mobility6 of workers.
Markets begin a return to balance ‒ signalled by a rank of 3 ‒ in 2018 as workers continue to leave the workforce. The start of a moderate housing up-cycle in 2019 may cause some initial recruit-
ing challenges in 2020, as industry will need to recruit back some of the workers lost during the downturn.
The rankings for some trades working in the residential sector are suppressed due to the small size of the workforce (<100 workers) and limited statistical reliability when assessing labour market con-ditions at the sector level. Trades may also be excluded because they typically do not work in the sector being assessed (e.g., boil-ermakers, millwrights, etc. in residential construction). For Alberta, residential rankings are reported for 25 trades and occupations.
ALBERTA – CONSTRUCTION AND MAINTENANCE LOOKING FORWARD
PLANNING FOR LABOUR MARKET PRESSURE AMID ECONOMIC DOWNTURNIn the face of slower economic growth, Alberta labour markets may still experience challenges in the long run as markets adjust to changing demographics. Retirements (including mortality) over the next 10 years are estimated at 36,200 workers. This reflects a significant loss of skilled workers, requiring proactive planning to ensure a long-term sustainable workforce to meet for the future needs of construction and maintenance work.
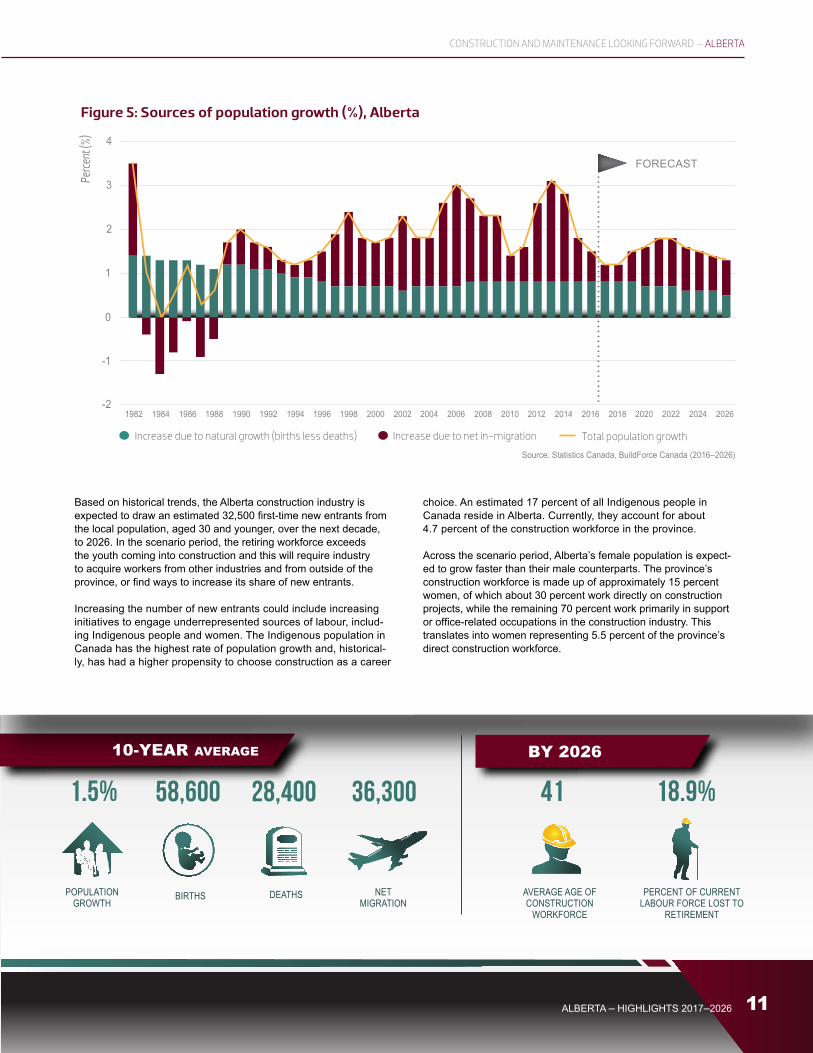
Alberta has one of the youngest populations in Canada thanks to steady flows of migration over the past decade. As the economy slows, the province will continue to draw migrants, but considerably less than previous peak levels. Births continue to outweigh deaths, putting Alberta among the highest provincial rates of natural popu-lation growth in Canada. Figure 5 shows the factors contributing to population growth in the province.
An aging population continues to be a source of concern for all Canadian provinces. Table 6 shows Alberta’s population age distri-bution. By 2026, the share of the population in prime working age (25-54 years old) is expected to decline, and at the same time, the share of the population in older age bracket (65 and over) is expected to increase.
Labour force participation by older individuals is much lower than for those in their prime working years. As a considerable share of the population move into the older age bracket, the labour force par-ticipation rate (percent of the population 15 years and older in the labour force) is expected to fall steadily.
With an aging workforce, construction, like most industries, will need to access alternative sources of labour to fill the gap of retiring workers.
Increase due to natural growth (births less deaths) Increase due to net in-migration Total population growth
1.5% 58,600 28,400 36,300 41 18.9%
Based on historical trends, the Alberta construction industry is expected to draw an estimated 32,500 first-time new entrants from the local population, aged 30 and younger, over the next decade, to 2026. In the scenario period, the retiring workforce exceeds the youth coming into construction and this will require industry to acquire workers from other industries and from outside of the province, or find ways to increase its share of new entrants.
Increasing the number of new entrants could include increasing initiatives to engage underrepresented sources of labour, includ-ing Indigenous people and women. The Indigenous population in Canada has the highest rate of population growth and, historical-ly, has had a higher propensity to choose construction as a career
choice. An estimated 17 percent of all Indigenous people in Canada reside in Alberta. Currently, they account for about 4.7 percent of the construction workforce in the province.
Across the scenario period, Alberta’s female population is expect-ed to grow faster than their male counterparts. The province’s construction workforce is made up of approximately 15 percent women, of which about 30 percent work directly on construction projects, while the remaining 70 percent work primarily in support or office-related occupations in the construction industry. This translates into women representing 5.5 percent of the province’s direct construction workforce.
ALBERTA – CONSTRUCTION AND MAINTENANCE LOOKING FORWARD
12 ALBERTA – HIGHLIGHTS 2017–2026
CONCLUSIONS AND IMPLICATIONSThe oil price collapse in 2015 marked the end of an extraordinary period of resource expansion. The employment declines and complex supply response that followed continues to unfold and reverberate throughout the Alberta economy and many labour markets across Canada. The full impacts are not yet clear, but the post hyper-expansion era has set in motion a complex transition of Alberta’s labour market, which presents both opportunities and risks for industry, and has implications for how future construction labour demands are met.
The 2017–2026 Construction and Maintenance Looking Forward scenario for Alberta anticipates weaker labour markets over the near term as current projects wind down. More moderate employ-ment growth is expected over the long term, with total employment remaining below the 2014 peak and higher than average unemploy-ment rates compared to the last decade.
Recruiting challenges may re-emerge in labour markets where employment growth is expected to be moderate and stable, even as other markets decline; for example, meeting the needs of major industrial shutdown and turnaround work with very distinct seasonal peak demands that often require specialized skills and experience for some trades and occupations.
In addition, industry will need to plan for an aging workforce and replacing retiring workers. Although hiring and attracting new entrants following a period of decline may pose challenges, failing to do so could result in a loss of training capacity and skew the demographic age profile of the future workforce, resulting in poten-tial skill gaps between older and younger workers.
The industry scenario-based approach developed by BuildForce Canada to assess future labour market conditions provides a pow-erful planning tool for industry, government and other stakeholders to better track labour market conditions and identify potential pres-sure points. The anticipated labour market conditions reflect the current long-run oil price outlook and industry capital investment assumptions. Any changes in to these assumptions present risks.
ALBERTA - HIGHLIGHTS 2017-2025 12
Timely construction forecast data is available online at constructionforecasts.ca. Create customized reports on a broad range of selected categories within sector, trade or province covering up to 10 years.