Construction of a survival prediction modelfor high-and low -grade UTUC after tumorresection based on “SEER database”: amulticenter studyMengmeng Wang1†, Xin Ren1†, Ge Wang1, Xiaomin Sun1, Shifeng Tang2, Baogang Zhang3, Xiaoming Xing4,Wenfeng Zhang1, Guojun Gao5, Jing Du6, Shukun Zhang7, Lijuan Liu2, Xia Zheng2, Zhenkun Zhang8 andChanggang Sun2,9*
Abstract
Background: There are differences in survival between high-and low-grade Upper Tract Urothelial Carcinoma(UTUC). Our study aimed to develop a nomogram to predict overall survival (OS) of patients with high- and low-grade UTUC after tumor resection, and to explore the difference between high- and low-grade patients.
Methods: Patients confirmed to have UTUC between 2004 and 2015 were selected from the Surveillance,Epidemiology and End Results (SEER) database. The UTUCs were identified and classified as high- and low-grade,and 1-, 3- and 5-year nomograms were established. The nomogram was then validated using the Chinesemulticenter dataset (patients diagnosed in Shandong, China between January 2010 and October 2020).
Results: In the high-grade UTUC patients, nine important factors related to survival after tumor resection wereidentified to construct nomogram. The C index of training dataset was 0.740 (95% confidence interval [CI]: 0.727–0.754), showing good calibration. The C index of internal validation dataset was 0.729(95% CI:0.707–0.750). On theother hand, Two independent predictors were identified to construct nomogram of low-grade UTUC. The C indexwas 0.714 (95% CI: 0.671–0.758) for the training set,0.731(95% CI:0.670–0.791) for the internal validation dataset.Encouragingly, the nomogram was clinically useful and had a good discriminative ability to identify patients at highrisk.
Conclusion: We constructed a nomogram and a corresponding risk classification system predicting the OS ofpatients with an initial diagnosis of high-and low-grade UTUC.
* Correspondence: [email protected]†Mengmeng Wang and Xin Ren contributed equally to this work.2Department of Oncology, Weifang Traditional Chinese Hospital, Weifang261000, Shandong, China9Qingdao Academy of Chinese Medical Sciences, Shandong University ofTraditional Chinese Medicine, Qingdao 266112, Shandong, People’s Republicof ChinaFull list of author information is available at the end of the article
Wang et al. BMC Cancer (2021) 21:999 https://doi.org/10.1186/s12885-021-08742-3
IntroductionUpper Tract Urothelial Carcinoma (UTUC) is a rela-tively rare tumor of the genitourinary system, affecting 2in every 100,000 people [1]. It accounts for approxi-mately 5 to 10% of urothelial malignancies [2, 3]. UTUCincludes renal pelvis tumors and ureteral tumors [2].Two-thirds of UTUC are reportedly invasive at the timeof diagnosis [4]. Therefore, radical nephroureterectomy(RNU) is the gold standard for the treatment of high-risk patients with UTUC [2, 5]. However, some patientsundergo minimally invasive treatment [6, 7]. Irrespectiveof the surgical method used, it is beneficial for the over-all survival rate.Tumor grade is a reliable predictor of cancer-related
prognosis in patients with UTUC because it is closely re-lated to cancer aggressiveness and tumor stage. At thesame time, it is also an important predictor of postoper-ative survival [8, 9]. According to the World HealthOrganization (2004/2016) classification, UTUC is di-vided into high- and low-grade [2], which is differentfrom the World Health Organization (1973) classifica-tion that included G1, G2, and G3. The high- and low-grade tumor grading system is a strong independent pre-dictor of UTUC recurrence and death. In a previousanalysis, high-grade tumors were found to be more ag-gressive than the low-grade tumors. Patients with highaggressive tumors have a lower survival rate [10],whereas those with low aggressive tumors have a highersurvival rate.The rationale for conducting postoperative evaluation
is that interventions can be directed toward those pa-tients most likely to benefit. For example, more thor-ough therapeutic interventions can be implemented forpatients with high-grade tumors, as well as preventionand early treatment for patients with low-grade tumors.Several groups have previously published nomogramsthat predict the outcome of tumor resection in patientswith UTUC [11, 12]. However, these studies treatedhigh-grade and low-grade as a single group and did notdiscuss the differences in survival prediction models be-tween the two grades. Although some studies have car-ried out survival model prediction for high-gradepatients, there is still a lack of low-grade models. There-fore, for clinical application, it is not easy and direct toconduct real-time and accurate evaluation for patients ofdifferent grades, leading to limitations in the clinical ap-plicability of UTUC prediction models. In addition, thereis still a lack of understanding of the overall survivalcharacteristics of patients with low- and high-grade tu-mors, and clinical trials are needed to conduct postoper-ative evaluation and validation.Due to the rarity of UTUC, trends in disease inci-
dence, associated demographic factors, and predictors ofcancer-related and overall survival outcomes are limited.
Although a previous study reported differences in sur-vival and clinical characteristics between patients withhigh- and low-grade tumors, it was a single center studywith a small sample size that was not representative[13]. Based on these considerations, we relied on theSurveillance Epidemiology and End Results (SEER) data-base of patients classified as high-grade and low-gradeafter tumor resection to build predictive models. Moreimportantly, we validated this model using the Chinesemulticenter external verification dataset.
MethodsPatient selectionIn this multicenter retrospective study, we retrieved datafor patients with UCTC from the SEER database. Thecase recruitment method is shown in Fig. 1. The criteriafor data extraction from the database were: (1) patientsdiagnosed with UTUC between 2004 and 2015; (2) theonly or the first primary tumor confirmed by histologywas UTUC,no history of bladder cancer or radical cyst-ectomy;(3) SEER records for which the InternationalClassification of Diseases for Oncology, third edition(ICD-O-3) codes included:“C65.9-Renal pelvis”,“C66.9-Ureter”;(4)(ICD-O-3) morphology:8020/3, 8031/38082/38120/38122/38130/38131/3;(5) tumor resection wasperformed; (6) clinicopathological and follow-up datawere available. The exclusion criteria included: (1) pa-tients with missing or incomplete data, such as tumorgrade, survival status and survival time, sex, laterality,race, American Joint Committee on Cancer (AJCC)stage, T stage, N stage, M stage, primary site and Lymphnode dissection;(2) patients followed up at 1 month orless than 1 month after initial diagnosis. Finally, eligiblepatients with UCTC in the SEER database were identi-fied and classified as high or low-grade.In addition, a Chinese multicenter verification dataset
(cancers diagnosed in three hospitals affiliated to Wei-fang Medical College, Weifang traditional Chinese Medi-cine Hospital,Weihai Municipal Hospital and People’sHospital Of Rizhao between January 2010 and October2020) was used for external verification. Through thehospital electronic medical record system, we have col-lected basic patient data, clinical and pathological infor-mation, and survival status. Except for the year ofdiagnosis, the inclusion and exclusion criteria of the ex-ternal validation dataset were the same for the Chinesemulticenter dataset. The information is anonymous andhas been approved by the ethics Committee of WeifangHospital of Traditional Chinese Medicine.
Data collectionDemographic and clinical data were retrieved, includingage, sex, race, grade, primary site of the tumor, laterality,tumor size, AJCC TNM stage, AJCC stage, histology
Wang et al. BMC Cancer (2021) 21:999 Page 2 of 16
type, Lymph node dissection, radiotherapy, and chemo-therapy. The AJCC and TNM stages were reclassified ac-cording to the AJCC 8th edition staging criteria [14].We used X-tile software to determine the best cut-offvalue for age at diagnosis and tumor size.The aim of UTUC treatment is to improve overall sur-
vival (OS) and achieve eventual cure. Therefore, the clin-ical endpoint of this study was OS, defined as the timefrom surgery to death, or the date of last follow-up forthose patients who were alive and reviewed.
Development, performance assessment and validation ofthe nomogramIn the training set, univariate Cox regression analysiswas used to test the predictors and multivariate Cox re-gression analysis was used to construct the pre-modelingof high-grade and low-grade OS respectively. Model 1included AJCC and TNM stages, and model 2 includedAJCC stage. The stopping rule of the backward stepwiseselection is guided by Akaike’s Information Criterion(AIC) [15]. Other predictor variables were the same forthe two models. We used the Harrell’s concordanceindex (C-index) to quantify the discrimination accuracyof the models [16]. On this basis, nomograms wereestablished for the high-and low-grade patients. The dis-criminant ability of line chart was quantitatively evalu-ated by C-index. Calibration curves were then drawn toevaluate the calibration of the nomograms. ROC curve(time-dependent AUC) were used to evaluate the dis-criminant ability of the nomogram. The performance ofthe nomogram was verified by the SEER internal verifi-cation dataset and external dataset from Chinese multi-center database.
Risk stratification based on the nomogramThe Kaplan-Meier method was used to compare thehigh- and low-grade risk stratification, risk stratificationof the training dataset, and validation dataset of thenomogram, as well as analyze the risk stratification ofradiotherapy. The Kaplan-Meier method was used to es-timate the probability of OS occurrence.
Statistical analysisFor comparison between groups, Univariate and multipleCox regression analysis and OS were calculated usingSPSS (IBM SPSS Statistics for Windows, Version 26.0.Armonk, NY: IBM Corp). X-tile software version 3.6.1(Yale University, New Haven, Connecticut, USA) wasused to determine the best cut-off value. Random group-ing was accomplished with the “CARET” package. Sur-vival analysis was performed by the “survival” softwarepackage. The nomogram and calibration chart are gener-ated using the “rms” software package. R software ver-sion 4.0.3 was used for analysis (R Foundation forStatistical Computing, Vienna, Austria, https://www.r-project.org/). In a two-tailed test, statistical significancewas set at P values less than 0.05.
ResultsPatient characteristicsAs shown in Fig. 1, the SEER database had a total of4149 eligible records for which UTUC histologic classifi-cation was high- or low-grade. The records were ran-domly divided into the SEER training dataset and SEERinternal validation dataset according to a 7:3 ratio. Themedian follow-up time for the entire dataset was 28months (interquartile range [IQR]: 13–60.5 months). In
Fig. 1 Flow chart illustrating patient selection for this study
Table 1 Patient and tumor characteristics of high-and low-grade datasets (Continued)
SEER Whole SEER Training SEER Validation Chinese Validation
Population[cases(%)]
Cohort[cases(%)]
Cohort[cases(%)]
Cohort[cases(%)]
N0 2837 (81.6) 1982 (81.4) 855 (82.2) 53 (80.3)
N1 354 (10.2) 255 (10.5) 99 (9.5) 7 (10.6)
N2 285 (8.2) 199 (8.2) 86 (8.3) 6 (9.1)
M
M0 3214 (92.5) 2251 (92.4) 963 (92.6) 61 (92.4)
M1 262 (7.5) 185 (7.6) 77 (7.4) 5 (7.6)
Ln_surg
yes 1220 (35.1) 868 (35.6) 352 (33.8) 12 (18.1)
no 2256 (64.9) 1568 (64.4) 688 (66.2) 54 (81.8)
Radiation
yes 246 (7.1) 165 (6.8) 81 (7.8) 4 (6.1)
no 3230 (92.9) 2271 (93.2) 959 (92.2) 62 (93.9)
Chemotherapy
yes 930 (26.8) 647 (26.6) 283 (27.2) 29 (43.9)
no 2546 (73.2) 1789 (73.4) 757 (72.8) 37 (56.1)
Low grade Characteristis
Total 673 473 200 33
Age
Median (IQR),years: 69 (61–78)
<=71 378 (56.2) 271 (57.3) 107 (53.5) 18 (54.5)
> 71 295 (43.8) 202 (42.7) 93 (46.5) 15 (45.5)
– – – – –
Sex
male 399 (59.3) 282 (59.6) 117 (58.5) –
female 274 (40.7) 191 (40.4) 83 (41.5) –
Race
white 591 (87.8) 419 (88.6) 172 (86.0) –
black 33 (4.9) 21 (4.4) 12 (6.0) –
other 49 (7.3) 33 (7.0) 16 (8.0) –
Primary_site
Renal pelvis 449 (66.7) 312 (66.0) 137 (68.5) –
Ureter 224 (33.3) 161 (34.0) 63 (31.5) –
Grade
I 145 (21.5) 103 (21.8) 42 (21.0) –
II 528 (78.5) 370 (78.2) 158 (79.0) –
Laterity
left 344 (51.1) 247 (52.2) 97 (48.5) –
right 329 (48.9) 226 (47.8) 103 (51.5) –
Tumor_size
Median (IQR),mm: 32 (22.5–47.5)
<=20mm 147 (21.8) 90 (19.0) 57 (28.5) –
> 20mm 526 (78.2) 383 (81.0) 143 (71.5) –
Wang et al. BMC Cancer (2021) 21:999 Page 5 of 16
addition, 99 eligible UTUC records were obtained froma multicenter database in China, which served as an ex-ternal validation dataset for this study.In Table 1, the median ages of the high- and low-
grade cohorts were 73 and 69 years, respectively; thus,the median age of the high-grade patients was higherthan that of the low-grade patients. The median tumorsize (40 mm vs. 32 mm) of the high- and low-grade pa-tients showed that the size of high-grade tumors was lar-ger than that of low-grade tumors. Regarding the Tstage, the high-grade patients were mainly in stage T3(48.1%), whereas the low-grade patients were mainly instage T1 (58.2%). In addition, N0 and M0 accounted for
the majority in the high- and low- grade patients. Interms of treatment, 35.1% of the high-grade patientsunderwent Lymph node dissection, which was higherthan the percentage of low-grade patients (18.4%). Theproportion of patients receiving radiotherapy andchemotherapy was relatively small. Appendix Table 2showed the percentage of surgical procedures.
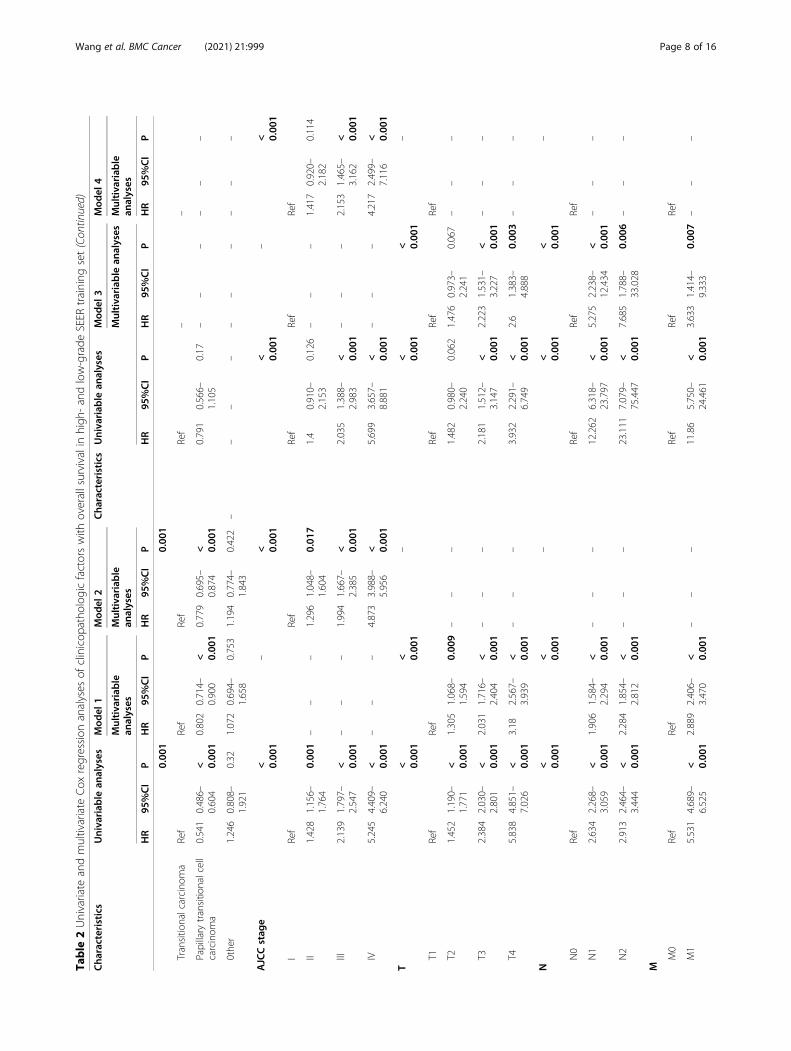
Development and performance evaluation of nomogramTable 2 shows the results of univariate and multivariateCOX regression analysis in the high- and low-gradetraining dataset. In the high-grade multivariate COX re-gression results, age at diagnosis, AJCC stage, AJCC
Table 1 Patient and tumor characteristics of high-and low-grade datasets (Continued)
SEER Whole SEER Training SEER Validation Chinese Validation
Data are n or n (%) unless indicated otherwise. AJCC the American Joint Committee on Cancer, Ln_ dissection Lymph node dissection
Wang et al. BMC Cancer (2021) 21:999 Page 6 of 16
Table
2Univariate
andmultivariate
Cox
regression
analyses
ofclinicop
atho
logicfactorswith
overallsurvivalinhigh
-andlow-grade
SEER
training
set
Cha
racteristics
Univariab
lean
alyses
Mod
el1
Mod
el2
Cha
racteristics
Univariab
lean
alyses
Mod
el3
Mod
el4
Multivariab
lean
alyses
Multivariab
lean
alyses
Multivariab
lean
alyses
Multivariab
lean
alyses
HR
95%CI
PHR
95%CI
PHR
95%CI
PHR
95%CI
PHR
95%CI
PHR
95%CI
P
Age
< 0.00
1< 0.00
1< 0.00
1
<=66
Ref
Ref
Ref
<=71
Ref
Ref
Ref
67–80
1.609
1.411–
1.833
< 0.00
11.585
1.387–
1.811
< 0.00
11.631
1.427–
1.864
< 0.00
1>71
2.734
2.008–
3.724
< 0.00
12.842
2.064–
3.913
< 0.00
12.938
2.129–
4.053
< 0.00
1
>80
2.567
2.223–
2.964
< 0.00
12.389
2.051–
2.782
< 0.00
12.444
2.099–
2.846
< 0.00
1–
––
––
––
––
Sex male
Ref
Ref
––
female
1.045
0.940–
1.160
0.415
––
––
––
1.084
0.800–
1.468
0.602
––
––
––
Race
0.641
––
0.946
––
white
Ref
Ref
black
1.123
0.880–
1.434
0.351
––
––
––
1.071
0.502–
2.286
0.86
––
––
––
othe
r1.018
0.856–
1.211
0.837
––
––
––
0.915
0.483–
1.735
0.786
––
––
––
Prim
ary_site
Renalp
elvis
Ref
Ref
––
Ureter
0.975
0.871–
1.092
0.668
––
––
––
1.139
0.831–
1.561
0.419
––
––
––
Laterality
left
Ref
Ref
––
right
1.035
0.932–
1.149
0.521
––
––
––
0.954
0.706–
1.290
0.761
––
––
––
Grade
lllRef
IRef
––
IV1.006
0.901–
1.122
0.916
––
––
––
II1.313
0.901–
1.912
0.156
––
––
––
Tumor_size
<65
mm
Ref
Ref
Ref
<=20
mm
Ref
––
>=65
mm
2.085
1.847–
2.354
< 0.00
11.311
1.141–
1.506
< 0.00
11.447
1.270–
1.648
< 0.00
1>20
mm
1.104
0.740–
1.647
0.627
––
––
––
Histology
<0.00
1<
Wang et al. BMC Cancer (2021) 21:999 Page 7 of 16
Table
2Univariate
andmultivariate
Cox
regression
analyses
ofclinicop
atho
logicfactorswith
overallsurvivalinhigh
-andlow-grade
SEER
training
set(Con
tinued)
Cha
racteristics
Univariab
lean
alyses
Mod
el1
Mod
el2
Cha
racteristics
Univariab
lean
alyses
Mod
el3
Mod
el4
Multivariab
lean
alyses
Multivariab
lean
alyses
Multivariab
lean
alyses
Multivariab
lean
alyses
HR
95%CI
PHR
95%CI
PHR
95%CI
PHR
95%CI
PHR
95%CI
PHR
95%CI
P
0.00
10.00
1
Transitio
nalcarcino
ma
Ref
Ref
Ref
Ref
––
Papillary
transitio
nalcell
carcinom
a0.541
0.486–
0.604
< 0.00
10.802
0.714–
0.900
< 0.00
10.779
0.695–
0.874
< 0.00
10.791
0.566–
1.105
0.17
––
––
––
0the
r1.246
0.808–
1.921
0.32
1.072
0.694–
1.658
0.753
1.194
0.774–
1.843
0.422
––
––
––
––
––
AJCCstag
e< 0.00
1–
< 0.00
1< 0.00
1–
< 0.00
1
IRef
Ref
Ref
Ref
Ref
II1.428
1.156–
1.764
0.00
1–
––
1.296
1.048–
1.604
0.01
71.4
0.910–
2.153
0.126
––
–1.417
0.920–
2.182
0.114
lll2.139
1.797–
2.547
< 0.00
1–
––
1.994
1.667–
2.385
< 0.00
12.035
1.388–
2.983
< 0.00
1–
––
2.153
1.465–
3.162
< 0.00
1
IV5.245
4.409–
6.240
< 0.00
1–
––
4.873
3.988 –
5.956
< 0.00
15.699
3.657–
8.881
< 0.00
1–
––
4.217
2.499–
7.116
< 0.00
1
T< 0.00
1< 0.00
1–
< 0.00
1< 0.00
1–
T1Ref
Ref
Ref
Ref
Ref
T21.452
1.190–
1.771
< 0.00
11.305
1.068–
1.594
0.00
9–
––
1.482
0.980–
2.240
0.062
1.476
0.973–
2.241
0.067
––
–
T32.384
2.030–
2.801
< 0.00
12.031
1.716–
2.404
< 0.00
1–
––
2.181
1.512–
3.147
< 0.00
12.223
1.531–
3.227
< 0.00
1–
––
T45.838
4.851–
7.026
< 0.00
13.18
2.567–
3.939
< 0.00
1–
––
3.932
2.291–
6.749
< 0.00
12.6
1.383–
4.888
0.00
3–
––
N< 0.00
1< 0.00
1–
< 0.00
1< 0.00
1–
N0
Ref
Ref
Ref
Ref
N1
2.634
2.268–
3.059
< 0.00
11.906
1.584–
2.294
< 0.00
1–
––
12.262
6.318–
23.797
< 0.00
15.275
2.238–
12.434
< 0.00
1–
––
N2
2.913
2.464–
3.444
< 0.00
12.284
1.854–
2.812
< 0.00
1–
––
23.111
7.079–
75.447
< 0.00
17.685
1.788–
33.028
0.00
6–
––
M
M0
Ref
Ref
Ref
Ref
Ref
M1
5.531
4.689–
6.525
< 0.00
12.889
2.406–
3.470
< 0.00
1–
––
11.86
5.750–
24.461
< 0.00
13.633
1.414–
9.333
0.00
7–
––
Wang et al. BMC Cancer (2021) 21:999 Page 8 of 16
Table
2Univariate
andmultivariate
Cox
regression
analyses
ofclinicop
atho
logicfactorswith
overallsurvivalinhigh
-andlow-grade
SEER
training
set(Con
tinued)
Cha
racteristics
Univariab
lean
alyses
Mod
el1
Mod
el2
Cha
racteristics
Univariab
lean
alyses
Mod
el3
Mod
el4
Multivariab
lean
alyses
Multivariab
lean
alyses
Multivariab
lean
alyses
Multivariab
lean
alyses
HR
95%CI
PHR
95%CI
PHR
95%CI
PHR
95%CI
PHR
95%CI
PHR
95%CI
P
Ln_d
issectiondissectio
n
yes
Ref
Ref
Ref
Ref
no0.743
0.667–
0.827
< 0.00
11.223
1.067–
1.401
0.00
41.179
1.045–
1.331
0.00
80.774
0.531–
1.127
0.181
––
––
––
Radiation
yes
Ref
Ref
Ref
Ref
Ref
Ref
no0.475
0.398–
0.566
< 0.00
10.699
0.583–
0.838
< 0.00
10.732
0.611–
0.878
0.00
10.268
0.119–
0.608
0.00
20.814
0.282–
2.347
0.703
0.634
0.249–
1.613
0.339
Che
mothe
rapy
yes
Ref
Ref
Ref
Ref
Ref
Ref
no0.845
0.751–
0.950
0.00
51.324
1.157–
1.516
< 0.00
11.243
1.088–
1.420
0.00
10.468
0.301–
0.729
0.00
10.852
0.467–
1.555
0.603
0.665
0.388–
1.139
0.137
AJCCtheAmerican
JointCom
mittee
onCan
cer,CI
confiden
ceinterval,H
RHazardRa
tio,Ln_
dissectio
nLymph
node
dissectio
n,SEER
theSu
rveillanceEp
idem
iology
,and
EndRe
sults
databa
se
Wang et al. BMC Cancer (2021) 21:999 Page 9 of 16
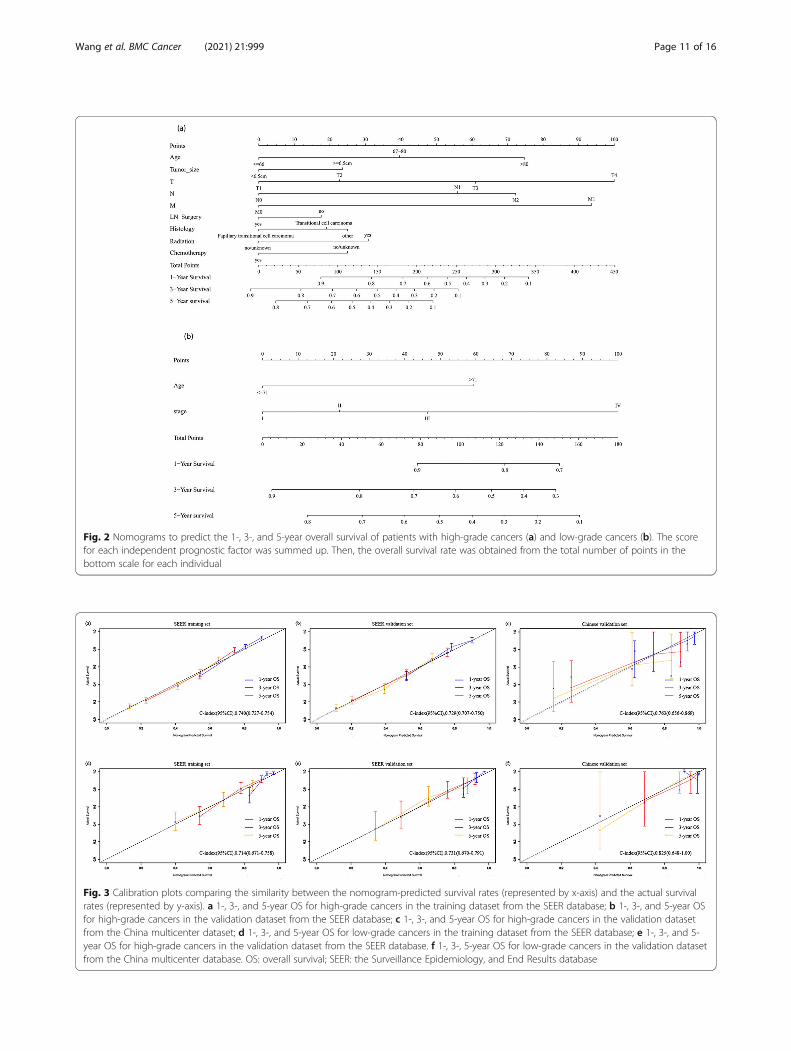
TNM stage, tumor size, Lymph node dissection, hist-ology type, radiotherapy, and chemotherapy were signifi-cantly related to OS. To get an optimal model, wecreated two models and compared them. In bothmodels, age at diagnosis, tumor size, Lymph node dis-section, pathological type, radiotherapy, and chemother-apy were included. Model 1 included T, N, M stage, andmodel 2 included AJCC stage. Table 3 lists the C-indexof various models; compared to model 2, model 1showed superior resolution in predicting OS (C-indexindex, 0.740; 95% confidence interval [CI], 0.727–0.754;P < 0.001) (Table 3). Therefore, model 1 was selected asthe final model and following these regression results,we drew the corresponding nomogram (Fig. 2a). Inaddition, the nomogram of the training set showed goodcalibration (Fig. 3a).The low grade, multivariate COX regression model
showed that age at diagnosis, AJCC stage, and AJCCTNM stage were significantly related to OS. Similar tothe high-grade, two models (model 3 including T, N,and M stages; and model 4 including the AJCC stage)were established for optimal selection, and age at diag-nosis was included in both models. Table 3 shows theC-index results of each model. There was no significantdifference between model 3 and model 4 in predictingOS resolution (P = 0.474). To ensure a balanced propor-tion of patients in each stage, model 4 (C index, 0.714;95% CI, 0.671–0.758) was selected as the best model anda nomogram was drawn (Fig. 2b). The calibration curveof OS within 1-, 3- and 5-year also showed a good cali-bration of the nomogram (Fig. 3d). The area under thecurve (AUC) values of 1-, 3- and 5-year predicted by thenomogram were all greater than 0.7 in the training setfor high- and low-grade UTUCs (Fig. 4a and d). Appen-dix Table 1 shows the regression coefficients.
Validation of the nomogramThe SEER internal validation dataset (Fig. 3b): C-index,0.729;95\% CI,0.707–0.750) and the Chinese multi-center external validation dataset (Fig. 3c): C-index,0.763; 95\% CI, 0.656–0.869) showed a good
recognition ability of the high-grade nomogram. Inaddition, In the low-grade cohort, both the SEER in-ternal validation data set and the Chinese multi-centerexternal validation dataset showed excellent discrimin-ation on the nomogram, with a C-index of 0.731 and0.825, respectively (Fig. 3e and f). These results showedthat there was good consistency between the validationand training dataset regarding prediction of the nomo-gram. Therefore, we concluded that the proposed nomo-gram performed well on both the training set and theverification set. In addition, the 1-, 3- and 5-year pre-dicted AUC values of the SEER internal validation data-set and external validation dataset from Chinesemulticenter database were also greater than 0.7 (Fig. 4b,c, e and f).
Risk stratification based on the nomogramInitially, risk stratification was done for patients withhigh-and low-grade tumors. The Kaplan-Meier curveshowed that there was a significant difference in the sur-vival rate between the two groups, with the low-gradeOS being significantly higher than the high-grade OS(Fig. 5a): P < 0.001). Finally, according to the total scorecalculated by the nomogram, the high-grade and low-grade patients were stratified into two risk groups: low-risk and high-risk. In the high-grade training and in-ternal validation datasets and the Chinese multicenterexternal validation dataset, the Kaplan-Meier OS curvesshowed significant differences between the two riskgroups (Fig. 6a, b and c): P < 0.001). The same resultswere observed for the low-grade datasets (Fig. 6d, e):P < 0.001,6(f): p < 0.03). In addition, survival analysis ofpatients on radiotherapy showed significant improve-ment in OS in patients who did not receive radiotherapy(Fig. 5b): P < 0.001). Appendix Figure 2 showed Kaplan–Meier survival curves of patients with UTUC after vari-ous surgical procedures.
DiscussionUTUC is a rare disease. There is currently little clinicalunderstanding of the prognosis of patients with high-and low-grade UTUCs. We conducted survival analysisof patients with low- and high- grades, and the resultsshowed significant differences (P < 0.001). Based on theSEER database, this study constructed correspondingprediction models for patients with high- and low-gradeUTUC following tumor resection. In the high-gradeUTUC patients, nine important factors related to sur-vival after tumor resection were identified, whereas inthe low-grade UTUC patients, two important factors re-lated to survival were identified. In addition, the SEERinternal verification dataset and Chinese multicenter ex-ternal verification dataset were used for validation. Theresults showed that these models exhibited good
Table 3 Performance of models in the SEER training set
Models C-index(95% CI) P*
High grade
Model 1 0.740 (0.727–0.754) –
Model 2 0.734 (0.720–0.747) 0.0006
Low grade
Model 3 0.717 (0.673–0.761) –
Model 4 0.714 (0.671–0.758) 0.474
SEER the Surveillance Epidemiology, and End Results database, AJCC theAmerican Joint Committee on Cancer*P values were obtained by comparing model 1 with model 2,as well as model3 with model 4
Wang et al. BMC Cancer (2021) 21:999 Page 10 of 16
Fig. 2 Nomograms to predict the 1-, 3-, and 5-year overall survival of patients with high-grade cancers (a) and low-grade cancers (b). The scorefor each independent prognostic factor was summed up. Then, the overall survival rate was obtained from the total number of points in thebottom scale for each individual
Fig. 3 Calibration plots comparing the similarity between the nomogram-predicted survival rates (represented by x-axis) and the actual survivalrates (represented by y-axis). a 1-, 3-, and 5-year OS for high-grade cancers in the training dataset from the SEER database; b 1-, 3-, and 5-year OSfor high-grade cancers in the validation dataset from the SEER database; c 1-, 3-, and 5-year OS for high-grade cancers in the validation datasetfrom the China multicenter dataset; d 1-, 3-, and 5-year OS for low-grade cancers in the training dataset from the SEER database; e 1-, 3-, and 5-year OS for high-grade cancers in the validation dataset from the SEER database. f 1-, 3-, 5-year OS for low-grade cancers in the validation datasetfrom the China multicenter database. OS: overall survival; SEER: the Surveillance Epidemiology, and End Results database
Wang et al. BMC Cancer (2021) 21:999 Page 11 of 16
Fig. 4 Comparison of the AUC values of the1-, 3-, and 5-year OS for high-grade and low-grade cancers. The AUC values of the nomograms in thetraining and validation datasets for OS of high-grade (a, b) and low-grade (d, e), and the Chinese validation dataset for high-grade (c) and low-grade (f). AUC: area under the curve; OS: overall survival
Fig. 5 Kaplan–Meier survival curves of patients. Kaplan–Meier survival curves of OS in: (a) high-and low-grade datasets (b) patients undergoingradiotherapy; OS: overall survival; SEER: the Surveillance Epidemiology, and End Results database
Wang et al. BMC Cancer (2021) 21:999 Page 12 of 16
identification and calibration capabilities. Finally, weused these models to evaluate the risk of patients.A recent NMIBC EAU Guidelines-panelstudy by van
Rhijn et al. support the assumption of reporting bothWHO grading scores. In this prognostic factor study theauthors found that both classification systems wereprognostic for progression but not for recurrence[17].UTUC is naturally similar to bladder cancer, andmost studies have been based on the use of 1973WHOclassifications, which is a triplex classification system.However, the guideline shows that high and low level di-chotomy is an important Risk stratification. In clinicalapplication, the prediction model of classification (2004/2016) also has great clinical significance, but few peoplehave studied its clinical applicability, so it is necessary todiscuss and study the high and low levels respectively.In this study, we found that the 5-year OS after tumor
resection was 70.23% for low-grade patients and 40.45%for high-grade patients. Robert et al. found that the 5-year OS for low-grade tumors was 69.4% and that forhigh-grade tumors was 24.2% [18]. Compared to ourstudy, the OS rate of low-grade patients was similar, but
the survival rate of high-grade patients was greatly im-proved, indicating that although diagnostic techniquesand treatment methods have been developed over theyears, there is an urgent need to further study survivaland clinical features in patients with low-grade UTUCsto guide better outcomes. However, regardless of howthe outcomes and endpoints were selected, most studiesanalyzed patients with high and low grades as a whole,without analyzing the differences in their clinical charac-teristics. Recently, some studies reported relapse-freesurvival and postoperative recurrence in high-grade pa-tients [19, 20], whereas there are few studies on thesepredictions for low-grade patients.The 2020 guideline proposed an overall cut-off value
of 2 cm for high - and low-risk UTUC tumor size. Theoverall median age after RNU was 69.7 years [4]. How-ever, most previous studies have analyzed the age atdiagnosis and tumor size of high and low grades as awhole, and have not analyzed the two separately. In thisstudy, we found that the median age of high-grade pa-tients was higher than that of lower-grade patients,which is similar to the results of Bjarte et al. This finding
Fig. 6 Kaplan–Meier survival curves categorized into low-risk and high-risk groups. a high-grade training dataset; b high-grade validation datasetin the SEER database; c high-grade validation dataset in the China multicenter database; d low-grade training dataset; e low-grade validationdataset in the SEER database; f low-grade validation set in the Chinese multicenter database. OS: overall survival; SEER: the SurveillanceEpidemiology, and End Results database
Wang et al. BMC Cancer (2021) 21:999 Page 13 of 16
may be due to the change in tumor cell potential causedby increasing age and the decrease in host defensemechanisms, which makes malignant tumors more likelyto occur [13]. In addition, T3 patients accounted for48.1% of high-grade patients, whereas most of the low-grade patients were T1 (58.2%). The results of Gordona-Brown et al. also supports our observations [21]. Themedian tumor size was larger in high-grade patientsthan in low-grade patients (40 mm vs. 32 mm). All of theabove analyses showed that high-grade tumors are moreinvasive and dangerous than low-grade tumors. Import-antly, the regression analysis of high-grade patientsshowed a significant correlation with better survival inpatients who received chemotherapy and Lymph nodedissection. These results suggest that high-grade patientsshould be actively treated to improve survival. Comparedwith high-grade tumors, histological types, tumor size,and treatment were not significantly associated with sur-vival in low-grade patients. Second, low-grade tumorsare less invasive and less likely to have recurrence andmetastasis. Therefore, follow-up treatment is not heeded,but there are still low-grade patients with a high degreeof advanced malignancy [10]. As a result, effective treat-ment guidance cannot be given to these patients. Insummary, we developed a new nomogram to addressthese problems in patients with high- and low-gradetumors.Previous studies have shown that T, N, and M stage,
age at diagnosis, histological types, Lymph node dissec-tion, tumor size, and treatment are all independent pre-dictors of OS in patients with postoperative UTUC [9].This is similar to the results of Cox multivariate regres-sion analyses of the high-grade patients in our study. Inthe process of constructing the high-grade nomogram,TNM stage was the main part of the final risk scorecompared to the AJCC stage. When combined with othervariables, TNM staging showed significant favorable prog-nostic performance. Therefore, the use of AJCC TNM sta-ging may better guide clinical decisions when predictingprognosis in high-grade patients. For low-grade patients,multivariate Cox regression analysis showed that age at diag-nosis was significantly related to AJCC stage and AJCCTNM stage, but the combined AJCC stage did not show asignificant correlation with TNM when constructing themodel. However, as a single variable, AJCC stage is sufficientand convenient than TNM in overall data collection, so wechose age and AJCC stage as independent predictors for pa-tients with low-grade UTUC. It is important to note that theprediction model has been verified by internal and externaldata, showing a good prediction efficiency.The Kaplan-Meier curve showed that in the high-
grade dataset, the OS of higher-risk patients was lowerthan that of lower-risk patients (55.84% vs. 17.53%) (P <0.001). This may suggest that the patient is at a more
advanced stage; thus, higher vigilance and active treat-ment is required when managing these high-risk patientsto improve the overall survival rate. In the low-gradedataset, the OS of low-risk patients (81.22%) was higherthan that of high-risk patients (57.43%). Therefore, it isnecessary to detect and treat such high-risk patients asearly as possible in clinical practice to prevent the con-tinued development of their tumors.Some controversial factors related to the prognosis of
UTUC have been found in previous studies. Other stud-ies that have examined adjuvant radiotherapy alone havenot shown any benefit on overall survival [9]. Otherstudies have shown that radiotherapy is associated witha better prognosis [22]. In this study, the Kaplan-Meiercurve of high-grade patients receiving radiotherapyshowed that the OS of patients receiving radiotherapywas lower than that of patients without radiotherapy.However, the inclusion of adjuvant radiotherapy in-creased the C-index of the nomogram, indicating itsvalue in predicting OS in patients with UTUC. Inaddition, more patients with T3/T4 cancers receivedradiotherapy (88.9%), but the overall survival was worsethan that of patients with T1/T2 cancers. Previous stud-ies have shown that patients with T3/T4 cancer who re-ceived radiotherapy had a higher OS than those who didnot receive radiotherapy. However, regardless of radio-therapy, patients with T3/T4 cancers had a lower OSthan patients with T1/T2 cancer [22]. This supports ourfindings. Second, the majority of patients with radiother-apy are in advanced stages, and the adverse effects ofradiotherapy on their survival cannot be ignored. Ournomogram also showed that radiotherapy is an import-ant harmful factor, emphasizing the need to be cautiouswith patients who are administered UTUC radiotherapy.In this study, the proportion of various surgical
methods of high and low UTUC is shown. The RNUsurgical method accounted for the majority of high- andlow-grade patients, 57.6 and 60.3%, respectively. Localtumor excision accounted for the least, with 1.2 and4.1% respectively. Then constructed a survival analysisbased on high and low levels. Survival analysis showedthat among high-grade UTUC patients, the survival ad-vantage of Partial or subtotal nephrectomy and RNUwas significantly better than that of patients with othersurgical methods (p < 0.001). Among low-grade UTUCpatients, the survival advantage of RNU was significantlybetter than that of patients with other surgical methods(p < 0.001). In summary, the RNU operation method hasgained more survival time for the patient. In addition tothe benefits of the operation itself, it is not ruled out thatthe postoperative combination of cisplatin chemotherapycan bring more significant advantages to the patient [2].The variables involved in this study are all clinically
easy to collect, and the external verification data show
Wang et al. BMC Cancer (2021) 21:999 Page 14 of 16
that they are of high clinical applicability. The totalnumber of points calculated from the established nomo-gram can become a new factor in predicting survival forhigh and low grade patients. The exciting developmentis that we achieved excellent discrimination and calibra-tion of the nomogram in the validation dataset. Moreimportantly, the C-index of the China Shandong cohortwas 0.763 for the high-grade cohort, and 0.825 for thelow-grade cohort. The AUC values of external datasetfor high- and low-grade predictive 1-year OS were 0.726and 0.769; 3-year OS were 0.747 and 0.725; and 5-yearOS were 0.764 and 0.711, respectively. In addition, thecalibration further confirmed the accuracy of the nomo-gram between the predicted OS and the observed OS forhigh- and low-grade patients in Shandong Province, in-dicating that the nomogram based on the SEER databaseis also suitable for patients in Shandong Province, China.Some limitations of this study are as follows. First, this
study may be limited due to the retrospective nature ofthe study. We excluded patients whose data were miss-ing during the data collection process so as not to com-promise the credibility of the results. Second, thenomogram may lack some potential predictors becausethe information was not consistent in the retrieved dataset. Such as CKD, tumor multifocality, lymphovascularinvasion, specific adjuvant chemotherapy,specific chemo-radiotherapy information,template-based manneretc.be-cause these informations were not inaccessible in theSEER database or uniformly available in the Chinesemulticenter datasets. A comprehensive nomogram thattakes into account all potential predictors may have bet-ter prognostic performance. Third, biopsy grade may stillbe affected by non-negligible sampling error rate [23],especially for large tumors. In order to avoid this effect,the study included patients after surgical resection of thetumor, which may not be applicable for patients withonly preoperative ureteral biopsy grading and patientswith unknown grade. Finally, even if rigorous tests showvery reliable line chart results, the limited range of infor-mation obtained from standard clinicopathological vari-ables, the lack of external data, and the short follow-uptime lead to insufficient low-grade 5-year follow-up dataand imperfect prognostic accuracy. We hope thatthrough continuous research, this model can be ex-tended with additional external data to further improvethe prediction of tumor prognosis and optimize patientcare.
ConclusionIn summary, the constructed nomogram provides aneasy-to-use tool to guide personalized clinical decisionsabout management choices when targeting high-andlow-grade patients.
Supplementary InformationThe online version contains supplementary material available at https://doi.org/10.1186/s12885-021-08742-3.
Additional file 1: Appendix Table 1. Cox regression coefficients of thetwo models of the SEER training set. AJCC: the American JointCommittee on Cancer; CI: confidence interval; HR: Hazard Ratio; Ln_surg:Lymph node dissection; SEER: the Surveillance Epidemiology, and EndResults database.
Additional file 2: Appendix Table 2. A table showing the percentageof surgical procedures. Partial nephrectomy: Partial or subtotalnephrectomy (kidney or renal pelvis) or partial ureterectomy;RNU:Complete/total/simple nephrectomy - for kidney parenchymaNephroureterectomy; Any nephrectomy: Any nephrectomy (simple,subtotal, complete, partial, total, radical) PLUS an en bloc:resection ofother organ(s) (colon, bladder); Nephrectomy, NOS:Nephrectomy,NOS;Ureterectomy, NOS.
Additional file 3: Appendix Figure 1. (a-d) X-tile plots of age at diag-nosis, identifying the best risk score cut-off based on the overall survival(OS) in the high- and low-grades; (e-h)X-tile plots of tumor size, identify-ing the best risk score cut-off based on the OS in the high- and low-grades.
Additional file 4: Appendix Figure 2. Kaplan–Meier survival curves ofpatients with UTUC after various surgical procedures. (a) Kaplan–Meiersurvival curves of patients with high-grade UTUC after various surgicalprocedures (b) Kaplan–Meier survival curves of patients with low-gradeUTUC after various surgical procedures. Partial nephrectomy: Partial orsubtotal nephrectomy (kidney or renal pelvis) or partial ureterectomy;RNU:Complete/total/simple nephrectomy - for kidney parenchymaNephroureterectomy; Any nephrectomy: Any nephrectomy (simple, sub-total, complete, partial, total, radical) PLUS an en bloc:resection of otherorgan(s) (colon, bladder); Nephrectomy, NOS:Nephrectomy, NOS;Ureter-ectomy, NOS.
AcknowledgementsNot applicable.
Authors’ contributionsStudy concept and design: M. Wang, X. Ren, and C.Sun. Acquisition of data:M. Wang, X. Ren, G.Wang, X.Sun and W.Zhang. Analysis and interpretation ofdata: M. Wang, X. Ren, G. Wang and X.Sun. Drafting of the manuscript: M.Wang, X.Ren. Critical revision of the manuscript for important: S.Tang; B.Zhang and C.Sun. Statistical analysis: M. Wang, X.Ren. Obtained funding:G.Gao, J. Du, X.Xing, S.Zhang, L.Liu, X.Zheng, Z.Zhang and C.Sun. The authorsread and approved the final manuscript.
FundingNo specific funding was disclosed.
Availability of data and materialsThe dataset from SEER database generated and analyzed during the currentstudy are available in the SEER dataset repository (version 8.3.8, downloadedfrom http://seer.cancer.gov/ seerstat/).
Declarations
Ethics approval and consent to participateNot applicable.
Consent for publicationNot applicable.
Competing interestsThe authors declare that there is no conflict of interest regarding thepublication of this Original Article.
Author details1Clinical Medical Colleges, Weifang Medical University, Weifang 261000,China. 2Department of Oncology, Weifang Traditional Chinese Hospital,
Wang et al. BMC Cancer (2021) 21:999 Page 15 of 16
Weifang 261000, Shandong, China. 3Department of Pathology, WeifangMedical University, Weifang 261053, China. 4Department of Pathology,Affiliated Hospital of Qingdao University, Qingdao 266555, China.5Department of Urology, The Affiliated Hospital of Weifang Medical College,Weifang 261000, China. 6Department of Urology, Weifang Traditional ChineseHospital, Weifang 261000, China. 7Department of Pathology, ShandongUniversity,Weihai Municipal Hospital, Cheeloo College of Medicine, Weihai264200, China. 8Department of Oncology, ShouGuang People’s Hospital,Weifang 262700, China. 9Qingdao Academy of Chinese Medical Sciences,Shandong University of Traditional Chinese Medicine, Qingdao 266112,Shandong, People’s Republic of China.
Received: 23 March 2021 Accepted: 26 August 2021
References1. Killock D. New standard for localized UTUC. Nat Rev Clin Oncol. 2020;17(5):
275. https://doi.org/10.1038/s41571-020-0354-6.2. Rouprêt M, Babjuk M, Burger M, Capoun O, Cohen D, Compérat EM, Cowan
NC, Dominguez-Escrig JL, Gontero P, Hugh Mostafid A, et al. EuropeanAssociation of Urology guidelines on upper urinary tract urothelialcarcinoma: 2020 update. Eur Urol 2021, 79(1):62–79, DOI: https://doi.org/10.1016/j.eururo.2020.05.042.
3. Siegel RL, Miller KD, Jemal A. Cancer statistics, 2020. CA Cancer J Clin. 2020;70(1):7–30. https://doi.org/10.3322/caac.21590.
4. Margulis V, Shariat SF, Matin SF, Kamat AM, Zigeuner R, Kikuchi E, et al.Outcomes of radical nephroureterectomy: a series from the upper tracturothelial carcinoma collaboration. Cancer. 2009;115(6):1224–33. https://doi.org/10.1002/cncr.24135.
5. Shigeta K, Kikuchi E, Abe T, Hagiwara M, Ogihara K, Anno T, et al. A novelrisk-based approach simulating oncological surveillance after radicalNephroureterectomy in patients with upper tract urothelial carcinoma. EurUrol Oncol. 2020;3(6):756–63. https://doi.org/10.1016/j.euo.2019.06.021.
6. Ariane MM, Colin P, Ouzzane A, Pignot G, Audouin M, Cornu JN, et al.Assessment of oncologic control obtained after open versus laparoscopicnephroureterectomy for upper urinary tract urothelial carcinomas (UUT-UCs): results from a large French multicenter collaborative study. Ann SurgOncol. 2012;19(1):301–8. https://doi.org/10.1245/s10434-011-1841-x.
8. Grasso M, Fishman AI, Cohen J, Alexander B. Ureteroscopic and extirpativetreatment of upper urinary tract urothelial carcinoma: a 15-yearcomprehensive review of 160 consecutive patients. BJU Int. 2012;110(11):1618–26. https://doi.org/10.1111/j.1464-410X.2012.11066.x.
9. Leow JJ, Orsola A, Chang SL, Bellmunt J. A contemporary review ofmanagement and prognostic factors of upper tract urothelial carcinoma.Cancer Treat Rev. 2015;41(4):310–9. https://doi.org/10.1016/j.ctrv.2015.02.006.
10. Brown GA, Matin SF, Busby JE, Dinney CP, Grossman HB, Pettaway CA, et al.Ability of clinical grade to predict final pathologic stage in upper urinarytract transitional cell carcinoma: implications for therapy. Urology. 2007;70(2):252–6. https://doi.org/10.1016/j.urology.2007.03.051.
11. Zeng S, Dai L, Yang J, Gao X, Yu X, Ren Q, et al. Development and externalvalidation of a nomogram predicting prognosis of upper tract urothelialcarcinoma after radical nephroureterectomy. Urol Oncol. 2019;37(4):290.e217–24.
12. Jeldres C, Sun M, Lughezzani G, Isbarn H, Shariat SF, Widmer H, et al. Highlypredictive survival nomogram after upper urinary tract urothelial carcinoma.Cancer. 2010;116(16):3774–84. https://doi.org/10.1002/cncr.25122.
13. Almås B, Halvorsen OJ, Gjengstø P, Ulvik Ø, Beisland C. Grading of urothelialcarcinoma of the upper urinary tract according to the World HealthOrganization/International Society of Urological Pathology classificationfrom 2004 is a valuable tool when considering whether a patient is suitablefor endoscopic treatment. Scand J Urol. 2016;50(4):298–304. https://doi.org/10.3109/21681805.2016.1144220.
14. Abdel-Rahman O. Revisiting the prognostic heterogeneity of AJCC stage IVcarcinomas of the upper urinary tract. Clin Genitourin Cancer. 2018;16(4):e859–65. https://doi.org/10.1016/j.clgc.2018.02.005.
15. Akaike H. Information theory and an extension of the maximum likelihoodprinciple. In: 2nd Int Symp information theory. Budapest: Akademia Kiado;1973.
16. Wang W, Sun Z, Deng JY, Qi XL, Feng XY, Fang C, et al. A novel nomogramindividually predicting disease-specific survival after D2 gastrectomy foradvanced gastric cancer. Cancer Commun (Lond). 2018;38(1):23. https://doi.org/10.1186/s40880-018-0293-0.
17. van Rhijn BWG, Hentschel AE, Bründl J, Compérat EM, Hernández V, ČapounO, et al. Prognostic value of the WHO1973 and WHO2004/2016 classificationSystems for Grade in primary ta/T1 non-muscle-invasive bladder Cancer: amulticenter European Association of Urology non-muscle-invasive bladderCancer guidelines panel study. Eur Urol Oncol. 2021;4(2):182–91. https://doi.org/10.1016/j.euo.2020.12.002.
18. Huben RP, Mounzer AM, Murphy GP. Tumor grade and stage as prognosticvariables in upper tract urothelial tumors. Cancer. 1988;62(9):2016–20.https://doi.org/10.1002/1097-0142(19881101)62:9<2016::AID-CNCR2820620924>3.0.CO;2-G.
19. Freifeld Y, Ghandour R, Singla N, Woldu S, Clinton T, Kulangara R, et al.Preoperative predictive model and nomogram for disease recurrencefollowing radical nephroureterectomy for high grade upper tract urothelialcarcinoma. Urol Oncol. 2019;37(10):758–64. https://doi.org/10.1016/j.urolonc.2019.06.009.
20. Krabbe LM, Eminaga O, Shariat SF, Hutchinson RC, Lotan Y, Sagalowsky AI,et al. Postoperative nomogram for relapse-free survival in patients with highgrade upper tract urothelial carcinoma. J Urol. 2017;197(3 Pt 1):580–9.https://doi.org/10.1016/j.juro.2016.09.078.
21. Hu P, Bai J, Liu M, Xue J, Chen T, Li R, et al. Trends of incidence andprognosis of gastric neuroendocrine neoplasms: a study based on SEER andour multicenter research. Gastric Cancer. 2020;23(4):591–9. https://doi.org/10.1007/s10120-020-01046-8.
22. Chen B, Zeng ZC, Wang GM, Zhang L, Lin ZM, Sun LA, et al. Radiotherapymay improve overall survival of patients with T3/T4 transitional cellcarcinoma of the renal pelvis or ureter and delay bladder tumour relapse.BMC Cancer. 2011;11(1):297. https://doi.org/10.1186/1471-2407-11-297.
23. Smith AK, Stephenson AJ, Lane BR, Larson BT, Thomas AA, Gong MC, et al.Inadequacy of biopsy for diagnosis of upper tract urothelial carcinoma:implications for conservative management. Urology. 2011;78(1):82–6.https://doi.org/10.1016/j.urology.2011.02.038.
Publisher’s NoteSpringer Nature remains neutral with regard to jurisdictional claims inpublished maps and institutional affiliations.
Wang et al. BMC Cancer (2021) 21:999 Page 16 of 16


![Churn prediction in mobile social games towards a complete assessment using survival ensembles [IEEE DSAA 2016]](https://static.documents.pub/doc/80x56/5873d9d41a28abd72e8b4605/churn-prediction-in-mobile-social-games-towards-a-complete-assessment-using.jpg)