Contents lists available at SciVerse ScienceDirect
Fisheries Research
jou rn al h om epa ge: www.elsev ier .com/ locate / f i shres
onstruction of biological reference points for management of the Dungenessrab, Cancer magister, fishery in the Fraser River Delta, British Columbia, Canada
ane Zhang ∗, Jason S. Dunhamacific Biological Station, 3190 Hammond Bay Road, Nanaimo, BC V9T 6N7, Canada
r t i c l e i n f o
rticle history:eceived 16 March 2012eceived in revised form 6 November 2012ccepted 19 November 2012
The objective of this study was to define two biological reference points, the Upper Stock ReferencePoint (USR) and the Limit Reference Point (LRP), to facilitate management of the Fraser River delta com-mercial Dungeness crab (Cancer magister) fishery in a precautionary manner. The USR is the stock levelbelow which the removal rate is progressively reduced to avoid reaching the LRP. The LRP is the stocklevel below which productivity is sufficiently impaired to cause serious harm. Currently, the commercialDungeness crab fishery in the Fraser River delta is managed with a minimum size limit (165 mm cara-pace width point-to-point), non-retention of females and soft-shell crabs, and a restricted fishing season(June to November) to protect large males during the winter/spring moult period. We evaluated vari-ations in legal male, sublegal male, and female Dungeness crab abundances using fishery-independenttrap surveys from 1988 to 2010. We also examined proportions of soft-shell legal male and female crabsusing survey data and information collected from commercial fishing. A relationship existed betweenfemale abundance and corresponding legal male abundance five years later, which is well describedby the Beverton–Holt stock–recruitment model. We conducted simulations to assess possible adverseimpacts of fishing on the crab population. We assumed the population would stabilize at the existingabundance upon suspension of commercial harvesting if abundance has been steadily declining. Usingthe stock–recruitment relationship along with information on commercial catch compositions and soft-
shell proportions, we assessed the potential reduction in legal male and female crab abundances, givenpersistent fishing, before the population reaches a lower equilibrium. The amount of reduction to legalmale and female crabs increases with decreasing population size. If legal male crab abundance is 50% and20% of maximum possible recruitment, then fishing would reduce female abundance by 20% and 48%,respectively, before the population is stabilized. We propose these two female abundance levels as theUSR and LRP for managing the Fraser River commercial Dungeness crab fishery.
. Introduction
In British Columbia (BC), as valuable finfish stocks have declined,enthic invertebrates such as Dungeness crabs (Cancer magis-er) have become an increasingly important fishery resource forommercial, recreation, and First Nation sectors (Fisheries andceans Canada, 2001). Canada is committed to using the Precau-
ionary Approach (PA) in managing its straddling and domestictocks because of the United Nations Agreement on Straddling andighly Migratory Fish Stocks (UNFA). A harvest strategy incorpo-
ating the PA fits into an overall Sustainable Fisheries Framework
or Canadian fisheries that will provide a more comprehensivepproach to managing Canada’s fisheries, factoring in ecosystem
considerations and precaution into decision-making (Fisheries andOceans Canada, 2009).
A harvest strategy compliant with the PA includes a RemovalReference for three stock status zones (Healthy, Cautious, and Crit-ical) delineated by the Upper Stock Reference Point (USR) and LimitReference Point (LRP; Fig. 1). The USR is the stock level thresholdbelow which the removal rate is progressively reduced to avoidreaching the LRP. The Removal Reference is the maximum accept-able removal rate for the stock and is adjusted depending on thestatus of the stock. The LRP is the stock level below which pro-ductivity is sufficiently impaired to cause serious harm, but abovethe level where the risk of extinction becomes a concern. At thispoint there could be long-term loss in fishing opportunities. If theLRP is reached then removals must be kept to the lowest possible
level and a stock rebuilding plan must be implemented (Fisheriesand Oceans Canada, 2006). In order to obtain Marine StewardshipCouncil (MSC) certification, the LRP and Target Reference Point(TRP) have been established for the Oregon commercial Dungeness
Z. Zhang, J.S. Dunham / Fisheries Research 139 (2013) 18– 27 19
F
cd
pfitgrmcab
Atsfttsmb1
slNsDot1abps(
bWeSsC
seven Crab Management Areas (CMAs). One of the largest com-
ig. 1. Fisheries management framework consistent with a precautionary approach.
rab fishery (Scientific Certification Systems, 2010). The TRP is theesirable point to which management actions should aim.
The objective of this study was to develop biological referenceoints (USR and LRP) to manage the commercial Dungeness crabshery in the Fraser River delta in BC using the PA. To achievehis objective, we describe long-term population trends in Dun-eness crab abundance on the Fraser River delta using standardizedesearch trap time series data. We also examined in-season com-ercial catch dynamics and moult patterns for male and female
rabs throughout commercial fishing seasons. Lastly, we developed stock recruitment relationship that was used to construct theiological reference points.
Dungeness crabs are distributed along the west coast of Northmerica from California to Alaska and occur from the low inter-
idal to depths of at least 230 m (Jensen, 1995). Adult crabs inhabitubstrates comprised of sand, mud, or silt, and are frequentlyound near eelgrass beds. Dungeness crabs generally mate duringhe spring and summer. Females extrude their eggs from Augusthrough January. Eggs hatch December through April and the zoealtages are planktonic for three to four months until they meta-orphose into megalopae which settle on appropriate substrate
etween May and September (Butler, 1960, 1961; Hankin et al.,997; Pauley et al., 1989; Stone and O’Clair, 2001).
Dungeness crabs grow by moulting, a process whereby the oldhell is shed. Timing of the adult male moult is somewhat simi-ar between California and Washington; it occurs between July andovember, starting earlier in central California and getting progres-
ively later as one moves northward (Hankin et al., 1997; Oregonepartment of Fish and Wildlife, 2011; Washington Departmentf Fish and Wildlife, 2011). In contrast, in BC and southeast Alaskahe male moult occurs earlier between February and July (Butler,961; Shirley and Sturdevant, 1988). Male crabs in BC undergopproximately 10 moults (2 years) from the time of settlementefore they reach sexual maturity at 100–120 mm carapace widthoint-to-point (CW) and 12–14 moults (3–4 years) to reach legalize (165 mm CW) after which they usually moult only once moreButler, 1961).
Female Dungeness crabs from California to Washington moultetween February and June (Oregon Department of Fish andildlife, 2011). In contrast, females moult later in BC and south-
ast Alaska, from June to September (Butler, 1961; Shirley and
turdevant, 1988; Swiney and Shirley, 2001). Females grow morelowly than males once they become sexually mature at 100 mmW because most of their energy is devoted to egg production
Fig. 2. The Fraser River delta in the Strait of Georgia near Vancouver, BritishColumbia, where the majority of commercial Dungeness crab fishing occurs (subar-eas 29-6, -7, -9, and -10).
rather than growth and often skip-moult (moult every two years;Butler, 1960).
Dungeness crabs comprise a metapopulation (the sum of localpopulations within a species’ range) whereby local populations ofrelatively sedentary juveniles and adults are interconnected by dis-persing larvae whose survival largely depends on ocean circulation,upwelling, and temperature (Cowen et al., 2007). Larvae can betransported substantial distances by ocean currents during theirlengthy planktonic stage; therefore, larvae returning to a local pop-ulation may not necessarily be offspring of that local population(Shanks and Roegner, 2007). Commercial Dungeness crab catchesin Washington, Oregon, and northern California were cyclical fromaround 1947 to 1977 and peaked about every 10 years (Botsfordet al., 1989; Armstrong et al., 2003). Cyclic peaks in crab catchesare likely the result of a multi-year fishery on a single large year-class that periodically occurs as the result of ideal ocean circulationand favourable post-settlement conditions. The clear cycling in thecommercial catch stopped after 1977 and coincides with the rapidbuild-up in the size of the crab fishing fleet (Shanks and Roegner,2007).
Quotas are not used to manage the commercial Dungenesscrab fishery in BC. Instead, management measures include a min-imum size limit (165 mm CW), sex restriction (non-retention offemales), non-retention of soft-shell crabs and, in some areas, sea-sonal closures during the spring male moult. The goal of thesemanagement measures is to protect the breeding component ofpopulations—females and small mature males that are allowed tobreed for at least a year before being recruited into the fishery.
In BC the commercial Dungeness crab fishery is divided into
mercial fisheries in terms of landings is located in CMA I on theFraser River delta near Vancouver (Fig. 2). CMA I covers an areafrom Indian Arm in the north to approximately the Tsawwassen
arvest logbooks on the Fraser River delta, 1993–2011. Data reported 1993–1997lso include the small fishery in CMA J (Boundary Bay).
erry terminal at Point Roberts. Between 36 and 51 vessels haveeen licensed to fish there during each fishing season (data for000–2010; Fisheries and Oceans Canada, 2010). In 2010, com-ercial landings (harvest logbooks) were 780 tonnes valued at
5.53 million (Canadian) (Fig. 3). In addition to size and sex restric-ions, other commercial management measures in CMA I included
soft-shell closure from December 1 to June 14, restrictions on theumber of vessels and traps, and electronically monitored fishingctivity. Trap regulations included a trap volume limit, no hangingait, and escape mechanisms such as escape rings and lids closedith rot cord under tension. Contract biologists hired by Industry
termed service providers – collect fishery dependent data fromommercial vessels during the fishing season (Fisheries and Oceansanada, 2010).
. Material and methods
In this paper we analyzed a subset of the CMA I commercial Dun-eness crab fishery data, specifically those data from subareas 29-6,7, -9, and -10 which cover approximately 243 km2 of crab fishingrounds (Fig. 2). This is the main part of the Fraser River delta whereost commercial fishing occurs and the sandy substrate here is dif-
erent from the mud/clay substrate found in Burrard Inlet to theorth.
Dungeness crab data used in this study came from two sources:1) fishery independent (Department of Fisheries and Oceans;FO) standardized research trap surveys, and (2) fishery depend-nt information collected by service providers from commercialatches. DFO has been conducting pre- and post commercial fish-ry research surveys in CMA I since 1988 using standardized trapear. Research surveys are generally conducted twice each year,nce in the spring before the beginning and once again in the fallear the end of the commercial fishing season. Surveys were notonducted before the onset of commercial fishing in 1988, 1989,990 and 2002. Standardized fishing gear is a commercial style cir-ular stainless steel trap with closed escape ports, herring (Clupeaallasi) for bait, and the soak time (i.e., the time the trap is in theater) approximately 24 h (overnight soak). Infrequently geoduck
Panopea abrupta) and other fish were used as bait or traps wereoaked longer than 24 h, either because of inclement weather oreliberately to measure the effect of soak time on trap catch. Theampling design was fixed station; the same sampling sites were
isited each survey (Fig. 2). At each general sampling location sixtrings consisting of 10 traps on each were set with one string atach of the following depth intervals: 5, 20, 40, 60, 80, and 100 m.
Research 139 (2013) 18– 27
Occasionally particular sampling locations and/or fishing depthscould not be surveyed because of inclement weather.
Commercial fishing seasons have started in June or July andended in October or November. We use the term ‘fishing period’to incorporate the temporal aspect of commercial fishing seasonsinto our analyses. A fishing period occurred semi-monthly with thefirst fishing period June 15–30, the second July 1–15, and so on.
We first examined variations in abundance indices for thethree crab types (legal males, sublegal males, and females) atthe beginning and end of commercial fishing seasons by statisti-cally standardizing catch rates (CPUEs) from fishery-independentsurveys. We then established a stock and recruitment rela-tionship between female abundance and subsequent legal crababundance using standardized catch rates. We used data fromfishery-independent surveys and service providers to estimatethe composition of crab types in catches and proportions ofsoft-shell for each of the three crab types during different fish-ing seasons. Using this biological information together withthe stock–recruitment relationship, we assessed consequences ofintensive fishing on the viability of the crab population at variousrelative population sizes. Based on the stock–recruitment rela-tionship and the evaluated consequences, we propose biologicalreference points for management of the commercial fishery accord-ing to the PA.
2.1. Standardization of CPUEs from fishery-independent surveys
CPUE estimates were standardized using a generalized linearmodel with gamma probability distribution. Factors considered inthe standardization process include year, area, depth, soak time,and bait. We set five categories for fishing depth: <20, 20–40, 40–60,60–80, and >80 m. We categorized soak hours into four levels: <12,12–32, 32–52, and >52 h. Most traps were deployed approximately24 h. We categorized bait into three groups: herring, geoduck, andother fish. Herring was the most common bait.
CPUE estimates were modelled as:
Ui,j,k,l,m∼gamma(si,j,k,l,m, v) (1)
where s and v are, respectively, the parameters of the shape andrate of the gamma distribution, the expected CPUE (U) is s/v, andthe subscripts, i, j, k, l, m, refer to Year i, Area j, Depth k, Bait l, andSoak-hour m. The expected CPUE, Ui,j,k,l , is estimated as:
where r0 is the intercept, ryi, raj, rdk, rbl, and rsm are the effects ofYear i, Area j, Depth k, Bait l, and Soak-hour m, respectively.
The standardization was conducted separately for legal male,sublegal male, and female crabs both before the onset and afterthe end of commercial fishing. Relative abundance in any year isrepresented by exp(ryi), which is known as the abundance index inthis study.
2.2. Proportions of legal, sublegal, and female crabs incommercial catches
We used sampling data from commercial catches provided byservice providers to examine changes in the proportions of legalmale, sublegal male, and female crabs in commercial catches overthe fishing periods. Proportions were modelled using a multinomiallogistic model:
where x is a vector containing the observed number of legal, sub-legal, and female crabs, p is also a vector containing the probability
eries
obts
p
w
l
wp
2
tfipttmat
S
wtos
o
l
w
2
mdsotcattWrd
R
wadoittnw
Z. Zhang, J.S. Dunham / Fish
f catching legal, sublegal, and female crabs, n is the total num-er of captured crabs of the three types. The subscript, i, refers tohe fishing period. The probability of capturing a crab type j (legal,ublegal, or female crab) was calculated as:
i,j = �j∑�j
(4)
here �j was estimated based on the effect of fishing period:
og(�j) = ˛j + ˇi,j (5)
here ˛j is the intercept for crab type j and ˇi,j is the effect of fishingeriod i on capturing crab type j.
.3. Proportion of moulting crabs
We examined shell condition data to determine the propor-ion of moulting crabs. Shell condition data were obtained fromshery-independent surveys and by service providers who sam-led commercial catches. Data from these two sources were usedo identify changes in proportions of soft- or hard-shell crabs duringhe fishing periods. Proportions of soft-shell legal males, sublegal
ales, and female crabs in each fishing period were modelled using generalized linear model with the binomial probability distribu-ion:
i∼binom(Pi, Ni) (6)
here S is the observed number of soft-shell crabs of one type, P ishe probability of being a soft-shell crab of this type, and N is thebserved number of both soft and hard-shell crabs of this type. Theubscript, i, refers to the fishing period.
We used the logit link function to model the probability basedn fishing period:
ogit(Pi) = p0 + Ti (7)
here p0 is the intercept and Ti is the effect of fishing period i.
.4. Biological correlations
Using fishery-independent survey data and a simple linearodel, we examined the correlation between the relative abun-
ance of sublegal male crabs at the end of commercial fishingeasons and relative abundance of legal male crabs at the beginningf the next commercial fishing season. We also studied the correla-ion between the relative abundance of female crabs at the end ofommercial fishing seasons and the abundance of legal male crabst the beginning of commercial fishing five years later. We choseo use a time lag of five years because male crabs are recruited tohe fishery approximately four years after settlement (Butler, 1961;
illiams, 1979; Collier, 1983; Shanks and Roegner, 2007). This cor-elation should reflect a stock–recruitment relationship, which wasescribed by the Beverton–Holt model:
= a × S
b + Sexp(ε) (8)
here S is the relative abundance of female crabs (stock abundance)t the end of the commercial fishing season, R is the relative abun-ance of legal male crabs (recruitment abundance) at the beginningf commercial fishing five years later, a and b are model parametersndicating the maximum relative abundance for recruitment and
he relative stock abundance needed to produce recruitment equalo a/2 (Hilborn and Walters, 1992), and ε is a random variate from aormal distribution with the mean equal to zero. Model parametersere estimated using the maximum likelihood approach.
Research 139 (2013) 18– 27 21
2.5. Evaluation of possible adverse impact of fishing
Through simulations we evaluated the consequences of thecurrent fishing pattern and intensity persisting on the steadilydeclining crab population in terms of amount of reduction inrecruitment (legal male abundance) and stock size (female spawn-ing abundance).
For the compensatory Beverton–Holt stock–recruitment func-tion, the recruitment rate will increase when stock size decreases.Due to ecological interactions, however, recruitment may notrebound as expected, even when fishing has ceased (see Section4). We, therefore, made an assumption in the simulation thatthe decline was caused by commercial harvesting and the pop-ulation would be at equilibrium without fishing pressure; i.e.,the stock abundance (number of female crabs) and recruitment(number of legal male crabs) would remain unchanged withoutfishing. Through such simulations we formulated biological ref-erence points for precautionary management of the commercialfishery.
We assumed fishing would start June 15 and end October 31with nine fishing periods, each of which has a semi-monthly dura-tion. We set the exploitation rate in the first fishing period to 0.4, anestimate of the overall mean of exploitation rates in the first fish-ing period (Zhang and Dunham, unpublished data). Exploitationrate in each of the later fishing periods was set to be the productof this initial exploitation rate and the ratio of fishing effort (meannumber of traps deployed in the real fishery) in that period to thefishing effort in the first fishing period. The estimated proportion offemale crabs in the catch and proportion of soft-shell female crabsat each fishing period were used in the simulation. Annual instanta-neous natural mortality rate was assumed to be 0.97, as estimatedby Zhang et al. (2004). The stock–recruitment relationship estab-lished in this study allowed us to predict the abundance of legalcrabs based on female abundance. We assumed handling mortal-ity is 5% and 25% for hard and soft-shell female Dungeness crabs,respectively (see Alverson et al., 1994).
The parameter a in the stock–recruitment model represents themaximum relative abundance for recruitment and was estimated tobe 1.4. The relative abundance for recruitment (R0) varied between0.2 and 1.3 with an interval of 0.1 at the beginning of simula-tions. For each simulation, the relative abundance was set at oneof these levels. Therefore, twelve such simulations were conductedaltogether.
The relative female abundance for the stock (S0) was calculatedaccording to the established stock–recruitment equation:
S0 = b × R0
a − R0(9)
To start the simulation, the abundance of legal crabs wasassigned to be 250,000, represented by NL0. Assignment of a dif-ferent number would not alter the outcome. The number of femalecrabs in the first fishing period of the first simulation year was setto be 70%NL0, as the mean ratio of catch rates for female crabs tocatch rates for legal male crabs in June is 0.7. The highest proportionof soft-shell female crabs was 37–50% in July and August. Some ofthese soft-shell crabs may not have been vulnerable to traps beforemoulting, whereas others may have already been large enough tobe vulnerable to traps. For simplicity, we assumed the abundanceof female crabs vulnerable to traps increased by 50% in the thirdfishing period because of moulting of smaller female crabs.
The catch of legal crabs (CL) in each fishing period is:
CLy,i = NLy,i × Ei (10)
where NL and E are the number of legal crabs and the exploitationrate, respectively. The subscripts y and i indicate simulation yearand fishing period. In the first three fishing periods, commercial
2 eries
cvpa
N
wrbtsu
a
C
wtfh
N
whtbnwzf
u
S
s
N
a
tiawlw
2
B(t2stecaf
2 Z. Zhang, J.S. Dunham / Fish
atch rates for legal crabs dropped quickly due to intensive har-esting. The number of legal crabs in each of the initial three fishingeriods was calculated by deducting catch in the previous periodnd by incorporating natural mortality:
Ly,i+1 = (NLy,i − CLy,i) exp(−15M
365
)(i ≤ 3) (11)
here M is the annual instantaneous natural mortality rate. In theemaining fishing periods catch rates did not decrease apprecia-ly probably because the relatively small number of removals byhe fishery was, to some extent, replaced by moulting crabs frommaller sizes. We, therefore, assumed the number of legal crabs wasnchanged throughout the remaining fishing periods.
Catch of female crabs in each fishing period was calculatedccording to the catch of legal male crabs:
Fy,i = Ri × CLy,i (12)
here R is the estimated mean ratio of the number of female crabso the number of legal male crabs in real catches. The number ofemale crabs in each fishing period was calculated by deductingandling mortality and natural mortality:
here s, h1, and h2 are the proportion of soft-shell female crabs,andling mortality rates on soft and hard-shell females, respec-ively. In the third fishing period, the number of females increasesy 50% due to moulting of smaller female crabs. When fishing wasot conducted, the number of female crabs for each fishing periodas similarly calculated except that h1 and h2 were assigned to be
ero. We used NF0 to represent the stock abundance (number ofemale crabs) in the no fishing scenario.
When fishing was conducted, relative stock abundance in sim-lation year y is:
y = S0 × NFy,10
NF0(14)
The number of legal crabs in the first fishing period the nextimulation year is:
Ly+1,1 = ˛ × Sy
b + Sy× NL0
R0(15)
nd the number of female crabs is: NFy+1,1 = 0.7NLy+1,1.For each simulation year, the amount of reduction in rela-
ive stock abundance, (R0 − Ry)/R0, was calculated to represent thempact of fishing on the stock. The simulation continued untilnother equilibrium was reached, namely the stock abundanceould not change even if the simulation continued. At this equi-
ibrium stage, reduction in both recruitment and stock abundanceere recorded.
.6. Bayesian analyses
Calculations for Sections 2.1–2.3 were conducted with theayesian approach using the WinBUGS software programSpiegelhalter et al., 2003). Sum-to-zero constraints were appliedo all variables except for those in the multinomial model in Section.3 where the corner constraints were used (Ntzoufras, 2009). Theum-to-zero constraint means the overall summed effect of a fac-or is zero. Specifically, we set the effect of the first level negatively
qual to the summed effects of the remaining effects. The corneronstraint means the effect of the first level of a factor is assigned
value of zero. In either way of setting, effects of all levels exceptor the first one were estimated through modelling.
Research 139 (2013) 18– 27
We assigned uninformative priors to all parameters in order toforce the model to estimate these parameters from the data. Specif-ically, r0, ry, ra, rd, rb, and rs (Section 2.1), and (Section 2.2), p0and T (Section 2.3) were all assigned a normal distribution withmean = 0 and variance = 10,000 (N (0, 1002)); v (Section 2.1) wasassigned a gamma distribution (Gamma (0.001, 0.001)) where 0.001and 0.001 represent the parameters of shape and rate of the gammadistribution.
The first 100,000 samples from the posterior distribution weretreated as a burn-in period. To reduce autocorrelation, every 10thsample from the posterior distribution was selected after the burn-in period. Visual examination showed the autocorrelations weresufficiently low at this sampling interval. Altogether 10,000 sam-ples were saved. Two chains were used with different initial valuesfor the convergence test by Gelman–Rubin diagnostics (Gelman andRubin, 1992). Evidence of convergence was warranted by this testas the two independent chains virtually overlapped each other.
3. Results
The CPUE standardization process produced two sets of relativeabundance indices for legal male, sublegal male, and female crabs,one for the beginning of fishing seasons (Fig. 4) and the other forthe end of fishing seasons (Fig. 5).
At the onset of commercial fishing seasons, relative abundanceindices indicate legal male crab abundance has generally increasedfrom the early 1990s to 2003, and then decreased to a level similarto that observed in the early 1990s (Fig. 4A). Also, abundance waslower in the most recent three years compared to the previous fouryears. The abundance of sublegal male crabs has two increasing andtwo decreasing periods (Fig. 4B); abundance increased during theearly 1990s and between 2001 and 2003, but decreased during themid- and late 1990s and from 2004 to the present with the lowestabundance occurring in the most recent three years. The abundanceof female crabs has generally been stable except in 1991 and 1993when it was higher (Fig. 4C).
At the end of commercial fishing seasons, legal male crababundance has been relatively stable except for recent years(2005–2007, 2009) when abundance was higher (Fig. 5A). Theabundance of sublegal male crabs has fluctuated over the years,but decreased since 2006 to a lower level despite a slight increasein the most recent two years (Fig. 5B). The abundance of femalecrabs has generally decreased since the early 1990s (Fig. 5C).
The proportion of legal male crabs in commercial catchesdecreased from the beginning of the fishing season (June 15) toearly September, and then increased in the following 30 days(Fig. 6). Only in the fishery’s first two weeks was the proportionof legal males higher than either sublegal males or females. By thebeginning of August the proportion of legal males was lower thanboth sublegal males and females, and this relationship remains con-sistent for the rest of the fishing season. There was a large increasein the proportion of sublegal male crabs in commercial catches inthe first half of July relative to the beginning period mid June (Fig. 6).This sublegal proportion changed little until mid September whenit increased considerably before dropping in October. The propor-tion of female crabs in commercial catches decreased in the firsthalf of July relative to the beginning period mid June (Fig. 6). Thefemale proportion generally increased during the fishing season inspite of a decrease in the second half of September.
The proportion of moulting legal male crabs was approximately30% in April and peaked in May at 60%. When the commercial fish-
ery opened mid June, the proportion of soft-shell legal male crabswas approximately 40%, and this proportion remained relativelyconstant until the first half of August after which the proportiondropped to 15% and remained low during the rest of the fishing
Z. Zhang, J.S. Dunham / Fisheries Research 139 (2013) 18– 27 23
Fig. 4. Estimated annual abundance indices for legal (A), sublegal (B), and femalecrabs (C) before the onset of commercial fishing with 95% credible intervals basedofc
Fig. 5. Estimated annual abundance indices for legal (A), sublegal (B), and femalecrabs (C) at the end of the commercial fishing season with 95% credible intervals
n fishery independent survey information. Abundance indices are only comparableor the same crab type. The mean of the logarithm of the abundance indices for eachrab type for the available time frame was set to zero for each of the three types.
eason (Fig. 7A). The proportion of soft-shell sublegal male crabsas generally low (less than 30%) between April and October. Theroportion was highest in the second half of May and the first halff June, and in September and the first half of October (Fig. 7B). Theroportion of moulting females peaked in July and August with 50%f the females soft during the second half of August (Fig. 7C).
There was a highly significant positive correlation (p = 0.001)etween the abundance of sublegal crabs at the end of commercialshing seasons and the abundance of legal crabs at the beginningf commercial fishing the following year. The coefficient of deter-ination (r2) was 0.18 (Fig. 8).The relationship between the abundance of female crabs at
he end of commercial fishing seasons and the abundance ofegal crabs at the beginning of the fishery five years later istted by the Beverton–Holt stock recruitment model (Fig. 9).
he two parameters of the model, a and b, were estimatedo be 1.46 with a standard deviation of 0.27, and 0.42 with
standard deviation of 0.26, respectively. The 95% confidencentervals are between 1.35 and 1.79 for a and 0.3 and 1.73
based on fishery independent survey information. The abundance index is relativeto the overall mean, which is set to one. The dash and dot lines in C represent theproposed Upper Stock Reference Point and Limit Reference Point, respectively.
for b. Parameter a was much more precisely estimated thanparameter b. The coefficient of determination for this model is0.20.
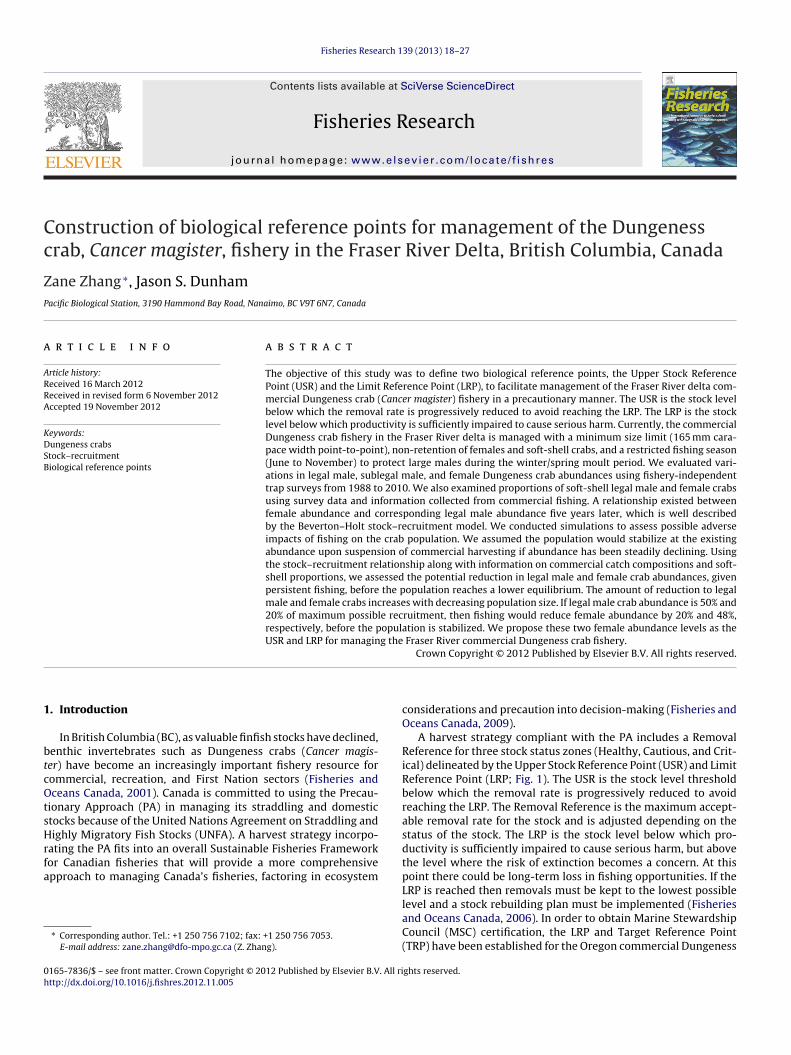
The simulation study showed the impact of fishing at the cur-rent intensity on the crab population depends on population sizerelative to maximum recruitment, as indicated by the parametera in the Beverton–Holt stock–recruitment model (Table 1). Theamount of reduction in legal male and female crabs increased whenthe population size at the beginning of the simulation was lower.The rate of increase in the amount of this reduction was relativelylow when legal male crab abundance was greater than 50% of themaximum possible recruitment; this rate was considerably higherwhen legal male crab abundance was less than 40% of the maxi-mum possible recruitment (Fig. 10). If legal male crab abundancewas approximately 50% of the maximum recruitment with an abun-
dance index of 0.73, and the corresponding abundance index forfemales was 0.43, then fishing will reduce legal male abundanceby about 12% and female abundance by about 20% before the stockis stabilized. If the abundance of legal males was about 20% of the
24 Z. Zhang, J.S. Dunham / Fisheries Research 139 (2013) 18– 27
0.0
0.2
0.4
0.6
Fishing Period
Pro
po
rtio
n
Legal Crab s
Sublega l Crab s
Female Crab s
June
15-30
Oct.
1-15
Sep .
16-30
Sep .
1-15
Aug .
16-31
Aug .
1-15
July
16-31
July
1-15
Fcs
mcwb
F(T
0.0
0.5
1.0
1.5
2.0
2.5
0.0 0.5 1.0 1.5 2.0 2.5
Abunda nce Inde x f or Sublega l Crab s
Ab
un
da
nce
In
de
x fo
r L
eg
al C
rab
s
Fig. 8. Correlation between sublegal male crab abundance at the end of the fishingseason and legal male crab abundance at the beginning of the fishing season in thefollowing year. The abundance index is relative to its own overall mean, which isset to one either for legal or sublegal male crabs.
1.5
2.0
eg
al C
rab
s
ig. 6. Proportions of legal male, sublegal male, and female crabs in commercialatches with 95% credible intervals over different fishing periods in the fishingeason.
aximum recruitment with an abundance index of 0.29, and theorresponding abundance index for females was 0.11, then fishingill reduce legal male abundance by 42% and female abundance
y 48% (Table 1). We propose to set the USR and LRP at female
0.0
0.2
0.4
0.6
Apr.
1-15
Apr.
16-30
May
1-15
May
16-31
Jun .
1-15
Jun .
16-30
Jul.
1-15
Jul.
16-31
Aug .
1-15
Aug .
16-31
Sep .
1-15
Sep .
16-30
Oct.
1-15
Oct.
16-31
Yea r
Pro
po
rtio
n
A
Legal Crab s
Beginn ing o f Fishing Sea son
0.0
0.2
0.4
0.6
Apr.
1-15
Apr.
16-30
May
1-15
May
16-31
Jun .
1-15
Jun .
16-30
Jul.
1-15
Jul.
16-31
Aug .
1-15
Aug .
16-31
Sep .
1-15
Sep .
16-30
Oct.
1-15
Oct.
16-31
Yea r
Pro
po
rtio
n
B
Sublega l Crab s
0.0
0.2
0.4
0.6
Apr.
1-15
Apr.
16-30
May
1-15
May
16-31
Jun .
1-15
Jun .
16-30
Jul.
1-15
Jul.
16-31
Aug .
1-15
Aug .
16-31
Sep .
1-15
Sep .
16-30
Oct.
1-15
Oct.
16-31
Yea r
Pro
po
rtio
n
C
Female Crab s
ig. 7. Proportion of soft-shell legal male (A), sublegal male (B), and female crabsC) with 95% credible intervals over different fishing periods in the fishing season.he vertical arrow indicates the starting time for the fishery in recent years.
0.0
0.5
1.0
0.0 0.5 1.0 1.5 2.0 2.5 3.0
Abundance Index for Female Crabs
Ab
un
da
nce
In
de
x fo
r L
Fig. 9. Correlation between female crab abundance at the end of the fishing seasonand legal male crab abundance at the beginning of the fishery five years later. Thecorrelation is fitted with the Beverton-Holt stock–recruitment (broken line). The
abundance index is relative to its own overall mean, which is set to one either forfemale or legal male crabs.
abundances corresponding to legal male crab abundances being,respectively, 50% and 20% of the maximum recruitment from the
stock–recruitment model. In the past 23 years, female abundancehas been below the proposed USR three times and has never beenlower than the proposed LRP (Fig. 5C).
Table 1Impact of fishing on recruitment (legal male abundance) and female crab abun-dance. The simulation was conducted using the stock–recruitment function withthe assumption that the population was at equilibrium at the beginning of the sim-ulation. Reductions in population size resulted from persistent fishing which drovethe population down to a lower level of equilibrium.
At the beginning of simulation At the lower equilibrium
ig. 10. Reduction in recruitment and female crab abundance at different sizes ofegal male crab populations. The amount of reduction was calculated when theopulation was driven to a lower level of equilibrium by intensive harvesting.
. Discussion
We evaluated variations in Dungeness crab abundance overpproximately the past 20 years, commercial catch compositionn terms of legal male, sublegal male, and female crabs, andhanges in proportions of soft-shell crabs throughout the fishingeason in the Fraser River delta, Strait of Georgia, BC. Changesn female abundance and subsequent legal crab abundance fiveears later showed a good stock–recruitment relationship. Usinghis relationship together with biological and fishing informa-ion, we assessed possible adverse impacts of fishing on this crabopulation. From these analyses, we propose biological referenceoints for precautionary management of this valuable commercialshery.
Fishery-independent surveys were conducted using standard-zed trap gear. Although the survey design required samplingocations, fishing depths, trap type, soak time, and bait be consis-ent, sometimes variations in these factors existed due to logisticaleasons. Consequently, nominal CPUE estimates may not be reli-bly comparable between years so we standardized CPUE estimatesn order to remove some effects of factors other than popula-ion abundance. Statistical standardization of commercial CPUEss required when evaluating changes in fish stock abundanceCampbell, 2004; Maunder and Punt, 2004). The standardizationf fishery-independent data is also encouraged since alterations tohe standard procedure are often unavoidable in fisheries surveysMaunder and Punt, 2004).
Legal crab abundance at the onset of the fishing season increasedetween 1991 and 2003. This abundance has been relatively lowince 2004, and even slightly lower in the most recent three years.ecause of high fishing intensity in the Fraser River delta, rela-ively few legal crabs remain at the end of each fishing season.onsequently, legal crabs at the beginning of a fishing season arerimarily newly recruited crabs that recently moulted. There is aositive correlation between sublegal crab abundance at the endf the fishing season and legal crab abundance at the onset of theext fishing season. Although sublegal crab abundance is indicativef the potential change in legal crab abundance in the followingshing season, this prediction should be taken with caution as theoefficient of determination for this relationship is 0.18. Juvenilebundance index has been used to predict the catch of blue crabs,ortunus pelagicus, in Western Australia in the following seasonBellchambers et al., 2006).
The Dungeness crab fishery is a male-only fishery with a mini-um size limit in order to protect sublegal males and females, the
eproductive capacity of the population. Although female abun-ance has not varied greatly at the beginning of fishing seasonsince 1994, it has generally declined since about 1990 at the endf fishing seasons, implying more females may have died during
Research 139 (2013) 18– 27 25
the fishing season over these years. The proportion of soft-shellfemales has been highest in July and August. Fishing intensity hasalso been high in July and, although commercial catches decreasedin August, female by-catch increased from about 20% in July to 32%in August. Captured soft-shell crabs are particularly vulnerable tohandling mortality. Alverson et al. (1994) reported that mortalityof soft-shell individuals discarded from traps could be 22–25%.
We found a good stock–recruitment relationship exists betweenthe abundance of female crabs at the end of the fishing season andabundance of legal crabs at the beginning of the fishing season fiveyears later. Stock–recruit relationships have also been describedfor blue crab (Callinectes sapidus) in Chesapeake Bay (Lipcius andStockhausen, 2002), blue swimmer crab (Portunus pelagicus) inCockburn Sound, Western Australia (de Lestang et al., 2010), tan-ner crab (Chionoecetes bairdi) in Bristol Bay, Alaska (Zheng andKruse, 1998), and king crab (Paralithodes camtschaticus) in Bris-tol Bay (Zheng and Kruse, 2003) and off Kodiak Island, Alaska(Bechtol and Kruse, 2009). However, stock–recruitment relation-ships remain poorly understood for most commercially importantspecies of crabs and lobsters partly because of difficulties associ-ated with identifying their ages (Wahle, 2003). In BC Dungenesscrabs breed in the summer and fertilized ova are extruded by thefemale in autumn (Butler, 1961). Female crabs captured in fall sur-veys will soon extrude their eggs, which will hatch the followingspring and the megalopae will settle later that summer. Male crabsin the Queen Charlotte Islands reach legal size (165 mm CW) fouryears after hatching (Butler, 1961). Cleaver (1949) also reportedapproximately four years of growth is required for male crabs inWashington State to reach legal size. Since it takes about four yearsfor a Dungeness crab to reach legal size after settlement, we choseto use a time lag of five years in the study of the stock–recruitmentrelationship.
Another challenge is the uncertainty about the relevant spatialscale to evaluate stock–recruitment relationships for crab popu-lations (Wahle, 2003). Dungeness crabs have a long larval periodlasting about four months (Butler, 1961). Larvae progress throughfive zoeal stages before moulting into megalopae (Reed, 1969).Off California and Oregon Dungeness larvae may undergo exten-sive movements. In central and northern California, zoeae werealmost always found in the ocean rather than in bays (Reilly, 1985).Megalopae appeared in large nearshore concentrations after theoccurrence of upwelling around April and May (Pauley et al., 1989).Shoreward migration of Dungeness crab megalopae from the openocean has also been observed off the Oregon coast (Roegner et al.,2007). The number of returning megalopae is closely and inverselyrelated to the timing of the spring transition, a seasonal shift inatmospheric forcing that drives ocean currents along the westcoast of the United States. Legal male crab abundance was primar-ily determined by the abundance of returning megalopae, whichwas not correlated with the corresponding spawning biomass offemales suggesting Dungeness crab recruitment success in theCalifornia Current system may vary primarily due to climatic forc-ing (Shanks and Roegner, 2007).
The Fraser River delta is located in the Strait of Georgia (Fig. 2)which is a different kind of oceanographic system compared to theopen west coast of North America. The Strait is primarily defined bydegree of enclosure; it is an enclosed system bordered by archipela-gos and shallow depths and bounded by strong tidal fronts tothe north and south (Powles et al., 2004). The Strait is, on aver-age, 220 km long and 33 km wide, with a mean depth of 156 m(Waldichuk, 1957), and is a ‘deep basin’ type of estuary as classifiedby Pritchard (1952). The principal generating forces responsible for
water movements are tides, river (fresh water) run-off, and winds.There is a counter-clockwise gyre in the southern Strait (Harrisand Rattray, 1954) where the Fraser River delta is located. Theseunique oceanographic and geographic properties of the Strait of
2 eries
GPbwtlDIftfVpl2tnphDS
nmiaaccd
BsmrwnsKoA2cphc2fils(ba
usspuadpirmd
6 Z. Zhang, J.S. Dunham / Fish
eorgia may help retain crab larvae in the Strait. Jamieson andhillips (1993) reported regional differences in size and behaviouretween megalopae in the southern Strait of Georgia comparedith those on the west coast of Vancouver Island. They suggested
he Juan de Fuca Strait may act as a physical barrier to dispersingarval crabs. Beacham et al. (2008) found some evidence of localungeness crab population differentiation in BC; for example, the
ndian Arm population (in Burrard Inlet) was genetically distinctrom crabs in Satellite Channel, which is located across the Strait inhe southern Gulf Islands near Victoria. However, the genetic dif-erentiation between southern Strait of Georgia and outer coastalancouver Island crab populations was substantially less than otheropulations surveyed in BC suggesting some degree of mixing of
arval crabs exists between these two regions (Beacham et al.,008). Dinnel et al. (1993) investigated three distinct cohorts ofhe same year-class around Puget Sound and concluded most juve-ile recruitment in Hood Canal and Puget Sound originates fromarental stocks endemic to their respective basins. On occasion,owever, oceanographic conditions allow influx of Pacific Oceanungeness crab larvae through the Strait of Juan de Fuca into Pugetound.
Biological reference points, including the USR and LRP, areeeded to indicate stock status so that appropriate managementeasures can be taken. Biological reference points are often defined
n terms of fishing mortality or stock biomass. Dungeness crabsre managed with no restriction on fishing mortality rate on malesbove the legal size; therefore, fishing mortality may not be a goodandidate for establishing biological reference points. Instead wehose to use a surrogate of stock abundance, catch rates from stan-ardized fishery-independent surveys.
For a compensatory stock–recruitment relationship such as theeverton–Holt model, recruitment rate or per capita productionhould increase when stock size decreases as density-dependentortality decreases. In reality, however, recruitment may not
ebound when stock biomass has fallen to a certain low level. Theorld’s largest red king crab (Paralithodes camtschaticus) fisheryear Kodiak Island, Alaska, collapsed in 1982 and a fishery clo-ure since 1983 has failed to induce stock recovery (Bechtol andruse, 2009). Similarly, Cockburn Sound once represented the sec-nd largest commercial blue swimmer crab fishery in Westernustralia. Commercial catches started to decline significantly since000 and the fishery continued for another six years before beinglosed in 2006; the stock has not yet shown signs of recovery. Oneossible cause of the major decline in the crab population mayave been the large reduction in female abundance, as was thease for blue crabs in Chesapeake Bay (Lipcius and Stockhausen,002). Another cause of the stock collapse was continued highshing pressure during years of low recruitment resulting in even
ower breeding stock (Johnston et al., 2011). At a low populationize, abundance may stabilize around a relatively low equilibriumPeterman, 1977). Failure to recover at low abundance levels maye due to ecological interactions (Myerscough et al., 1996; Waltersnd Kitchell, 2001).
To conduct simulations, we assumed the Dungeness crab pop-lation would stabilize at the existing abundance when fishing isuspended in the case where the population has shown signs ofteady declines. In other words, continual fishing on the decreasingopulation would further reduce the population size. We thensed the established stock–recruitment relationship to assess themount of potential reduction in female and legal male crab abun-ance before the stock reaches another lower equilibrium, if fishingersists. When potential reduction is small and the population size
s large, current fishing practices may continue. When potentialeduction is large and the population size is small, managementeasures must be taken to safeguard this valuable resource. Abun-
ance levels used to derive biological reference points depend
Research 139 (2013) 18– 27
on how much precaution we would like to take in managing thefishery.
Female abundance should be assessed using fishery-independent standardized trap surveys conducted at the endof each commercial fishing season. If a particular survey indicatesthe crab population has moved into a new stock status zone(such as from the Healthy to the Cautious zone), we believe,due to the inherent variability in trap catches, results from twomore post commercial fishery surveys should be required toconfirm the population has indeed moved into the new zone. Thismeans commercial fishing could continue without managementchanges for two more seasons. To be precautionary, however, weadvocate some management intervention should occur after twoconsecutive surveys show the crab population has dropped belowa reference point. Results from three consecutive surveys showingthe crab population in a particular zone confirms the status of thepopulation and management measures deemed appropriate forthe zone must be implemented.
When the crab population is confirmed to be in the CautiousZone, management actions must be triggered to protect femalecrabs. Potential management measures, listed in order of increas-ing female protection, could include: (1) increasing soak time todecrease handling of discards, (2) curtailing fishing in areas andat depths where females are most abundant, and (3) closing thecommercial fishery during July and August when the proportionof soft-shell females is highest. We suggest more stringent meas-ures to protect females should be implemented as stock statusapproaches the LRP. If the crab population is in the Cautious Zone,but near the USR, then increasing soak time would be the appropri-ate management measure to protect females. If the crab populationis in the Cautious Zone, but near the LRP, then closing the com-mercial fishery during the female moult would be the appropriatemanagement measure.
When the crab population is confirmed to be in the CriticalZone, the fishery must be closed. Three consecutive sampling sur-veys with results showing the stock in the Cautious Zone wouldbe required to reopen the fishery. This means the fishery would beclosed for a minimum of three seasons.
Acknowledgments
We thank Dr. Ian Perry, Dennis Rutherford, and Dr. Laura Brownfor providing helpful comments on a previous version of themanuscript. We are also grateful to the two anonymous reviewersfor their constructive comments. Erick Merner is acknowledged forhis ArcGIS support in creating Fig. 2.
References
Alverson, D.L., Freeberg, M.H., Pope, J.G., Murawski, S.A., 1994. A global assessmentof fisheries bycatch and discards. FAO Fisheries Technical Paper no. 339, Rome,FAO, 233 pp.
Armstrong, D.A., Rooper, C., Gunderson, D., 2003. Estuarine production of juvenileDungeness crab (Cancer magister) and contribution to the Oregon-Washingtoncoastal fishery. Estuaries 26, 1174–1188.
Beacham, T.D., Supernault, J., Miller, K.M., 2008. Population structure of Dungenesscrab (Cancer magister) in British Columbia. J. Shellfish Res. 27 (4), 901–906.
Bechtol, W.R., Kruse, G., 2009. Analysis of a stock–recruit relationship for red kingcrab off Kodiak Island, Alaska. Mar. Coast. Fish.: Dyn. Manage. Ecosyst. Sci. 1,29–44.
Bellchambers, L., de Lestang, S., Smith, K.D., Thomson, A.W., 2006. Catch predictionfor the blue swimmer crab (Portunus pelagicus) in Cockburn Sound, WesternAustralia. Bull. Mar. Sci. 79, 329–339.
Botsford, L.W., Armstrong, D.A., Shenker, J.M., 1989. Oceanographic influences onthe dynamics of commercially fished populations. In: Landry, M.R., Hickey, B.M.(Eds.), Coastal Oceanography of Washington and Oregon. Elsevier, Amsterdam,
The Netherlands, pp. 511–564.
Butler, T.H., 1960. Maturity and breeding of the Pacific edible crab, Cancer magisterDana. J. Fish. Res. Bd. Can. 17, 641–646.
Butler, T.H.J., 1961. Growth and age determination of the Pacific edible crab, Cancermagister Dana. Fish. Res. Bd. Can. 18, 873–891.
eries
C
C
C
C
d
D
FF
F
F
G
H
H
H
J
JJ
L
M
M
N
O
crab (Cancer magister). Can. J. Fish. Aquat. Sci. 61, 2126–2134.
Z. Zhang, J.S. Dunham / Fish
ampbell, R.A., 2004. CPUE standardization and the construction of indices of stockabundance in a spatially varying fishery using general linear models. Fish. Res.70, 209–227.
leaver, F.C., 1949. Preliminary results of the coastal crab (Cancer magister) investi-gation. Wash. State Dep. Fish., Olympia. Biol. Rep. 49A, 74–82.
ollier, P.C., 1983. Movement and growth of post-larval Dungeness crabs, Cancermagister, in the San Francisco area. In: Wild, P.W., Tasto, R.N. (Eds.), Life history,environment, and mariculture studies of the Dungeness crab, Cancer magister,with emphasis on the central California fishery resource. Calif. Dep. Fish GameFish Bull. 172, pp. 125–133.
e Lestang, S., Bellchambers, L.M., Caputi, N., Thomson, A.W., Pember, M.B., Johnston,D.J., Harris, D.C., 2010. Stock–recruitment–environment relationship for a Por-tunus pelagicus fishery in Western Australia. In: Kruse, G.H., Eckert, G.L., Foy, R.J.,Lipcius, R.N., Sainte-Marie, B., Stram, D.L., Woodby, D. (Eds.), Biology and Man-agement of Exploited Crab Populations under Climate Change. Alaska Sea Grant,University of Alaska Fairbanks, http://dx.doi.org/10.4027/bmecpcc.2010.06.
innel, P.A., Armstrong, D.A., McMillan, R.O., 1993. Evidence for multiplerecruitment-cohorts of Puget Sound Dungeness crab, Cancer magister. Mar. Biol.115, 53–63.
isheries and Oceans Canada, 2001. Fish stocks of the Pacific coast. 152 pp.isheries and Oceans Canada, 2006. A harvest strategy compliant with the Precau-
tionary Approach. DFO Can. Sci. Advis. Sec. Sci. Advis. Rep. 2006/023.isheries and Oceans Canada, 2009. A fishery decision-making framework
incorporating the Precautionary Approach. URL: <http://www.dfo-mpo.gc.ca/fm-gp/peches-fisheries/fish-ren-peche/sff-cpd/precaution-eng.htm>(accessed 08.04.10).
isheries and Oceans Canada, 2010. Pacific Region. Integrated Fisheries ManagementPlan. Crab by Trap. January 1 to December 31, 2011, 107 pp.
elman, A., Rubin, D.B., 1992. Inference from iterative simulation using multiplesequences (with discussion). Sat. Sci. 7, 457–511.
ankin, D.G., Butler, T.H., Wild, P.W., Xue, Q.-L., 1997. Does intense fishing on malesimpair mating success of female Dungeness crabs? Can. J. Fish. Aquat. Sci. 54,655–669.
arris, R.G., Rattray Jr., M., 1954. The surface winds over Puget Sound and the Strait ofJuan de Fuca and their oceanographic effects. University of Washington, Depart-ment of Oceanography, Tech. Report no. 37, 101 pp.
ilborn, R., Walters, C.J., 1992. Quantitative Fisheries Stock Assessment: Choice,Dynamics and Uncertainty. Chapman and Hall, London, UK.
amieson, G.S., Phillips, A., 1993. Megalopal spatial distribution and stock separationin Dungeness crab (Cancer magister). Can. J. Fish. Aquat. Sci. 50, 416–429.
ensen, G.C., 1995. Pacific Coast Crabs and Shrimps. Sea Challengers, Monterey, CA.ohnston, D., Harris, D., Caputi, N., Thomson, A., 2011. Decline of a blue swimmer crab
(Portunus pelagicus) fishery in Western Australia—History, contributing factorsand future management strategy. Fish. Res. 109, 119–130.
ipcius, R.N., Stockhausen, W.T., 2002. Concurrent decline of the spawning stock,recruitment, larval abundance, and size of the blue crab Callinectes sapidus inChesapeake Bay. Mar. Ecol. Prog. Ser. 226, 45–61.
aunder, M.N., Punt, A.E., 2004. Standardizing catch and effort data: a review ofrecent approaches. Fish. Res. 70, 141–159.
yerscough, M.R., Darwen, M.J., Hogarth, W.L., 1996. Stability, persistence and struc-tural stability in a classical predator-prey model. Ecol. Model. 89, 31–42.
tzoufras, I., 2009. Bayesian Modeling using Winbugs. John Wiley & Sons, Inc., Hobo-ken, New Jersey.
regon Department of Fish and Wildlife. The life of a Dungeness crab. URL:<http://www.dfw.state.or.us/mrp/shellfish/crab/lifehistory.asp> (accessed07.11.11).
Research 139 (2013) 18– 27 27
Pauley, G., Armstrong, D., Heun, T.P.N., Cordes, C., Moran, D., 1989. Species profiles:life histories and environmental requirements of coastal fishes and invertebrates(Pacific Northwest): Dungeness crab. Biological Report 82 (11.117). U.S. Fishand Wildlife Service, Coastal Ecology Group, Waterways Experiment Station,Vicksburg, Mississippi, USA.
Peterman, R.M., 1977. A simple mechanism that causes collapsing stabilityregions in exploited salmonid populations. J. Fish. Res. Board Can. 34,1130–1132.
Powles, H., Vendette, V., Siron, R., O’Boyle, B., 2004. Proceedings of the CanadianMarine Ecosystems Workshop. DFO Can. Sci. Advis. Sec. Proceed. Ser. 2004/016.
Pritchard, D.W., 1952. A review of our present knowledge of the dynamics and flush-ing of estuaries. Chesapeake Bay Inst., Johns Hopkins Univ., Tech. Report no. 4,45 pp.
Reed, P.N., 1969. Culture methods and effects of temperature and salinity on survivaland growth of Dungeness crab (Cancer magister) larvae in the laboratory. J. Fish.Res. Board Can. 26, 389–397.
Reilly, P.N., 1985. Dynamics of Dungeness crab, Cancer magister, larvae off cen-tral and northern California. In: Proceedings of the Symposium on DungenessCrab Biology and Management, Univ. Alaska Sea Grant Re 85-3, Fairbanks, pp.245–272.
Roegner, G.C., Armstrong, D., Shanks, A.L., 2007. Wind and tidal influences onlarval crab recruitment to an Oregon estuary. Mar. Ecol. Prog. Ser. 351,177–188.
Scientific Certification Systems, 2010. MSC Final Report w/Certification Decision.Oregon Dungeness Crab Fishery. Version 4, 119 pp.
Shanks, A.L., Roegner, G.C., 2007. Recruitment limitation in Dungeness crab popula-tions is driven by variation in atmospheric forcing. Ecology 88, 1726–1737.
Shirley, T.C., Sturdevant, M., 1988. Dungeness crab mating study, Annual report tothe Alaskan Department of Fish and Game, no. UASE 87-20, Juneau. Universityof Alaska, Southeast, School of Fisheries and Science.
Spiegelhalter, D., Thomas, A., Best, N., Lunn, D., 2003. WinBUGS Version 1.4 UserManual. MRC Biostatistics Unit, Cambridge.
Stone, R.P., O’Clair, C.E., 2001. Seasonal movements and distribution of Dungenesscrabs (Cancer magister) in a glacial southeastern Alaska estuary. Mar. Ecol. Prog.Ser. 214, 167–176.
Swiney, K.M., Shirley, T.C., 2001. Gonad development of south eastern Alaskan Dun-geness crab, Cancer magister, under laboratory conditions. J. Crustacean Biol. 21,897–904.
Wahle, R.A., 2003. Revealing stock–recruitment relationships in lobsters and crabs:is experimental ecology the key? Fish. Res. 65, 3–32.
Waldichuk, M., 1957. Physical oceanography of the Strait of Georgia, BritishColumbia. J. Fish. Res. Board Can. 14 (3), 321–486.
Walters, C., Kitchell, J.F., 2001. Cultivation/depensation effects on juvenile survivaland recruitment: implications for the theory of fishing. Can. J. Fish. Aquat. Sci.58, 39–50.
Washington Department of Fish and Wildlife. Fishing and Shellfishing. URL:<http://wdfw.wa.gov/fishing/commercial/crab/coastal/> (accessed 07.11.11).
Williams, J.G., 1979. Estimation of intertidal harvest of Dungeness crab, Cancer mag-ister, on Puget Sound, Washington, beaches. U.S. Natl. Mar. Fish. Sew. Fish. Bull.77 (1), 287–292.
Zhang, Z., Hajas, W., Phillips, A., Boutillier, J.A., 2004. Use of length-based models toestimate biological parameters and conduct yield analyses for male Dungeness
Zheng, J., Kruse, G.H., 1998. Stock–recruitment relationships for Bristol Bay tannercrab. Alaska Fish. Res. Bull. 5, 116–130.
Zheng, J., Kruse, G.H., 2003. Stock–recruitment relationships for three major Alaskancrab stocks. Fish. Res. 65, 103–121.