Consultant Report on EBITDA Projections Prepared by Greenko Dutch B.V.
Board of Directors of Greenko Dutch B.V. Barclays Bank PLC Deutsche Bank AG, Singapore Branch Investec Bank plc J.P. Morgan Securities plc Morgan Stanley & Co. International plc We have performed the procedures in accordance with the engagement contract signed with Greenko Dutch B.V. (referred to as “Company”) and Barclays Bank PLC, Deutsche Bank AG, Singapore Branch, Investec Bank plc, J.P. Morgan Securities plc, Morgan Stanley & Co. International plc (collectively, the “Joint Lead Managers”). The scope and sufficiency of these procedures is solely the responsibility of the Company. The Company is responsible for the EBITDA projections and underlying assumptions. Consequently, we make no representation regarding the sufficiency of the procedures described below either for the purpose for which this report has been requested or for any other purpose. This report includes our procedures performed and results of such procedures.
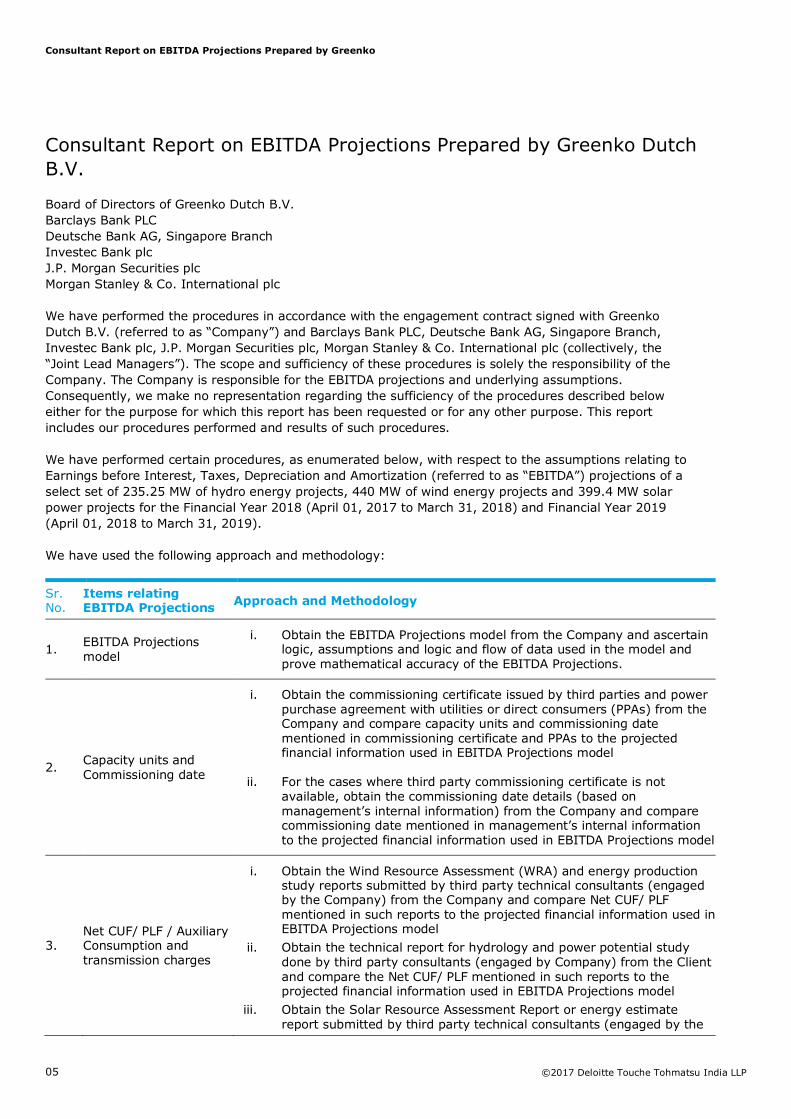
We have performed certain procedures, as enumerated below, with respect to the assumptions relating to Earnings before Interest, Taxes, Depreciation and Amortization (referred to as “EBITDA”) projections of a select set of 235.25 MW of hydro energy projects, 440 MW of wind energy projects and 399.4 MW solar power projects for the Financial Year 2018 (April 01, 2017 to March 31, 2018) and Financial Year 2019 (April 01, 2018 to March 31, 2019).
We have used the following approach and methodology:
Sr. No.
Items relating EBITDA Projections
Approach and Methodology
1. EBITDA Projections model
i. Obtain the EBITDA Projections model from the Company and ascertain logic, assumptions and logic and flow of data used in the model and prove mathematical accuracy of the EBITDA Projections.
2. Capacity units and Commissioning date
i. Obtain the commissioning certificate issued by third parties and power purchase agreement with utilities or direct consumers (PPAs) from the Company and compare capacity units and commissioning date mentioned in commissioning certificate and PPAs to the projected financial information used in EBITDA Projections model
ii. For the cases where third party commissioning certificate is not available, obtain the commissioning date details (based on management’s internal information) from the Company and compare commissioning date mentioned in management’s internal information to the projected financial information used in EBITDA Projections model
3. Net CUF/ PLF / Auxiliary Consumption and transmission charges
i. Obtain the Wind Resource Assessment (WRA) and energy production study reports submitted by third party technical consultants (engaged by the Company) from the Company and compare Net CUF/ PLF mentioned in such reports to the projected financial information used in EBITDA Projections model
ii. Obtain the technical report for hydrology and power potential study done by third party consultants (engaged by Company) from the Client and compare the Net CUF/ PLF mentioned in such reports to the projected financial information used in EBITDA Projections model
iii. Obtain the Solar Resource Assessment Report or energy estimate report submitted by third party technical consultants (engaged by the
Consultant Report on EBITDA Projections Prepared by Greenko
Company) from the Company and compare Net CUF/ PLF mentioned in such reports for solar projects to the projected financial information used in EBITDA Projections model
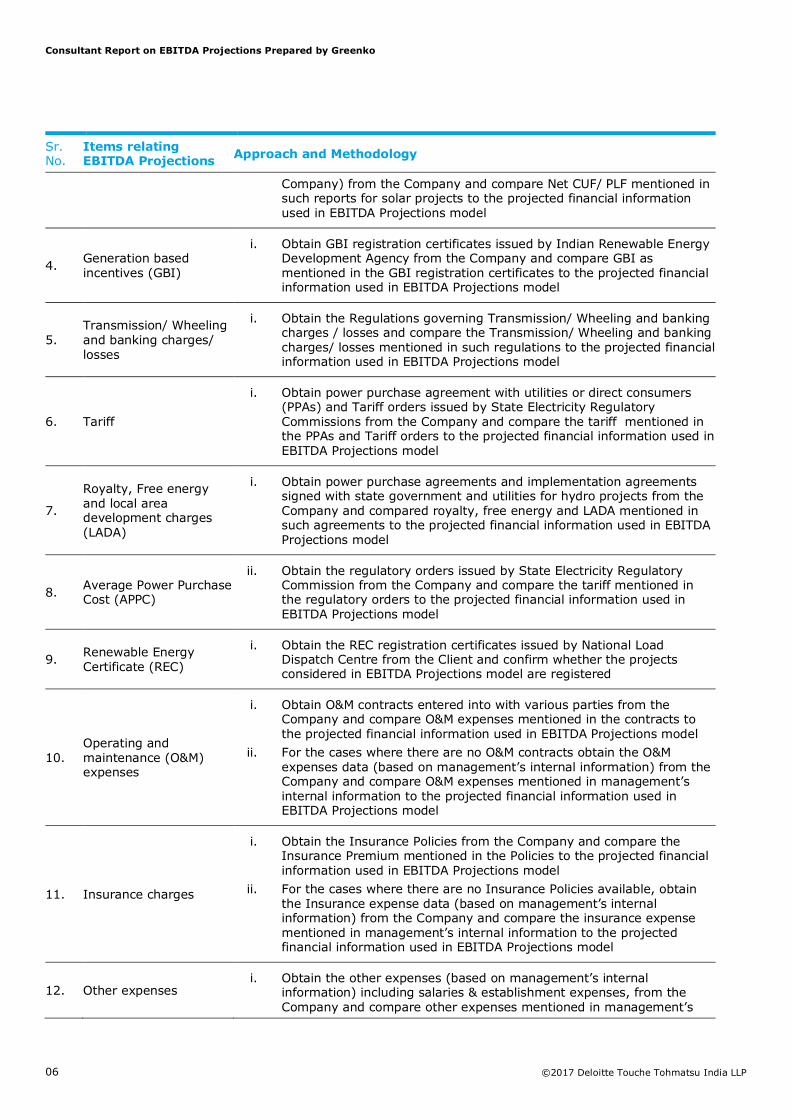
4. Generation based incentives (GBI)
i. Obtain GBI registration certificates issued by Indian Renewable Energy Development Agency from the Company and compare GBI as mentioned in the GBI registration certificates to the projected financial information used in EBITDA Projections model
5. Transmission/ Wheeling and banking charges/ losses
i. Obtain the Regulations governing Transmission/ Wheeling and banking charges / losses and compare the Transmission/ Wheeling and banking charges/ losses mentioned in such regulations to the projected financial information used in EBITDA Projections model
6. Tariff
i. Obtain power purchase agreement with utilities or direct consumers (PPAs) and Tariff orders issued by State Electricity Regulatory Commissions from the Company and compare the tariff mentioned in the PPAs and Tariff orders to the projected financial information used in EBITDA Projections model
7.
Royalty, Free energy and local area development charges (LADA)
i. Obtain power purchase agreements and implementation agreements signed with state government and utilities for hydro projects from the Company and compared royalty, free energy and LADA mentioned in such agreements to the projected financial information used in EBITDA Projections model
8. Average Power Purchase Cost (APPC)
ii. Obtain the regulatory orders issued by State Electricity Regulatory Commission from the Company and compare the tariff mentioned in the regulatory orders to the projected financial information used in EBITDA Projections model
9. Renewable Energy Certificate (REC)
i. Obtain the REC registration certificates issued by National Load Dispatch Centre from the Client and confirm whether the projects considered in EBITDA Projections model are registered
10. Operating and maintenance (O&M) expenses
i. Obtain O&M contracts entered into with various parties from the Company and compare O&M expenses mentioned in the contracts to the projected financial information used in EBITDA Projections model
ii. For the cases where there are no O&M contracts obtain the O&M expenses data (based on management’s internal information) from the Company and compare O&M expenses mentioned in management’s internal information to the projected financial information used in EBITDA Projections model
11. Insurance charges
i. Obtain the Insurance Policies from the Company and compare the Insurance Premium mentioned in the Policies to the projected financial information used in EBITDA Projections model
ii. For the cases where there are no Insurance Policies available, obtain the Insurance expense data (based on management’s internal information) from the Company and compare the insurance expense mentioned in management’s internal information to the projected financial information used in EBITDA Projections model
12. Other expenses i. Obtain the other expenses (based on management’s internal
information) including salaries & establishment expenses, from the Company and compare other expenses mentioned in management’s
Consultant Report on EBITDA Projections Prepared by Greenko
internal information to the projected financial information used in EBITDA Projections model
We have not conducted any due diligence of information provided in the technical or due diligence reports provided by TÜV Rheinland (India) Pvt Ltd, SgurrEnergy India Pvt. Ltd., 3TIER R&D India Private Limited, Tractebel Engineering Private Limited, Entura Hydro Tasmania India Pvt Ltd, Garrad Hassan India Private Ltd and AWS Truepower LLC.
We have not checked any land records/ land agreements / rent agreements/ property taxes. We have relied on Management Representation for all these expenses.
We did not explicitly evaluate the model logic and/or the associated input assumptions below EBITDA including, but not limited to, those calculations and assumptions related to taxes, interest, depreciation, financing structures, (i.e., tax equity, project debt financing), working capital, etc. Our scope also did not include any projected cash flows or projected balance sheet.
Any historical data has not been inspected by us.
We have the following main findings:
• We inspected the EBITDA model and found no mathematical inaccuracies.
• We noted the capacity and the commissioning date of the projects from the Commissioning certificates. The observations for individual projects are discussed in Section 4.
• We compared PLF shown in the model for wind projects with the P75 estimates given in WRA reports and noted no differences.
• We compared PLF shown in the model for solar projects with the P75 estimates given in solar resource assessment reports (PVsyst) reports and noted no differences.
• PLF/generation considered in the model for hydro power projects is in line with the estimates given in Tractebel report, Entura report and based on Management Representation for some projects where the internal assessment is lower than the technical report estimates.
• We compared royalty, free energy and LADA mentioned in Implementation agreements signed with state governments to the projected financial information used in EBITDA Projections model and noted that they are in agreement
• We inspected the PPAs to compare the tariff for operational wind, hydro and solar projects selling power to state electricity utilities and noted no differences.
• We compared the tariff for projects selling directly to industrial and commercial consumers with the terms of the PPA and applicability of charges with Karnataka Electricity Regulatory Commission (KERC) FY 2017-18 order (order dated April 11, 2017) and Andhra Pradesh Electricity Regulatory Commission (APERC) FY 2017-18 order (order dated March 31, 2017). We noted no differences. The observations for individual projects are discussed in detail in Section 4.
• We inspected the GBI registration letters from Indian Renewable Energy Development Agency Limited (IREDA) and snapshots of IREDA website registration for operational projects and noted that projects selling power to state electricity utilities are registered to avail GBI benefits. We compared the GBI rate mentioned in GBI guidelines issued by IREDA and noted no differences. The observations for individual projects are discussed in Section 4.
• We have inspected the REC registration certificates issued by National Load Dispatch Centre (NLDC). The observations on the impact on sale of RECs on EBITDA are discussed in Section 4.
Consultant Report on EBITDA Projections Prepared by Greenko
• We compared the O&M expenses for hydro and solar power projects with Management representation and noted no differences.
• We compared the O&M expenses for solar projects with the benchmarks for solar projects listed in CERC order (dated March 30, 2016) named Determination of levellised generic tariff for FY 2016-17 under Regulation 8 of the Central Electricity Regulatory Commission (Terms and Conditions for Tariff determination from Renewable Energy Sources) Regulations, 2012 and noted that the difference is less than 1%
• We compared the O&M expenses for Hydro projects with the benchmarks for hydro projects listed in CERC order (dated April 18, 2017) named Determination of levellised generic tariff for FY 2017-18 under Regulation 8 of the Central Electricity Regulatory Commission (Terms and Conditions for Tariff determination from Renewable Energy Sources) Regulations, 2017 and Uttarakhand Electricity Regulatory Commission (UERC) tariff order on Budhil dated 30th November 2016 and noted that the O&M expenses in the model is higher by ~22%
• We inspected the O&M agreements for wind power projects with the O&M Charges and escalation rate assumed in the model and noted that they are as per agreement. We compared the applicable tax on O&M Charges with Management representation and noted that they are in agreement.
• We compared the other expenses considered in the model for wind power projects with expenses provided in Management representation and noted that they are in agreement. Management represented that the expenses are based on internal estimates and their experience in operating such projects.
The details about the EBITDA level projections, underlying assumptions and detailed findings are given in the attached detailed report.
We were not engaged to and did not conduct an examination, the objective of which would be the expression of an opinion on the accompanying EBITDA projections. Accordingly, we do not express an opinion on whether the underlying assumptions provide a reasonable basis for the presentation. Had we performed additional procedures, other matters might have come to our attention that would have been reported to the Company. Furthermore, there will usually be differences between the forecasted and actual results, because events and circumstances frequently do not occur as expected, and those differences may be material. We have no responsibility to update this report for events and circumstances occurring after the date of this report.
This report is intended solely for the information and use of the Company and the Joint Lead Managers (referred to as the “Specified Parties”) and is not intended to be used or relied upon by anyone other than the Specified Parties. The report contains procedures agreed upon with the Company and may not be suitable for any investment decision or other purposes.
Conversion to United States Dollars (USD) is based on exchange rate of INR 64.8386 per USD 1.00, being the closing exchange rate published by Reserve Bank of India as of 31st March 2017
The representation provided by the Management is provided as Annexure 1.
Consultant Report on EBITDA Projections Prepared by Greenko
1. Introduction Greenko Energies Pvt. Ltd. is an independent power producer which owns and operates portfolio of wind, hydro, solar, natural gas and biomass based power generation assets in India. The Company has over 2500 MW of operating capacity (including assets with significant minority ownership but operational control). Greenko Mauritius Ltd, parent of Greenko Energies Pvt. Ltd., through its 100% owned Dutch subsidiary Greenko Dutch B.V. (“Greenko” or the “Company”), proposes to raise a high yield bond by public offer in the Singapore market. The overall Greenko group structure with Restricted Group as provided by the Company Management is presented below:
Source: Greenko
Consultant Report on EBITDA Projections Prepared by Greenko
The Company has prepared the financial projections considering the following 1074.65 MW of select hydro, wind and solar power projects in India:
• 235.25 MW of hydro power projects
• 440.00 MW of wind projects
• 399.40 MW of solar power projects
The above set of operational projects comprise the Restricted Group. The details of the specific projects considered in the projections are given later in Section 3.
The projected financials provide combined financial projections of projects and financial information associated with these projects including:
• Annual operating parameters – Net CUF/ PLF/generation, wheeling and banking charges and transmission losses
• Annual operating revenues
• Annual operating expenses
• Earnings before Interest, Taxes, Depreciation and Amortization (EBITDA)
Revenues and EBITDA as shown in projected financials have not been recognized in accordance with Generally Accepted Accounting Principles (GAAP) but are instead non-GAAP estimates of future project performance. We have not ascertained the adherence of the projections to Indian GAAP or IFRS.
Further the projections of generation, revenues, expenses and EBITDA are consolidated measures of the projects reflecting 100% ownership. These figures do not take into account minority interests, tax equity, or other financial interests in the projects other than the Restricted Group.
Consultant Report on EBITDA Projections Prepared by Greenko
Based on the assumptions made by the Company and their financial model, the combined financial forecasts for the Restricted Group are shown in the table below:
Particulars FY 2018E FY 2019E FY 2018E FY 2019E
[INR Mn] [INR Mn] [USD Mn] [USD Mn]
Saleable energy [MkWh] 2,691.55 2,687.14 2,691.55 2,687.14
Revenue
Revenue from sale of power 13,471.07 13,449.43 207.76 207.43
Revenue from GBI 382.01 382.01 5.89 5.89
Revenue from REC 84.73 84.73 1.31 1.31
Total income 13,937.81 13,916.17 214.96 214.63
Per unit income INR
5.18/kWh
INR
5.18/KWh
USC
7.99/kWh
USC
7.99/kWh
Expenses
O&M expenses 1,372.98 1,473.61 21.18 22.73
Other expenses 404.42 417.90 6.24 6.45
Total expenses 1,777.40 1,891.51 27.41 29.17
Per unit expense INR
0.66/kWh
INR
0.70/kWh
USC
1.02/kWh
USC
1.09/kWh
EBITDA 12,160.41 12,024.67 187.55 185.46
EBITDA % 87.25% 86.41% 87.25% 86.41%
*Translations were made at the exchange rate of INR 64.8386 per USD 1.00, being the closing exchange rate published
by Reserve Bank of India as of 31st March 2017
The underlying input assumptions for operating characteristics / parameters, revenues and expenses for the Restricted Group and our overall findings if any are described below.
Capacity and Commissioning date
We obtained the commissioning certificates of all the operational projects and compared the commissioning dates and capacity with the assumptions in the model and found no differences except for Rithwik and Ratnagiri.
We obtained the Commissioning certificate for Rithwik and noted that 24 MW of the project has commissioned. The interconnection approval by KPTCL indicated a project capacity of 24.75 MW and Management represented that the installed capacity of the plant is 24.75 MW based on the interconnection approval. We compared the capacity in the model for Rithwik with capacity in Management representation and noted that they are in agreement.
Phase 2 of the Ratnagiri project consists of 20 GE Turbines. We obtained the Commissioning certificate and noted that the capacity of each turbine is 1.6 MW. Management represented that the actual turbine capacity is 1.8 MW due to capacity enhancement. We compared the capacity in model and Management representation and noted no differences.
Our observations for individual projects are discussed in Section 4.
Consultant Report on EBITDA Projections Prepared by Greenko
We obtained the wind resource assessment (WRA) reports prepared by technical consultants AWS Truepower LLC and Garrad Hassan India Private Ltd for all the wind power projects.
Because of the uncertainty involved in pattern of wind flows, the WRA Reports provide estimates of generation/ plant load factor (PLF) based on different confidence levels called as P99, P95, P90, P75 and P50. The number represents the probability that the actual generation will exceed the estimated generation. So, a P75 represents that there is a 75% probability that actual generation will be higher than the estimated generation. Hence, P90 estimates are lower than P75 estimates which are lower than P50 estimates.
We compared the PLF in the model for wind projects with the P75 estimates given in WRA reports and noted no differences.
Solar Power Projects
We obtained the solar resource assessment (PVsyst) reports prepared by TÜV Rheinland (India) Pvt Ltd, SgurrEnergy India Pvt. Ltd., 3TIER R&D India Private Limited and Tractebel Engineering Private Limited for all the solar power projects which indicated the energy generation estimates.
We compared the PLF in the model for solar projects with the P75 estimates given in the PVsyst reports and found no differences.
Hydro Power Projects
We obtained the due diligence reports for hydro power projects prepared by Tractebel Engineering Private Limited (“Tractebel report”) dated June 2014 and Entura Hydro Tasmania India Pvt. Ltd. (“Entura report”) dated September 2013.
PLF/generation considered in the model for hydro power projects is in line with the estimates given in Tractebel report, Entura report and based on Management Representation for some projects where the internal assessment is lower than the P75 estimates.
For AMR, the PLF considered in the model is greater than the P75 estimate provided in the Tractebel report and we enquired the management about the difference. Management indicated that both AMR and Rithwik projects are on the same river and share the same hydrological resources. Management indicated that the combined generation of AMR and Rithwik is same as the combined P75 estimate provided in Tractebel report for both the plants. Based on the above, PLF considered for Rithwik is lower than P75 estimate provided in Tractebel report. We compared the combined PLF for AMR and Rithwik with the P75 estimates for these two projects and noted no difference.
Revenue approach / assumptions
The Restricted Group projects considered for the analysis have three possible sources of revenues:
• Sale of electricity to distribution utilities or direct sale to consumers, and
• Generation based incentives (GBI)
• Renewable energy certificate
Revenue from sale of electricity
The Restricted Group is selling power from operational projects under different sale models.
• Sale to electricity utilities
• Direct sale to end consumers (industrial/commercial)
Consultant Report on EBITDA Projections Prepared by Greenko
The Restricted Group has long-term Power Purchase Agreements (PPAs) for operational projects. State electricity utilities considered for the Restricted Group sign long-term PPA for tenures of 13 - 40 years for hydro, wind and solar power projects.
The wind and hydro PPAs are signed through one of the following mechanism to electricity utilities: Feed-in-tariff (“FIT”) and APPC-REC model. Under FIT mechanism, the tariff is fixed by state electricity commissions and the power generator is paid same tariff for the entire life of the project. Under APPC-REC mechanism, average pooled purchase cost of distribution companies is paid to the power generator and in addition to this price, power generator also receives Renewable energy certificate which can be sold at power exchange.
The solar PPA’s are signed through competitive bidding route with tariff based bidding or though Feed-in-Tariff mechanism.
We inspected the PPAs to compare the tariff assumed by the Restricted Group for operational projects and noted that the tariff was in agreement with the PPAs.
Direct sale to industrial/commercial consumers
The Restricted Group has long-term Power Purchase Agreements (PPAs) under group captive and third party route in two states, Karnataka and Andhra Pradesh.
For the projects in Karnataka, the Restricted Group has PPAs of different tenures with the end consumers (Industrial/Commercial). As per the PPAs, the power is sold to the end consumers at a discount to the tariff (energy charges) charged by the respective electricity utilities for that particular category of consumers (Industrial/Commercial). The tariff to be charged by the electricity utilities is approved by Karnataka Electricity Regulatory Commission (KERC) by periodic Tariff Orders. The PPAs are signed under group captive mode or direct sale mode.
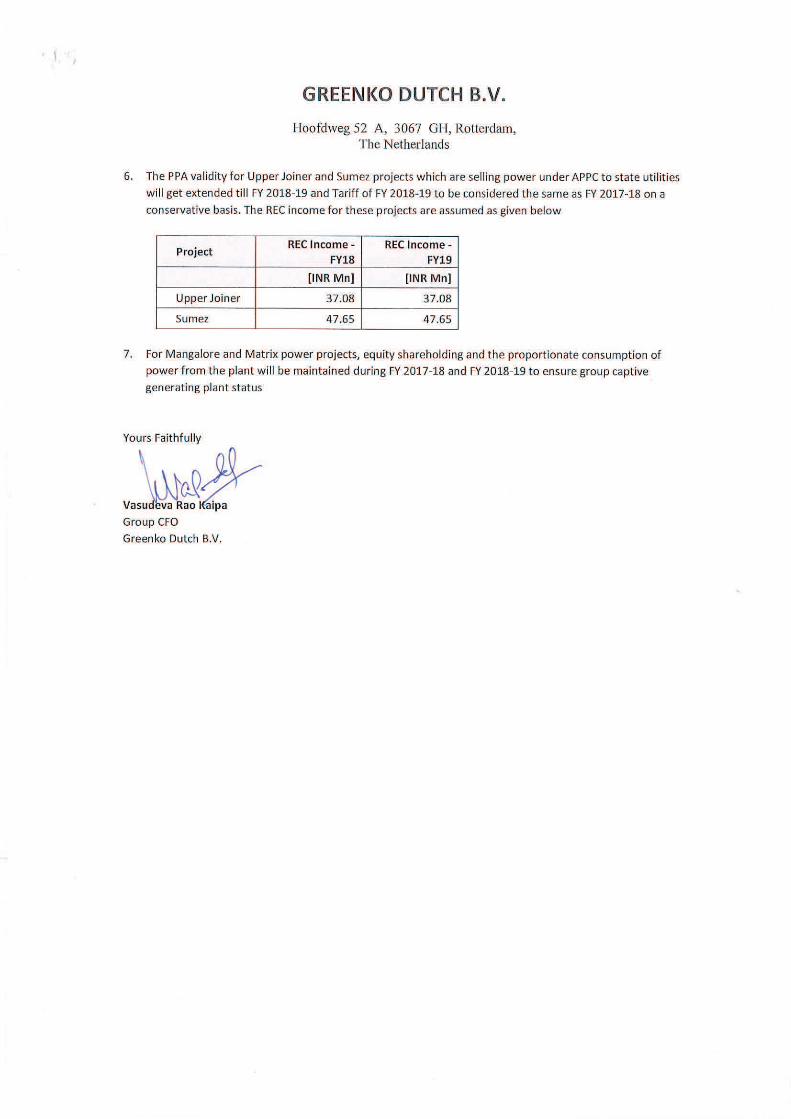
The Electricity Rules, 2005 specify that for projects to be considered as captive generating plant, the consumers need to have at least 26% of equity in the project and consume at least 51% of the power on an annual basis. Further, the captive users need to consume power in proportion to their shares in ownership of the power plant within a variation not exceeding 10%. We examined the proportion of contracted energy as per the PPAs and the proportion of the shareholding as per the SHAs and noted that the proportions are in agreement with the requirements i.e. 26% equity and at least 51% consumption of power for captive generating stations under the Electricity Rules, 2005. Management represented that for Mangalore and Matrix power projects, equity shareholding and the proportionate consumption of power from the plant will be maintained during FY 2017-18 and FY 2018-19 to ensure group captive generating plant status.
For selling power to end consumers, the projects have to bear certain charges like cross-subsidy surcharge (wherever applicable) and wheeling and banking charges to be paid to electricity utilities. These charges are also approved by the KERC in its Tariff Orders. Cross subsidy surcharge is not applicable for captive generating stations. Wheeling charges are 5% of energy injected into the grid.
Due to seasonal nature and uncertainty of wind generation, it is not always possible to match the generation with offtake of energy by consumers and this may result in demand-supply mismatches. Maximum wind generation is usually observed during the period of May-September, so the generation that is not consumed is banked with the electricity utility to be consumed in the later months. This banking facility is provided in Karnataka over a wind year from April to March and energy not consumed during a wind year will be deemed to be purchased by the distribution licensee in whose jurisdiction, the project is located. The payment for such energy shall be at the rate of 85% of the latest generic tariff for wind energy. The latest generic tariff for wind energy in the state is 4.50 Rs/kWh as per KERC order dated February 24, 2015. 85% of this tariff will be 3.83 Rs/kWh. Based on the general seasonal generation pattern and tenure of banking period allowed under the regulations, we ascertained whether there will be any lapse of annual generation. Banking charges are 2% of energy injected into the grid.
Consultant Report on EBITDA Projections Prepared by Greenko
The tariff for sale of power to end-consumers assumed by the Restricted Group for projecting the revenues for FY2017-18 is net of the discount and charges. It has assumed an escalation of 1% on the FY 2017-18 tariffs for projecting the tariff for FY 2018-19.
We calculated the net tariff applicable for the projects based on the tariff category & discount mentioned in the PPA, wheeling & banking charges, cross subsidy surcharge and end user tariff in Karnataka Electricity Regulatory Commission (KERC) Tariff order for FY 2017-18. We compared the calculated tariffs with the tariff assumed in model and found no differences. The observations for individual projects are discussed in more detail in Section 4.
Sriram-Manempalli, Beachaganapalli,Jogipet, Regode has entered into PPAs with consumers in Andhra Pradesh with PPA tenure of 10-20 years. We also noted the various charges under Andhra Pradesh Electricity Regulatory Commission (APERC) Tariff order for FY 2017-18. The tariff for sale of power to end-consumers assumed by the Restricted Group for projecting the revenues for FY2017-18 is net of the discount and charges. It has assumed an escalation of 1% on the FY 2017-18 tariffs for projecting the tariff for FY 2018-19.
Income from Generation Based Incentive (GBI)
We obtained the Operational Guidelines for Implementation of “Extension Scheme for Generation Based Incentive for Grid Connected Wind Power Projects” as revised on April 22, 2015 and noted the requirements for availing generation based incentives (GBI). Wind power projects which are commissioned/likely to be commissioned between April 01, 2012 and March 31, 2017 (including both the dates) and selling power to electricity utilities are eligible for GBI. Wind power projects meeting the eligibility criteria have to register the projects with Indian Renewable Energy Development Agency Ltd (IREDA, a Govt. of India Enterprise and nodal agency for registering and issuance of GBI) for availing the GBI. As per GBI operational guidelines, the projects will get the GBI at a rate of INR 0.50 per kWh of electricity fed into the grid with a maximum limit of INR 10.0 million per MW. The total disbursement in the year will be limited to INR 2.5 million/MW during the first four years. The incentive is over and above the tariff approved by State Electricity Regulatory Commissions (SERCs) in various states.
We obtained the GBI registration letters from Indian Renewable Energy Development Agency Limited (IREDA) and snapshots of IREDA website registration for Ratnagiri Wind, Rayala Wind, Poly and Jed wind projects who are selling power to state electricity utilities. The Restricted Group has assumed GBI for these four wind projects selling power to state electricity utilities.
Revenue from Renewable Energy Certificates (RECs)
Projects selling power to electricity utilities under APPC are eligible for availing RECs. RECs are tradable instruments which can be sold in Indian Power Exchanges at a market determined price. However, the price of the non Solar REC is limited at their floor price of INR 1000/REC and forbearance price of INR 3000/REC. The floor and forbearance price is determined by Central Electricity Regulatory Commission (CERC) and are applicable from 1st April 2017 and shall remain valid until further orders from the commission. The Supreme Court has stayed trading in Renewable Energy Certificates (RECs). The Restricted Group has assumed the floor price for projecting the revenues from RECs. We have inspected the REC registration certificates issued by National Load Dispatch Centre (NLDC). The observations on the impact on sale of RECs on EBITDA are discussed in Section 4.
Operating expenses approach / assumptions
Wind power projects
The projects in the Restricted Group have signed agreements for operation & maintenance (O&M) of the wind power projects with the respective Original Equipment Manufacturers (OEMs) / wind turbine manufacturers. We have inspected the O&M agreements to understand the assumptions used for O&M expenses.
In addition there are personnel, consumables, insurance and administration expenses. We inquired of Management as to source of these other O&M expenses and were informed that it was based on management internal information and their experience in other similar operating projects.
Consultant Report on EBITDA Projections Prepared by Greenko
The Restricted Group uses the in-house capability for O&M of hydro power projects. We have compared the expenses projected by the Restricted Group with the Management representation and noted that they are in agreement. We compared the escalation rate for O&M expenses considered in the model with rate provided in Management representation and noted that they are in agreement. Management represented that these numbers are based on their experience of operating similar projects. Corporate overheads are not considered in these projections. The observations for individual projects are more fully discussed in Section 4.
Solar power projects
The Restricted Group uses the in-house capability for O&M of Solar power projects. We have compared the expenses projected by the Restricted Group with the Management representation and noted that they are in agreement. We compared the escalation rate for O&M expenses considered in the model with rate provided in Management representation and noted that they are in agreement. Management represented that these numbers are based on their experience of operating similar projects. Corporate overheads are not considered in these projections. The observations for individual projects are more fully discussed in Section 4.
Consultant Report on EBITDA Projections Prepared by Greenko
Greenko Dutch BV through its subsidiaries owns and operates a portfolio of hydro, wind and solar assets and plans to increase its portfolio by developing new Greenfield assets or by acquiring projects.
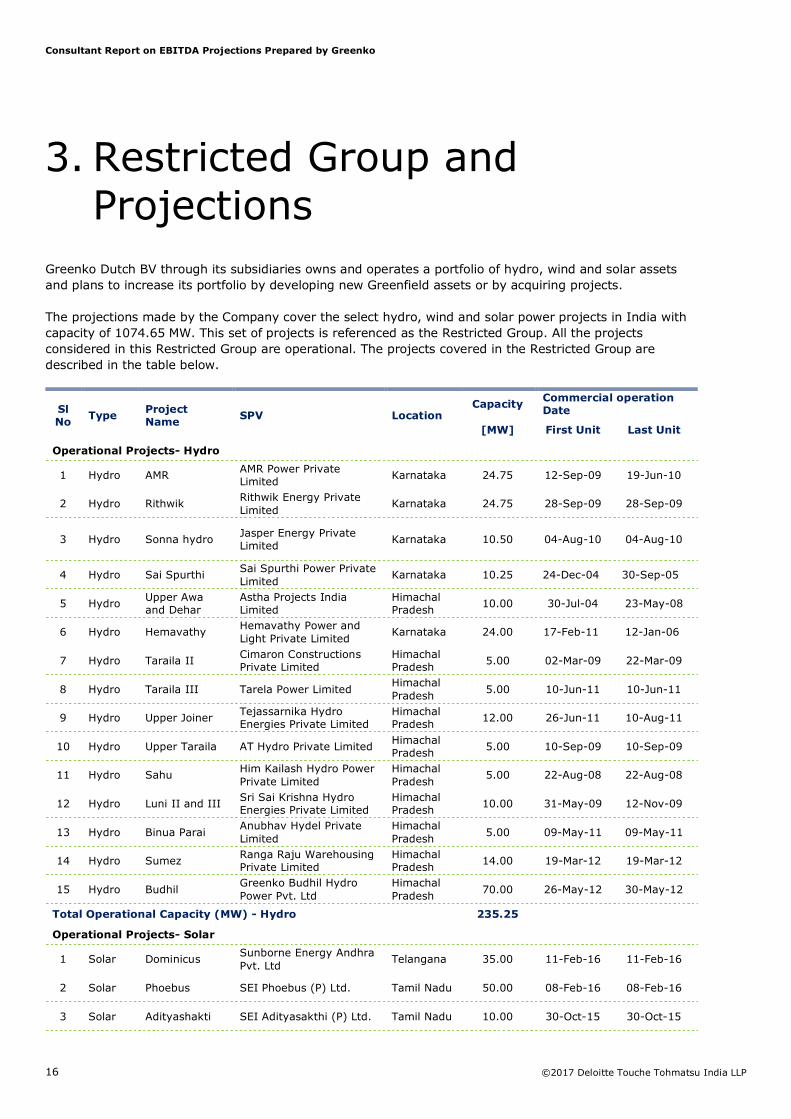
The projections made by the Company cover the select hydro, wind and solar power projects in India with capacity of 1074.65 MW. This set of projects is referenced as the Restricted Group. All the projects considered in this Restricted Group are operational. The projects covered in the Restricted Group are described in the table below.
Sl No
Type Project Name
SPV Location Capacity
Commercial operation Date
[MW] First Unit Last Unit
Operational Projects- Hydro
1 Hydro AMR AMR Power Private Limited
Karnataka 24.75 12-Sep-09 19-Jun-10
2 Hydro Rithwik Rithwik Energy Private Limited
Karnataka 24.75 28-Sep-09 28-Sep-09
3 Hydro Sonna hydro Jasper Energy Private Limited
Karnataka 10.50 04-Aug-10 04-Aug-10
4 Hydro Sai Spurthi Sai Spurthi Power Private Limited
Karnataka 10.25 24-Dec-04 30-Sep-05
5 Hydro Upper Awa and Dehar
Astha Projects India Limited
Himachal Pradesh
10.00 30-Jul-04 23-May-08
6 Hydro Hemavathy Hemavathy Power and Light Private Limited
Karnataka 24.00 17-Feb-11 12-Jan-06
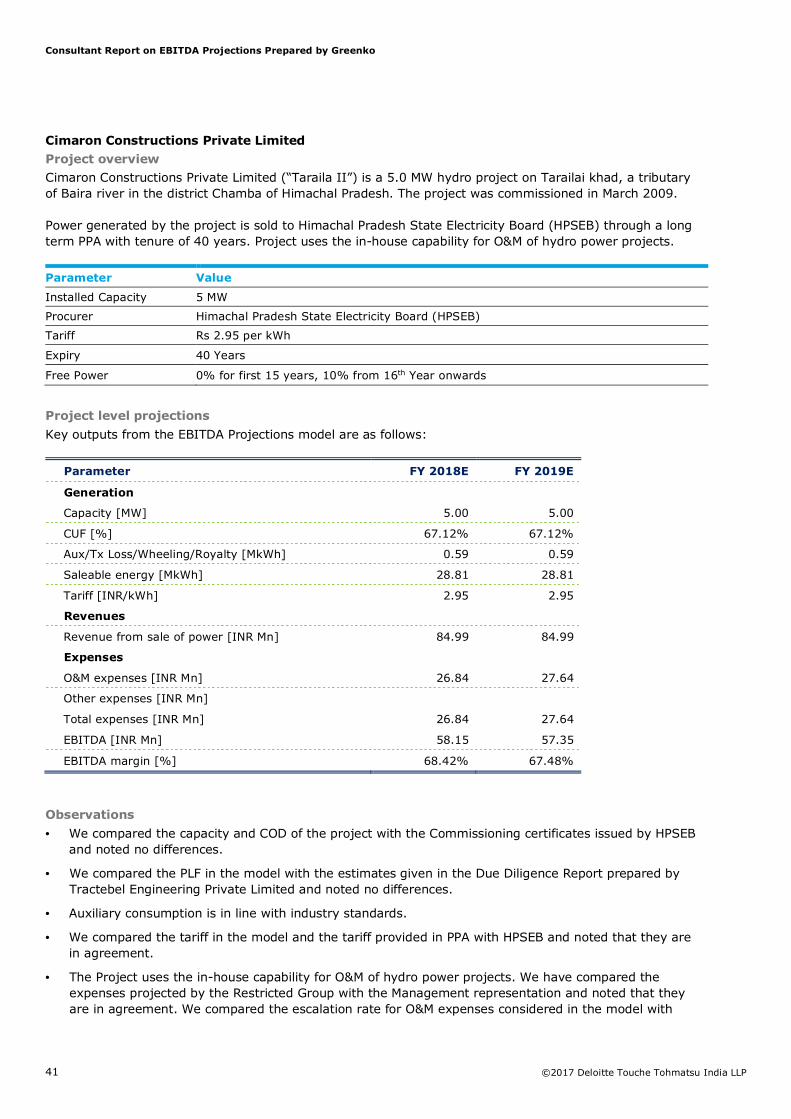
7 Hydro Taraila II Cimaron Constructions Private Limited
Himachal Pradesh
5.00 02-Mar-09 22-Mar-09
8 Hydro Taraila III Tarela Power Limited Himachal Pradesh
5 Wind Rayala Wind Rayala Wind Power Company Private Limited
Andhra Pradesh
159.20 29-Nov-13 06-May-15
6 Wind Poly Poly Solar Parks Private Limited
Andhra Pradesh
24.00 23-Jul-16 23-Jul-16
7 Wind Jed Jed Solar Parks Private Limited
Andhra Pradesh
24.00 23-Jul-16 23-Jul-16
Total Operational Capacity (MW)- Wind 440.00
Total Capacity considering all projects (MW) 1,074.65
Source: Greenko
The projects considered in the Restricted Group are spread across six states of India. The capacity distribution by states and technology is presented here:
Consultant Report on EBITDA Projections Prepared by Greenko
Every project considered for this Restricted Group is discussed in the following section. In project wise discussions, we have given a project overview and explained the basis for assumptions related to operational performance, revenue and expenses. Each project level description also has projections of saleable energy, revenue, operating expenses and EBITDA.
Based on the assumptions made by the Company and their EBITDA Projections model, the EBITDA contribution by each project to the combined projections is provided in the table below:
Sl
No Type Project Name
EBITDA EBITDA
FY 2018E FY 2019E FY 2018E FY 2019E
[INR Mn] [INR Mn] [USD Mn] [USD Mn]
Operational Projects- Hydro
1 Hydro AMR 310.09 311.82 4.78 4.81
2 Hydro Rithwik 114.28 113.03 1.76 1.74
3 Hydro Sonna hydro 21.69 21.22 0.33 0.33
4 Hydro Sai Spurthi 89.57 88.77 1.38 1.37
5 Hydro Upper Awa and Dehar 109.99 108.87 1.70 1.68
6 Hydro Hemavathy 223.71 222.45 3.45 3.43
7 Hydro Taraila II 58.15 57.35 0.90 0.88
8 Hydro Taraila III 63.25 62.63 0.98 0.97
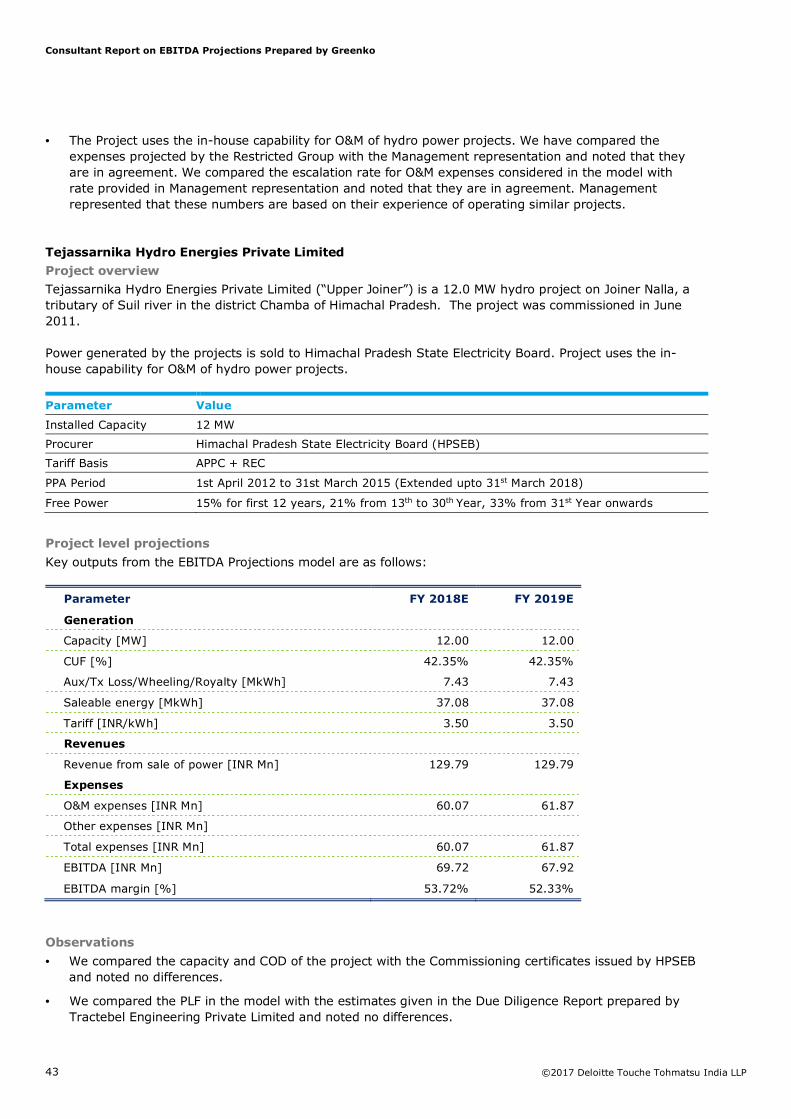
9 Hydro Upper Joiner 69.72 67.92 1.08 1.05
10 Hydro Upper Taraila 59.17 58.51 0.91 0.90
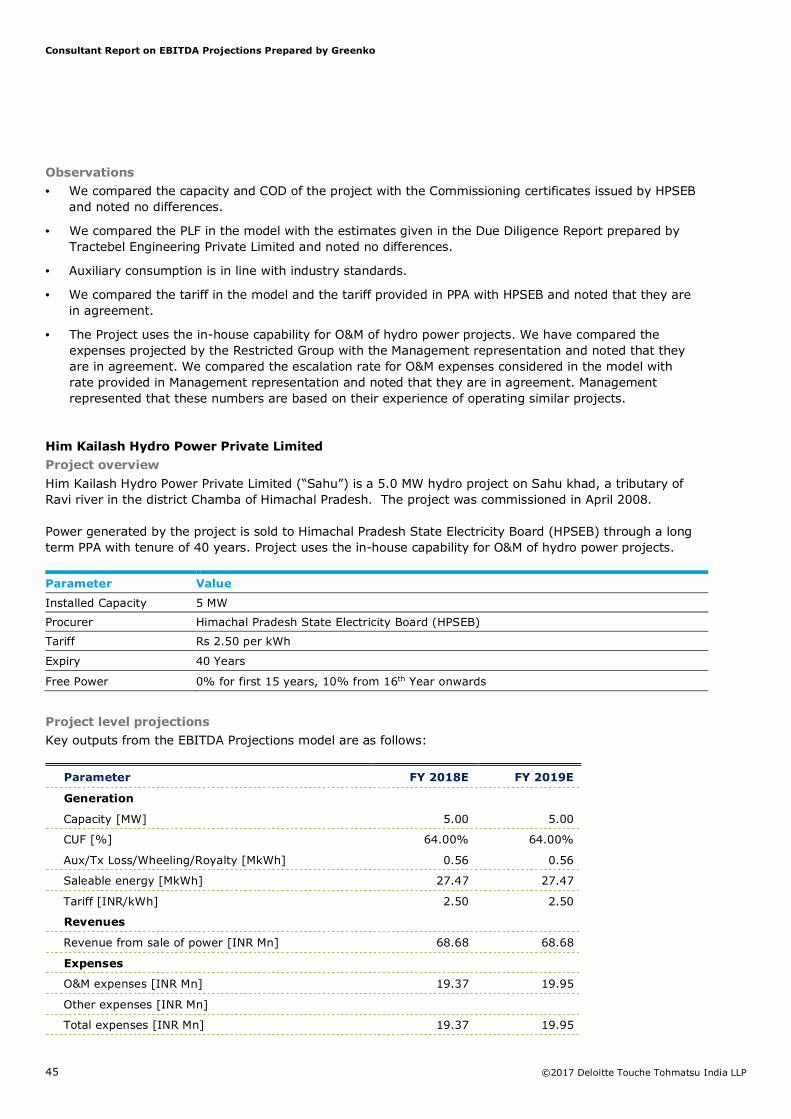
11 Hydro Sahu 49.31 48.73 0.76 0.75
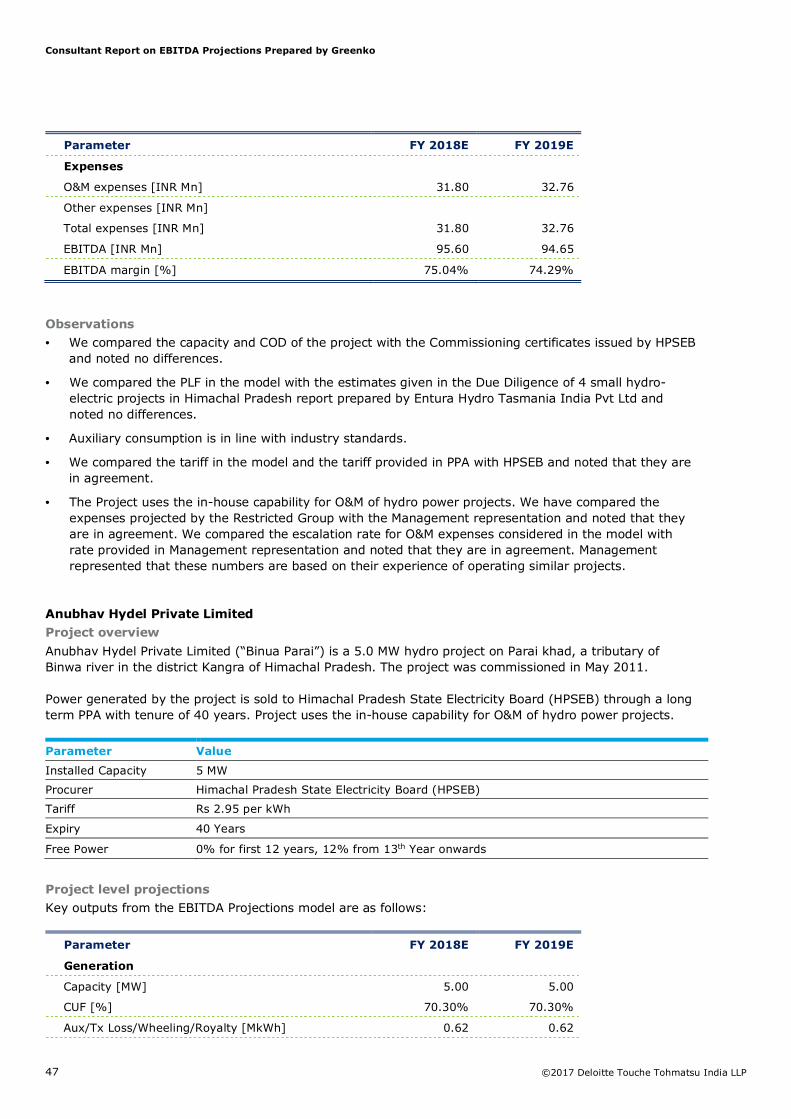
12 Hydro Luni II and III 95.60 94.65 1.47 1.46
13 Hydro Binua Parai 74.14 73.69 1.14 1.14
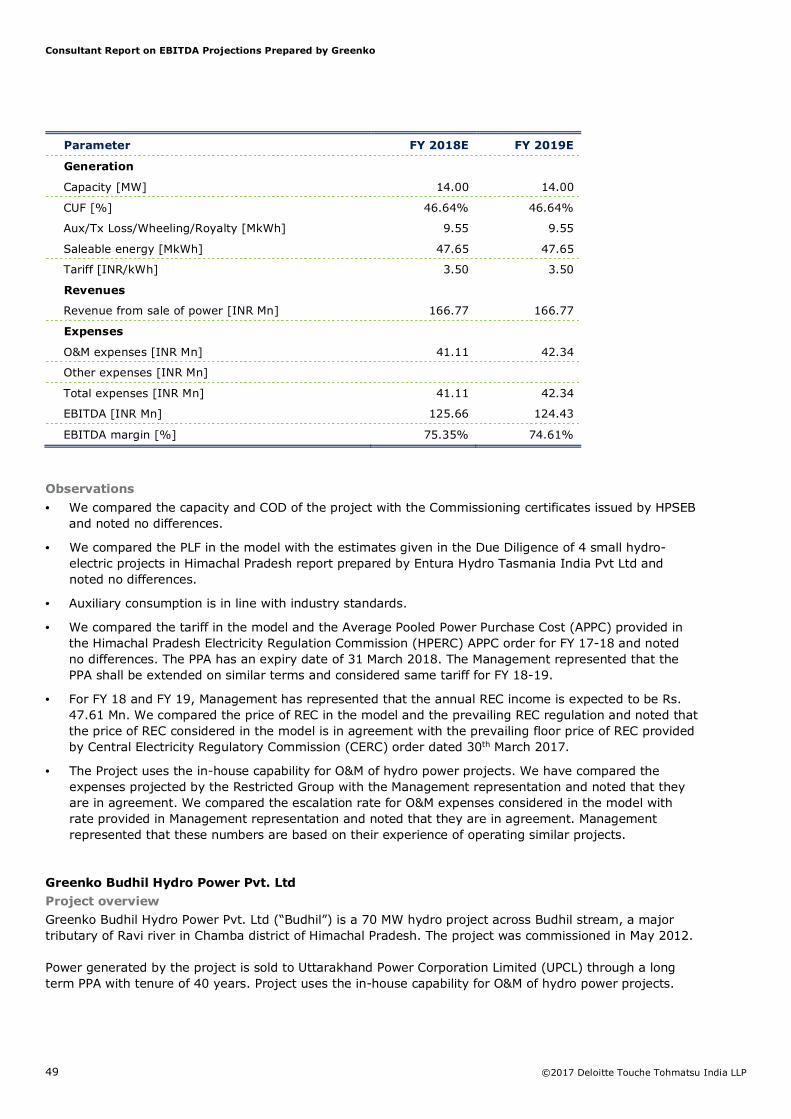
14 Hydro Sumez 125.66 124.43 1.94 1.92
15 Hydro Budhil 795.33 770.46 12.27 11.88
Consultant Report on EBITDA Projections Prepared by Greenko
The following summarizes key project assumptions underlying the financial model forecasts, projected financials based on the assumptions and our observations related to these assumptions.
Operational Solar Power Projects
Sunborne Energy Andhra Pvt. Ltd.
Project overview
Sunborne Energy Andhra Pvt. Ltd. (“Dominicus“) is a solar power project located in the Mahabubnagar district of Telangana. The project has capacity of 35 MW. The project was commissioned in February 2016.
Energy generated from Dominicus is sold to Southern Power distribution of Telangana Limited (TSSPDCL) under long term PPA with tenure of 20 years. The Project uses the in-house capability for O&M of solar power projects.
Parameter Value
Installed Capacity 35 MW
Procurer Southern Power distribution of Telangana Limited (TSSPDCL)
Tariff Fixed tariff of Rs. 6.45 per kWh for tenure of PPA
Expiry 20 years from COD
Project level projections
Key outputs from the EBITDA Projections model are as follows:
Parameter FY 2018E FY 2019E
Generation
Capacity [MW] 35.00 35.00
Net CUF [%] 23.36% 23.25%
Aux/Tx Loss/Wheeling/Royalty [MkWh] 0.36 0.36
Saleable energy [MkWh] 71.28 70.92
Tariff [INR/kWh] 6.45 6.45
Revenues
Revenue from sale of power [INR Mn] 459.73 457.41
Expenses
O&M expenses [INR Mn] 29.99 31.49
Other expenses [INR Mn]
Total expenses [INR Mn] 29.99 31.49
EBITDA [INR Mn] 429.74 425.92
EBITDA margin [%] 93.48% 93.12%
Consultant Report on EBITDA Projections Prepared by Greenko
• We compared the capacity and COD of the project with the Commissioning certificate issued by TSSPDCL and noted no differences.
• We compared the PLF and degradation factor in the model with the P75 estimates and degradation factor given in the Lenders Engineer Report prepared by TÜV Rheinland (India) Pvt Ltd and noted no differences.
• Auxiliary consumption is in line with industry standards.
• We compared the tariff in the model and the PPA with TSSPDCL and noted that they are in agreement.
• The Project uses the in-house capability for O&M of solar power projects. We have compared the expenses projected by the Restricted Group with the Management representation and noted that they are in agreement. We compared the escalation rate for O&M expenses considered in the model with rate provided in Management representation and noted that they are in agreement. Management represented that these numbers are based on their experience of operating similar projects.
SEI Phoebus (P) Ltd.
Project overview
SEI Phoebus (P) Ltd. (“Phoebus”) is a solar power project located in the Virudunagar district of Tamil Nadu. The project has capacity of 50 MW and has been operational since February, 2016.
Energy generated from Phoebus is sold to the Tamil Nadu Generation and Distribution Corporation Limited (TANDEDCO) under long term PPA with tenure of 25 years. The project is awarded through Feed in Tariff mechanism. The Project uses the in-house capability for O&M of solar power projects.
Parameter Value
Installed Capacity 50 MW
Procurer Tamil Nadu Generation and Distribution Corporation Limited (TANDEDCO)
Tariff Fixed tariff of Rs. 7.01 per kWh for tenure of PPA
Expiry 25 years from COD
Project level projections
Key outputs from the EBITDA projections model are as follows:
Parameter FY 2018E FY 2019E
Generation
Capacity [MW] 50.00 50.00
Net CUF [%] 24.45% 24.33%
Aux/Tx Loss/Wheeling/Royalty [MkWh] 0.54 0.53
Saleable energy [MkWh] 106.57 106.03
Tariff [INR/kWh] 7.01 7.01
Revenues
Revenue from sale of power [INR Mn] 747.05 743.27
Expenses
O&M expenses [INR Mn] 40.18 42.18
Other expenses [INR Mn]
Total expenses [INR Mn] 40.18 42.18
EBITDA [INR Mn] 706.87 701.09
EBITDA margin [%] 94.62% 94.32%
Consultant Report on EBITDA Projections Prepared by Greenko
• We compared the capacity and COD of the project with the Commissioning certificate issued by TANGEDCO and noted no differences.
• We compared the PLF and degradation factor in the model with the P75 estimates and degradation factor given in the Due Diligence Report prepared by TÜV Rheinland (India) Pvt Ltd and noted no differences.
• Auxiliary consumption is in line with industry standards.
• We compared the tariff in the model and the PPA with TANGEDCO and noted that they are in agreement.
• The Project uses the in-house capability for O&M of solar power projects. We have compared the expenses projected by the Restricted Group with the Management representation and noted that they are in agreement. We compared the escalation rate for O&M expenses considered in the model with rate provided in Management representation and noted that they are in agreement. Management represented that these numbers are based on their experience of operating similar projects.
SEI Adityasakthi (P) Ltd.
Project overview
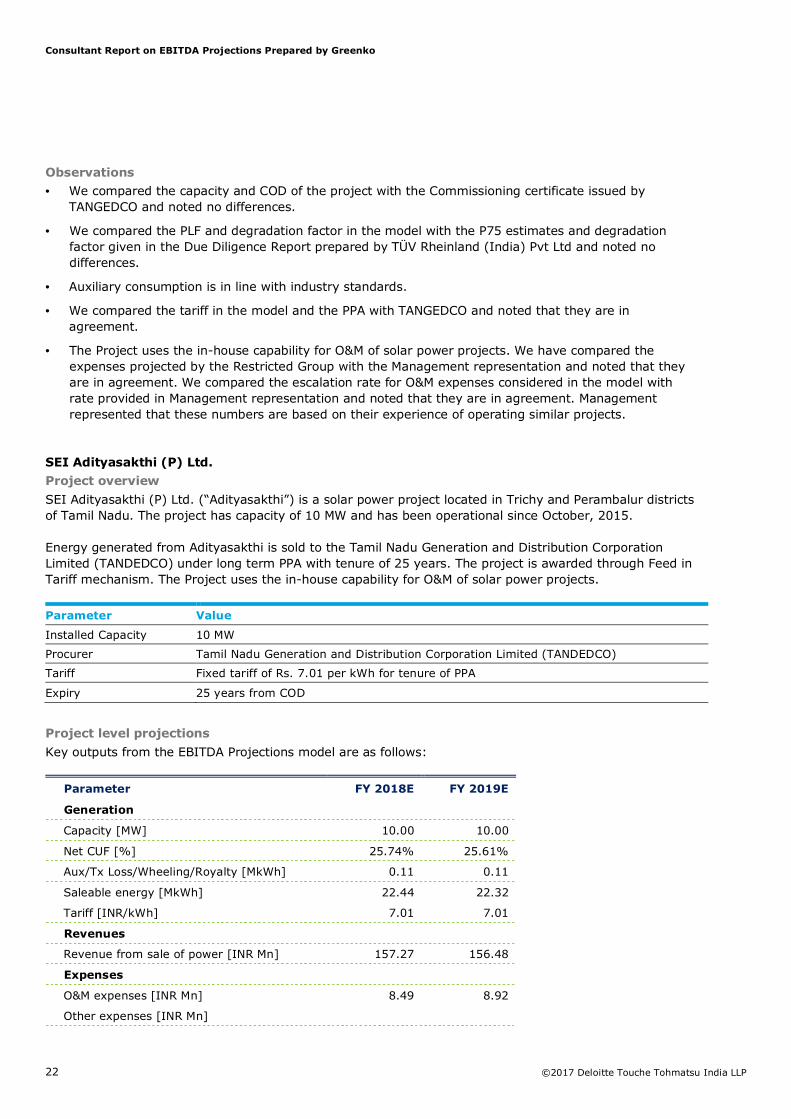
SEI Adityasakthi (P) Ltd. (“Adityasakthi”) is a solar power project located in Trichy and Perambalur districts of Tamil Nadu. The project has capacity of 10 MW and has been operational since October, 2015.
Energy generated from Adityasakthi is sold to the Tamil Nadu Generation and Distribution Corporation Limited (TANDEDCO) under long term PPA with tenure of 25 years. The project is awarded through Feed in Tariff mechanism. The Project uses the in-house capability for O&M of solar power projects.
Parameter Value
Installed Capacity 10 MW
Procurer Tamil Nadu Generation and Distribution Corporation Limited (TANDEDCO)
Tariff Fixed tariff of Rs. 7.01 per kWh for tenure of PPA
Expiry 25 years from COD
Project level projections
Key outputs from the EBITDA Projections model are as follows:
Parameter FY 2018E FY 2019E
Generation
Capacity [MW] 10.00 10.00
Net CUF [%] 25.74% 25.61%
Aux/Tx Loss/Wheeling/Royalty [MkWh] 0.11 0.11
Saleable energy [MkWh] 22.44 22.32
Tariff [INR/kWh] 7.01 7.01
Revenues
Revenue from sale of power [INR Mn] 157.27 156.48
Expenses
O&M expenses [INR Mn] 8.49 8.92
Other expenses [INR Mn]
Consultant Report on EBITDA Projections Prepared by Greenko
• We compared the capacity and COD of the project with the Commissioning certificate issued by TANGEDCO and noted no differences.
• We compared the PLF and degradation factor in the model with the P75 estimates and degradation factor given in the Due Diligence Report prepared by TÜV Rheinland (India) Pvt Ltd and noted no differences.
• Auxiliary consumption is in line with industry standards.
• We compared the tariff in the model and the PPA with TANGEDCO and noted that they are in agreement.
• The Project uses the in-house capability for O&M of solar power projects. We have compared the expenses projected by the Restricted Group with the Management representation and noted that they are in agreement. We compared the escalation rate for O&M expenses considered in the model with rate provided in Management representation and noted that they are in agreement. Management represented that these numbers are based on their experience of operating similar projects.
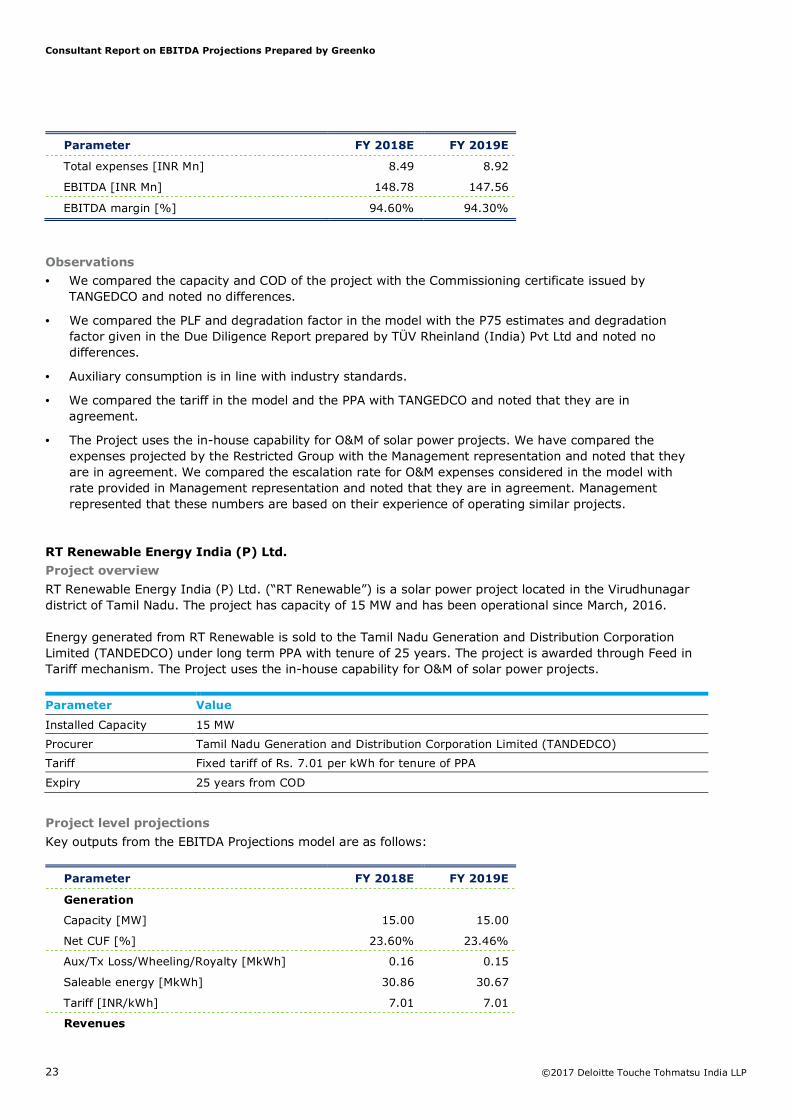
RT Renewable Energy India (P) Ltd.
Project overview
RT Renewable Energy India (P) Ltd. (“RT Renewable”) is a solar power project located in the Virudhunagar district of Tamil Nadu. The project has capacity of 15 MW and has been operational since March, 2016.
Energy generated from RT Renewable is sold to the Tamil Nadu Generation and Distribution Corporation Limited (TANDEDCO) under long term PPA with tenure of 25 years. The project is awarded through Feed in Tariff mechanism. The Project uses the in-house capability for O&M of solar power projects.
Parameter Value
Installed Capacity 15 MW
Procurer Tamil Nadu Generation and Distribution Corporation Limited (TANDEDCO)
Tariff Fixed tariff of Rs. 7.01 per kWh for tenure of PPA
Expiry 25 years from COD
Project level projections
Key outputs from the EBITDA Projections model are as follows:
Parameter FY 2018E FY 2019E
Generation
Capacity [MW] 15.00 15.00
Net CUF [%] 23.60% 23.46%
Aux/Tx Loss/Wheeling/Royalty [MkWh] 0.16 0.15
Saleable energy [MkWh] 30.86 30.67
Tariff [INR/kWh] 7.01 7.01
Revenues
Consultant Report on EBITDA Projections Prepared by Greenko
• We compared the capacity and COD of the project with the Commissioning certificate issued by TANGEDCO and noted no differences.
• We compared the PLF and degradation factor in the model with the P75 estimates and degradation factor given in the technical due diligence report prepared by SgurrEnergy India Pvt. Ltd. and noted no differences.
• Auxiliary consumption is in line with industry standards.
• We compared the tariff in the model and the PPA with TANGEDCO and noted that they are in agreement.
• The Project uses the in-house capability for O&M of solar power projects. We have compared the expenses projected by the Restricted Group with the Management representation and noted that they are in agreement. We compared the escalation rate for O&M expenses considered in the model with rate provided in Management representation and noted that they are in agreement. Management represented that these numbers are based on their experience of operating similar projects.
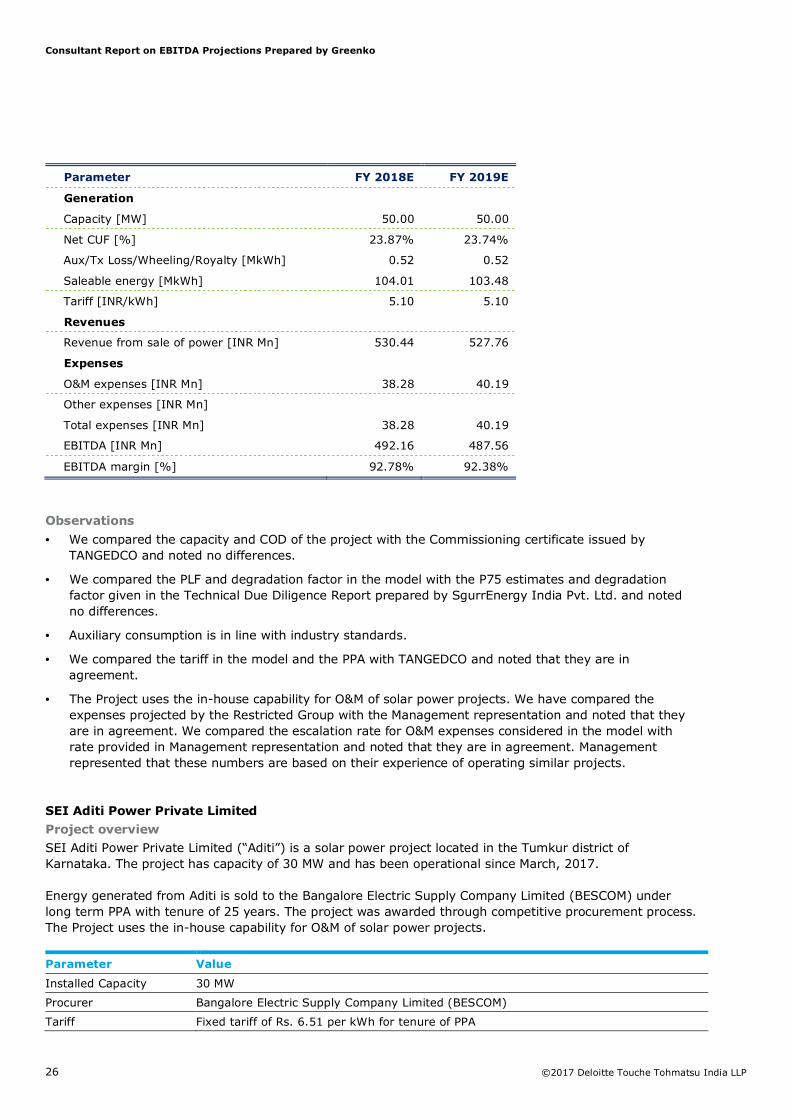
SEI Adhavan Power Private Limited
Project overview
SEI Adhavan Power Private Limited (“Adhavan”) is a solar power project located in the Virudhunagar district of Tamil Nadu. The project has capacity of 50 MW and has been operational since March, 2016.
Energy generated from Adhavan is sold to the Tamil Nadu Generation and Distribution Corporation Limited (TANGEDCO) under long term PPA with tenure of 25 years. The project is awarded through Feed in Tariff mechanism. The Project uses the in-house capability for O&M of solar power projects.
Parameter Value
Installed Capacity 50 MW
Procurer Tamil Nadu Generation and Distribution Corporation Limited (TANGEDCO)
Tariff Fixed tariff of Rs. 7.01 per kWh for tenure of PPA
Expiry 25 years from COD
Project level projections
Key outputs from the EBITDA Projections model are as follows:
Parameter FY 2018E FY 2019E
Generation
Capacity [MW] 50.00 50.00
Net CUF [%] 23.16% 23.02%
Consultant Report on EBITDA Projections Prepared by Greenko
• We compared the capacity and COD of the project with the Commissioning certificate issued by TANGEDCO and noted no differences.
• We compared the PLF and degradation factor in the model with the P75 estimates and degradation factor given in the Due Diligence Report prepared by 3TIER R&D India Private Limited and noted no differences.
• Auxiliary consumption is in line with industry standards.
• We compared the tariff in the model and the PPA with TANGEDCO and noted that they are in agreement.
• The Project uses the in-house capability for O&M of solar power projects. We have compared the expenses projected by the Restricted Group with the Management representation and noted that they are in agreement. We compared the escalation rate for O&M expenses considered in the model with rate provided in Management representation and noted that they are in agreement. Management represented that these numbers are based on their experience of operating similar projects.
SEI Kathiravan Power Pvt Ltd.
Project overview
SEI Kathiravan Power Pvt Ltd. (“Kathiravan”) is a solar power project located in the Virudhunagar district of Tamil Nadu. The project has capacity of 50 MW and has been operational since March, 2017.
Energy generated from Kathiravan is sold to the Tamil Nadu Generation and Distribution Corporation Limited (TANGEDCO) under long term PPA with tenure of 25 years. The project is awarded through Feed in Tariff mechanism. The Project uses the in-house capability for O&M of solar power projects.
Parameter Value
Installed Capacity 50 MW
Procurer Tamil Nadu Generation and Distribution Corporation Limited (TANGEDCO)
Tariff Fixed tariff of Rs. 5.10 per kWh for tenure of PPA
Expiry 25 years from COD
Project level projections
Key outputs from the EBITDA Projections model are as follows:
Consultant Report on EBITDA Projections Prepared by Greenko
• We compared the capacity and COD of the project with the Commissioning certificate issued by TANGEDCO and noted no differences.
• We compared the PLF and degradation factor in the model with the P75 estimates and degradation factor given in the Technical Due Diligence Report prepared by SgurrEnergy India Pvt. Ltd. and noted no differences.
• Auxiliary consumption is in line with industry standards.
• We compared the tariff in the model and the PPA with TANGEDCO and noted that they are in agreement.
• The Project uses the in-house capability for O&M of solar power projects. We have compared the expenses projected by the Restricted Group with the Management representation and noted that they are in agreement. We compared the escalation rate for O&M expenses considered in the model with rate provided in Management representation and noted that they are in agreement. Management represented that these numbers are based on their experience of operating similar projects.
SEI Aditi Power Private Limited
Project overview
SEI Aditi Power Private Limited (“Aditi”) is a solar power project located in the Tumkur district of Karnataka. The project has capacity of 30 MW and has been operational since March, 2017.
Energy generated from Aditi is sold to the Bangalore Electric Supply Company Limited (BESCOM) under long term PPA with tenure of 25 years. The project was awarded through competitive procurement process. The Project uses the in-house capability for O&M of solar power projects.
Parameter Value
Installed Capacity 30 MW
Procurer Bangalore Electric Supply Company Limited (BESCOM)
Tariff Fixed tariff of Rs. 6.51 per kWh for tenure of PPA
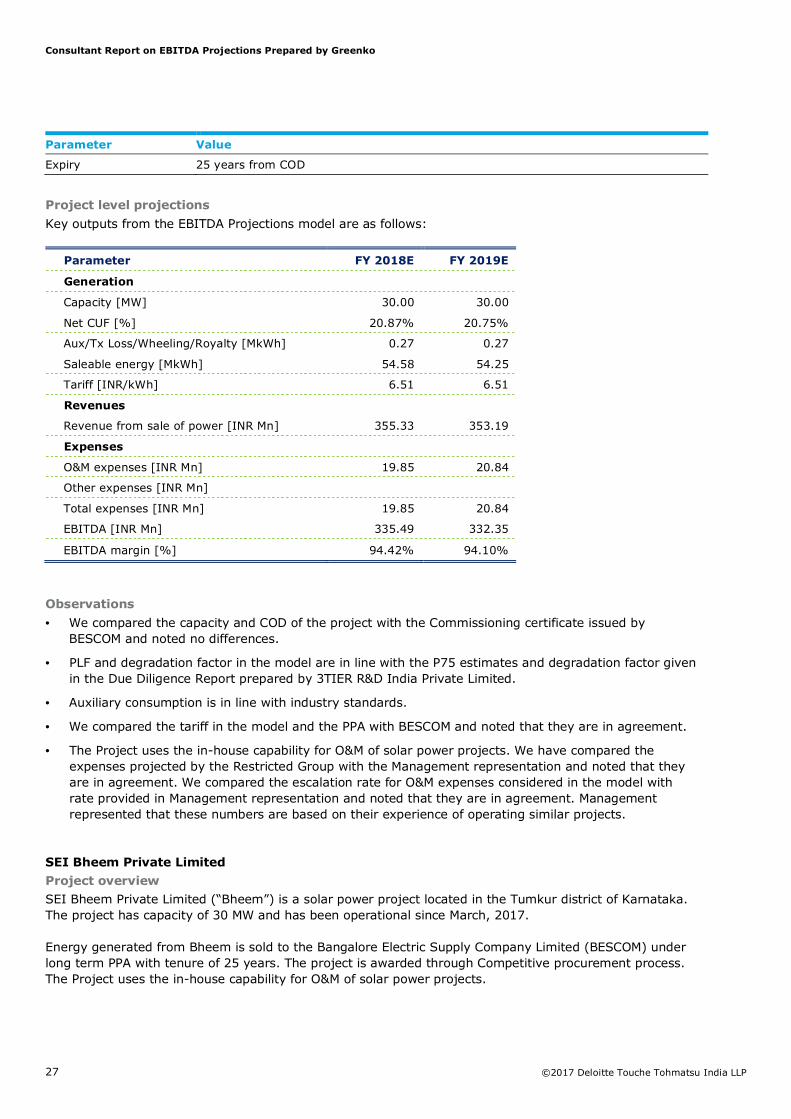
Consultant Report on EBITDA Projections Prepared by Greenko
Key outputs from the EBITDA Projections model are as follows:
Parameter FY 2018E FY 2019E
Generation
Capacity [MW] 30.00 30.00
Net CUF [%] 20.87% 20.75%
Aux/Tx Loss/Wheeling/Royalty [MkWh] 0.27 0.27
Saleable energy [MkWh] 54.58 54.25
Tariff [INR/kWh] 6.51 6.51
Revenues
Revenue from sale of power [INR Mn] 355.33 353.19
Expenses
O&M expenses [INR Mn] 19.85 20.84
Other expenses [INR Mn]
Total expenses [INR Mn] 19.85 20.84
EBITDA [INR Mn] 335.49 332.35
EBITDA margin [%] 94.42% 94.10%
Observations
• We compared the capacity and COD of the project with the Commissioning certificate issued by BESCOM and noted no differences.
• PLF and degradation factor in the model are in line with the P75 estimates and degradation factor given in the Due Diligence Report prepared by 3TIER R&D India Private Limited.
• Auxiliary consumption is in line with industry standards.
• We compared the tariff in the model and the PPA with BESCOM and noted that they are in agreement.
• The Project uses the in-house capability for O&M of solar power projects. We have compared the expenses projected by the Restricted Group with the Management representation and noted that they are in agreement. We compared the escalation rate for O&M expenses considered in the model with rate provided in Management representation and noted that they are in agreement. Management represented that these numbers are based on their experience of operating similar projects.
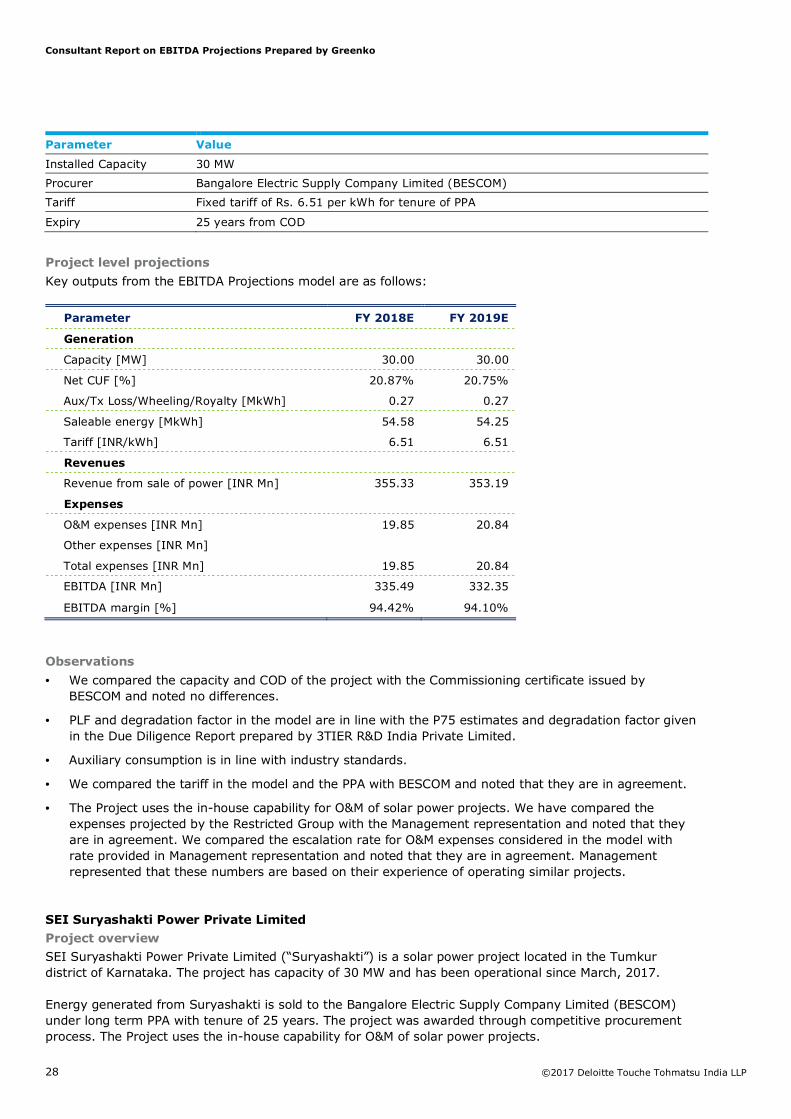
SEI Bheem Private Limited
Project overview
SEI Bheem Private Limited (“Bheem”) is a solar power project located in the Tumkur district of Karnataka. The project has capacity of 30 MW and has been operational since March, 2017.
Energy generated from Bheem is sold to the Bangalore Electric Supply Company Limited (BESCOM) under long term PPA with tenure of 25 years. The project is awarded through Competitive procurement process. The Project uses the in-house capability for O&M of solar power projects.
Consultant Report on EBITDA Projections Prepared by Greenko
Procurer Bangalore Electric Supply Company Limited (BESCOM)
Tariff Fixed tariff of Rs. 6.51 per kWh for tenure of PPA
Expiry 25 years from COD
Project level projections
Key outputs from the EBITDA Projections model are as follows:
Parameter FY 2018E FY 2019E
Generation
Capacity [MW] 30.00 30.00
Net CUF [%] 20.87% 20.75%
Aux/Tx Loss/Wheeling/Royalty [MkWh] 0.27 0.27
Saleable energy [MkWh] 54.58 54.25
Tariff [INR/kWh] 6.51 6.51
Revenues
Revenue from sale of power [INR Mn] 355.33 353.19
Expenses
O&M expenses [INR Mn] 19.85 20.84
Other expenses [INR Mn]
Total expenses [INR Mn] 19.85 20.84
EBITDA [INR Mn] 335.49 332.35
EBITDA margin [%] 94.42% 94.10%
Observations
• We compared the capacity and COD of the project with the Commissioning certificate issued by BESCOM and noted no differences.
• PLF and degradation factor in the model are in line with the P75 estimates and degradation factor given in the Due Diligence Report prepared by 3TIER R&D India Private Limited.
• Auxiliary consumption is in line with industry standards.
• We compared the tariff in the model and the PPA with BESCOM and noted that they are in agreement.
• The Project uses the in-house capability for O&M of solar power projects. We have compared the expenses projected by the Restricted Group with the Management representation and noted that they are in agreement. We compared the escalation rate for O&M expenses considered in the model with rate provided in Management representation and noted that they are in agreement. Management represented that these numbers are based on their experience of operating similar projects.
SEI Suryashakti Power Private Limited
Project overview
SEI Suryashakti Power Private Limited (“Suryashakti”) is a solar power project located in the Tumkur district of Karnataka. The project has capacity of 30 MW and has been operational since March, 2017.
Energy generated from Suryashakti is sold to the Bangalore Electric Supply Company Limited (BESCOM) under long term PPA with tenure of 25 years. The project was awarded through competitive procurement process. The Project uses the in-house capability for O&M of solar power projects.
Consultant Report on EBITDA Projections Prepared by Greenko
Procurer Bangalore Electric Supply Company Limited (BESCOM)
Tariff Fixed tariff of Rs. 6.51 per kWh for tenure of PPA
Expiry 25 years from COD
Project level projections
Key outputs from the EBITDA Projections model are as follows:
Parameter FY 2018E FY 2019E
Generation
Capacity [MW] 30.00 30.00
Net CUF [%] 20.35% 20.25%
Aux/Tx Loss/Wheeling/Royalty [MkWh] 0.27 0.27
Saleable energy [MkWh] 53.21 52.94
Tariff [INR/kWh] 6.51 6.51
Revenues
Revenue from sale of power [INR Mn] 346.41 344.66
Expenses
O&M expenses [INR Mn] 19.85 20.84
Other expenses [INR Mn]
Total expenses [INR Mn] 19.85 20.84
EBITDA [INR Mn] 326.57 323.82
EBITDA margin [%] 94.27% 93.95%
Observations
• We compared the capacity and COD of the project with the Commissioning certificate issued by BESCOM and noted no differences.
• We compared the PLF and degradation factor in the model with the P75 estimates and degradation factor given in the Techno Economic Viability Study prepared by Tractebel Engineering Private Limited and noted no differences.
• Auxiliary consumption is in line with industry standards.
• We compared the tariff in the model and the PPA with BESCOM and noted that they are in agreement.
• The Project uses the in-house capability for O&M of solar power projects. We have compared the expenses projected by the Restricted Group with the Management representation and noted that they are in agreement. We compared the escalation rate for O&M expenses considered in the model with rate provided in Management representation and noted that they are in agreement. Management represented that these numbers are based on their experience of operating similar projects.
SEI Venus Private Limited
Project overview
SEI Venus Private Limited (“Venus”) is a solar power project located in the Chitradurga district of Karnataka. The project has capacity of 30 MW and has been operational since March, 2017.
Consultant Report on EBITDA Projections Prepared by Greenko
Energy generated from Venus is sold to the Hubli Electric Supply Company Limited (HESCOM) under long term PPA with tenure of 25 years. The project was awarded through competitive procurement process. The Project uses the in-house capability for O&M of solar power projects.
Parameter Value
Installed Capacity 30 MW
Procurer Hubli Electric Supply Company Limited (HESCOM)
Tariff Fixed tariff of Rs. 6.51 per kWh for tenure of PPA
Expiry 25 years from COD
Project level projections
Key outputs from the EBITDA Projections model are as follows:
Parameter FY 2018E FY 2019E
Generation
Capacity [MW] 30.00 30.00
Net CUF [%] 20.57% 20.42%
Aux/Tx Loss/Wheeling/Royalty [MkWh] 0.27 0.27
Saleable energy [MkWh] 53.79 53.38
Tariff [INR/kWh] 6.51 6.51
Revenues
Revenue from sale of power [INR Mn] 350.18 347.53
Expenses
O&M expenses [INR Mn] 20.48 21.50
Other expenses [INR Mn]
Total expenses [INR Mn] 20.48 21.50
EBITDA [INR Mn] 329.70 326.03
EBITDA margin [%] 94.15% 93.81%
Observations
• We compared the capacity and COD of the project with the Commissioning certificate issued by Karnataka Power Transmission Corporation Limited (KPTCL) and noted no differences.
• We compared the PLF and degradation factor in the model with the P75 estimates and degradation factor given in the Energy Yield Assessment Report prepared by SgurrEnergy India Pvt. Ltd and noted no differences.
• Auxiliary consumption is in line with industry standards.
• We compared the tariff in the model and the PPA with HESCOM and noted that they are in agreement.
• The Project uses the in-house capability for O&M of solar power projects. We have compared the expenses projected by the Restricted Group with the Management representation and noted that they are in agreement. We compared the escalation rate for O&M expenses considered in the model with rate provided in Management representation and noted that they are in agreement. Management represented that these numbers are based on their experience of operating similar projects.
Consultant Report on EBITDA Projections Prepared by Greenko
SEI Diamond Private Limited (“Diamond”) is a solar power project located in the Chitradurga district of Karnataka. The project has capacity of 30 MW and has been operational since March, 2017.
Energy generated from Diamond is sold to the Bangalore Electric Supply Company Limited (BESCOM) under long term PPA with tenure of 25 years. The project is awarded through Competitive procurement process. The Project uses the in-house capability for O&M of solar power projects.
Parameter Value
Installed Capacity 30 MW
Procurer Bangalore Electric Supply Company Limited (BESCOM)
Tariff Fixed tariff of Rs. 6.51 per kWh for tenure of PPA
Expiry 25 years from COD
Project level projections
Key outputs from the EBITDA Projections model are as follows:
Parameter FY 2018E FY 2019E
Generation
Capacity [MW] 30.00 30.00
Net CUF [%] 20.51% 20.36%
Aux/Tx Loss/Wheeling/Royalty [MkWh] 0.27 0.27
Saleable energy [MkWh] 53.63 53.23
Tariff [INR/kWh] 6.51 6.51
Revenues
Revenue from sale of power [INR Mn] 349.16 346.52
Expenses
O&M expenses [INR Mn] 20.48 21.50
Other expenses [INR Mn]
Total expenses [INR Mn] 20.48 21.50
EBITDA [INR Mn] 328.69 325.03
EBITDA margin [%] 94.14% 93.80%
Observations
• We compared the capacity and COD of the project with the Commissioning certificate issued by Karnataka Power Transmission Corporation Limited (KPTCL) and noted no differences.
• We compared the PLF and degradation factor in the model with the P75 estimates and degradation factor given in the Energy Yield Assessment Report prepared by SgurrEnergy India Pvt. Ltd and noted no differences.
• Auxiliary consumption is in line with industry standards.
• We compared the tariff in the model and the PPA with BESCOM and noted that they are in agreement.
• The Project uses the in-house capability for O&M of solar power projects. We have compared the expenses projected by the Restricted Group with the Management representation and noted that they are in agreement. We compared the escalation rate for O&M expenses considered in the model with rate provided in Management representation and noted that they are in agreement. Management represented that these numbers are based on their experience of operating similar projects.
Consultant Report on EBITDA Projections Prepared by Greenko
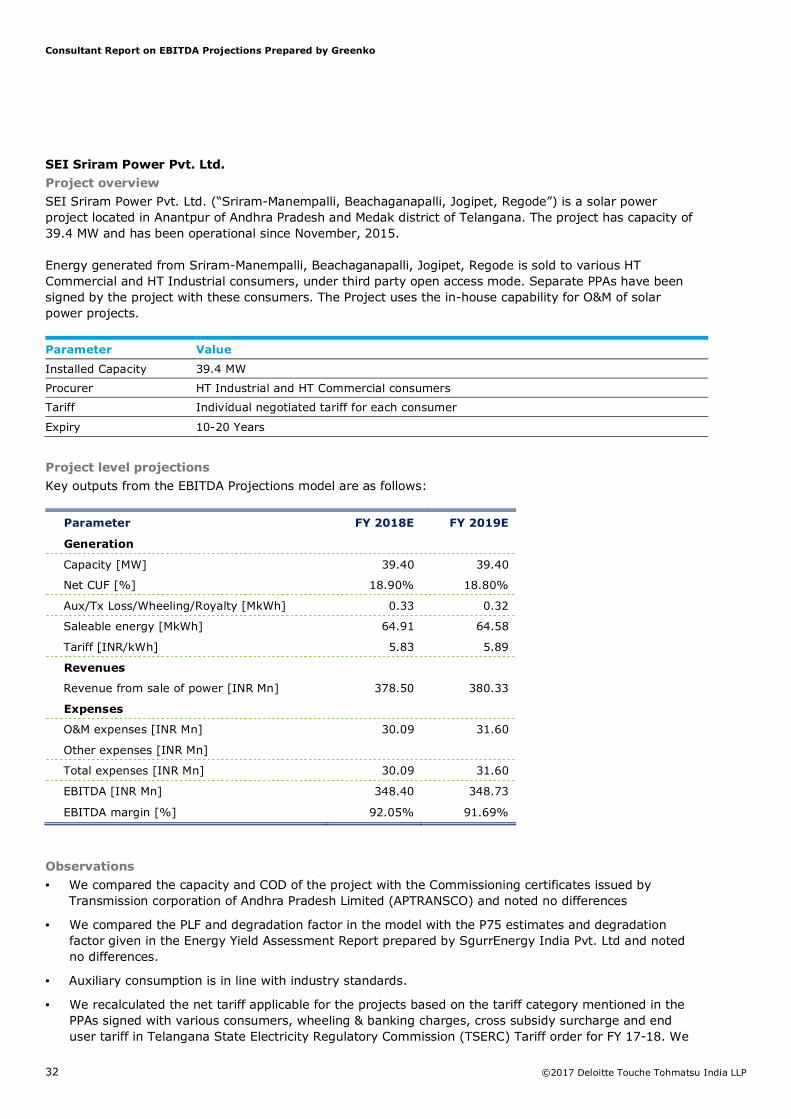
SEI Sriram Power Pvt. Ltd. (“Sriram-Manempalli, Beachaganapalli, Jogipet, Regode”) is a solar power project located in Anantpur of Andhra Pradesh and Medak district of Telangana. The project has capacity of 39.4 MW and has been operational since November, 2015.
Energy generated from Sriram-Manempalli, Beachaganapalli, Jogipet, Regode is sold to various HT Commercial and HT Industrial consumers, under third party open access mode. Separate PPAs have been signed by the project with these consumers. The Project uses the in-house capability for O&M of solar power projects.
Parameter Value
Installed Capacity 39.4 MW
Procurer HT Industrial and HT Commercial consumers
Tariff Individual negotiated tariff for each consumer
Expiry 10-20 Years
Project level projections
Key outputs from the EBITDA Projections model are as follows:
Parameter FY 2018E FY 2019E
Generation
Capacity [MW] 39.40 39.40
Net CUF [%] 18.90% 18.80%
Aux/Tx Loss/Wheeling/Royalty [MkWh] 0.33 0.32
Saleable energy [MkWh] 64.91 64.58
Tariff [INR/kWh] 5.83 5.89
Revenues
Revenue from sale of power [INR Mn] 378.50 380.33
Expenses
O&M expenses [INR Mn] 30.09 31.60
Other expenses [INR Mn]
Total expenses [INR Mn] 30.09 31.60
EBITDA [INR Mn] 348.40 348.73
EBITDA margin [%] 92.05% 91.69%
Observations
• We compared the capacity and COD of the project with the Commissioning certificates issued by Transmission corporation of Andhra Pradesh Limited (APTRANSCO) and noted no differences
• We compared the PLF and degradation factor in the model with the P75 estimates and degradation factor given in the Energy Yield Assessment Report prepared by SgurrEnergy India Pvt. Ltd and noted no differences.
• Auxiliary consumption is in line with industry standards.
• We recalculated the net tariff applicable for the projects based on the tariff category mentioned in the PPAs signed with various consumers, wheeling & banking charges, cross subsidy surcharge and end user tariff in Telangana State Electricity Regulatory Commission (TSERC) Tariff order for FY 17-18. We
Consultant Report on EBITDA Projections Prepared by Greenko
compared the recalculated tariffs with the tariff assumed in model and found no differences. As per Telangana Solar Power Policy 2015, for any solar power plant located within the state and selling power to third parties within the state, 100% exemption shall be provided on the cross subsidy surcharge as determined by TSERC for five years from the date of commissioning of the solar power plant. Hence no cross subsidy surcharge is considered.
• The Project uses the in-house capability for O&M of solar power projects. We have compared the expenses projected by the Restricted Group with the Management representation and noted that they are in agreement. We compared the escalation rate for O&M expenses considered in the model with rate provided in Management representation and noted that they are in agreement. Management represented that these numbers are based on their experience of operating similar projects.
Operational Hydro Power Projects
AMR Power Private Limited
Project overview
AMR Power Private Limited (“AMR”) is a 24.75 MW hydro project across river Netravathi in Dakshina Karnataka district of Karnataka. The project was commissioned in June 2010.
Energy generated from AMR is proposed to be sold to various HT Commercial and HT Industrial consumers, under third party open access mode. Long term PPAs have been signed by AMR with some consumers and rest of capacity is sold on short term basis. The Project uses the in-house capability for O&M of hydro power projects.
Parameter Value
Installed Capacity 24.75 MW
Procurer HT Industrial and HT Commercial consumers
Tariff Individual negotiated tariff for each consumer
Expiry Large long term PPAs and short term sale
Project level projections
Key outputs from the EBITDA Projections model are as follows:
Parameter FY 2018E FY 2019E
Generation
Capacity [MW] 24.75 24.75
CUF [%] 38.00% 38.00%
Aux/Tx Loss/Wheeling/Royalty [MkWh] 7.30 7.30
Saleable energy [MkWh] 75.09 75.09
Tariff [INR/kWh] 5.04 5.09
Revenues
Revenue from sale of power [INR Mn] 378.44 382.23
Expenses
O&M expenses [INR Mn] 68.36 70.41
Other expenses [INR Mn]
Total expenses [INR Mn] 68.36 70.41
EBITDA [INR Mn] 310.09 311.82
EBITDA margin [%] 81.94% 81.58%
Consultant Report on EBITDA Projections Prepared by Greenko
• We compared the capacity and COD of the project with the Commissioning certificates issued by Karnataka Power Transmission Corporation Limited and noted no differences.
• We compared the PLF in the model with the estimates given in the Due Diligence Report prepared by Tractebel Engineering Private Limited. The PLF considered in the model is greater than the P75 estimate provided in the Tractebel report and we enquired the management about the difference. Management indicated that both AMR and Rithwik Hydro power projects are on the same river and share the same hydrological resources and Management indicated that the combined potential of AMR and Rithwik is same as the combined P75 estimate provided in Tractebel report for both the plants. We compared the combined PLF for AMR and Rithwik with the P75 estimates for these two projects and noted no difference.
• Auxiliary consumption is in line with industry standards.
• Management represented that the project sells energy to consumers through a mix of large long term PPAs and short term sale basis. We compared the tariff of these large PPAs which represented 69% of total energy sold. The tariff for these PPAs are in line with tariff considered by Management for the entire project. Management represented that they would be able to realise Rs 5.04 for FY 2017-18 and Rs 5.09 for FY 2018-19. We compared the tariffs considered in the model for the entire project and tariff represented by the management and noted no differences.
• The Project uses the in-house capability for O&M of hydro power projects. We have compared the expenses projected by the Restricted Group with the Management representation and noted that they are in agreement. We compared the escalation rate for O&M expenses considered in the model with rate provided in Management representation and noted that they are in agreement. Management represented that these numbers are based on their experience of operating similar projects.
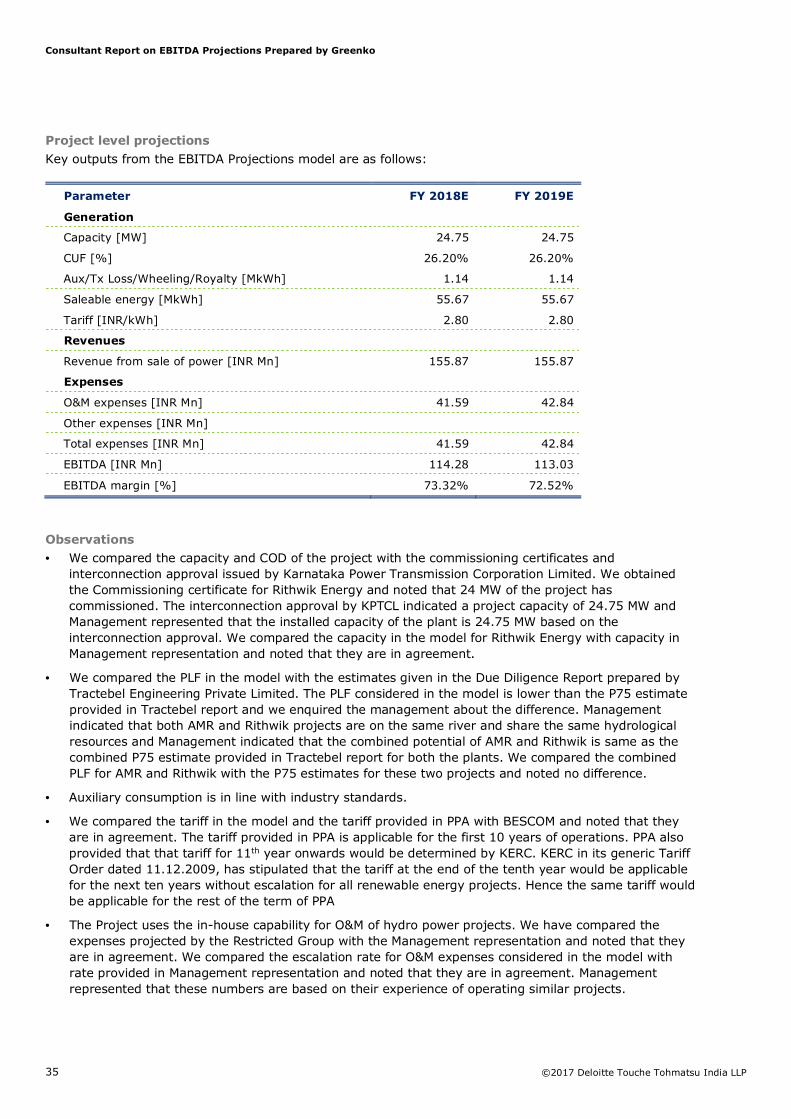
Rithwik Energy Private Limited
Project overview
Rithwik Energy Private Limited (“Rithwik”) is a 24.75 MW hydro project across river Netravathi in Dakshina Karnataka district of Karnataka. The project was commissioned in September 2009.
Power generated by the project is sold to Bangalore Electricity Supply Company Limited through a long term PPA with tenure of 20 years. Project uses the in-house capability for O&M of hydro power projects.
Parameter Value
Installed Capacity 24.75 MW
Procurer Bangalore Electricity Supply Company Limited (BESCOM)
Tariff Rs 2.80 per kWh
Expiry 20 Years
Consultant Report on EBITDA Projections Prepared by Greenko
Key outputs from the EBITDA Projections model are as follows:
Parameter FY 2018E FY 2019E
Generation
Capacity [MW] 24.75 24.75
CUF [%] 26.20% 26.20%
Aux/Tx Loss/Wheeling/Royalty [MkWh] 1.14 1.14
Saleable energy [MkWh] 55.67 55.67
Tariff [INR/kWh] 2.80 2.80
Revenues
Revenue from sale of power [INR Mn] 155.87 155.87
Expenses
O&M expenses [INR Mn] 41.59 42.84
Other expenses [INR Mn]
Total expenses [INR Mn] 41.59 42.84
EBITDA [INR Mn] 114.28 113.03
EBITDA margin [%] 73.32% 72.52%
Observations
• We compared the capacity and COD of the project with the commissioning certificates and interconnection approval issued by Karnataka Power Transmission Corporation Limited. We obtained the Commissioning certificate for Rithwik Energy and noted that 24 MW of the project has commissioned. The interconnection approval by KPTCL indicated a project capacity of 24.75 MW and Management represented that the installed capacity of the plant is 24.75 MW based on the interconnection approval. We compared the capacity in the model for Rithwik Energy with capacity in Management representation and noted that they are in agreement.
• We compared the PLF in the model with the estimates given in the Due Diligence Report prepared by Tractebel Engineering Private Limited. The PLF considered in the model is lower than the P75 estimate provided in Tractebel report and we enquired the management about the difference. Management indicated that both AMR and Rithwik projects are on the same river and share the same hydrological resources and Management indicated that the combined potential of AMR and Rithwik is same as the combined P75 estimate provided in Tractebel report for both the plants. We compared the combined PLF for AMR and Rithwik with the P75 estimates for these two projects and noted no difference.
• Auxiliary consumption is in line with industry standards.
• We compared the tariff in the model and the tariff provided in PPA with BESCOM and noted that they are in agreement. The tariff provided in PPA is applicable for the first 10 years of operations. PPA also provided that that tariff for 11th year onwards would be determined by KERC. KERC in its generic Tariff Order dated 11.12.2009, has stipulated that the tariff at the end of the tenth year would be applicable for the next ten years without escalation for all renewable energy projects. Hence the same tariff would be applicable for the rest of the term of PPA
• The Project uses the in-house capability for O&M of hydro power projects. We have compared the expenses projected by the Restricted Group with the Management representation and noted that they are in agreement. We compared the escalation rate for O&M expenses considered in the model with rate provided in Management representation and noted that they are in agreement. Management represented that these numbers are based on their experience of operating similar projects.
Consultant Report on EBITDA Projections Prepared by Greenko
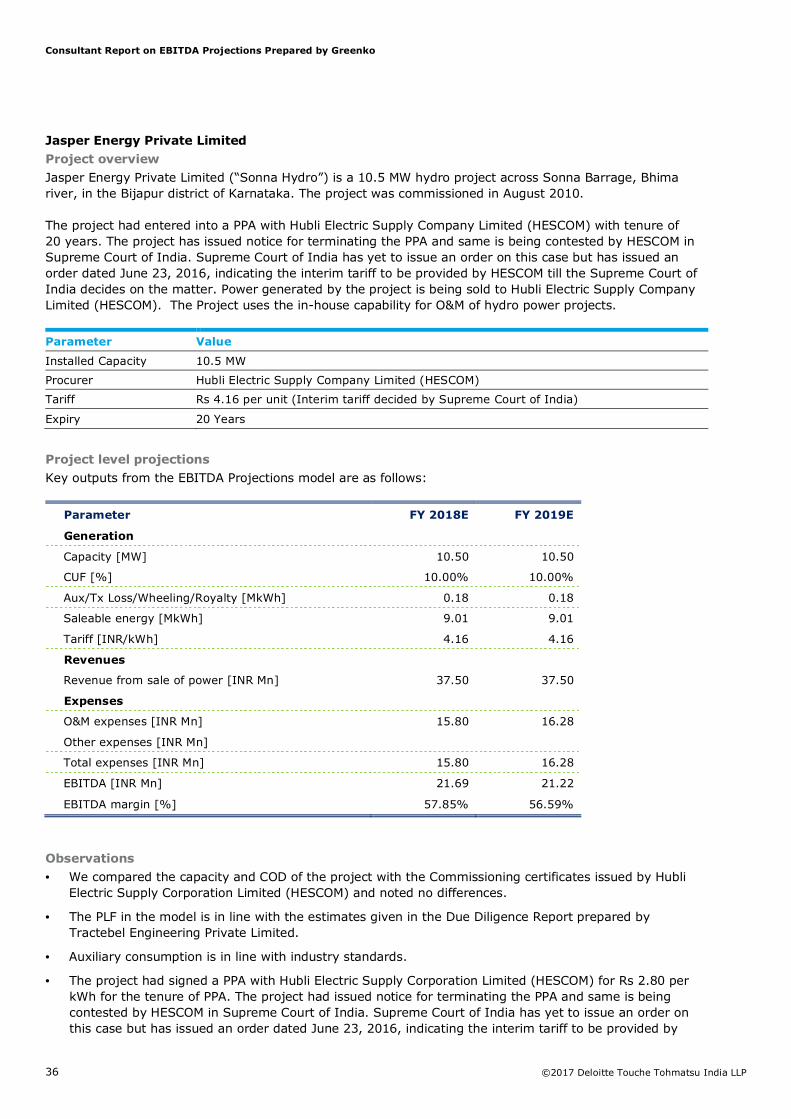
Jasper Energy Private Limited (“Sonna Hydro”) is a 10.5 MW hydro project across Sonna Barrage, Bhima river, in the Bijapur district of Karnataka. The project was commissioned in August 2010.
The project had entered into a PPA with Hubli Electric Supply Company Limited (HESCOM) with tenure of 20 years. The project has issued notice for terminating the PPA and same is being contested by HESCOM in Supreme Court of India. Supreme Court of India has yet to issue an order on this case but has issued an order dated June 23, 2016, indicating the interim tariff to be provided by HESCOM till the Supreme Court of India decides on the matter. Power generated by the project is being sold to Hubli Electric Supply Company Limited (HESCOM). The Project uses the in-house capability for O&M of hydro power projects.
Parameter Value
Installed Capacity 10.5 MW
Procurer Hubli Electric Supply Company Limited (HESCOM)
Tariff Rs 4.16 per unit (Interim tariff decided by Supreme Court of India)
Expiry 20 Years
Project level projections
Key outputs from the EBITDA Projections model are as follows:
Parameter FY 2018E FY 2019E
Generation
Capacity [MW] 10.50 10.50
CUF [%] 10.00% 10.00%
Aux/Tx Loss/Wheeling/Royalty [MkWh] 0.18 0.18
Saleable energy [MkWh] 9.01 9.01
Tariff [INR/kWh] 4.16 4.16
Revenues
Revenue from sale of power [INR Mn] 37.50 37.50
Expenses
O&M expenses [INR Mn] 15.80 16.28
Other expenses [INR Mn]
Total expenses [INR Mn] 15.80 16.28
EBITDA [INR Mn] 21.69 21.22
EBITDA margin [%] 57.85% 56.59%
Observations
• We compared the capacity and COD of the project with the Commissioning certificates issued by Hubli Electric Supply Corporation Limited (HESCOM) and noted no differences.
• The PLF in the model is in line with the estimates given in the Due Diligence Report prepared by Tractebel Engineering Private Limited.
• Auxiliary consumption is in line with industry standards.
• The project had signed a PPA with Hubli Electric Supply Corporation Limited (HESCOM) for Rs 2.80 per kWh for the tenure of PPA. The project had issued notice for terminating the PPA and same is being contested by HESCOM in Supreme Court of India. Supreme Court of India has yet to issue an order on this case but has issued an order dated June 23, 2016, indicating the interim tariff to be provided by
Consultant Report on EBITDA Projections Prepared by Greenko
HESCOM till the Supreme Court of India decides on the matter. We compared the tariff in the model and the tariff provided in order dated June 23, 2016 issued by Supreme Court of India and noted that they are in agreement.
• The Project uses the in-house capability for O&M of hydro power projects. We have compared the expenses projected by the Restricted Group with the Management representation and noted that they are in agreement. We compared the escalation rate for O&M expenses considered in the model with rate provided in Management representation and noted that they are in agreement. Management represented that these numbers are based on their experience of operating similar projects.
Sai Spurthi Power Private Limited
Project overview
Sai Spurthi Power Private Limited (“Sai Spurthi”) is a 10.25 MW hydro project across Arkavathi River in the Bangalore rural district of Karnataka. The entire project was commissioned in September 2005.
Power generated by the projects is sold to Karnataka Power Transmission Corporation Limited (KPTCL) through a PPA with tenure of 20 years. Project uses the in-house capability for O&M of hydro power projects.
Parameter Value
Installed Capacity 10.25 MW
Procurer Karnataka Power Transmission Corporation Limited (KPTCL)
Tariff Rs 3.422 per kWh
Expiry 20 Years
Project level projections
Key outputs from the EBITDA Projections model are as follows:
Parameter FY 2018E FY 2019E
Generation
Capacity [MW] 10.25 10.25
CUF [%] 38.65% 38.65%
Aux/Tx Loss/Wheeling/Royalty [MkWh] 0.69 0.69
Saleable energy [MkWh] 34.01 34.01
Tariff [INR/kWh] 3.42 3.42
Revenues
Revenue from sale of power [INR Mn] 116.38 116.38
Expenses
O&M expenses [INR Mn] 26.81 27.61
Other expenses [INR Mn]
Total expenses [INR Mn] 26.81 27.61
EBITDA [INR Mn] 89.57 88.77
EBITDA margin [%] 76.96% 76.27%
Consultant Report on EBITDA Projections Prepared by Greenko
• We compared the capacity and COD of the project with the Commissioning certificates issued by Karnataka Power Transmission Corporation Limited and noted no differences.
• We compared the PLF in the model with the estimates given in the Due Diligence Report prepared by Tractebel Engineering Private Limited and noted no differences.
• Auxiliary consumption is in line with industry standards.
• We compared the tariff in the model and the tariff provided in PPA with KPTCL and noted that they are in agreement. The tariff provided in PPA is applicable for the first 10 years of operations. PPA also provided that that tariff for 11th year onwards would be determined by KERC. KERC in its generic Tariff Order dated 11.12.2009, has stipulated that the tariff at the end of the tenth year would be applicable for the next ten years without escalation for all renewable energy projects. Hence the same tariff would be applicable for the rest of the term of PPA.
• The Project uses the in-house capability for O&M of hydro power projects. We have compared the expenses projected by the Restricted Group with the Management representation and noted that they are in agreement. We compared the escalation rate for O&M expenses considered in the model with rate provided in Management representation and noted that they are in agreement. Management represented that these numbers are based on their experience of operating similar projects.
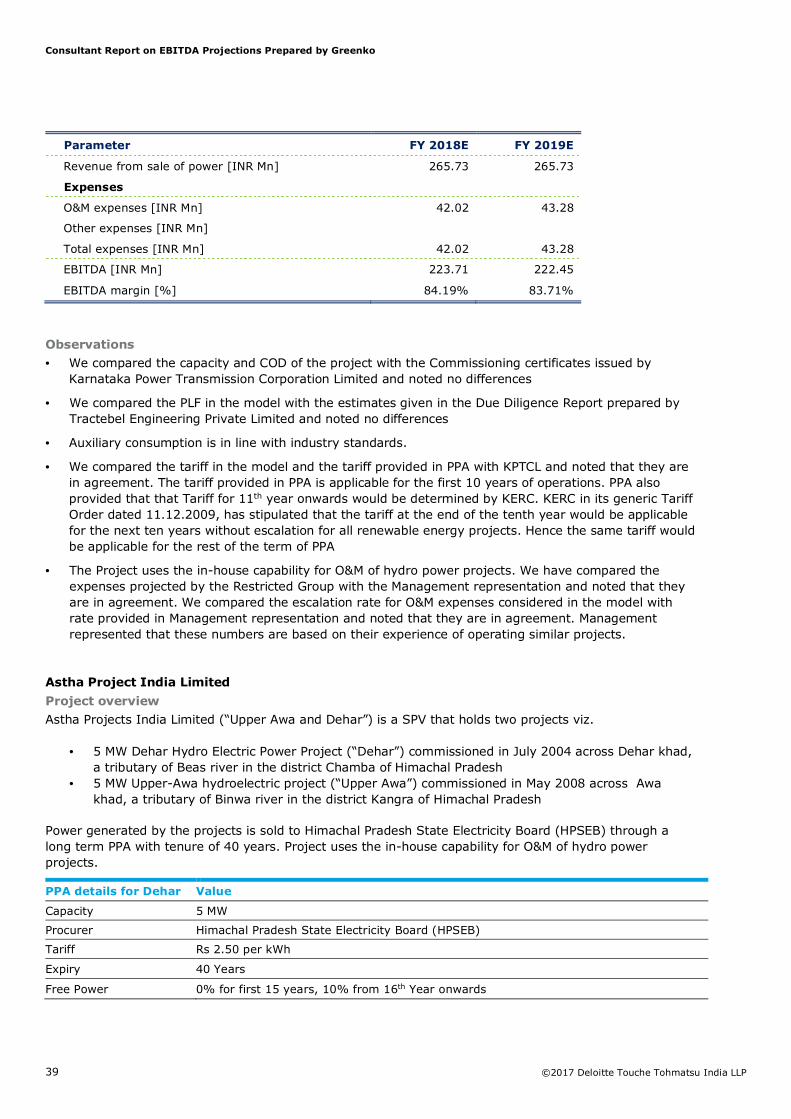
Hemavathy Power and Light Private Limited
Project overview
Hemavathy Power and Light Private Limited (“Hemavathy”) is a SPV that holds two projects viz.
• 8 MW hydro project of Hemavathy Power and Light Private Limited commissioned in August 2005 across Hemavathy Left Bank Canal in district Hassan of Karnataka
• 16 MW hydro project of The Sandur Manganese and Iron Ores Limited commissioned in April 2001 across Hemavathy Left Bank Canal in district Hassan of Karnataka.
Power generated by the projects is sold to Karnataka Power Transmission Corporation Limited (KPTCL) through a PPA with tenure of 20 years. Project uses the in-house capability for O&M of hydro power projects.
Parameter Value
Installed Capacity 24 MW
Procurer Karnataka Power Transmission Corporation Limited (KPTCL)
Tariff Rs 3.422 per kWh
Expiry 20 Years
Project level projections
Key outputs from the EBITDA Projections model are as follows:
Parameter FY 2018E FY 2019E
Generation
Capacity [MW] 24.00 24.00
CUF [%] 37.69% 37.69%
Aux/Tx Loss/Wheeling/Royalty [MkWh] 1.58 1.58
Saleable energy [MkWh] 77.65 77.65
Tariff [INR/kWh] 3.42 3.42
Revenues
Consultant Report on EBITDA Projections Prepared by Greenko
• We compared the capacity and COD of the project with the Commissioning certificates issued by Karnataka Power Transmission Corporation Limited and noted no differences
• We compared the PLF in the model with the estimates given in the Due Diligence Report prepared by Tractebel Engineering Private Limited and noted no differences
• Auxiliary consumption is in line with industry standards.
• We compared the tariff in the model and the tariff provided in PPA with KPTCL and noted that they are in agreement. The tariff provided in PPA is applicable for the first 10 years of operations. PPA also provided that that Tariff for 11th year onwards would be determined by KERC. KERC in its generic Tariff Order dated 11.12.2009, has stipulated that the tariff at the end of the tenth year would be applicable for the next ten years without escalation for all renewable energy projects. Hence the same tariff would be applicable for the rest of the term of PPA
• The Project uses the in-house capability for O&M of hydro power projects. We have compared the expenses projected by the Restricted Group with the Management representation and noted that they are in agreement. We compared the escalation rate for O&M expenses considered in the model with rate provided in Management representation and noted that they are in agreement. Management represented that these numbers are based on their experience of operating similar projects.
Astha Project India Limited
Project overview
Astha Projects India Limited (“Upper Awa and Dehar”) is a SPV that holds two projects viz.
• 5 MW Dehar Hydro Electric Power Project (“Dehar”) commissioned in July 2004 across Dehar khad, a tributary of Beas river in the district Chamba of Himachal Pradesh
• 5 MW Upper-Awa hydroelectric project (“Upper Awa”) commissioned in May 2008 across Awa khad, a tributary of Binwa river in the district Kangra of Himachal Pradesh
Power generated by the projects is sold to Himachal Pradesh State Electricity Board (HPSEB) through a long term PPA with tenure of 40 years. Project uses the in-house capability for O&M of hydro power projects.
PPA details for Dehar Value
Capacity 5 MW
Procurer Himachal Pradesh State Electricity Board (HPSEB)
Tariff Rs 2.50 per kWh
Expiry 40 Years
Free Power 0% for first 15 years, 10% from 16th Year onwards
Consultant Report on EBITDA Projections Prepared by Greenko
Procurer Himachal Pradesh State Electricity Board (HPSEB)
Tariff Rs 2.95 per kWh
Expiry 40 Years
Free Power 0% for first 15 years, 10% from 16th Year onwards
Project level projections
Key outputs from the EBITDA Projections model are as follows:
Parameter FY 2018E FY 2019E
Generation
Capacity [MW] 10.00 10.00
CUF [%] 63.08% 63.08%
Aux/Tx Loss/Wheeling/Royalty [MkWh] 1.11 1.11
Saleable energy [MkWh] 54.15 54.15
Tariff [INR/kWh] 2.73 2.73
Revenues
Revenue from sale of power [INR Mn] 147.57 147.57
Expenses
O&M expenses [INR Mn] 37.57 38.70
Other expenses [INR Mn]
Total expenses [INR Mn] 37.57 38.70
EBITDA [INR Mn] 109.99 108.87
EBITDA margin [%] 74.54% 73.77%
Observations
• We compared the capacity and COD of the project with the Commissioning certificates issued by HPSEB and noted no differences.
• We compared the PLF in the model with the estimates given in the Due Diligence Report prepared by Tractebel Engineering Private Limited and noted no differences.
• Auxiliary consumption is in line with industry standards.
• We compared the tariff in the model and the average tariff provided in PPAs with HPSEB and noted that they are in agreement.
• The Project uses the in-house capability for O&M of hydro power projects. We have compared the expenses projected by the Restricted Group with the Management representation and noted that they are in agreement. We compared the escalation rate for O&M expenses considered in the model with rate provided in Management representation and noted that they are in agreement. Management represented that these numbers are based on their experience of operating similar projects.
Consultant Report on EBITDA Projections Prepared by Greenko
Cimaron Constructions Private Limited (“Taraila II”) is a 5.0 MW hydro project on Tarailai khad, a tributary of Baira river in the district Chamba of Himachal Pradesh. The project was commissioned in March 2009.
Power generated by the project is sold to Himachal Pradesh State Electricity Board (HPSEB) through a long term PPA with tenure of 40 years. Project uses the in-house capability for O&M of hydro power projects.
Parameter Value
Installed Capacity 5 MW
Procurer Himachal Pradesh State Electricity Board (HPSEB)
Tariff Rs 2.95 per kWh
Expiry 40 Years
Free Power 0% for first 15 years, 10% from 16th Year onwards
Project level projections
Key outputs from the EBITDA Projections model are as follows:
Parameter FY 2018E FY 2019E
Generation
Capacity [MW] 5.00 5.00
CUF [%] 67.12% 67.12%
Aux/Tx Loss/Wheeling/Royalty [MkWh] 0.59 0.59
Saleable energy [MkWh] 28.81 28.81
Tariff [INR/kWh] 2.95 2.95
Revenues
Revenue from sale of power [INR Mn] 84.99 84.99
Expenses
O&M expenses [INR Mn] 26.84 27.64
Other expenses [INR Mn]
Total expenses [INR Mn] 26.84 27.64
EBITDA [INR Mn] 58.15 57.35
EBITDA margin [%] 68.42% 67.48%
Observations
• We compared the capacity and COD of the project with the Commissioning certificates issued by HPSEB and noted no differences.
• We compared the PLF in the model with the estimates given in the Due Diligence Report prepared by Tractebel Engineering Private Limited and noted no differences.
• Auxiliary consumption is in line with industry standards.
• We compared the tariff in the model and the tariff provided in PPA with HPSEB and noted that they are in agreement.
• The Project uses the in-house capability for O&M of hydro power projects. We have compared the expenses projected by the Restricted Group with the Management representation and noted that they are in agreement. We compared the escalation rate for O&M expenses considered in the model with
Consultant Report on EBITDA Projections Prepared by Greenko
rate provided in Management representation and noted that they are in agreement. Management represented that these numbers are based on their experience of operating similar projects.
Tarela Power Limited
Project overview
Tarela Power Limited (“Taraila III”) is a 5.0 MW hydro project on Tarailai khad, a tributary of Baira river in the district Chamba of Himachal Pradesh. The project was commissioned in June 2011.
Power generated by the project is sold to Himachal Pradesh State Electricity Board (HPSEB) through a long term PPA with tenure of 40 years. Project uses the in-house capability for O&M of hydro power projects.
Parameter Value
Installed Capacity 5 MW
Procurer Himachal Pradesh State Electricity Board (HPSEB)
Tariff Rs 2.95 per kWh
Expiry 40 Years
Free Power 0% for first 12 years, 12% from 13th Year onwards
Project level projections
Key outputs from the EBITDA Projections model are as follows:
Parameter FY 2018E FY 2019E
Generation
Capacity [MW] 5.00 5.00
CUF [%] 66.21% 66.21%
Aux/Tx Loss/Wheeling/Royalty [MkWh] 0.58 0.58
Saleable energy [MkWh] 28.42 28.42
Tariff [INR/kWh] 2.95 2.95
Revenues
Revenue from sale of power [INR Mn] 83.84 83.84
Expenses
O&M expenses [INR Mn] 20.59 21.21
Other expenses [INR Mn]
Total expenses [INR Mn] 20.59 21.21
EBITDA [INR Mn] 63.25 62.63
EBITDA margin [%] 75.44% 74.70%
Observations
• We compared the capacity and COD of the project with the Commissioning certificates issued by HPSEB and noted no differences.
• We compared the PLF in the model with the estimates given in the Due Diligence Report prepared by Tractebel Engineering Private Limited and noted no differences.
• Auxiliary consumption is in line with industry standards.
• We compared the tariff in the model and the tariff provided in PPA with HPSEB and noted that they are in agreement.
Consultant Report on EBITDA Projections Prepared by Greenko
• The Project uses the in-house capability for O&M of hydro power projects. We have compared the expenses projected by the Restricted Group with the Management representation and noted that they are in agreement. We compared the escalation rate for O&M expenses considered in the model with rate provided in Management representation and noted that they are in agreement. Management represented that these numbers are based on their experience of operating similar projects.
Tejassarnika Hydro Energies Private Limited
Project overview
Tejassarnika Hydro Energies Private Limited (“Upper Joiner”) is a 12.0 MW hydro project on Joiner Nalla, a tributary of Suil river in the district Chamba of Himachal Pradesh. The project was commissioned in June 2011.
Power generated by the projects is sold to Himachal Pradesh State Electricity Board. Project uses the in-house capability for O&M of hydro power projects.
Parameter Value
Installed Capacity 12 MW
Procurer Himachal Pradesh State Electricity Board (HPSEB)
Tariff Basis APPC + REC
PPA Period 1st April 2012 to 31st March 2015 (Extended upto 31st March 2018)
Free Power 15% for first 12 years, 21% from 13th to 30th Year, 33% from 31st Year onwards
Project level projections
Key outputs from the EBITDA Projections model are as follows:
Parameter FY 2018E FY 2019E
Generation
Capacity [MW] 12.00 12.00
CUF [%] 42.35% 42.35%
Aux/Tx Loss/Wheeling/Royalty [MkWh] 7.43 7.43
Saleable energy [MkWh] 37.08 37.08
Tariff [INR/kWh] 3.50 3.50
Revenues
Revenue from sale of power [INR Mn] 129.79 129.79
Expenses
O&M expenses [INR Mn] 60.07 61.87
Other expenses [INR Mn]
Total expenses [INR Mn] 60.07 61.87
EBITDA [INR Mn] 69.72 67.92
EBITDA margin [%] 53.72% 52.33%
Observations
• We compared the capacity and COD of the project with the Commissioning certificates issued by HPSEB and noted no differences.
• We compared the PLF in the model with the estimates given in the Due Diligence Report prepared by Tractebel Engineering Private Limited and noted no differences.
Consultant Report on EBITDA Projections Prepared by Greenko
• Auxiliary consumption is in line with industry standards.
• We compared the tariff in the model and the Average Pooled Power Purchase Cost (APPC) provided in the Himachal Pradesh Electricity Regulation Commission (HPERC) APPC order for FY 17-18 and noted no differences. The same tariff has been considered for FY 18-19.
• For FY 18 and FY 19, Management has represented that the annual REC income is expected to be Rs. 37.08 Mn. We compared the price of REC in the model and the prevailing REC regulation and noted that the price of REC considered in the model is in agreement with the prevailing floor price of REC provided by Central Electricity Regulatory Commission (CERC) order dated 30th March 2017.
• The Project uses the in-house capability for O&M of hydro power projects. We have compared the expenses projected by the Restricted Group with the Management representation and noted that they are in agreement. We compared the escalation rate for O&M expenses considered in the model with rate provided in Management representation and noted that they are in agreement. Management represented that these numbers are based on their experience of operating similar projects.
AT Hydro Private Limited
Project overview
AT Hydro Private Limited (“Upper Taraila”) is a 5.0 MW hydro project on Taraila khad, a tributary of Baira river in the district Chamba of Himachal Pradesh. The project was commissioned in September 2009.
Power generated by the project is sold to Himachal Pradesh State Electricity Board (HPSEB) through a long term PPA with tenure of 40 years. Project uses the in-house capability for O&M of hydro power projects.
Parameter Value
Installed Capacity 5 MW
Procurer Himachal Pradesh State Electricity Board (HPSEB)
Tariff Rs 2.95 per kWh
Expiry 40 Years
Free Power 0% for first 15 years, 10% from 16th Year onwards
Project level projections
Key outputs from the EBITDA Projections model are as follows:
Parameter FY 2018E FY 2019E
Generation
Capacity [MW] 5.00 5.00
CUF [%] 63.93% 63.93%
Aux/Tx Loss/Wheeling/Royalty [MkWh] 0.56 0.56
Saleable energy [MkWh] 27.44 27.44
Tariff [INR/kWh] 2.95 2.95
Revenues
Revenue from sale of power [INR Mn] 80.95 80.95
Expenses
O&M expenses [INR Mn] 21.78 22.44
Other expenses [INR Mn]
Total expenses [INR Mn] 21.78 22.44
EBITDA [INR Mn] 59.17 58.51
EBITDA margin [%] 73.09% 72.28%
Consultant Report on EBITDA Projections Prepared by Greenko
• We compared the capacity and COD of the project with the Commissioning certificates issued by HPSEB and noted no differences.
• We compared the PLF in the model with the estimates given in the Due Diligence Report prepared by Tractebel Engineering Private Limited and noted no differences.
• Auxiliary consumption is in line with industry standards.
• We compared the tariff in the model and the tariff provided in PPA with HPSEB and noted that they are in agreement.
• The Project uses the in-house capability for O&M of hydro power projects. We have compared the expenses projected by the Restricted Group with the Management representation and noted that they are in agreement. We compared the escalation rate for O&M expenses considered in the model with rate provided in Management representation and noted that they are in agreement. Management represented that these numbers are based on their experience of operating similar projects.
Him Kailash Hydro Power Private Limited
Project overview
Him Kailash Hydro Power Private Limited (“Sahu”) is a 5.0 MW hydro project on Sahu khad, a tributary of Ravi river in the district Chamba of Himachal Pradesh. The project was commissioned in April 2008.
Power generated by the project is sold to Himachal Pradesh State Electricity Board (HPSEB) through a long term PPA with tenure of 40 years. Project uses the in-house capability for O&M of hydro power projects.
Parameter Value
Installed Capacity 5 MW
Procurer Himachal Pradesh State Electricity Board (HPSEB)
Tariff Rs 2.50 per kWh
Expiry 40 Years
Free Power 0% for first 15 years, 10% from 16th Year onwards
Project level projections
Key outputs from the EBITDA Projections model are as follows:
Parameter FY 2018E FY 2019E
Generation
Capacity [MW] 5.00 5.00
CUF [%] 64.00% 64.00%
Aux/Tx Loss/Wheeling/Royalty [MkWh] 0.56 0.56
Saleable energy [MkWh] 27.47 27.47
Tariff [INR/kWh] 2.50 2.50
Revenues
Revenue from sale of power [INR Mn] 68.68 68.68
Expenses
O&M expenses [INR Mn] 19.37 19.95
Other expenses [INR Mn]
Total expenses [INR Mn] 19.37 19.95
Consultant Report on EBITDA Projections Prepared by Greenko
• We compared the capacity and COD of the project with the Commissioning certificates issued by HPSEB and noted no differences.
• We compared the PLF in the model with the estimates given in the Due Diligence Report prepared by Tractebel Engineering Private Limited and noted no differences.
• Auxiliary consumption is in line with industry standards.
• We compared the tariff in the model and the tariff provided in PPA with HPSEB and noted that they are in agreement.
• The Project uses the in-house capability for O&M of hydro power projects. We have compared the expenses projected by the Restricted Group with the Management representation and noted that they are in agreement. We compared the escalation rate for O&M expenses considered in the model with rate provided in Management representation and noted that they are in agreement. Management represented that these numbers are based on their experience of operating similar projects.
Sri Sai Krishna Hydro Energies Private Limited
Project overview
Sri Sai Krishna Hydro Energies Private Limited (“Luni II and III”) is a 10.0 MW hydro project on Luni Khad, a tributary of Binwa river in the district Kangra of Himachal Pradesh. The project was commissioned in November 2009.
Power generated by the project is sold to Himachal Pradesh State Electricity Board (HPSEB) through a long term PPA with tenure of 40 years. Project uses the in-house capability for O&M of hydro power projects.
Parameter Value
Installed Capacity 10 MW
Procurer Himachal Pradesh State Electricity Board (HPSEB)
Tariff Rs 2.95 per kWh
Expiry 40 Years
Free Power 0% for first 15 years, 10% from 16th Year onwards
Project level projections
Key outputs from the EBITDA Projections model are as follows:
Parameter FY 2018E FY 2019E
Generation
Capacity [MW] 10.00 10.00
CUF [%] 50.31% 50.31%
Aux/Tx Loss/Wheeling/Royalty [MkWh] 0.88 0.88
Saleable energy [MkWh] 43.19 43.19
Tariff [INR/kWh] 2.95 2.95
Revenues
Revenue from sale of power [INR Mn] 127.41 127.41
Consultant Report on EBITDA Projections Prepared by Greenko
• We compared the capacity and COD of the project with the Commissioning certificates issued by HPSEB and noted no differences.
• We compared the PLF in the model with the estimates given in the Due Diligence of 4 small hydro-electric projects in Himachal Pradesh report prepared by Entura Hydro Tasmania India Pvt Ltd and noted no differences.
• Auxiliary consumption is in line with industry standards.
• We compared the tariff in the model and the tariff provided in PPA with HPSEB and noted that they are in agreement.
• The Project uses the in-house capability for O&M of hydro power projects. We have compared the expenses projected by the Restricted Group with the Management representation and noted that they are in agreement. We compared the escalation rate for O&M expenses considered in the model with rate provided in Management representation and noted that they are in agreement. Management represented that these numbers are based on their experience of operating similar projects.
Anubhav Hydel Private Limited
Project overview
Anubhav Hydel Private Limited (“Binua Parai”) is a 5.0 MW hydro project on Parai khad, a tributary of Binwa river in the district Kangra of Himachal Pradesh. The project was commissioned in May 2011.
Power generated by the project is sold to Himachal Pradesh State Electricity Board (HPSEB) through a long term PPA with tenure of 40 years. Project uses the in-house capability for O&M of hydro power projects.
Parameter Value
Installed Capacity 5 MW
Procurer Himachal Pradesh State Electricity Board (HPSEB)
Tariff Rs 2.95 per kWh
Expiry 40 Years
Free Power 0% for first 12 years, 12% from 13th Year onwards
Project level projections
Key outputs from the EBITDA Projections model are as follows:
Parameter FY 2018E FY 2019E
Generation
Capacity [MW] 5.00 5.00
CUF [%] 70.30% 70.30%
Aux/Tx Loss/Wheeling/Royalty [MkWh] 0.62 0.62
Consultant Report on EBITDA Projections Prepared by Greenko
• We compared the capacity and COD of the project with the Commissioning certificates issued by HPSEB and noted no differences.
• We compared the PLF in the model with the estimates given in the Due Diligence of 4 small hydro-electric projects in Himachal Pradesh report prepared by Entura Hydro Tasmania India Pvt Ltd and noted no differences.
• Auxiliary consumption is in line with industry standards.
• We compared the tariff in the model and the tariff provided in PPA with HPSEB and noted that they are in agreement.
• The Project uses the in-house capability for O&M of hydro power projects. We have compared the expenses projected by the Restricted Group with the Management representation and noted that they are in agreement. We compared the escalation rate for O&M expenses considered in the model with rate provided in Management representation and noted that they are in agreement. Management represented that these numbers are based on their experience of operating similar projects.
Ranga Raju Warehousing Private Limited
Project overview
Ranga Raju Warehousing Private Limited (“Sumez”) is a 14.0 MW hydro project on Sechi and Mohail khad, a tributary of Satluj river in the district Shimla of Himachal Pradesh. The project was commissioned in March 2012.
Power generated by the projects is sold to Himachal Pradesh State Electricity Board. Project uses the in-house capability for O&M of hydro power projects.
Parameter Value
Installed Capacity 14 MW
Procurer Himachal Pradesh State Electricity Board (HPSEB)
Tariff Basis APPC + REC
PPA Period 1st April 2012 to 31st March 2015 (Extended upto 31st March 2018)
Free Power 15% for first 12 years, 21% from 13th to 30th Year, 33% from 31st Year onwards
Project level projections
Key outputs from the EBITDA Projections model are as follows:
Consultant Report on EBITDA Projections Prepared by Greenko
• We compared the capacity and COD of the project with the Commissioning certificates issued by HPSEB and noted no differences.
• We compared the PLF in the model with the estimates given in the Due Diligence of 4 small hydro-electric projects in Himachal Pradesh report prepared by Entura Hydro Tasmania India Pvt Ltd and noted no differences.
• Auxiliary consumption is in line with industry standards.
• We compared the tariff in the model and the Average Pooled Power Purchase Cost (APPC) provided in the Himachal Pradesh Electricity Regulation Commission (HPERC) APPC order for FY 17-18 and noted no differences. The PPA has an expiry date of 31 March 2018. The Management represented that the PPA shall be extended on similar terms and considered same tariff for FY 18-19.
• For FY 18 and FY 19, Management has represented that the annual REC income is expected to be Rs. 47.61 Mn. We compared the price of REC in the model and the prevailing REC regulation and noted that the price of REC considered in the model is in agreement with the prevailing floor price of REC provided by Central Electricity Regulatory Commission (CERC) order dated 30th March 2017.
• The Project uses the in-house capability for O&M of hydro power projects. We have compared the expenses projected by the Restricted Group with the Management representation and noted that they are in agreement. We compared the escalation rate for O&M expenses considered in the model with rate provided in Management representation and noted that they are in agreement. Management represented that these numbers are based on their experience of operating similar projects.
Greenko Budhil Hydro Power Pvt. Ltd
Project overview
Greenko Budhil Hydro Power Pvt. Ltd (“Budhil”) is a 70 MW hydro project across Budhil stream, a major tributary of Ravi river in Chamba district of Himachal Pradesh. The project was commissioned in May 2012.
Power generated by the project is sold to Uttarakhand Power Corporation Limited (UPCL) through a long term PPA with tenure of 40 years. Project uses the in-house capability for O&M of hydro power projects.
Consultant Report on EBITDA Projections Prepared by Greenko
Procurer Uttarakhand Power Corporation Limited (UPCL)
Tariff As determined by Uttarakhand Electricity Regulatory Commission (UERC)
Expiry 36 Years
Free Power 12% for first 12 years, 18% from 13th Year onwards
Project level projections
Key outputs from the EBITDA Projections model are as follows:
Parameter FY 2018E FY 2019E
Generation
Capacity [MW] 70.00 70.00
CUF [%] 49.40% 49.40%
Aux/Tx Loss/Wheeling/Royalty [MkWh] 41.68 41.68
Saleable energy [MkWh] 261.24 261.24
Tariff [INR/kWh] 3.76 3.68
Revenues
Revenue from sale of power [INR Mn] 981.71 962.43
Expenses
O&M expenses [INR Mn] 186.38 191.97
Other expenses [INR Mn]
Total expenses [INR Mn] 186.38 191.97
EBITDA [INR Mn] 795.33 770.46
EBITDA margin [%] 81.01% 80.05%
Observations
• We compared the capacity and COD of the project with the Commissioning certificate issued by Central Electricity Authority and noted no differences.
• We compared the PLF in the model with the estimates given in the Due Diligence of 3 Hydro‐electric projects in Himachal Pradesh prepared by Entura Hydro Tasmania India Pvt Ltd and noted no differences.
• Auxiliary consumption is in line with industry standards.
• We compared the tariff in the model and the tariff provided in Uttarakhand Electricity Regulatory Commission (UERC) tariff order on Budhil dated 30th November 2016 and noted that they are in agreement.
• The Project uses the in-house capability for O&M of hydro power projects. We have compared the expenses projected by the Restricted Group with the Management representation and noted that they are in agreement. We compared the escalation rate for O&M expenses considered in the model with rate provided in Management representation and noted that they are in agreement. Management represented that these numbers are based on their experience of operating similar projects.
Consultant Report on EBITDA Projections Prepared by Greenko
Ratnagiri Wind Power Projects Private Limited (“Ratnagiri Wind”) is a wind power project located in the Satara district of Maharashtra. Capacity of 65.6 MW of first phase (“Ratnagiri-P1”) of Ratnagiri Wind has been operational since August 2013. Ratnagiri-P1 consists of 41 1.6 MW GE turbines.
The second phase (“Ratnagiri-P2”) of 36 MW has been operational since October 2015. Ratnagiri-P2 consists of 20 1.8 MW GE turbines.
Energy generated from Ratnagiri Wind is sold to Maharashtra State Electricity Distribution Company Ltd MSEDCL under a FIT PPA with tenure of 13 years.
PPA Details for Phase 1
Capacity 65.6 MW
Procurer Maharashtra State Electricity Distribution Company Ltd (MSEDCL)
Tariff Rs. 5.75 per kWh
Expiry 13 years from COD
PPA Details for Phase 2
Capacity 36 MW
Procurer Maharashtra State Electricity Distribution Company Ltd (MSEDCL)
Tariff Rs. 5.70 per kWh
Expiry 13 years from COD
Ratnagiri wind has entered into an O&M agreement with GE India Industrial Private Limited effective from the day of signing of the O&M agreement. In addition there are taxes, consumables, insurance and administration expenses. We inquired of Management as to source of these other O&M expenses and were informed that it was based on management internal information and their experience in other similar operating projects.
Project level projections
Key outputs from the EBITDA Projections model are as follows:
Parameter FY 2018E FY 2019E
Generation
Capacity [MW] 101.60 101.60
CUF [%] 24.11% 24.11%
Aux/Tx Loss/Wheeling/Royalty [MkWh] 4.29 4.29
Saleable energy [MkWh] 210.29 210.29
Tariff [INR/kWh] 5.73 5.73
Revenues
Revenue from sale of power [INR Mn] 1,205.53 1,205.53
GBI Income [INR Mn] 105.15 105.15
Total Revenue [INR Mn] 1,310.68 1,310.68
Expenses
O&M expenses [INR Mn] 126.06 132.36
Other expenses [INR Mn] 99.42 102.40
Total expenses [INR Mn] 225.48 234.76
EBITDA [INR Mn] 1,085.20 1,075.92
EBITDA margin [%] 82.80% 82.09%
Consultant Report on EBITDA Projections Prepared by Greenko
• We compared the capacity and COD of the project with the Commissioning certificate issued by MSEDCL. For Phase 1 capacity of 65.6 MW, we noted that capacity of the project and capacity in commissioning certificate are in agreement. Phase 2 of the project consists of 20 GE Turbines. We obtained the Commissioning certificate and noted that the capacity of each turbine is 1.6 MW. Management represented that the actual Turbine capacity of 1.8 MW due to capacity enhancement. We compared the capacity in model and Management representation and noted no differences.
• We compared the PLF in the model for wind projects with the P75 estimates given in Estimation of the Wind resource and energy yield report prepared by AWS Truepower LLC and noted that they are in agreement.
• Auxiliary consumption is in line with industry standards.
• We compared the tariff in the model and the PPA with MSEDCL and noted that they are in agreement.
• We obtained GBI registration letter of IREDA and observed that the project is registered with IREDA. For FY 18 and FY 19, we recalculated the revenue from GBI and observed that it is in agreement to the GBI guidelines.
• We compared the O&M price considered in the model with the price mentioned in the O&M contract and noted that they are in agreement. We noted that in calculation of O&M expenses in the model, taxes have been considered in addition to the O&M price, as O&M price mentioned in the O&M agreement does not include applicable taxes. We compared the escalation rate for O&M expense considered in the model with the rate in the O&M agreement and found no difference.
• We inquired of Management about other expenses and were informed that they are based on internal estimates and their experience in other projects. We compared the escalation rate with Management representation and noted that they are in agreement.
Rayala Wind Power Company Private Limited
Project overview
Rayala Wind Power Company Private Limited (“Rayala Wind”) is a 51.2 MW wind power project located in the Anantpur district of Andhra Pradesh. The project consists of following phases
• The first phase (“Rayala-P1A”) of Rayala Wind of 51.2 MW has been operational since December 2013. Rayala-P1A consists of 32 1.6 MW GE turbines.
• Phase 1B of 50.0 MW capacity (“Rayala-P1B”) has been operational since March 2014. Rayala-P1B consists of 25 2.0 MW Gamesa turbines.
• Phase 2A of 50.0 MW capacity (“Rayala-P2A”) has been operational since May 2015. Rayala-P2A consists of 25 2.0 MW Gamesa turbines.
Energy generated from Rayala wind project is sold to Central Power Distribution Company of Andhra Pradesh Limited under a FIT PPA with tenure of 25 years
PPA Details for Phase 1 A and 1B
Capacity 101.2 MW
Procurer Central Power Distribution Company of Andhra Pradesh Limited
Tariff Rs. 4.70 per kWh
Expiry 25 years from COD
PPA Details for Phase 2 A
Capacity 50 MW
Consultant Report on EBITDA Projections Prepared by Greenko
Procurer Central Power Distribution Company of Andhra Pradesh Limited
Tariff Rs. 4.70 per kWh
Expiry 25 years from COD
Rayala 1A has entered into an O&M agreement with GE India Industrial Private Limited effective from the day of signing of the O&M agreement. Rayala 1B and Rayala 2A has entered into to O&M agreement with Gamesa Wind Turbines Private Limited. In addition there are applicable taxes, consumables, insurance and administration expenses. We inquired of Management as to source of these other O&M expenses and were informed that it was based on management internal information and their experience in other similar operating projects.
Project level projections
Key outputs from the EBITDA Projections model are as follows:
Parameter FY 2018E FY 2019E
Generation
Capacity [MW] 159.20 159.20
CUF [%] 30.66% 30.66%
Aux/Tx Loss/Wheeling/Royalty [MkWh] 8.55 8.55
Saleable energy [MkWh] 418.98 418.98
Tariff [INR/kWh] 4.70 4.70
Revenues
Revenue from sale of power [INR Mn] 1,969.20 1,969.20
GBI Income [INR Mn] 209.49 209.49
Total Revenue [INR Mn] 2,178.69 2,178.69
Expenses
O&M expenses [INR Mn] 135.13 141.89
Other expenses [INR Mn] 173.68 180.23
Total expenses [INR Mn] 308.81 322.12
EBITDA [INR Mn] 1,869.89 1,856.58
EBITDA margin [%] 85.83% 85.22%
Observations
• We compared the capacity and COD of the project with the Commissioning certificate issued by Central Power Distribution Company of Andhra Pradesh Limited and noted no differences.
• We compared the PLF in the model for wind projects with the P75 estimates given in Energy Production Estimates report prepared by AWS Truepower LLC and noted that they are in agreement.
• Auxiliary consumption is in line with industry standards.
• We compared the tariff in the model and the PPA with Central Power Distribution Company of Andhra Pradesh Limited and noted that they are in agreement.
• We obtained GBI registration letter of IREDA and observed that the project is registered with IREDA. For FY 18 and FY 19, we recalculated the revenue from GBI and observed that it is in agreement to the GBI guidelines.
• We compared the O&M price considered in the model with the price mentioned in the O&M contract and noted that they are in agreement. We noted that in calculation of O&M expenses in the model, taxes have been considered in addition to the O&M price, as O&M price mentioned in the O&M agreement does not include applicable taxes. We compared the escalation rate for O&M expense considered in the model with the rate in the O&M agreement and found no difference.
Consultant Report on EBITDA Projections Prepared by Greenko
• We inquired of Management about other expenses and were informed that they are based on internal estimates and their experience in other projects. We compared the escalation rate with Management representation and noted that they are in agreement.
Matrix Power Wind Private Limited
Project overview
Matrix Power Wind Private Limited (“Matrix”) is a wind power project located in the Bijapur district of Karnataka. The capacity of Matrix is 15 MW which has been operational since November 2013. Matrix consists of 10 1.5 MW ReGen turbines.
Energy generated from Matrix is sold via direct sale to end consumers under captive route.
PPA Details
Capacity 15 MW
Procurer Direct sale to end consumers
Tariff Discount to Bangalore Electricity Supply Company Ltd. (BESCOM) energy charge and Fuel Adjustment Charge (FAC) for Industrial / Commercial consumers as applicable to respective consumers
Expiry 11 Yrs
Matrix has entered in to an O&M agreement with ReGen Powertech Private Limited effective from the day of COD of plant. In addition there are applicable taxes, consumables, insurance and administration expenses. We inquired of Management as to source of these other O&M expenses and were informed that it was based on management internal information and their experience in other similar operating projects.
Project level projections
Key outputs from the EBITDA Projections model are as follows:
Parameter FY 2018E FY 2019E
Generation
Capacity [MW] 15.00 15.00
CUF [%] 31.90% 31.90%
Aux/Tx Loss/Wheeling/Royalty [MkWh] 3.71 3.71
Saleable energy [MkWh] 38.20 38.20
Tariff [INR/kWh] 8.12 8.20
Revenues
Revenue from sale of power [INR Mn] 310.21 313.31
GBI Income [INR Mn] 0.00 0.00
Total Revenue [INR Mn] 310.21 313.31
Expenses
O&M expenses [INR Mn] 15.79 16.58
Other expenses [INR Mn] 26.94 27.75
Total expenses [INR Mn] 42.74 44.34
EBITDA [INR Mn] 267.47 268.97
EBITDA margin [%] 86.22% 85.85%
Consultant Report on EBITDA Projections Prepared by Greenko
• We compared the capacity and COD of the project with the Commissioning certificate issued by Hubli Electricity Supply Company Limited (HESCOM) and noted no differences.
• We compared the PLF in the model for wind projects with the P75 estimates given in Energy Yield Assessment report prepared by AWS Truepower LLC and noted that they are in agreement.
• Auxiliary consumption is in line with industry standards.
• The Electricity Rules, 2005 specify that for projects to be considered as captive generating plant, the consumers need to have at least 26% of equity in the project and consume at least 51% of the power on an annual basis. Further, the captive users need to consume power in proportion to their shares in ownership of the power plant within a variation not exceeding 10%. We examined the proportion of contracted energy as per the PPAs and the proportion of the shareholding as per the SHAs and noted that the proportions are in agreement with the requirements for 26% equity and at least 51% consumption of power for captive generating stations under the Electricity Rules, 2005. Further management represented that equity shareholding and the proportionate consumption of power from the plant will be maintained to ensure group captive generating plant status.
• We compared the net tariff applicable for the projects for existing customers based on the tariff category & discount mentioned in the PPA signed, wheeling charges and end user tariff in Karnataka Electricity Regulatory Commission (KERC) Tariff order for FY 2017-18, wheeling and banking charges as per the WBA order, with the tariff assumed in model and found no differences. As power is sold under captive mode, cross subsidy surcharge is not applicable. The escalation of 1% considered is conservative as compared to the historical trend of tariff hikes for HT Industrial and HT Commercial consumers.
• We compared the O&M price considered in the model with the price mentioned in the O&M contract and noted that they are in agreement. We noted that in calculation of O&M expenses in the model, taxes have been considered in addition to the O&M price, as O&M price mentioned in the O&M agreement does not include applicable taxes. We compared the escalation rate for O&M expense considered in the model with the rate in the O&M agreement and found no difference.
• We inquired of Management about other expenses and were informed that they are based on internal estimates and their experience in other projects. We compared the escalation rate with Management representation and noted that they are in agreement.
Mangalore Energies Private Limited
Project overview
Mangalore Energies Private Limited (“Mangalore”) is a wind power project located in the Bijapur district of Karnataka. The capacity of the project is 15 MW. The project consists of 10 1.5 MW ReGen turbines.
Energy generated from Mangalore is sold via direct sale to end consumers under captive route.
PPA Details
Capacity 15 MW
Procurer Direct sale to end consumers
Tariff Discount to Bangalore Electricity Supply Company Ltd. (BESCOM) energy charge and Fuel Adjustment Charge (FAC) for Industrial / Commercial consumers as applicable to respective consumers
Expiry 10-12 Yrs
The Project has entered in to an O&M agreement with ReGen Powertech Private Limited effective from the day of COD of plant. In addition there are applicable taxes, consumables, insurance and administration
Consultant Report on EBITDA Projections Prepared by Greenko
expenses. We inquired of Management as to source of these other O&M expenses and were informed that it was based on management internal information and their experience in other similar operating projects.
Project level projections
Key outputs from the EBITDA Projections model are as follows:
Parameter FY 2018E FY 2019E
Generation
Capacity [MW] 15.00 15.00
CUF [%] 30.60% 30.60%
Aux/Tx Loss/Wheeling/Royalty [MkWh] 3.56 3.56
Saleable energy [MkWh] 36.65 36.65
Tariff [INR/kWh] 8.56 8.65
Revenues
Revenue from sale of power [INR Mn] 313.69 316.83
GBI Income [INR Mn] 0.00 0.00
Total Revenue [INR Mn] 313.69 316.83
Expenses
O&M expenses [INR Mn] 16.01 16.81
Other expenses [INR Mn] 6.18 6.37
Total expenses [INR Mn] 22.19 23.17
EBITDA [INR Mn] 291.50 293.65
EBITDA margin [%] 92.93% 92.69%
Observations
• We compared the capacity and COD of the project with the Commissioning certificate issued by Hubli Electricity Supply Company Limited (HESCOM) and noted no differences.
• We compared the PLF in the model for wind projects with the P75 estimates given in WRA report prepared by AWS Truepower LLC and noted that they are in agreement.
• Auxiliary consumption is in line with industry standards.
• The Electricity Rules, 2005 specify that for projects to be considered as captive generating plant, the consumers need to have at least 26% of equity in the project and consume at least 51% of the power on an annual basis. Further, the captive users need to consume power in proportion to their shares in ownership of the power plant within a variation not exceeding 10%. We examined the proportion of contracted energy as per the PPAs and the proportion of the shareholding as per the SHAs and noted that the proportions are in agreement with the requirements for 26% equity and at least 51% consumption of power for captive generating stations under the Electricity Rules, 2005. Further management represented that equity shareholding and the proportionate consumption of power from the plant will be maintained to ensure group captive generating plant status.
• We compared the net tariff applicable for the projects for existing customers based on the tariff category & discount mentioned in the PPA signed, wheeling charges and end user tariff in Karnataka Electricity Regulatory Commission (KERC) Tariff order for FY 2017-18, wheeling and banking charges as per the WBA order, with the tariff assumed in model and found no differences. As power is sold under captive mode, cross subsidy surcharge is not applicable. The escalation of 1% considered is conservative as compared to the historical trend of tariff hikes for HT Industrial and HT Commercial consumers.
• We compared the O&M price considered in the model with the price mentioned in the O&M contract and noted that they are in agreement. We noted that in calculation of O&M expenses in the model, taxes have been considered in addition to the O&M price, as O&M price mentioned in the O&M agreement
Consultant Report on EBITDA Projections Prepared by Greenko
does not include applicable taxes. We compared the escalation rate for O&M expense considered in the model with the rate in the O&M agreement and found no difference.
• We inquired of Management about other expenses and were informed that they are based on internal estimates and their experience in other projects. We compared the escalation rate with Management representation and noted that they are in agreement.
Fortune Five Hydel Projects Private Limited
Project overview
Fortune Five Hydel Projects Private Limited (“Fortune Five”) is a wind power project located in the Bijapur district of Karnataka. The project consists of the following phases
• Phase 1A capacity of 51.2 MW (“Fortune Five-P1A”) of the Fortune Five has been operational since November 2013. Fortune Five-P1A consists of 32 1.6 MW GE XLE turbines.
• Phase 1B capacity of 50 MW (“Fortune Five-P1B”) of the Fortune Five has been operational since June 2014. Fortune Five-P1B consists of 25 2 MW Gamesa turbines.
Energy generated from Fortune Five is sold to end consumers (Industrial and commercial) under direct sale route
PPA Details
Capacity 101.2 MW
Procurer Direct sale to end consumers
Tariff Discount to Bangalore Electricity Supply Company Ltd. (BESCOM) energy charge and Fuel Adjustment Charge (FAC) for Industrial / Commercial consumers as applicable to respective consumers
Fortune Five-P1A has entered in to an O&M agreement with GE India Industrial Private Limited effective from the day of COD of plant. Fortune Five-P1B has entered into a 5 year O&M agreement with Gamesa Wind Turbines Private Limited effective from commissioning of first WTG of the project. In addition there are applicable taxes, consumables, insurance and administration expenses. We inquired of Management as to source of these other O&M expenses and were informed that it was based on management internal information and their experience in other similar operating projects.
Project level projections
Key outputs from the EBITDA Projections model are as follows:
Parameter FY 2018E FY 2019E
Generation
Capacity [MW] 101.20 101.20
CUF [%] 30.30% 30.30%
Aux/Tx Loss/Wheeling/Royalty [MkWh] 23.80 23.80
Saleable energy [MkWh] 244.81 244.81
Tariff [INR/kWh] 5.02 5.07
Revenues
Revenue from sale of power [INR Mn] 1,228.97 1,241.26
GBI Income [INR Mn] 0.00 0.00
Total Revenue [INR Mn] 1,228.97 1,241.26
Expenses
O&M expenses [INR Mn] 128.20 135.81
Other expenses [INR Mn] 75.96 78.24
Total expenses [INR Mn] 204.16 214.05
Consultant Report on EBITDA Projections Prepared by Greenko
• We compared the capacity and COD of the project with the Commissioning certificate issued by Hubli Electricity Supply Company Limited (HESCOM) and noted no differences.
• We compared the PLF in the model for wind projects with the P75 estimates given in Assessment of the energy production report prepared by Garrad Hassan India Private Ltd and noted that they are in agreement
• Auxiliary consumption is in line with industry standards.
• Management represented that the project sells energy to consumers through a mix of large long term PPAs and short term sale basis. We compared the tariff of these large PPAs which represented 42% of total energy sold. The tariff for these PPAs are higher than with tariff considered by Management for the project. Management represented that they would be able to realise Rs 5.02/kWh for FY 2017-18 and Rs 5.07/kWh for FY 2018-19. We compared the tariffs considered in the model for the entire project and tariff represented by the management and noted no differences.
• We compared the O&M price considered in the model with the price mentioned in the O&M contract and noted that they are in agreement. We noted that in calculation of O&M expenses in the model, taxes have been considered in addition to the O&M price, as O&M price mentioned in the O&M agreement does not include applicable taxes. We compared the escalation rate for O&M expense considered in the model with the rate in the O&M agreement and found no difference.
• We inquired of Management about other expenses and were informed that they are based on internal estimates and their experience in other projects. We compared the escalation rate with Management representation and noted that they are in agreement.
Poly Solar Parks Private Limited
Project overview
Poly Solar Parks Private Limited (“Poly”) is a 24 MW wind power project in Anantpur district of Andhra Pradesh. The project was commissioned in July 2016
Power generated by the project is sold to Southern Power Distribution Company of A.P. Limited through a long term PPA with tenure of 25 years.
Parameter Value
Installed Capacity 24 MW
Procurer Southern Power Distribution Company of A.P. Limited
Tariff Rs 4.83 per kWh + Income Tax/MAT
Expiry 25 Years
The Project has entered in to a 20 year O&M agreement with Gamesa Renewable Private Limited effective from the day of COD of plant. In addition there are applicable taxes, consumables, insurance and administration expenses. We inquired of Management as to source of these other O&M expenses and were informed that it was based on management internal information and their experience in other similar operating projects.
Project level projections
Key outputs from the EBITDA Projections model are as follows:
Consultant Report on EBITDA Projections Prepared by Greenko
• We compared the capacity and COD of the project with the Commissioning certificates issued by Southern Power Distribution Company of A.P. Limited and noted no differences.
• We compared the PLF in the model with the estimates given in the Energy assessment report prepared by 3TIER R&D India Private Limited td and noted they are in line agreement.
• Auxiliary consumption is in line with industry standards.
• We compared the tariff in the model and the tariff provided in PPA with Southern Power Distribution Company of A.P. Limited and noted that they are in agreement.
• We obtained snapshots of IREDA website registration and observed that the project is registered with IREDA. For FY 18 and FY 19, we recalculated the revenue from GBI and observed that it is in agreement to the GBI guidelines.
• We compared the O&M price considered in the model with the price mentioned in the O&M contract and noted that they are in agreement. We noted that in calculation of O&M expenses in the model, taxes have been considered in addition to the O&M price, as O&M price mentioned in the O&M agreement does not include applicable taxes. We compared the escalation rate for O&M expense considered in the model with the rate in the O&M agreement and found no difference.
• We inquired of Management about other expenses and were informed that they are based on internal estimates and their experience in other projects. We compared the escalation rate with Management representation and noted that they are in agreement.
Jed Solar Parks Private Limited
Project overview
Jed Solar Parks Private Limited (“Jed”) is a 24 MW wind power project in Anantpur district of Andhra Pradesh. The project was commissioned in July 2016
Power generated by the project is sold to Southern Power Distribution Company of A.P. Limited through a long term PPA with tenure of 25 years.
Parameter Value
Installed Capacity 24 MW
Consultant Report on EBITDA Projections Prepared by Greenko
Procurer Southern Power Distribution Company of A.P. Limited
Tariff Rs 4.83 per kWh + Income Tax/MAT
Expiry 25 Years
The Project has entered in to a 20 year O&M agreement with Gamesa Renewable Private Limited effective from the day of COD of plant. In addition there are applicable taxes, consumables, insurance and administration expenses. We inquired of Management as to source of these other O&M expenses and were informed that it was based on management internal information and their experience in other similar operating projects.
Project level projections
Key outputs from the EBITDA Projections model are as follows:
Parameter FY 2018E FY 2019E
Generation
Capacity [MW] 24.00 24.00
CUF [%] 32.70% 32.70%
Aux/Tx Loss/Wheeling/Royalty [MkWh] 1.37 1.37
Saleable energy [MkWh] 67.37 67.37
Tariff [INR/kWh] 4.90 4.90
Revenues
Revenue from sale of power [INR Mn] 330.13 330.13
GBI Income [INR Mn] 33.69 33.69
Total Revenue [INR Mn] 363.82 363.82
Expenses
O&M expenses [INR Mn] 0.00 21.94
Other expenses [INR Mn] 11.12 11.46
Total expenses [INR Mn] 11.12 33.40
EBITDA [INR Mn] 352.69 330.42
EBITDA margin [%] 96.94% 90.82%
Observations
• We compared the capacity and COD of the project with the Commissioning certificates issued by Southern Power Distribution Company of A.P. Limited and noted no differences.
• We compared the PLF in the model with the estimates given in the Energy assessment report prepared by 3TIER R&D India Private Limited and noted that they are in agreement.
• Auxiliary consumption is in line with industry standards.
• We compared the tariff in the model and the tariff provided in PPA with Southern Power Distribution Company of A.P. Limited and noted that they are in agreement.
• We obtained snapshots of IREDA website registration and observed that the project is registered with IREDA. For FY 18 and FY 19, we recalculated the revenue from GBI and observed that it is in agreement to the GBI guidelines.
• We compared the O&M price considered in the model with the price mentioned in the O&M contract and noted that they are in agreement. We noted that in calculation of O&M expenses in the model, taxes have been considered in addition to the O&M price, as O&M price mentioned in the O&M agreement does not include applicable taxes. We compared the escalation rate for O&M expense considered in the model with the rate in the O&M agreement and found no difference.
Consultant Report on EBITDA Projections Prepared by Greenko
• We inquired of Management about other expenses and were informed that they are based on internal estimates and their experience in other projects. We compared the escalation rate with Management representation and noted that they are in agreement.
Consultant Report on EBITDA Projections Prepared by Greenko