55
Global Technology Services Trend reporting for Tivoli Storage Manager Holger Speh Consulting IT Specialist

Global Technology Services
Trend reporting for Tivoli Storage Manager
Holger Speh
Consulting IT Specialist

Global Technology Services
22
Do you know how your TSM environment is evolving?
Healthy? Well integrated?
Data Growth?
Accounting?

Global Technology Services
33
Historical Reporting and Business Intelligence are needed to be prepared for future challenges
� Recognize and quanitfy data growth
� Support financial investmens in additional or new hardware
� Avoid operational problems by timely adjustments
� Be auditable

Global Technology Services
44
Some history in the TSM reporting area...

Global Technology Services
55
Tivoli Decision Support (TDS)
1. Allows users to make business decisions based on historical data
2. Unlocks hidden IT data
3. Consolidates and transforms enterprise management data into text and graphical formats
4. Turns raw statistics into useful business information
� Products: TDS Discovery Guides for …
� Storage Management Analysis (for ITSM)
� Storage Network Management Analysis (for TSNM)

Global Technology Services
66
Tivoli Data Warehouse
� Follow-on product to Tivoli Decision Support.
� Builds a “Central Data Warehouse” (DB) containing data from entire IT infrastructure. (including TSM environment).
� A subset of the CDW (or Data Mart as it is called) can be then used to analyze IT costs, infrastructure, performance and do historical trending.
� Vendors can write their own packages to interface with TDW for their software applications, or customers can also develop their own). These are referred to as Enablement Packages.
� Tivoli has developed V1 of its WEP for TSM.
� TDW contains several software components and can run on several platforms.
Global Technology Services
77
What tools do we have today?

Global Technology Services
88
Operational Reporting Collaboration Model
Managers TSM Admins
TSM Server
TSM Server
Node
Owners
App
OwnersHelp Desk Tape Operators
TEC Web
E-mail Operational ReportingDesktop
Global Technology Services
99
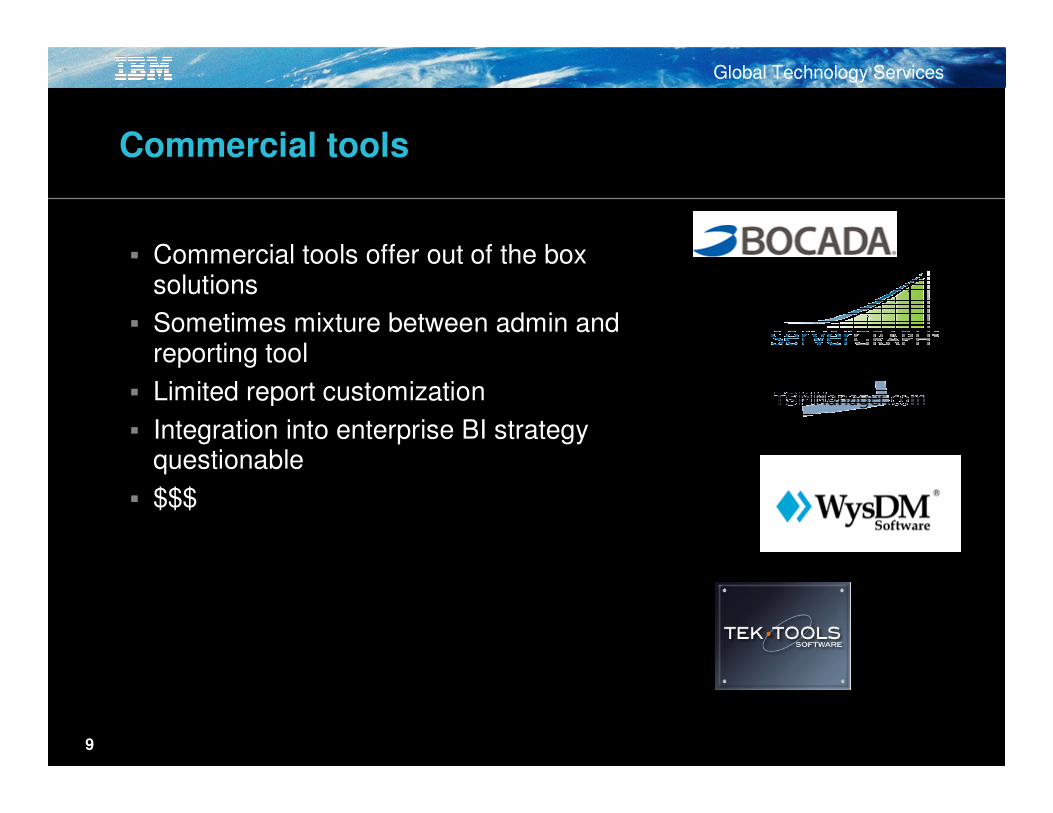
Commercial tools
� Commercial tools offer out of the box solutions
� Sometimes mixture between admin and reporting tool
� Limited report customization
� Integration into enterprise BI strategy questionable
� $$$

Global Technology Services
1010
Open Source Business Intelligence tools
� Cacti (monitoring tool with reporting capabilities)
� Pentaho
� Jaspersoft
� OpenI
� BIRT
� Bizgres

Global Technology Services
1111
Cacti serves between monitoring and reporting
� “Cacti is a complete frontend to RRDTool, it stores all of the necessary information to create graphs and populate them with data in a MySQL database. The frontend is completely PHP driven. Along with being able to maintain Graphs, Data Sources, and Round Robin Archives in a database, cacti handles the data gathering. There is also SNMP support for those used to creating traffic graphs with MRTG.”
� Cacti uses
� MySQL
� PHP
� SNMP
� RRDTool
RRDtool refers to Round Robin Database tool. Round robin is a
technique that works with a fixed amount of data, and a pointer to
the current element. Think of a circle with some dots plotted on the
edge -- these dots are the places where data can be stored. As we are
on a circle there is neither a beginning nor an end, you can go on
and on and on. After a while, all the available places will be used
and the process automatically reuses old locations. This way, the
dataset will not grow in size and therefore requires no maintenance.

Global Technology Services
1212
Principles of Operation for Cacti
� Data Retrival by utilizing scheduled poller run
� Data Storage by utilizing RRDTool
� Data Presentation by again utilizing RRDTool

Global Technology Services
1313
Example Output for Diskpool Utilization
� Nightly backups fill diskpool until automatic migration starts
� Situation is permanent
� TSM queries need script, no SNMP possible

Global Technology Services
1414
Example Output for Drive Utilization
� Nightly backups use heavily available drives
� Situation is permanent
� TSM queries need script, no SNMP possible

Global Technology Services
1515
How to get from a script to a Cacti graph
The minimal steps to create a graph from a script are simply:
1. Create a Data Input Method to tell Cacti how to call the script and what to expect from it.
2. Create a Data Template to tell cacti how and where the data willbe stored.
3. Create a Graph Template to tell cacti how the data will be presented in graph form.
4. Associate Template with device
5. Add Graph to Graph View so you can view the graph.
6. View the Graph

Global Technology Services
1616
Further Examples

Global Technology Services
1717
Cacti Links
� Home of Cacti http://www.cacti.net
� Home of CactiEZ http://www.cactiusers.org
� Cacti Templates http://www.debianhelp.co.uk/cactitemplates.htm
� RRDTool http://www.rrdtool.org

Global Technology Services
1818
What‘s BIRT?
� BIRT Project = Business Intelligence and Report Tools Project
� Open source initiative as part of the Eclipse Foundation
� Project launched in October, 2004
� Goals:
� Next generation reporting technology
� Eclipse-based Report Designer
� Web-centric design metaphor
� Open Source with rapid adoption
� Standards based & highly extensible
� Open XML design format
� Build community and ecosystem
Global Technology Services
1919
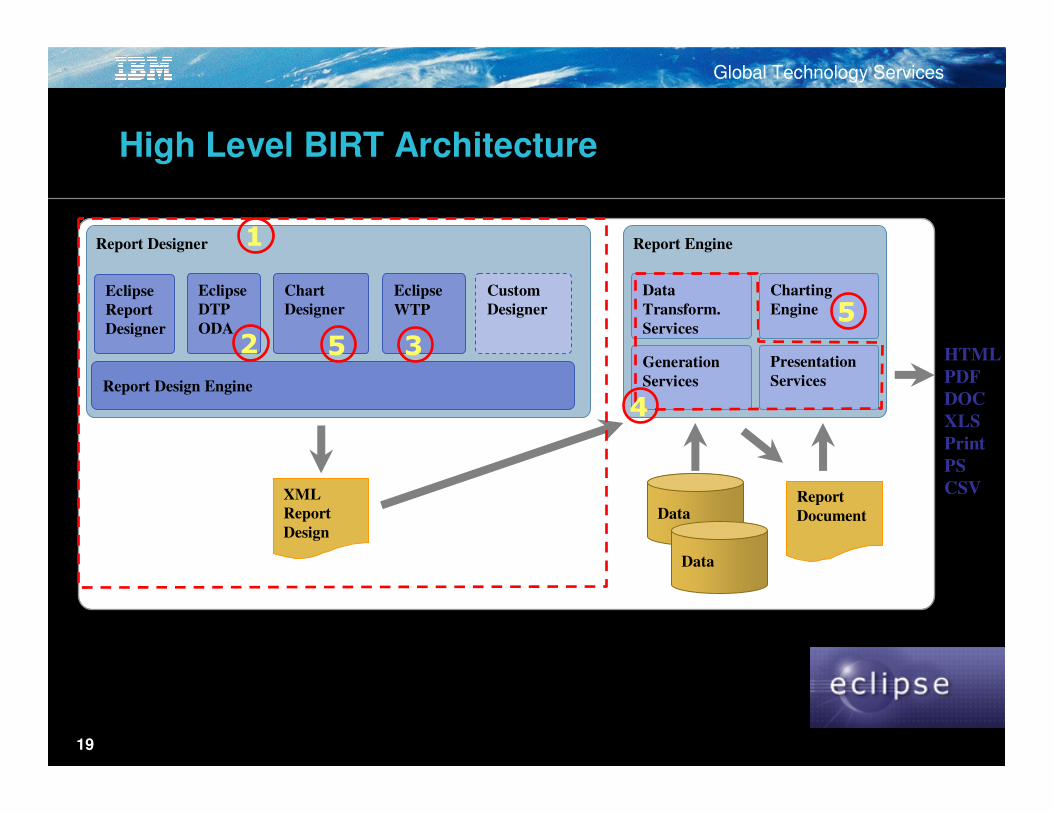
High Level BIRT Architecture
Report Designer
Report Design Engine
XML
Report
Design
HTML
DOC
XLS
PS
CSV
Report Engine
Presentation
Services
Generation
Services
Data
Transform.
Services
4
Report
DocumentData
Data
Custom
Designer
1
Charting
Engine 5
Eclipse
DTP
ODA
2
Eclipse
WTP
3
Chart
Designer
5
Eclipse
Report
Designer

Global Technology Services
20 6-May-09
BIRT Designer Workbench

Global Technology Services
21 6-May-09
BIRT Views
Navigator
� Navigates through Eclipse projects and files under those projects
� Allows user to run report inside of BIRTOutline
� Provides hierarchy of current report
� Allows for easy navigation of report elements to change properties in the property pane
� When selecting libraries, use the outline to copy non-visual components such as data sources and sets
Palette
� Contains a number of visual elements used in BIRT report designs
� Similar to Toolboxes in MS Visual Studio and other visual IDE
Data Explorer
� Data Sources: Connections to database.
� Data Sets: Same as a Recordset. Allows users to navigate through Query Results.
� Report Parameters: Used as the interface for report parameters that will be passed to a Data Set.

Global Technology Services
22 6-May-09
BIRT Report Designer
� Area where report layout is designed, previews of the report are seen, scripts and events are coded, and XML source for report can be viewed.
� Properties for BIRT objects can be modified, such as Data Set Binding, Font information, formatting for Data Set returns such as Row Highlighting and Color Alternation.

Global Technology Services
2323
Example Report for Storage Pools Volume Occupation

Global Technology Services
2424
Some preparations
� Database needed to store TSM data points
� Extract mechanism to regularly extract data
� Here we „mirrored“ the TSM database on a daily basis by extracting via „select *“ on each table

Global Technology Services
2525
BIRT Links
� Home of BIRT Project http://www.eclipse.org/birt
� BIRT World http://birtworld.blogspot.com/
� BIRT Exchange http://www.birt-exchange.com/

Global Technology Services
2626
Meanwhile...
what is Tivoli doing...?

Global Technology Services
TSM Real-Time Monitoring and Reporting
� Integrated, common-reporting engine that integrates to IBM Tivoli Monitoring (ITM) and Tivoli Data Warehouse (TDW)
� Uses an agent to communicate with the TSM server and extract data from the TSM database and return this data to the ITM server to be stored in the TDW database
� ITM will act as a monitoring application while the Tivoli CommonReporting (TCR) portion of ITM will report on the retrieved data
� TCR uses the Eclipse/BIRT (open-source) engine to report on the data using customized and standardized reporting templates provided by TCR and customized by IBM
27

Global Technology Services
28
Tivoli solution – Tivoli Common Reporting (TCR)
� Comes from Tivoli Monitoring (ITM)
� Shared across Tivoli Portfolio
� Web Server based
� Agents needed
� Leverages BIRT
28

Global Technology Services
FAQ’s
29
� How does a user see Reporting and Monitoring?
� -Reporting GUI is the TSM Admin Center� -Monitoring GUI is TEP
� Can Monitoring be installed without Reporting?� -Yes
� Can Reporting be installed without Monitoring?� -No
� Is it supported and downloadable for TSM 5.x Servers ?� -Yes
� Can it be installed on the TSM Server ?� -For TSM 5.x: Yes, but not recommended, due to resource consumption� -For TSM 6.1: No, not supported, due to conflicting DB2 Versions� -We recommend to install the standard TSM Admin Center and Reporting/Monitoring on the� same server to manage multiple mixed TSM Servers
� Is it all in one installation package?� -Yes, all required components (ITM,TEP,DB2, TSM Admin Center…)will automatically install
� What about the old TSM ‘Operational Reporting’?� -It will be discontinued – changes to TSM 6.1 are not compatible with Operational Reporting
� Is scheduling build-into the product?� -Not yet, it is under consideration for future releases
29

Global Technology Services
FAQ’s
30
� Do I need extra licenses?
� -No, it is part of TSM Base/EE
� Do I need to write my own Monitors or Reports?
� -No, we deliver pre-configured Monitors and pre-defined Reports
� Can I write my own reports?
� -Yes, they can be developed with BIRT using Eclipse 3.3.1.1
� Can customers write their own reports?
� -Yes, but we recommend a service engagement, since BIRT is not trivial
� Can customers customize their own Monitors?� -Yes, it’s very easy in TEP
� Does it plug-into an existing ITM installation?
� -Yes, you can see TSM Monitoring as well as all other ITM Monitors (licensing required)
� Does it plug into an existing TSM Admin Center Installation?
� -Yes, we recommend to use one server for managing/reporting/monitoring TSM. It plugs into TSM 6.1 Admin Center only.
� Can I monitor and report on multiple TSM Servers?
� -Yes, you can even monitor and report on different TSM versions
30

Global Technology Services
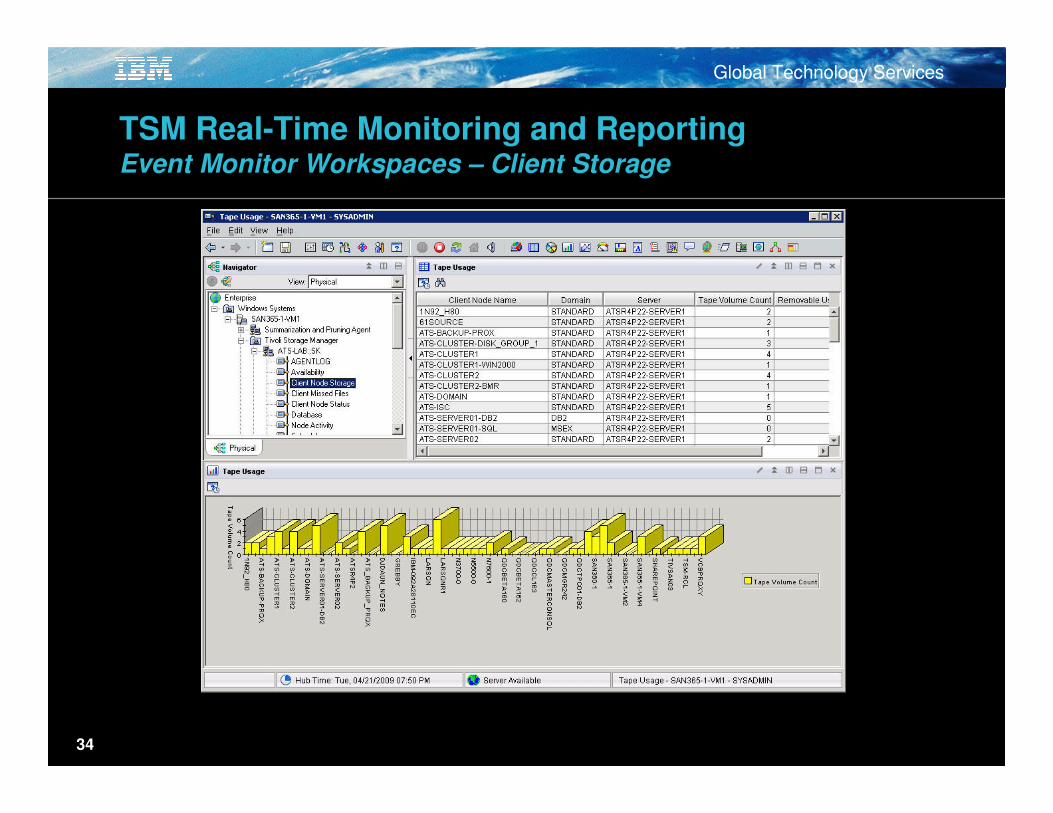
TSM Real-Time Monitoring and Reporting Using the Event Monitor
� ITM workspaces are presented on the Tivoli Enterprise Portal foundation. A number of workspaces are delivered with the TSM reporting solution. These workspaces are easily selected from a list of workspaces in the TEP console. Once selected, each workspace will communicate with the TSM agent to retrieve and present data to the user from the selected TSM server.
� Use the TEP application as installed (there is an icon on the desktop) or the TEP can be accessed via a web browser
31

Global Technology Services
TSM Real-Time Monitoring and Reporting Event Monitor Workspaces – Client Storage
32

Global Technology Services
TSM Real-Time Monitoring and Reporting Event Monitor Workspaces – Client Storage
33
Global Technology Services
TSM Real-Time Monitoring and Reporting Event Monitor Workspaces – Client Storage
34

Global Technology Services
TSM Real-Time Monitoring and Reporting Event Monitor Workspaces – Client Backups
35

Global Technology Services
TSM Real-Time Monitoring and Reporting Event Monitor Workspaces – Client Status
36

Global Technology Services
TSM Real-Time Monitoring and Reporting Event Monitor Workspaces – Server Database
37

Global Technology Services
TSM Real-Time Monitoring and Reporting Event Monitor Workspaces – Server Storage Pools
38

Global Technology Services
TSM Real-Time Monitoring and Reporting Event Monitor Workspaces – Server Processes
39

Global Technology Services
TSM Real-Time Monitoring and Reporting Event Monitor Workspaces – Server Tape Drives
40

Global Technology Services
TSM Real-Time Monitoring and Reporting Event Monitor Workspaces – Server Tape Volumes
41

Global Technology Services
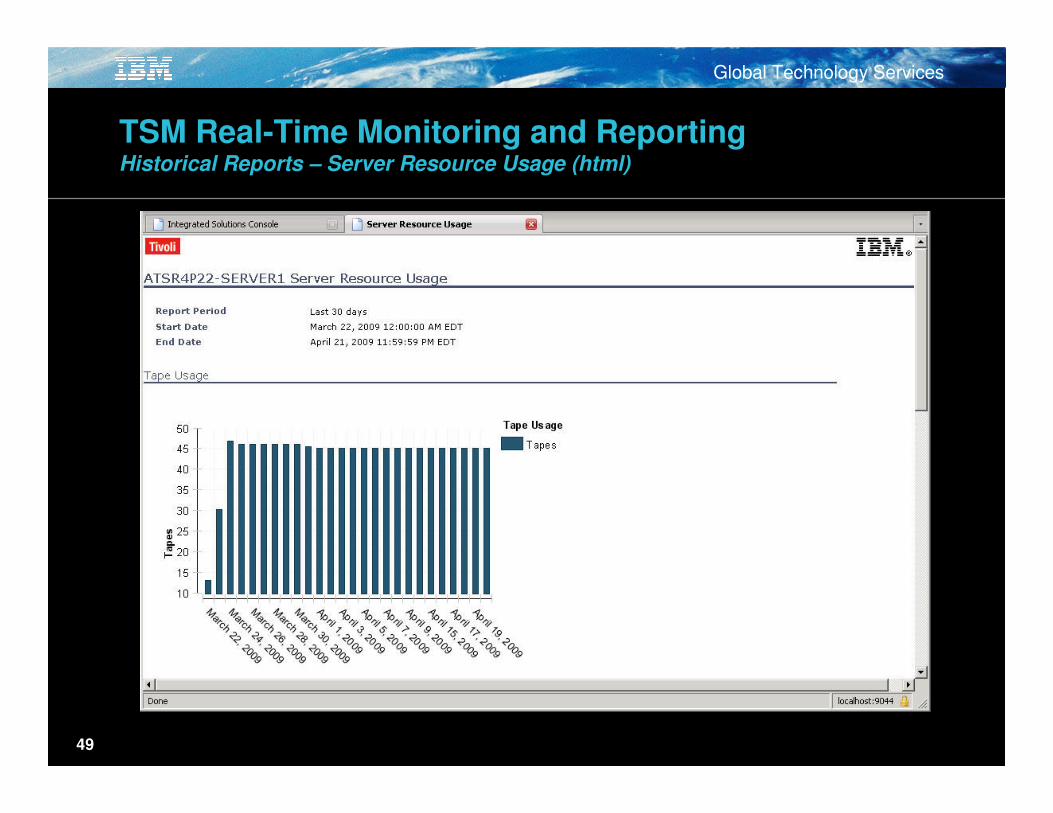
TSM Real-Time Monitoring and Reporting Using the Reporting Feature
� To start TCR, the user will point their browser to a URL in the same way as the user points to the Admin Center URL. ISC will request a userid and password to access the TCR product.
� The user will be presented, after login, a list of reports available to them in the ISC navigation tree. They will select each report which will then be displayed to them in the ISC console.
42

Global Technology Services
TSM Real-Time Monitoring and Reporting Using the Reporting Feature
� Reports can be generated in HTML, PDF, Excel or Adobe PostScript format
43

Global Technology Services
TSM Real-Time Monitoring and Reporting Using the Reporting Feature
� Each report presents a parameter input window. Parameters are specific to the individual report.
� Click “Run” to generate the report
44

Global Technology Services
TSM Real-Time Monitoring and Reporting Historical Reports – Client Backups (html)
45

Global Technology Services
TSM Real-Time Monitoring and Reporting Historical Reports – Client Backup Status (Excel)
46

Global Technology Services
TSM Real-Time Monitoring and Reporting Historical Reports – Client Schedule Status (html)
47

Global Technology Services
TSM Real-Time Monitoring and Reporting Historical Reports – Server Activity (html)
48
Global Technology Services
TSM Real-Time Monitoring and Reporting Historical Reports – Server Resource Usage (html)
49

Global Technology Services
TSM Real-Time Monitoring and Reporting Historical Reports – Report Snapshots
� Report Snapshots preserve a particular report with certain parameter settings.
50

Global Technology Services
TSM Real-Time Monitoring and Reporting Customizing the Historical Reports Using BIRT
� To create your own custom reports using BIRT and Tivoli Common Reporting from your data that is stored in Tivoli Data Warehouse, complete the following steps:
� Download and install BIRT, version 2.2.1, All-In-One software using one of the following Web sites:
� Go to the following IBM Tivoli Open Process Automation Library (OPAL) Web site for the BIRT software that you need to download and install:http://www.ibm.com/software/brandcatalog/portal/opal/details?catalog.label=1TW10OT02
� If you cannot access OPAL, go to the following BIRT Web site:http://download.eclipse.org/birt/downloads/index2.2.2.php
� Import the data, configure the data source, and customize the reports following the directions in the Customizing Tivoli Common Reporting Report Designs document found at:http://www.ibm.com/developerworks/tivoli/library/t-tcr/ibm_tiv_tcr_customizing_report_designs.pdf
51

Global Technology Services
5252
Global Technology Services
54
Global Technology Services
6-May-09
Disclaimer
55
No part of this document may be reproduced or transmitted in any form without written permission from IBM Corporation.
Product data has been reviewed for accuracy as of the date of initial publication. Product data is subject to change without notice. This information could include technical inaccuracies or typographical errors. IBM may make improvements and/or changes in the product(s) and/or program(s) at any time without notice. Any statements regarding IBM's future direction and intent are subject to change or withdrawal without notice, and represent goals and objectives only.
The performance data contained herein was obtained in a controlled, isolated environment. Actual results that may be obtained in other operating environments may vary significantly. While IBM has reviewed each item for accuracy in a specific situation, there is no guarantee that the same or similar results will be obtained elsewhere. Customer experiences described herein are based upon information and opinions provided by the customer. The same results may not be obtained by every user.
Reference in this document to IBM products, programs, or services does not imply that IBM intends to make such products, programs or services available in all countries in which IBM operates or does business. Any reference to an IBM Program Product in this document is not intended to state or imply that only that program product may be used. Any functionally equivalent program, that does not infringe IBM's intellectual property rights, may be used instead. It is the user's responsibility to evaluate and verify the operation on any non-IBM product, program or service.
THE INFORMATION PROVIDED IN THIS DOCUMENT IS DISTRIBUTED "AS IS" WITHOUT ANY WARRANTY, EITHER EXPRESS OR IMPLIED. IBM EXPRESSLY DISCLAIMS ANY WARRANTIES OF MERCHANTABILITY, FITNESS FOR A PARTICULAR PURPOSE OR INFRINGEMENT. IBM shall have no responsibility to update this information. IBM products are warranted according to the terms and conditions of the agreements (e.g. IBM Customer Agreement, Statement of Limited Warranty, International Program License Agreement, etc.) under which they are provided. IBM is not responsible for the performance or interoperability of any non-IBM products discussed herein.
Information concerning non-IBM products was obtained from the suppliers of those products, their published announcements or other publicly available sources. IBM has not tested those products in connection with this publication and cannot confirm the accuracy of performance, compatibility or any other claims related to non-IBM products. Questions on the capabilities of non-IBM products should be addressed to the suppliers of those products.


