1 Consumer acceptance of edible insects A value proposition development for the case of an entomology-based venture Laura Capponi - 911204155030 Supervisor: Valentina Materia Co-supervisor: Anita Linnemann Management Studies Group Food Quality and Design Group Wageningen University, January 2016
Transcript
1
Consumer acceptance of edible insects A value proposition development for the case of an entomology-based venture
Laura Capponi - 911204155030
Supervisor: Valentina Materia Co-supervisor: Anita Linnemann Management Studies Group Food Quality and Design Group
List of Figures........................................................................................................................................ 7
List of Tables ......................................................................................................................................... 8
1. Introduction ...................................................................................................................................... 9 1.1 Background and selected problem .............................................................................................................................. 9 1.2 The case of Jumping Jack Snacks ............................................................................................................................... 11
2. Literature ........................................................................................................................................ 12 2.1 Edible insects and the state of the art ....................................................................................................................... 12 2.2 Entrepreneurship, radical innovation and consumers’ voice ..................................................................................... 16 2.3 Consumer driven product development and value propositions ............................................................................... 18 2.4 Theoretical framework .............................................................................................................................................. 22 2.5 Conclusions based on literature ................................................................................................................................ 22
3. Problem Analysis and Research Design .......................................................................................... 23 3.1 Problem definition and research questions ............................................................................................................... 23
3.1.1 Objective in relation to the problem ................................................................................................................. 23 3.1.2 Objective in relation to the research project ..................................................................................................... 23 3.1.3 Main question ................................................................................................................................................... 23 3.1.4 Sub-questions .................................................................................................................................................... 23
3.2 Research materials .................................................................................................................................................... 24 3.3 Research framework ................................................................................................................................................. 24 3.4 Research strategy and methodology ......................................................................................................................... 24
3.4.1 Qualitative research .......................................................................................................................................... 25 3.4.2 Quantitative research ....................................................................................................................................... 26
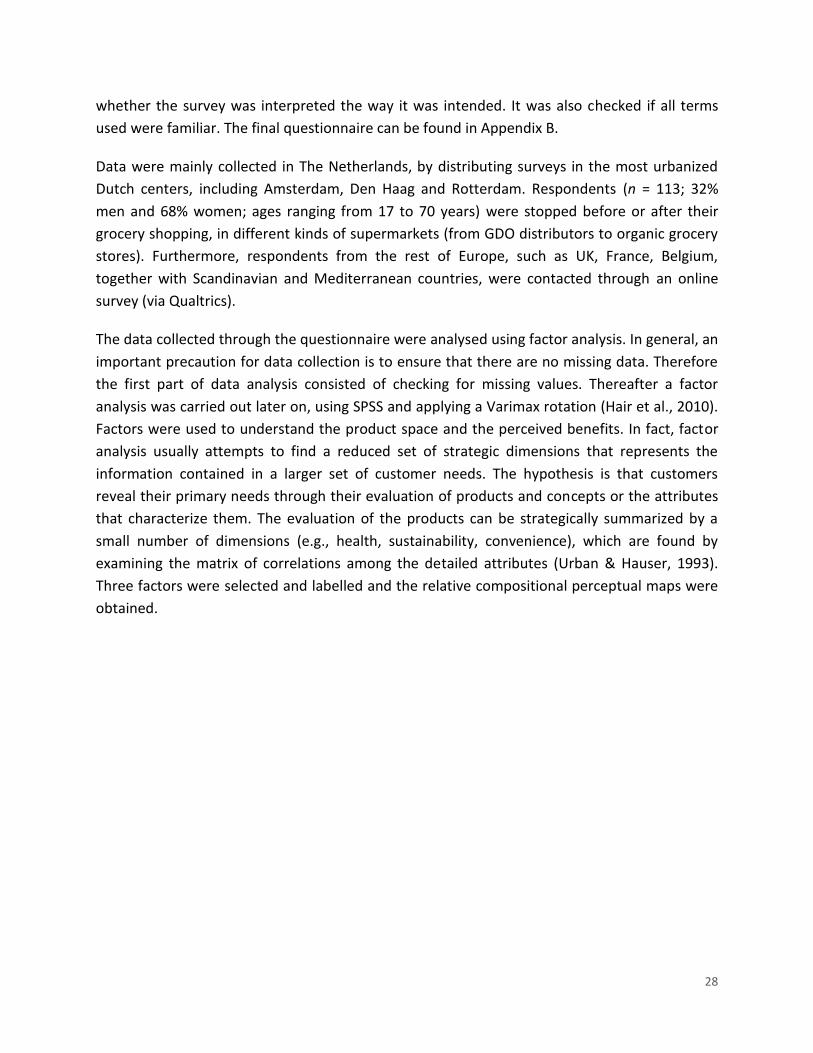
4.1.1 The Hierarchical Value Map .............................................................................................................................. 29 4.1.2 Attribute and product set definition for questionnaire ..................................................................................... 30
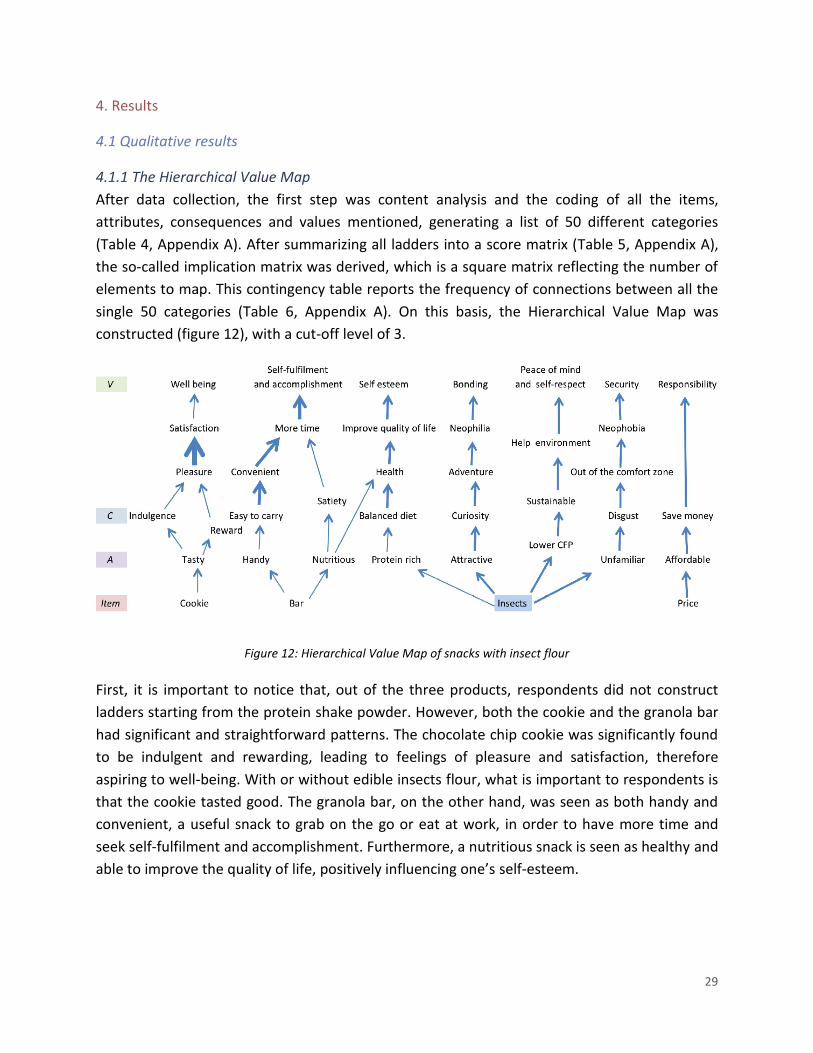
4.2 Quantitative results ................................................................................................................................................... 31 4.2.1 Factor analysis over the whole sample ............................................................................................................. 33 4.2.2 Respondent segmentation based on FNS .......................................................................................................... 36
5. Discussion ....................................................................................................................................... 38 5.1 Attributes and product appropriateness ................................................................................................................... 38 5.2 Two potential strategies for value creation .............................................................................................................. 40
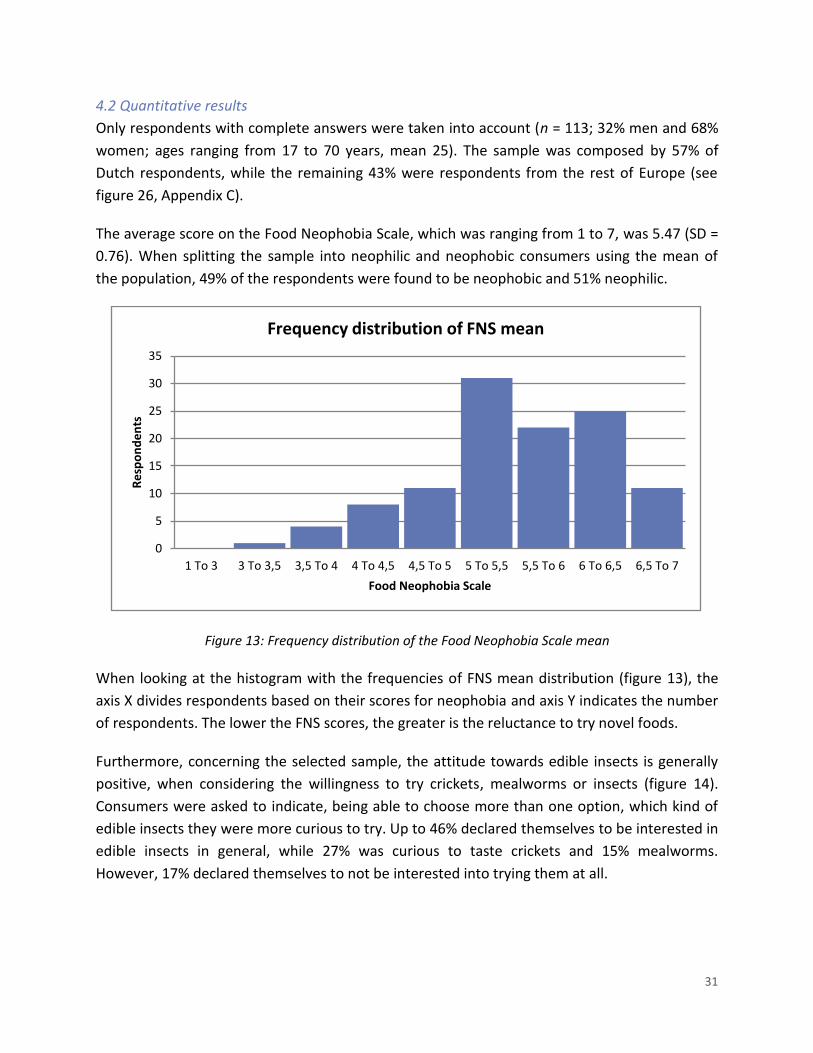
5.2.1 The rational strategy......................................................................................................................................... 41 5.2.2 The sensory strategy ......................................................................................................................................... 44
6.3 Suggestions for further research ............................................................................................................................... 48 6.4 Recommendations for the company ......................................................................................................................... 49
Appendix A ......................................................................................................................................... 55
Appendix B .......................................................................................................................................... 61
Appendix C .......................................................................................................................................... 68
4
Abstract
Jumping Jack Snacks is an entomology-based venture, founded in 2015 and still in its seed
stage. With the desire to scale up production, the start-up wants to create a thorough value
proposition based on the significantly accepted attributes and multisensory characteristics for
its products to be appealing to consumers. It is important to match the most appropriate type
of product with the right set of brand values. Therefore, this study intends to determine what
are the significantly accepted product attributes and to advise the Jumping Jack team on its
value proposition strategy.
After a preliminary desk search, a two-step study was carried out amongst European
consumers. In-depth laddering interviews were followed by a quantitative survey, allowing
discrimination between advantages and disadvantages of a product-set and the understanding
of consumer acceptance dynamics. Food Choice Motives questionnaire and Food Neophobia
Scale were applied.
Visibility, sweetness, perceived healthiness, sensorial attractiveness of the matrix and
convenience are all attributes and benefits to be taken into account. Two potential strategies
for value creation emerged from the study: one is rationally-oriented, with a focus on healthy
and balanced snacks rich in proteins; the other is a sensory strategy, focused on tasty treats
being indulgent, highly attractive and with the unconventional, adventurous twist of insects.
For both options it is important to use only flour and not visible insects, thus maximizing
acceptance of neophobic consumers.
Jumping Jack Snacks should pursue the sensory strategy, but after basing the final decision on
the additional variables of its business model.
Keywords: edible insects, radical innovation, entrepreneurship, consumer driven new product
development, food neophobia, food choice motives
5
Executive Summary
Nowadays a new generation of chefs, farmers and sustainability experts is embracing the
thought that insects belong to the future of food. In fact, a considerable number of start-ups,
from the USA to Europe, are taking chances and exploring the opportunities brought to the fore
by entomophagy.
Jumping Jack Snacks is one of these several entomology-based ventures. Founded in April 2015
and located in the Netherlands, the company saw a consistent market opportunity and the
potential of insects as a wholesome snack. However, having the desire to scale up production, it
is necessary to create a thorough value proposition and to understand what are the suitable
attributes and multisensory characteristics for the product to be appealing to consumers.
Furthermore, it is important to match the most appropriate type of product with the right set
of brand values. The aim of this study is therefore to determine which are the significantly
accepted attributes and advise the Jumping Jack team over its value proposition strategy.
After a preliminary desk search on the state of the art of edible insects, novel foods and
consumer driven product development, a two-step study was carried out amongst European
consumers. First of all, a qualitative analysis carried out through in-depth laddering interviews
provided a profound insight on the matter and helped in developing a questionnaire. Secondly,
a quantitative factor analysis allowed the researcher to discriminate between advantages and
disadvantages of a product-set and understand the dynamics of consumer acceptance. The
survey was conducted by applying factor analysis over a selected range of attributes from the
Food Choice Motives questionnaire and by segmenting consumers through the Food
Neophobia Scale. Lastly, recommendations on how to design the Value Proposition Canvas
were formulated.
The laddering interviews confirmed most of the attributes retrieved from literature, while
adding new ones on the basis of which it was possible to discriminate and develop a product-
set. Taking into account the information obtained from the state of the art and the in-depth
interviews, products were differentiated based on: the degree of healthiness and indulgence,
visibility of edible insects, the type of insects, savoury/sweetness, convenience and handiness.
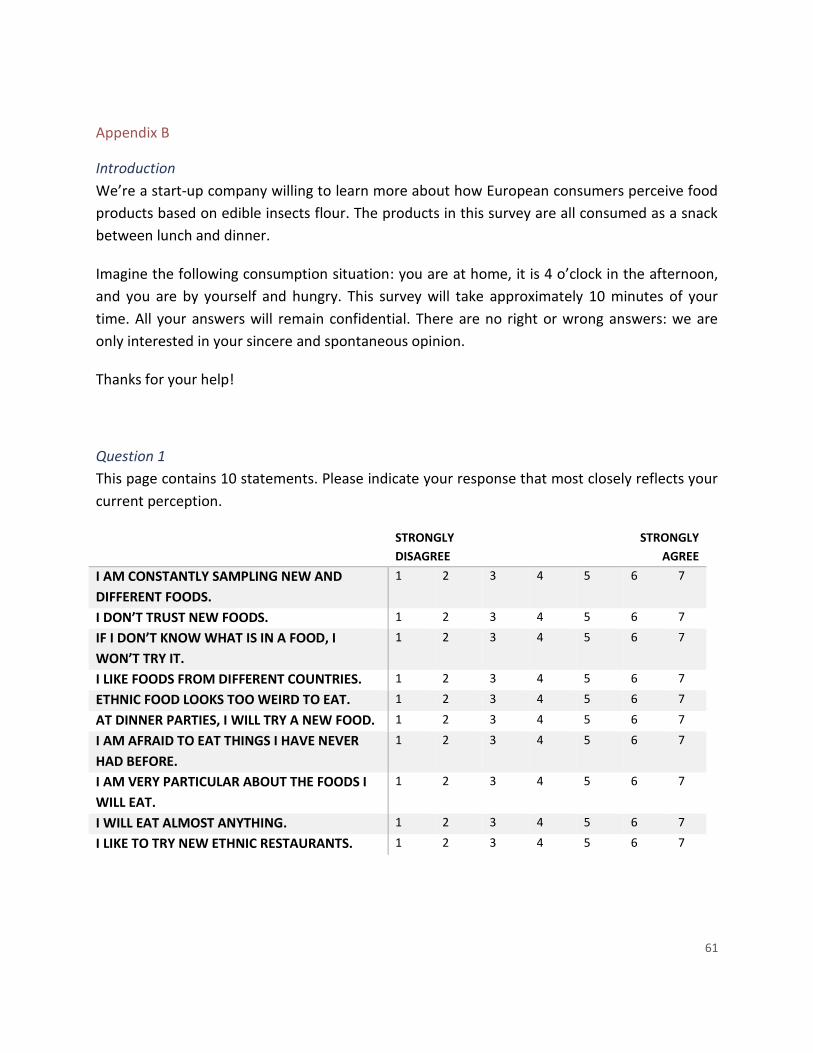
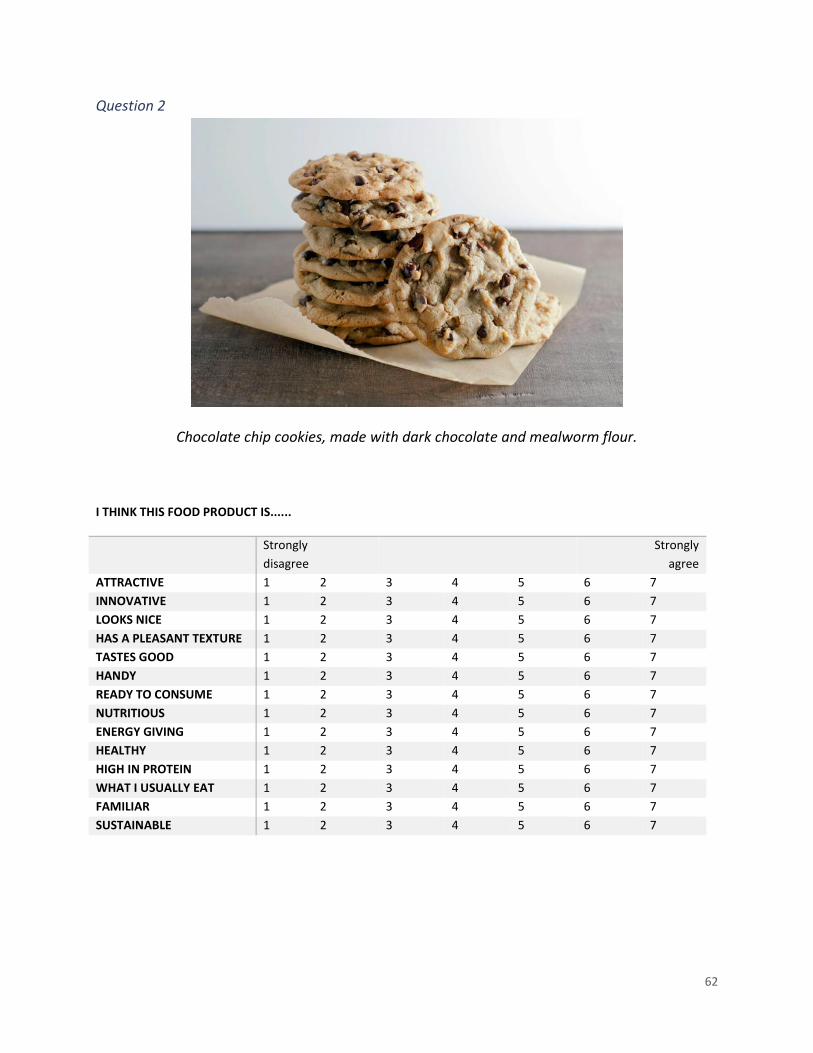
The five selected items were: chocolate chip cookies, a granola bar, tortilla chips, a protein
milkshake and a chocolate candy topped with a gold-coated cricket.
Some defined patterns emerged already during the qualitative interviews, such as the innate
preference for more familiar products like cookies and granola bars. Visibility, sweetness,
perceived healthiness, the sensorial attractiveness of the matrix, as well as convenience are all
6
attributes and benefits to be taken into account when developing the value proposition. Two
potential strategies for value creation emerged from the study: one is more of a rational
strategy, with a focus on healthy and balanced snacks rich in proteins; the other is a sensory
strategy, focused on tasty treats that are indulgent, highly attractive and with the
unconventional, adventurous twist of insects. For both options it is important to carry on the
hiding strategy, e.g. using only flour and not visible insects, with the aim to maximize
acceptance of neophobic consumers.
Jumping Jack Snacks should promptly decide for one strategy or the other and make an
informed decision based on the additional key variables of its business model. In fact, the Value
Proposition Canvas is only the first step for constructing a thorough business strategy and the
final decision has to be made considering the whole framework of the Business Model Canvas.
Either way, the firm cannot keep on using the granola bar while promoting a sensory strategy
based on indulgence, but should rather separate the two elements and choose one or the
other. Moreover, according to the state of the art, rational proofs usually barely work to drive
food choices of existing products, not to mention novel food products. Sensory strategies are
needed to promote a shift in the paradigm and the key is to convince consumers of insects’
hedonic characteristics and social acceptability. Furthermore, both the focus and the expertise
of the start-up are heading towards hedonic consumers.
The Jumping Jack team should therefore carry on its current hedonic strategy and create a
brand image and a product mix based on indulgence, uniqueness and adventurousness. This
approach has a higher potential to succeed and can be the perfect icebreaker to get Europeans
familiarized with edible insects.
7
List of Figures
Figure 1: Water requirements of livestock
Figure 2: Insects and sustainability
Figure 3: The hourglass model of how serial innovators innovate
Figure 4: The Business Model Canvas
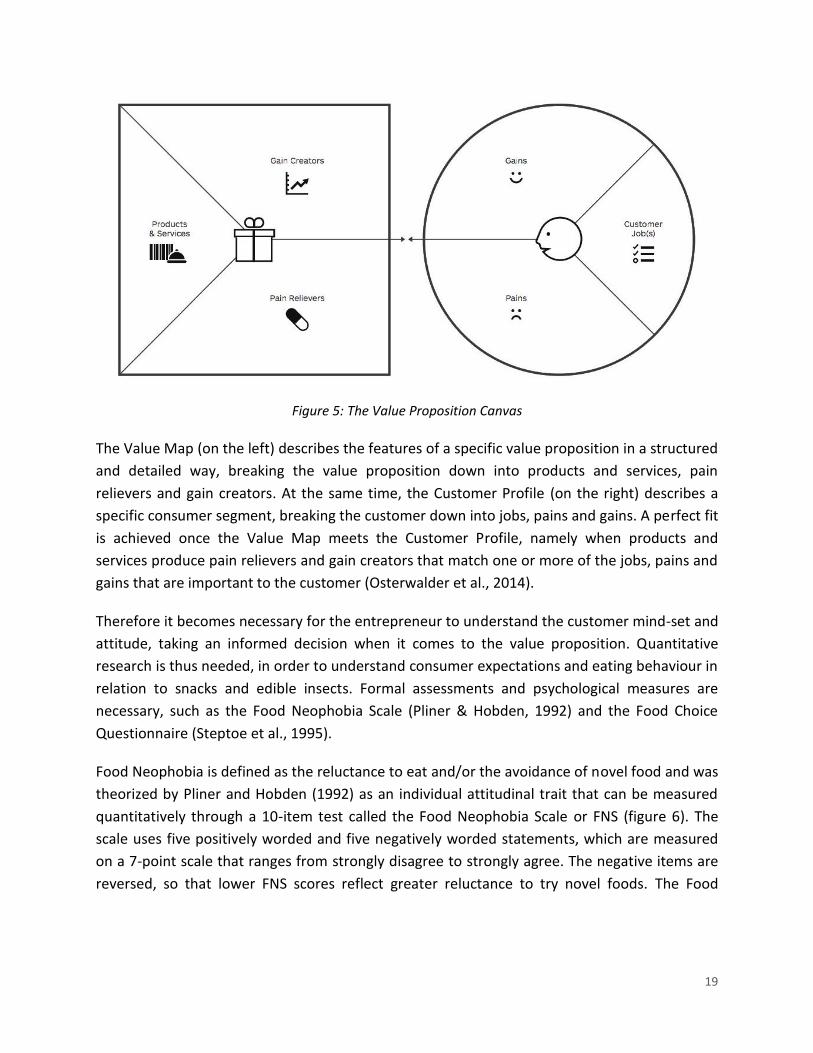
Figure 5: The Value Proposition Canvas
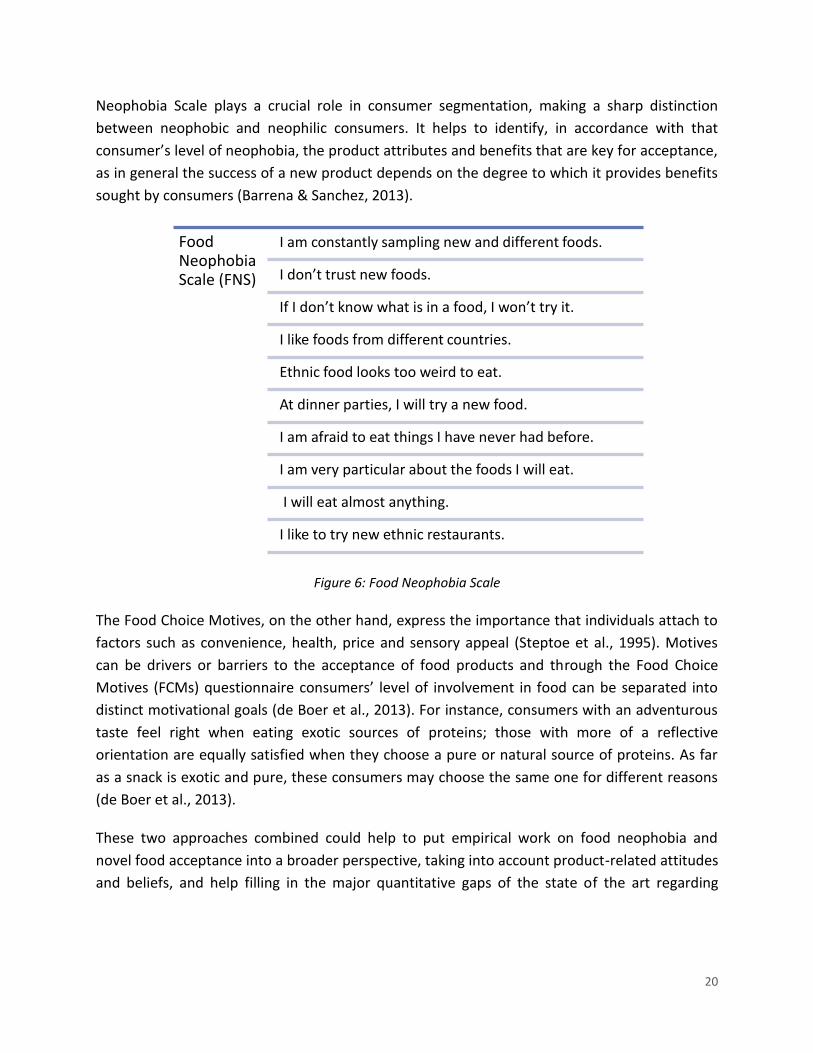
Figure 6: Food Neophobia Scale
Figure 7: The Means-end Value Chain
Figure 8: Theoretical framework
Figure 9: Research framework
Figure 10: Food products chosen for the questionnaire on insect-based snacks
Figure 11: Attributes chosen for the questionnaire on insect-based snacks
Figure 12: Hierarchical Value Map of snacks with insect flour
Figure 13: Frequency distribution of the Food Neophobia Scale mean
Figure 14: Willingness to try edible insects
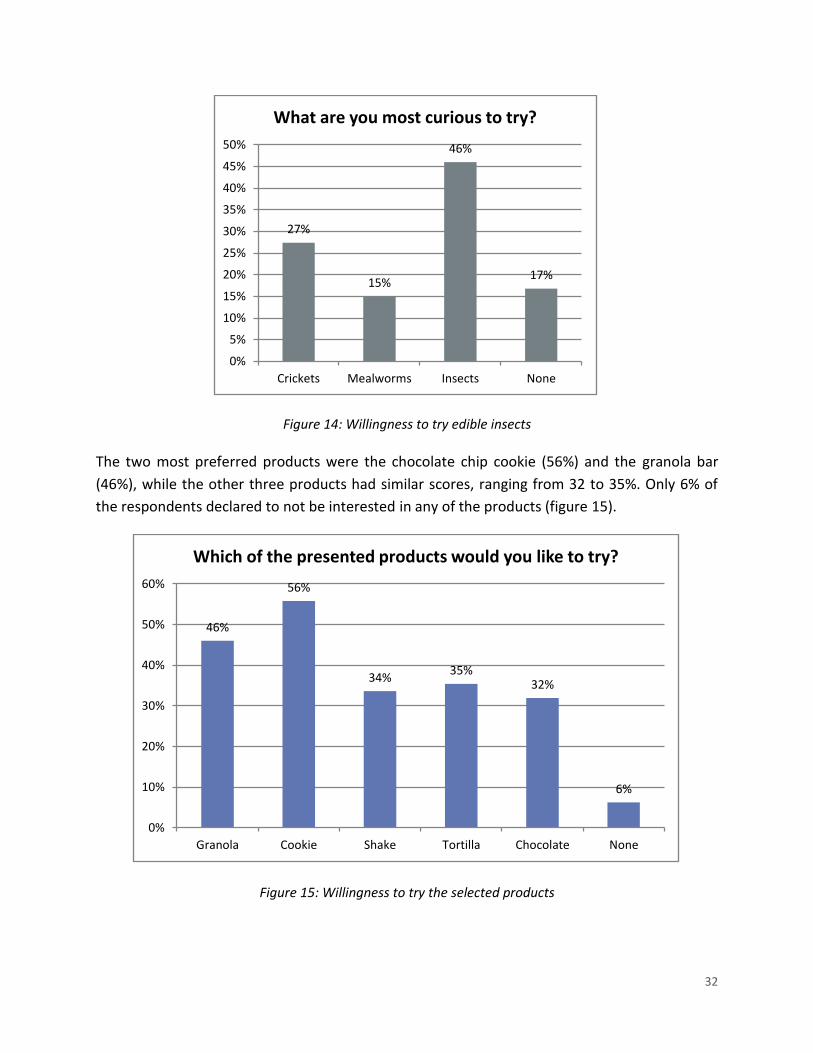
Figure 15: Willingness to try the selected products
Figure 16: Compositional perceptual map “Attractiveness over Healthiness”
Figure 17: Compositional perceptual map “Familiarity over Attractiveness”
Figure 18: Compositional perceptual maps “Familiarity over Attractiveness” for neophobic (left)
and neophilic (right) respondents
Figure 19: Compositional perceptual maps “Attractiveness over Healthiness” for neophobic
(left) and neophilic (right) respondents
Figure 20: Significant attributes influencing consumer acceptance of edible insects
Figure 21: Comparison of the advantages of the two products with the highest potential
Figure 22: Value Proposition Canvas for the rational strategy
Figure 23: Value Proposition Canvas for the sensory strategy
Figure 24: Nationality of respondents of the laddering interviews
Figure 25: Gender of respondents of the laddering interviews
Figure 26: Nationality of respondents of the survey study
Figure 27: Gender of respondents of the survey study
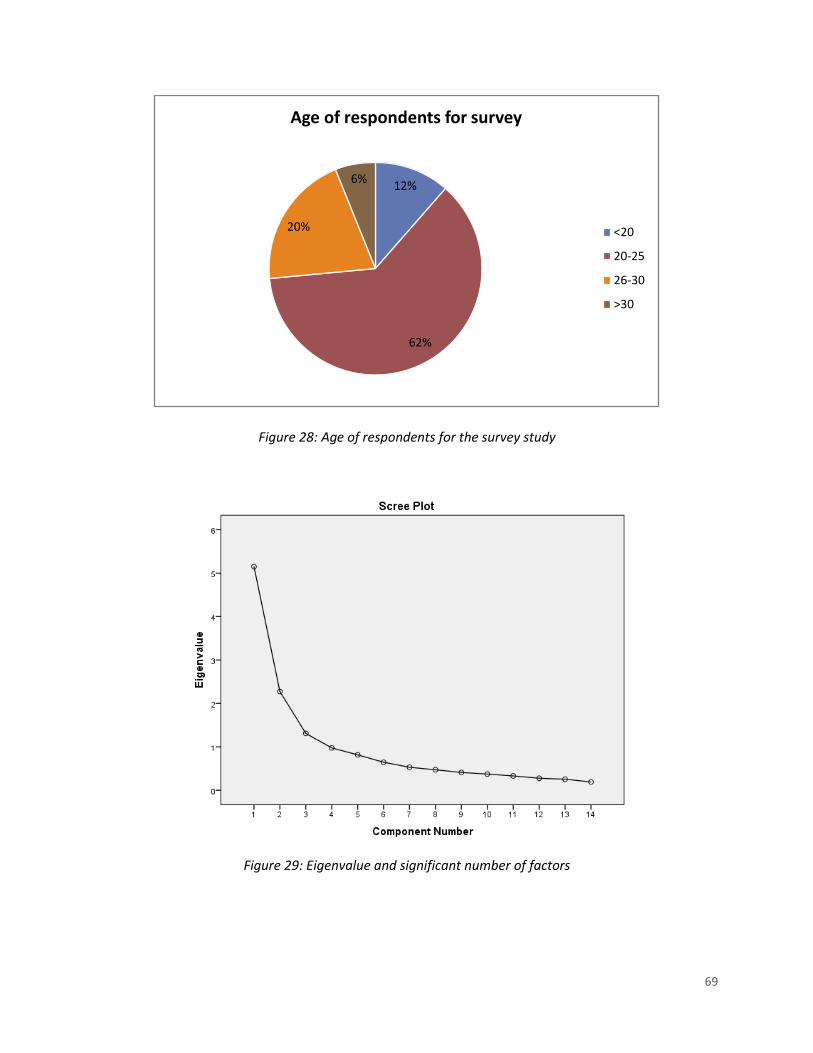
Figure 28: Age of respondents of the survey study
Figure 29: Eigenvalue and significant number of factors
8
List of Tables
Table 1: Factors, variables and labels of the selected products
Table 2: Cues and technological requirements for the granola bar with insect flour
Table 3: Cues and technological requirements for treats with insect flour
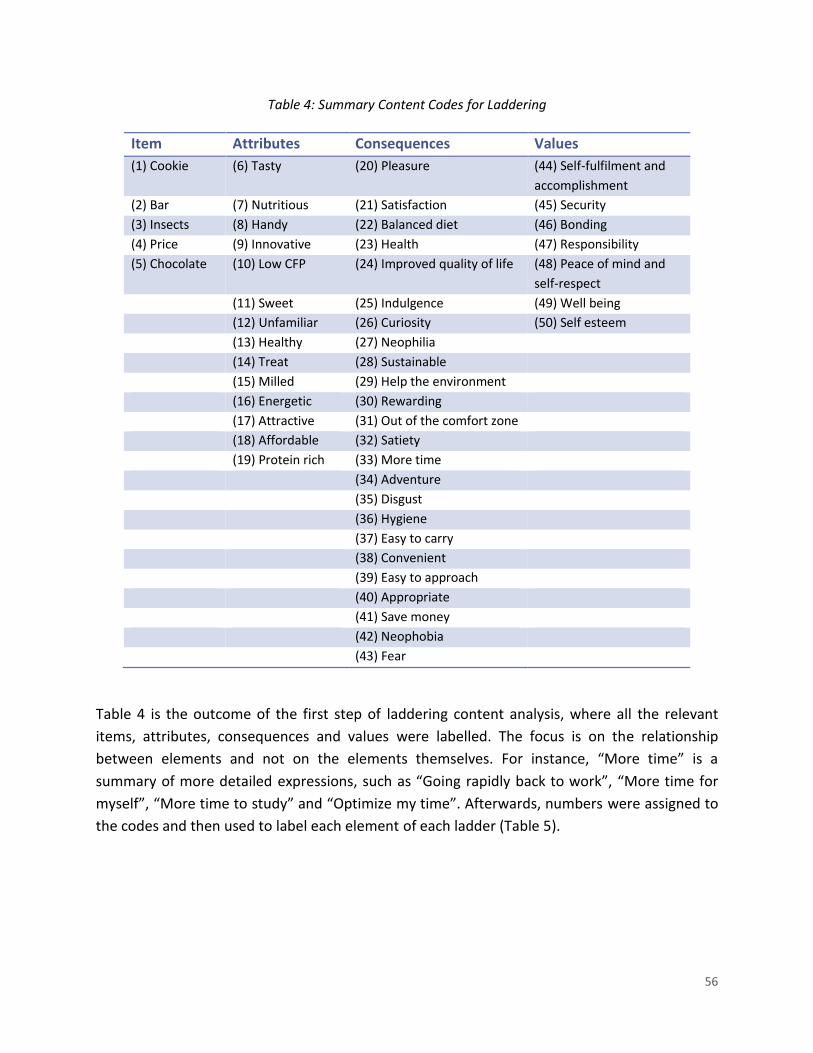
Table 4: Summary Content Codes for Laddering
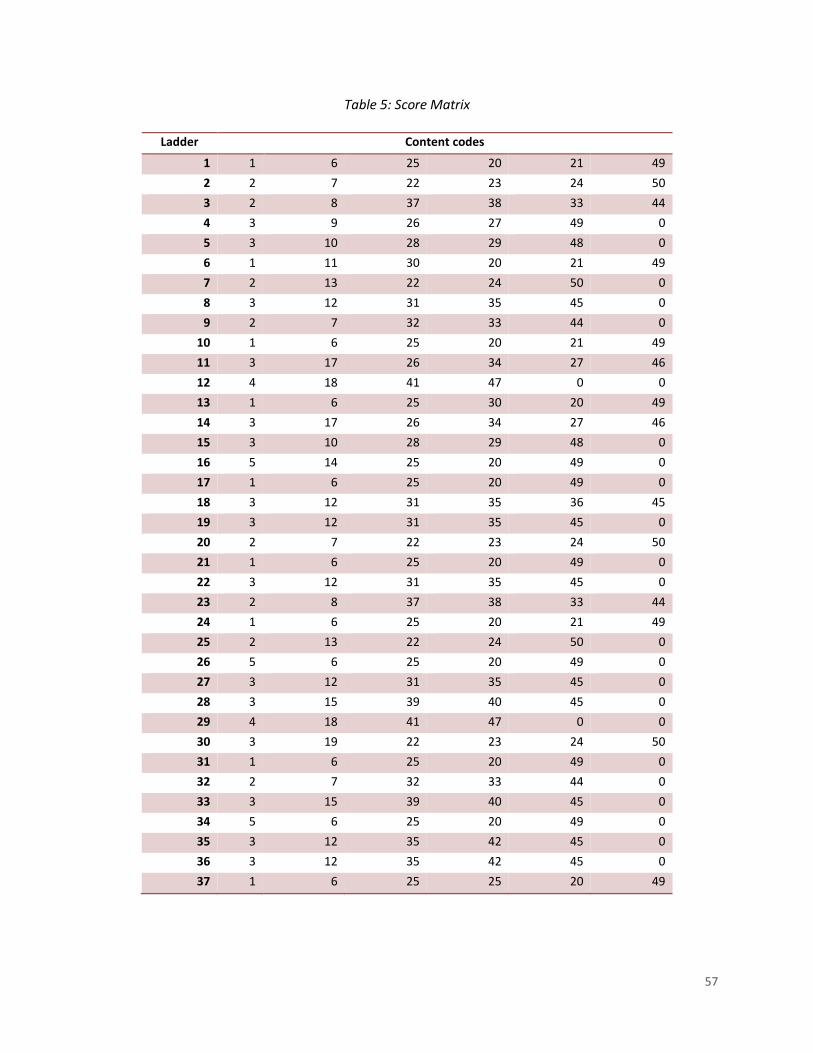
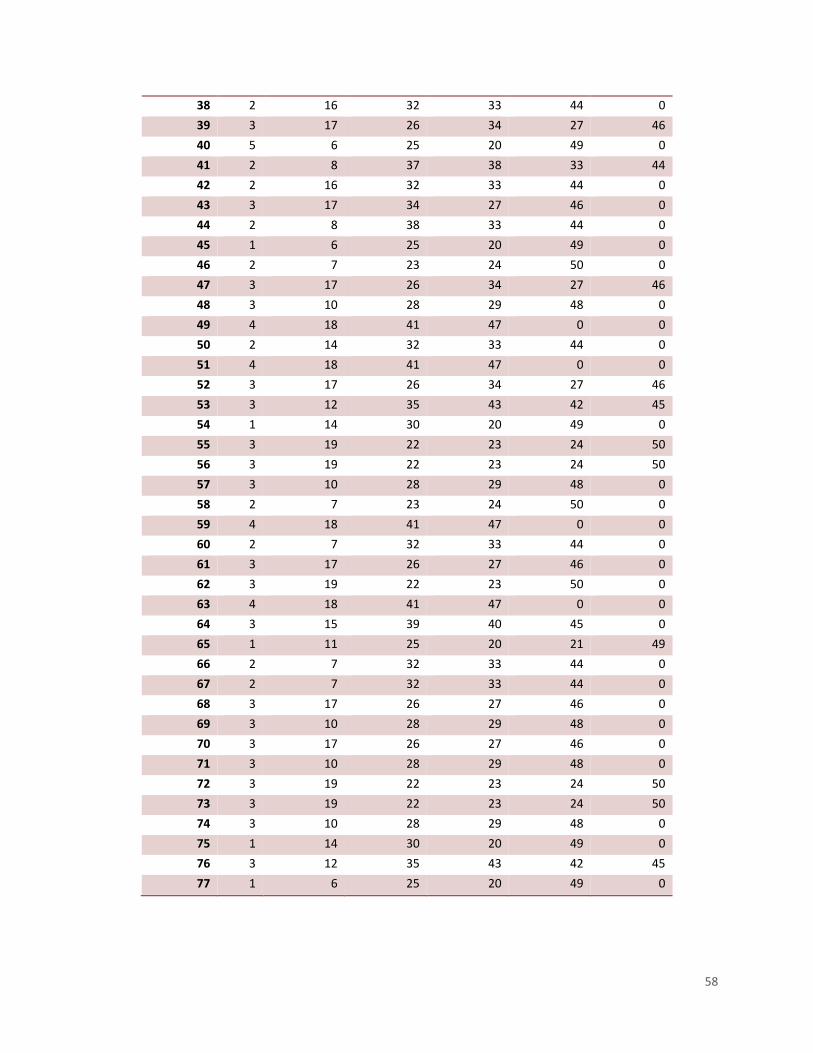
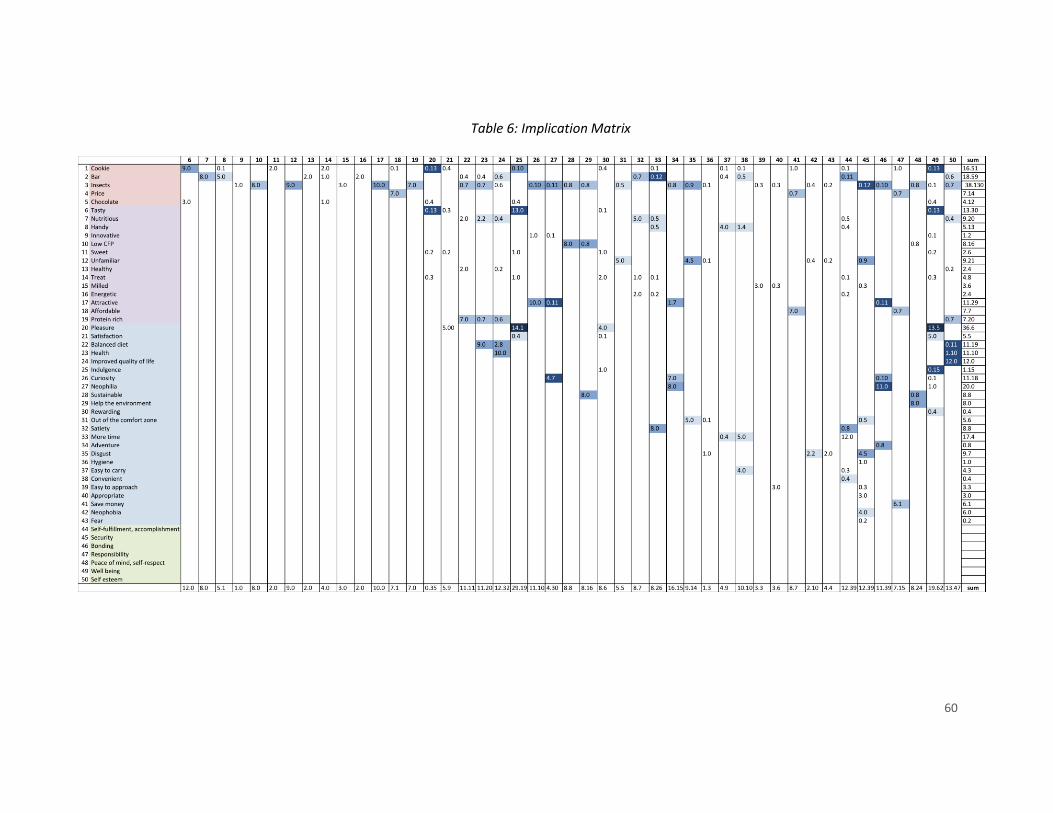
Table 5: Score Matrix
Table 6: Implication Matrix
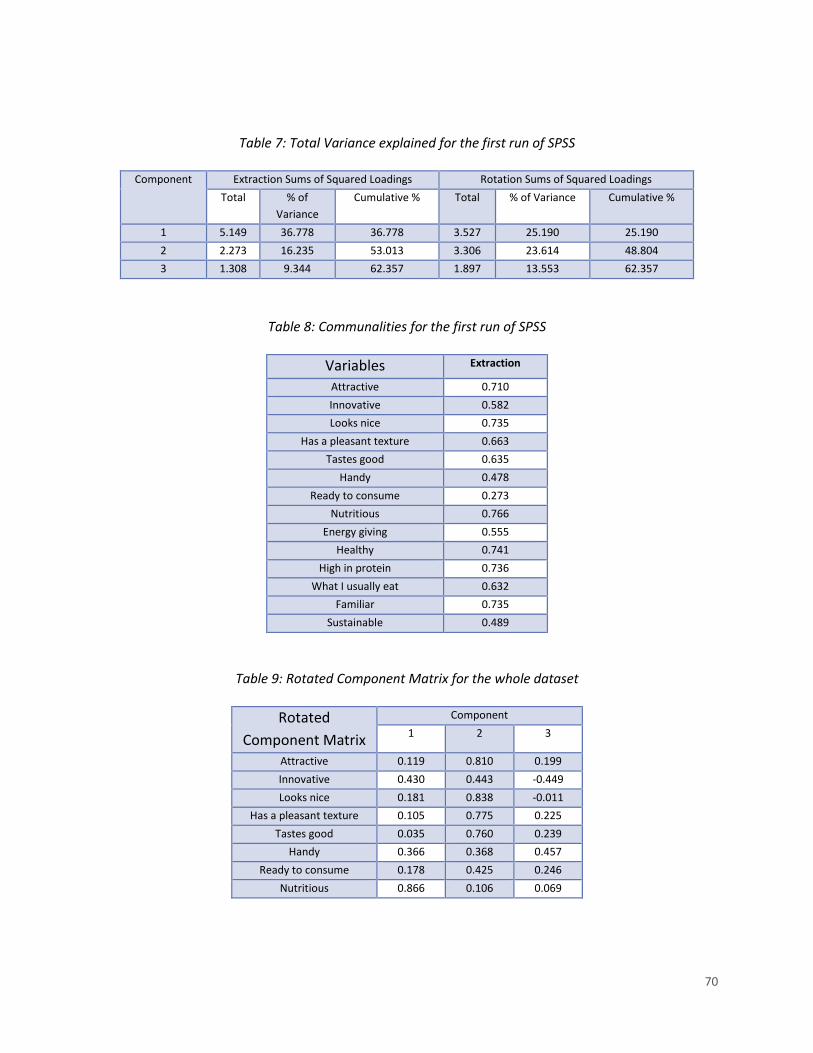
Table 7: Total Variance explained for the first run of SPSS
Table 8: Communalities for the first run of SPSS
Table 9: Rotated Component Matrix for the whole dataset
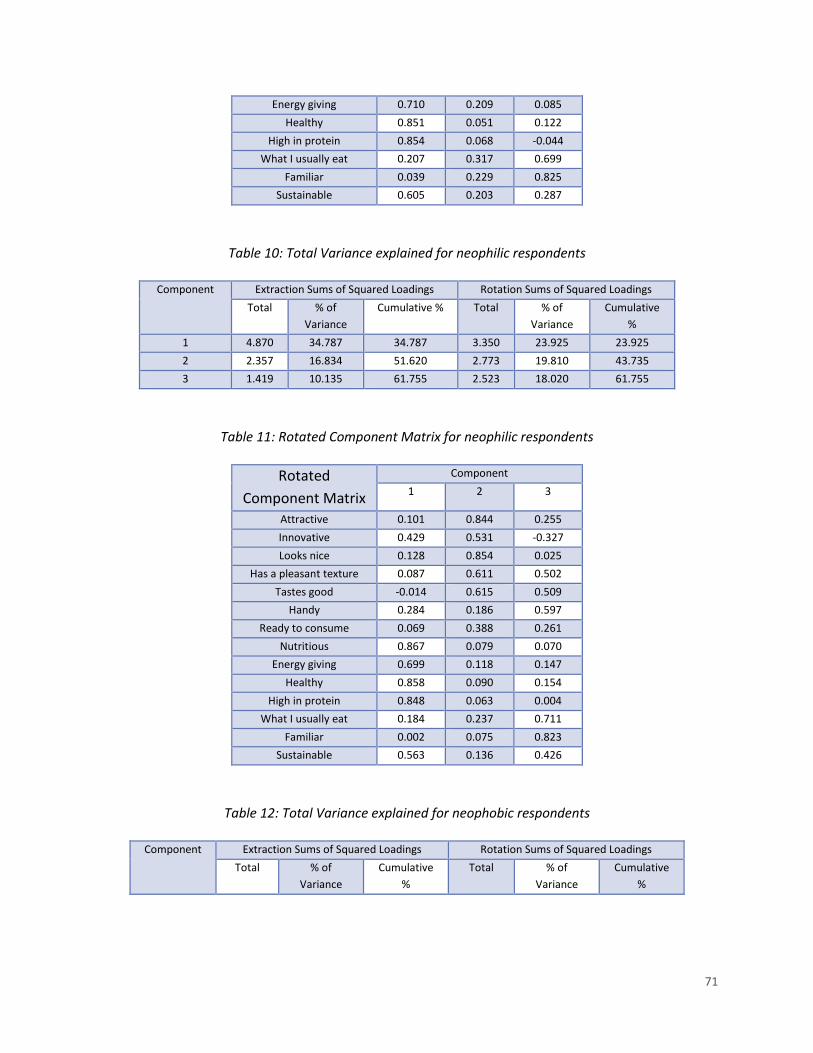
Table 10: Total Variance explained for neophilic respondents
Table 11: Rotated Component Matrix for neophilic respondents
Table 12: Total Variance explained for neophobic respondents
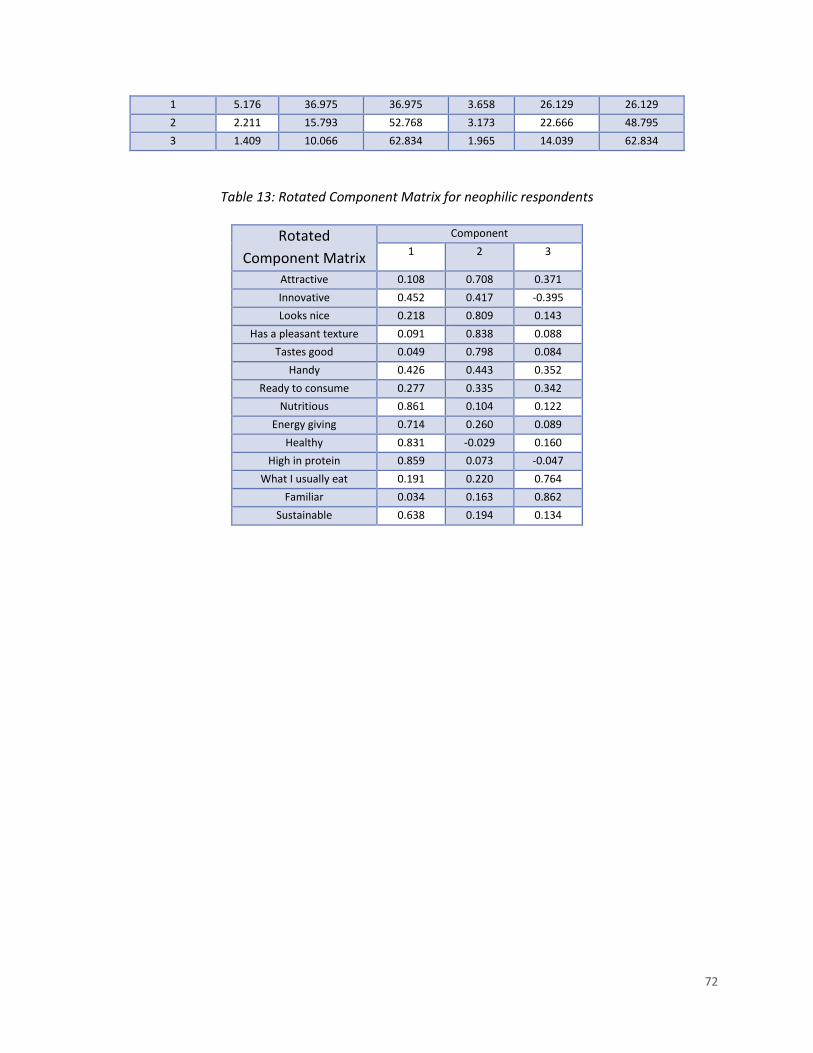
Table 13: Rotated Component Matrix for neophilic respondents
9
1. Introduction
1.1 Background and selected problem
Nowadays a new generation of chefs, farmers and sustainability experts is embracing the
thought that insects belong to the future of food. In fact, edible insects are thought of as a
sustainable source of protein, due to their low requirements of feed, water and land.
Insects do have a high feed-conversion rate (van Huis,
2013), so much that crickets can convert feed mass into
increased body mass much more efficiently than cattle
(namely sixfold), poultry or pigs (more precisely, twice as
high). Furthermore, edible insects can be reared on
organic side streams, adding value to waste while
reducing environmental contamination. The same goes
for the water requirement, a key determinant of land
productivity (figure 1). One kg of beef does in fact require
22,000 litres of water, in the best-case scenario, compared
with the single litre needed for rearing 1 kg of crickets.
Lastly, insects emit 80 percent less methane than cattle
(figure 2) and provide twice as much protein as chicken and beef (Chemnitz et al., 2014).
Another benefit to keep in mind when considering edible
insects is their outstanding nutritional profile, due to the
presence of proteins, unsaturated fats and fibre. Insects
are also rich in lysine, threonine and tryptophan amino
acids (Bukkens, 2005), as well as in micronutrients, such as
iron, zinc, calcium and vitamins. They are also particularly
rich in chitin, an insoluble fibre derived from their
exoskeleton, which has been found to improve immune
responses in humans and decrease allergies (Goodman,
1989).
Entomophagy is uncommon only in Western societies, as already 80% of the world considers
insects as part of its diet. However, insect harvesting has been associated with the hunter-
gatherer era and therefore thought of as something primitive (van Huis, 2013). The average
assumption is that even those remote primitive tribes consume insects only as a last resort, and
many more other common myths stand around this practice.
Figure 1: Water requirements of livestock
Figure 2: Insects and sustainability
10
Are these arguments sufficient to drive a change through the European diet yet? Sustainability,
nutrition and exemplarity are all rational proofs, which usually barely work to drive food
choices of existing products. Therefore, how could they thus drive consumers acceptance of a
novel food? The Westernized world seems to be largely averse to the practice of eating insects,
which usually evokes disgust and phobia in the minds of consumers. However, policy-makers do
not seem to take such dynamics into account. Introducing insects in the Western market is
indeed a challenge that big corporations seem not to be interested in at the moment. It is a
venture involving the introduction of a radical innovation on the food market, rather than an
incremental one. Industry leaders simply cannot afford to embrace radical change, as being the
first mover usually brings more cons than pros (Stringer, 2000). This is truly an issue of
organizational culture. On the contrary, a considerable number of start-ups, from the USA to
Europe, are taking chances and exploring those opportunities brought to the fore by
entomophagy.
11
1.2 The case of Jumping Jack Snacks
Jumping Jack Snacks is one of the several entomology-based ventures that have been
undertaken in the last few years. Founded in April 2015 and located in the Netherlands, the
company was established by two master students of Wageningen University. The start-up saw a
consistent market opportunity and the potentials of insects as a wholesome snack. The idea
was to find ways to prepare insects (specifically crickets and mealworms) as an appealing
gastronomic item to today’s European consumers, starting from the Dutch market.
The first concept the Jumping Jack team came up with was a granola bar with insect flour.
However, when selling directly to consumers, the product mix was enriched by more indulgent
sweets, such as cookies, brownies and candies. Therefore, the focus shifted to tasty, delicious
bakery products having an adventurous twist, as the beachhead target market consisted of
Dutch foodies attending Food Festivals. This segment is an economically well-disposed
generation of eaters, usually looking for their fixes in new, atypical eats and getting a thrill from
consuming both ethically and ethnically. The fact that foodies are open-minded, curious and
eager to experiment is a clear indicator to marketers that this is a willing audience for product
launches (Packaged Facts, 2009). Furthermore, the expected audience of the Food Festivals in
the Netherlands amounts to approximately 80,000 people per year (Van Loon, 2013). However,
the start-up doubts whether to keep the granola bar in the product mix, since it could clash
with the current hedonic approach. On the other hand, the healthy sector looks really attractive
and rich in opportunities, with the rise of protein-rich supplements targeting fitness
enthusiasts.
The next challenge therefore is to shift the choice decisively in one direction and to create a
more thorough value proposition, able to attract the next target market. In fact, it is important
for the firm to clarify and articulate which are the compelling reasons why consumers should
buy an insect-food product. Which benefits and added values does the company need to
deliver? How to create the belief in the customer that such value will be delivered and
experienced? Foodies are adventurous eaters by definition and the perfect early adopters, but
what about the less neophilic consumers? With the desire to scale up production, it is
necessary to understand what will be the suitable attributes and multisensory characteristics
able to make the product appealing to neophobic consumers as well. Furthermore, it is
important to match the most appropriate type of product with the right set of brand values.
The aim of this study is therefore to determine what are the significantly accepted product
attributes and develop a value proposition strategy through consumer driven new product
development.
12
2. Literature
2.1 Edible insects and the state of the art
It goes without saying that reluctance to eat insects in many modern societies is a strong barrier
against the commercialization of insect-containing food products. It can be argued that
entomophagy is a “failed diffusion” (Shelomi, 2015), since its adoption never reached or
approached universal acceptance in its target population (Rogers, 2003). This barrier is mainly
triggered by a cultural representation, according to which insects cause either fear (of dirt and
diseases) or curiosity (Yen, 2009). Furthermore, the disgust factor is deeply embedded in the
Western psyche, since insects are mainly viewed as pests, no matter how great the amount of
literature underlying their nutritional and sustainable features (van Huis et al., 2013). This could
be partly explained by the lack of exposure to the taste, flavour, visual and tactile sensations of
edible insects (Deroy et al., 2015) together with the geographical availability of other
proteinaceous sources of food, such as cattle, pigs and poultry (Harris, 1999).
The lack of knowledge and exposure can only raise the levels of fear and misconception
towards entomophagy. For instance, the naïve categorization of insects implies a group
including even spiders, lizards, scorpions, as well as snakes and bats (Costa-Neto, 2000).
Fortunately, the mass media and the institutions in Europe are increasingly focusing on the
subject. Until the harmonization of the European regulatory framework, some Member States
decided to self-regulate their internal markets. For instance, on 15 October 2014 the Dutch
Office for Risk Assessment and Research stated that three kinds of insects could be produced
and sold in the Netherlands, namely two kinds of mealworms and crickets. Likewise other
countries, such as Belgium, France, UK and Denmark, are self-regulating the commercialization
of edible insects.
In 2010, the United Nations’ Food and Agriculture Organization (FAO) published a report on the
importance of edible insects; however, it largely failed in convincing European and American
consumers to change their habits. On the other hand, TV shows negatively portrayed the
insect-eating experience. For instance, looking at the Netherlands, based on the results of a
focus group (Tan et al., 2015), most of the Dutch participants gained their awareness from
special events, travels and TV. When divided amongst eaters (respondents that ate edible
insects at least once) and non-eaters (respondents that never tried them), the former had the
chance to taste insects once or twice during these events and during their travels, whereas
Dutch non-eaters had never tasted insects before, but had gained awareness of the topic
mainly through the same events and the mass media. While the exposure to the concept of
edible insects is growing day by day in the Netherlands, Dutch consumers (as well as European
13
consumers in general) do not have a strong cultural basis to understand them as a gastronomic
item. In fact, when asked about preparation methods, taste and flavour, or the distinction
between edible and inedible insects, consumers have barely any capability to discriminate at
the moment (Tan et al., 2015).
Despite the lack of cultural exposure, in recent years European consumers have been offered
plenty of reasons to consider the eating of insects, such as novelty, environmental and health
benefits. For instance, insects have already been introduced in Dutch supermarkets as a
sustainable alternative to meat. In fact, most of the scientific literature on the topic regards
insects as a meat replacer. It is a logical conclusion, if the premises are that insects are a
sustainable source of protein first of all and should therefore be eaten by Western consumers
instead of beef, poultry and pork.
Are meat substitutes of any appeal to new consumers? What does it take to increase their
consumption? The main key barriers are unfamiliarity and the lower sensory attractiveness, no
matter if it arises from insects or plant-based ingredients (Hoek et al., 2011). Although meat
lovers understand the ethical and health-related aspects of meat replacers, these reasons are
not relevant enough to make the shift happen. The main focus of communication strategies is
on rational and ethical arguments, but what should rather be improved is the resemblance to
meat itself, together with the sensorial properties. Lastly, familiarity is the key when it comes to
acceptance, in particular in the neophobic subjects: the individual level of food neophobia
affects the degree of acceptance of novel products, equally before and after tasting (Henriques
et al., 2009; Pliner et al., 1998). The logical failure lies in understanding the mind-set of
hedonistically motivated meat consumers, who would rather cut their rations than substitute
meat with its analogues. If policy-makers keep on proposing insects under the category of
animal protein, just because of their high protein content, the wrong representation will be
created in the mind of consumers, with high expectations of visual appearance, smell, texture
and the flavour of meat (Deroy et al., 2015), all of which might be not easy to achieve with
edible insects (Harrison-Dunn, 2014).
It is a matter of appropriateness and categorization: in order for a novel product to be accepted
by the market, it has to belong to the most appropriate category, i.e. the one able to make
sense in the mind of product buyers (Loken et al., 2008). For instance, Dutch people
traditionally eat meat as a main course, although, in the last few years, pasta and rice dishes
with meat sauces have become more and more attractive (Schosler et al., 2012). It has been
suggested that meat substitutes might be more successful as additional ingredients in the
context of a meal, rather than as a separate, individual meal component (Aiking, 2006). The
14
same could be true for edible insects. In fact, in a cross-cultural study between Germany and
China, results revealed that Germans are more willing to eat processed insect-based food when
integrated with other ingredients in a meal context, in comparison with unprocessed insects
(Hartmann et al., 2015).
When considering other cultures, protein-rich species such as grasshoppers and locusts were no
part of the dietary pattern of aborigines and other populations now integrating insects in their
diets (Deroy et al., 2015). In some cases, such as that of the Australian Aboriginal hunter-
gatherers, the preferred insect species are associated with sweet food, fruits, and are
integrated mainly for their fat content (O’Dea et al., 1991). On the contrary, in the milieu of the
Thai culture insects are more properly prepared in a savoury rather than a sweet manner (Tan
et al., 2015). However, when it comes to Western culture consumers are keener to try sweet
varieties of insect-based food, because of humans’ innate preference for sweet taste
(Drewnowski, 1997).
This is not only is a matter of categorization, but also one of presentation. Visualization is
indeed a big issue for consumers’ acceptance, creating concerns and leading them to rejection
due to disgust and/or neophobia. It could dampen the market acceptance and value creation
potentiality of insect-based food products. For instance, consumers prefer and are willing to
pay a premium price for insect-based products with a nutritional health claim, but they are not
willing to pay for a product with a visualized insect (de-Magistris et al., 2015). The hiding
strategy could therefore be a winner. Belgian consumers were more ready to accept insects
into a familiar context, together with known flavours and when they were not visible (Megido
et al., 2013). On the other hand, hiding could communicate a lack of transparency and a loss of
distinctiveness and differentiation between the different kinds of insects (Deroy et al., 2015).
Sensory strategies, rather than rational ones, are needed to promote a shift in this paradigm.
An example could be to understand the most appropriate plating technique, as used in fine
dining (Spence et al., 2014). The downfall of this approach is that it relegates insects to
Michelin-starred restaurants, making them far from being a consumer good. However, when it
comes to consumer products, an advertisement of insects as a food source solely based on its
nutritive advantages is unlikely to be effective, while convincing consumers of hedonic
characteristics and social acceptability could be the winning strategy (Hartmann et al., 2015).
Furthermore, processed insects-based foods could reduce neophobic reactions, when
introduced in a familiar product category or flavour profile, therefore leading to a higher
willingness to eat.
15
Nonetheless, when it comes to mass consumption products, consumers often struggle in
evaluating major innovations, not having a clear mental picture of which needs the new
products could fulfil. It all depends on the previous information and the visibility of the
attributes. In the case of entomophagy, this attitude clearly emerges during the previously
mentioned focus groups with Dutch participants (Tan et al., 2015). While barriers to
consumption are deeply rooted, the same cannot be stated for the values associated with
edible insects.
However, the relevant literature is fairly limited at the moment and given the limited sample
size it is not possible to speculate about general population attitudes. In particular, the focus is
not wide enough to cover all of Europe. The majority of the qualitative studies are carried
among Dutch, Belgian and German consumers, or in cross-cultural contexts with Asian
populations. Quantitative research is therefore needed in order to understand consumer
expectations, attitude and paradigms of acceptance.
16
2.2 Entrepreneurship, radical innovation and consumers’ voice
Start-ups might play an important role in the widespread acceptance of entomophagy, being
the perfect cradle for creativity and lacking organizational culture boundaries. Venture creation
and innovations follow a similar pattern, starting from an idea followed by its comprehensive
assessment (de-Magistris et al., 2015).
Edible insects can be called a radical innovation, being “new to the world” and not a
mainstream product on the European markets (Bessant & Tidd, 2007). Therefore, in the case of
entomology-based enterprises, the new venture creation has to be contextualized within the
field of radical innovation, thus raising the chances of failure.
In fact, if the most optimistic estimate of failure rate for new ventures is around 46% (Timmons
& Spinelli, 2009), when it comes to food introductions on the market two out of three new
products never live to see their second year on the shelves (ECR Europe, 1999). Furthermore,
72% of true new products and 55% of line extensions fail (Lord, 2000). Always according to Lord
(2000), non-leading, smaller companies introduced up to 14,298 products and had only 12%
success rate. Lately, in order to improve the
chances of success, the traditional cook-and-
look approach has been replaced with
structured methodologies (Linnemann et al.,
2006), which are more commonly used by
bigger companies.
In order to remove any degree of uncertainty
a full commitment to research and
development is needed. Particularly when it
comes to food, large attention to product
design and features is necessary. Most start-
ups use a circular trial-and-error process to
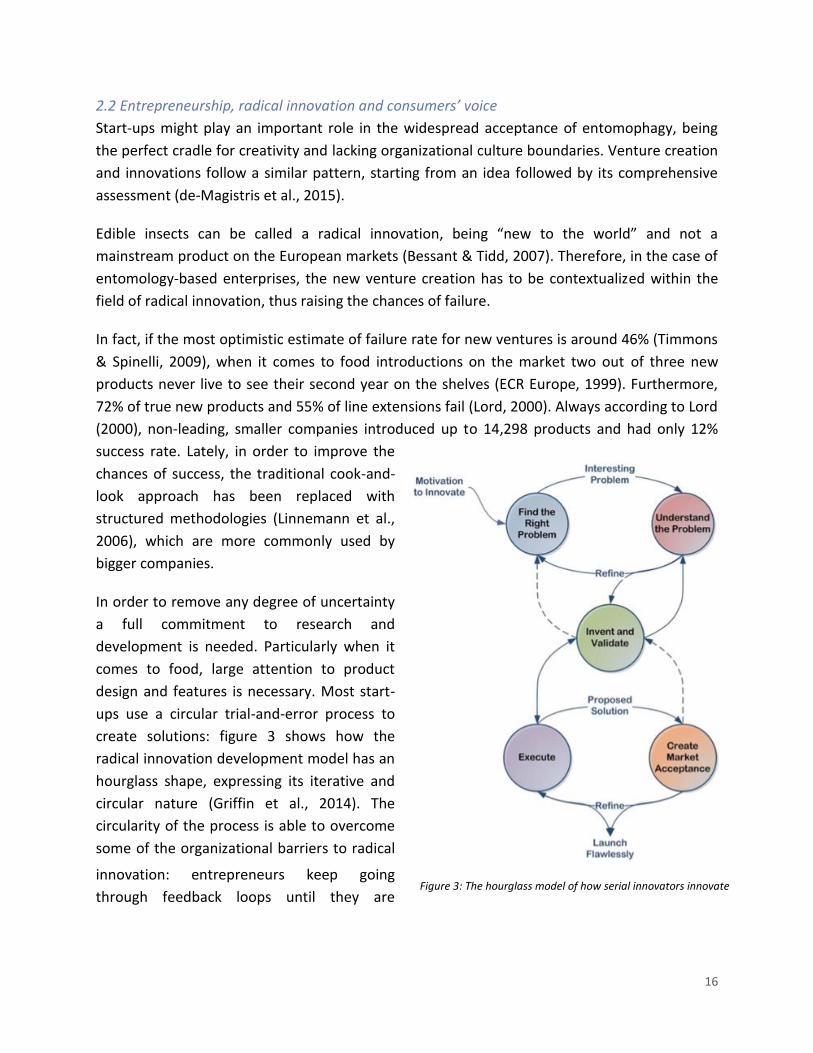
create solutions: figure 3 shows how the
radical innovation development model has an
hourglass shape, expressing its iterative and
circular nature (Griffin et al., 2014). The
circularity of the process is able to overcome
some of the organizational barriers to radical
innovation: entrepreneurs keep going
through feedback loops until they are Figure 3: The hourglass model of how serial innovators innovate
17
convinced of having a potentially successful product. As already mentioned elsewhere,
alongside with the trial-and-error techniques, more structured methodologies, based on
consumer wishes, have been developed.
Successful product development means also building the right set of cues that consumers can
use to infer the presence of quality (Grunert, 2007). For instance, intrinsic quality cues refer to
physical characteristics of the product, while extrinsic quality cues refer to the price of the
product, the store in which the product is bought, advertising claims about the product and the
brand (Grunert, 2002). Therefore incorporating and integrating the voice of the consumer in
the early stage has been identified as a critical success factor: even though it might be difficult
for consumers to vocalize their needs and wishes, it is important to understand how they
perceive products, shape their needs and make food choices (van Kleef et al., 2005).
18
2.3 Consumer driven product development and value propositions
Consumers truly are at the heart of the Business Model Canvas (figure 4), a strategic
management and lean start-up tool to describe how an organization creates, delivers and
captures value (Osterwalder et al., 2014).
This template defines a business model as made of the following nine building blocks: Value
Healthy (0.851) Looks nice (0.838) What I usually eat (0.699)
High in protein (0.854) Has a pleasant texture (0.775)
Energy giving (0.710) Tastes good (0.760)
Healthiness Attractiveness Familiarity
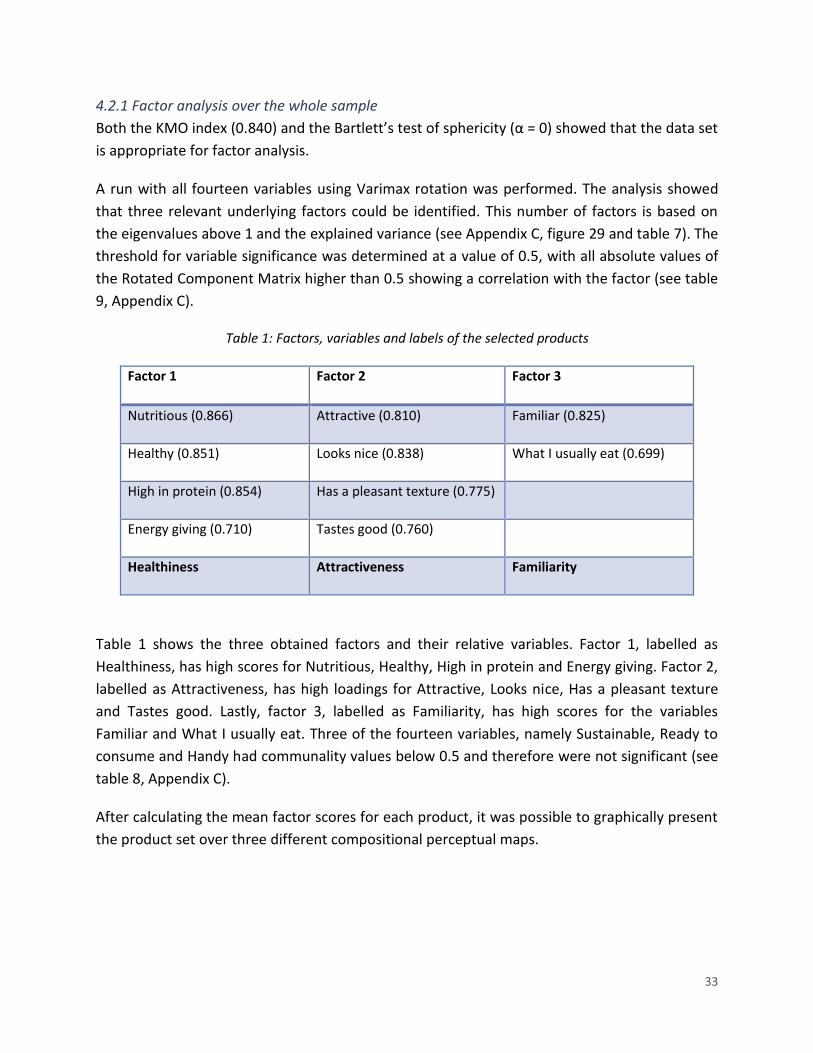
Table 1 shows the three obtained factors and their relative variables. Factor 1, labelled as
Healthiness, has high scores for Nutritious, Healthy, High in protein and Energy giving. Factor 2,
labelled as Attractiveness, has high loadings for Attractive, Looks nice, Has a pleasant texture
and Tastes good. Lastly, factor 3, labelled as Familiarity, has high scores for the variables
Familiar and What I usually eat. Three of the fourteen variables, namely Sustainable, Ready to
consume and Handy had communality values below 0.5 and therefore were not significant (see
table 8, Appendix C).
After calculating the mean factor scores for each product, it was possible to graphically present
the product set over three different compositional perceptual maps.
34
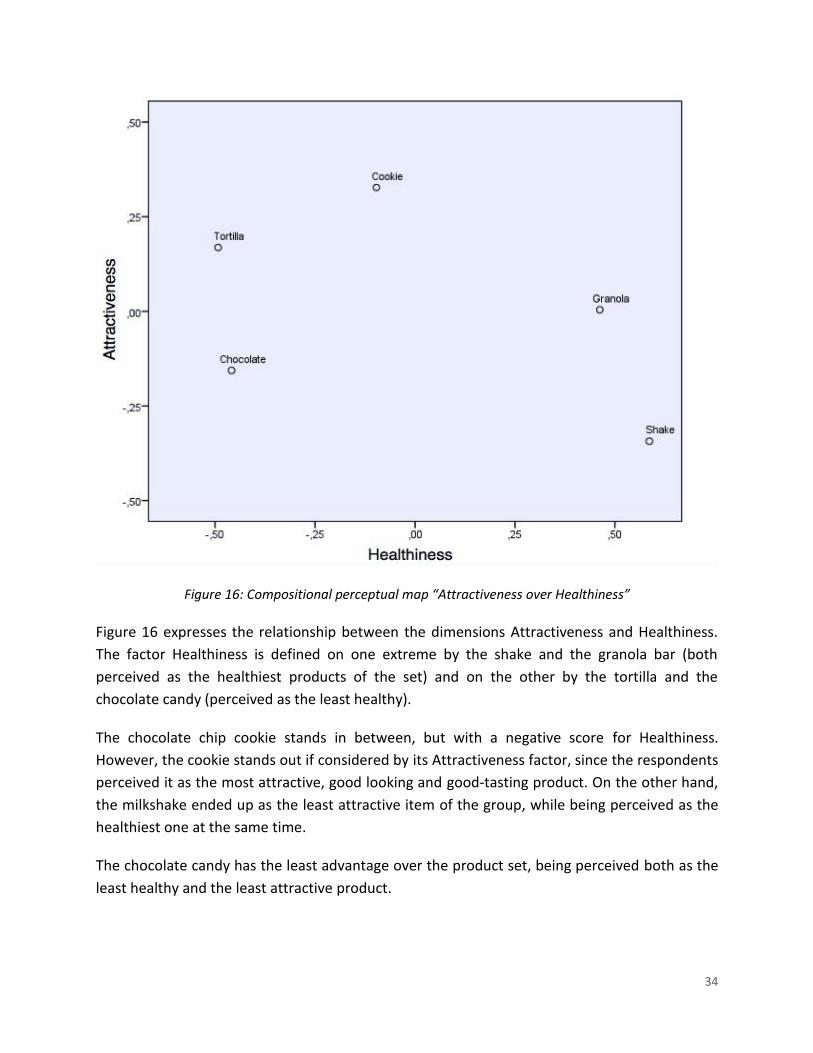
Figure 16: Compositional perceptual map “Attractiveness over Healthiness”
Figure 16 expresses the relationship between the dimensions Attractiveness and Healthiness.
The factor Healthiness is defined on one extreme by the shake and the granola bar (both
perceived as the healthiest products of the set) and on the other by the tortilla and the
chocolate candy (perceived as the least healthy).
The chocolate chip cookie stands in between, but with a negative score for Healthiness.
However, the cookie stands out if considered by its Attractiveness factor, since the respondents
perceived it as the most attractive, good looking and good-tasting product. On the other hand,
the milkshake ended up as the least attractive item of the group, while being perceived as the
healthiest one at the same time.
The chocolate candy has the least advantage over the product set, being perceived both as the
least healthy and the least attractive product.
35
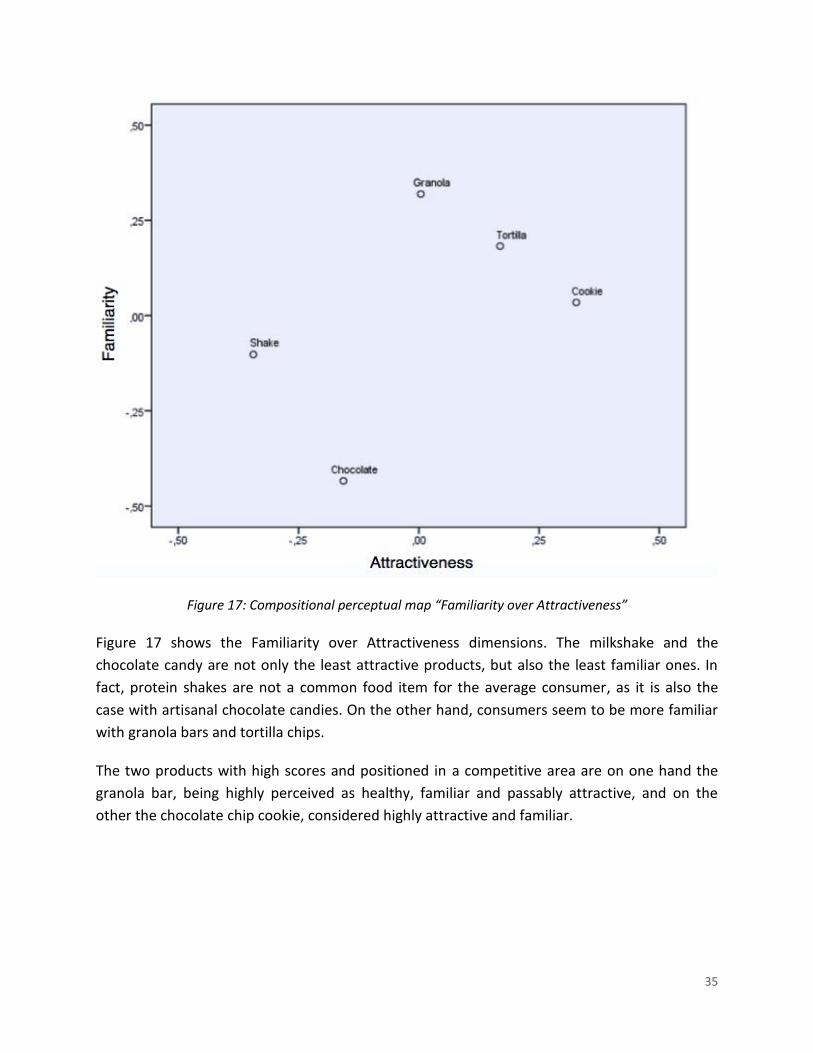
Figure 17: Compositional perceptual map “Familiarity over Attractiveness”
Figure 17 shows the Familiarity over Attractiveness dimensions. The milkshake and the
chocolate candy are not only the least attractive products, but also the least familiar ones. In
fact, protein shakes are not a common food item for the average consumer, as it is also the
case with artisanal chocolate candies. On the other hand, consumers seem to be more familiar
with granola bars and tortilla chips.
The two products with high scores and positioned in a competitive area are on one hand the
granola bar, being highly perceived as healthy, familiar and passably attractive, and on the
other the chocolate chip cookie, considered highly attractive and familiar.
36
4.2.2 Respondent segmentation based on FNS
When splitting the consumer sample based on their neophobia attitude, two distinct datasets
were obtained, both meritorious based on the KMO values (respectively 0.837 for neophobics
and 0.822 for neophilics) and Barlett’s test of sphericity (α = 0 for both).
The number of factors, the labels and variables entirely overlap with the previous dataset, while
the rotated component scores for neophilics and neophobics can be found in Appendix C. The
most significant differences emerge from the comparison between the two sets of
compositional perceptual maps.
Figure 18: Compositional perceptual maps “Familiarity over Attractiveness” for neophobic (left) and
neophilic (right) respondents
When considering the factor Familiarity over Attractiveness, both groups perceive the
chocolate candy to be an unusual item to eat (figure 18). However, neophobic respondents find
it highly unattractive, since this product is topped with a whole golden cricket, while neophilics
find it even more appealing than tortillas and granola bars.
Moreover, it is also interesting to notice how neophobic consumers almost equally value tortilla
chips and the chocolate chip cookie to be both highly familiar and attractive. On the other
hand, neophilics did not perceive tortilla chips to be particularly attractive.
37
Figure 19: Compositional perceptual maps “Attractiveness over Healthiness” for neophobic (left) and
neophilic (right) respondents
The difference between the two groups is even more emphasized when comparing
Attractiveness over Healthiness (figure 19). For neophobic consumers, the chocolate candy is as
unattractive as the shake and extremely opposed to the tortillas and the chocolate chip cookie.
Once again, neophilics rated the candy much higher than the granola bars, the tortillas and the
shake. Lastly, the cookie, the granola and the shake are valued with a similar trend by the two
different datasets.
38
5. Discussion
5.1 Attributes and product appropriateness
The two-step research strategy helped answering the several research sub-questions and made
it possible to understand which type of product could reduce rejection and improve acceptance
of neophobic consumers. From the quantitative study, clear patterns emerged concerning the
significantly accepted attributes, the product-related drivers and barriers and the benefits that
consumers see as added values, answering the first three research sub-questions (figure 20).
Only after an exhaustive explanation of these core issues, it was possible to develop a suitable
strategy for the start-up, including a thorough value proposition and the choice of the most
appropriate product category for commercialization.
Some defined patterns emerged already during the qualitative interviews, such as the innate
preference for more familiar products like cookies and granola bars. In fact, the protein shake
powder is poorly understood and not even taken into consideration for laddering, thus making
the two other products more appropriate matrixes. The cookie is highly appreciated and valued
as a tasty, pleasurable treat, while the granola has multiple benefits – convenience, satiety, and
healthiness. Furthermore, the ladder describing the granola bar as nutritious and consequently
healthy is intertwined with the one of insects as a source of protein, a fundamental component
of a balanced, healthy diet. The shared goals and values could make the two products a perfect
fit.
Figure 20: Significant attributes influencing consumer acceptance of edible insects
Attractiveness
Healthiness
Visibility
Sweetness and
indulgence
Protein source
39
Concerning sustainability, this was mentioned by the respondents within the context of meat
replacements and alternative sources of protein, therefore not representing a competitive edge
within the snacks category.
Some significant dimensions that emerge from the qualitative research were not as significant
for the quantitative study. Price was not included, as previously mentioned. Moreover,
convenience was not a discriminative dimension for the product set, but this does not imply
that these two factors should be forgotten for the value proposition development. In particular,
handiness was highly relevant during the qualitative stage.
Concerning the tested attributes, visibility is a high barrier for acceptance, in particular in
neophobic consumers, who find whole insects to be highly unattractive. Furthermore, visible
insects are equally perceived as unfamiliar by neophilics and neophobics, belonging more to a
niche market.
The savoury/sweet dichotomy is not particularly significant among European consumers,
contrarily to Asian ones. In Asia edible insects are considered as meat and always eaten in a
savoury meal context, as emerged both from literature (Tan et al., 2015) and during interviews.
However, European consumers do not have prior knowledge of consumption and thus neither
an opinion on the matter, nor find sweets to be an inappropriate context. Furthermore, the
sweet snacks are what the start-up already focused its production on and are found to have a
competitive edge over the product set. In fact, sweet taste, indulgence and sensory appeal are
all attributes able to drive consumption of all respondents, no matter the individual attitude
towards food neophobia. The chocolate chip cookie is a strong example of a pleasurable treat
that captured the attention of all respondents.
Healthiness can be a driver for consumption as well. Protein-rich food is perceived as extremely
healthy and this applies to both the granola bar and the shake. The granola bar, in particular,
was perceived as a familiar and healthy snack, gaining a competitive edge over the other items.
On the other hand, the protein shake has a lower potential, since it was considered as highly
unattractive and unfamiliar. The shake is confined to a highly specialized niche, far from being a
consumer good but rather an item targetable to body builders and athletes. This target is
completely out of the company’s focus and needs further R&D investment, in both time and
money.
40
5.2 Two potential strategies for value creation
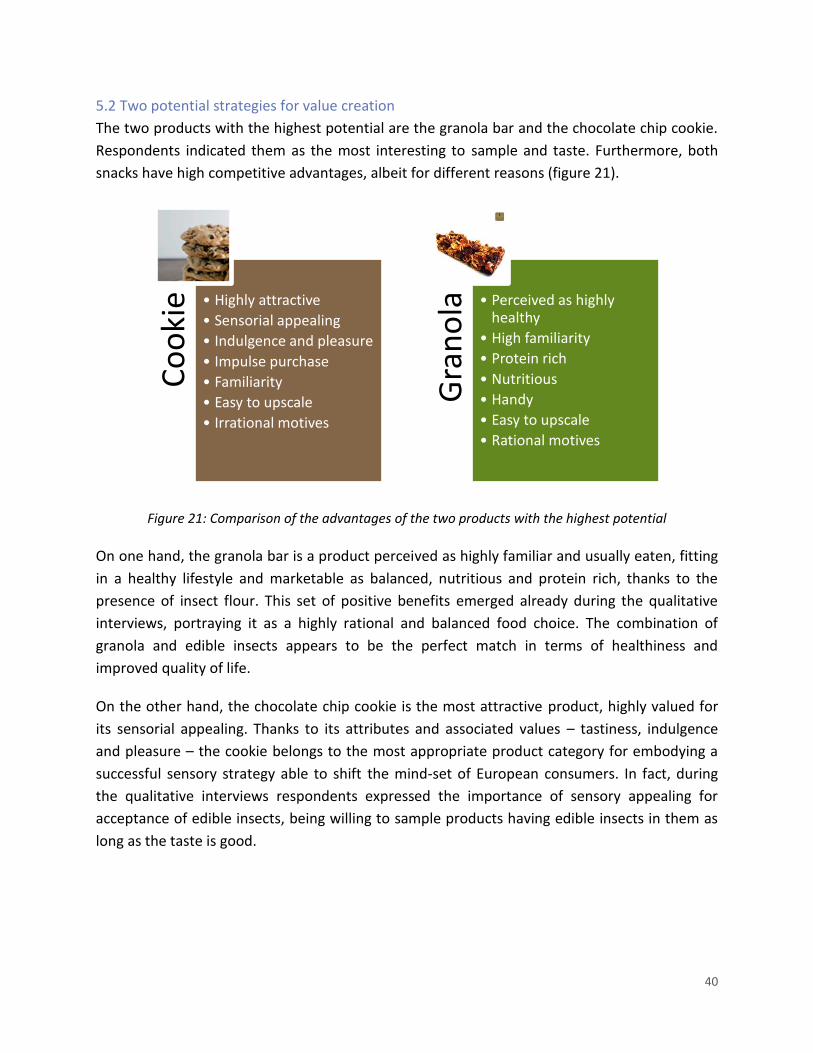
The two products with the highest potential are the granola bar and the chocolate chip cookie.
Respondents indicated them as the most interesting to sample and taste. Furthermore, both
snacks have high competitive advantages, albeit for different reasons (figure 21).
Figure 21: Comparison of the advantages of the two products with the highest potential
On one hand, the granola bar is a product perceived as highly familiar and usually eaten, fitting
in a healthy lifestyle and marketable as balanced, nutritious and protein rich, thanks to the
presence of insect flour. This set of positive benefits emerged already during the qualitative
interviews, portraying it as a highly rational and balanced food choice. The combination of
granola and edible insects appears to be the perfect match in terms of healthiness and
improved quality of life.
On the other hand, the chocolate chip cookie is the most attractive product, highly valued for
its sensorial appealing. Thanks to its attributes and associated values – tastiness, indulgence
and pleasure – the cookie belongs to the most appropriate product category for embodying a
successful sensory strategy able to shift the mind-set of European consumers. In fact, during
the qualitative interviews respondents expressed the importance of sensory appealing for
acceptance of edible insects, being willing to sample products having edible insects in them as
long as the taste is good.
Co
oki
e • Highly attractive
• Sensorial appealing
• Indulgence and pleasure
• Impulse purchase
• Familiarity
• Easy to upscale
• Irrational motives
G
ran
ola
• Perceived as highly healthy
• High familiarity
• Protein rich
• Nutritious
• Handy
• Easy to upscale
• Rational motives
41
The “cookie strategy” fits perfectly within the company’s focus on tasty, delicious bakery
products having an adventurous twist, while the granola bar is highly inappropriate for such
context. It is therefore important to distinguish between two different strategies with which the
start-up can choose to proceed: one is rationally-oriented, with a focus on healthy and
balanced snacks rich in proteins; the other is a sensorial strategy, focused on tasty treats being
indulgent, highly attractive and with the unconventional, adventurous twist of insects.
The following sections articulate the two approaches through the Value Proposition Canvas. In
order to construct the Canvas, it is important to first develop the Customer Profile, listing
customer jobs, pains and gains and consequently a matching Value Map, with suitable pain
relievers and gain creators. The aim is to articulate a concrete answer to the remaining research
sub-question, on the basis of the outcomes of the qualitative and quantitative study, together
with the start-up internal knowledge. The goal is to define for which customer segments the
company would be creating value, which consumer needs the value proposition has to satisfy
and which are the significant benefits that consumers see as an added value.
5.2.1 The rational strategy
The first strategy sees the potential of edible insects in their nutritional profile, as the value
creator of a healthy and balanced snack. As mentioned in the qualitative results, the product
fits within a highly rational means-end chain structure, with a personal focus on the individual
self-esteem, quality of life and physical wellness.
The specific consumer segment that would be interested in a healthy snack with insect flour is a
health conscious consumer, namely an individual that is focused on nutrition, fitness and a
“wellness-oriented” lifestyle, but not necessarily at a professional level (Kraft & Goodell, 1993).
Consumers who seek a healthy lifestyle follow the latest health and fitness trends and are often
looking for balanced snacks to eat on the go – before going to the gym, during workouts or
breaks. However, supermarkets often offer boring and tasteless options on one hand, or
unhealthy and sugary alternatives on the other. For fitness enthusiast is hard to find balanced,
convenient snacks to buy on the go, without giving up on taste and naturalness. Actually,
consumers that follow a carb conscious diet often have to renounce to their cereal and sugar
fix. Satiety, more time to work, study or train, healthiness and social bonding are all customer
gains in which this segment is interested.
Thus the introduction of edible insects has the potential to revolutionise the snack bars market.
The product would have a competitive edge over the already existing healthy snack, due to its
remarkable nutritional profile given by the combination of cereals and insects. It has multiple
42
distinctive pain relievers for the selected customer segment, such as the maximized healthiness
of a sweet snack. In fact, the presence of insect meal allows the production of a cereal-based
snack with a balanced nutritional profile, without compromising taste. Furthermore, giving the
handiness of the product, proteins can finally be a convenient snack, easy to integrate in an
active lifestyle. Introducing insects as a superfood, rich in several amino acids, vitamins and
micronutrients might help creating a wholesome alternative to the granola bars and other
snacks already on the market. The insect granola bar would create gain for consumers through
its balanced and nutritious nature, being healthier than the average cereal bar but also having a
better taste than the average protein bar. Moreover, insect would be introduced as flour in a
highly familiar food matrix, while offering a valuable and fibres-rich source of proteins. Namely,
this product could reunite the need for convenience, healthiness and satiety in a familiar snack
that is easy to accept and rationalize. A visual representation of the Value Proposition Canvas
for the rational strategy can be found in figure 22.
Figure 22: Value Proposition Canvas for the rational strategy
To deliver this value proposition to the customer is necessary to develop the right set of cues,
namely information used by consumers to infer quality (Grunert, 2007). For instance, when it
comes to healthiness, healthfulness conveyed by images rather than health claims could lead to
the most favourable evaluation of a product’s healthfulness (Chrysochou & Grunert, 2014), as
well as certified organic food is perceived to be healthier than conventional food (Guilabert &
Wood, 2012).
43
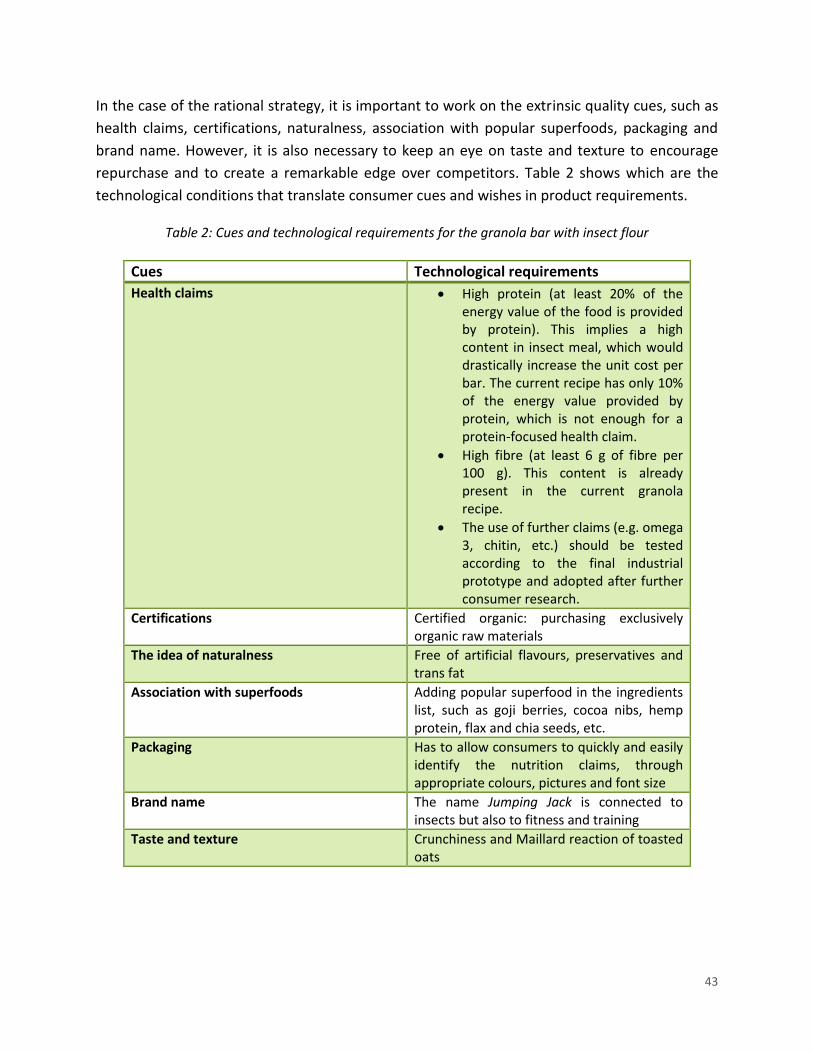
In the case of the rational strategy, it is important to work on the extrinsic quality cues, such as
health claims, certifications, naturalness, association with popular superfoods, packaging and
brand name. However, it is also necessary to keep an eye on taste and texture to encourage
repurchase and to create a remarkable edge over competitors. Table 2 shows which are the
technological conditions that translate consumer cues and wishes in product requirements.
Table 2: Cues and technological requirements for the granola bar with insect flour
Cues Technological requirements
Health claims High protein (at least 20% of the energy value of the food is provided by protein). This implies a high content in insect meal, which would drastically increase the unit cost per bar. The current recipe has only 10% of the energy value provided by protein, which is not enough for a protein-focused health claim.
High fibre (at least 6 g of fibre per 100 g). This content is already present in the current granola recipe.
The use of further claims (e.g. omega 3, chitin, etc.) should be tested according to the final industrial prototype and adopted after further consumer research.
Certifications Certified organic: purchasing exclusively organic raw materials
The idea of naturalness Free of artificial flavours, preservatives and trans fat
Association with superfoods Adding popular superfood in the ingredients list, such as goji berries, cocoa nibs, hemp protein, flax and chia seeds, etc.
Packaging Has to allow consumers to quickly and easily identify the nutrition claims, through appropriate colours, pictures and font size
Brand name The name Jumping Jack is connected to insects but also to fitness and training
Taste and texture Crunchiness and Maillard reaction of toasted oats
44
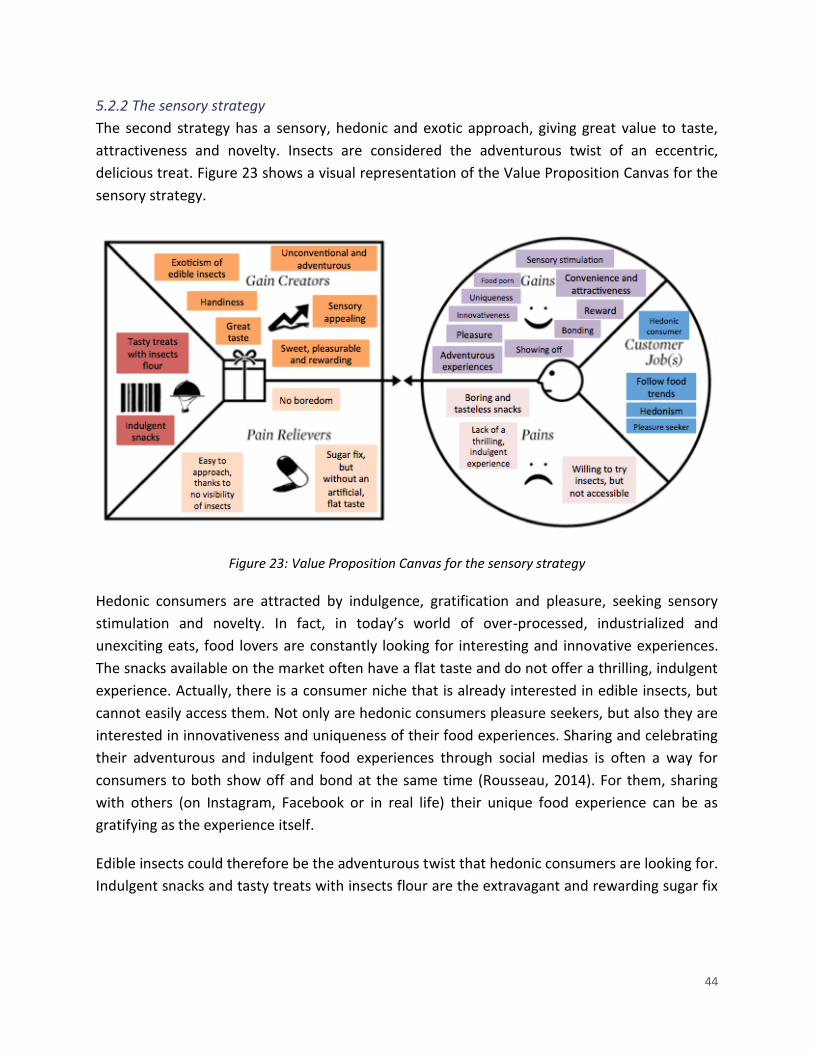
5.2.2 The sensory strategy
The second strategy has a sensory, hedonic and exotic approach, giving great value to taste,
attractiveness and novelty. Insects are considered the adventurous twist of an eccentric,
delicious treat. Figure 23 shows a visual representation of the Value Proposition Canvas for the
sensory strategy.
Figure 23: Value Proposition Canvas for the sensory strategy
Hedonic consumers are attracted by indulgence, gratification and pleasure, seeking sensory
stimulation and novelty. In fact, in today’s world of over-processed, industrialized and
unexciting eats, food lovers are constantly looking for interesting and innovative experiences.
The snacks available on the market often have a flat taste and do not offer a thrilling, indulgent
experience. Actually, there is a consumer niche that is already interested in edible insects, but
cannot easily access them. Not only are hedonic consumers pleasure seekers, but also they are
interested in innovativeness and uniqueness of their food experiences. Sharing and celebrating
their adventurous and indulgent food experiences through social medias is often a way for
consumers to both show off and bond at the same time (Rousseau, 2014). For them, sharing
with others (on Instagram, Facebook or in real life) their unique food experience can be as
gratifying as the experience itself.
Edible insects could therefore be the adventurous twist that hedonic consumers are looking for.
Indulgent snacks and tasty treats with insects flour are the extravagant and rewarding sugar fix
45
that can save consumers from everyday boredom. Moreover, introducing insects in a rewarding
context might be the most successful strategy to create a great first impression. The cookie is
only one of the several treats in which insect flour can be integrated. Candy bars, for instance,
can reunite handiness with sensory fulfilment. Great taste, high quality, exotic ingredients and a
product mix focused on rewarding treats are all strong gain creators.
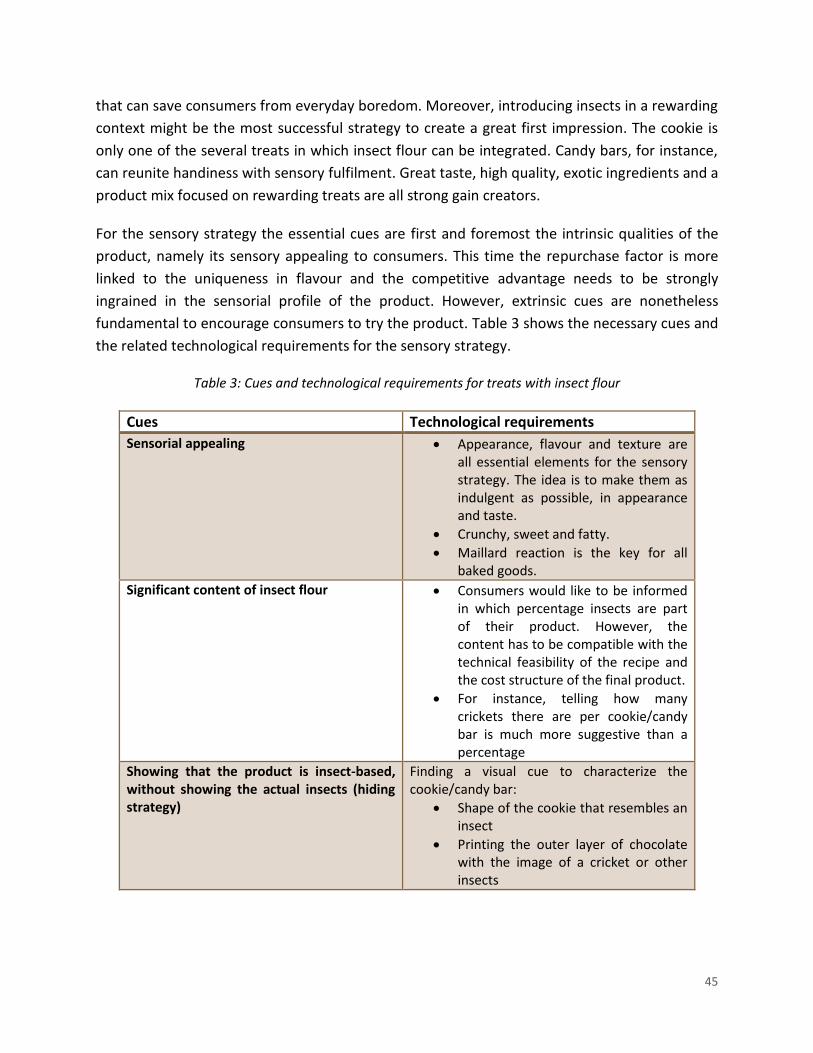
For the sensory strategy the essential cues are first and foremost the intrinsic qualities of the
product, namely its sensory appealing to consumers. This time the repurchase factor is more
linked to the uniqueness in flavour and the competitive advantage needs to be strongly
ingrained in the sensorial profile of the product. However, extrinsic cues are nonetheless
fundamental to encourage consumers to try the product. Table 3 shows the necessary cues and
the related technological requirements for the sensory strategy.
Table 3: Cues and technological requirements for treats with insect flour
Cues Technological requirements
Sensorial appealing Appearance, flavour and texture are all essential elements for the sensory strategy. The idea is to make them as indulgent as possible, in appearance and taste.
Crunchy, sweet and fatty.
Maillard reaction is the key for all baked goods.
Significant content of insect flour Consumers would like to be informed in which percentage insects are part of their product. However, the content has to be compatible with the technical feasibility of the recipe and the cost structure of the final product.
For instance, telling how many crickets there are per cookie/candy bar is much more suggestive than a percentage
Showing that the product is insect-based, without showing the actual insects (hiding strategy)
Finding a visual cue to characterize the cookie/candy bar:
Shape of the cookie that resembles an insect
Printing the outer layer of chocolate with the image of a cricket or other insects
46
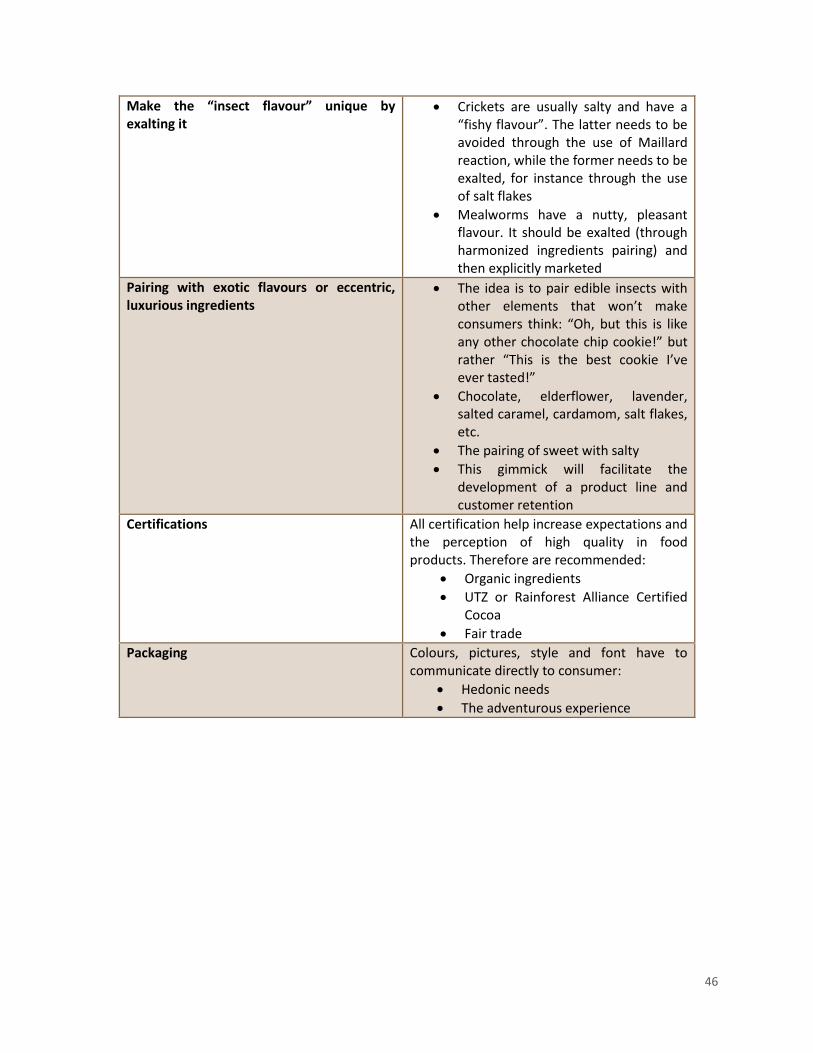
Make the “insect flavour” unique by exalting it
Crickets are usually salty and have a “fishy flavour”. The latter needs to be avoided through the use of Maillard reaction, while the former needs to be exalted, for instance through the use of salt flakes
Mealworms have a nutty, pleasant flavour. It should be exalted (through harmonized ingredients pairing) and then explicitly marketed
Pairing with exotic flavours or eccentric, luxurious ingredients
The idea is to pair edible insects with other elements that won’t make consumers think: “Oh, but this is like any other chocolate chip cookie!” but rather “This is the best cookie I’ve ever tasted!”
Chocolate, elderflower, lavender, salted caramel, cardamom, salt flakes, etc.
The pairing of sweet with salty
This gimmick will facilitate the development of a product line and customer retention
Certifications All certification help increase expectations and the perception of high quality in food products. Therefore are recommended:
Organic ingredients
UTZ or Rainforest Alliance Certified Cocoa
Fair trade
Packaging Colours, pictures, style and font have to communicate directly to consumer:
Hedonic needs
The adventurous experience
47
6. Conclusions and Recommendations
6.1 Conclusions
Nowadays the Western world is facing the raise of several entomology-based ventures that see
plenty of potential in edible insects. Jumping Jack Snacks is one of them and, before launching
one of their products and upscale production, wants to understand what is the most successful
value proposition strategy, with highly accepted attributes, multisensory characteristics and
values.
After a literature review on the state of the art of edible insects, a study regarding the
acceptance of European consumers was carried out, by means of both qualitative interviews
and quantitative analysis. Afterward, recommendations on how to design a thorough Value
Proposition Canvas were formulated.
Visibility, sweetness, perceived healthiness, sensorial attractiveness of the matrix and
convenience are all attributes and benefits to take into account when composing the value
proposition. In particular, two potential strategies for value creation emerged from the study:
one is more of a rational strategy, with a focus on healthy and balanced snacks rich in proteins;
the other is a sensorial strategy, focused on tasty treats that are indulgent, highly attractive and
feature the unconventional, adventurous twist of insects. For both options it is important to
carry on with the hiding strategy, e.g. using only flour, rather than visible insects, with the aim
to maximize acceptance of neophobic consumers.
However, according to literature, rational proofs usually barely work to drive food choices of
existing products, not to mention novel food products. Sensory strategies are needed to
promote a shift in the paradigm and the key is to convince consumers of insects’ hedonic
characteristics and social acceptability. Thus the sensory strategy described in this study has a
higher potential to succeed and can be the perfect icebreaker to get Europeans familiarized
with edible insects.
6.2 Limitations
The dropout rate of the online survey was quite high, since the data from 37 respondents were
not complete and had to be excluded from the statistics. This could be due to the length of the
survey and to the respondents’ lack of interest. Therefore consumers not attracted by edible
insects might have not been engaged and motivated enough to dedicate 10 minutes of their
time to the questionnaire. This is also why the presence of a positive attitude towards edible
insects should not be interpreted too enthusiastically, in terms of market share or general
48
consumer interest. However, it proved useful for segmenting consumer attitude and wishes
based on food neophobia.
Furthermore, a cultural bias could have been caused by the inclusion in the sample of different
nationalities without heterogeneous proportions. Consumers from Mediterranean countries
were included as well; therefore the results concerning the degree of acceptance and interest
towards edible insects cannot be generalized for Northern Europe. In fact, norms, food culture
and quality perception are different between the North and South of Europe, thus varying the
patterns of acceptance among consumers. However, generalization of results was not the main
aim of the study, since its main goal was a specific strategy development for the selected
company. Nonetheless, the applied methodology is highly replicable and can be tested again
with different products or with a generalization purpose.
Moreover, when showing images of insect-based products, the lack of information about the
nutritional value, the list of ingredients and the percentage of insect flour might have not
allowed respondents to thoroughly judge whether the products were safe or not to eat. This
could particularly be true for the golden coat of the chocolate candy.
Lastly, the outcome of the study shows trends and valuable material for a branding strategy,
but it does not provide a measure of buying and repurchase behaviour. In fact, customer
retention was not the focus of this study.
6.3 Suggestions for further research
The aim of this study was to take qualitative and quantitative psychological measures of eating
behaviour in regards to edible insects. Respondents did not taste samples, but rather rated and
based their preference on inferred properties, such as quality, taste and flavour. This might
culturally vary between Northern and Mediterranean consumers, or even within the same
country, among clusters of consumers. Further quantitative research should focus on formal
taste assessments.
In fact, as mentioned in the state of the art, consumers might be less resistant when introduced
to the sweet varieties of insect-base food, but it is still unclear if the willingness is equally high
for the savoury version of such products.
Lastly, when examining the willingness to eat insect-based food, factors like safety concerns,
risk perception and perceived food quality should be taken into account and therefore are
worth exploring in further studies.
49
6.4 Recommendations for the company
Jumping Jack Snacks should promptly choose between one strategy and the other and make an
informed decision based on the additional key variables of its business model. The Value
Proposition Canvas is only the first step for constructing a thorough business strategy and the
final choice has to be made considering the whole framework of the Business Model Canvas. In
fact, in order to make an informed decision, it is necessary to take into account other variables,
such as profit margins, the competitor environment, the size of the market, possible barriers to
enter, the channels and so on. For instance, a healthier version of the average granola bar
requires a high content of insect flour, which would drastically increase the unit cost per bar.
Nevertheless, the firm cannot keep on using its granola bar while carrying on a sensory
strategy, but should rather separate the two elements and choose one or the other.
It is also true that the current state of the art is more prone to see potential in the sensory
strategy and indulgence has been acknowledged to be a strong driver for acceptance.
Furthermore, both the focus and the expertise of the start-up are heading towards the sensory
strategy. The Jumping Jack team should therefore carry on its current strategy and create a
brand image and a product mix based on indulgence, uniqueness and adventurousness.
50
Bibliography
Aiking, H. (2006). Sustainable protein production and consumption: Pigs or Peas? Dordrecht,
The Netherlands: Springer.
Barrena, R., Sánchez, M. (2013). Neophobia, personal consumer values and novel food
acceptance. Food Quality and Preference, 27, 72–84.
Bessant, J., Tidd, J. (2007). Innovation and entrepreneurship. John Wiley & Sons Inc., Chichester,
England.
Bukkens, S.G.F. (2005). Insects in the human diet: nutritional aspects. In M.G. Paoletti, ed.
Ecological implications of minilivestock; role of rodents, frogs, snails, and insects for sustainable
development, pp. 545–577. New Hampshire, Science Publishers.
Chemnitz, C., Becheva, S. (2014). Meat atlas: facts and figures about the animals we eat. Berlin:
Heinrich Böll Stiftung and Friends of the Earth Europe.