36
Chapter 4 Consumer and Firm Behavior: The Work-Leisure Decision and Profit Maximization

Chapter 4
Consumer and Firm Behavior: The Work-Leisure Decision and Profit Maximization
Copyright © 2005 Pearson Addison-Wesley. All rights reserved. 4-2
The Representative Consumer
• Preferences– Goods: The Consumption Good and
Leisure – The Utility Function
• More Preferred to Less• Preference for Diversity • Consumption and leisure are normal goods
( , )U C l
Copyright © 2005 Pearson Addison-Wesley. All rights reserved. 4-3
– Indifference Curves • Downward Sloping (more preferred to less)• Convex to the Origin (preference for diversity)
– Marginal Rate of Substitution (MRS)• Slope of the Indifference Curve• Rate at which consumer is willing to substitute
leisure for consumption goods
Copyright © 2005 Pearson Addison-Wesley. All rights reserved. 4-4
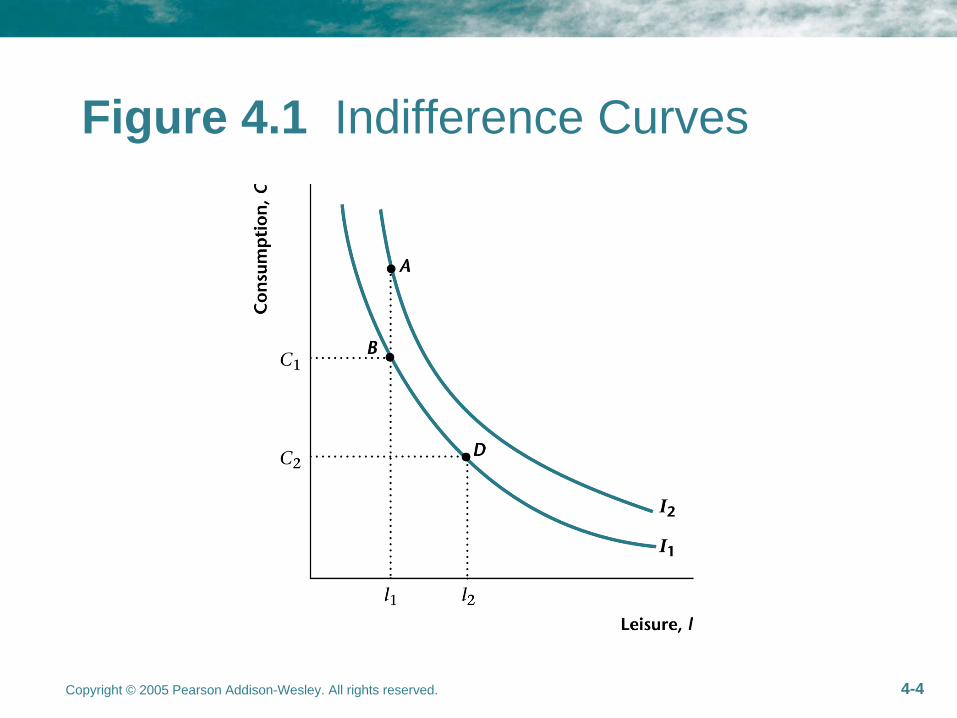
Figure 4.1 Indifference Curves
Copyright © 2005 Pearson Addison-Wesley. All rights reserved. 4-5
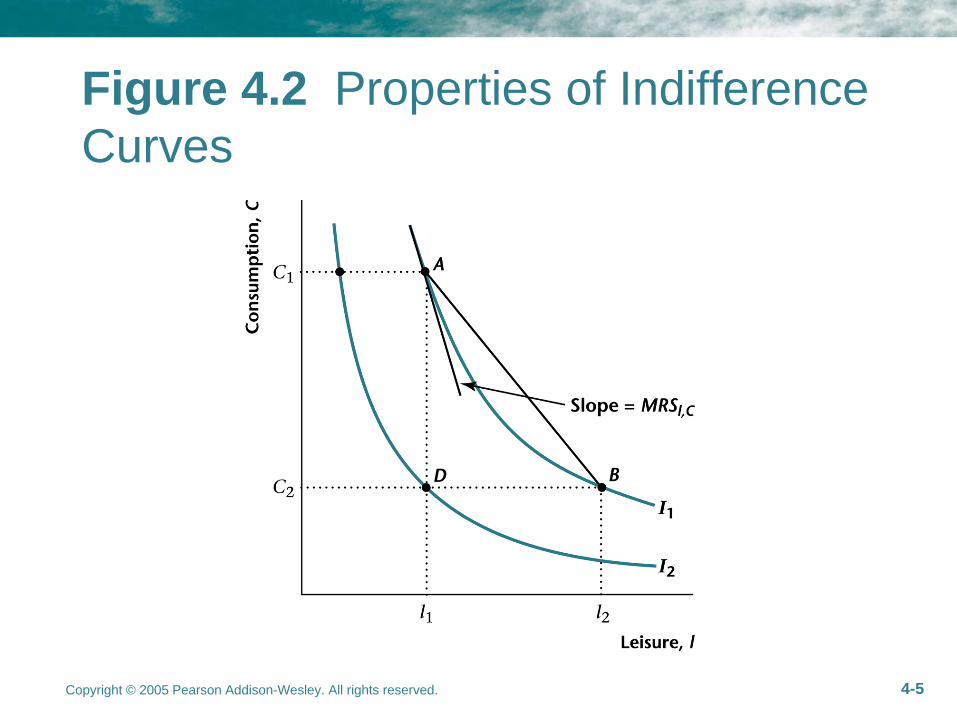
Figure 4.2 Properties of Indifference Curves
Copyright © 2005 Pearson Addison-Wesley. All rights reserved. 4-6
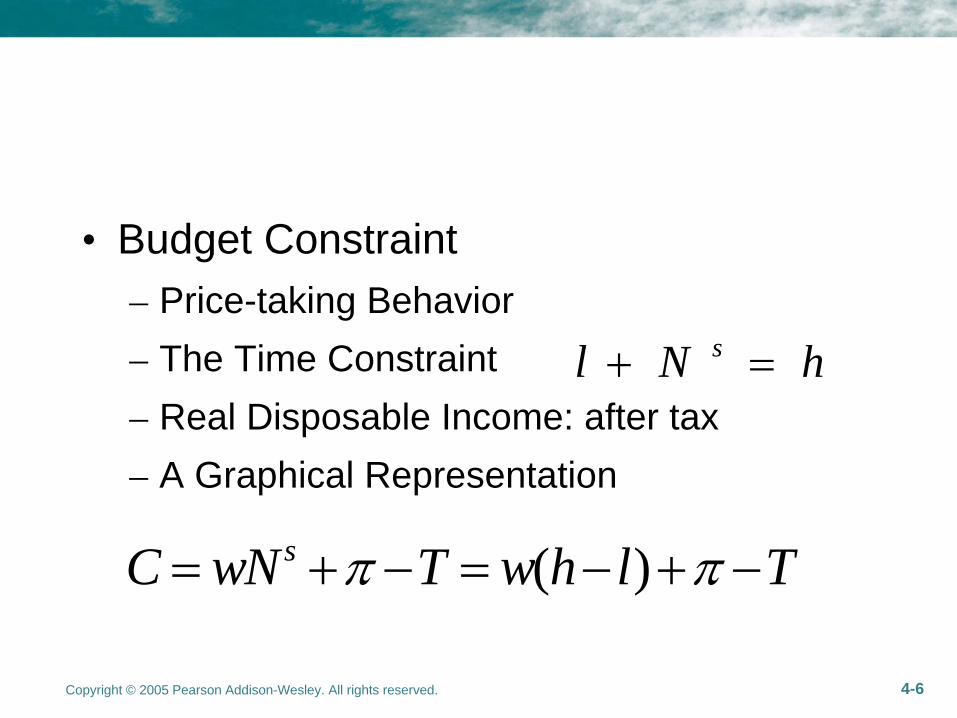
• Budget Constraint – Price-taking Behavior – The Time Constraint – Real Disposable Income: after tax – A Graphical Representation
sl N h
( )sC wN T w h l T
Copyright © 2005 Pearson Addison-Wesley. All rights reserved. 4-7
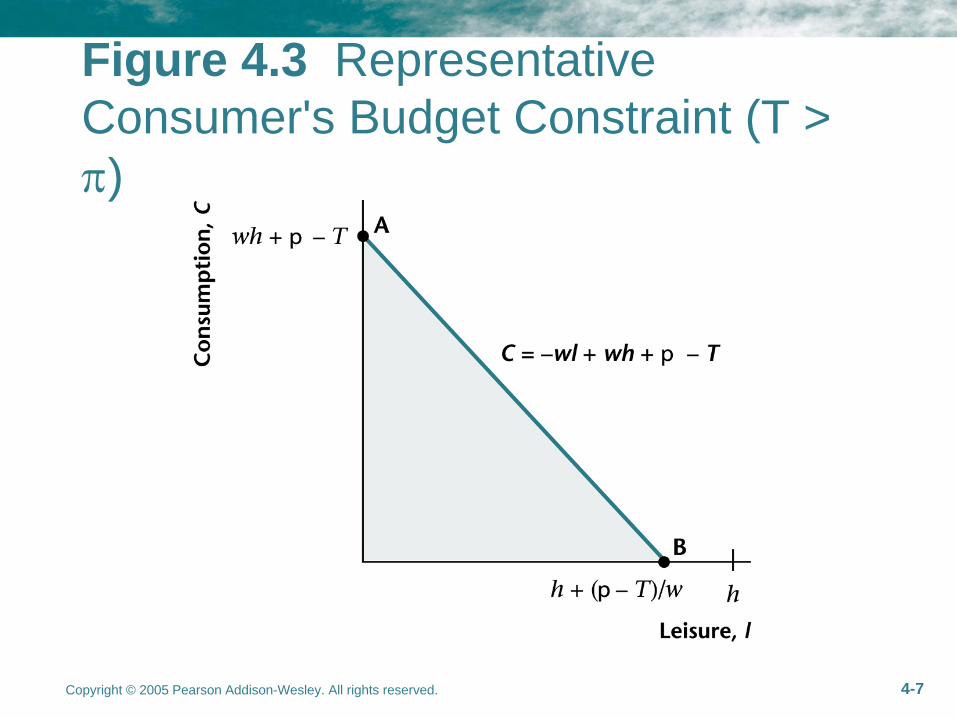
Figure 4.3 Representative Consumer's Budget Constraint (T > )
Copyright © 2005 Pearson Addison-Wesley. All rights reserved. 4-8
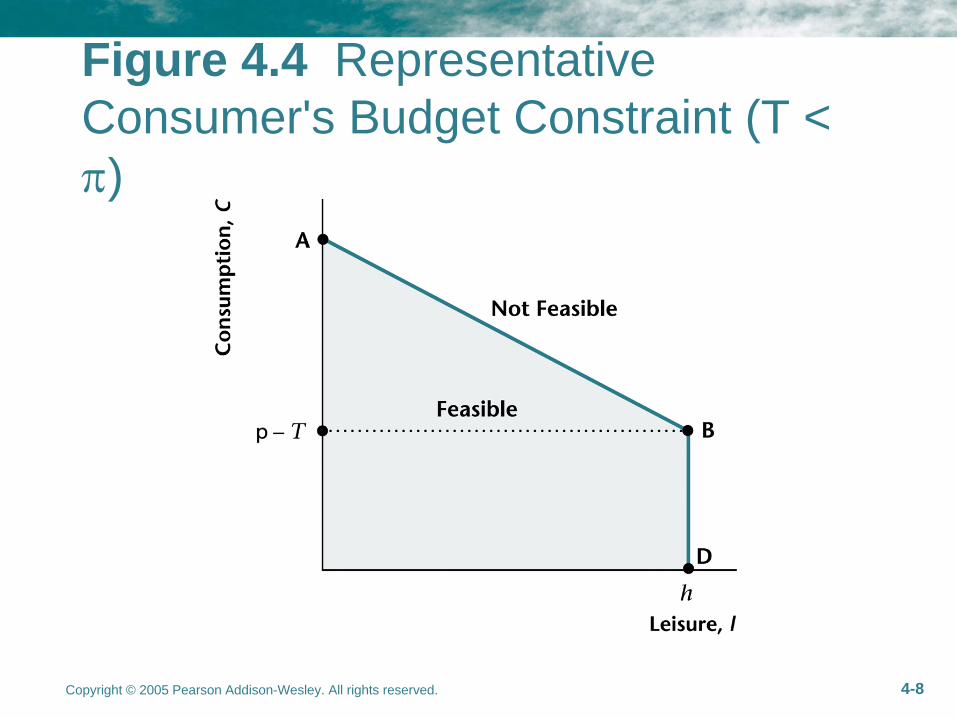
Figure 4.4 Representative Consumer's Budget Constraint (T < )
Copyright © 2005 Pearson Addison-Wesley. All rights reserved. 4-9
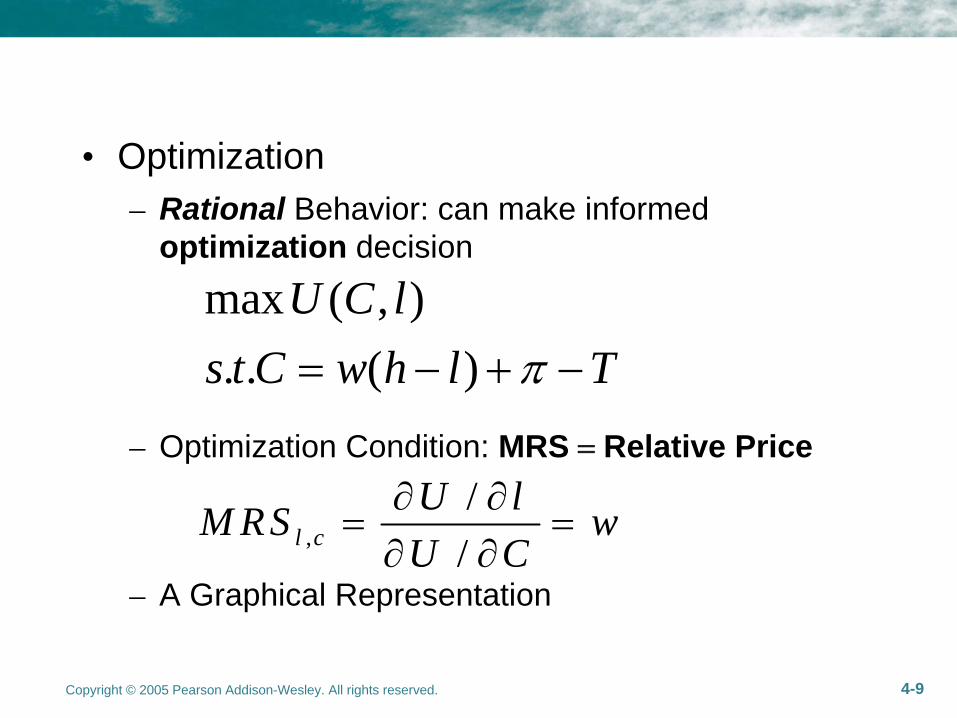
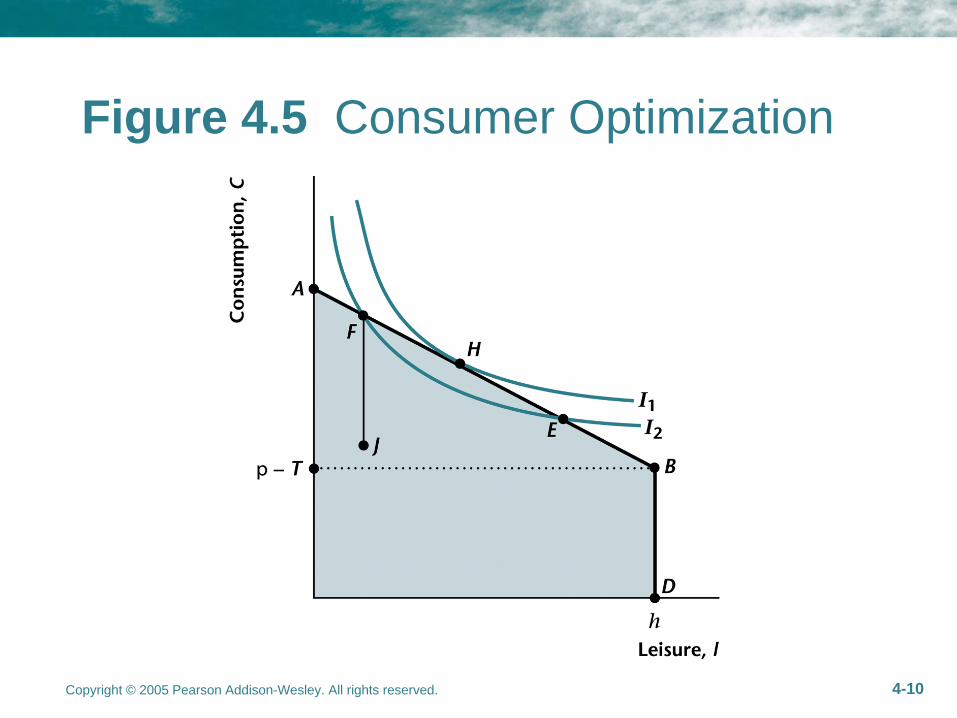
• Optimization– Rational Behavior: can make informed
optimization decision
– Optimization Condition: MRS Relative Price
– A Graphical Representation
,//l c
U lM RS wU C
max ( , ). . ( )
U C ls t C w h l T
Copyright © 2005 Pearson Addison-Wesley. All rights reserved. 4-10
Figure 4.5 Consumer Optimization
Copyright © 2005 Pearson Addison-Wesley. All rights reserved. 4-11
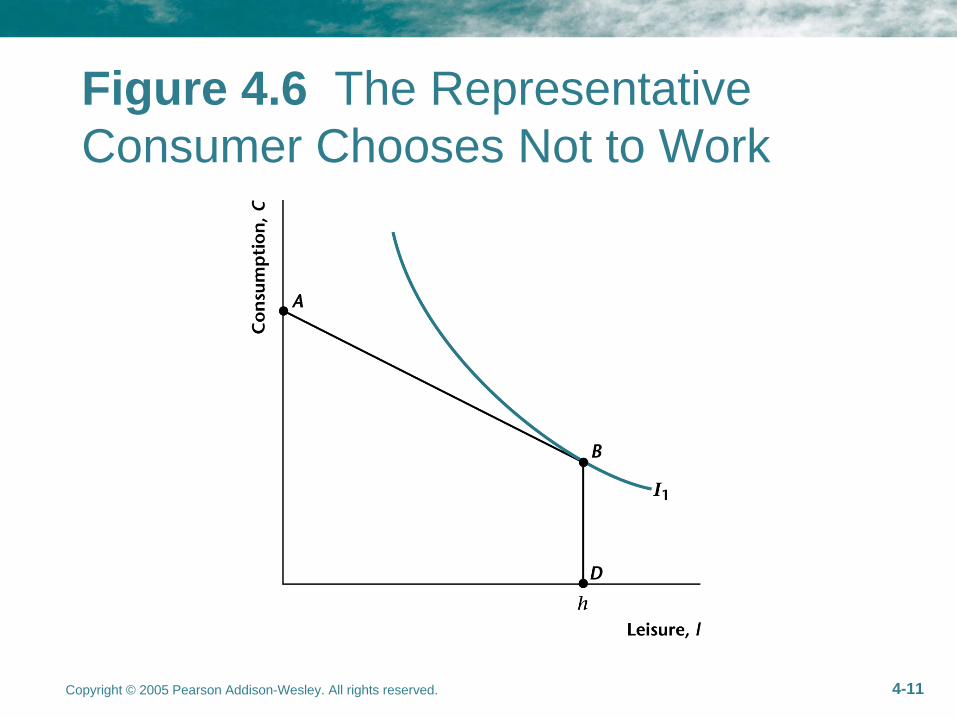
Figure 4.6 The Representative Consumer Chooses Not to Work
Copyright © 2005 Pearson Addison-Wesley. All rights reserved. 4-12
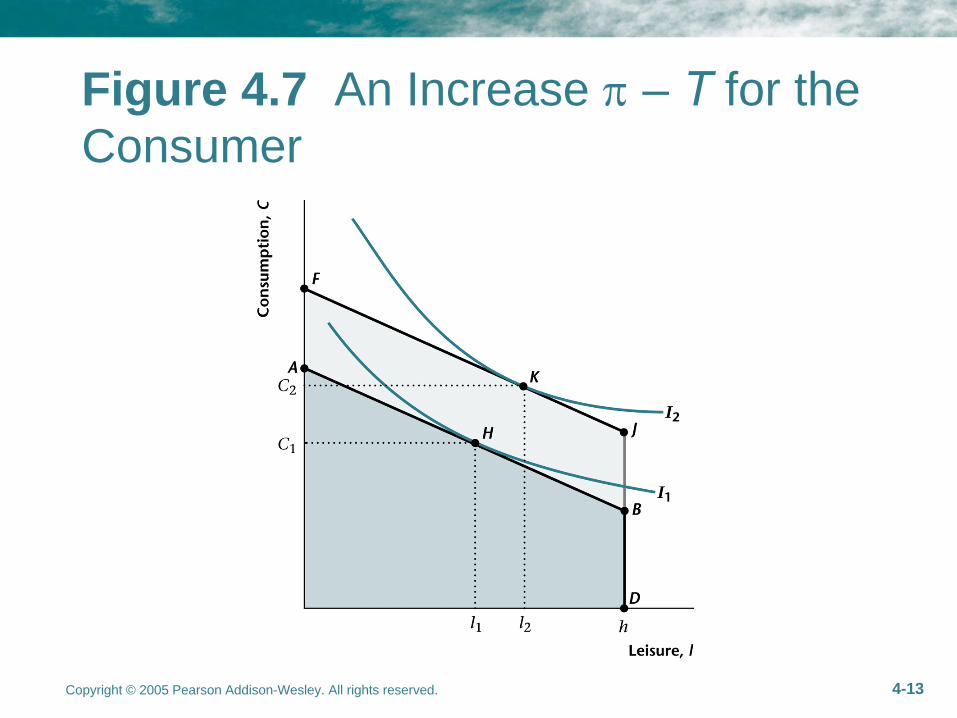
• Comparative Statics Experiments – Changes in Dividends (π) and Taxes (T):
Pure Income Effect, relative price (w) no change
both c
and l
– Changes in the Real Wage (w): Income and Substitution Effects
c
, l
or
Copyright © 2005 Pearson Addison-Wesley. All rights reserved. 4-13
Figure 4.7 An Increase
– T
for the Consumer
Copyright © 2005 Pearson Addison-Wesley. All rights reserved. 4-14
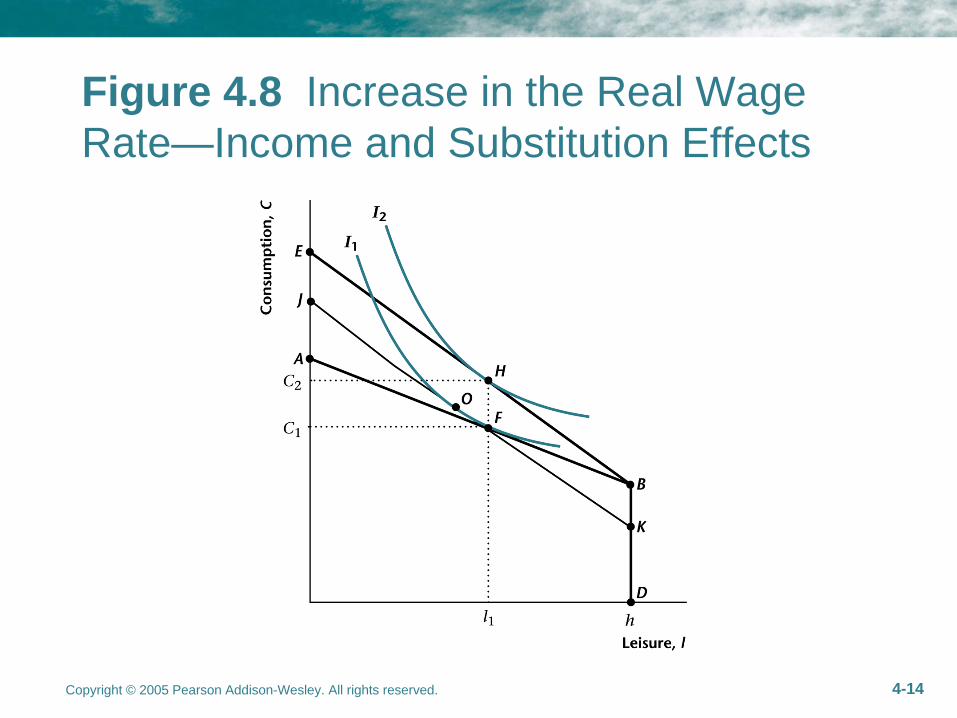
Figure 4.8 Increase in the Real Wage Rate—Income and Substitution Effects
Copyright © 2005 Pearson Addison-Wesley. All rights reserved. 4-15
•Labor Supply Curve: –Substitution Effect > Income Effect
upward-sloping labor supply curve–Substitution Effect < Income Effect
downward-sloping labor supply curve
•Question: What does L Supply Curve look like in the data?
( ) ( )sN w h l w
Copyright © 2005 Pearson Addison-Wesley. All rights reserved. 4-16
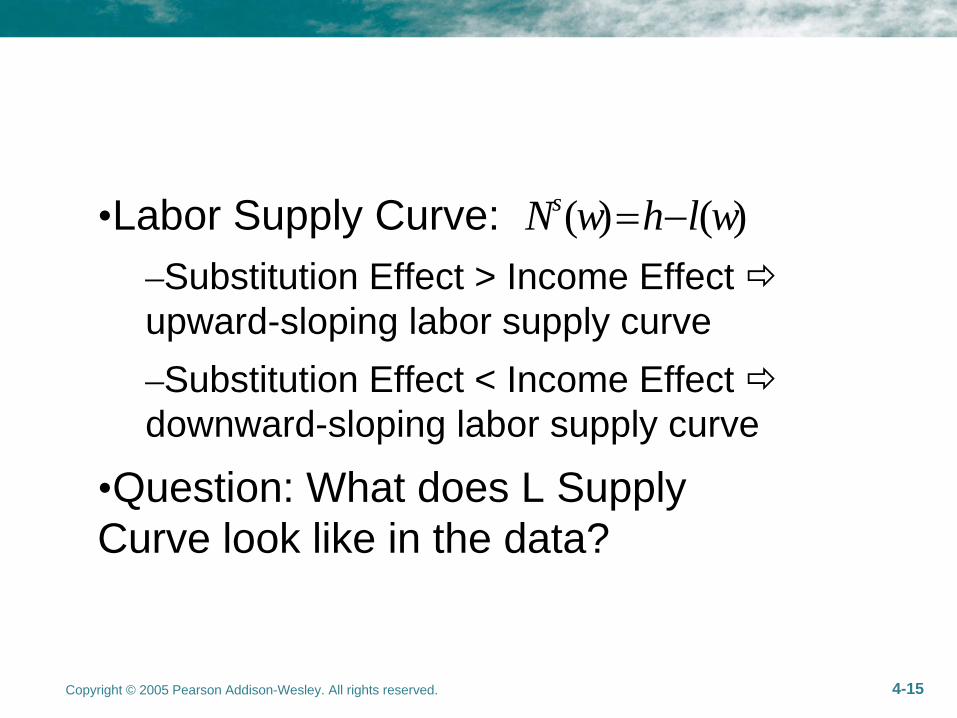
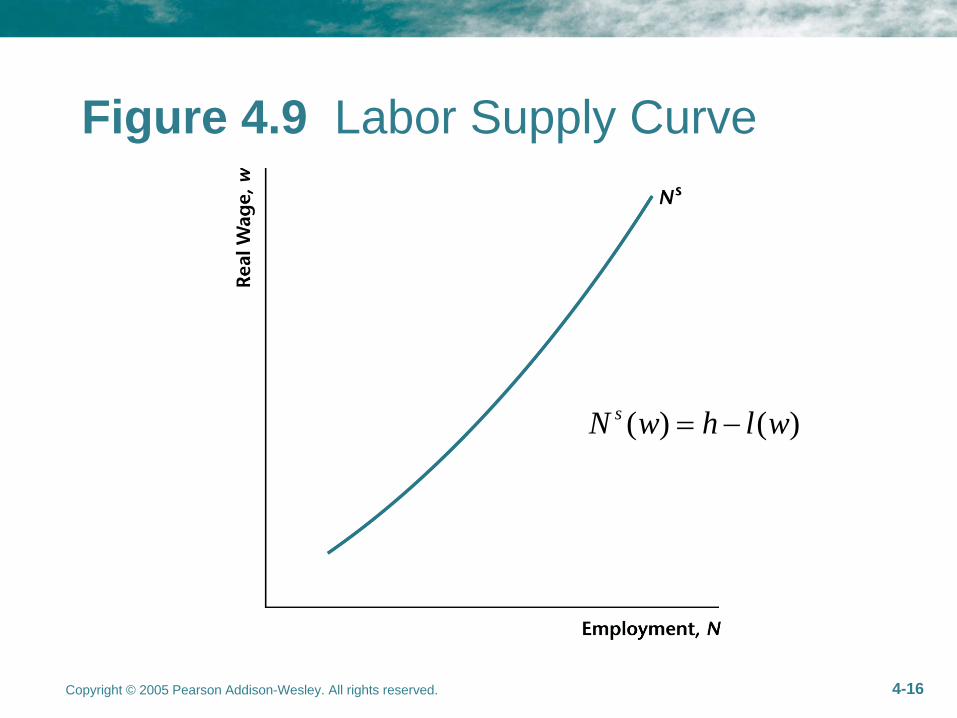
Figure 4.9 Labor Supply Curve
( ) ( )sN w h l w
Copyright © 2005 Pearson Addison-Wesley. All rights reserved. 4-17
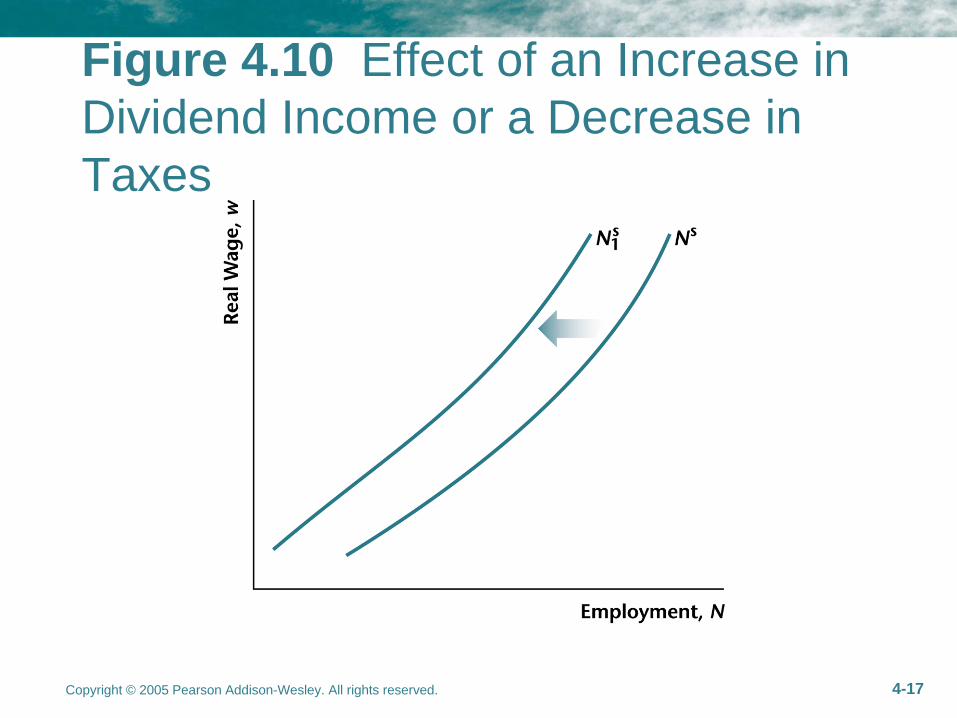
Figure 4.10 Effect of an Increase in Dividend Income or a Decrease in Taxes
Copyright © 2005 Pearson Addison-Wesley. All rights reserved. 4-18
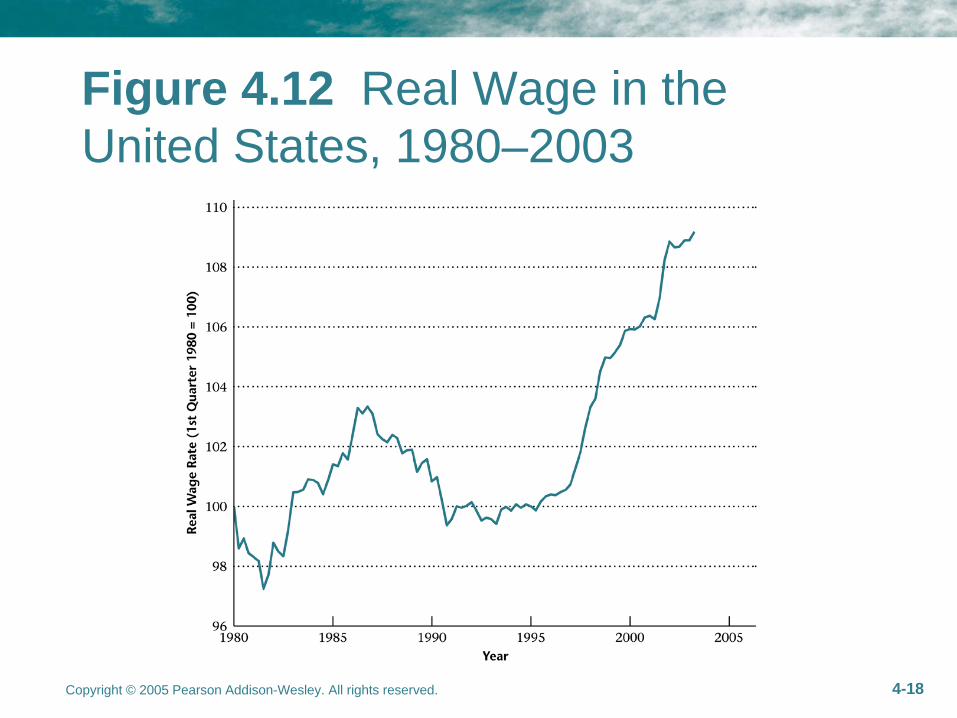
Figure 4.12 Real Wage in the United States, 1980–2003
Copyright © 2005 Pearson Addison-Wesley. All rights reserved. 4-19
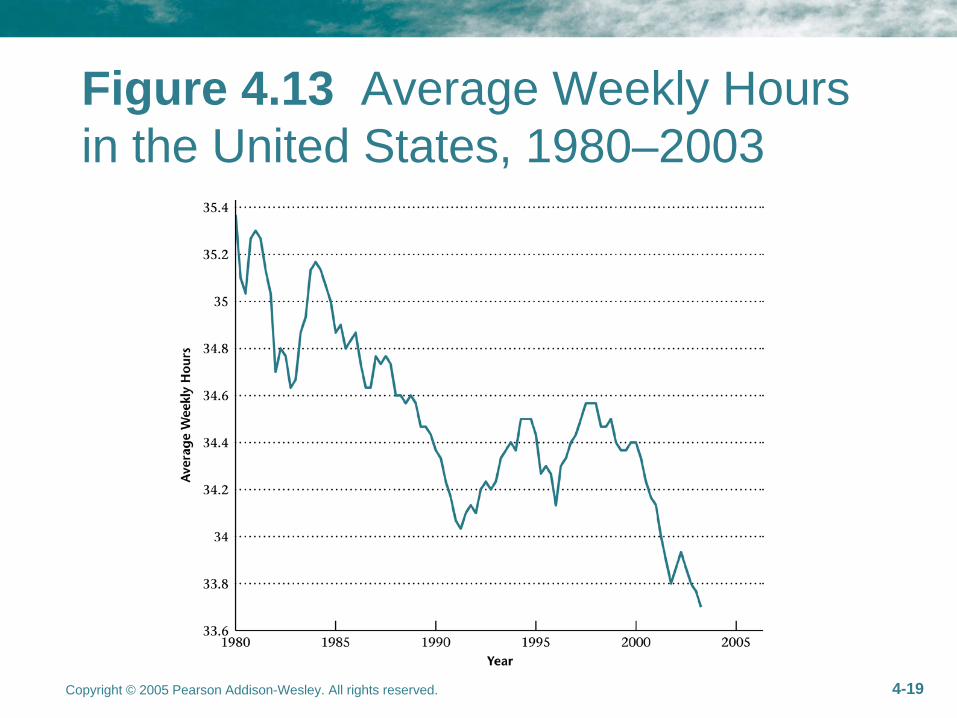
Figure 4.13 Average Weekly Hours in the United States, 1980–2003
Copyright © 2005 Pearson Addison-Wesley. All rights reserved. 4-20
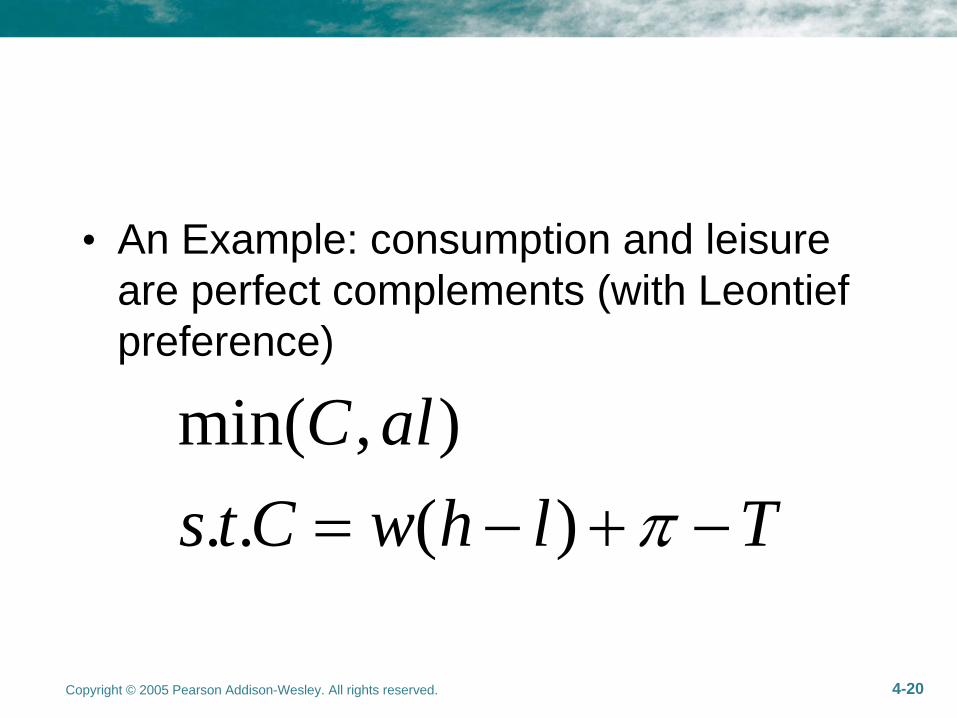
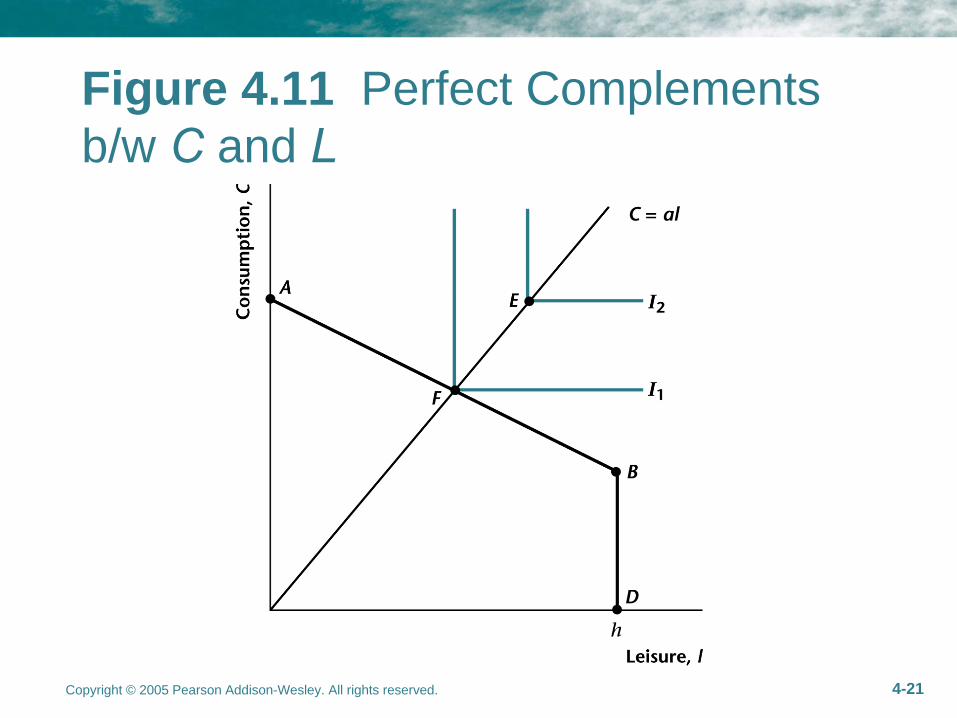
• An Example: consumption and leisure are perfect complements (with Leontief preference)
min( , ). . ( )
C als t C w h l T
Copyright © 2005 Pearson Addison-Wesley. All rights reserved. 4-21
Figure 4.11 Perfect Complements b/w C
and L
Copyright © 2005 Pearson Addison-Wesley. All rights reserved. 4-22
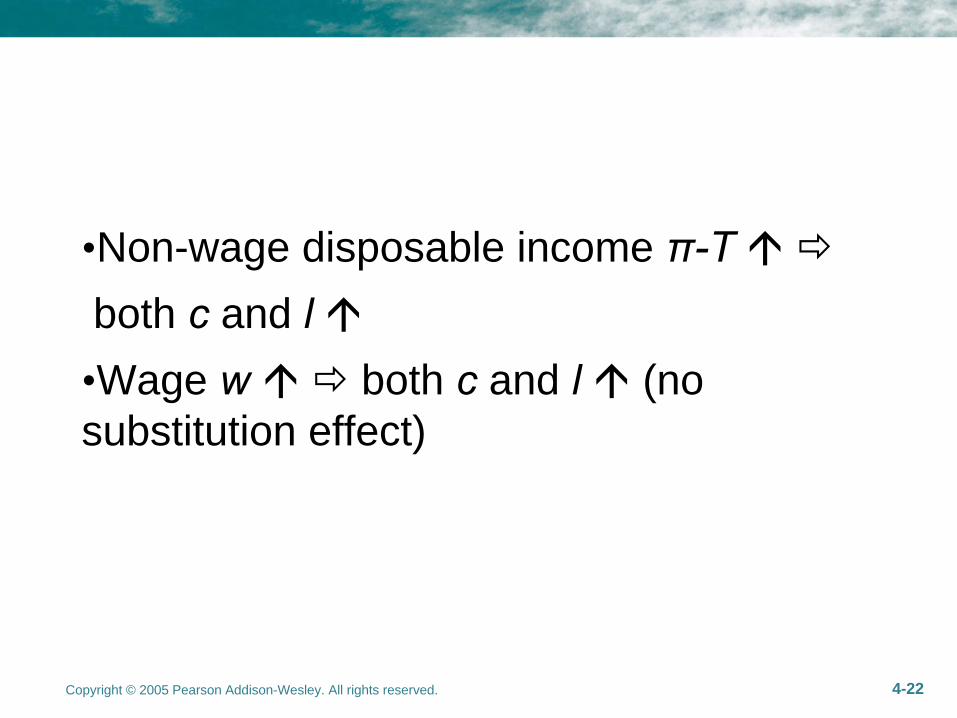
•Non-wage disposable income π-T
both c
and l
•Wage w both c
and l
(no
substitution effect)
Copyright © 2005 Pearson Addison-Wesley. All rights reserved. 4-23
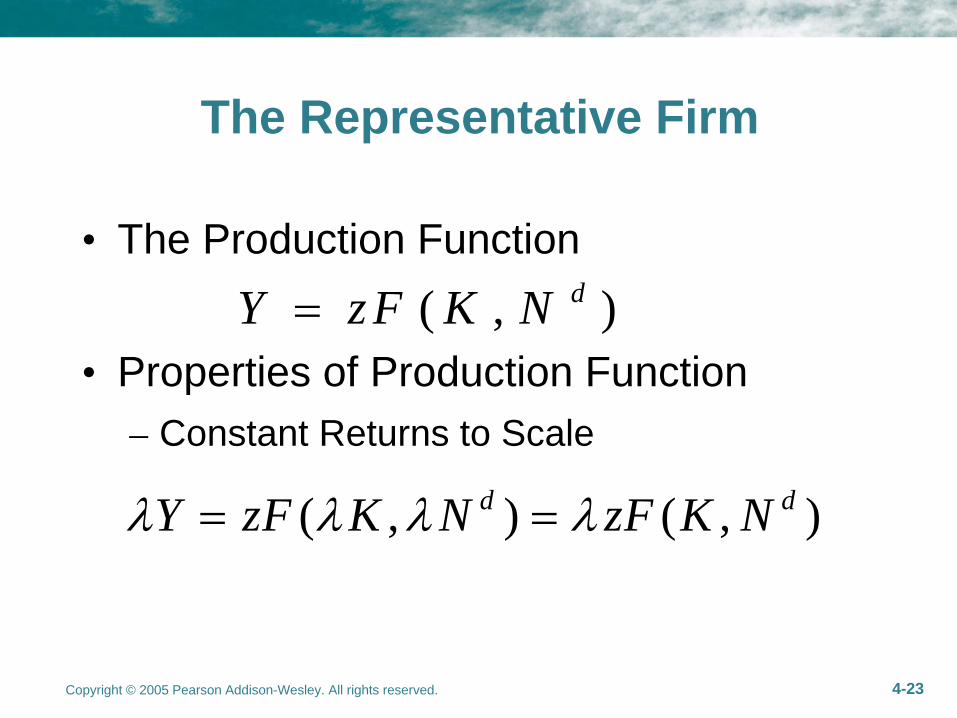
The Representative Firm
• The Production Function
• Properties of Production Function– Constant Returns to Scale
( , )dY zF K N
( , ) ( , )d dY zF K N zF K N
Copyright © 2005 Pearson Addison-Wesley. All rights reserved. 4-24
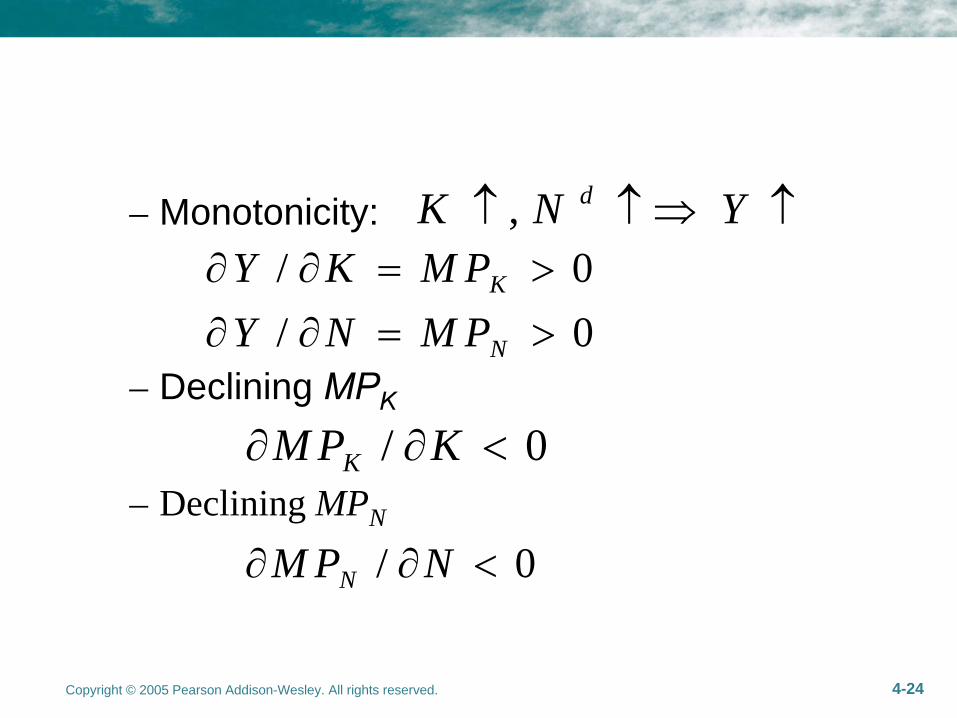
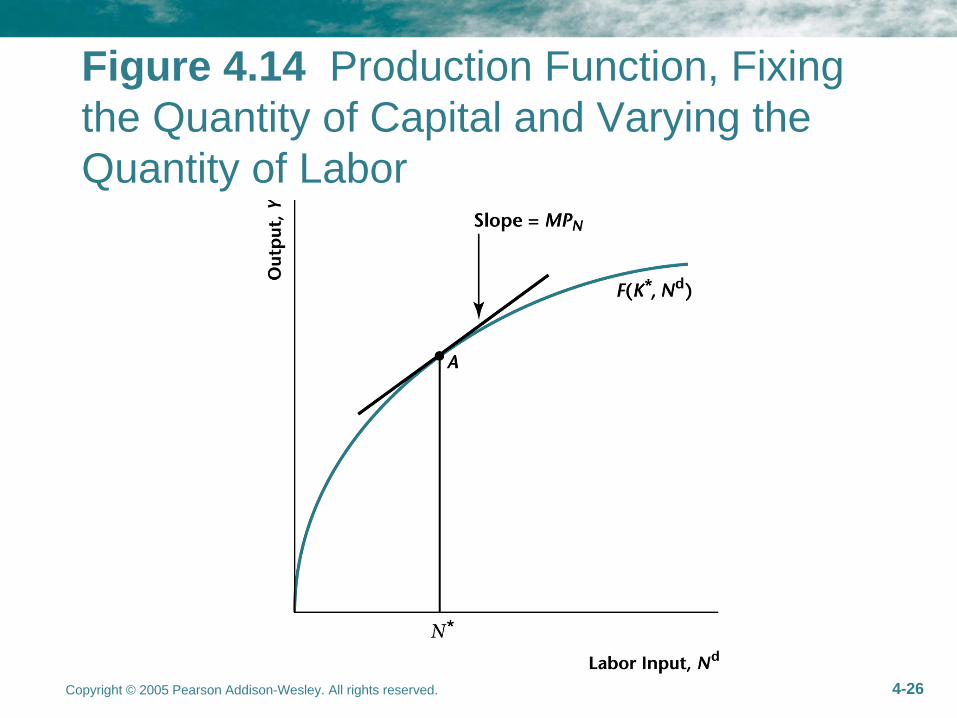
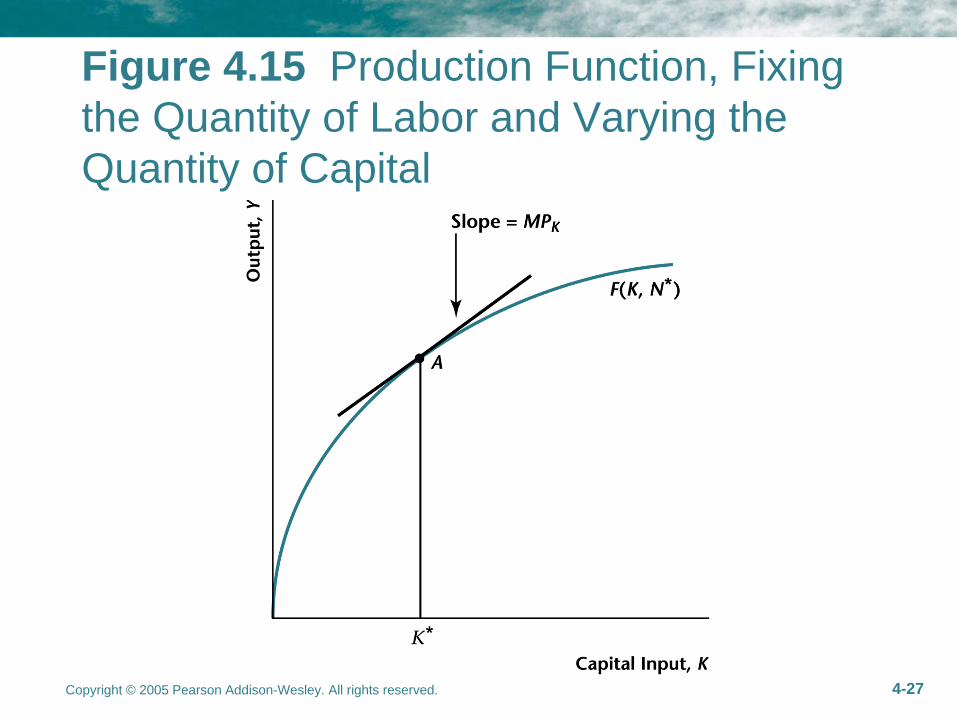
– Monotonicity:
– Declining MPK
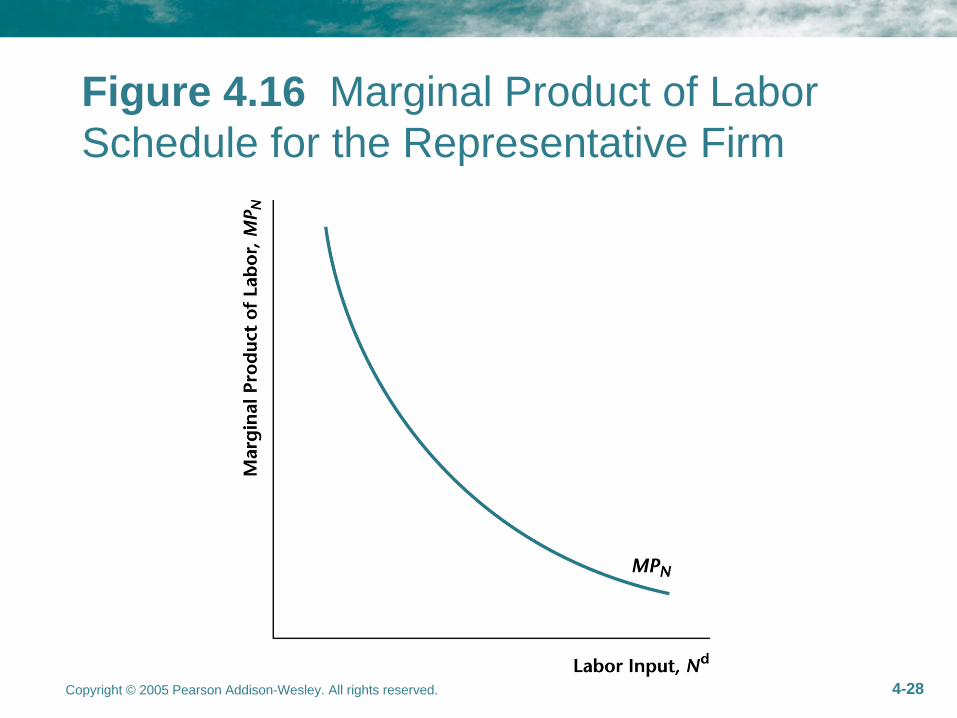
– Declining MPN
/ 0KM P K
/ 0NM P N
/ 0/ 0
K
N
Y K M PY N M P
, dK N Y
Copyright © 2005 Pearson Addison-Wesley. All rights reserved. 4-25
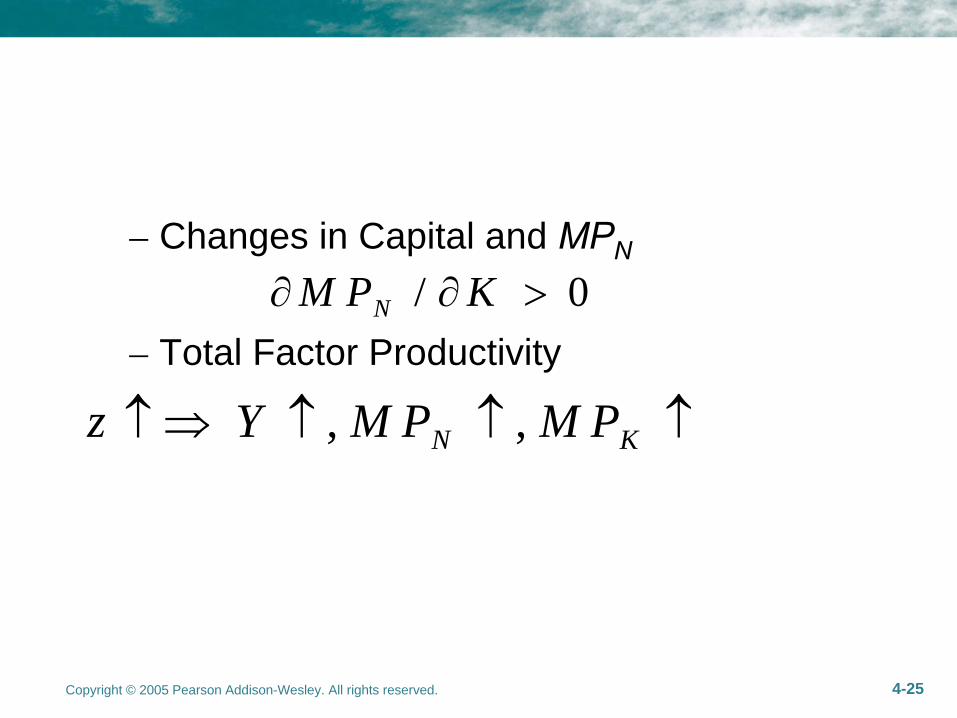
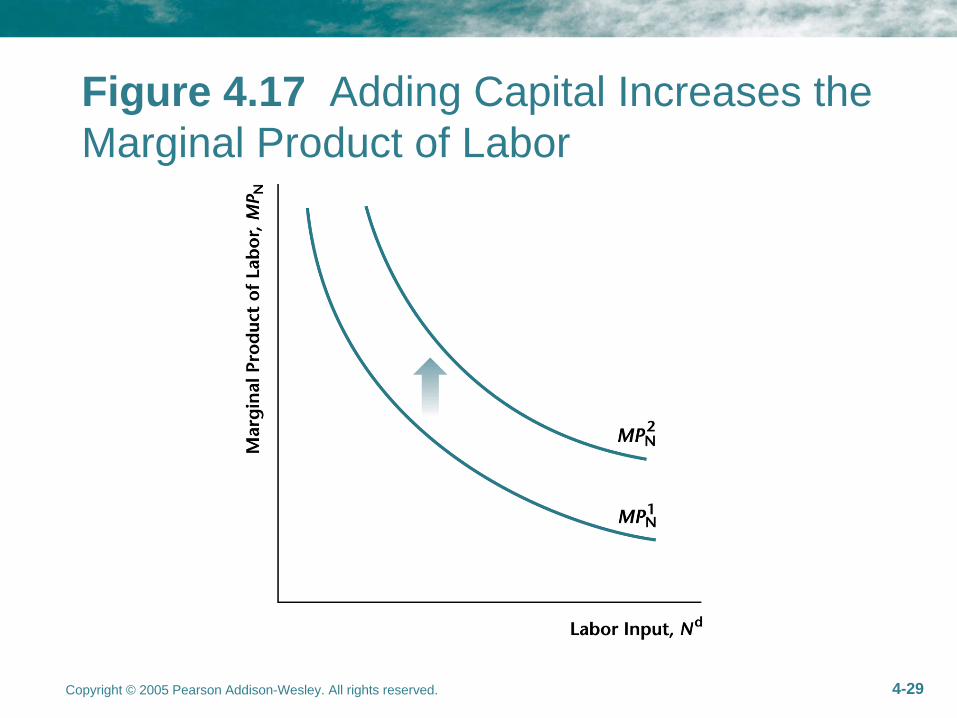
– Changes in Capital and MPN
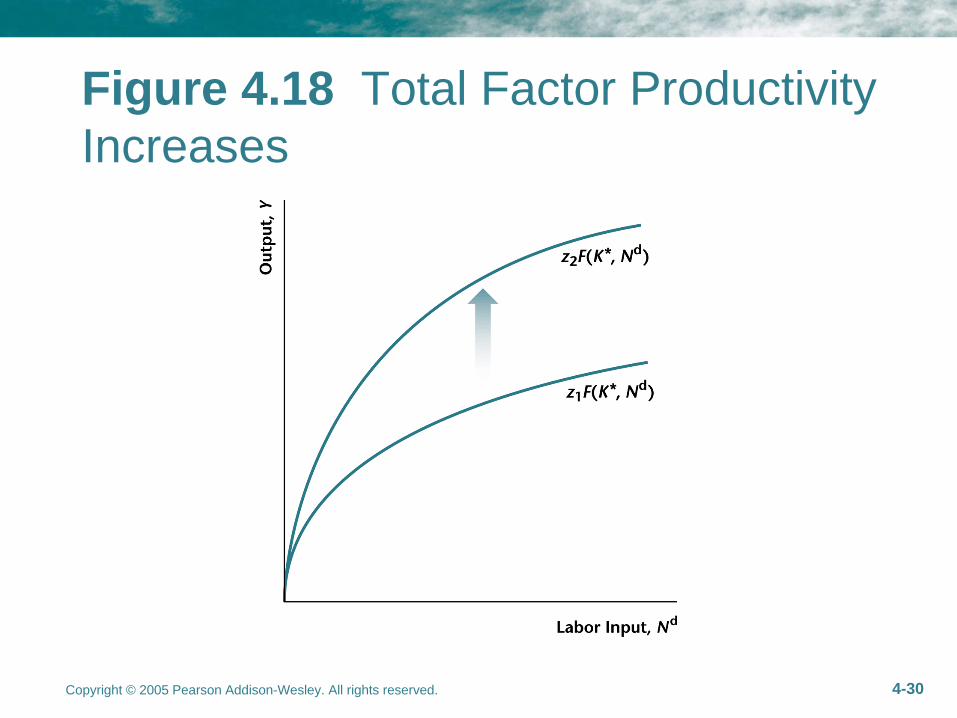
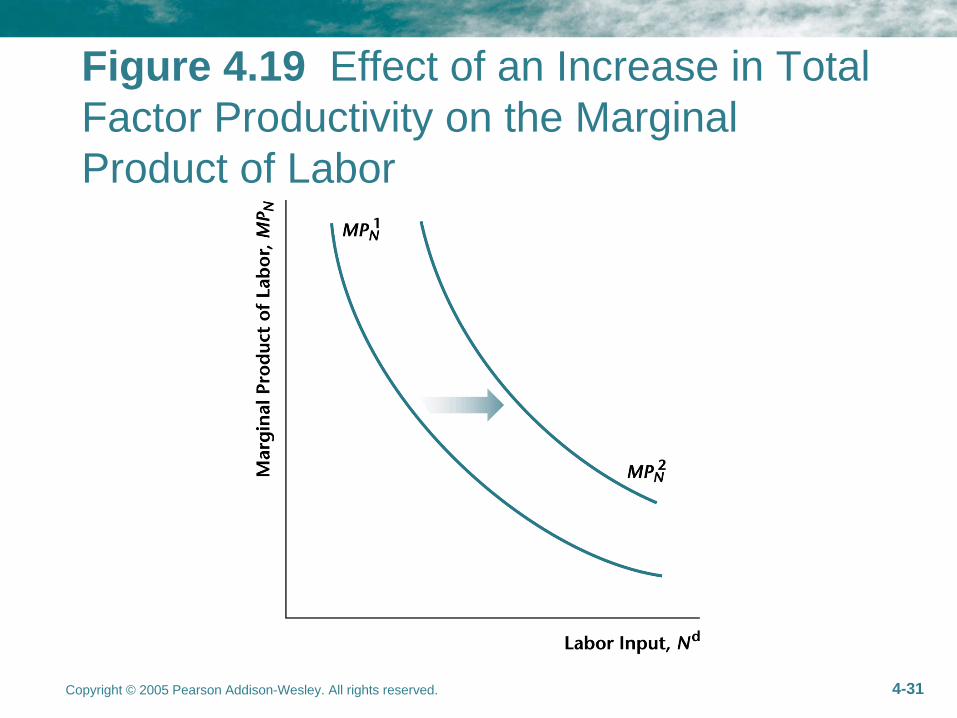
– Total Factor Productivity / 0NM P K
, ,N Kz Y M P M P
Copyright © 2005 Pearson Addison-Wesley. All rights reserved. 4-26
Figure 4.14 Production Function, Fixing the Quantity of Capital and Varying the Quantity of Labor
Copyright © 2005 Pearson Addison-Wesley. All rights reserved. 4-27
Figure 4.15 Production Function, Fixing the Quantity of Labor and Varying the Quantity of Capital
Copyright © 2005 Pearson Addison-Wesley. All rights reserved. 4-28
Figure 4.16 Marginal Product of Labor Schedule for the Representative Firm
Copyright © 2005 Pearson Addison-Wesley. All rights reserved. 4-29
Figure 4.17 Adding Capital Increases the Marginal Product of Labor
Copyright © 2005 Pearson Addison-Wesley. All rights reserved. 4-30
Figure 4.18 Total Factor Productivity Increases
Copyright © 2005 Pearson Addison-Wesley. All rights reserved. 4-31
Figure 4.19 Effect of an Increase in Total Factor Productivity on the Marginal Product of Labor
Copyright © 2005 Pearson Addison-Wesley. All rights reserved. 4-32
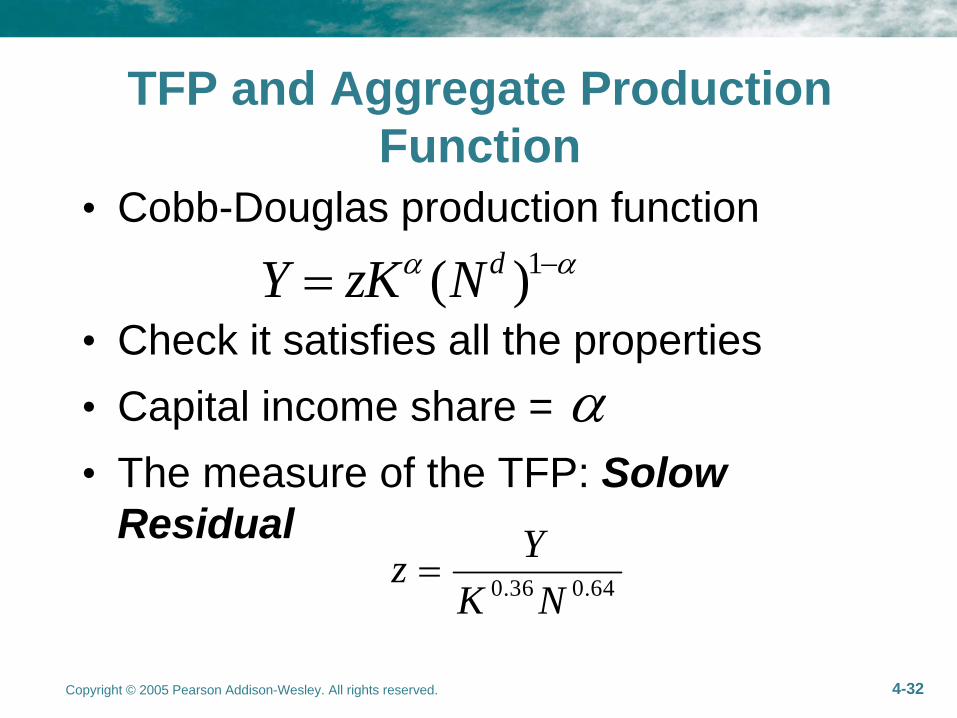
TFP and Aggregate Production Function
• Cobb-Douglas production function
• Check it satisfies all the properties• Capital income share = • The measure of the TFP: Solow
Residual
1( )dY zK N
0.36 0.64
YzK N
Copyright © 2005 Pearson Addison-Wesley. All rights reserved. 4-33
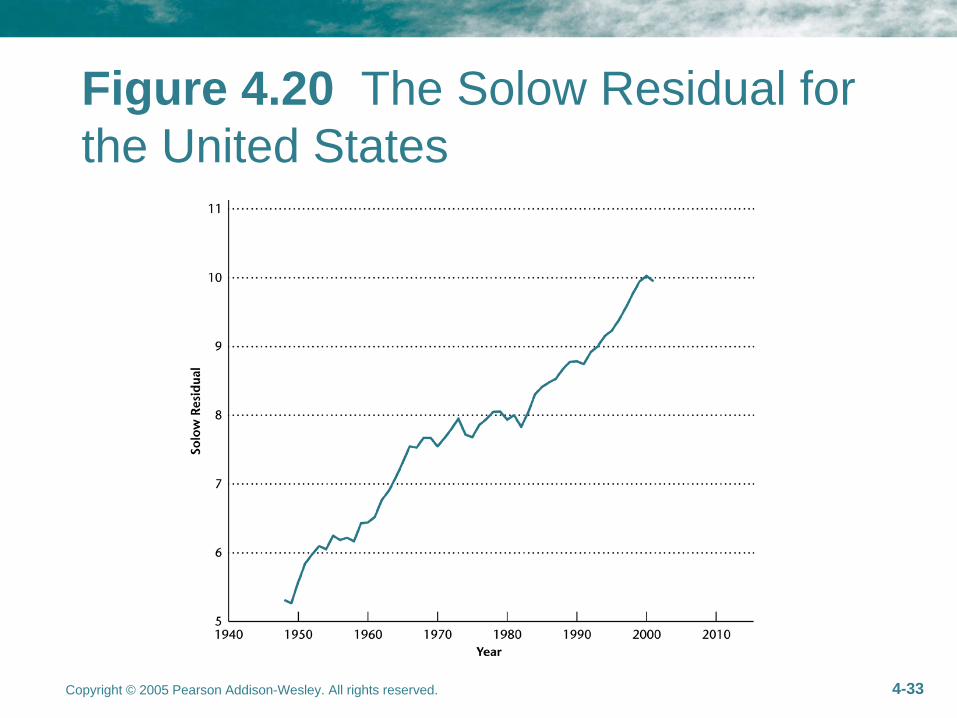
Figure 4.20 The Solow Residual for the United States
Copyright © 2005 Pearson Addison-Wesley. All rights reserved. 4-34
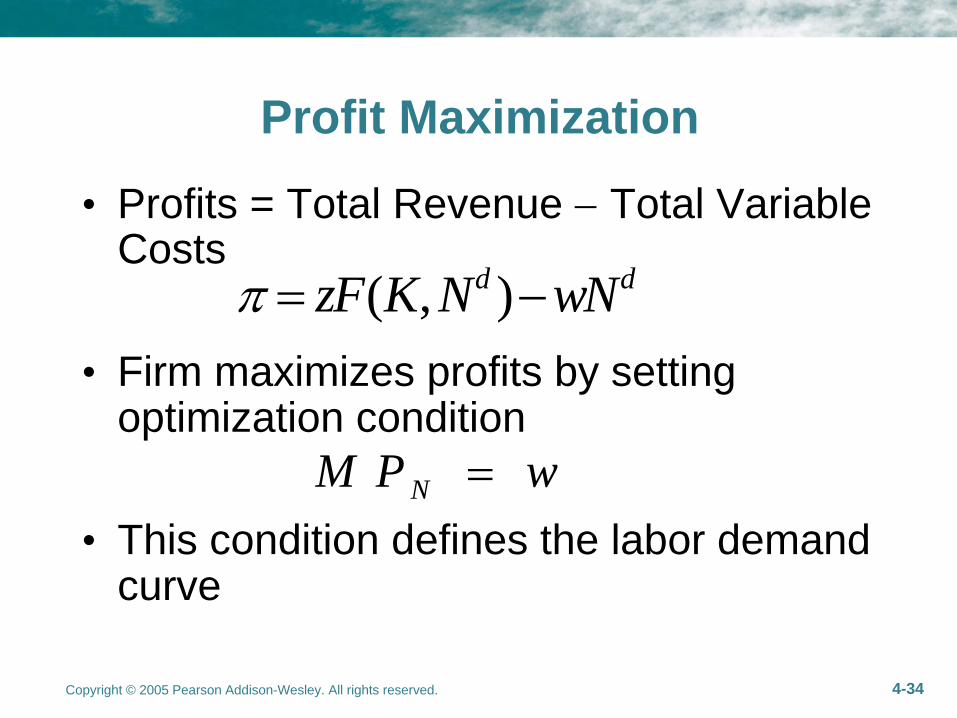
Profit Maximization
• Profits = Total Revenue
Total Variable Costs
• Firm maximizes profits by setting optimization condition
• This condition defines the labor demand curve
( , )d dzF K N wN
NM P w
Copyright © 2005 Pearson Addison-Wesley. All rights reserved. 4-35
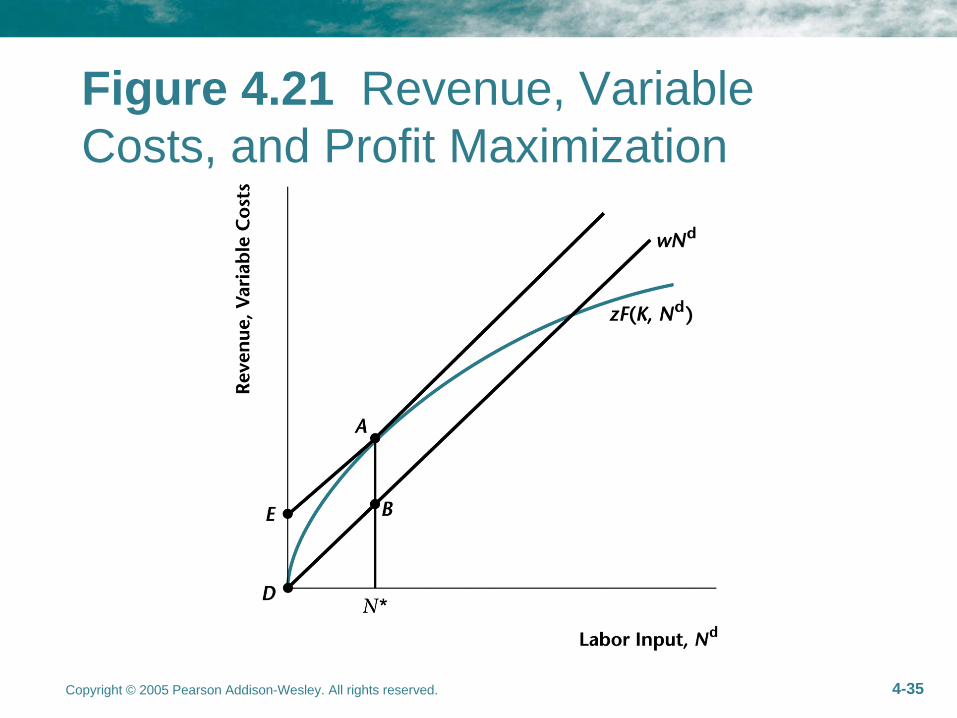
Figure 4.21 Revenue, Variable Costs, and Profit Maximization
Copyright © 2005 Pearson Addison-Wesley. All rights reserved. 4-36
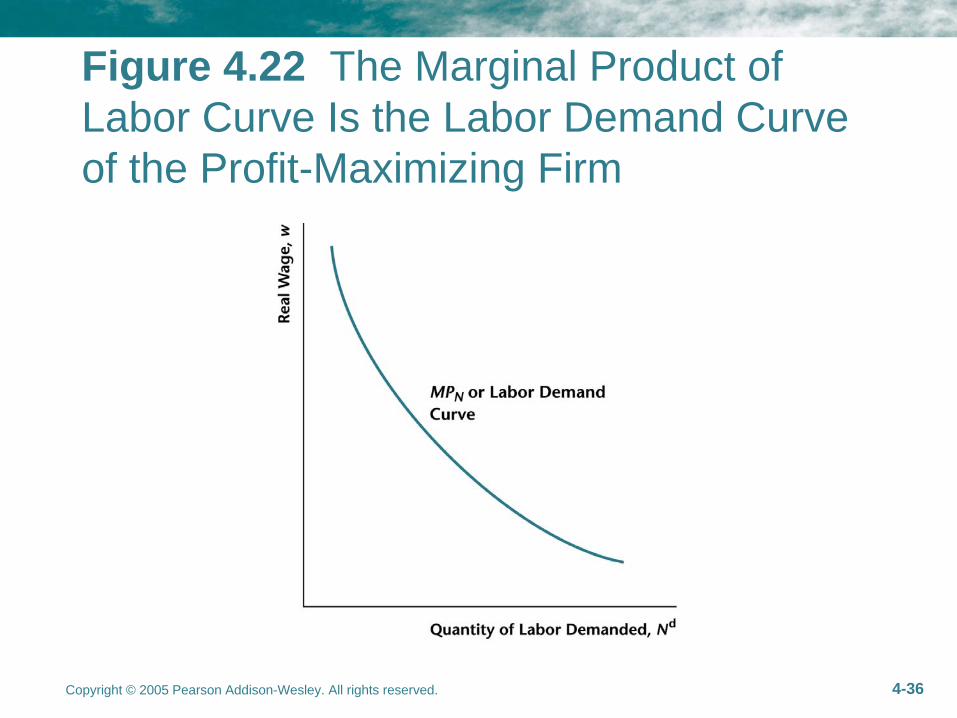
Figure 4.22 The Marginal Product of Labor Curve Is the Labor Demand Curve of the Profit-Maximizing Firm


