44
1 1 1 1 Consumer and Market Insights: Prepared Meals Market in Belgium CS1973MF May 2015
| Date post: | 28-May-2018 |
| Category: |
Documents |
| Upload: | duongnguyet |
| View: | 218 times |
| Download: | 0 times |
1 1 1 1
Consumer and Market Insights: Prepared Meals Market in Belgium
CS1973MF May 2015
2 2 2 04/06/2015 2 6/4/2015 2 6/4/2015 2 6/4/2015 2
This report brings together multiple data sources to provide a comprehensive overview of the Prepared Meals sector
in Belgium as part of our global coverage of the sector. This report draws on market data, analyzing value and
volume data and category and channel distribution breakdown, also highlighting which categories are witnessing the
biggest growth. Brand and Private Label analysis is also provided. It contains top line foodservice transaction figures
highlighting where the most opportunistic channels are for industry players in the country. Detailed packaging
analysis is also provided, analyzing category trends and also packaging material and type.
Market data coverage: The overall market value and volume data included in the report is for the period 2014-
2019.
Category coverage: This report provides information on three categories including Meal Kits, Pizza and Ready
Meals.
More extensive brand coverage: The report provides more extensive brand share coverage. Brand share data is
also validated by inputs from industry experts.
Distribution channel: The Distribution data included in the report covers 11 distribution channels including Cash &
Carries & Warehouse Clubs, “Dollar Stores”, Variety Stores & General Merchandise Retailers, Hypermarkets &
Supermarkets, Convenience Stores
Time period: The report provides overall market value and volume data, including category level data for the period
2009-2019. Distribution channel and brand share data is included for the year 2014.
Report scope
3 3 3
Table of Contents
• Country Context
• Market Overview
• Retail Landscape and Key Distribution Channels
• Packaging
• Brand and Private Label Share
• Appendix
4 4 4
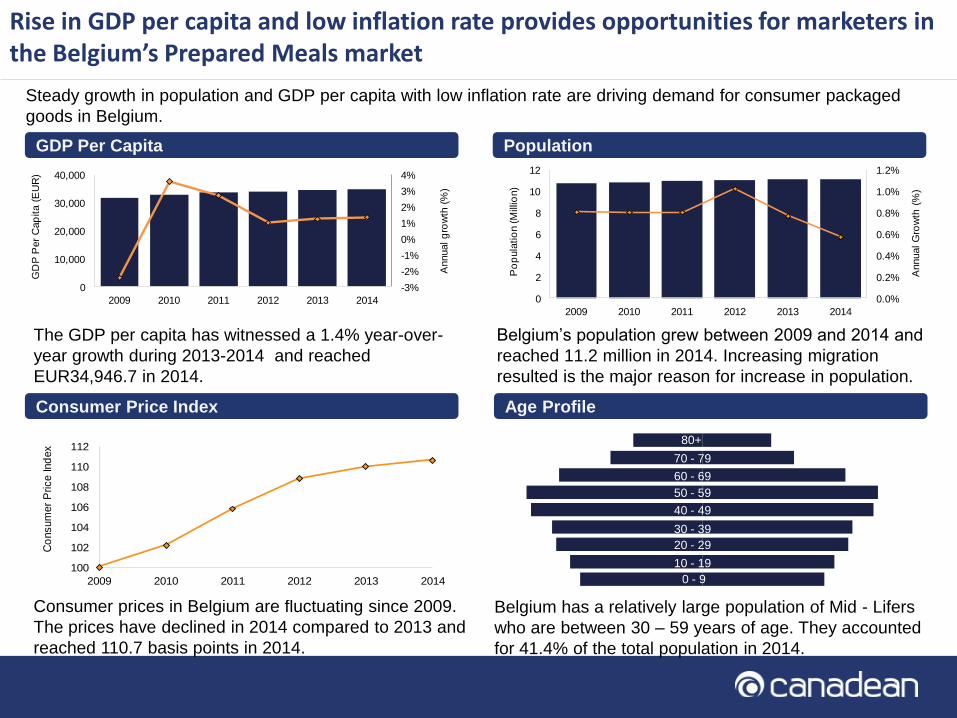
Rise in GDP per capita and low inflation rate provides opportunities for marketers in the Belgium’s Prepared Meals market
The GDP per capita has witnessed a 1.4% year-over-
year growth during 2013-2014 and reached
EUR34,946.7 in 2014.
Belgium has a relatively large population of Mid - Lifers
who are between 30 – 59 years of age. They accounted
for 41.4% of the total population in 2014.
Consumer prices in Belgium are fluctuating since 2009.
The prices have declined in 2014 compared to 2013 and
reached 110.7 basis points in 2014.
Belgium’s population grew between 2009 and 2014 and
reached 11.2 million in 2014. Increasing migration
resulted is the major reason for increase in population.
Steady growth in population and GDP per capita with low inflation rate are driving demand for consumer packaged
goods in Belgium.
GDP Per Capita Population
Consumer Price Index Age Profile
-3%
-2%
-1%
0%
1%
2%
3%
4%
0
10,000
20,000
30,000
40,000
2009 2010 2011 2012 2013 2014
GD
P P
er
Cap
ita (
EU
R)
Annual g
row
th (
%)
100
102
104
106
108
110
112
2009 2010 2011 2012 2013 2014
Co
nsum
er
Price Ind
ex
0 - 9
10 - 19
20 - 29
30 - 39
40 - 49
50 - 59
60 - 69
70 - 79
80+
0.0%
0.2%
0.4%
0.6%
0.8%
1.0%
1.2%
0
2
4
6
8
10
12
2009 2010 2011 2012 2013 2014
Annual G
row
th (
%)
Po
pula
tio
n (M
illio
n)
5 5 5
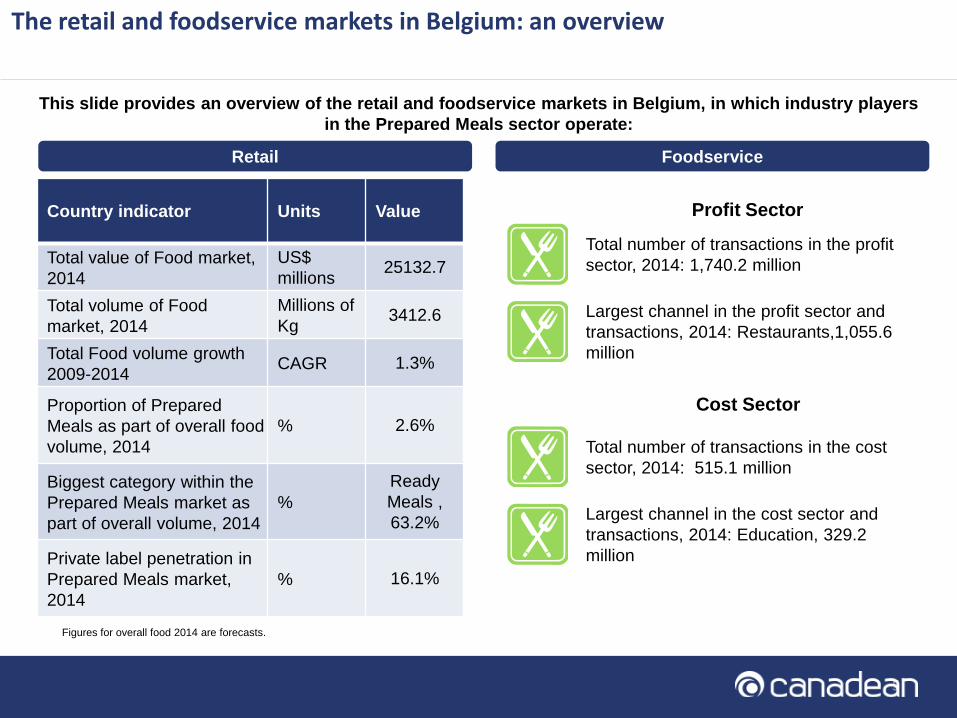
The retail and foodservice markets in Belgium: an overview
Foodservice
This slide provides an overview of the retail and foodservice markets in Belgium, in which industry players
in the Prepared Meals sector operate:
Profit Sector
Total number of transactions in the profit
sector, 2014: 1,740.2 million
Largest channel in the profit sector and
transactions, 2014: Restaurants,1,055.6
million
Cost Sector
Total number of transactions in the cost
sector, 2014: 515.1 million
Largest channel in the cost sector and
transactions, 2014: Education, 329.2
million
Retail
Country indicator Units Value
Total value of Food market,
2014
US$
millions 25132.7
Total volume of Food
market, 2014
Millions of
Kg 3412.6
Total Food volume growth
2009-2014 CAGR 1.3%
Proportion of Prepared
Meals as part of overall food
volume, 2014
% 2.6%
Biggest category within the
Prepared Meals market as
part of overall volume, 2014
%
Ready
Meals ,
63.2%
Private label penetration in
Prepared Meals market,
2014
% 16.1%
Figures for overall food 2014 are forecasts.
6 6 6
Table of Contents
• Country Context
• Market Overview
• Retail Landscape and Key Distribution Channels
• Packaging
• Brand and Private Label Share
• Appendix
7 7 7
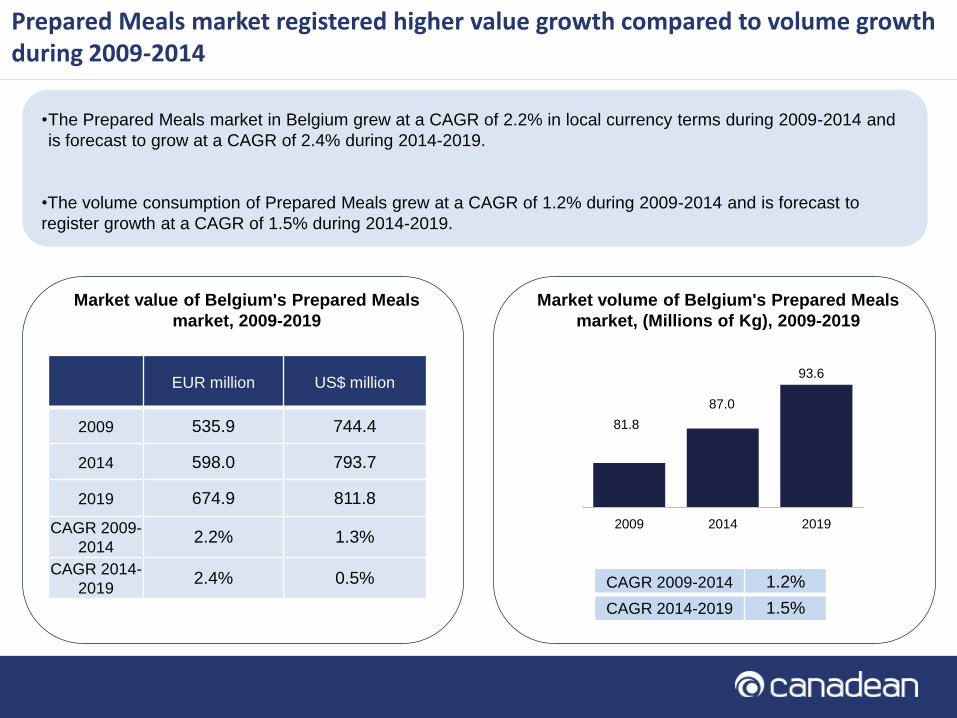
Prepared Meals market registered higher value growth compared to volume growth during 2009-2014
Market value of Belgium's Prepared Meals
market, 2009-2019
Market volume of Belgium's Prepared Meals
market, (Millions of Kg), 2009-2019
CAGR 2009-2014 1.2%
CAGR 2014-2019 1.5%
•The Prepared Meals market in Belgium grew at a CAGR of 2.2% in local currency terms during 2009-2014 and
is forecast to grow at a CAGR of 2.4% during 2014-2019.
•The volume consumption of Prepared Meals grew at a CAGR of 1.2% during 2009-2014 and is forecast to
register growth at a CAGR of 1.5% during 2014-2019.
EUR million US$ million
2009 535.9 744.4
2014 598.0 793.7
2019 674.9 811.8
CAGR 2009-
2014 2.2% 1.3%
CAGR 2014-
2019 2.4% 0.5%
81.8
87.0
93.6
2009 2014 2019
8 8 8
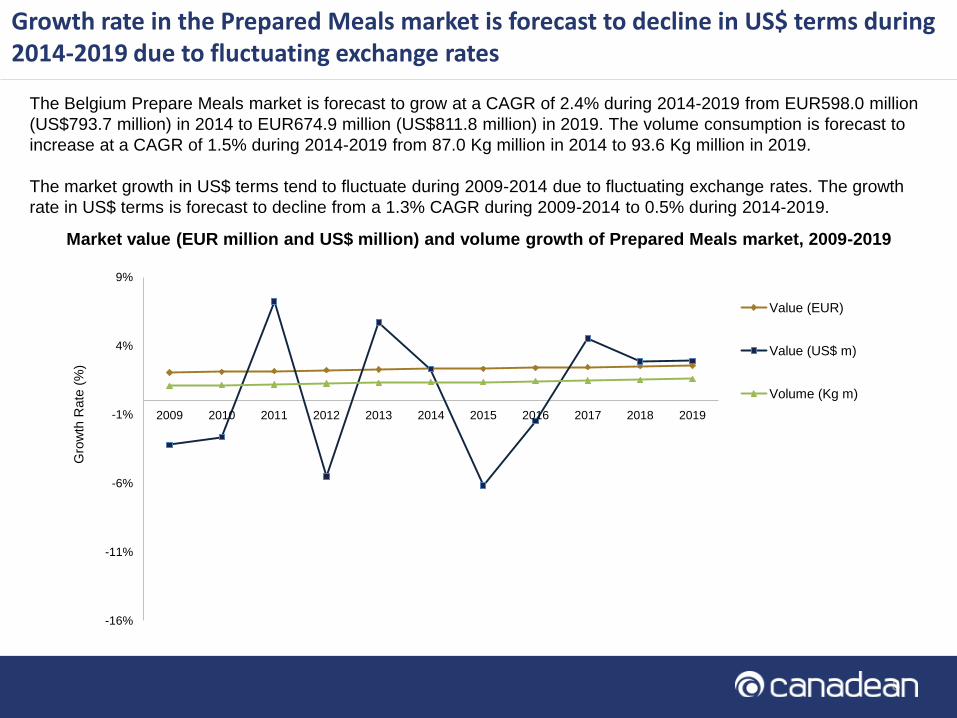
Growth rate in the Prepared Meals market is forecast to decline in US$ terms during 2014-2019 due to fluctuating exchange rates
The Belgium Prepare Meals market is forecast to grow at a CAGR of 2.4% during 2014-2019 from EUR598.0 million
(US$793.7 million) in 2014 to EUR674.9 million (US$811.8 million) in 2019. The volume consumption is forecast to
increase at a CAGR of 1.5% during 2014-2019 from 87.0 Kg million in 2014 to 93.6 Kg million in 2019.
The market growth in US$ terms tend to fluctuate during 2009-2014 due to fluctuating exchange rates. The growth
rate in US$ terms is forecast to decline from a 1.3% CAGR during 2009-2014 to 0.5% during 2014-2019.
Market value (EUR million and US$ million) and volume growth of Prepared Meals market, 2009-2019
-16%
-11%
-6%
-1%
4%
9%
2009 2010 2011 2012 2013 2014 2015 2016 2017 2018 2019
Gro
wth
Rate
(%
)
Value (EUR)
Value (US$ m)
Volume (Kg m)
9 9 9
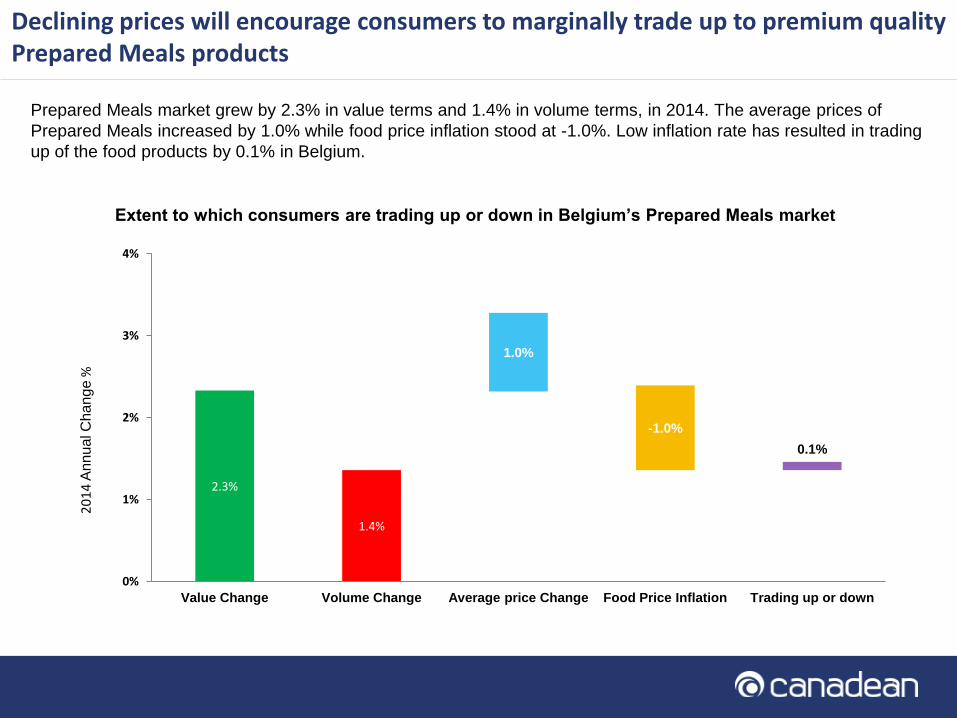
Declining prices will encourage consumers to marginally trade up to premium quality Prepared Meals products
Extent to which consumers are trading up or down in Belgium’s Prepared Meals market
Prepared Meals market grew by 2.3% in value terms and 1.4% in volume terms, in 2014. The average prices of
Prepared Meals increased by 1.0% while food price inflation stood at -1.0%. Low inflation rate has resulted in trading
up of the food products by 0.1% in Belgium.
2.3%
1.4%
1.0%
-1.0%
0.1%
0%
1%
2%
3%
4%
Value Change Volume Change Average price Change Food Price Inflation Trading up or down
20
14
An
nu
al C
han
ge
%
10 10 10
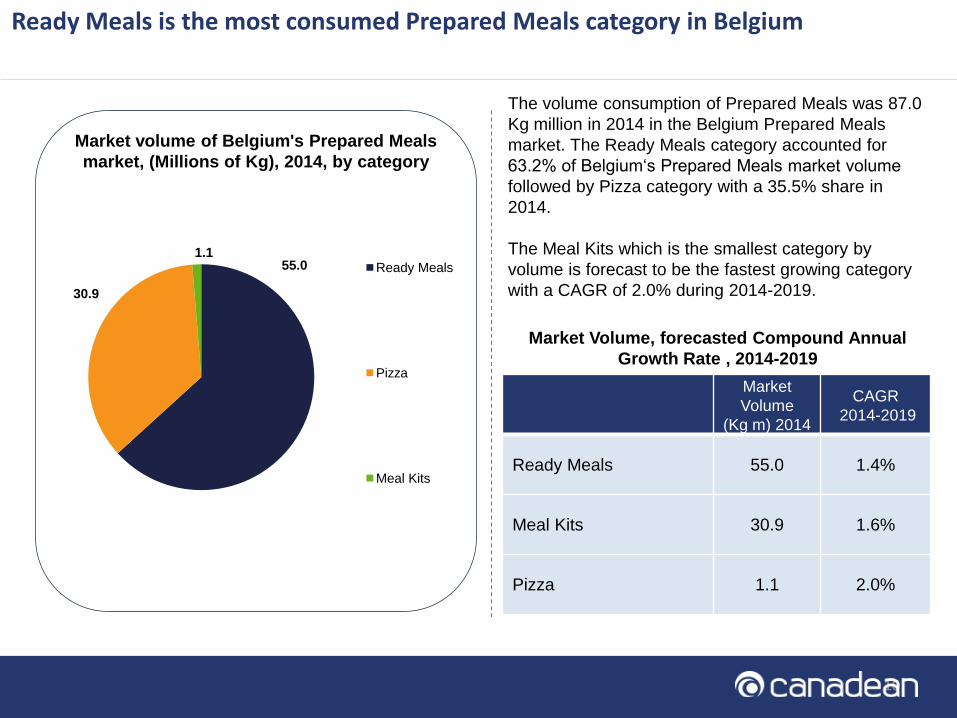
Ready Meals is the most consumed Prepared Meals category in Belgium
Market volume of Belgium's Prepared Meals
market, (Millions of Kg), 2014, by category
The volume consumption of Prepared Meals was 87.0
Kg million in 2014 in the Belgium Prepared Meals
market. The Ready Meals category accounted for
63.2% of Belgium‘s Prepared Meals market volume
followed by Pizza category with a 35.5% share in
2014.
The Meal Kits which is the smallest category by
volume is forecast to be the fastest growing category
with a CAGR of 2.0% during 2014-2019.
Market Volume, forecasted Compound Annual
Growth Rate , 2014-2019
Market
Volume
(Kg m) 2014
CAGR
2014-2019
Ready Meals 55.0 1.4%
Meal Kits 30.9 1.6%
Pizza 1.1 2.0%
55.0
30.9
1.1 Ready Meals
Pizza
Meal Kits
11 11 11
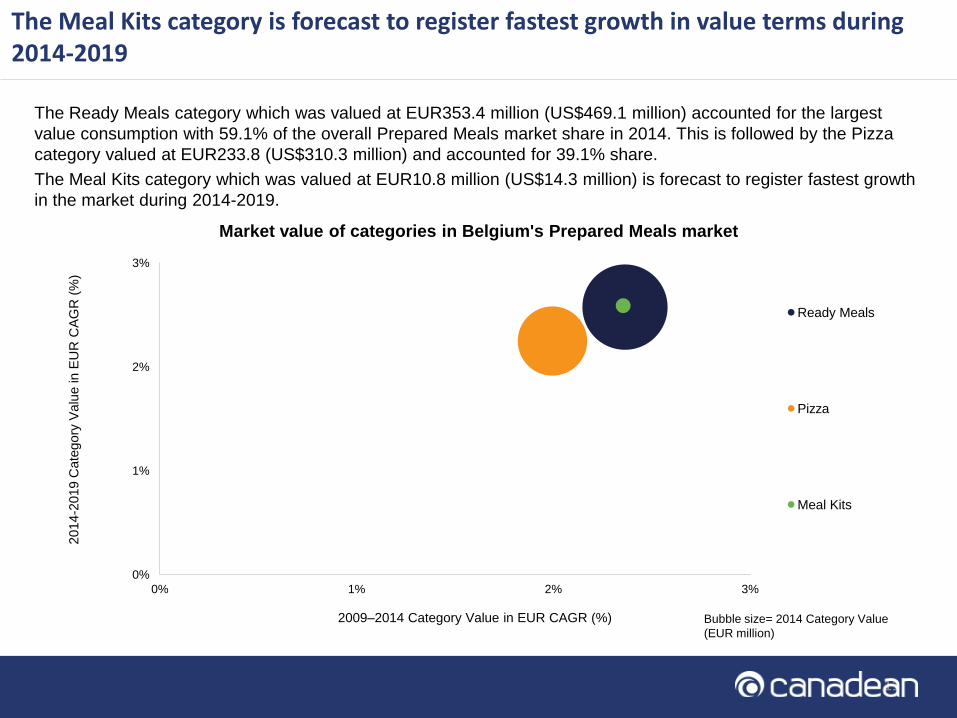
The Meal Kits category is forecast to register fastest growth in value terms during 2014-2019
Market value of categories in Belgium's Prepared Meals market
The Ready Meals category which was valued at EUR353.4 million (US$469.1 million) accounted for the largest
value consumption with 59.1% of the overall Prepared Meals market share in 2014. This is followed by the Pizza
category valued at EUR233.8 (US$310.3 million) and accounted for 39.1% share.
The Meal Kits category which was valued at EUR10.8 million (US$14.3 million) is forecast to register fastest growth
in the market during 2014-2019.
0%
1%
2%
3%
0% 1% 2% 3%
2009–2014 Category Value in EUR CAGR (%)
Ready Meals
Pizza
Meal Kits
2
014-2
019 C
ate
gory
Valu
e in E
UR
CA
GR
(%
)
Bubble size= 2014 Category Value
(EUR million)
12 12 12 04/06/2015 12 6/4/2015 12 6/4/2015 12 6/4/2015 12
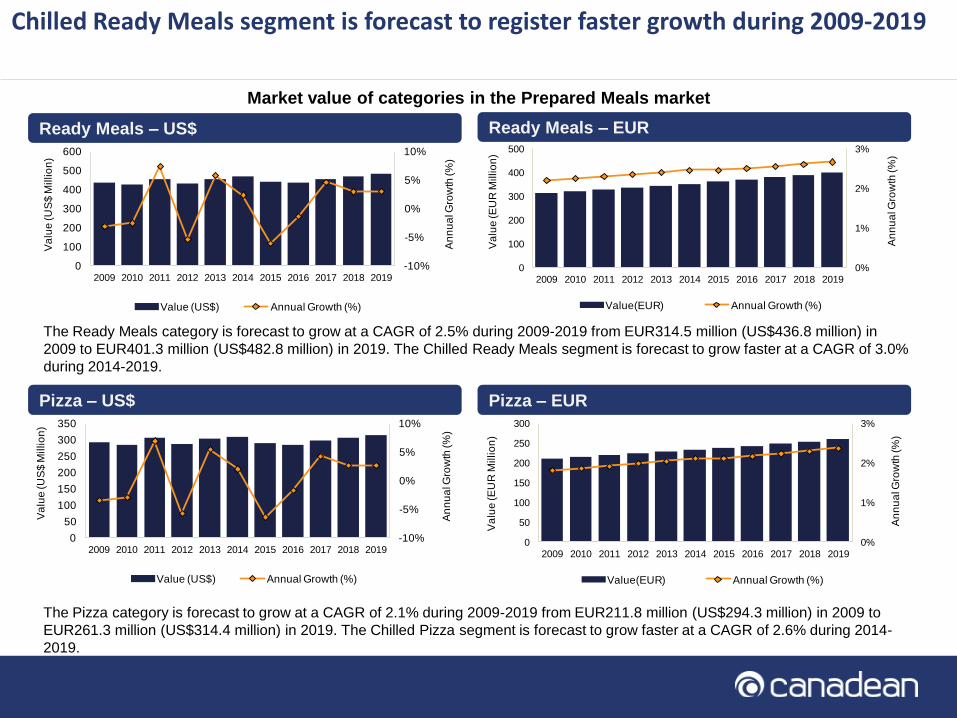
Chilled Ready Meals segment is forecast to register faster growth during 2009-2019
The Ready Meals category is forecast to grow at a CAGR of 2.5% during 2009-2019 from EUR314.5 million (US$436.8 million) in
2009 to EUR401.3 million (US$482.8 million) in 2019. The Chilled Ready Meals segment is forecast to grow faster at a CAGR of 3.0%
during 2014-2019.
Ready Meals – US$ Ready Meals – EUR
Market value of categories in the Prepared Meals market
Pizza – US$ Pizza – EUR
The Pizza category is forecast to grow at a CAGR of 2.1% during 2009-2019 from EUR211.8 million (US$294.3 million) in 2009 to
EUR261.3 million (US$314.4 million) in 2019. The Chilled Pizza segment is forecast to grow faster at a CAGR of 2.6% during 2014-
2019.
0%
1%
2%
3%
0
50
100
150
200
250
300
2009 2010 2011 2012 2013 2014 2015 2016 2017 2018 2019
An
nu
al G
row
th (%
)
Va
lue
(E
UR
Millio
n)
Value(EUR) Annual Growth (%)
0%
1%
2%
3%
0
100
200
300
400
500
2009 2010 2011 2012 2013 2014 2015 2016 2017 2018 2019
An
nu
al G
row
th (%
)
Va
lue
(E
UR
Millio
n)
Value(EUR) Annual Growth (%)
-10%
-5%
0%
5%
10%
0
100
200
300
400
500
600
2009 2010 2011 2012 2013 2014 2015 2016 2017 2018 2019
An
nu
al G
row
th (%
)
Va
lue
(U
S$
Millio
n)
Value (US$) Annual Growth (%)
-10%
-5%
0%
5%
10%
0
50
100
150
200
250
300
350
2009 2010 2011 2012 2013 2014 2015 2016 2017 2018 2019
An
nu
al G
row
th (%
)
Va
lue
(U
S$
Millio
n)
Value (US$) Annual Growth (%)
13 13 13 04/06/2015 13 6/4/2015 13 6/4/2015 13 6/4/2015 13
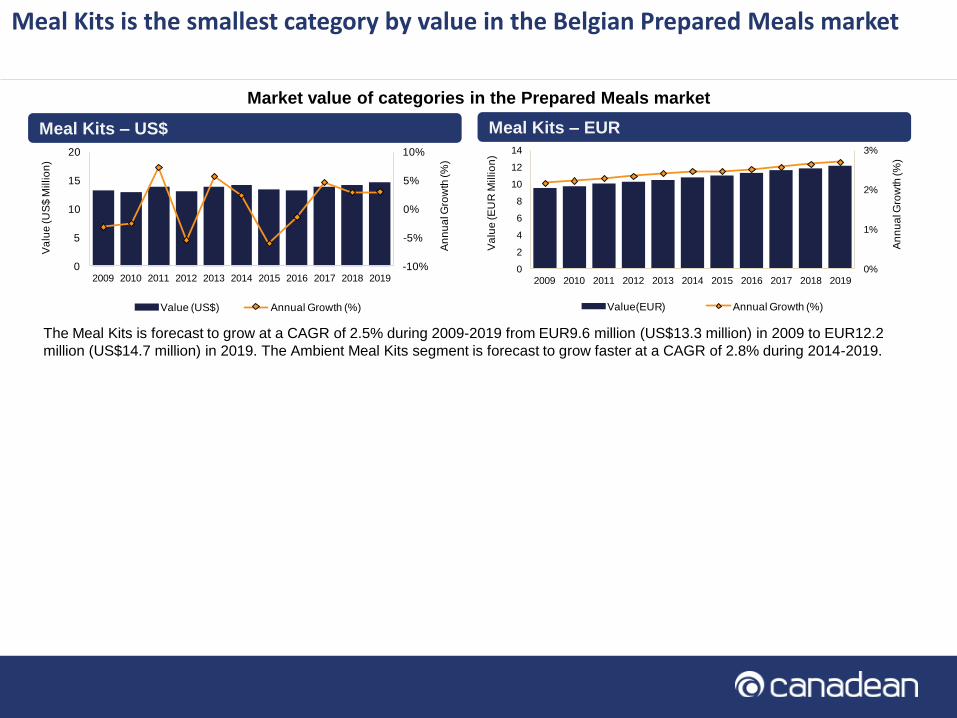
Meal Kits is the smallest category by value in the Belgian Prepared Meals market
The Meal Kits is forecast to grow at a CAGR of 2.5% during 2009-2019 from EUR9.6 million (US$13.3 million) in 2009 to EUR12.2
million (US$14.7 million) in 2019. The Ambient Meal Kits segment is forecast to grow faster at a CAGR of 2.8% during 2014-2019.
Meal Kits – US$ Meal Kits – EUR
Market value of categories in the Prepared Meals market
0%
1%
2%
3%
0
2
4
6
8
10
12
14
2009 2010 2011 2012 2013 2014 2015 2016 2017 2018 2019
An
nu
al G
row
th (%
)
Va
lue
(E
UR
Millio
n)
Value(EUR) Annual Growth (%)
-10%
-5%
0%
5%
10%
0
5
10
15
20
2009 2010 2011 2012 2013 2014 2015 2016 2017 2018 2019
An
nu
al G
row
th (%
)
Va
lue
(U
S$
Millio
n)
Value (US$) Annual Growth (%)
14 14 14
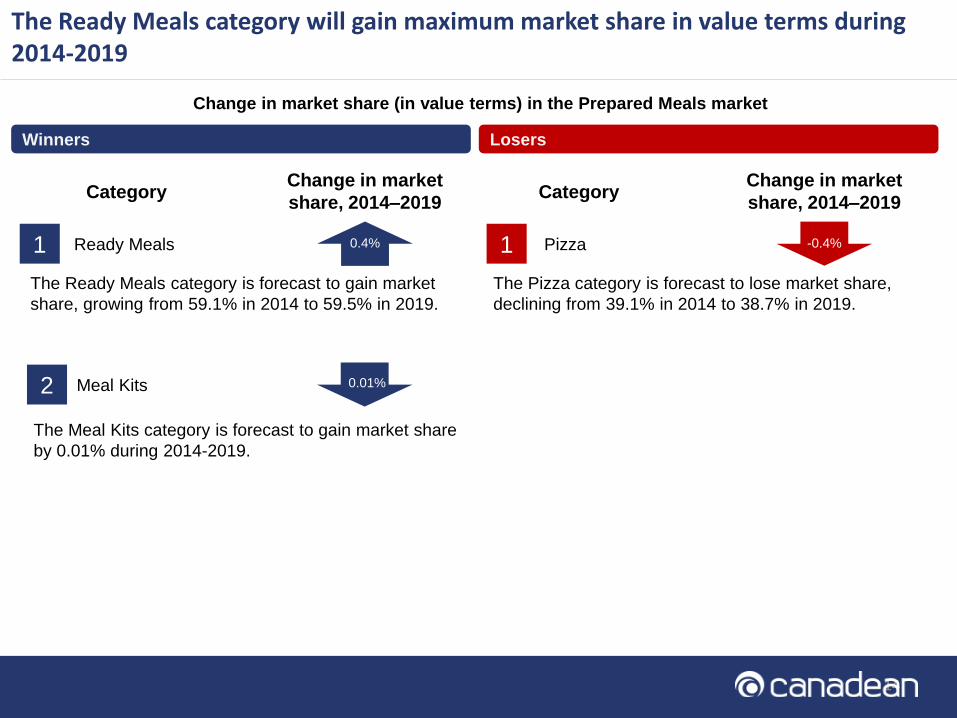
The Ready Meals category will gain maximum market share in value terms during 2014-2019
Winners Losers
Ready Meals
The Ready Meals category is forecast to gain market
share, growing from 59.1% in 2014 to 59.5% in 2019.
1
Meal Kits
The Meal Kits category is forecast to gain market share
by 0.01% during 2014-2019.
1
Change in market
share, 2014–2019 Category
Change in market
share, 2014–2019 Category
Pizza
The Pizza category is forecast to lose market share,
declining from 39.1% in 2014 to 38.7% in 2019.
2
0.4% -0.4%
0.01%
Change in market share (in value terms) in the Prepared Meals market
15 15 15 04/06/2015 15 6/4/2015 15 6/4/2015 15 6/4/2015 15
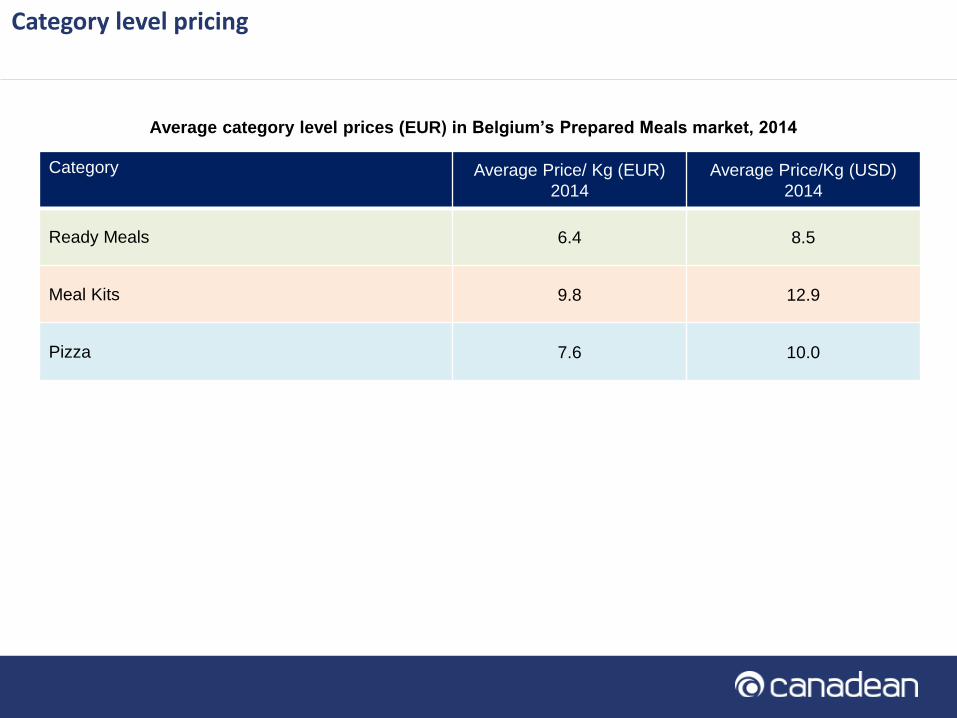
Category level pricing
Average category level prices (EUR) in Belgium’s Prepared Meals market, 2014
Category Average Price/ Kg (EUR)
2014
Average Price/Kg (USD)
2014
Ready Meals 6.4 8.5
Meal Kits 9.8 12.9
Pizza 7.6 10.0
16 16 16 04/06/2015 16 6/4/2015 16 6/4/2015 16 6/4/2015 16
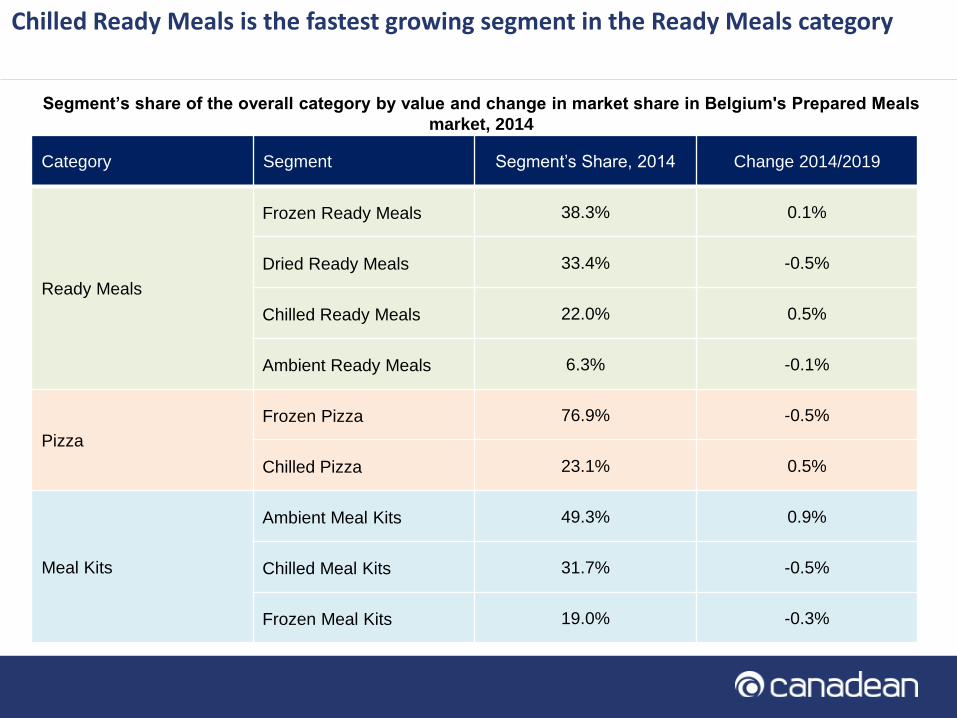
Chilled Ready Meals is the fastest growing segment in the Ready Meals category
Category Segment Segment’s Share, 2014 Change 2014/2019
Ready Meals
Frozen Ready Meals 38.3% 0.1%
Dried Ready Meals 33.4% -0.5%
Chilled Ready Meals 22.0% 0.5%
Ambient Ready Meals 6.3% -0.1%
Pizza
Frozen Pizza 76.9% -0.5%
Chilled Pizza 23.1% 0.5%
Meal Kits
Ambient Meal Kits 49.3% 0.9%
Chilled Meal Kits 31.7% -0.5%
Frozen Meal Kits 19.0% -0.3%
Segment’s share of the overall category by value and change in market share in Belgium's Prepared Meals
market, 2014

17 17 17
Table of Contents
• Country Context
• Market Overview
• Retail Landscape and Key Distribution Channels
• Packaging
• Brand and Private Label Share
• Appendix
18 18 18
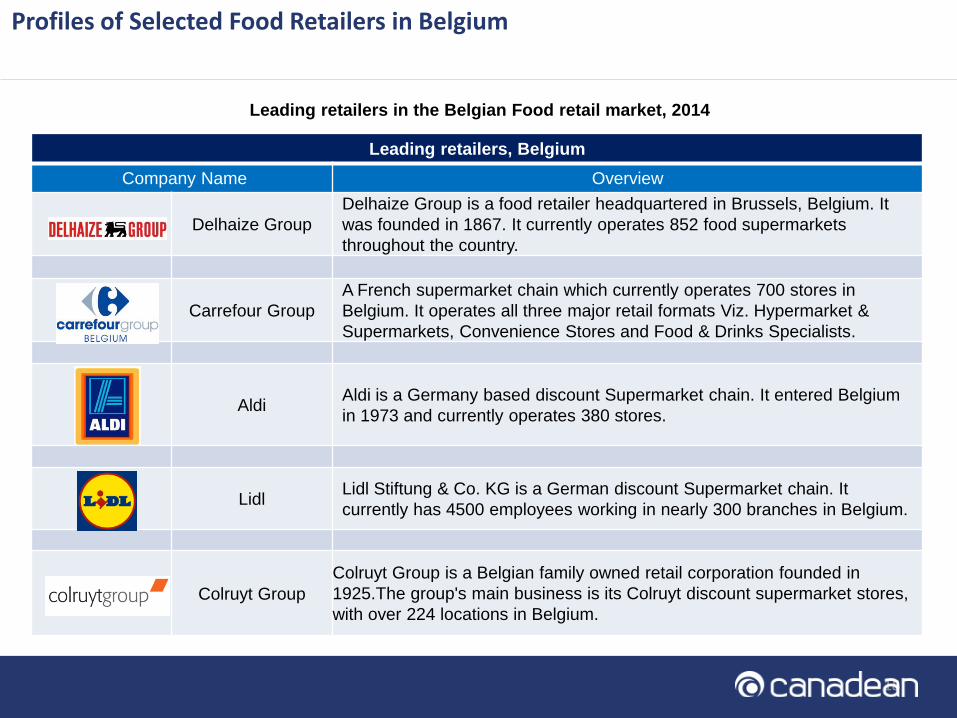
Profiles of Selected Food Retailers in Belgium
Leading retailers, Belgium
Company Name Overview
Delhaize Group
Delhaize Group is a food retailer headquartered in Brussels, Belgium. It
was founded in 1867. It currently operates 852 food supermarkets
throughout the country.
Carrefour Group
A French supermarket chain which currently operates 700 stores in
Belgium. It operates all three major retail formats Viz. Hypermarket &
Supermarkets, Convenience Stores and Food & Drinks Specialists.
Aldi Aldi is a Germany based discount Supermarket chain. It entered Belgium
in 1973 and currently operates 380 stores.
Lidl Lidl Stiftung & Co. KG is a German discount Supermarket chain. It
currently has 4500 employees working in nearly 300 branches in Belgium.
Colruyt Group
Colruyt Group is a Belgian family owned retail corporation founded in
1925.The group's main business is its Colruyt discount supermarket stores,
with over 224 locations in Belgium.
Leading retailers in the Belgian Food retail market, 2014
19 19 19
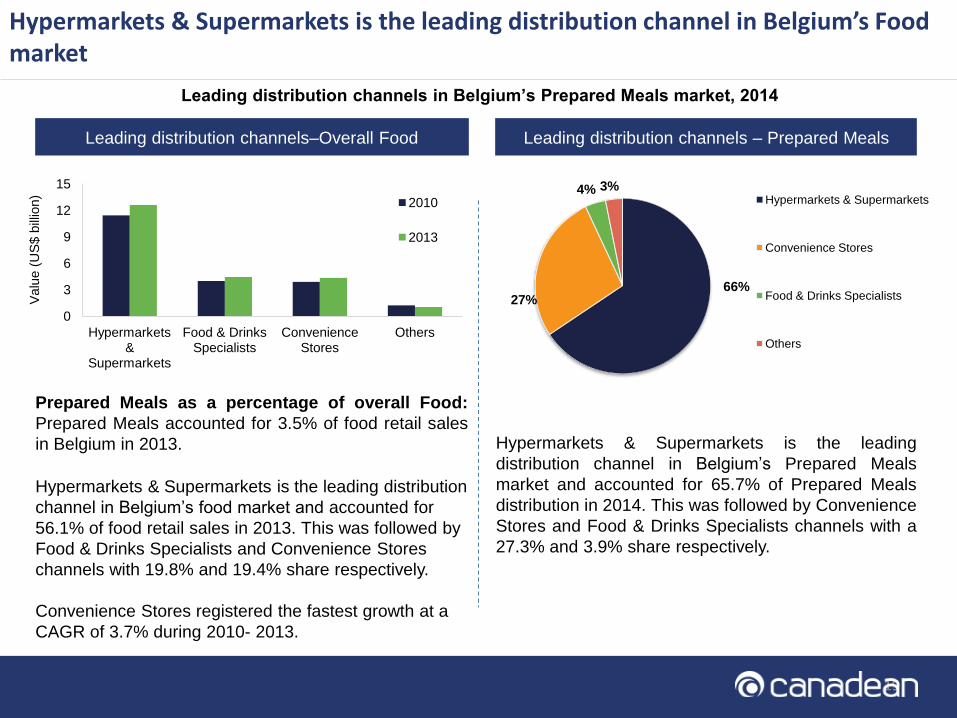
Leading distribution channels–Overall Food
Prepared Meals as a percentage of overall Food:
Prepared Meals accounted for 3.5% of food retail sales
in Belgium in 2013.
Hypermarkets & Supermarkets is the leading distribution
channel in Belgium’s food market and accounted for
56.1% of food retail sales in 2013. This was followed by
Food & Drinks Specialists and Convenience Stores
channels with 19.8% and 19.4% share respectively.
Convenience Stores registered the fastest growth at a
CAGR of 3.7% during 2010- 2013.
Hypermarkets & Supermarkets is the leading distribution channel in Belgium’s Food market
Leading distribution channels in Belgium’s Prepared Meals market, 2014
Leading distribution channels – Prepared Meals
Hypermarkets & Supermarkets is the leading
distribution channel in Belgium’s Prepared Meals
market and accounted for 65.7% of Prepared Meals
distribution in 2014. This was followed by Convenience
Stores and Food & Drinks Specialists channels with a
27.3% and 3.9% share respectively.
66% 27%
4% 3% Hypermarkets & Supermarkets
Convenience Stores
Food & Drinks Specialists
Others
0
3
6
9
12
15
Hypermarkets &
Supermarkets
Food & Drinks Specialists
Convenience Stores
Others
Valu
e (
US
$ b
illio
n)
2010
2013
20 20 20
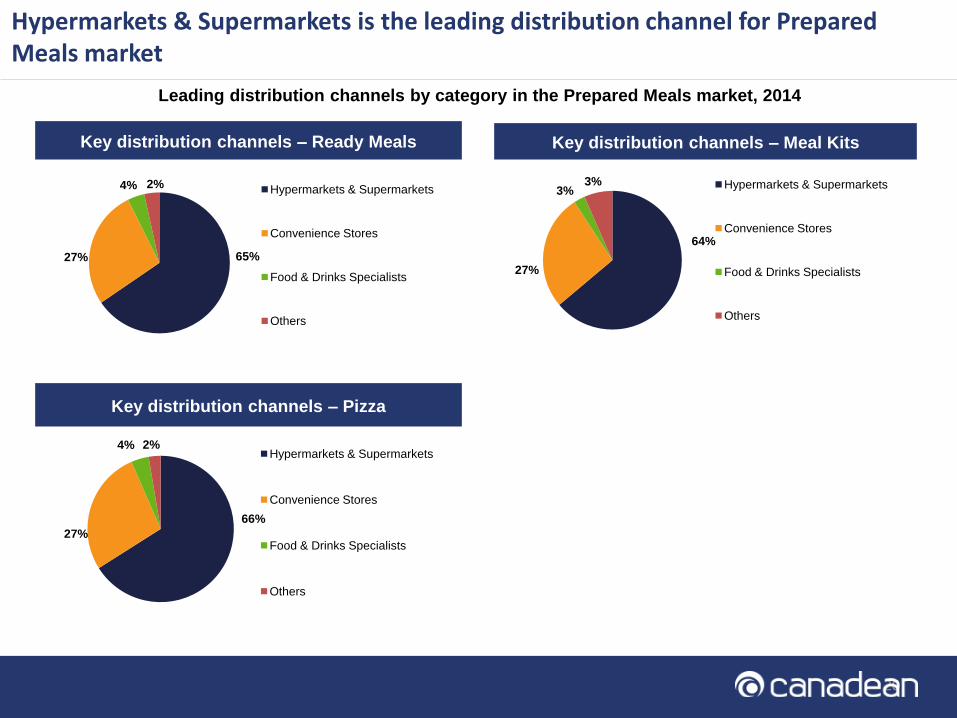
Hypermarkets & Supermarkets is the leading distribution channel for Prepared Meals market
Key distribution channels – Ready Meals
Key distribution channels – Pizza
Key distribution channels – Meal Kits
Leading distribution channels by category in the Prepared Meals market, 2014
65% 27%
4% 2% Hypermarkets & Supermarkets
Convenience Stores
Food & Drinks Specialists
Others
66%
27%
4% 2% Hypermarkets & Supermarkets
Convenience Stores
Food & Drinks Specialists
Others
64%
27%
3% 3% Hypermarkets & Supermarkets
Convenience Stores
Food & Drinks Specialists
Others
21 21 21
Table of Contents
• Country Context
• Market Overview
• Retail Landscape and Key Distribution Channels
• Packaging
• Brand and Private Label Share
• Appendix
22 22 22
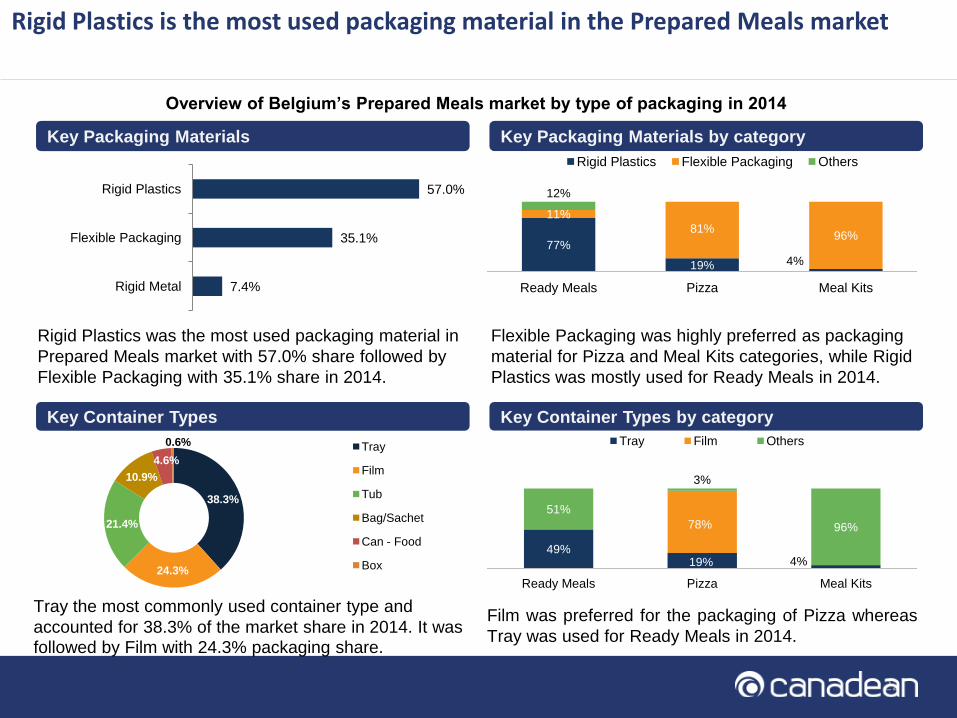
Rigid Plastics is the most used packaging material in the Prepared Meals market
Tray the most commonly used container type and
accounted for 38.3% of the market share in 2014. It was
followed by Film with 24.3% packaging share.
Flexible Packaging was highly preferred as packaging
material for Pizza and Meal Kits categories, while Rigid
Plastics was mostly used for Ready Meals in 2014.
Film was preferred for the packaging of Pizza whereas
Tray was used for Ready Meals in 2014.
Key Packaging Materials Key Packaging Materials by category
Key Container Types Key Container Types by category
Rigid Plastics was the most used packaging material in
Prepared Meals market with 57.0% share followed by
Flexible Packaging with 35.1% share in 2014.
Overview of Belgium’s Prepared Meals market by type of packaging in 2014
57.0%
35.1%
7.4%
Rigid Plastics
Flexible Packaging
Rigid Metal
77%
19% 4%
11%
81% 96%
12%
Ready Meals Pizza Meal Kits
Rigid Plastics Flexible Packaging Others
49% 19% 4%
78%
51%
3%
96%
Ready Meals Pizza Meal Kits
Tray Film Others
38.3%
24.3%
21.4%
10.9%
4.6%
0.6% Tray
Film
Tub
Bag/Sachet
Can - Food
Box
23 23 23
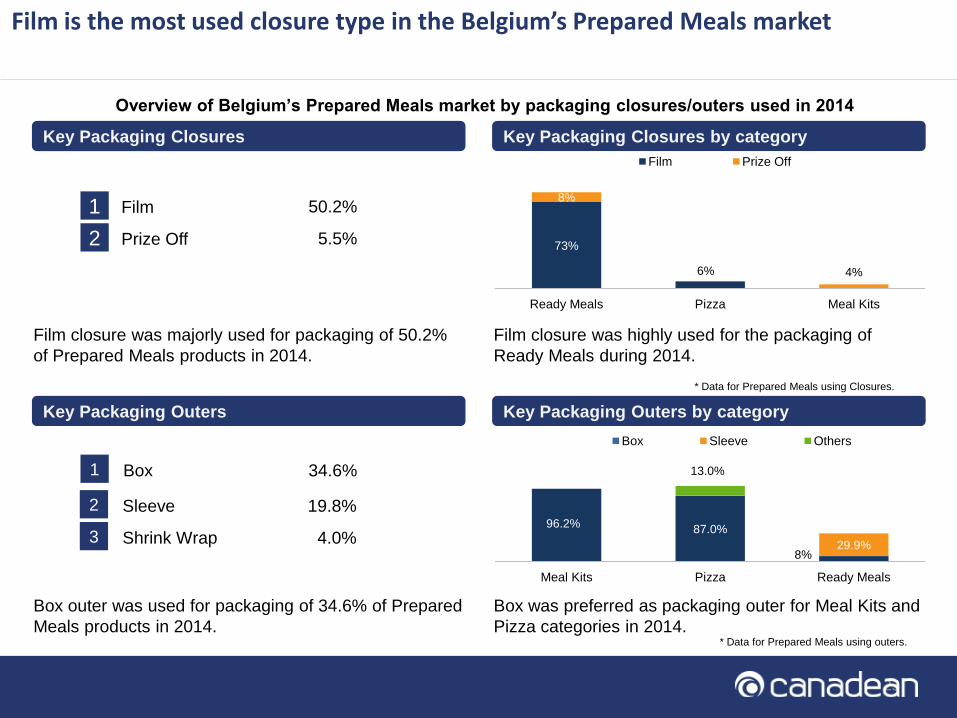
Film is the most used closure type in the Belgium’s Prepared Meals market
Box outer was used for packaging of 34.6% of Prepared
Meals products in 2014.
Film closure was highly used for the packaging of
Ready Meals during 2014.
Box was preferred as packaging outer for Meal Kits and
Pizza categories in 2014.
Key Packaging Closures Key Packaging Closures by category
Key Packaging Outers Key Packaging Outers by category
Overview of Belgium’s Prepared Meals market by packaging closures/outers used in 2014
Film closure was majorly used for packaging of 50.2%
of Prepared Meals products in 2014.
50.2% 1 Film
5.5% 2 Prize Off
34.6% 1 Box
* Data for Prepared Meals using Closures.
* Data for Prepared Meals using outers.
19.8% 2 Sleeve
4.0% 3 Shrink Wrap
73%
6%
8%
4%
Ready Meals Pizza Meal Kits
Film Prize Off
96.2% 87.0%
8% 29.9%
13.0%
Meal Kits Pizza Ready Meals
Box Sleeve Others
24 24 24
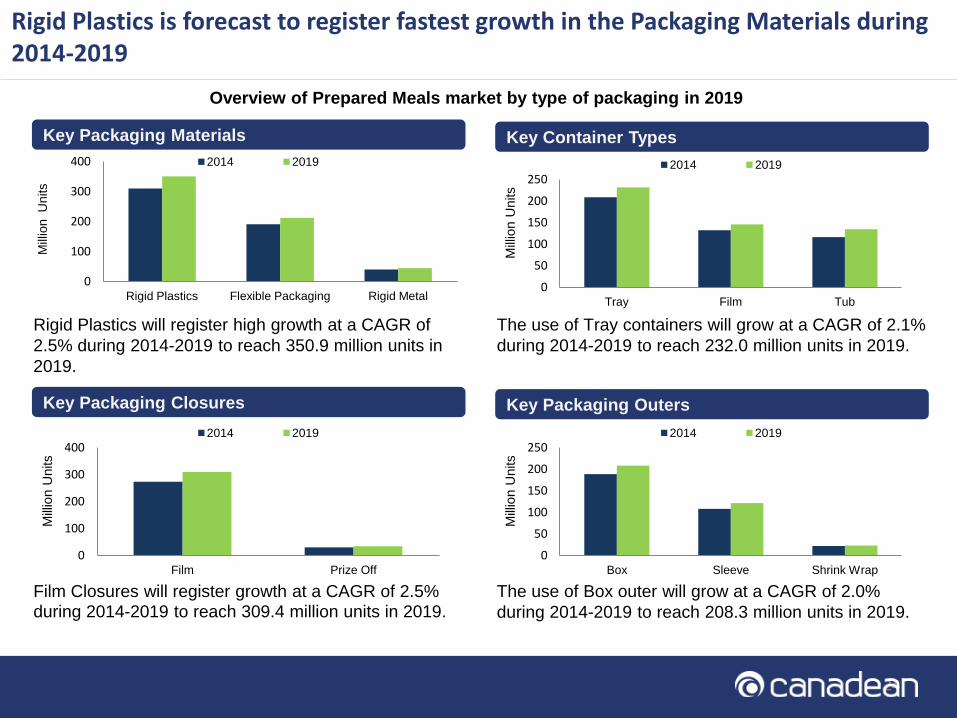
Rigid Plastics is forecast to register fastest growth in the Packaging Materials during 2014-2019
Film Closures will register growth at a CAGR of 2.5%
during 2014-2019 to reach 309.4 million units in 2019.
The use of Tray containers will grow at a CAGR of 2.1%
during 2014-2019 to reach 232.0 million units in 2019.
Key Packaging Materials Key Container Types
Key Packaging Closures Key Packaging Outers
Rigid Plastics will register high growth at a CAGR of
2.5% during 2014-2019 to reach 350.9 million units in
2019.
Overview of Prepared Meals market by type of packaging in 2019
The use of Box outer will grow at a CAGR of 2.0%
during 2014-2019 to reach 208.3 million units in 2019.
0
100
200
300
400
Rigid Plastics Flexible Packaging Rigid Metal
Mill
ion U
nits
2014 2019
0
50
100
150
200
250
Tray Film Tub
Mill
ion U
nits
2014 2019
0
100
200
300
400
Film Prize Off
Mill
ion U
nits
2014 2019
0
50
100
150
200
250
Box Sleeve Shrink Wrap
Mill
ion U
nits
2014 2019
25 25 25
Table of Contents
• Country Context
• Market Overview
• Retail Landscape and Key Distribution Channels
• Packaging
• Brand and Private Label Share
• Appendix
26 26 26
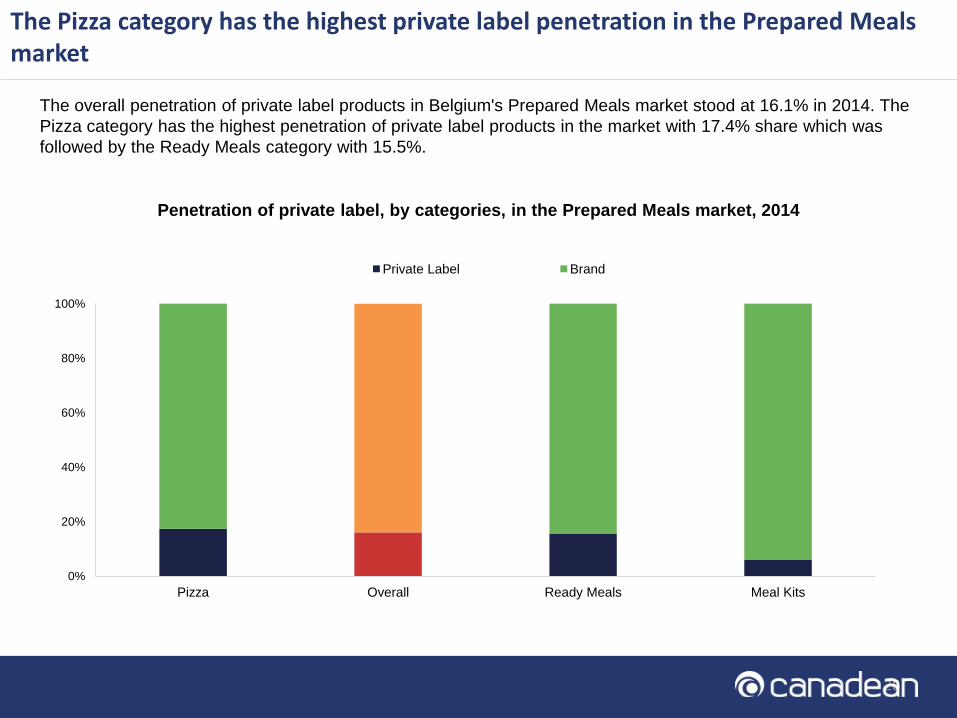
The Pizza category has the highest private label penetration in the Prepared Meals market
The overall penetration of private label products in Belgium's Prepared Meals market stood at 16.1% in 2014. The
Pizza category has the highest penetration of private label products in the market with 17.4% share which was
followed by the Ready Meals category with 15.5%.
Penetration of private label, by categories, in the Prepared Meals market, 2014
0%
20%
40%
60%
80%
100%
Pizza Overall Ready Meals Meal Kits
Private Label Brand
27 27 27
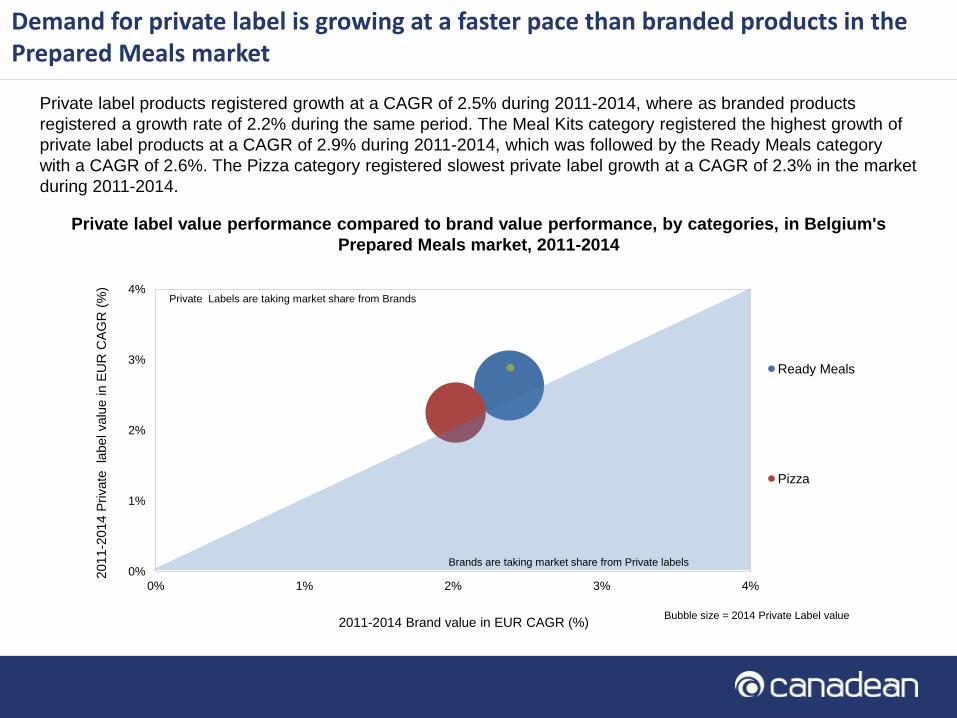
Demand for private label is growing at a faster pace than branded products in the Prepared Meals market
Private label products registered growth at a CAGR of 2.5% during 2011-2014, where as branded products
registered a growth rate of 2.2% during the same period. The Meal Kits category registered the highest growth of
private label products at a CAGR of 2.9% during 2011-2014, which was followed by the Ready Meals category
with a CAGR of 2.6%. The Pizza category registered slowest private label growth at a CAGR of 2.3% in the market
during 2011-2014.
Private label value performance compared to brand value performance, by categories, in Belgium's
Prepared Meals market, 2011-2014
0%
1%
2%
3%
4%
0% 1% 2% 3% 4%
2011-2
014 P
rivate
la
bel valu
e in E
UR
CA
GR
(%
)
2011-2014 Brand value in EUR CAGR (%)
Ready Meals
Pizza
Bubble size = 2014 Private Label value
Private Labels are taking market share from Brands
Brands are taking market share from Private labels
28 28 28
Ready Meals – Brand share
Leading brands - market share
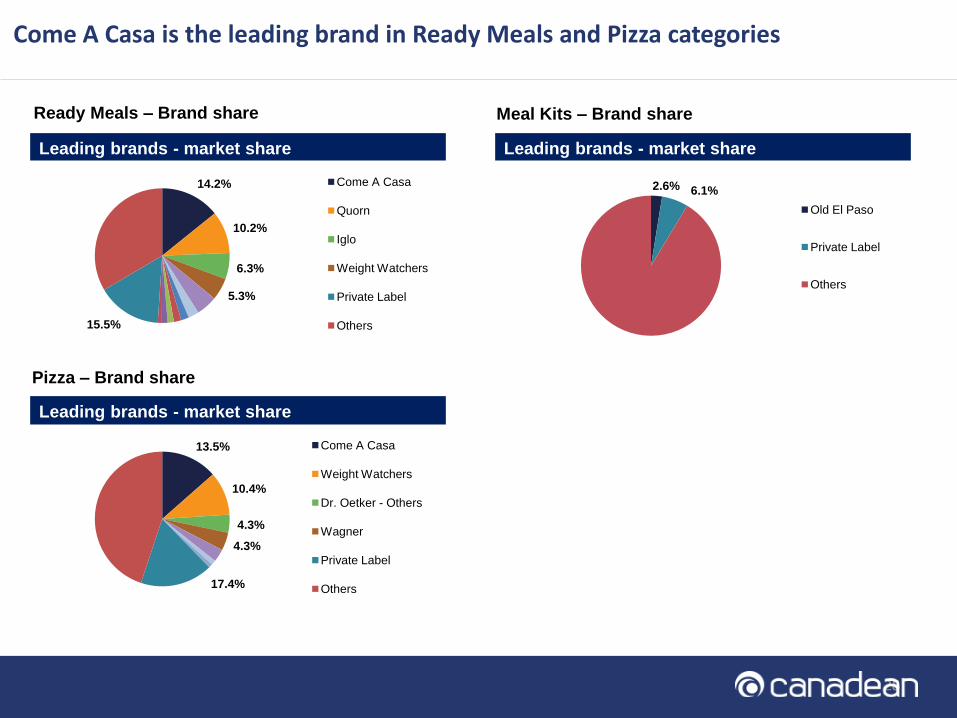
Come A Casa is the leading brand in Ready Meals and Pizza categories
Meal Kits – Brand share
Leading brands - market share
Pizza – Brand share
Leading brands - market share
14.2%
10.2%
6.3%
5.3%
15.5%
Come A Casa
Quorn
Iglo
Weight Watchers
Private Label
Others
13.5%
10.4%
4.3%
4.3%
17.4%
Come A Casa
Weight Watchers
Dr. Oetker - Others
Wagner
Private Label
Others
2.6% 6.1%
Old El Paso
Private Label
Others
29 29 29
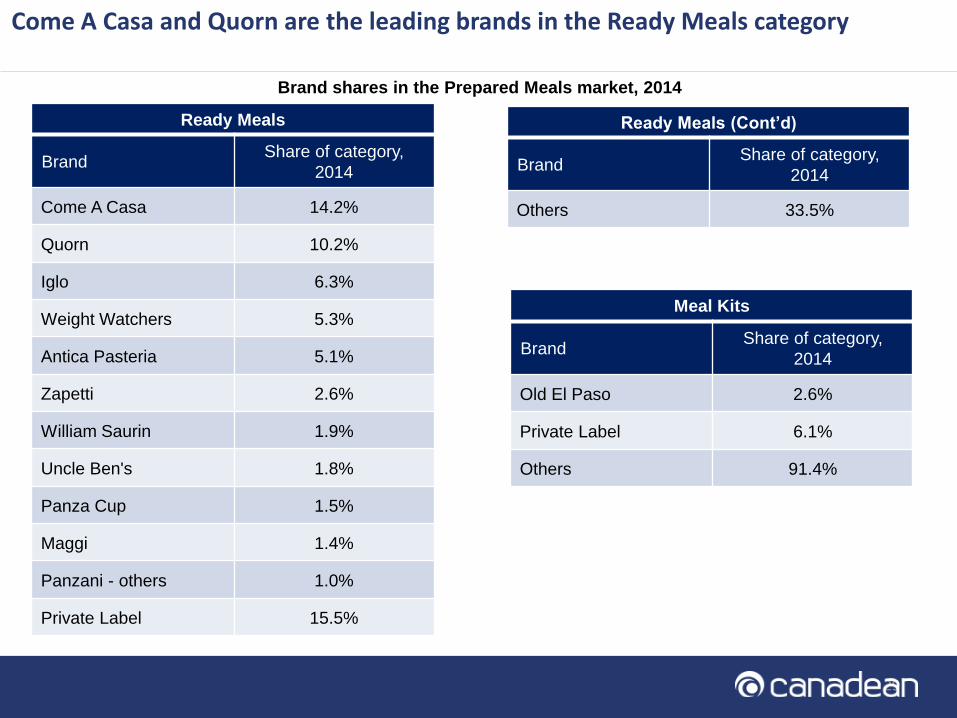
Come A Casa and Quorn are the leading brands in the Ready Meals category
Brand shares in the Prepared Meals market, 2014
Ready Meals
Brand Share of category,
2014
Come A Casa 14.2%
Quorn 10.2%
Iglo 6.3%
Weight Watchers 5.3%
Antica Pasteria 5.1%
Zapetti 2.6%
William Saurin 1.9%
Uncle Ben's 1.8%
Panza Cup 1.5%
Maggi 1.4%
Panzani - others 1.0%
Private Label 15.5%
Meal Kits
Brand Share of category,
2014
Old El Paso 2.6%
Private Label 6.1%
Others 91.4%
Ready Meals (Cont’d)
Brand Share of category,
2014
Others 33.5%
30 30 30
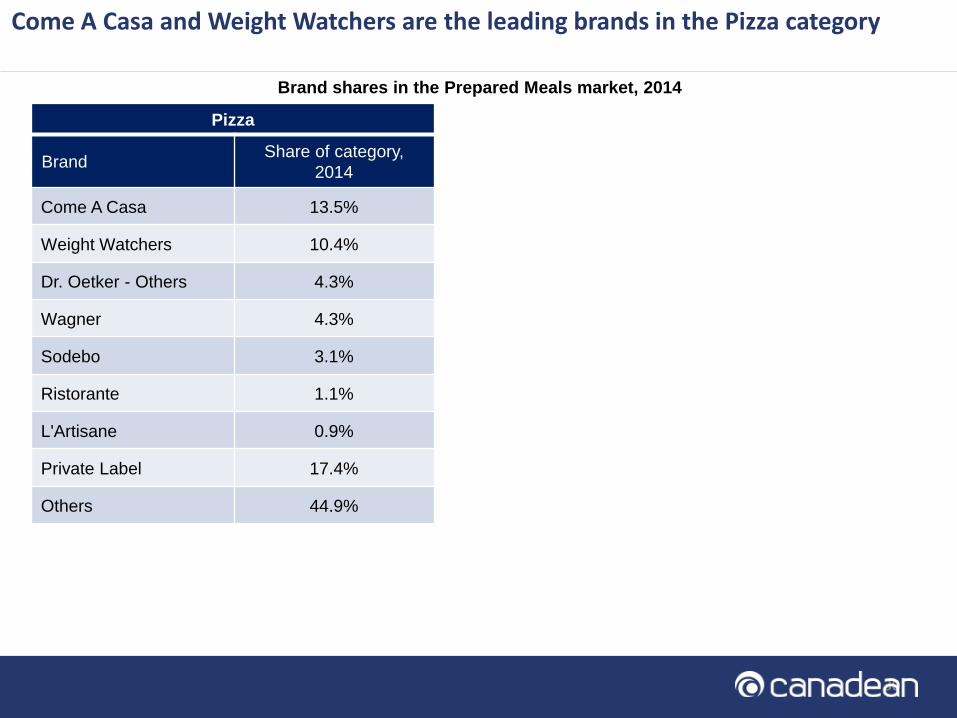
Come A Casa and Weight Watchers are the leading brands in the Pizza category
Brand shares in the Prepared Meals market, 2014
Pizza
Brand Share of category,
2014
Come A Casa 13.5%
Weight Watchers 10.4%
Dr. Oetker - Others 4.3%
Wagner 4.3%
Sodebo 3.1%
Ristorante 1.1%
L'Artisane 0.9%
Private Label 17.4%
Others 44.9%
31 31 31
Table of Contents
• Country Context
• Market Overview
• Retail Landscape and Key Distribution Channels
• Packaging
• Brand and Private Label Share
• Appendix
32 32 32
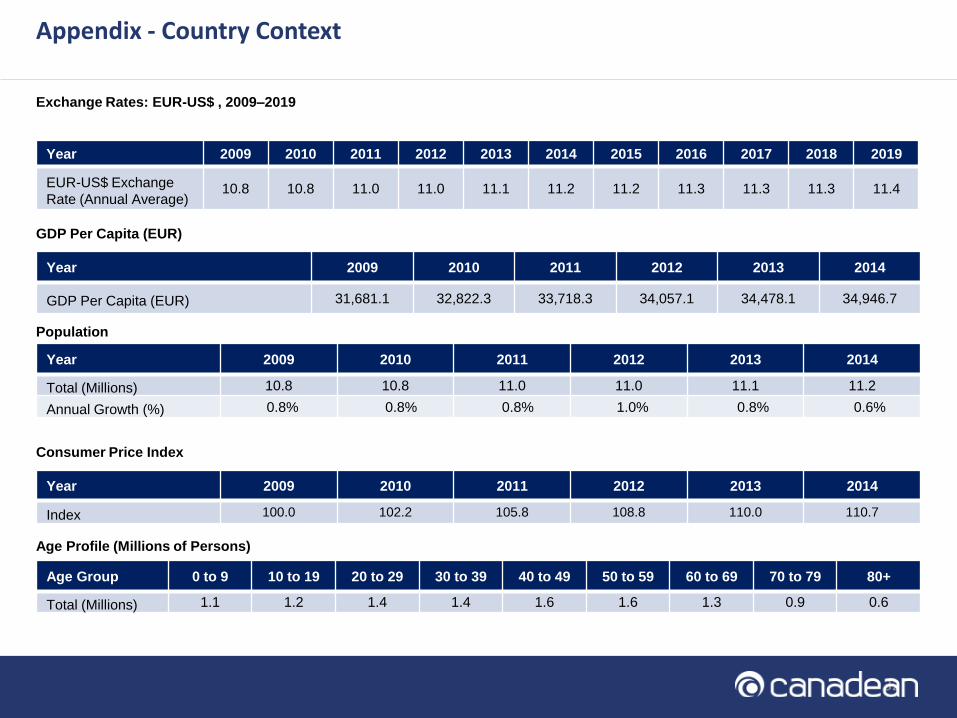
Appendix - Country Context
Year 2009 2010 2011 2012 2013 2014
Total (Millions) 10.8 10.8 11.0 11.0 11.1 11.2
Annual Growth (%) 0.8% 0.8% 0.8% 1.0% 0.8% 0.6%
Year 2009 2010 2011 2012 2013 2014
GDP Per Capita (EUR) 31,681.1 32,822.3 33,718.3 34,057.1 34,478.1 34,946.7
Year 2009 2010 2011 2012 2013 2014
Index 100.0 102.2 105.8 108.8 110.0 110.7
Age Group 0 to 9 10 to 19 20 to 29 30 to 39 40 to 49 50 to 59 60 to 69 70 to 79 80+
Total (Millions) 1.1 1.2 1.4 1.4 1.6 1.6 1.3 0.9 0.6
GDP Per Capita (EUR)
Population
Consumer Price Index
Age Profile (Millions of Persons)
Year 2009 2010 2011 2012 2013 2014 2015 2016 2017 2018 2019
EUR-US$ Exchange
Rate (Annual Average) 10.8 10.8 11.0 11.0 11.1 11.2 11.2 11.3 11.3 11.3 11.4
Exchange Rates: EUR-US$ , 2009–2019
33 33 33
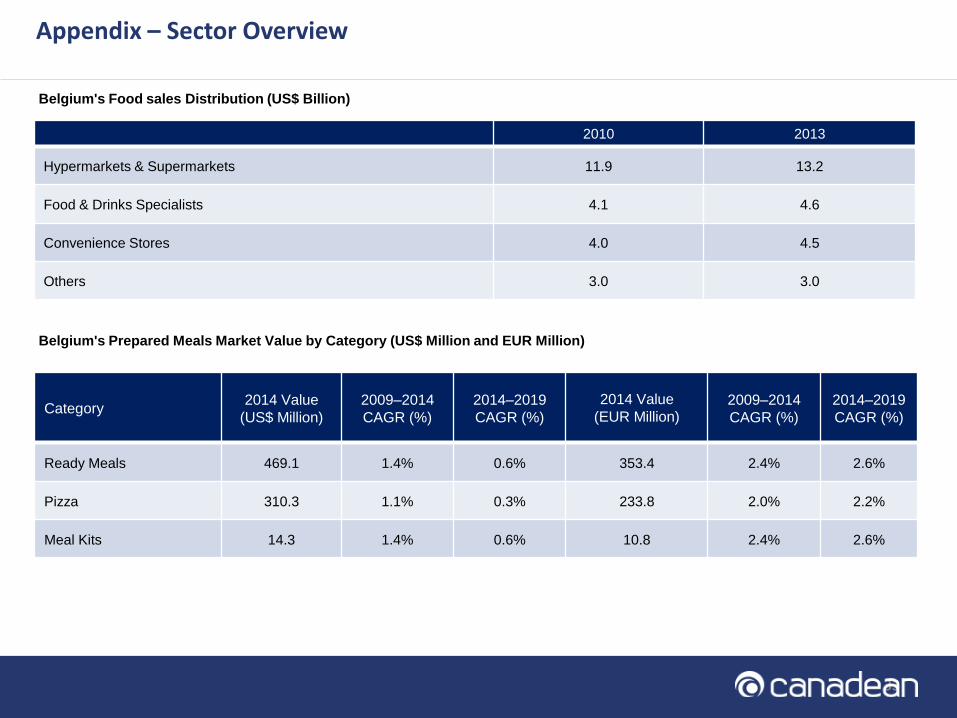
2010 2013
Hypermarkets & Supermarkets 11.9 13.2
Food & Drinks Specialists 4.1 4.6
Convenience Stores 4.0 4.5
Others 3.0 3.0
Belgium's Food sales Distribution (US$ Billion)
Appendix – Sector Overview
Category 2014 Value
(US$ Million)
2009–2014
CAGR (%)
2014–2019
CAGR (%)
2014 Value
(EUR Million) 2009–2014
CAGR (%)
2014–2019
CAGR (%)
Ready Meals 469.1 1.4% 0.6% 353.4 2.4% 2.6%
Pizza 310.3 1.1% 0.3% 233.8 2.0% 2.2%
Meal Kits 14.3 1.4% 0.6% 10.8 2.4% 2.6%
Belgium's Prepared Meals Market Value by Category (US$ Million and EUR Million)
34 34 34
Appendix – Sector Overview
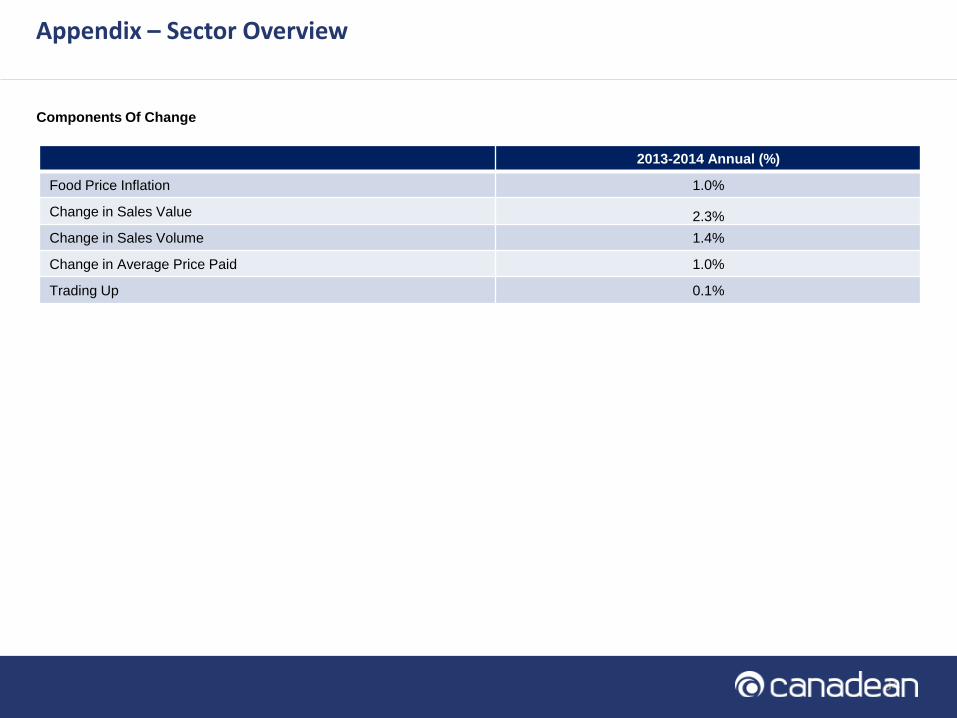
2013-2014 Annual (%)
Food Price Inflation 1.0%
Change in Sales Value 2.3%
Change in Sales Volume 1.4%
Change in Average Price Paid 1.0%
Trading Up 0.1%
Components Of Change
35 35 35
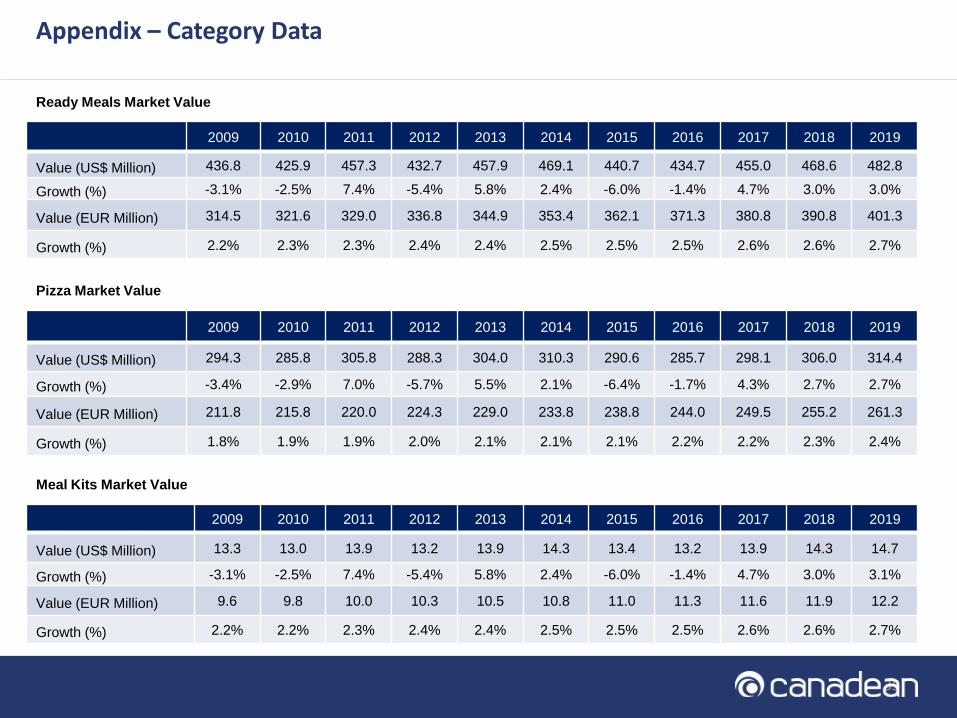
2009 2010 2011 2012 2013 2014 2015 2016 2017 2018 2019
Value (US$ Million) 436.8 425.9 457.3 432.7 457.9 469.1 440.7 434.7 455.0 468.6 482.8
Growth (%) -3.1% -2.5% 7.4% -5.4% 5.8% 2.4% -6.0% -1.4% 4.7% 3.0% 3.0%
Value (EUR Million) 314.5 321.6 329.0 336.8 344.9 353.4 362.1 371.3 380.8 390.8 401.3
Growth (%) 2.2% 2.3% 2.3% 2.4% 2.4% 2.5% 2.5% 2.5% 2.6% 2.6% 2.7%
Ready Meals Market Value
Meal Kits Market Value
2009 2010 2011 2012 2013 2014 2015 2016 2017 2018 2019
Value (US$ Million) 13.3 13.0 13.9 13.2 13.9 14.3 13.4 13.2 13.9 14.3 14.7
Growth (%) -3.1% -2.5% 7.4% -5.4% 5.8% 2.4% -6.0% -1.4% 4.7% 3.0% 3.1%
Value (EUR Million) 9.6 9.8 10.0 10.3 10.5 10.8 11.0 11.3 11.6 11.9 12.2
Growth (%) 2.2% 2.2% 2.3% 2.4% 2.4% 2.5% 2.5% 2.5% 2.6% 2.6% 2.7%
Appendix – Category Data
2009 2010 2011 2012 2013 2014 2015 2016 2017 2018 2019
Value (US$ Million) 294.3 285.8 305.8 288.3 304.0 310.3 290.6 285.7 298.1 306.0 314.4
Growth (%) -3.4% -2.9% 7.0% -5.7% 5.5% 2.1% -6.4% -1.7% 4.3% 2.7% 2.7%
Value (EUR Million) 211.8 215.8 220.0 224.3 229.0 233.8 238.8 244.0 249.5 255.2 261.3
Growth (%) 1.8% 1.9% 1.9% 2.0% 2.1% 2.1% 2.1% 2.2% 2.2% 2.3% 2.4%
Pizza Market Value
36 36 36 04/06/2015 36 6/4/2015 36 6/4/2015 36 6/4/2015 36
Appendix – Segment data
Category Segment Segment’s Share, 2014 Segment’s Share, 2019
Ready Meals
Frozen Ready Meals 38.3% 38.4%
Dried Ready Meals 33.4% 33.0%
Chilled Ready Meals 22.0% 22.5%
Ambient Ready Meals 6.3% 6.2%
Pizza
Frozen Pizza 76.9% 76.4%
Chilled Pizza 23.1% 23.6%
Meal Kits
Ambient Meal Kits 49.3% 50.2%
Chilled Meal Kits 31.7% 31.2%
Frozen Meal Kits 19.0% 18.7%
Market Share by Segment by Value
37 37 37
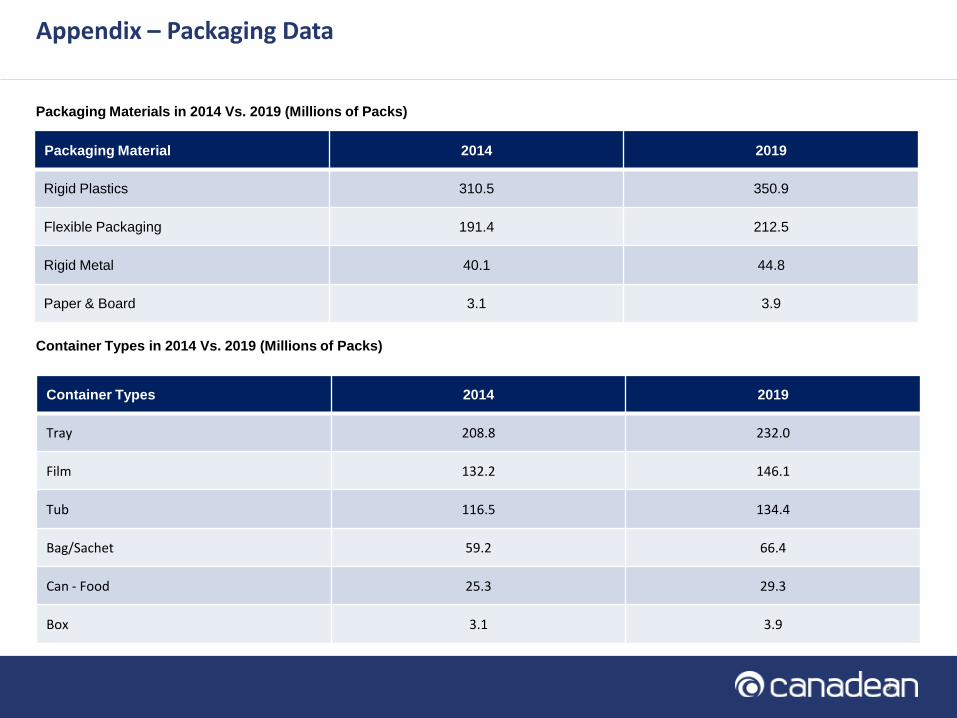
Packaging Material 2014 2019
Rigid Plastics 310.5 350.9
Flexible Packaging 191.4 212.5
Rigid Metal 40.1 44.8
Paper & Board 3.1 3.9
Packaging Materials in 2014 Vs. 2019 (Millions of Packs)
Appendix – Packaging Data
Container Types 2014 2019
Tray 208.8 232.0
Film 132.2 146.1
Tub 116.5 134.4
Bag/Sachet 59.2 66.4
Can - Food 25.3 29.3
Box 3.1 3.9
Container Types in 2014 Vs. 2019 (Millions of Packs)
38 38 38
Appendix – Packaging Data
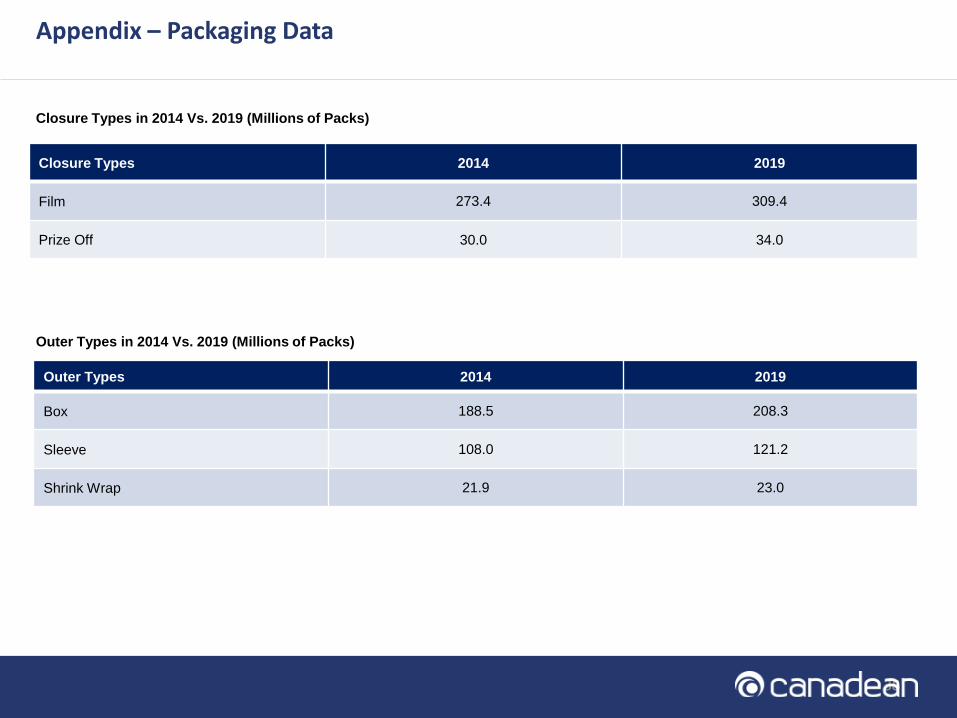
Closure Types 2014 2019
Film 273.4 309.4
Prize Off 30.0 34.0
Closure Types in 2014 Vs. 2019 (Millions of Packs)
Outer Types 2014 2019
Box 188.5 208.3
Sleeve 108.0 121.2
Shrink Wrap 21.9 23.0
Outer Types in 2014 Vs. 2019 (Millions of Packs)
39 39 39
Category definitions
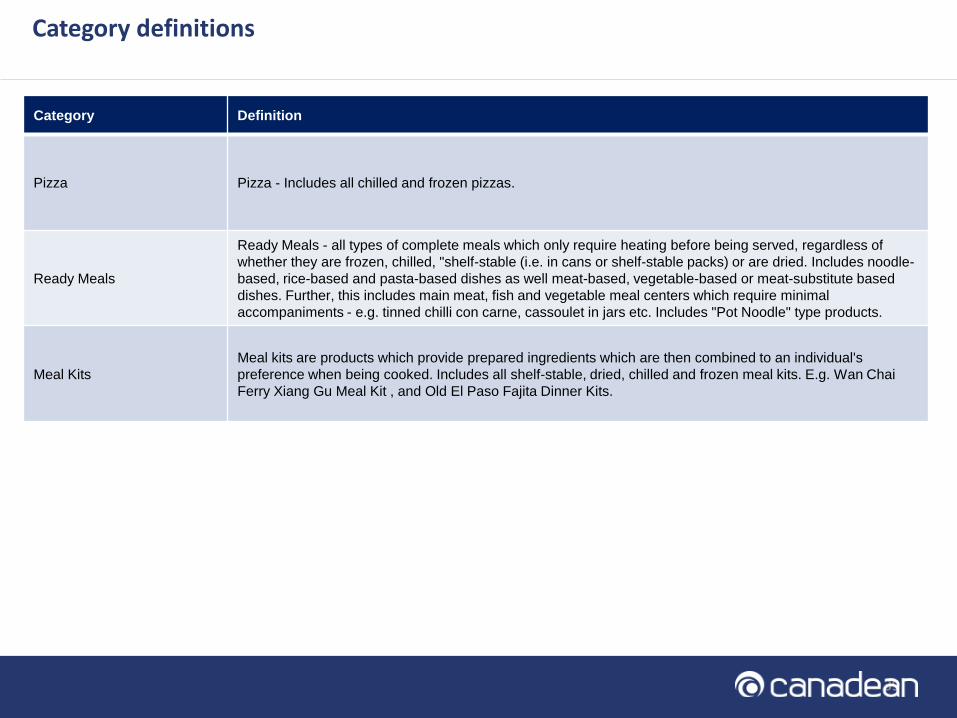
Category Definition
Pizza Pizza - Includes all chilled and frozen pizzas.
Ready Meals
Ready Meals - all types of complete meals which only require heating before being served, regardless of
whether they are frozen, chilled, "shelf-stable (i.e. in cans or shelf-stable packs) or are dried. Includes noodle-
based, rice-based and pasta-based dishes as well meat-based, vegetable-based or meat-substitute based
dishes. Further, this includes main meat, fish and vegetable meal centers which require minimal
accompaniments - e.g. tinned chilli con carne, cassoulet in jars etc. Includes "Pot Noodle" type products.
Meal Kits
Meal kits are products which provide prepared ingredients which are then combined to an individual's
preference when being cooked. Includes all shelf-stable, dried, chilled and frozen meal kits. E.g. Wan Chai
Ferry Xiang Gu Meal Kit , and Old El Paso Fajita Dinner Kits.
40 40 40
Category Definition
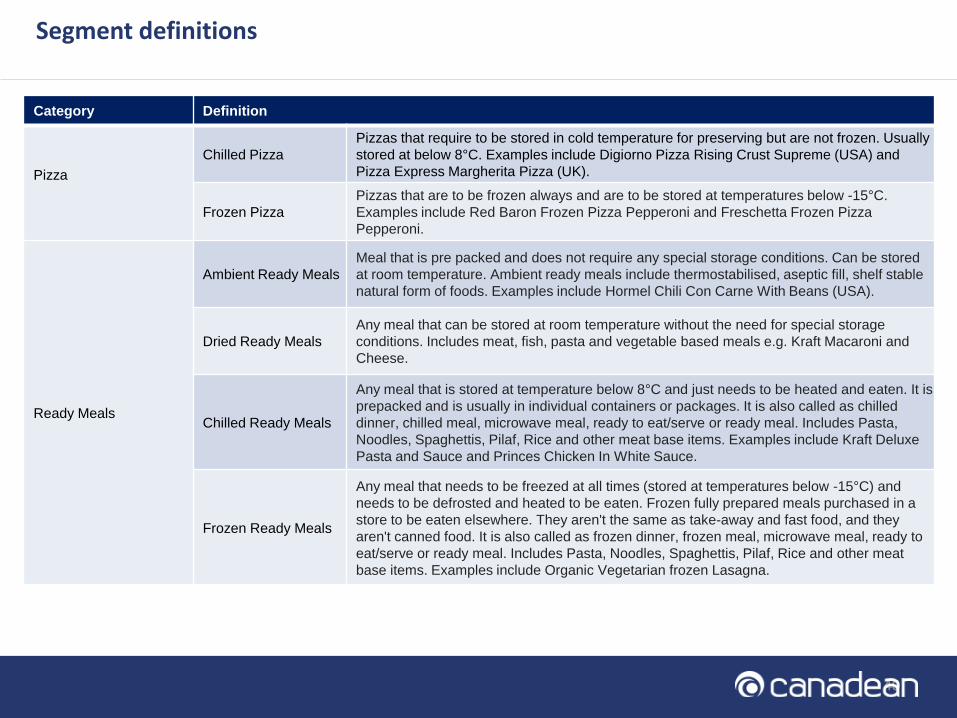
Pizza
Chilled Pizza
Pizzas that require to be stored in cold temperature for preserving but are not frozen. Usually
stored at below 8°C. Examples include Digiorno Pizza Rising Crust Supreme (USA) and
Pizza Express Margherita Pizza (UK).
Frozen Pizza
Pizzas that are to be frozen always and are to be stored at temperatures below -15°C.
Examples include Red Baron Frozen Pizza Pepperoni and Freschetta Frozen Pizza
Pepperoni.
Ready Meals
Ambient Ready Meals
Meal that is pre packed and does not require any special storage conditions. Can be stored
at room temperature. Ambient ready meals include thermostabilised, aseptic fill, shelf stable
natural form of foods. Examples include Hormel Chili Con Carne With Beans (USA).
Dried Ready Meals
Any meal that can be stored at room temperature without the need for special storage
conditions. Includes meat, fish, pasta and vegetable based meals e.g. Kraft Macaroni and
Cheese.
Chilled Ready Meals
Any meal that is stored at temperature below 8°C and just needs to be heated and eaten. It is
prepacked and is usually in individual containers or packages. It is also called as chilled
dinner, chilled meal, microwave meal, ready to eat/serve or ready meal. Includes Pasta,
Noodles, Spaghettis, Pilaf, Rice and other meat base items. Examples include Kraft Deluxe
Pasta and Sauce and Princes Chicken In White Sauce.
Frozen Ready Meals
Any meal that needs to be freezed at all times (stored at temperatures below -15°C) and
needs to be defrosted and heated to be eaten. Frozen fully prepared meals purchased in a
store to be eaten elsewhere. They aren't the same as take-away and fast food, and they
aren't canned food. It is also called as frozen dinner, frozen meal, microwave meal, ready to
eat/serve or ready meal. Includes Pasta, Noodles, Spaghettis, Pilaf, Rice and other meat
base items. Examples include Organic Vegetarian frozen Lasagna.
Segment definitions
41 41 41
Category Definition
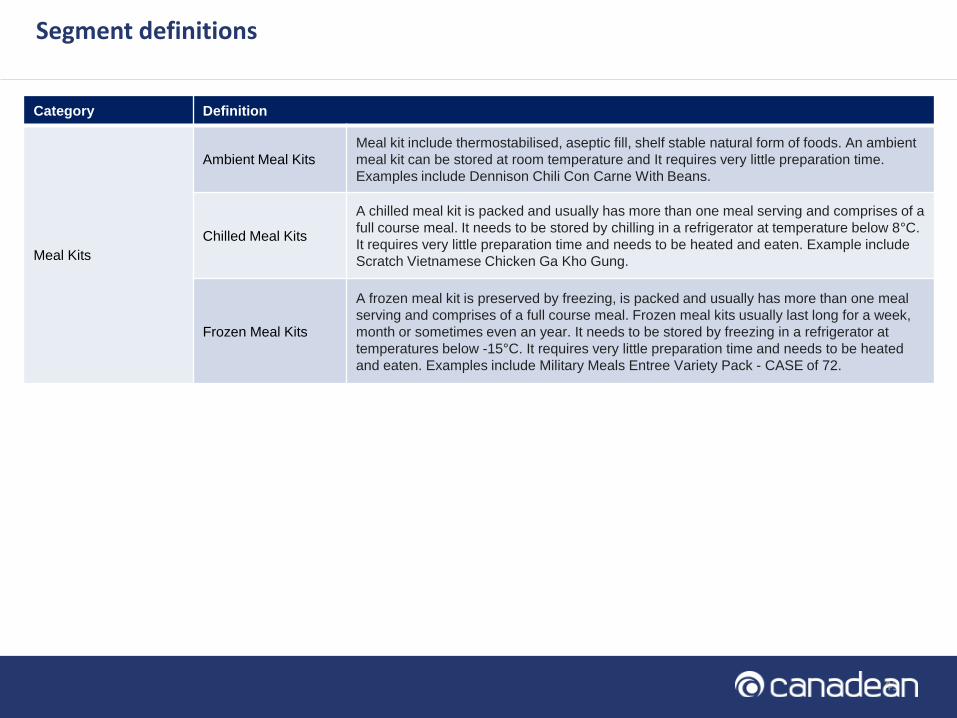
Meal Kits
Ambient Meal Kits
Meal kit include thermostabilised, aseptic fill, shelf stable natural form of foods. An ambient
meal kit can be stored at room temperature and It requires very little preparation time.
Examples include Dennison Chili Con Carne With Beans.
Chilled Meal Kits
A chilled meal kit is packed and usually has more than one meal serving and comprises of a
full course meal. It needs to be stored by chilling in a refrigerator at temperature below 8°C.
It requires very little preparation time and needs to be heated and eaten. Example include
Scratch Vietnamese Chicken Ga Kho Gung.
Frozen Meal Kits
A frozen meal kit is preserved by freezing, is packed and usually has more than one meal
serving and comprises of a full course meal. Frozen meal kits usually last long for a week,
month or sometimes even an year. It needs to be stored by freezing in a refrigerator at
temperatures below -15°C. It requires very little preparation time and needs to be heated
and eaten. Examples include Military Meals Entree Variety Pack - CASE of 72.
Segment definitions
42 42 42
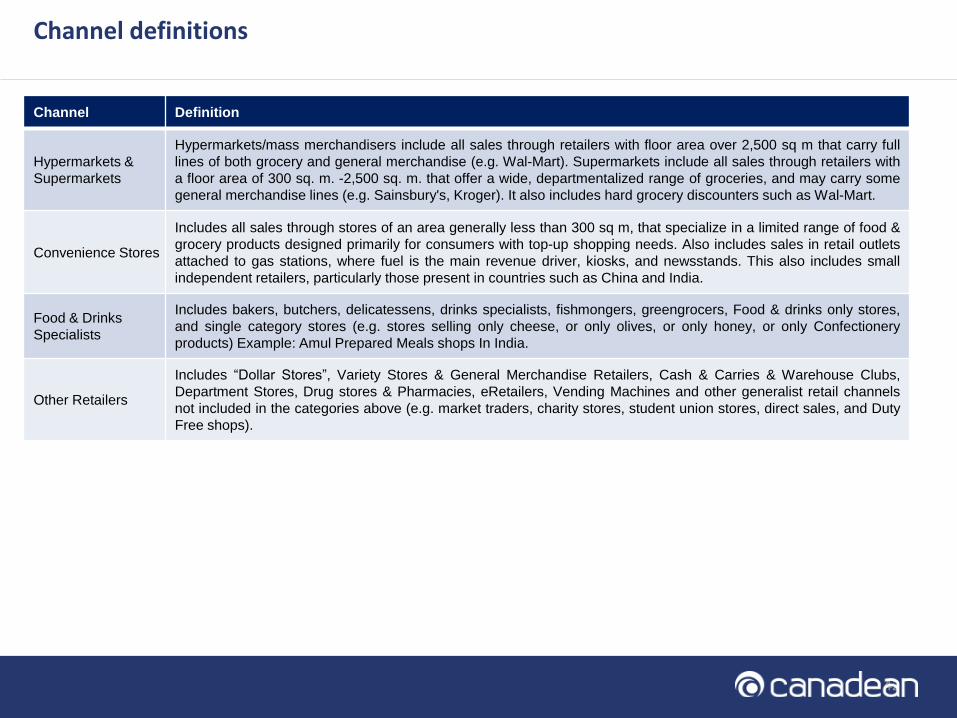
Channel Definition
Hypermarkets &
Supermarkets
Hypermarkets/mass merchandisers include all sales through retailers with floor area over 2,500 sq m that carry full
lines of both grocery and general merchandise (e.g. Wal-Mart). Supermarkets include all sales through retailers with
a floor area of 300 sq. m. -2,500 sq. m. that offer a wide, departmentalized range of groceries, and may carry some
general merchandise lines (e.g. Sainsbury's, Kroger). It also includes hard grocery discounters such as Wal-Mart.
Convenience Stores
Includes all sales through stores of an area generally less than 300 sq m, that specialize in a limited range of food &
grocery products designed primarily for consumers with top-up shopping needs. Also includes sales in retail outlets
attached to gas stations, where fuel is the main revenue driver, kiosks, and newsstands. This also includes small
independent retailers, particularly those present in countries such as China and India.
Food & Drinks
Specialists
Includes bakers, butchers, delicatessens, drinks specialists, fishmongers, greengrocers, Food & drinks only stores,
and single category stores (e.g. stores selling only cheese, or only olives, or only honey, or only Confectionery
products) Example: Amul Prepared Meals shops In India.
Other Retailers
Includes “Dollar Stores”, Variety Stores & General Merchandise Retailers, Cash & Carries & Warehouse Clubs,
Department Stores, Drug stores & Pharmacies, eRetailers, Vending Machines and other generalist retail channels
not included in the categories above (e.g. market traders, charity stores, student union stores, direct sales, and Duty
Free shops).
Channel definitions
43 43 43
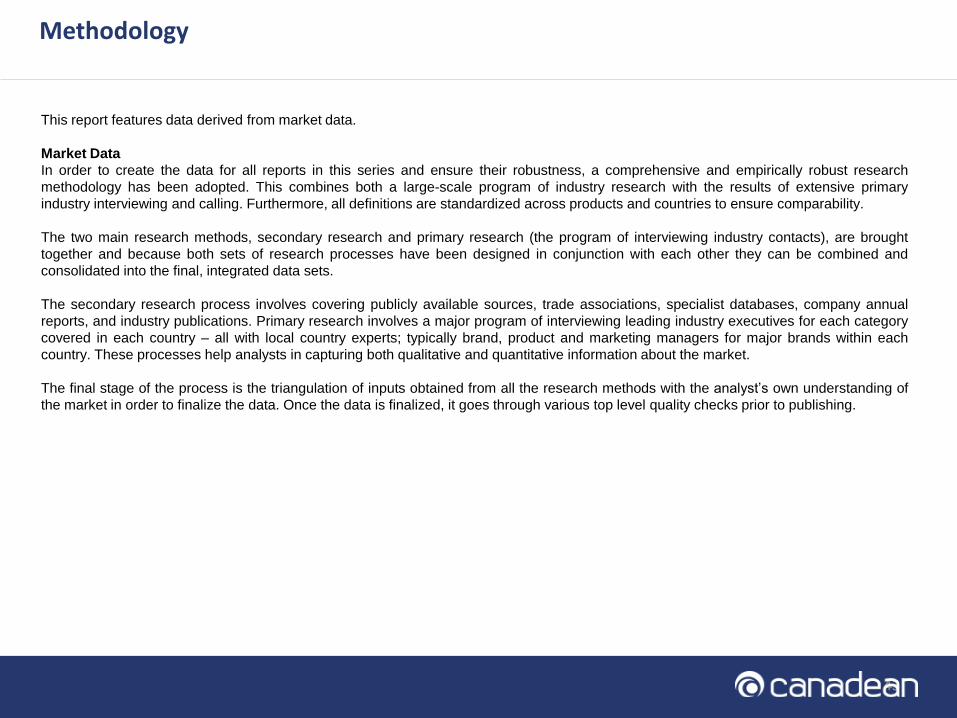
This report features data derived from market data.
Market Data
In order to create the data for all reports in this series and ensure their robustness, a comprehensive and empirically robust research
methodology has been adopted. This combines both a large-scale program of industry research with the results of extensive primary
industry interviewing and calling. Furthermore, all definitions are standardized across products and countries to ensure comparability.
The two main research methods, secondary research and primary research (the program of interviewing industry contacts), are brought
together and because both sets of research processes have been designed in conjunction with each other they can be combined and
consolidated into the final, integrated data sets.
The secondary research process involves covering publicly available sources, trade associations, specialist databases, company annual
reports, and industry publications. Primary research involves a major program of interviewing leading industry executives for each category
covered in each country – all with local country experts; typically brand, product and marketing managers for major brands within each
country. These processes help analysts in capturing both qualitative and quantitative information about the market.
The final stage of the process is the triangulation of inputs obtained from all the research methods with the analyst’s own understanding of
the market in order to finalize the data. Once the data is finalized, it goes through various top level quality checks prior to publishing.
Methodology
44 44 44
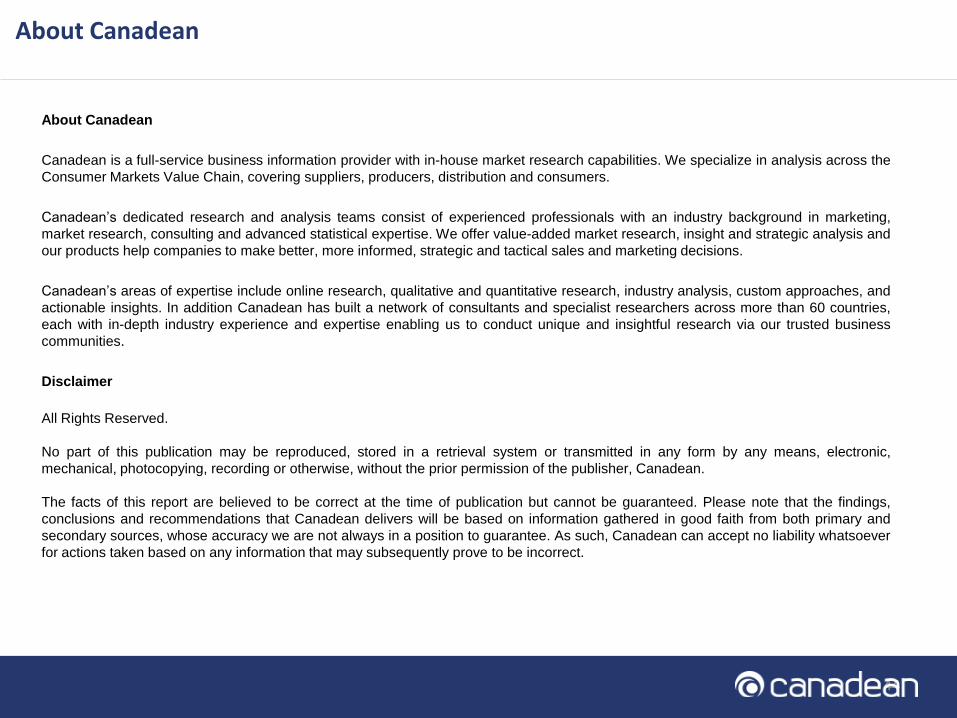
About Canadean
Canadean is a full-service business information provider with in-house market research capabilities. We specialize in analysis across the
Consumer Markets Value Chain, covering suppliers, producers, distribution and consumers.
Canadean’s dedicated research and analysis teams consist of experienced professionals with an industry background in marketing,
market research, consulting and advanced statistical expertise. We offer value-added market research, insight and strategic analysis and
our products help companies to make better, more informed, strategic and tactical sales and marketing decisions.
Canadean’s areas of expertise include online research, qualitative and quantitative research, industry analysis, custom approaches, and
actionable insights. In addition Canadean has built a network of consultants and specialist researchers across more than 60 countries,
each with in-depth industry experience and expertise enabling us to conduct unique and insightful research via our trusted business
communities.
Disclaimer
All Rights Reserved.
No part of this publication may be reproduced, stored in a retrieval system or transmitted in any form by any means, electronic,
mechanical, photocopying, recording or otherwise, without the prior permission of the publisher, Canadean.
The facts of this report are believed to be correct at the time of publication but cannot be guaranteed. Please note that the findings,
conclusions and recommendations that Canadean delivers will be based on information gathered in good faith from both primary and
secondary sources, whose accuracy we are not always in a position to guarantee. As such, Canadean can accept no liability whatsoever
for actions taken based on any information that may subsequently prove to be incorrect.
About Canadean


