61
Consumer Behavior and Utility Maximization 19 C H A P T E R
| Date post: | 13-Dec-2015 |
| Category: |
Documents |
| Upload: | mitchell-lynch |
| View: | 223 times |
| Download: | 1 times |

Consumer Behavior andUtility MaximizationConsumer Behavior andUtility Maximization
19C H A P T E R
Chapter 19. Consumer ChoiceChapter 19. Consumer ChoiceChapter 19. Consumer ChoiceChapter 19. Consumer Choice
• Utility
• Consumer surplus
• Budget Constraints
• Indifference Curves
• Utility
• Consumer surplus
• Budget Constraints
• Indifference Curves
Biscuits
123456

Choclate 123456
I. Utility AnalysisI. Utility AnalysisI. Utility AnalysisI. Utility Analysis
• what is utility? benefit you get from consuming a
good determined by your
tastes/preferences
(assume these are stable)
• what is utility? benefit you get from consuming a
good determined by your
tastes/preferences
(assume these are stable)

total utility (TU)total utility (TU)total utility (TU)total utility (TU)
• total benefit from consuming good
• example total benefit from 3 cookies
• total benefit from consuming good
• example total benefit from 3 cookies
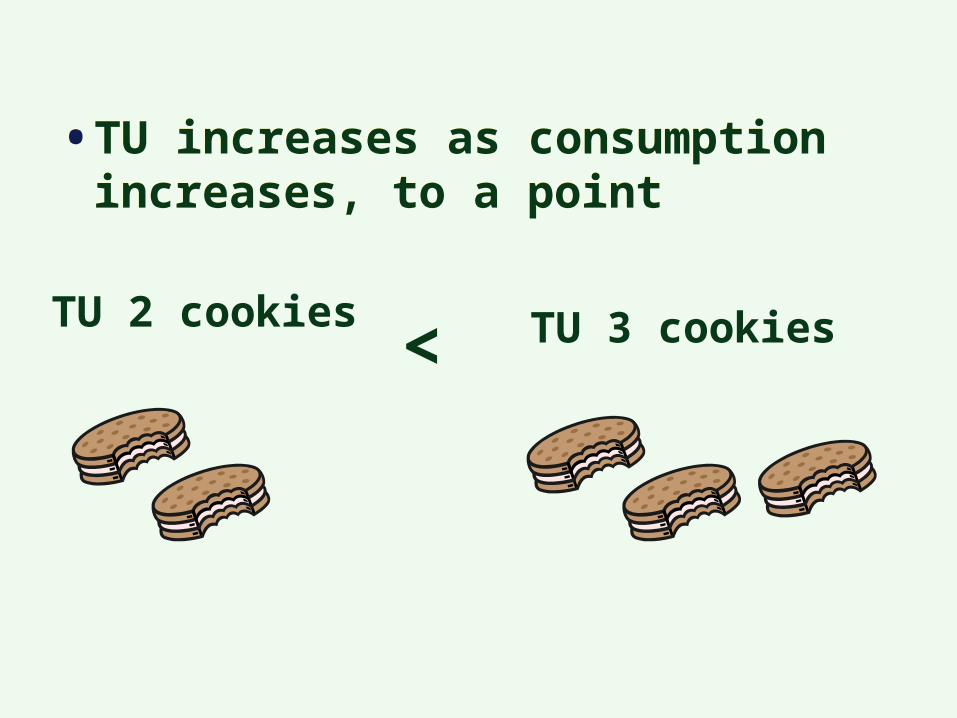
• TU increases as consumption increases, to a point
• TU increases as consumption increases, to a point
<TU 2 cookies TU 3 cookies

marginal utility (MU)marginal utility (MU)marginal utility (MU)marginal utility (MU)
• change in TU from
consuming one more of a good
• example how much MORE utility from
an additional pack of gum?
• change in TU from
consuming one more of a good
• example how much MORE utility from
an additional pack of gum?

change in TU from0 to 1 cookie
change in TU from1 cookie to 2 cookies
MU of 1st cookie
MU of 2nd cookie
=
=
0

diminishing marginal utilitydiminishing marginal utilitydiminishing marginal utilitydiminishing marginal utility
• MU falls as consumption rises
• get sick of cookies• MU falls as consumption rises
• get sick of cookies

MU of 1st cookie
> MU of 2nd cookie
0

TU
cookie
TU rises at slower and slower rate
as MU declines
MU
cookie

How to maximize TU?How to maximize TU?How to maximize TU?How to maximize TU?
• use available budget
• equalize MU/$ across goods
• Huh?
• use available budget
• equalize MU/$ across goods
• Huh?

• chose combination of cookies and milk where
• chose combination of cookies and milk where
price of cookies price of milk
MU cookies=
MU milk

why?why?why?why?
• chose combo of 6 cookies, 1 milk
• suppose MU/$1 of cookies = 4,
MU/$1 of milk = 15
• by consuming fewer cookies, more milk…
I would add more to my TU
• chose combo of 6 cookies, 1 milk
• suppose MU/$1 of cookies = 4,
MU/$1 of milk = 15
• by consuming fewer cookies, more milk…
I would add more to my TU

TU vs. MUTU vs. MUTU vs. MUTU vs. MU
• Diamond-Water paradox
• $10,000 one carat diamond 5 million gallons of tap water
• Diamond-Water paradox
• $10,000 one carat diamond 5 million gallons of tap water

why?why?why?why?
• TU of water is greater than TU of diamonds water is essential for life
• BUT water is abundant, diamonds are rarer MU of last diamond is higher
• MU determines value
• TU of water is greater than TU of diamonds water is essential for life
• BUT water is abundant, diamonds are rarer MU of last diamond is higher
• MU determines value

MU and demandMU and demandMU and demandMU and demand
• MU declines as consumption rises
• willing to pay less for each additional unit downward sloping demand
• MU declines as consumption rises
• willing to pay less for each additional unit downward sloping demand

example : pizzaexample : pizzaexample : pizzaexample : pizza
P
Q
D
$10
4 pizzas
for 4th pizzawilling to pay $10
for 2nd pizza$15
2 pizza
willing to pay $15

II. Consumer SurplusII. Consumer SurplusII. Consumer SurplusII. Consumer Surplus
• difference between what you pay for a good,
any what you are WILLING to pay for a good
• difference between what you pay for a good,
any what you are WILLING to pay for a good
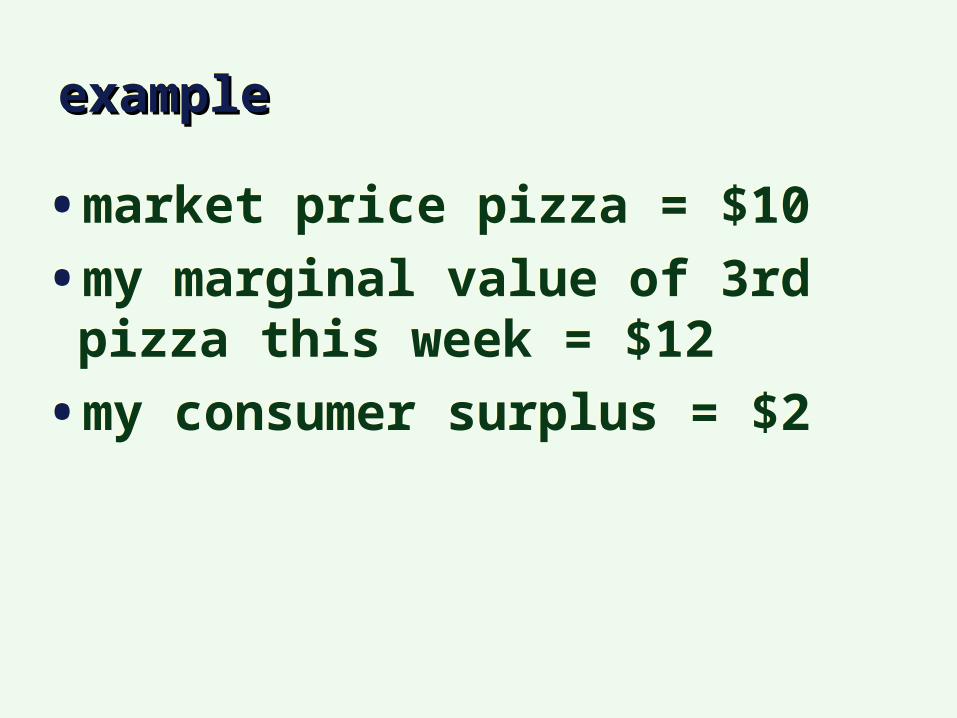
exampleexampleexampleexample
• market price pizza = $10
• my marginal value of 3rd pizza this week = $12
• my consumer surplus = $2
• market price pizza = $10
• my marginal value of 3rd pizza this week = $12
• my consumer surplus = $2

P
Q
D
$10
my demand curvemy demand curvemy demand curvemy demand curve
$12
3
my consumer surplus

P
Q
D
$10
10,000
total consumer surplus
area between Dand price of pizza
III. The Budget LineIII. The Budget LineIII. The Budget LineIII. The Budget Line
• given: consumer’s budget prices
• draw a line representing choices
• consumption possibilities
• given: consumer’s budget prices
• draw a line representing choices
• consumption possibilities

exampleexampleexampleexample
• 2 goods: milk & cookies
• bottle of milk = $1
• cookie = $.50
• daily budget = $4
• 2 goods: milk & cookies
• bottle of milk = $1
• cookie = $.50
• daily budget = $4

possible combinationspossible combinationspossible combinationspossible combinations
cookies milk
02468
43210

budget linebudget linebudget linebudget line
milk
cookies
8
4
2
6
0421 3

budget linebudget linebudget linebudget line
milk
cookies
8
4
2
6
0421 3
Affordable
Unaffordable
what if prices change?what if prices change?what if prices change?what if prices change?
• changes slope of budget line
• suppose cookies = $1• changes slope of budget line
• suppose cookies = $1

budget linebudget linebudget linebudget line
milk
cookies
8
4
2
6
0421 3
cookie = $.50
cookie = $1
what if budget changeswhat if budget changeswhat if budget changeswhat if budget changes
• budget line shifts
• suppose budget = $5• budget line shifts
• suppose budget = $5

milk
cookies
budget = $4
budget = $58
4
2
6
0
10
421 3 5

IV. Indifference CurvesIV. Indifference CurvesIV. Indifference CurvesIV. Indifference Curves
• (appendix)
• alternative way to show utility
• curve shows combo of goods
that deliver same total utility
• (appendix)
• alternative way to show utility
• curve shows combo of goods
that deliver same total utility

example: milk and cookiesexample: milk and cookiesexample: milk and cookiesexample: milk and cookies
milk
8
4
2
6
0421 3
cookies
Indifference curve
Every point on curve has same total utility
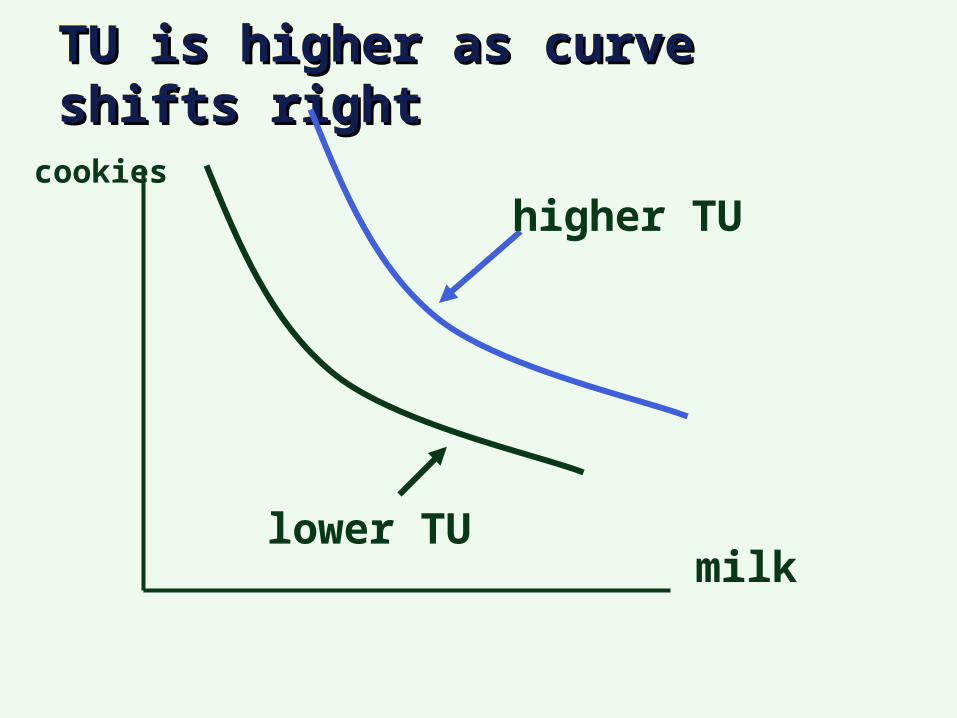
TU is higher as curve shifts rightTU is higher as curve shifts rightTU is higher as curve shifts rightTU is higher as curve shifts right
milk
cookies
higher TU
lower TU

consumer equilibriumconsumer equilibriumconsumer equilibriumconsumer equilibrium
• maximize TU
• stay on budget• maximize TU
• stay on budget
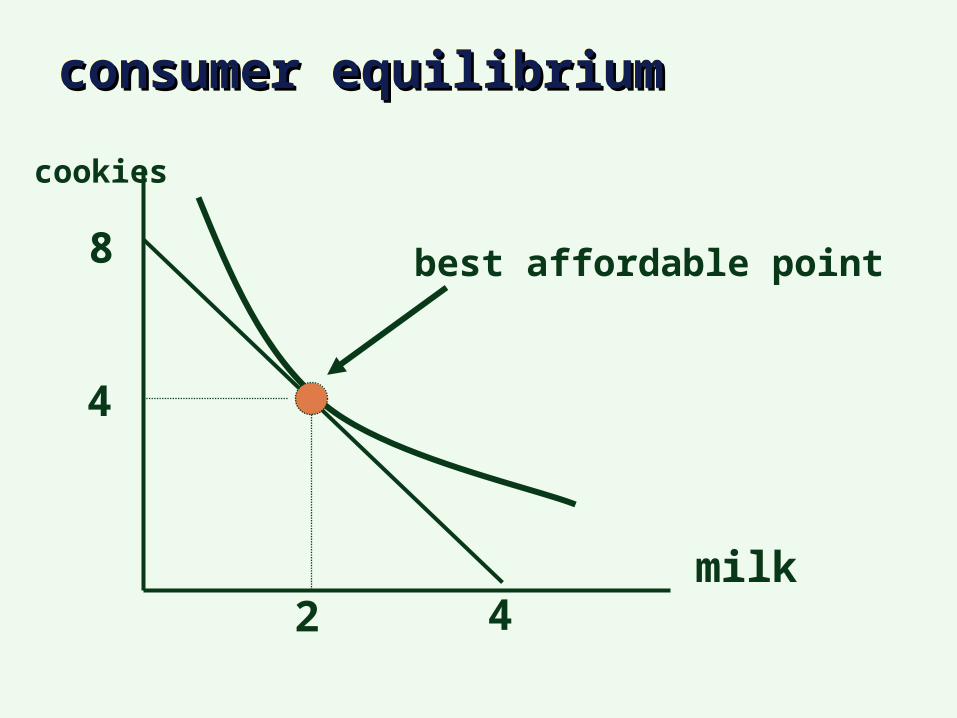
consumer equilibriumconsumer equilibriumconsumer equilibriumconsumer equilibrium
cookies
8
milk4
4
2
best affordable point
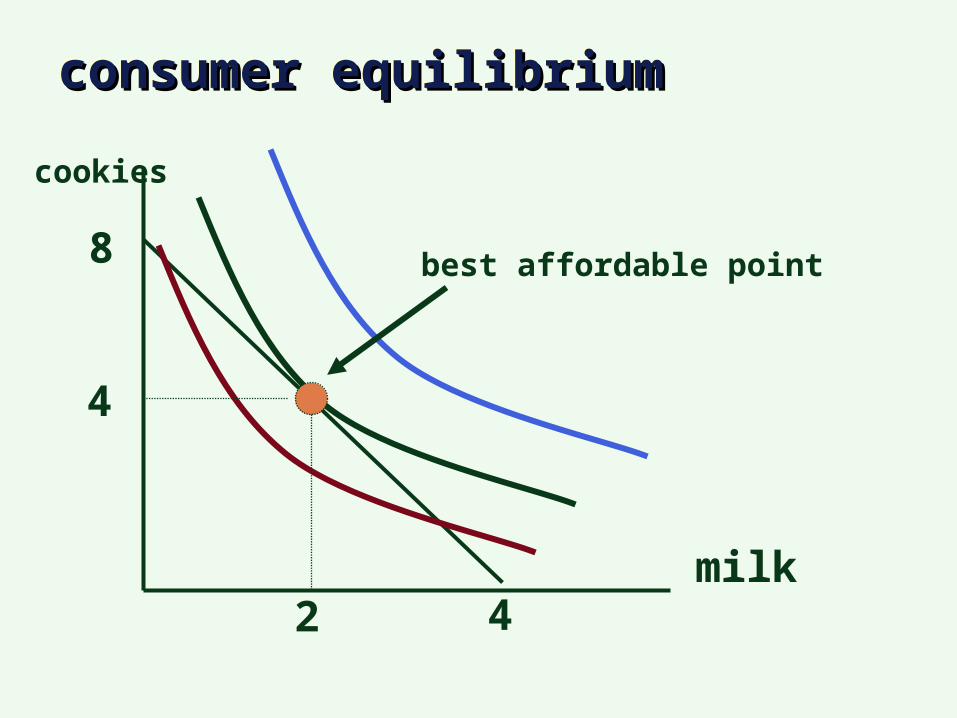
consumer equilibriumconsumer equilibriumconsumer equilibriumconsumer equilibrium
cookies
8
milk4
4
2
best affordable point
sum it upsum it upsum it upsum it up
• consumer decisions based on preferences budget constraint
• consumer decisions made at the margin marginal benefit of one more compared to price of one more
• consumer decisions based on preferences budget constraint
• consumer decisions made at the margin marginal benefit of one more compared to price of one more

• I. Introduction
• A. We spend Millions of KDs on goods and services each. yet no two consumers spend their incomes in the same way. How can this be explained?
• B. Why does a consumer buy a particular bundle of goods and services rather than others?
• Examining these issues will help us understand consumer behavior and the law of demand.
40

II. Two Explanations of the Law of Demand
• A. Income and substitution effects explain the inverse relationship between price and quantity demanded.
• 1. The income effect is the impact of a change in price on consumers’ real incomes and on the quantity of that product demanded.
• An increase in price means that less real income is available to buy subsequent amounts of the product.
41
You have less You have less income to buy income to buy
same amount of same amount of the product as the product as
beforebefore

• 2. The substitution effect
• A higher price for a particular product means that the item has become relatively more expensive compared to its substitutes. (i.e. Tea and Coffee)
• Therefore, consumers will buy less of this product and more of the substitutes, whose prices are relatively lower than before.
• 2. The substitution effect
• A higher price for a particular product means that the item has become relatively more expensive compared to its substitutes. (i.e. Tea and Coffee)
• Therefore, consumers will buy less of this product and more of the substitutes, whose prices are relatively lower than before. 42
other other products are products are cheaper nowcheaper now
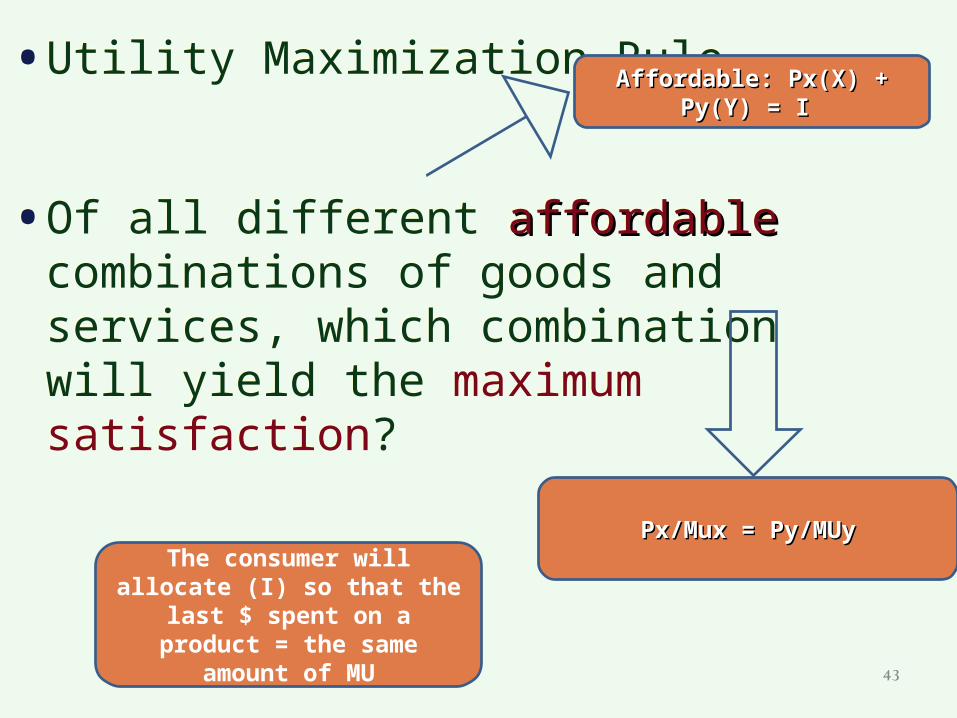
• Utility Maximization Rule
• Of all different affordableaffordable combinations of goods and services, which combination will yield the maximum satisfaction?
• Utility Maximization Rule
• Of all different affordableaffordable combinations of goods and services, which combination will yield the maximum satisfaction?
43
Affordable: Affordable: Px(X) + Py(Y) = IPx(X) + Py(Y) = I
Px/Mux = Py/MUyPx/Mux = Py/MUy
The consumer will allocate (I) so that the last $ spent on a product
= the same amount of MU

First 10 10 24 12Second 8 8 20 10Third 7 7 18 9Fourth 6 6 16 8Fifth 5 5 12 6Sixth 4 4 6 3Seventh 3 3 4 2
$ 10 income
UTILITY MAXIMIZING COMBINATION
Unit ofproduct
Product A:Price = $1
Product B:Price = $2
Marginalutility,utils
Marginalutility per
dollar(MU/price)
Marginalutility,utils
Marginalutility per
dollar(MU/price)
44

First 10 10 24 12Second 8 8 20 10Third 7 7 18 9Fourth 6 6 16 8Fifth 5 5 12 6Sixth 4 4 6 3Seventh 3 3 4 2
$ 10 income
UTILITY MAXIMIZING COMBINATION
Unit ofproduct
Product A:Price = $1
Product B:Price = $2
Marginalutility,utils
Marginalutility per
dollar(MU/price)
Marginalutility,utils
Marginalutility per
dollar(MU/price)
45
1 unit of (A) and 2 units of (B) is affordable:
1(1) + 2(2) = 5$Still $5 left!

First 10 10 24 12Second 8 8 20 10Third 7 7 18 9Fourth 6 6 16 8Fifth 5 5 12 6Sixth 4 4 6 3Seventh 3 3 4 2
$ 10 income
UTILITY MAXIMIZING COMBINATION
Unit ofproduct
Product A:Price = $1
Product B:Price = $2
Marginalutility,utils
Marginalutility per
dollar(MU/price)
Marginalutility,utils
Marginalutility per
dollar(MU/price)
46
4 of (A) and 5 of (B) 1(4) + 2(5)=$11Not affordable

First 10 10 24 12Second 8 8 20 10Third 7 7 18 9Fourth 6 6 16 8Fifth 5 5 12 6Sixth 4 4 6 3Seventh 3 3 4 2
$ 10 income
UTILITY MAXIMIZING COMBINATION
Unit ofproduct
Product A:Price = $1
Product B:Price = $2
Marginalutility,utils
Marginalutility per
dollar(MU/price)
Marginalutility,utils
Marginalutility per
dollar(MU/price)
47
2 of (A) and 4 of (B) 1(2) + 2(4) =$10
3. It is marginal utility per dollar spent that is equalized; that is, consumers compare the extra utility from each product with its cost.
3. It is marginal utility per dollar spent that is equalized; that is, consumers compare the extra utility from each product with its cost.
48
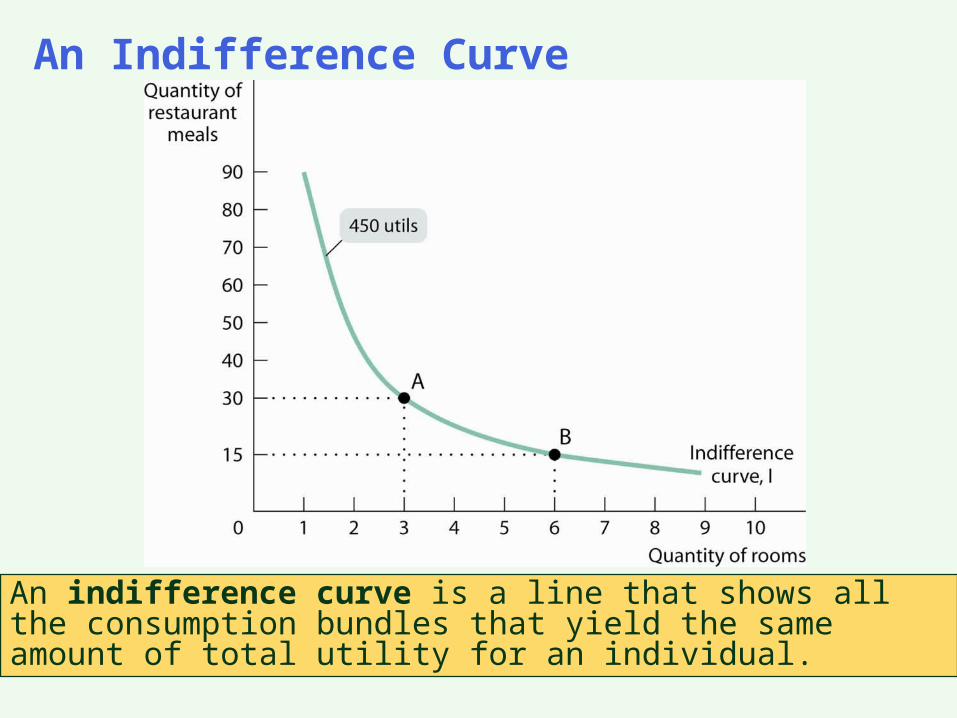
An Indifference Curve
An indifference curve is a line that shows all the consumption bundles that yield the same amount of total utility for an individual.

An Indifference Curve Map

Properties of Indifference Curves
indifference curves never crossthe farther out an indifference curve is, the higher the total utility it indicates
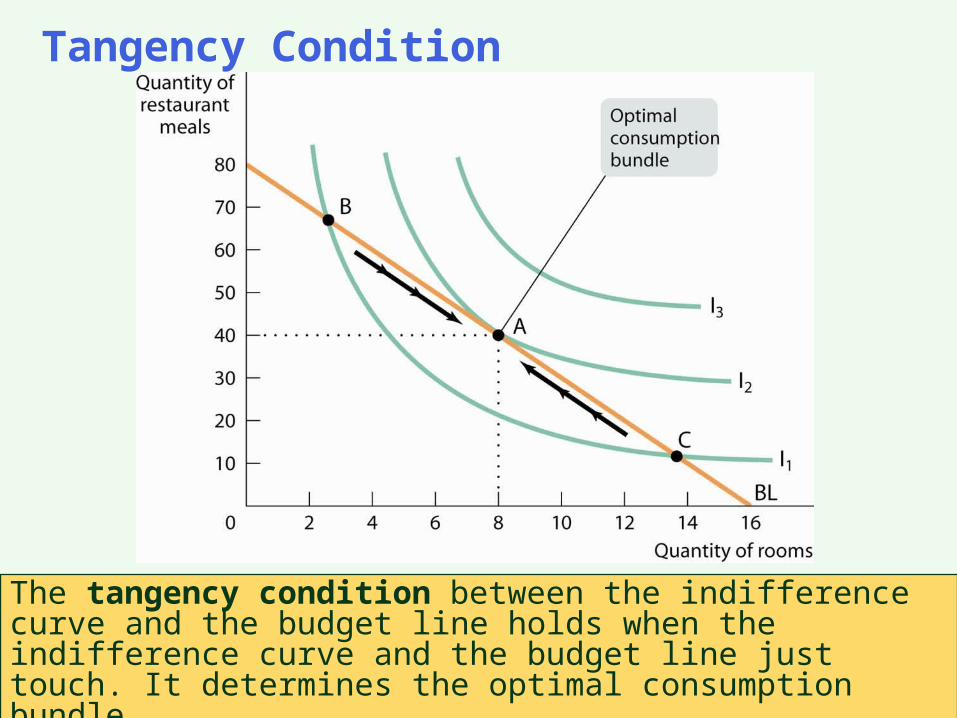
The tangency condition between the indifference curve and the budget line holds when the indifference curve and the budget line just touch. It determines the optimal consumption bundle.
Tangency Condition
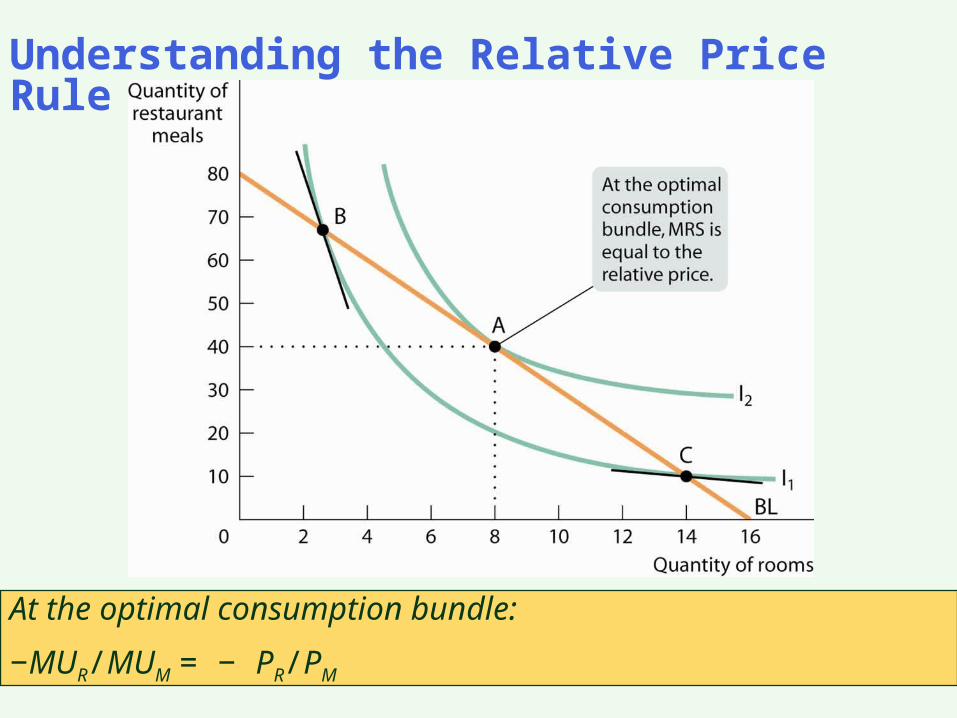
Understanding the Relative Price Rule
At the optimal consumption bundle:
−MUR/MUM = − PR/PM

Differences in Preferences
Even rats can make rational choices! And if rats can make rational choices, so can people!
• Rats and Rational Choice• Rats and Rational Choice
SCENARIO

1. Refer to the figure below. As described in the textbook, even a rat would not choose:
A) point C.
B) point A.
C) point B.
D) either point A or point B.
• Rats and Rational Choice
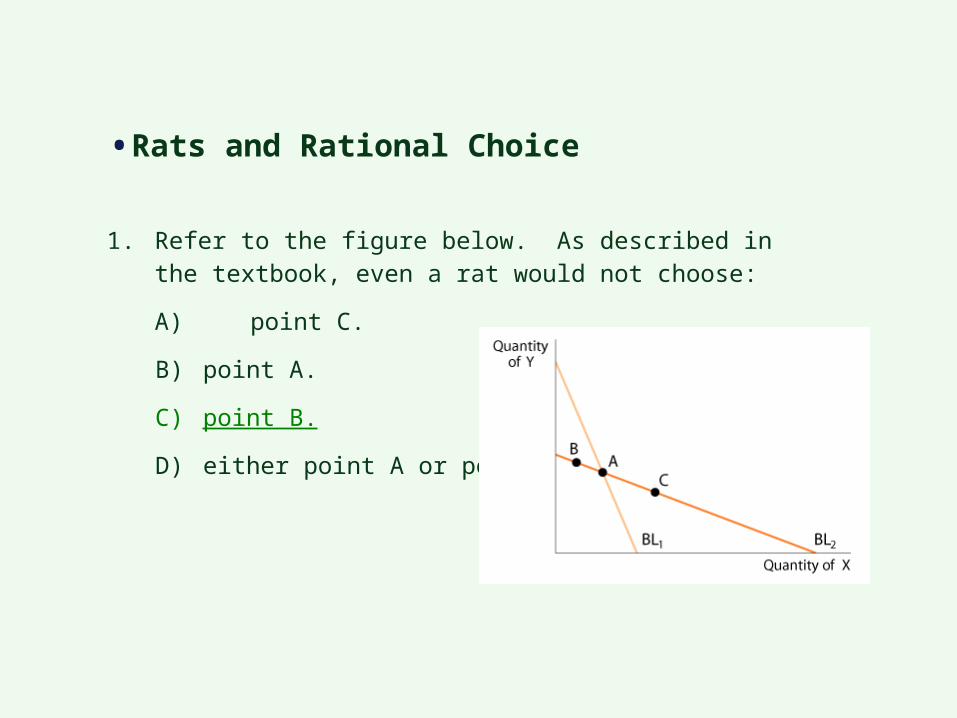
1. Refer to the figure below. As described in the textbook, even a rat would not choose:
A) point C.
B) point A.
C) point B.
D) either point A or point B.
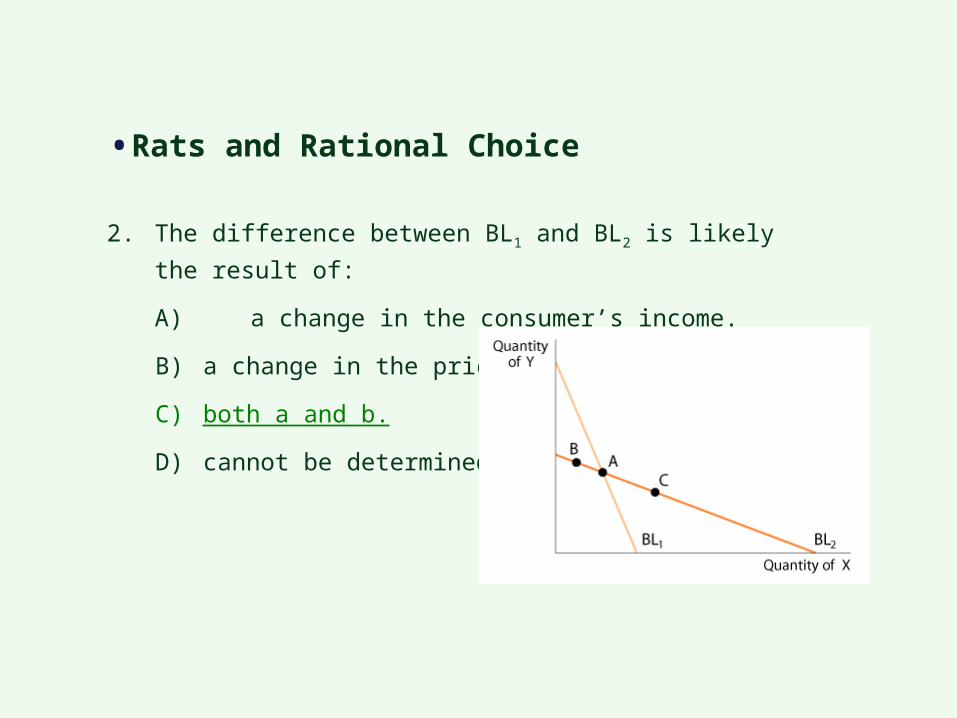
• Rats and Rational Choice

2. The difference between BL1 and BL2 is likely the result of:
A) a change in the consumer’s income.
B) a change in the prices of the goods.
C) both a and b.
D) cannot be determined.
• Rats and Rational Choice
2. The difference between BL1 and BL2 is likely the result of:
A) a change in the consumer’s income.
B) a change in the prices of the goods.
C) both a and b.
D) cannot be determined.
• Rats and Rational Choice

3. Which of the following is the expression for the optimal consumption bundle of two goods, X and Y?
A) MUX = PX and MUY = PY
B) MUX/PY = MUY/PX
C) MUX/PX = MUY/PY
D) none of the above
• Rats and Rational Choice

• Rats and Rational Choice
3. Which of the following is the expression for the optimal consumption bundle of two goods, X and Y?
A) MUX = PX and MUY = PY
B) MUX/PY = MUY/PX
C) MUX/PX = MUY/PY
D) none of the above


