30
Consumer-centric Medicaid in a 21 st Century Intelligent Healthcare System Healthcare Visions, Inc. Yes, when… An Approach for Savings Lives and Improving the Health of Georgians
| Date post: | 29-Dec-2015 |
| Category: |
Documents |
| Upload: | maria-newton |
| View: | 214 times |
| Download: | 0 times |

Consumer-centric Medicaid in a
21st Century Intelligent Healthcare System
Healthcare Visions, Inc. Yes, when…
An Approach for Savings Lives and
Improving the Health of Georgians

2
What Is a 21st Century Intelligent Health System?
In a 21st Century Intelligent Health System, the individual has: Accurate, timely knowledge of personal health needs, Access to the best information about how to maintain personal health, Knowledge of whom to see and where to go for health services, And confidence that health providers are practicing medicine using best
practices based on the most up-to-date understanding of outcomes-based medicine.
In a 21st Century Intelligent Health System, the individual has the right to know
the price and quality information about health services in the most accurate, least expensive, and most convenient manner possible.
In a 21st Century Intelligent Health System, the individual is the center of
knowledge and decision-making and has responsibility for his or her own health.

3
Consumer-centric MedicaidThe 21st Century Medicaid Act
Medicaid should be divided into three distinct sub-programs, each administered separately with its own rules and structures. However, all the sub-programs should be based on the following principles:
1. A 21st Century Medicaid System will focus on wellness,prevention, early detection, and independent living.
2. A 21st Century Medicaid System will integrate the family and community into the healthcare and the lives of loved ones.
3. A 21st Century Medicaid system will leverage innovations inscience and technology, quality systems, and best practices inevery aspect of providing care for its beneficiaries.
4
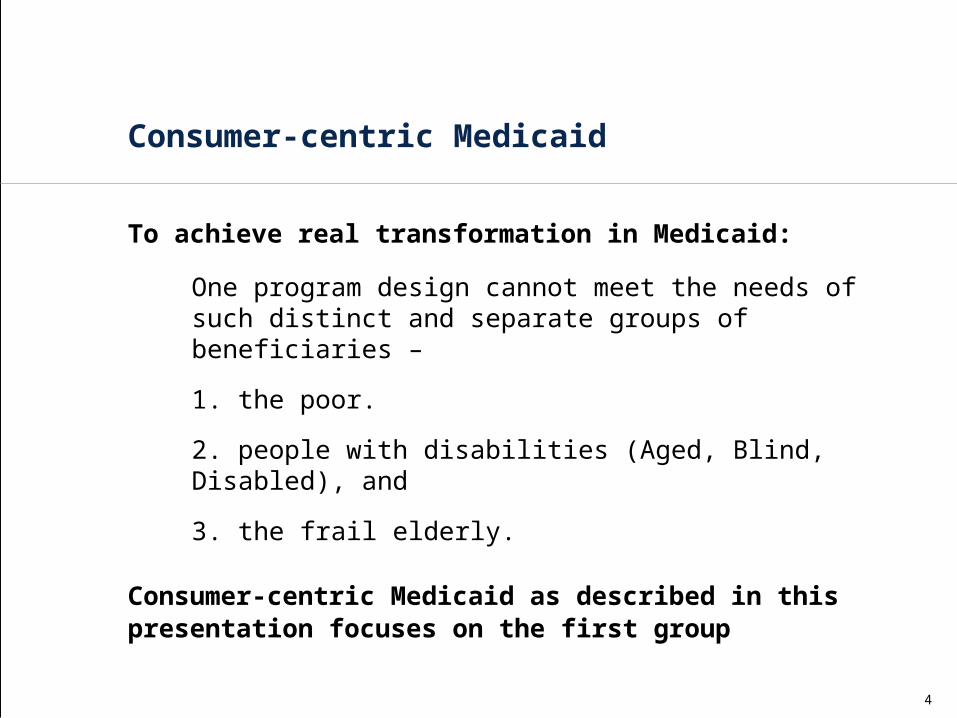
Consumer-centric Medicaid
To achieve real transformation in Medicaid:
One program design cannot meet the needs of such distinct and separate groups of beneficiaries –
1. the poor.
2. people with disabilities (Aged, Blind, Disabled), and
3. the frail elderly.
Consumer-centric Medicaid as described in this presentation focuses on the first group

5
Consumer-centric Medicaid
Consumer-centric Medicaid is about transforming the health benefit plan into one that puts economic purchasing power—and decision-making—in the hands of participants.
It’s about supplying the information and decision support tools they need, along with financial incentives, rewards, and other benefits that encourage personal involvement in altering health and healthcare purchasing behaviors.

6
Two Basic Principles for Successful Consumer-centric Medicaid
1. Must work for the Sickest Participants, as well as the healthy
2. Must work for those not wanting to get involved in decision-making, as well as the “techies”

7
The Core of Consumer-centric Medicaid
The Unifying Theme for a
Health and Healthcare Strategy is:
Behavioral ChangeBehavioral Change
“Implement only if it supports behavioral change consistent with the
strategy”

8
Consumer-centric Medicaid Choices involve Options for Behavioral Change
Consumerism Choices:
WellnessPreventive careEarly InterventionLifestyle Options (diet, exercise, smoking, safety)
Self-help, self careDiscretionary Expenses (e.g. OV, ER, Rx)
Value purchasing (e.g. DXL, o/p vs. in/p)
Participation in Disease Management ProgramsCompliance with Evidence Based Medicine
Treatment Plans

9
Two Choices for the FutureSupply Controls or Demand Controls
Plan Sponsors and Members have two basic choices to control costs:
1. Managed care & HMOs - The “supply of care” is limited by a third party who controls the access to medical services (e.g. utilization reviews, medical necessity, gatekeepers, formularies, scheduling, types of services allowed), or
2. Consumerism - The member controls their “demand for care” because of a direct and significant financial involvement in the cost of care, rewards for compliance, and the information to make wise health and healthcare value driven decisions.

10
High Healthcare Costs Climbing Higher
Patients have lost control of their own healthcare, and are not truly engaged in the process of managing their health
Patients are frustrated with managed care “rules” and the impact on access and quality of care
Patients don’t understand healthcare costs – costs are not transparent
“Every system is perfectly designed for the results achieved”
Supply Controls Are Failing

11
Cost Control LeversA comparison between Managed Care and Consumer-centric Medicaid
1. Eligibility
2. Benefit Design
3. Cost Sharing
4. Premium Sharing
5. Service Costs
6. Utilization
Consumer-centric Medicaid
Graduation to Private Ownership
Asset Accumulation
Shared Savings-Pay 4 Compliance
Income based
Shared Savings-Pay 4 Performance
Demand Controlled
Managed Medicare
Legislated Reductions
Fairly Fixed
Minimal
Non-existent
Forced Price Controls
Supply Managed
Georgia - Creating the Possible…

12
Two Choices for the FutureManaged Care or Consumerism
Behavioral Change and Cost Management Potential
Low Impact ---- ---- ---- ---- ---- ---- ---- ---- ---- High Impact
Traditional Medicaid
Planswith
Consumer Information
&Managed Care
2nd Generation Consumerism
Focus onBehaviorChanges
TraditionalMedicaid
Plans
3rd Generation Consumerism
IntegratedHealth &
Productive Citizenry
1st Generation Consumerism
Focus on Discretionary
Spending
4th Generation Consumerism
Personal Ownership of Health and Healthcare
2nd Gen Managed Care
Ltd Eligibility, In/P Review, O/P Review
3rd Gen Managed Care
Restrictive Rx Formulary,Social Service
Benefit Reductions
1st Gen Managed Care
Ltd Benefits, Ltd Network
Providers,High
Discounters
4th Gen Managed Care
More Supply Controls, Scheduled Benefits, Prioritized Diagnoses
Consumerism &
Demand Control
Managed Care & Supply Control
13
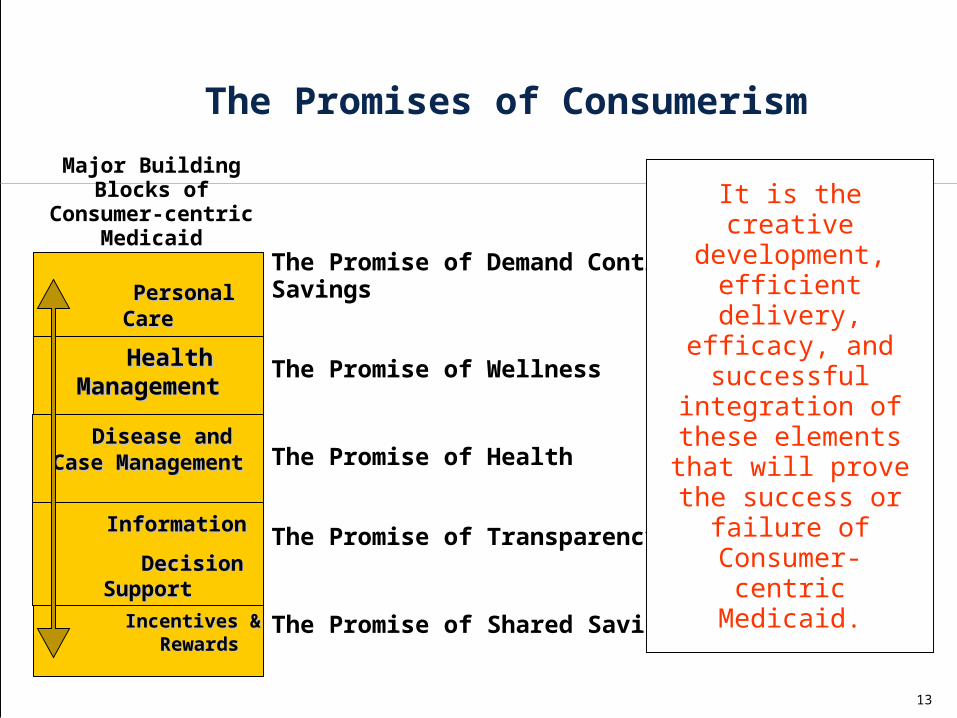
The Promises of Consumerism
Personal CarePersonal CareAccountsAccounts
Incentives & Incentives & RewardsRewards
Health ManagementHealth Management
Disease and Case Disease and Case ManagementManagement
InformationInformation
Decision SupportDecision Support
The Promise of Demand Control & Savings
The Promise of Wellness
The Promise of Shared Savings
The Promise of Transparency
The Promise of Health
It is the creative development,
efficient delivery, efficacy, and successful
integration of these elements that will
prove the success or failure of Consumer-
centric Medicaid.
Major Building Blocks of Consumer-centric
Medicaid

2nd Generation Consumerism
Focus onBehaviorChanges
3rd Generation Consumerism
IntegratedHealth &
Productive Citizenry
1st Generation Consumerism
Focus on Discretionary
Spending
4th Generation Consumerism
Personal Ownership of Health and Healthcare
Personal Care Personal Care AccountsAccounts
Incentives & Incentives & RewardsRewards
Health ManagementHealth Management
Disease and Case Disease and Case ManagementManagement
Education, Education, Communication, InformationCommunication, Information & Decision Support Tools& Decision Support Tools
Allocation to purchase Private
Coverage
Individual Activity & Compliance
Rewards
Individual, Family & Group Rewards
Conversion to Private HSAs, Use for non-Healthcare
100% Preventive Care thru Debit Cards
Web-based behavior change
support programs
Wellness,Stress, Juv Justice, Violence, MH/SA
Genomics, predictive modeling
push technology
Information, health coach,
Cash & Counseling
Disease specific focus, (Diabetes, MH/SA), Special Case Mgmt Svcs
Functionality Focus, Population Mgmt,
Cultural DM, Integrated Hlth Mgmt,
Wireless cyber –support, Holistic
care
Payor / Intermediary
Sponsored, Paper Based
Tele, Personal and Family hlth mgmt,
Community Resources
Info on Quality and Health Disparities,
Multi-Cultural needs, Faith Based Outreach
Personal Responsibilities,
Self-care, information therapy
Potential if unexpected Funds
Zero balance acct, activity based
incentives,P4P,P4C
Non-health State initiatives
Subsidies for movement to Indiv.
or Employment Based Coverage
The Consumer-centric
Medicaid Grid

15
Using Information & Incentives To Address Wellness & Disease Management Behavioral Changes
Low Users Medium Users
High Users
Very High Users
No Claims
Generally Healthy
Acute Episodic Conditions .
O/P, Low In/P, High Maternity
Chronic & Persistent . Conditions .
O/P, Low In/P, High
Catastrophic
% Mem 15% 48% 14%
3% 3% 12% 4% 1%
% Dollars 0% 12% 15%
12% 5% 21%
20%
15%
% Mem 63% 32% 17%
% Dollars
12% 32% 56%
PreventionPrevention Wellness - LifestyleWellness - Lifestyle
Minimize
Early InterventionEarly Intervention
Wellness - ClinicalWellness - Clinical
Maximize
Minimize
Maximize
Wellness - LifestyleWellness - Lifestyle
Wellness - ClinicalWellness - Clinical

16
State of Georgia Analysis (Includes Aged, Blind & Disabled)
Low Users Medium UsersHigh Users
Very High Users
No Claims Generally HealthyInpatient
CareMaternity
Aged, Blind, Disabled
Catastrophic
% Members 15% 32% 34%
4% 14% 1%
% Dollars 0% 7% 26% 8% 37%
22%
% Members 47% 38% 15%
% Dollars 7%
34% 59%
PreventionPrevention Wellness - LifestyleWellness - Lifestyle
Minimize
Early InterventionEarly InterventionWellness - ClinicalWellness - Clinical
Maximize
Minimize
Maximize
Wellness - LifestyleWellness - Lifestyle
Wellness - ClinicalWellness - Clinical

17
Health Promotion
Health Risk Management
Chronic Disease Management
High Cost Case Management
Website Health Risk Assessment
Patient Identification and enrollment
Targeted Behavior Modification
Care Coordination
Practice Guidelines
HealthyLifestyle Promotion
Physical Activity Campaign
Address Comorbid Conditions
Integrated Services, Communications, Measurement and EvaluationIntegrated Services, Communications, Measurement and Evaluation
Care Continuum - Changing Behaviors
Acute Conditionse.g., Infections, Respiratory, Lacerations
Navigational Support
Patient Advocacy
Care Coordination
Address Comorbid Conditions
At Risk
e.g., Inactivity, High Stress, Overweight, High Blood Pressure
Chronic Conditions
e.g., Depression, Heart Disease
Catastrophic Conditions
e.g., Cancer, Hepatitis C
Well
e.g., Low Risk, Good Nutrition, Active
Lifestyle

18
Low Users Medium Users High Users Very High Users
No Claims
Generally Healthy
Acute EpisodicConditions
Chronic & Persistent Conditions Catastrophic
O/P, Low
In/P, High Maternity O/P,
LowIn/P, High
% Ee
% Dollars
% Ee
% Dollars
PatientSafety
Centers of Excellence
PatientAdvocacy/
Case Management
Pre-Natal Care
Reduce Variation in Evidence-Based
Medicine
DiseaseManagement
Reduce Variation in Evidence-Based
Medicine
Discretionary Expenses
Psycho-Social Factors / Integrated Absence Management
Personal Health ManagementDecision Support & Information

19
Passive Assertive Aggressive Program Type: Phone and mail
out- reach, no incentives
Incentives (i.e., waiving Rx copays)
Incentives (i.e, waiving Rx copays,
premium differential
DM vendor pricing method
Per employee per month, all
employees
Low PEPM on all ees plus hourly or per
case rate on participants only (rate
varies based on participant risk
status)
Low PEPM on all ees plus hourly or per case rate on participants only (rate varies based on participant risk
status)
Percentage of chronic diseased participating in program
10% 50% 75%
Return on investment of disease management programs
0 - .5 1.5 - 2 1.5 - 3

20
Wellness
Communication
Acute Case Mgmt
Utilization and Case Management
NETWORK A / TPA A NETWORK B / TPA B
Education
Prevention
Demand Management
Disease Mgmt Programs
Integrated Absence Mgmt The secret is cooperation and synergy between
components supporting the corporate strategies
Integrated Health Management ProgramAn Implementation Option for Multiple Generations
General ManagerPersonal Care Accts.
FSAs, HRAs, HSAs
Process Integration &
Disciplined Im
provement
Com
pany
Dat
a W
areh
ouse
& M
etri
cs
21
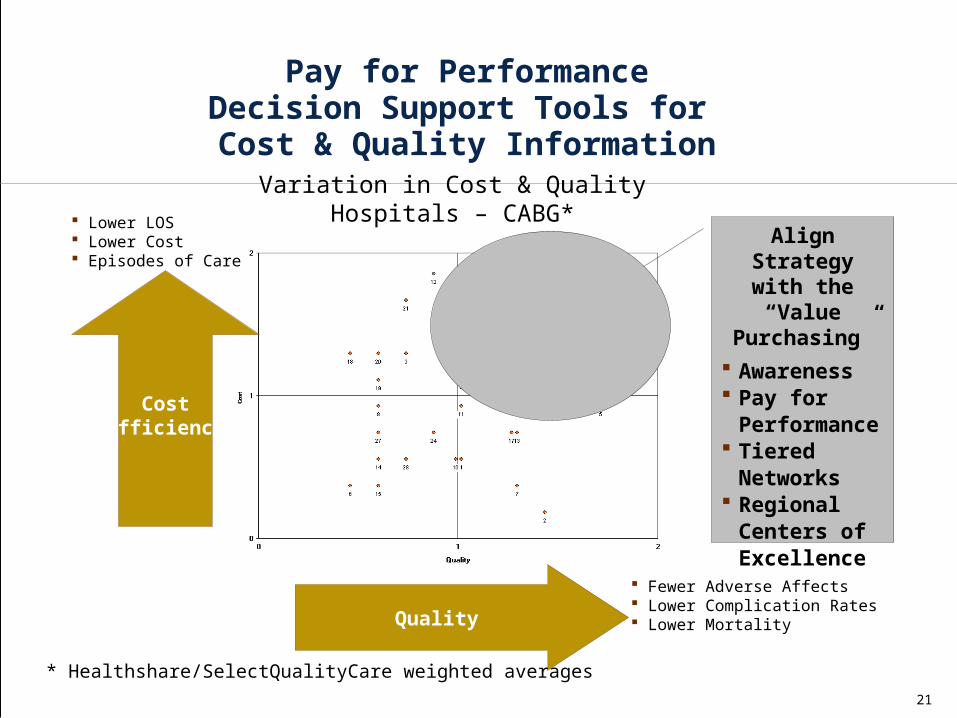
Align Strategy with the “Value
Purchasing”
Awareness Pay for
Performance Tiered
Networks Regional
Centers of Excellence
CostEfficiency
Quality
Variation in Cost & QualityHospitals – CABG*
Fewer Adverse Affects Lower Complication Rates Lower Mortality
Lower LOS Lower Cost Episodes of Care
* Healthshare/SelectQualityCare weighted averages
Pay for PerformanceDecision Support Tools for Cost & Quality Information

22
Comparison of Selected Atlanta Hospitals

23
Comparison of Selected Atlanta HospitalsDiabetes Mortality

24
Comparison of Selected Atlanta HospitalsDiabetes Complications Index
25
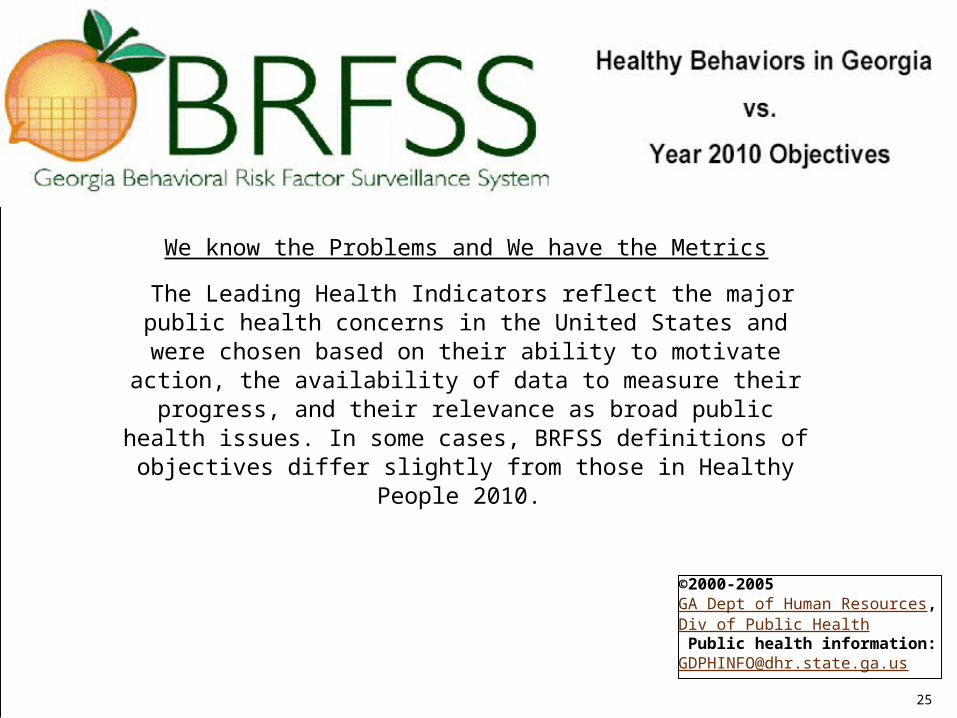
We know the Problems and We have the Metrics
The Leading Health Indicators reflect the major public health concerns in the United States and were chosen
based on their ability to motivate action, the availability of data to measure their progress, and their relevance as
broad public health issues. In some cases, BRFSS definitions of objectives differ slightly from those in Healthy
People 2010.
©2000-2005 GA Dept of Human Resources, Div of Public Health Public health information: [email protected]

26
Healthy People 2010, Leading Health Indicators
2001 2002 2003Year 2010
Target
Regular Moderate Physical Activity, 5 or more days/week for 30 or more minutes or Vigorous Physical Activity 20 Minutes or more per Day, Three or more Days per Week (Objective # 22.2) Ages > 18 years
40% N/A 42% 30%
Obese, BMI > 30 (Objective # 19.2) Ages > 20 years
23% 24% 26% 15%
Cigarette Smoking (Objective # 27.1a) Ages > 18 years
24% 23% 23% 12%
Binge Drinking, during past month (Objective # 26.11c)Ages > 18 years
12% 13% 13% 6%
Influenza Immunization, Within Past Year (Objective # 14.29a)Ages > 65 years
62% 59% 67% 90%
Pnumococcal Immunization, Ever had (Objective # 14.29b)Ages > 65 years
58% 57% 61% 80%
Health Insurance (Objective # 1.1)Ages > 18 years
86% 84% 84% 100%
Specific Source of Ongoing Primary Care (Objective #1.4c)Ages > 18 years
77% 77% 77% 96%
Healthy Behaviors in Georgia vs. Year 2010 Objectives

27
Healthy People 2010, Other Objectives
2001
2002 2003
Year 2010 Target
Limitation in Activities Due to Arthritis (Objective #2.2)Adults with Chronic Joint Symptoms, Ages > 18 years
54% N/A 41% 21%
Pap Smear, Ever Had (Objective #3.11a)Women, Ages > 18 years
94% 96% 97% 97%
Pap Smear, Within Past Three Years (Objective #3.11b)Women, Ages > 18 years
88% 87% 88% 90%
Fecal Occult Blood Test (FOBT) Within Past Two Years (Objective #3.12a)Ages > 50 years
32% 30% N/A 50%
Sigmoidoscopy, Ever Had (Objective #3.12b)Ages > 50 years
49% N/A N/A 50%
Mammogram, Within Past Two Years (Objective #3.14)Women, Ages > 40 years
79% 76% 76% 70%
Diabetes, Diagnosed (Objective #5.3)Ages > 18 years
7% 7% 8% 2.5%
Cholesterol Screening, Within Past Five Years (Objective #12.15)Ages > 18 years
75% N/A 75% 80%
No Leisure Time Physical Activity (Objective # 22.1)Ages > 18 years
27% 26% 25% 20%
Regular, Vigorous Physical Activity, 3 or more Days/Week for 20 or more Minutes (Objective #22.3)Ages > 18 years
23% N/A 25% 30%

28
Percentage of Population with Diagnosed Diabetes 2002 Ages 45-64
Less than 7.0 %
7.0 to 8.9 %
9.0 to 11.0 %
More than 11%

29
Total Number of Adults with Diagnosed Diabetes, 2002
Less than 70,000
70,000 to 189,999
190,000 to 330,000
More than 330,000

30
Georgia- Number of Diagnosed Diabetes by Year (1000’s)
18-44 45-64 Total <65 65-74 75+ Total Pop
2002 69,000 215,000 284,000 111,000 34,000 432,000
2001 67,000 205,000 272,000 108,000 38,000 420,000
2000 61,000 182,000 243,000 94,000 40,000 379,000
1999 57,000 164,000 221,000 81,000 44,000 348,000
1998 42,000 135,000 177,000 71,000 41,000 291,000
1994 34,000 89,000 123,000 60,000 20,000 202,000
CDC 2002


