17
Consumer Conditions Survey: Consumers at home in the single market – 2021 edition Key highlights
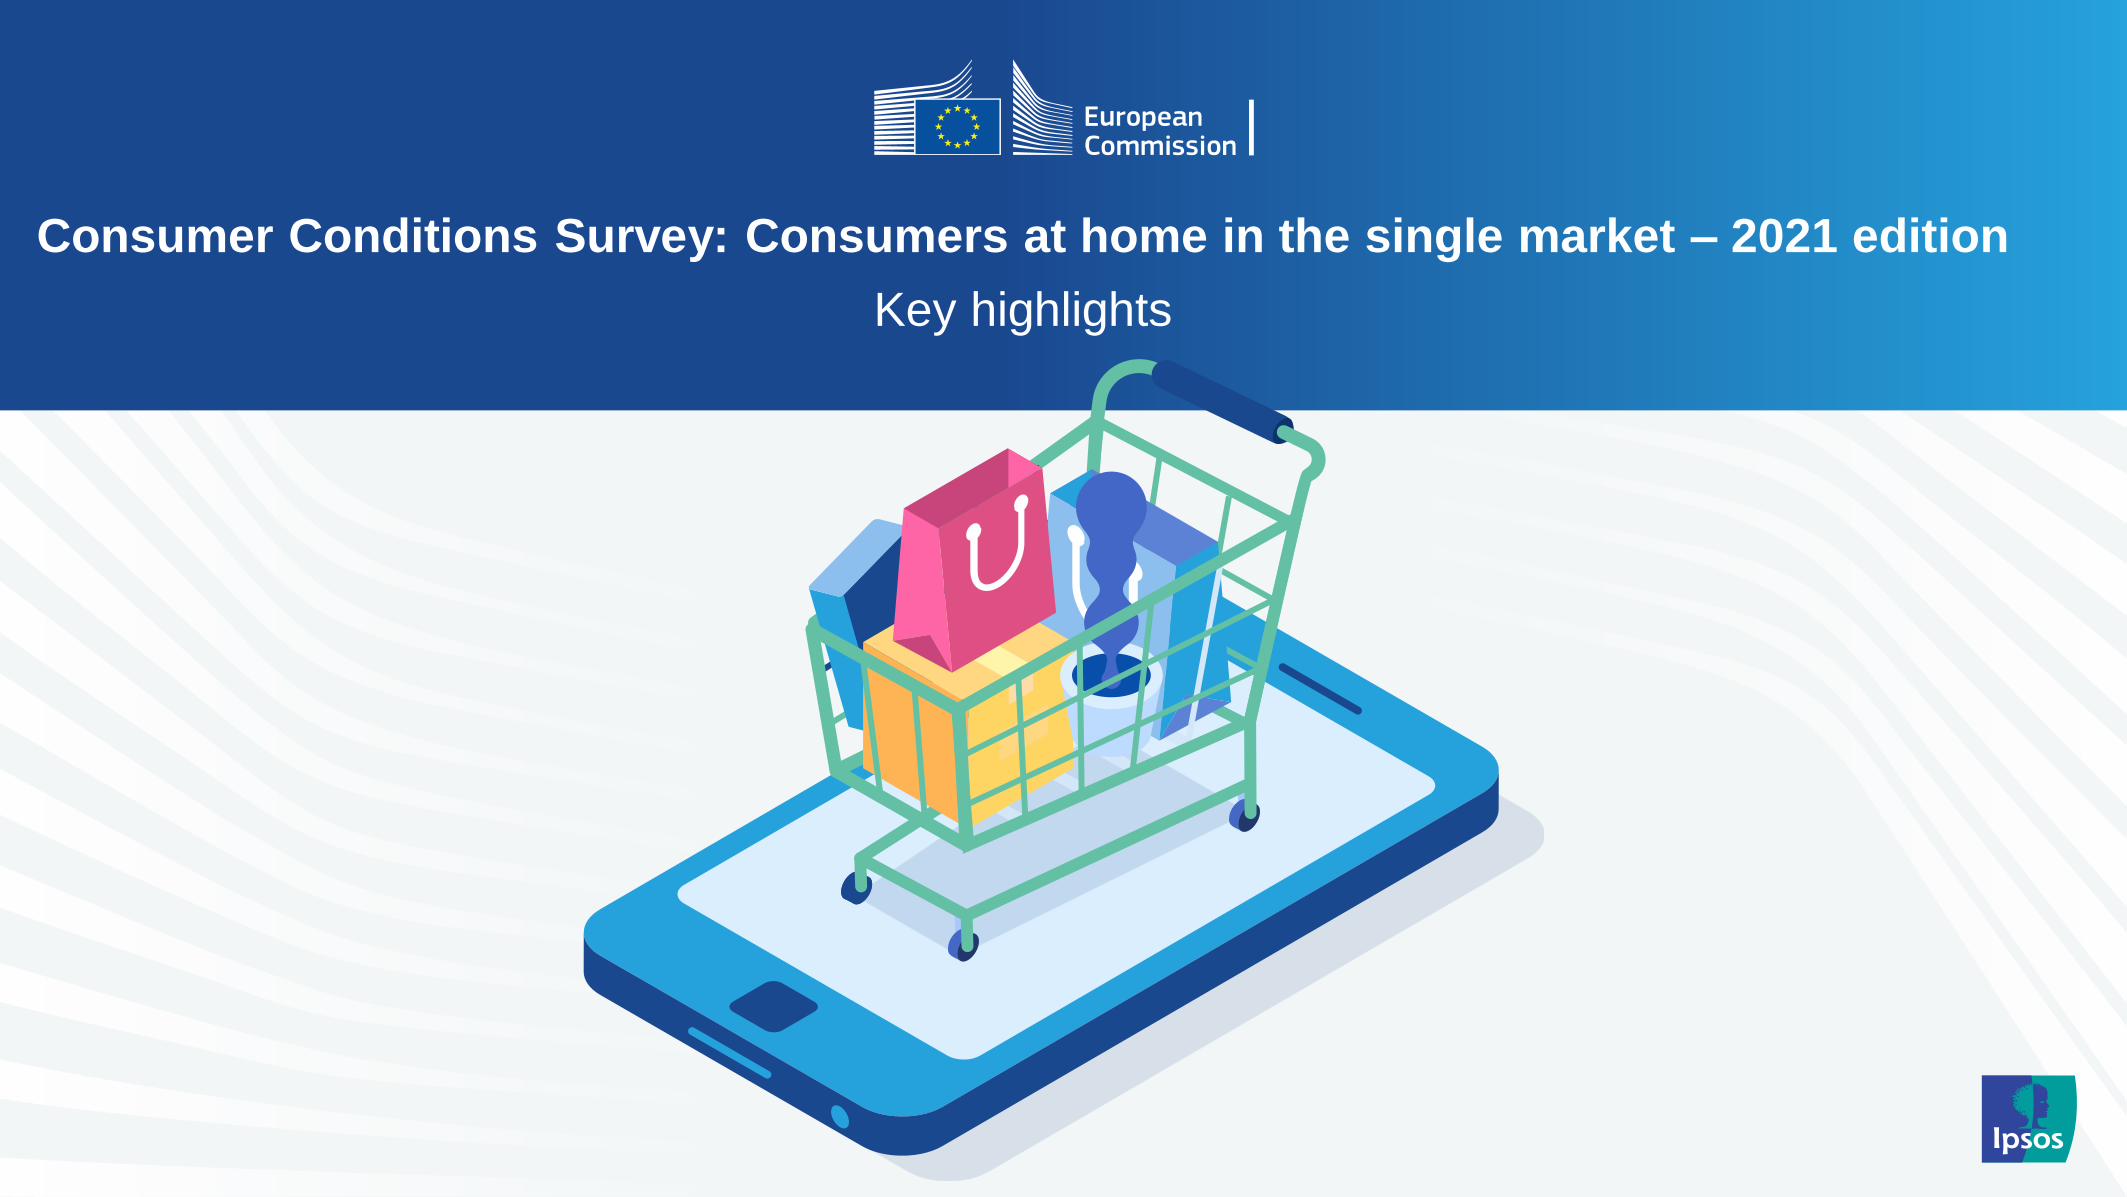
Consumer Conditions Survey: Consumers at home in the single market – 2021 edition
Key highlights

How to interpret the key highlights
EU27 The percentage represents the EU27 average
Trend
The percentage has significantly increased between the survey years
The percentage has significantly decreased between the survey years
The percentage has not significantly changed between the survey years
Difference between lowest and
highest scoring countries
<23 percentage points (pp) difference
23-47 percentage points (pp) difference
>47 percentage points (pp) difference
Satisfaction with problem handling
More than 65% of respondents were satisfied
Between 35% and 65% of respondents were satisfied
Less than 35% of respondents were satisfied
%
Percentages of 'don't know' responses are not shown. As a result, the figures generally do not add up to 100%.

Key highlights
% of consumers who… EU27 2020-
2018
2020-
2014Difference between lowest and highest scoring countries
…trust public authorities to protect consumer rights
Lowest
43%
44 ppHighest
87%
…agree that retailers and service providers generally
respect consumer rights
Lowest
59%
32 ppHighest
91%
…trust non-governmental consumer organisations
to protect consumer rights
Lowest
36%
44 ppHighest
80%
…feel confident purchasing goods or services via the
Internet from retailers or service providers in their country
Lowest
40%
47 ppHighest
88%
…feel confident purchasing goods or services via the
Internet from retailers or service providers in an/other
EU country
Lowest
33%
39 ppHighest
72%
70%
80%
66%
63%
43%
Consumer Conditions Survey: Consumers at home in the single market – 2021 edition Consumer confidence and knowledge - High level indicators

% of consumers who… EU27 2020-
2018
2020-
2014Difference between lowest and highest scoring countries
…think most non-food products are safe
Lowest
57%
30 ppHighest
87%
…agree that most environmental claims about goods or
services are reliable
Lowest
40%
40 ppHighest
80%
…pay attention to the environmental impact of goods
and services
Lowest
34%
41 ppHighest
75%
…pay attention to the environmental impact of all or most
goods or services
Lowest
9%
19 ppHighest
28%
…buy products that are better for the environment even if
they cost more - -
Lowest
42%
42 ppHighest
83%
72%
61%
56%
23%
67%
Key highlights
Consumer Conditions Survey: Consumers at home in the single market – 2021 edition Consumer confidence and knowledge - High level indicators

% of consumers who… EU27 2020-
2018
2020-
2014Difference between lowest and highest scoring countries
…agree that it is easy to settle disputes with retailers
and service providers through an out-of-court body
Lowest
25%
39 pp Highest
64%
…agree that it is easy to settle disputes with retailers
and service providers through the courts
Lowest
18%
42 pp Highest
60%
…have a high level of knowledge of consumer rights- -
Lowest
13%
26 pp Highest
38%
47%
35%
27%
Key highlights
Consumer Conditions Survey: Consumers at home in the single market – 2021 edition Consumer confidence and knowledge - High level indicators
% of consumers who… EU27 2020-
2018
2020-
2014Difference between lowest and highest scoring countries
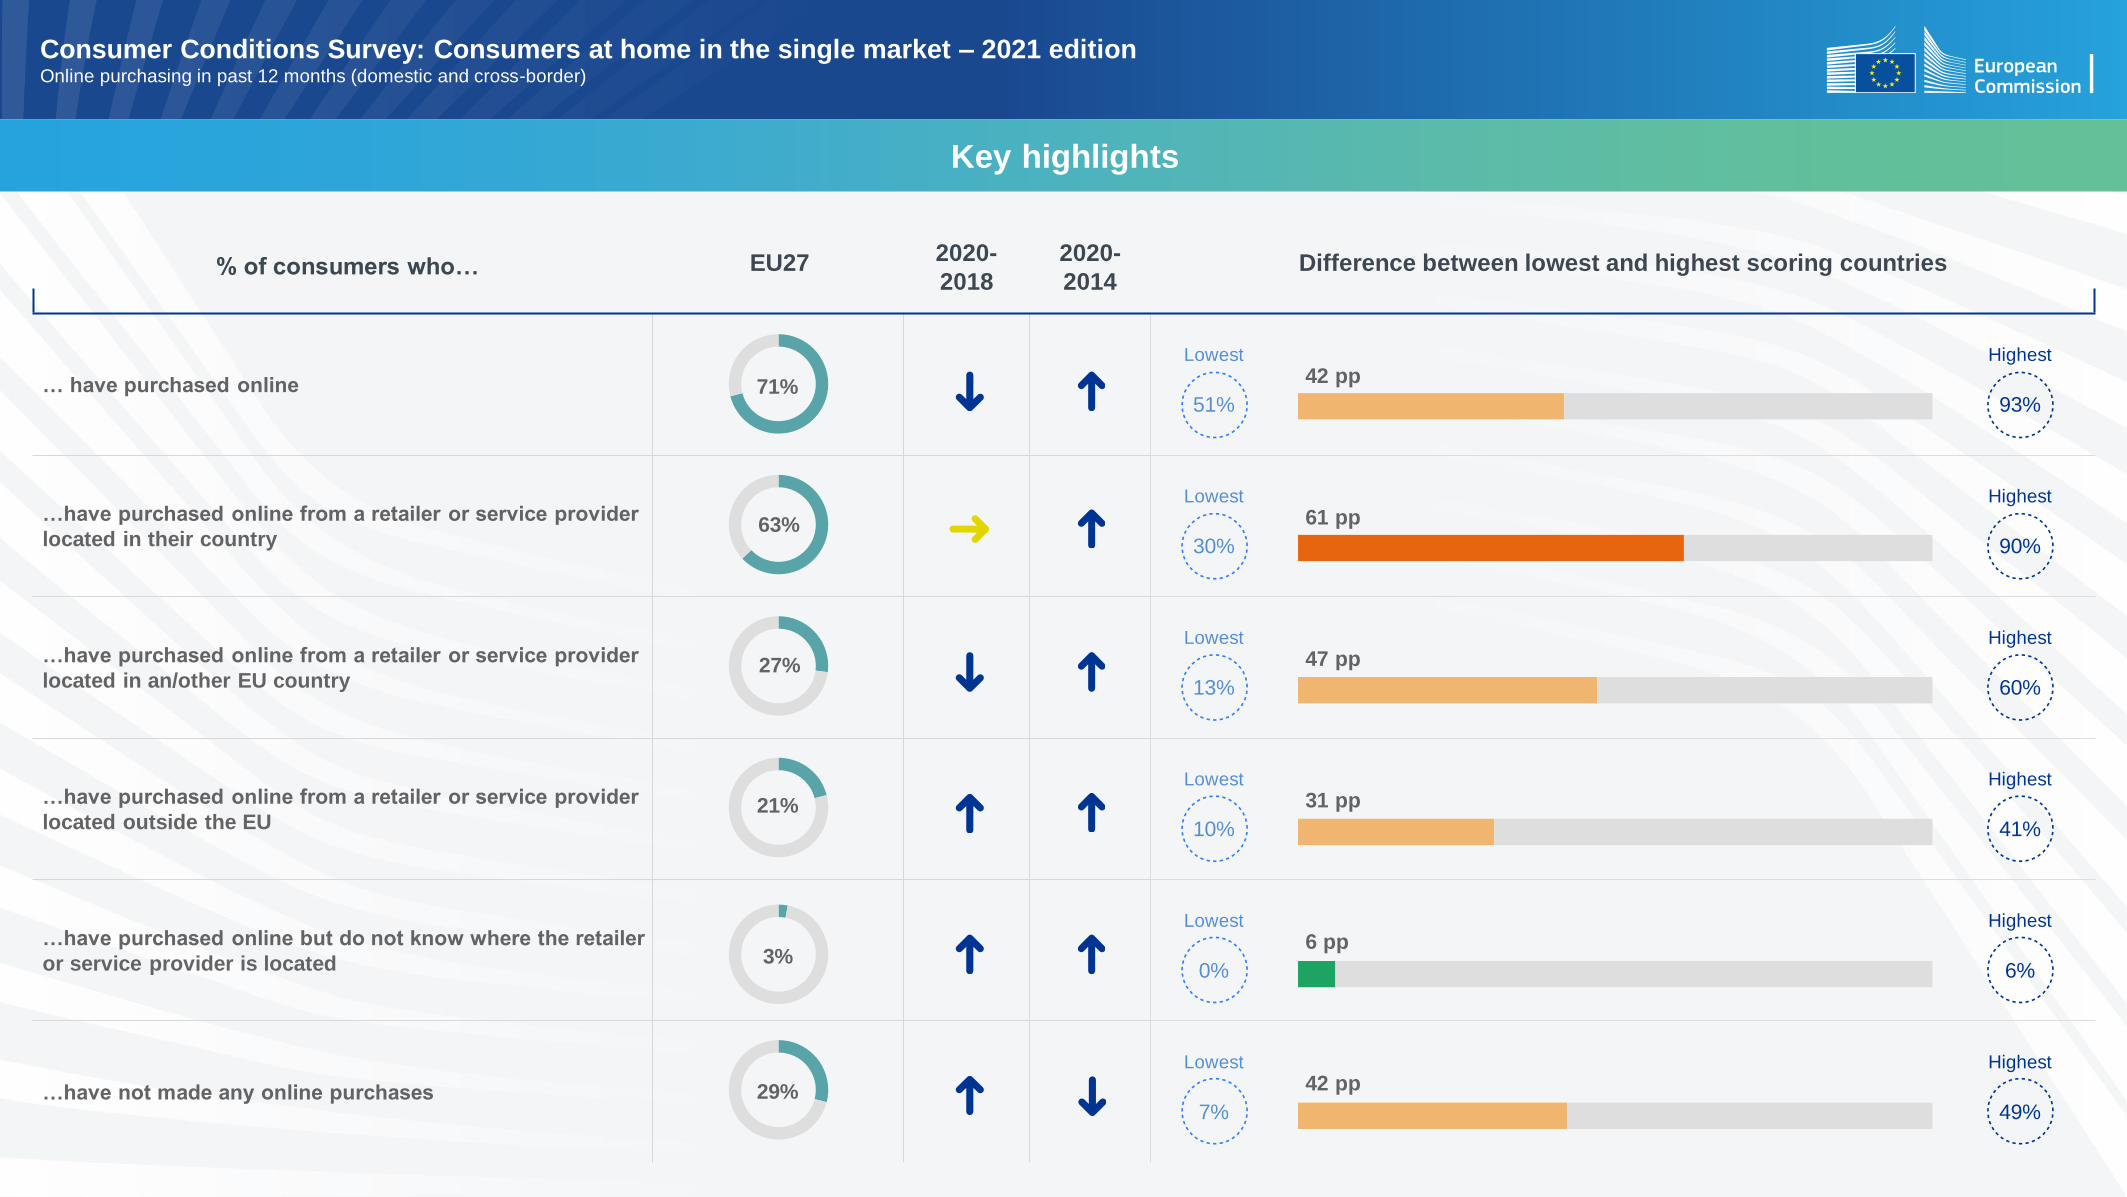
… have purchased online
Lowest
51%
42 ppHighest
93%
…have purchased online from a retailer or service provider
located in their country
Lowest
30%
61 ppHighest
90%
…have purchased online from a retailer or service provider
located in an/other EU country
Lowest
13%
47 ppHighest
60%
…have purchased online from a retailer or service provider
located outside the EU
Lowest
10%
31 ppHighest
41%
…have purchased online but do not know where the retailer
or service provider is located
Lowest
0%
6 ppHighest
6%
…have not made any online purchases
Lowest
7%
42 ppHighest
49%
63%
27%
21%
3%
29%
Key highlights
Consumer Conditions Survey: Consumers at home in the single market – 2021 edition Online purchasing in past 12 months (domestic and cross-border)
71%
% of consumers who… EU27 2020-
2018
2020-
2014Difference between lowest and highest scoring countries
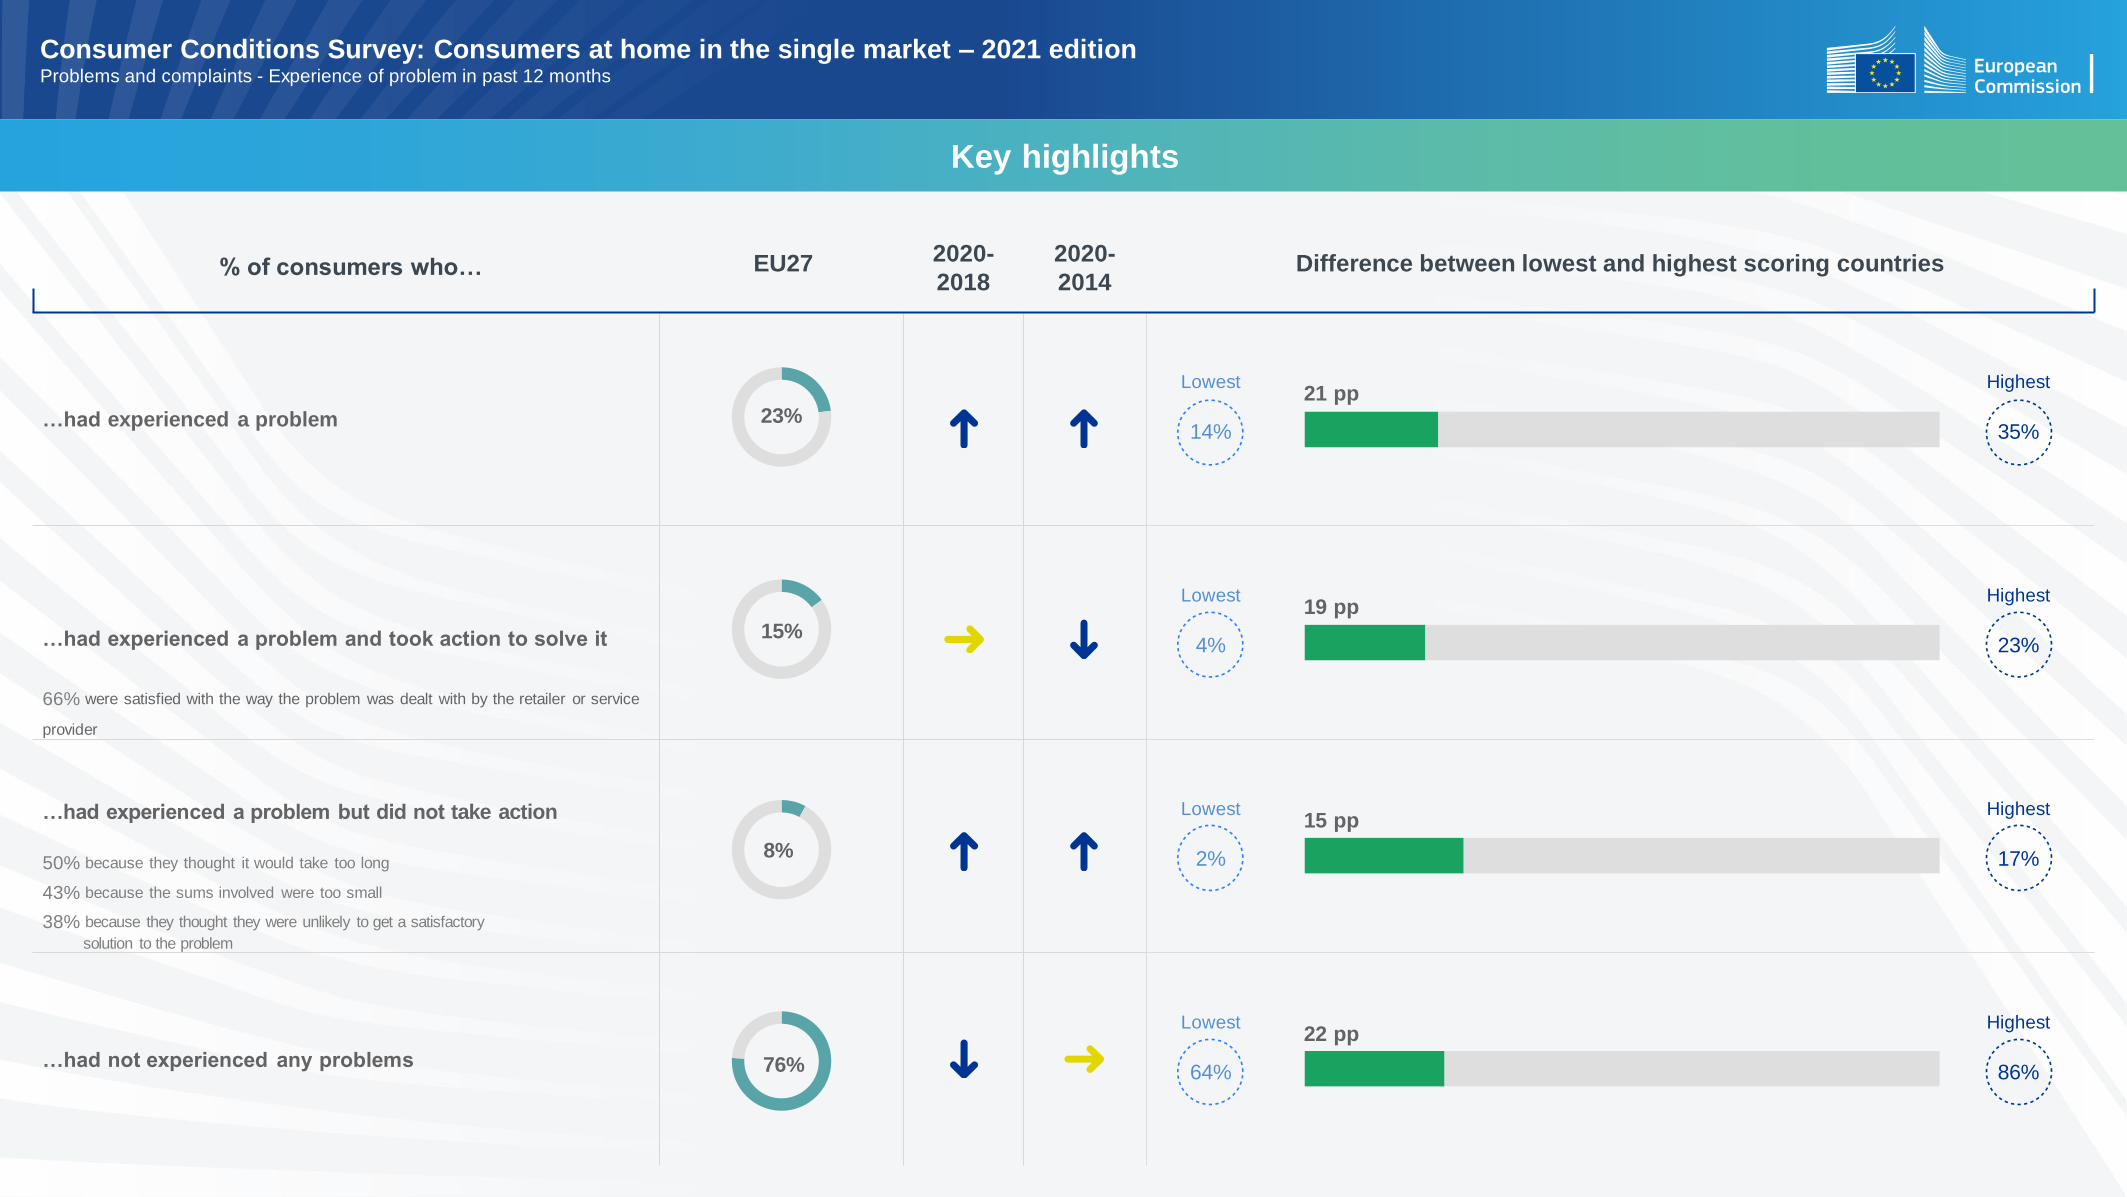
…had experienced a problem
Lowest
14%
21 ppHighest
35%
…had experienced a problem and took action to solve it
66% were satisfied with the way the problem was dealt with by the retailer or service
provider
Lowest
4%
19 ppHighest
23%
…had experienced a problem but did not take action
50% because they thought it would take too long
43% because the sums involved were too small
38% because they thought they were unlikely to get a satisfactory
solution to the problem
Lowest
2%
15 ppHighest
17%
…had not experienced any problems
Lowest
64%
22 ppHighest
86%
23%
8%
76%
Key highlights
Consumer Conditions Survey: Consumers at home in the single market – 2021 edition Problems and complaints - Experience of problem in past 12 months
15%
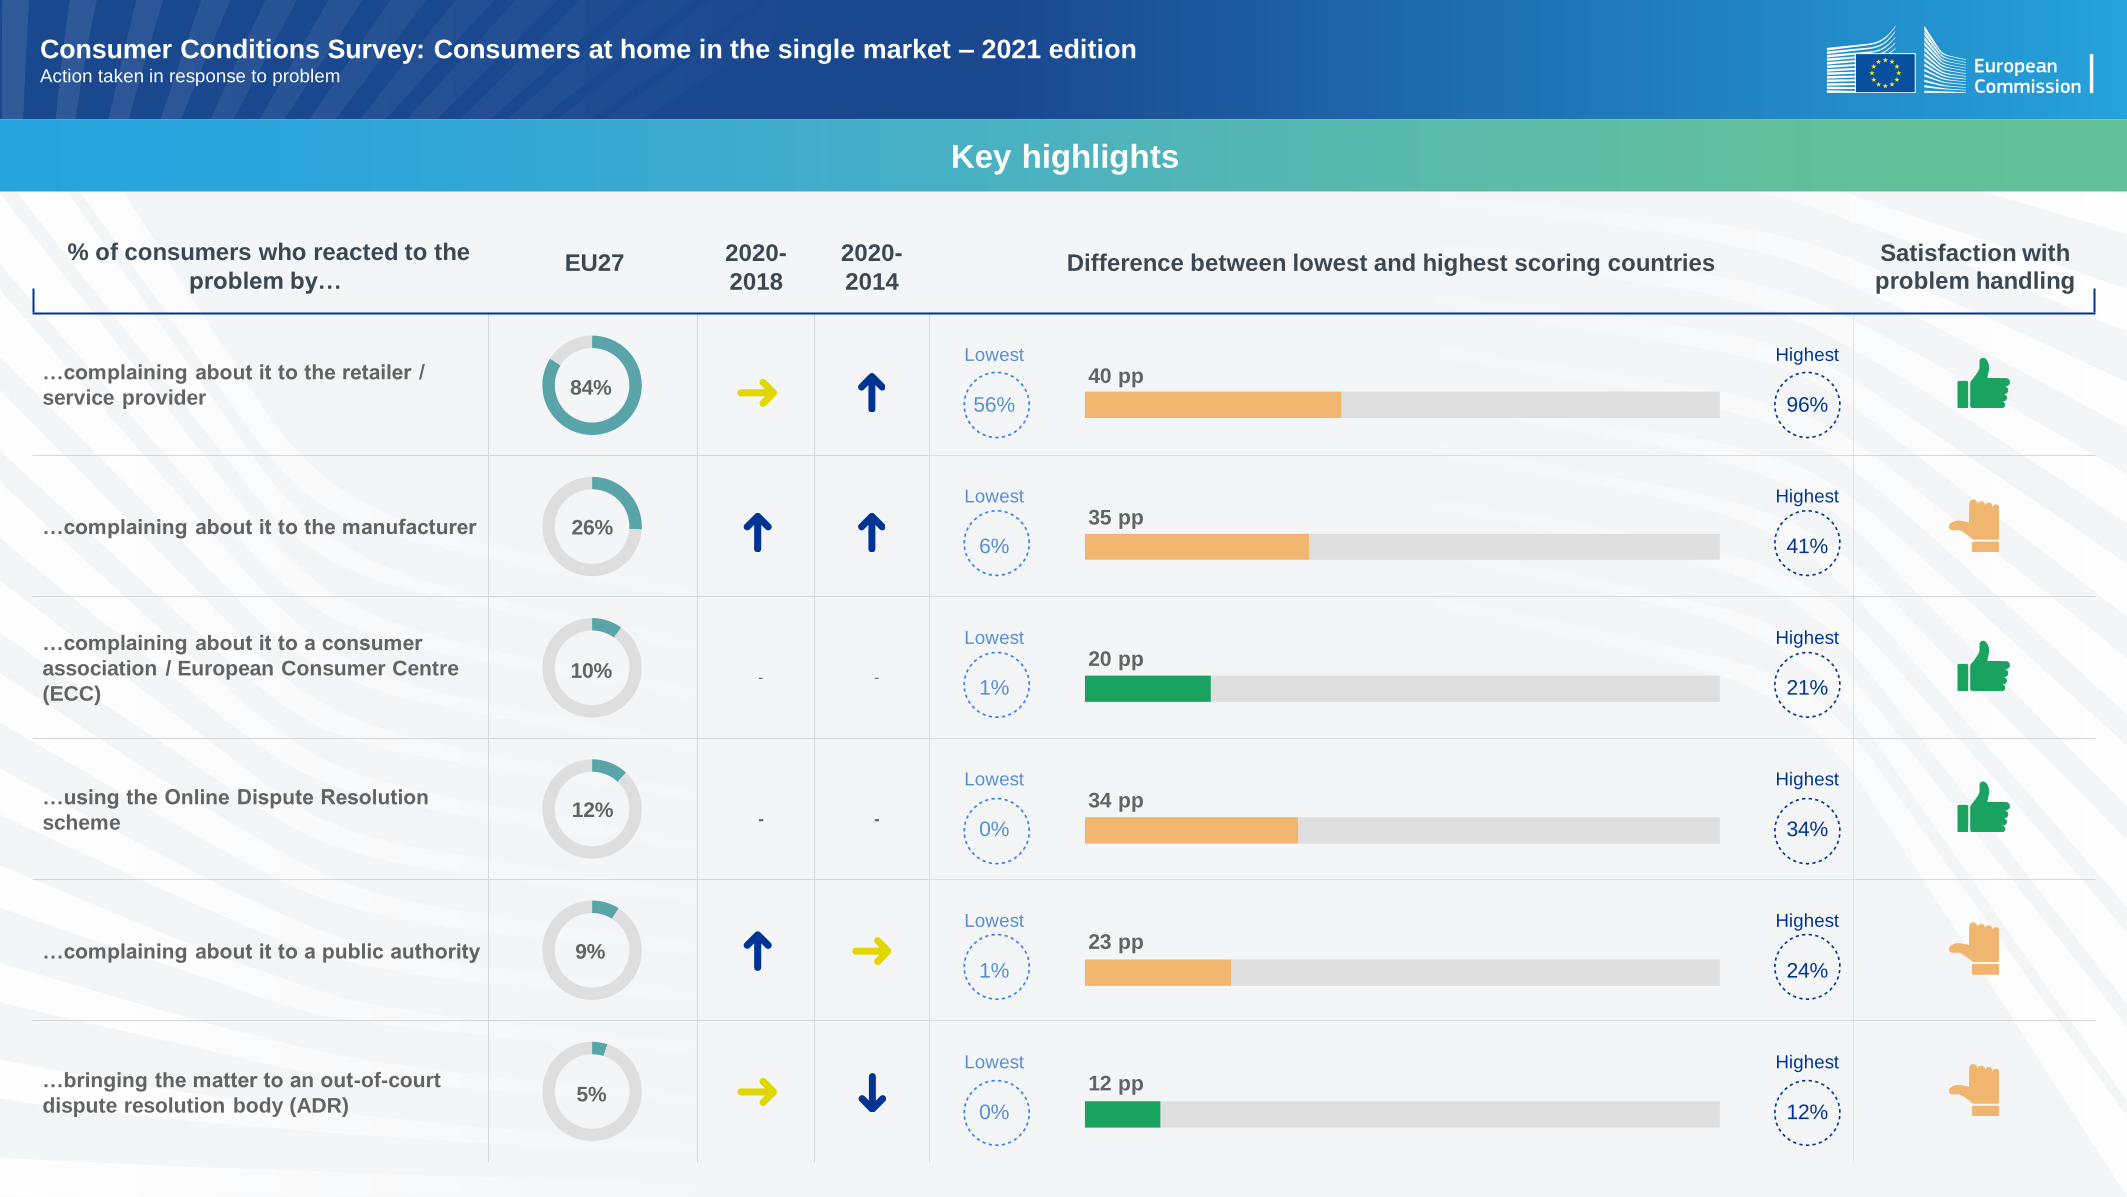
% of consumers who reacted to the
problem by…EU27 2020-
2018
2020-
2014Difference between lowest and highest scoring countries Satisfaction with
problem handling
…complaining about it to the retailer /
service provider
Lowest
56%
40 ppHighest
96%
…complaining about it to the manufacturer
Lowest
6%
35 ppHighest
41%
…complaining about it to a consumer
association / European Consumer Centre
(ECC)- -
Lowest
1%
20 ppHighest
21%
…using the Online Dispute Resolution
scheme - -
Lowest
0%
34 ppHighest
34%
…complaining about it to a public authority
Lowest
1%
23 ppHighest
24%
…bringing the matter to an out-of-court
dispute resolution body (ADR)
Lowest
0%
12 ppHighest
12%
84%
26%
10%
12%
5%
9%
Key highlights
Consumer Conditions Survey: Consumers at home in the single market – 2021 edition Action taken in response to problem
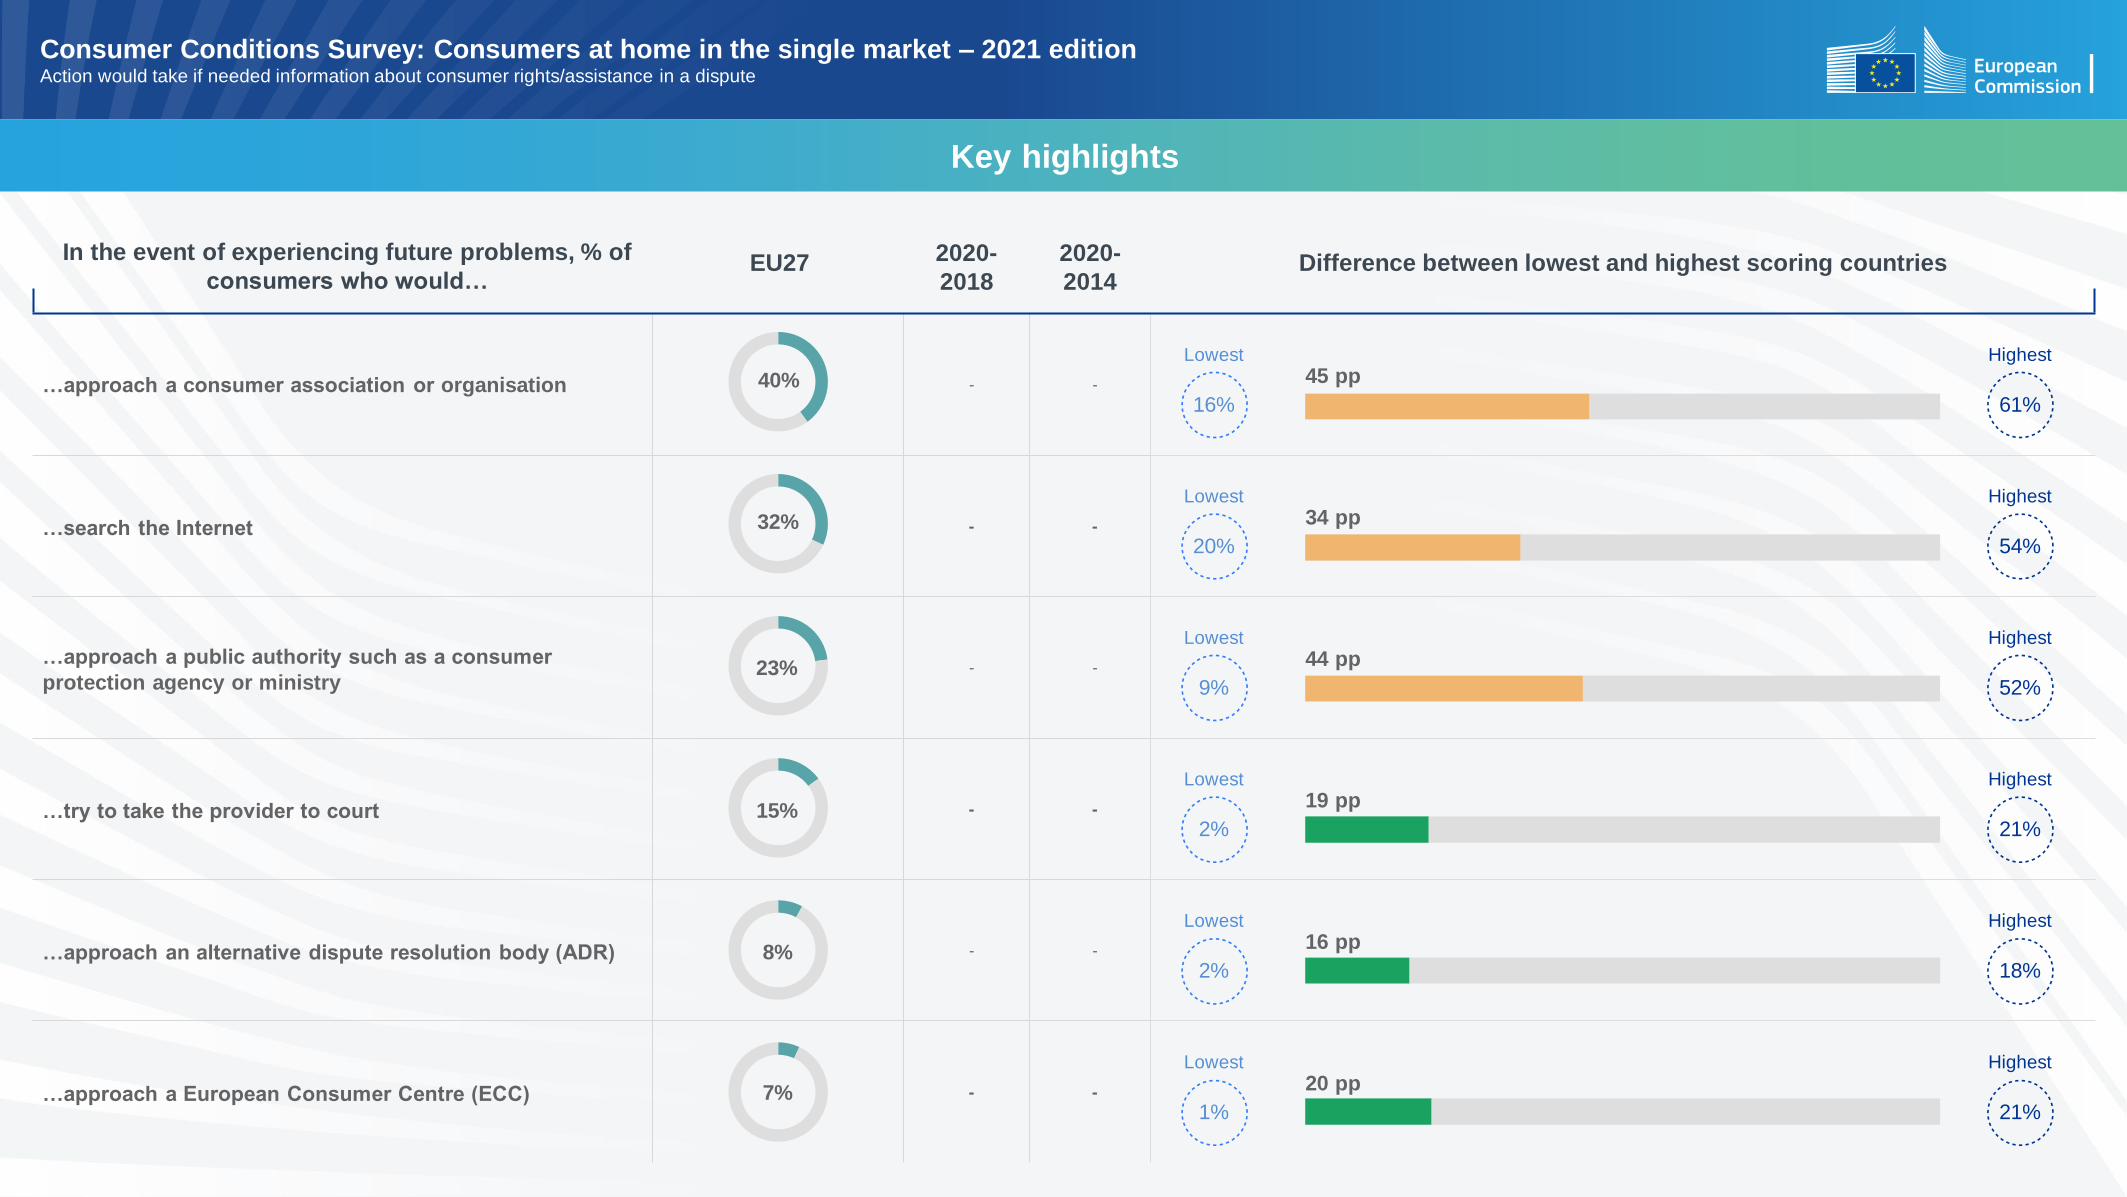
In the event of experiencing future problems, % of
consumers who would…EU27 2020-
2018
2020-
2014Difference between lowest and highest scoring countries
…approach a consumer association or organisation - -
Lowest
16%
45 ppHighest
61%
…search the Internet - -
Lowest
20%
34 ppHighest
54%
…approach a public authority such as a consumer
protection agency or ministry- -
Lowest
9%
44 ppHighest
52%
…try to take the provider to court - -
Lowest
2%
19 ppHighest
21%
…approach an alternative dispute resolution body (ADR) - -
Lowest
2%
16 ppHighest
18%
…approach a European Consumer Centre (ECC) - -
Lowest
1%
20 ppHighest
21%
40%
32%
23%
15%
8%
7%
Key highlights
Consumer Conditions Survey: Consumers at home in the single market – 2021 edition Action would take if needed information about consumer rights/assistance in a dispute

EU272020-
2018
2020-2014
Difference between lowest and highest scoring countries
Reasons for membership of consumer organisation
To stay informed about consumer rights* - -
To have a source of support in the event of experiencing
problems* - -
To stay informed about day-to-day consumer issues,
such as product recalls* - -
Factors that would encourage membership of consumer organisation
Nothing - -
Lowest
8%
60 ppHighest
68%
To stay informed about consumer rights* - -
Lowest
4%
25 ppHighest
29%
For help with resolving an existing problem - -
Lowest
5%
32 ppHighest
37%
31%
17%
21%
44%
39%
26%
Key highlights
Consumer Conditions Survey: Consumers at home in the single market – 2021 edition Membership of consumer organisation
*The difference between the lowest and highest scoring countries is only shown if the majority of countries had a base size above 49.

% of consumers who… EU27 2020-
2018
2020-
2014Difference between lowest and highest scoring countries
…have experienced a product recall - -
Lowest
20%
58 pp Highest
78%
…have experienced a recall that concerned a product they
owned
61% contacted the recalling company to have the product
repaired, replaced or refunded
16% disposed of the product
13% took no action
8% continued using the product with extra caution
- -
Lowest
3%
14 pp Highest
17%
…have experienced a recall that did not concern a product
they owned - -
Lowest
15%
55 pp Highest
70%
…have experienced product-related accidents, injuries or
health problems - -
Lowest
1%
9 pp Highest
10%
47%
8%
39%
4%
Key highlights
Consumer Conditions Survey: Consumers at home in the single market – 2021 edition Product safety
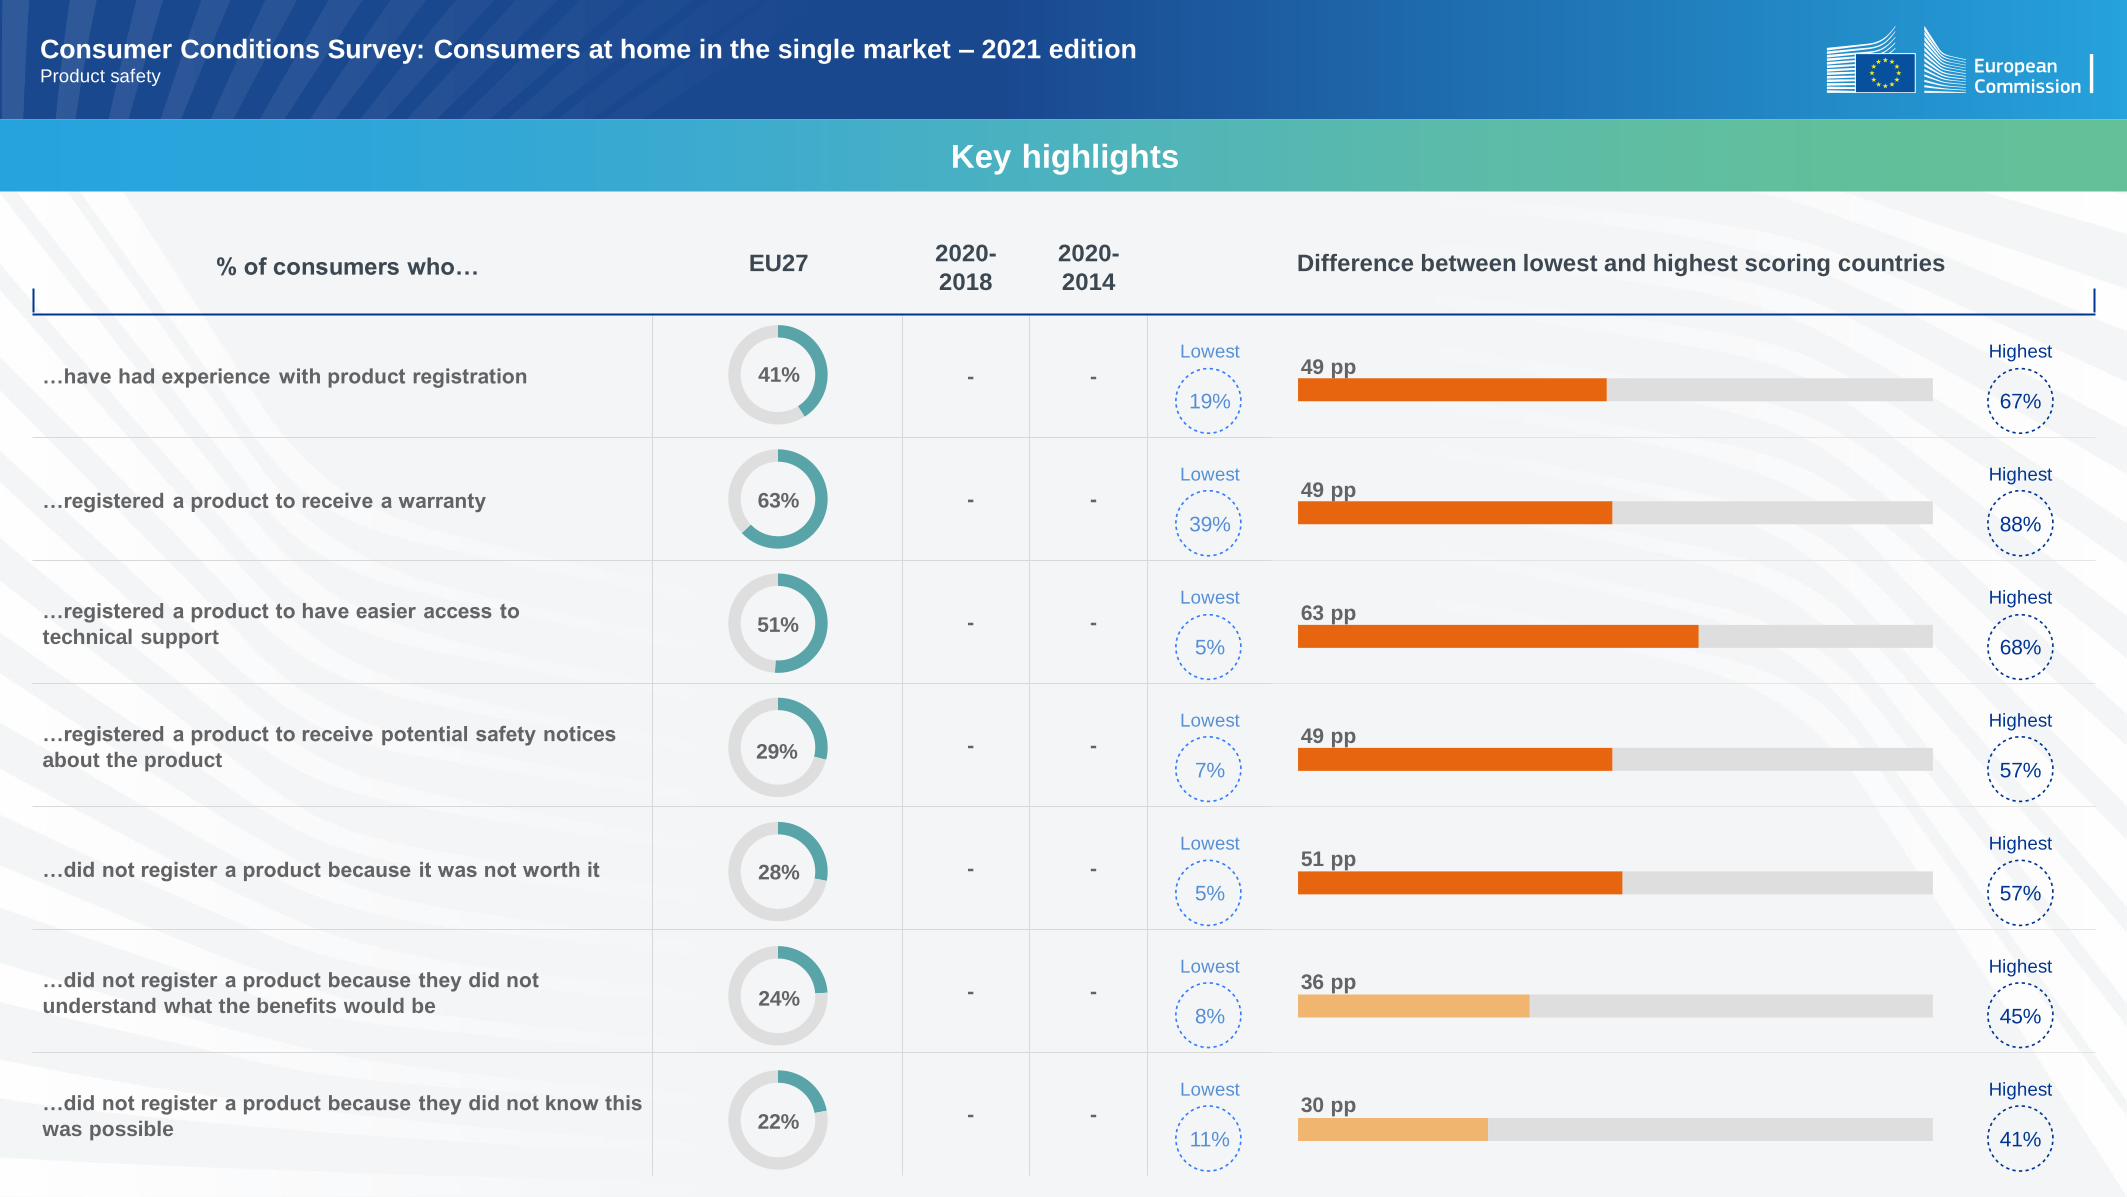
% of consumers who… EU27 2020-
2018
2020-
2014Difference between lowest and highest scoring countries
…have had experience with product registration - -
Lowest
19%
49 ppHighest
67%
…registered a product to receive a warranty - -
Lowest
39%
49 ppHighest
88%
…registered a product to have easier access to
technical support- -
Lowest
5%
63 ppHighest
68%
…registered a product to receive potential safety notices
about the product- -
Lowest
7%
49 ppHighest
57%
…did not register a product because it was not worth it - -
Lowest
5%
51 ppHighest
57%
…did not register a product because they did not
understand what the benefits would be - -
Lowest
8%
36 ppHighest
45%
…did not register a product because they did not know this
was possible- -
Lowest
11%
30 ppHighest
41%
41%
63%
51%
29%
28%
24%
22%
Key highlights
Consumer Conditions Survey: Consumers at home in the single market – 2021 edition Product safety

% of consumers who… EU27 2020-
2018
2020-
2014Difference between lowest and highest scoring countries
…have felt pressured by persistent sales calls / messages
urging them to buy something or sign a contract
Lowest
8%
59 ppHighest
67%
…have come across advertisements stating a product was
only available for a very limited period of time but later
realised this was not the case
Lowest
18%
33 ppHighest
52%
…have been offered a product advertised as
free of charge which actually entailed charges
Lowest
10%
32 ppHighest
41%
…have been informed they won a lottery they did not know
about, but were asked to pay some money in order to
collect the prize
Lowest
10%
40 ppHighest
50%
…have felt pressured to buy something they did not want
during an unexpected visit of a seller to their home - -
Lowest
3%
16 ppHighest
19%
…have felt pressured to buy something they did not want
during a product demonstration at a private home, hotel
or restaurant- -
Lowest
2%
17 ppHighest
19%
41%
32%
26%
26%
9%
8%
Key highlights
Consumer Conditions Survey: Consumers at home in the single market – 2021 edition Unfair commercial practices
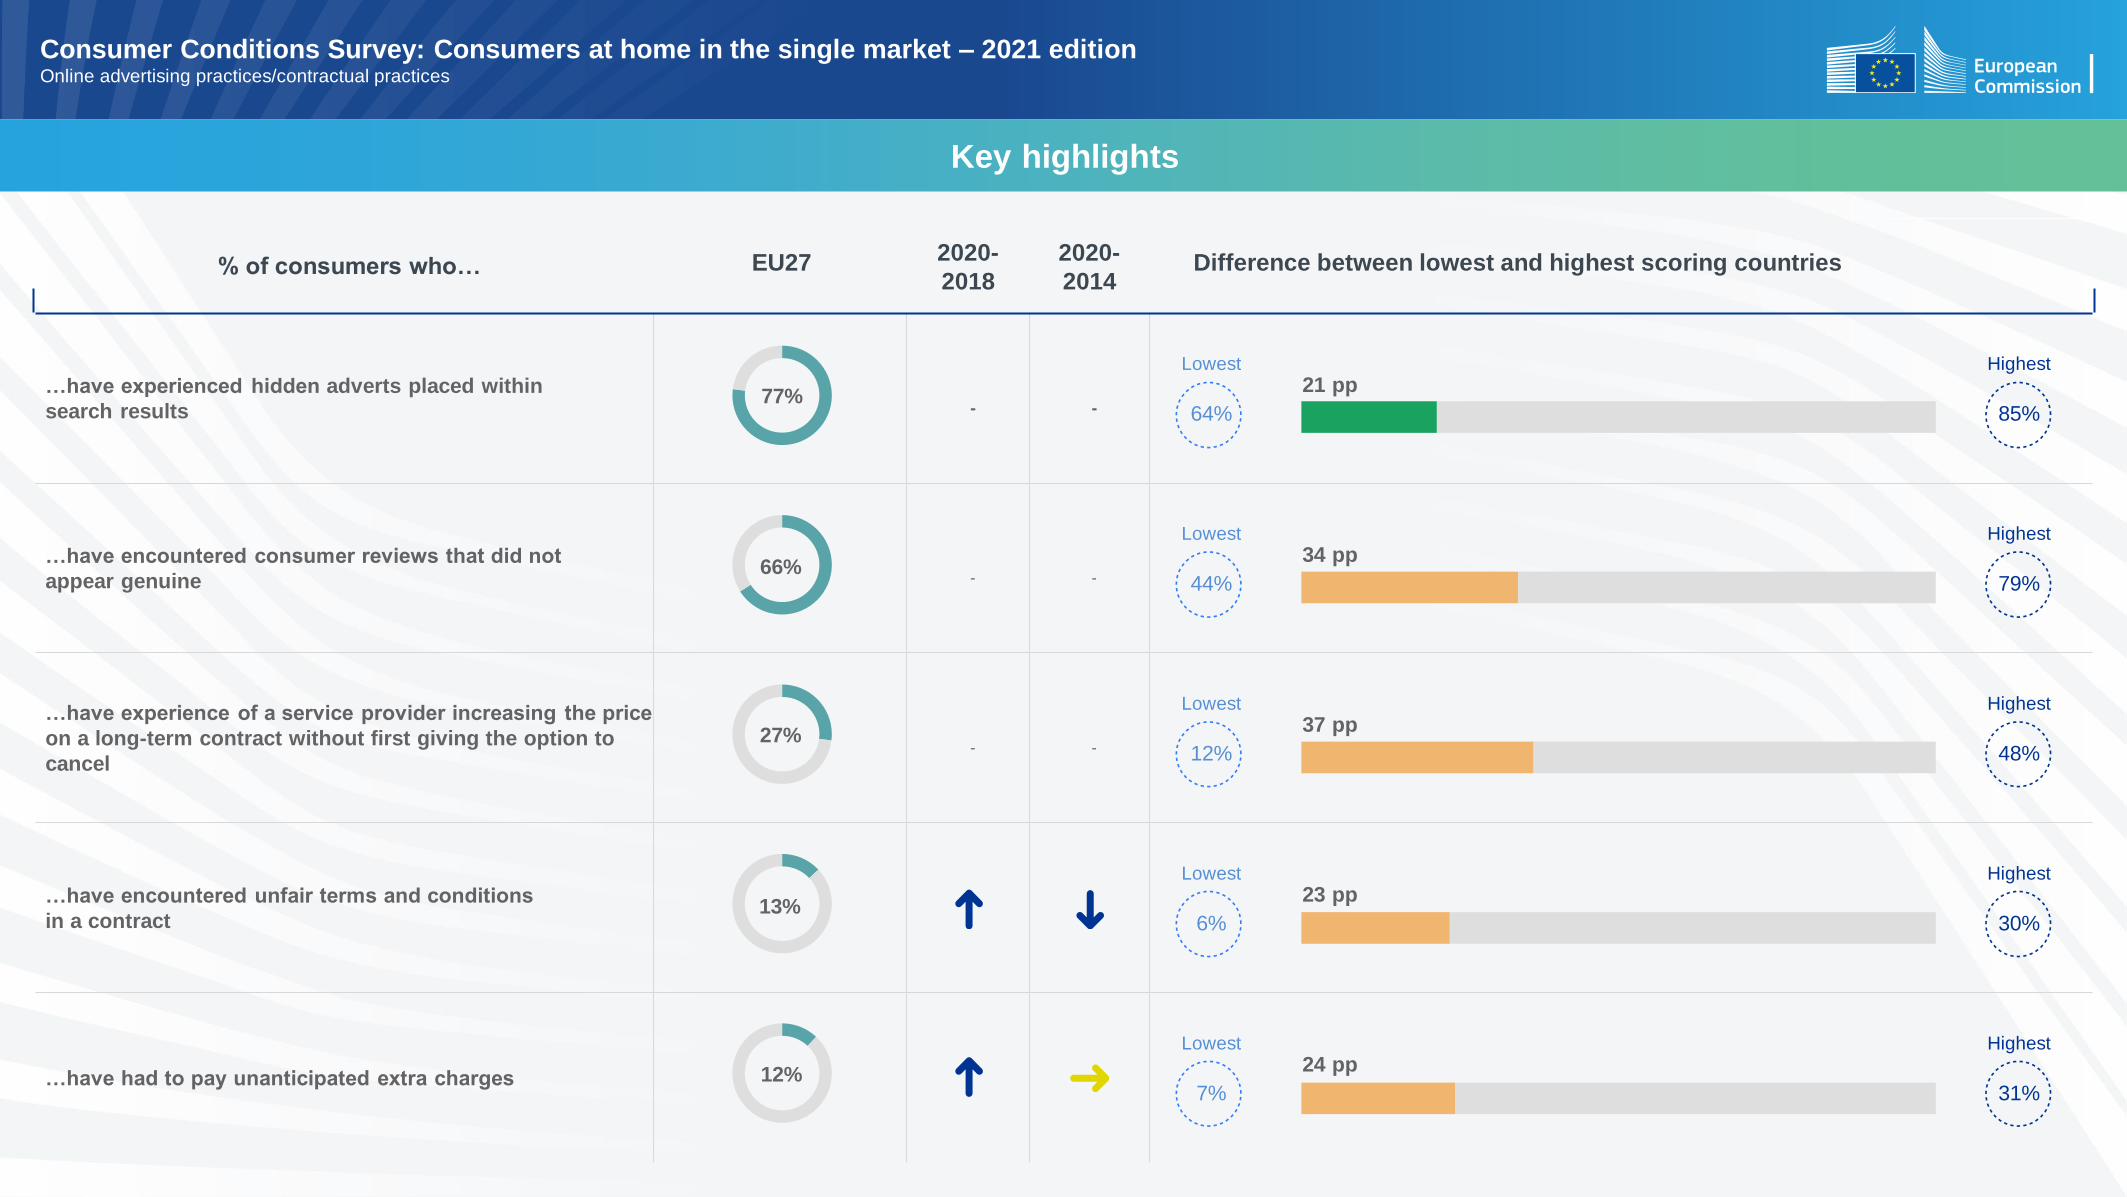
% of consumers who… EU27 2020-
2018
2020-
2014Difference between lowest and highest scoring countries
…have experienced hidden adverts placed within
search results - -
Lowest
64%
21 ppHighest
85%
…have encountered consumer reviews that did not
appear genuine - -
Lowest
44%
34 ppHighest
79%
…have experience of a service provider increasing the price
on a long-term contract without first giving the option to
cancel- -
Lowest
12%
37 ppHighest
48%
…have encountered unfair terms and conditions
in a contract
Lowest
6%
23 ppHighest
30%
…have had to pay unanticipated extra charges
Lowest
7%
24 ppHighest
31%
77%
66%
27%
13%
12%
Key highlights
Consumer Conditions Survey: Consumers at home in the single market – 2021 edition Online advertising practices/contractual practices

Regarding online targeted advertising, % of
consumers who are concerned…EU27 2020-
2018
2020-
2014Difference between lowest and highest scoring countries
…their personal data could be used for other purposes
and/or they don’t know with whom it might be shared - -
Lowest
20%
70 ppHighest
90%
…their online data is collected / a profile is made about
them - -
Lowest
32%
51 ppHighest
83%
…cookies are installed on their computer - -
Lowest
23%
63 ppHighest
86%
…it could cause exposure to inappropriate advertising - -
Lowest
13%
49 ppHighest
63%
…it negatively affects their trust in e-commerce - -
Lowest
11%
41 ppHighest
52%
…they may end up paying more for products - -
Lowest
9%
42 ppHighest
51%
75%
68%
60%
46%
34%
32%
Key highlights
Consumer Conditions Survey: Consumers at home in the single market – 2021 edition Main concerns about online targeted advertising

Since the COVID-19 pandemic, % of consumers
who…EU27 2020-
2018
2020-
2014Difference between lowest and highest scoring countries
…do all the things they did before, including vacations
and travel - -
Lowest
10%
36 ppHighest
46%
…won’t make travel plans until the situation is back to
normal in their country - -
Lowest
73%
16 ppHighest
89%
…shopped closer to home and supported local businesses - -
Lowest
60%
35 ppHighest
95%
…used grocery delivery services - -
Lowest
4%
26 ppHighest
31%
…used grocery pick-up services - -
Lowest
5%
21 ppHighest
26%
27%
79%
81%
16%
13%
Key highlights
Consumer Conditions Survey: Consumers at home in the single market – 2021 edition Impact of COVID-19 on consumers
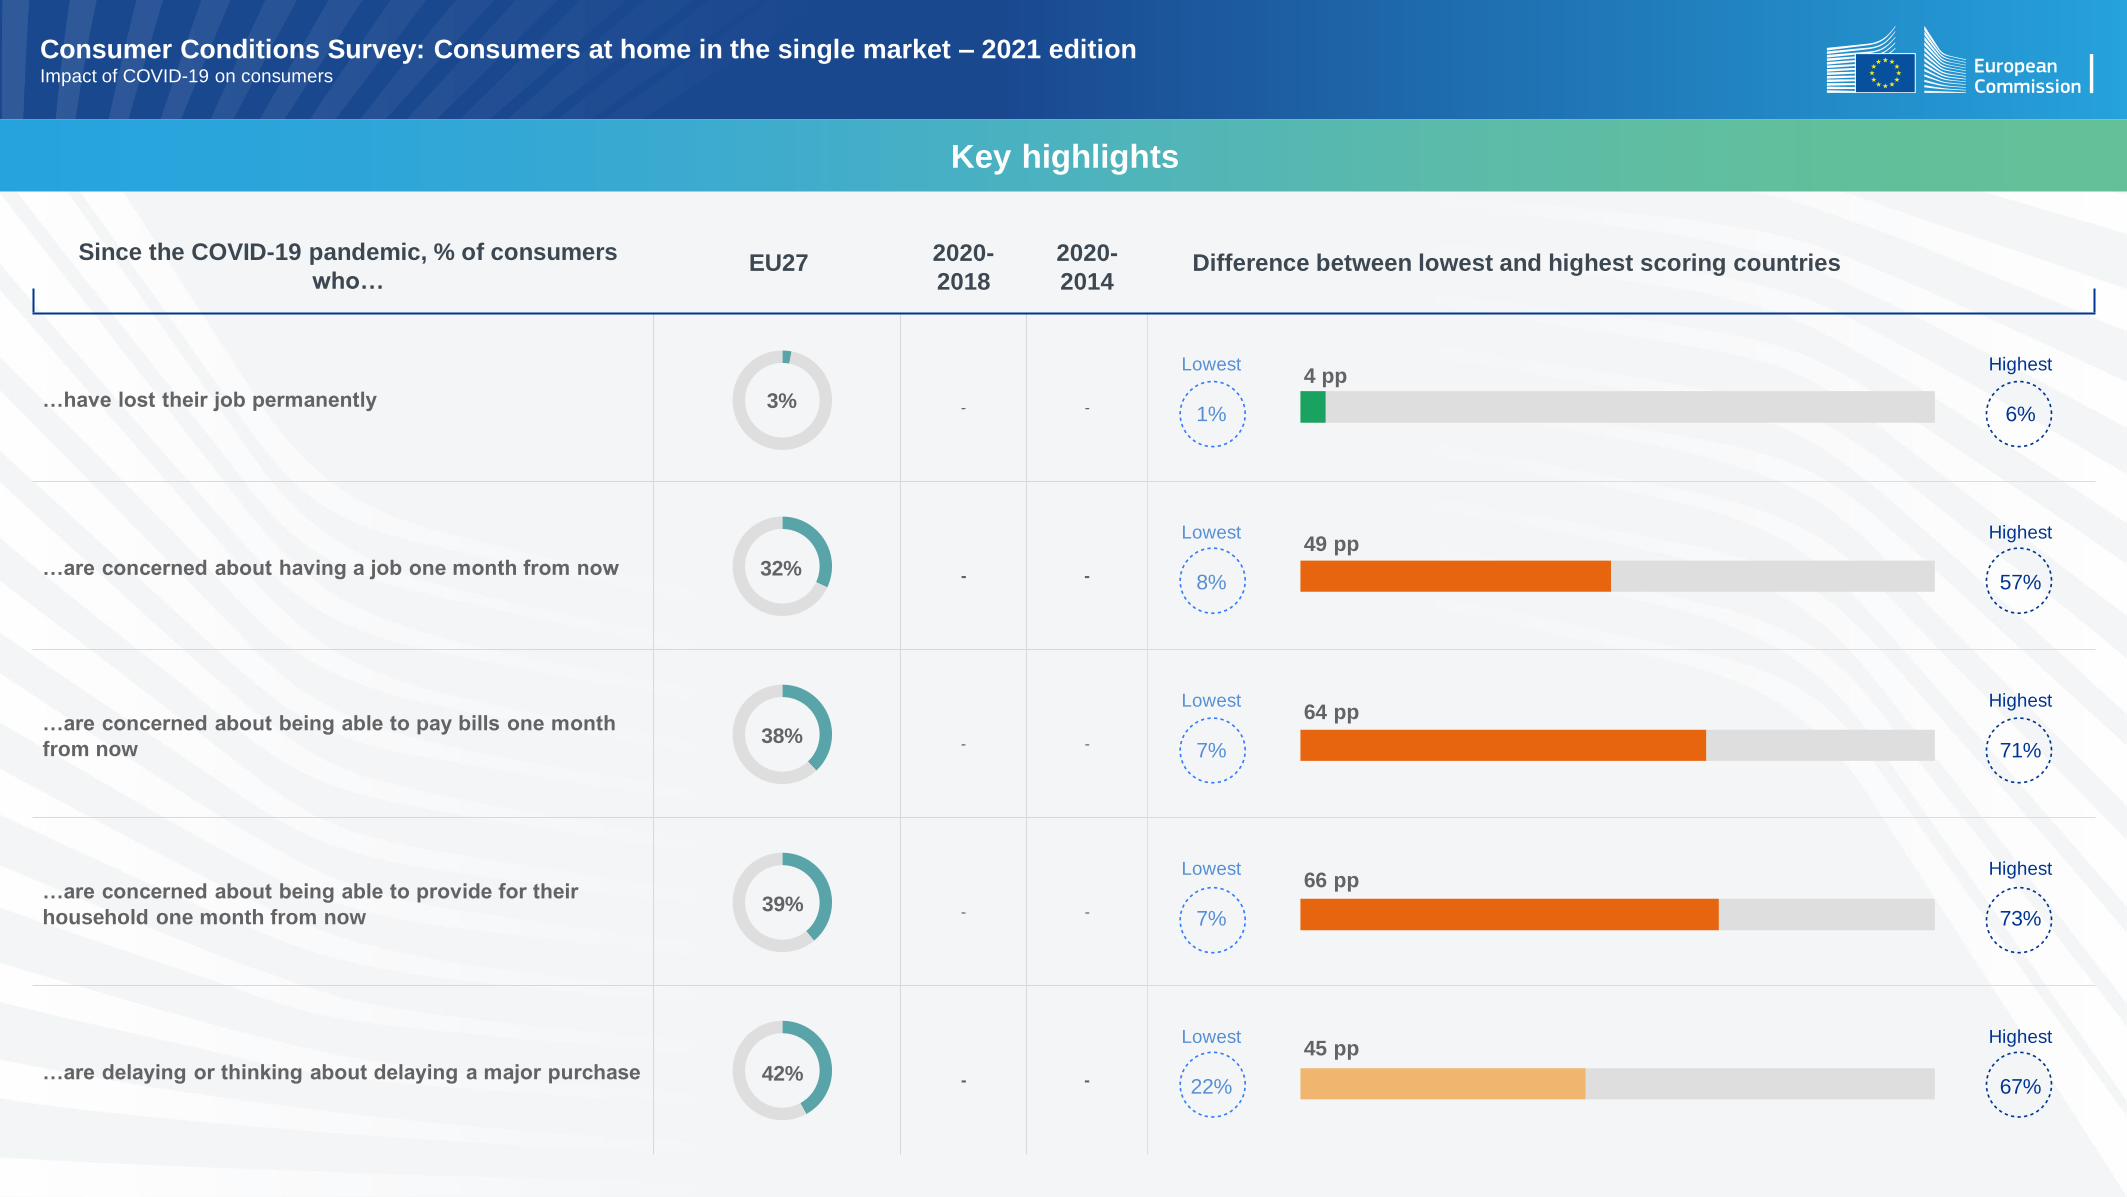
Since the COVID-19 pandemic, % of consumers
who…EU27 2020-
2018
2020-
2014Difference between lowest and highest scoring countries
…have lost their job permanently - -
Lowest
1%
4 ppHighest
6%
…are concerned about having a job one month from now - -
Lowest
8%
49 ppHighest
57%
…are concerned about being able to pay bills one month
from now - -
Lowest
7%
64 ppHighest
71%
…are concerned about being able to provide for their
household one month from now - -
Lowest
7%
66 ppHighest
73%
…are delaying or thinking about delaying a major purchase - -
Lowest
22%
45 ppHighest
67%
3%
32%
38%
39%
42%
Key highlights
Consumer Conditions Survey: Consumers at home in the single market – 2021 edition Impact of COVID-19 on consumers


![Consumer Assistance Cell for Electricity Consumers at ... · Consumer Assistance Cell for Electricity Consumers at Grassroots [CONASC] ... CUTS Calcutta Resource Centre 3 Suren Tagore](https://static.documents.pub/doc/80x56/600a5634cf3ea77fb4416140/consumer-assistance-cell-for-electricity-consumers-at-consumer-assistance-cell.jpg)


