24
Consumer Confidence Survey GB Q4, 2010 Survey field dates 10 th November to 1 st December 2010

Consumer Confidence Survey GB Q4, 2010
Survey field dates 10th November to 1st December 2010

2
Copyright © 2011 The Nielsen Company. Confidential and proprietary.
Topline Summary Nielsen/BRC Consumer Confidence Survey December 2010
• Consumer Confidence ended 2010 lower than at the start, Q4 did however see a marginal improvement on Q3.
• Latest quarters, Consumer Confidence saw a slight improvement as consumers felt slightly more positive about their job prospects and their personal finances. Les negativity around willingness to spend likely to be a seasonal fluctuation.
• Top 6 GB concerns all impact household income.
• The proportion of consumers who have ‘no spare cash’ has increased from 26% in Q3 to 27% in Q4. This is at an all time high.
• Putting spare cash into savings or paying off debts is higher up shoppers agendas than spending on discretionary items.
• With rising food costs and falling disposable incomes, switching to cheaper grocery brands is an established strategy for staying within budget.
3
Copyright © 2011 The Nielsen Company. Confidential and proprietary.
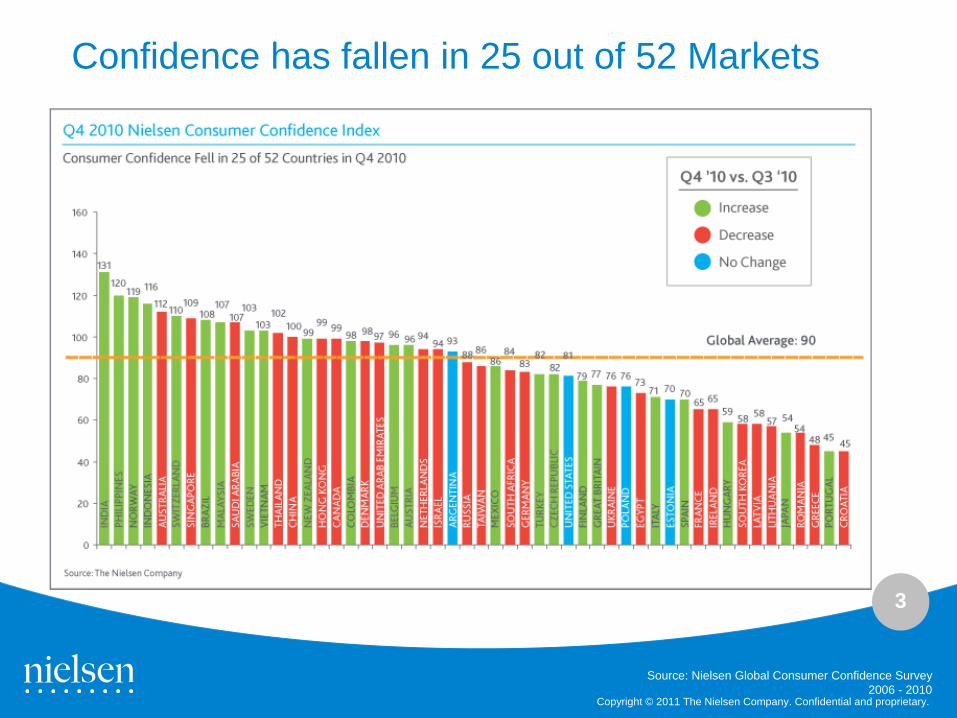
Confidence has fallen in 25 out of 52 Markets
Source: Nielsen Global Consumer Confidence Survey 2006 - 2010

4
Copyright © 2011 The Nielsen Company. Confidential and proprietary.
Global Consumer Confidence remained unchanged from Q3 at 90, but finished the year 2 index points lower than the start. GB Consumer Confidence improved on
Q3 but also ended the year lower than the start.
94
8491 94
7974
6572 75 77
80 7875 77
8479 80
70
61 60 6067 67 68
6367 65
106100
83 82 80 8084 85
81
9090
77
8286 87
92 9399
889797
8182
108
87
40
60
80
100
120
Q3, 06 Q1, 07 Q3, 07 Q1, 08 Q3, 08 Q1, 09 Q2, 09 Q3, 09 Q4, 09 Q1, 10 Q2, 10 Q3, 10 Q4, 10
Global* Average GB France USA
GB Consumer Confidence Index versus Global Average, Neighbouring Countries & USA
Source: Nielsen Global Consumer Confidence Survey 2006 - 2010
*June/December global index based on sub-set of 28/9 countries

5
Copyright © 2011 The Nielsen Company. Confidential and proprietary.
58
84 8589
58
8286 87
56
8479
88
57
82 84 86
Global Average GB France USA
Q1, 2010 Q2, 2010 Q3, 2010 Q4, 2010
“Do you think your country is in an economic recession at the moment?”
% answered “yes”
The proportion of global population believing we are in recession remains polarised, as the Asia Pacific economies are booming and Europe continues to be
hit by escalating concerns over debt.
Source: Nielsen – Global Consumer Confidence Survey 2008 - 2010 - GB results
Optimism continues to be driven by Asia Pacific where the economies of China, Australia, Hong Kong, Singapore are all in growth, whilst Europe continues to struggle especially those close to bankruptcy collectively known as PIIGS*.
*PIIGS Portugal, Ireland, Italy, Greece, Spain

Great Britain
Consumer Confidence Q4, 2010
7
Copyright © 2011 The Nielsen Company. Confidential and proprietary.
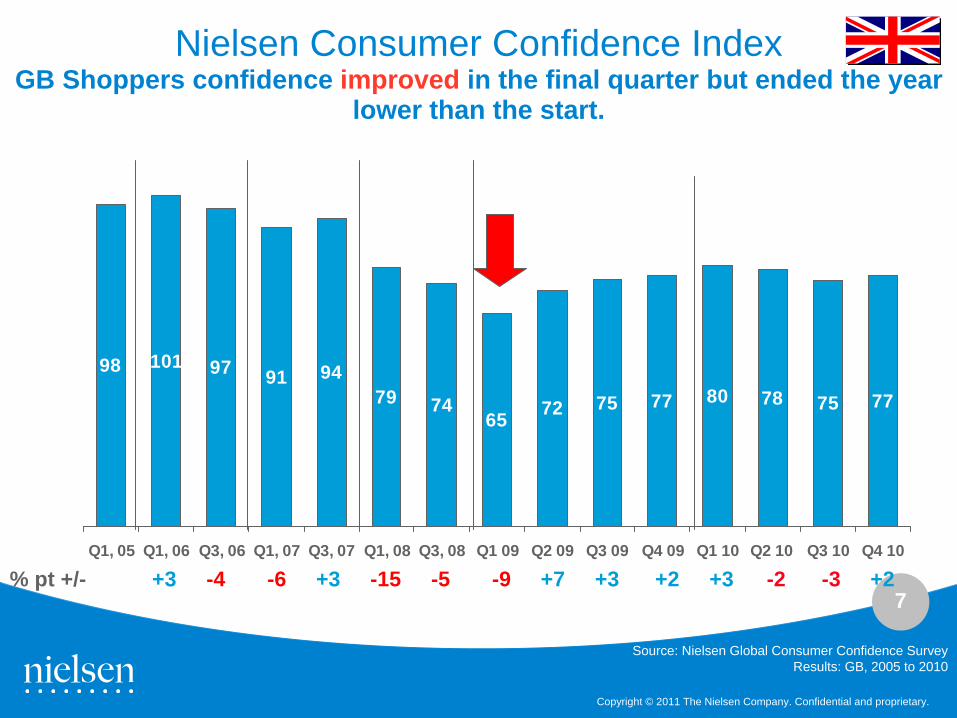
Nielsen Consumer Confidence Index GB Shoppers confidence improved in the final quarter but ended the year
lower than the start.
Source: Nielsen Global Consumer Confidence SurveyResults: GB, 2005 to 2010
98 101 97 91 9479 74
65 72 75 77 80 78 75 77
Q1, 05 Q1, 06 Q3, 06 Q1, 07 Q3, 07 Q1, 08 Q3, 08 Q1 09 Q2 09 Q3 09 Q4 09 Q1 10 Q2 10 Q3 10 Q4 10
% pt +/- +3 -4 -6 +3 -15 -5 -9 +7 +3 +2 +3 -2 -3 +2
8
Copyright © 2011 The Nielsen Company. Confidential and proprietary.
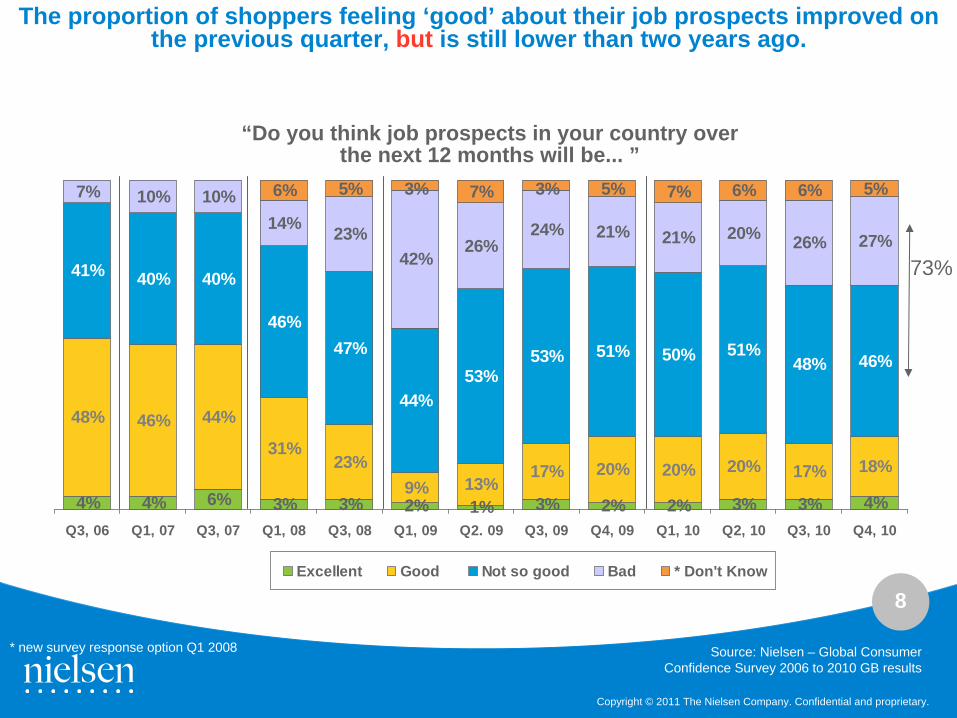
4% 4% 6% 3% 3% 2% 1% 3% 2% 2% 3% 3% 4%
48% 46% 44%
31%23%
9% 13%17% 20% 20% 20% 17% 18%
41% 40% 40%
46%47%
44%53%
53% 51% 50% 51%48% 46%
7% 10% 10%14% 23%
42%26%
24% 21% 21% 20% 26% 27%
6% 5% 3% 7% 3% 5% 7% 6% 6% 5%
Q3, 06 Q1, 07 Q3, 07 Q1, 08 Q3, 08 Q1, 09 Q2. 09 Q3, 09 Q4, 09 Q1, 10 Q2, 10 Q3, 10 Q4, 10
Excellent Good Not so good Bad * Don't Know
“Do you think job prospects in your country over the next 12 months will be... ”
Source: Nielsen – Global Consumer Confidence Survey 2006 to 2010 GB results
* new survey response option Q1 2008
The proportion of shoppers feeling ‘good’ about their job prospects improved on the previous quarter, but is still lower than two years ago.
73%

9
Copyright © 2011 The Nielsen Company. Confidential and proprietary.
4% 4% 5% 2% 1% 1% 2% 3% 3% 2% 2% 4% 3%
47% 46% 49%37% 34% 28% 32% 33% 36% 39% 39% 30% 32%
41% 37% 38%
44% 46%49%
49% 46% 42% 45% 42%48% 47%
7% 12% 8%13% 14% 17% 12% 12% 14% 9% 12% 13% 13%
4% 4% 4% 6% 5% 5% 5% 5% 5% 5%
Q3, 06 Q1, 07 Q3, 07 Q1, 08 Q3, 08 Q1, 09 Q2. 09 Q3, 09 Q4, 09 Q1, 10 Q2, 10 Q3, 10 Q4, 10
Excellent Good Not so good Bad * Don't Know
“Do you think the state of your own personal finances over the next 12 months will be..”
* new survey response option H1 2008
Compared to the start of 2010, the proportion of shoppers feeling good about their personal finances has fallen from 41% to 35%, as income has not kept pace with rising household
costs, there was however a slight improvement on the previous quarter.
Source: Nielsen – Global Consumer Confidence Survey 2006 to 2010 - GB results
60%

10
Copyright © 2011 The Nielsen Company. Confidential and proprietary.
3% 2% 3% 2% 1% 3% 2% 2% 3% 3% 1% 3% 3%
41% 36% 36%23% 27% 26% 27% 31% 30% 31% 30% 29% 29%
46%47% 46%
51% 46% 47% 49% 41% 45% 48%46% 42% 48%
10% 15% 15%22% 23% 23% 18% 23% 19% 16% 19% 22% 16%
2% 2% 1% 3% 3% 4% 2% 4% 4% 4%
Q3, 06 Q1, 07 Q3, 07 Q1, 08 Q3, 08 Q1, 09 Q2. 09 Q3, 09 Q4, 09 Q1, 10 Q2, 10 Q3, 10 Q4, 10
Excellent Good Not so good Bad * Dont' Know
“Considering the cost of things today and your own personal finances, would you say at this moment the time to buy the things you want and need is...”
* new survey response option H1 2008
GB has ended Q4 as it started, with a third of the population able and willing to spend discretionary income but two thirds are reluctant over spending
Source: Nielsen – Global Consumer Confidence Survey 2006 to 2010 - GB results
64%

11
Copyright © 2011 The Nielsen Company. Confidential and proprietary.
11%
12%
12%
10%
10%
5%
6%
5%
5%
2%
5%
4%
2%
14%
13%
12%
12%
7%
6%
6%
5%
5%
4%
2%
2%
2%
Increasing utility bills
The economy
Debt
Job security
Increasing food prices
Increasing fuel prices
Health
Immigration
Work/life balance
Terrorism
Childrens' education and/or welfare
Crime
Parents' welfare and happiness
Q3, 10
Q4, 10
“What is your biggest concern over the next 6 months?”
Top 6 GB concerns all impact household income and 4 of these have increased since October ..
Source: Nielsen – Global Consumer Confidence Survey Q3 2010 - GB results

12
Copyright © 2011 The Nielsen Company. Confidential and proprietary.
14%
13%
7%
12%
12%
6%
6%
5%
5%
4%
2%
2%
2%
13%
13%
13%
7%
6%
7%
6%
5%
4%
5%
5%
4%
3%
27%
26%
20%
19%
18%
13%
12%
10%
9%
9%
7%
6%
5%
Increasing utility bills
The economy
Increasing food prices
Job security
Debt
Increasing fuel prices
Health
Immigration
Work/life balance
Terrorism
Childrens' education and/or welfare
Crime
Parents' welfare and happiness
Main ConcernSecondary Concern
“What are your biggest concerns over the next 6 months?”
Increasing utility bills has become the number 1 concern, overtaking the economy. Increasing fuel prices have not gone unnoticed.
Source: Nielsen – Global Consumer Confidence Survey Q3 2010 - GB results
vs Q3, 10
==
=
=
13
Copyright © 2011 The Nielsen Company. Confidential and proprietary.
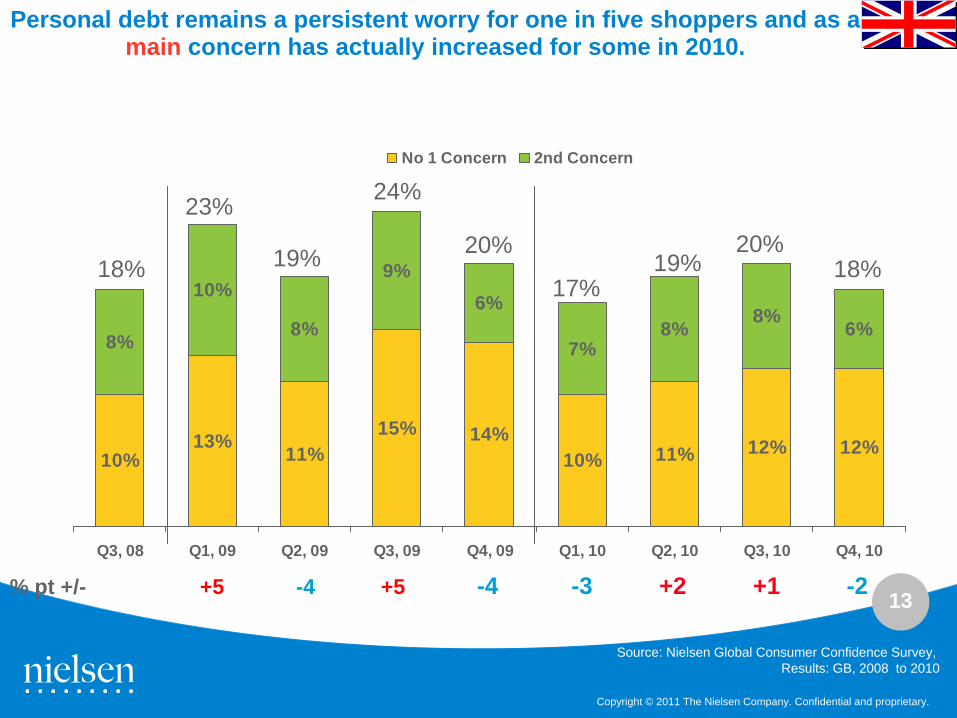
Personal debt remains a persistent worry for one in five shoppers and as a main concern has actually increased for some in 2010.
Source: Nielsen Global Consumer Confidence Survey, Results: GB, 2008 to 2010
10%13% 11%
15% 14%10% 11% 12% 12%
8%
10%
8%
9%6%
7%8% 8% 6%
Q3, 08 Q1, 09 Q2, 09 Q3, 09 Q4, 09 Q1, 10 Q2, 10 Q3, 10 Q4, 10
No 1 Concern 2nd Concern
% pt +/- +5 -4 +5 -4 -3 +2 +1 -2
18%
23%
19%
24%
20%
17%19%
20%18%

14
Copyright © 2011 The Nielsen Company. Confidential and proprietary.
4 out of 5 shoppers still believe GB to be in economic recession and a diminishing proportion expect to be out of it in the next 12 months
94 9584 82 84 82
27 2429
17 2014
Q3, 09 Q4, 09 Q1, 10 Q2, 10 Q3, 10 Q4, 10
Do you think your country is in an economic recession at the moment? (Yes)
Do you think your country will be out ofeconomic recession in the next 12 months? (Yes)
of those who think we are in a recession
Source: Nielsen – Global Consumer Confidence Survey 2009 - 2010 - GB results

15
Copyright © 2011 The Nielsen Company. Confidential and proprietary.
28%24%31%27%26%30%30%29%28%27%
58%56%
52%44%50%
51%48%50%48%51%
14%20%17%29%24%19%21%21%24%22%
GB Q4, 10GB Q3, 10GB Q2, 1OGB Q1, 10GB Q4 09GlobalAverageQ4, 10
GlobalAverageQ3, 10
GlobalAverageQ2, 10
GlobalAverageQ1, 10
GlobalAverageQ4, 09
Yes
No
Don'tknow
Source: Nielsen – Global Online Survey 2009-2010Consumer Confidence
“Do you think your country will be out of an economic recession in the next 12 months?”
Proportion of GB shoppers anticipating a double dip recession are increasing .....
16
Copyright © 2011 The Nielsen Company. Confidential and proprietary.
34%
26%
30%
24%
26%
23%
21%
16%
7%
5%
3%
31%
27%
26%
25%
24%
18%
18%
14%
5%
4%
4%
Putting into savings
I have no spare cash
Holidays / vacations
Paying off debts / credit cards / loans
New clothes
Home improvements / decorating
Out of home entertainment
New technology
Investing in shares of stock / mutual funds
Retirement fund
Don’t know/undecided
Q3, 10
Q4, 10
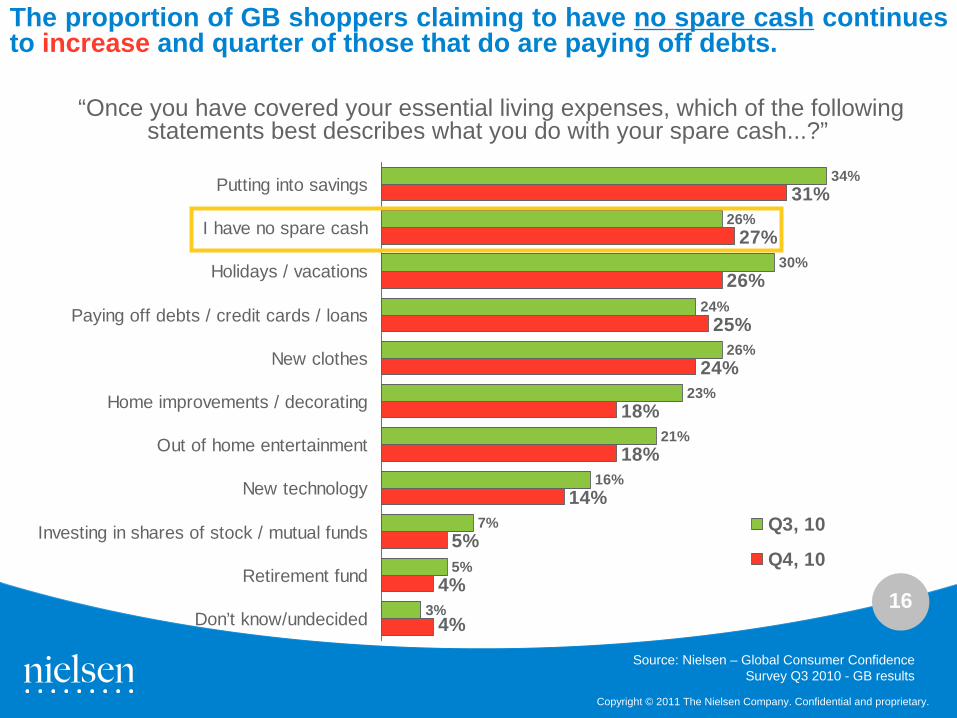
The proportion of GB shoppers claiming to have no spare cash continues to increase and quarter of those that do are paying off debts.
“Once you have covered your essential living expenses, which of the following statements best describes what you do with your spare cash...?”
Source: Nielsen – Global Consumer Confidence Survey Q3 2010 - GB results

17
Copyright © 2011 The Nielsen Company. Confidential and proprietary.
68% of GB shoppers are making savings to stay within budget.
62%
66%
68%
71%
63%
64%
70%
62%
France
USA
GB
Global Average
Q3, 10Q4, 10
“Compared to this time last year, have you changed your spending to save on household expenses?”
% answered “yes”
Source: Nielsen – Global Consumer Confidence Survey Q3 2010 - GB results

18
Copyright © 2011 The Nielsen Company. Confidential and proprietary.
59%
65%
60%
60%
50%
42%
37%
38%
37%
31%
31%
32%
24%
34%
13%
65%
65%
61%
57%
51%
42%
42%
40%
37%
29%
29%
28%
28%
23%
15%
Spend less on new clothes
Try save on gas and electricity
Cut down on take-away meals
Switch to cheaper grocery brands
Cut down on out-of-home entertainment
Cut down on holidays / short breaks
Cut down on telephone expenses
Delay replacement of major household items
Delay upgrading technology, eg. PC, Mobile
Use my car less often
Cut out annual vacation
Look for better deals on loans, insurance, credit cards
Cut down on at-home entertainment
Cut down on or buy cheaper brands of alcohol
Cut down on smoking
Q3, 10Q4, 10
“Compared to this time last year, which of the following actions would you take in order to stay within your budget?”
*results from a sub-set of those who have said yes, they have changed the way they shop to save money
Reigning in expenditure on new clothes is further evidence that shoppers are once again feeling the pinch and this strategy has moved back up the savings
hierarchy to joint first place with ‘bills’.
Source: Nielsen – Global Consumer Confidence Survey Q4 2010 - GB results
Of those householdslooking to stay withinbudget.

19
Copyright © 2011 The Nielsen Company. Confidential and proprietary.
56%
39%
31%
29%
24%
24%
25%
21%
13%
14%
14%
19%
10%
10%
11%
54%
38%
30%
30%
28%
23%
19%
18%
18%
18%
17%
14%
12%
12%
11%
Try to save on gas and electricity
Cut down on take-away meals
Switch to cheaper grocery brands
Spend less on new clothes
Cut down on telephone expenses
Cut down on out-of-home entertainment
Look for better deals on home loans, insurance, credit cards ..
Use my car less often
Cut down on holidays / short breaks
Delay the replacement of major household items
Delay upgrading technology, eg. PC, Mobile, etc
Cut down on or buy cheaper brands of alcohol
Cut out annual vacation
Cut down on smoking
Cut down on at-home entertainment
Q3, 10Q4, 10
“When economic conditions do improve, which of these do you expect you will continue to do?”
Shoppers will continue to make savings by switching to cheaper grocery brands.
Source: Nielsen – Global Consumer Confidence Survey Q4 2010 - GB results
The continued poor exchange rates for GB shoppers may explain the increase in those looking cut back on holidays.
*results from a sub-set of those who have said yes, they have changed the way they shop to save money

20
Copyright © 2011 The Nielsen Company. Confidential and proprietary.
65%
61%
65%
57%
42%
51%
28%
29%
42%
40%
37%
23%
15%
29%
28%
54%
38%
30%
30%
28%
23%
19%
18%
18%
18%
17%
14%
12%
12%
11%
Try to save on gas and electricity
Cut down on take-away meals
Spend less on new clothes
Switch to cheaper grocery brands
Cut down on telephone expenses
Cut down on out-of-home entertainmentLook for better deals on home loans, insurance, credit
cards etcUse my car less often
Cut down on holidays/short breaks
Delay the replacement of major household items
Delay upgrading technology, eg. PC, Mobile etc
Cut down on or buy cheaper brands of alcohol
Cut down on smoking
Cut out annual vacation
Cut down on at-home entertainment
NowPost Economic Crisis
“Compared to this time last year, which of the following actions would you take in order to stay within your budget?”
of those HHlooking to stay within budget
Saving on household essentials such as bills, groceries and discretionary items: clothes and take-aways are established strategies to save money
Source: Nielsen – Global Consumer Confidence Survey Q4 2010 - GB results*results from a sub-set of those who have said yes, they
have changed the way they shop to save money

Outlook for 2011

22
Copyright © 2011 The Nielsen Company. Confidential and proprietary.
GDP declined 0.5% in the final quarter of 2010. Worst December weather on record has been widely blamed, as hotels and restaurants contributed most to the decline.
GDP Growth UK output decreases by 0.5%
Real GDP quarterly growth
Source: ONS January 26th 2011
Negative growth will re-ignite fears that GB is heading for a double dip recession, analysts have reworked GDP accounting for the weather and suggest the final quarter would have come in at zero.

23
Copyright © 2011 The Nielsen Company. Confidential and proprietary.
Bleak GB Outlook for 2011• Negative GDP in Q4 will re-ignite fears that GB is heading for a double dip
recession.
• Nielsen’s Consumer Confidence survey has identified a diminishing proportion of shoppers believing GB will be out of recession in 12 months
• There is significant evidence that Shoppers are already feeling the impact of falling disposable income ...
– Unit growths remain weak– Promotions remain at an all time high– Shoppers are not willing to spend on discretionary categories such as
general merchandise
• Despite GB Consumer Confidence improving in the final quarter, it ended the year weaker than at the start.
• Discretionary expenditure is expected to be squeezed harder in 2011 as household income for most shoppers is unlikely to keep pace with the cost of living.
24
Copyright © 2011 The Nielsen Company. Confidential and proprietary.
Retail Outlook for 2011
• An increasing proportion of shoppers have no spare cash, those that do are more likely to put into savings or pay off debts than spend on discretionary items.
• For many homeowners there is an anticipation that interest rates will rise in the second half of 2011, putting another squeeze on discretionary spend.
• Looking ahead Grocery Retailers will need to find new incentives to encourage shoppers to spend, as shoppers will have to manage on LESS household income.


![Insperity Business Confidence Survey: Q4 2014 [Infographic]](https://static.documents.pub/doc/80x56/55a700761a28abf75e8b4787/insperity-business-confidence-survey-q4-2014-infographic.jpg)


