Page 1
Consumer Food Shopping Behaviour in Libya
By
Khairia A. H. Sehib
THESIS
SUBMITTED FOR
THE DEGREE OF
DOCTOR OF PHILOSOPHY
AT NEWCASTLE UNIVERSITY
Declaration
No portion of this work referred to in this thesis has been submitted in support of an application for
any other degree or qualification from this or any other University or Institute of learning
2013
Page 2
i
Abstract
This thesis explores consumer food shopping behaviour in an emerging economy, taking the Libyan
case as an example. As in many other emerging economies, Libya’s retail environment has been
dominated for generations by traditional markets and small independent stores but has recently
witnessed the spread of ‘modern’ formats such as supermarkets.
The study draws on both qualitative and quantitative research. The qualitative research
provided evidence of a complex picture, highlighting significant variations, from family to family
and geographically, in the social acceptability of females shopping at traditional markets and other
retail formats. In Libya, food shopping has traditionally been a task for male household members,
with traditional markets regarded as inappropriate spaces for females. However the safer, cleaner,
and less crowded environment offered by large supermarkets contributed to some women feeling
more comfortable shopping for food and henceforth being able to shop as independent consumers.
Traditional culture, rather than constraining the spread of supermarkets, may act as a facilitator of
the growing popularity of supermarkets in Libya.
The main quantitative research instrument was a self-administered questionnaire of Libyan
food shoppers in Benghazi city. 371 completed questionnaires were obtained. Factor analysis
revealed 12 factors that underlie the reasons consumers go shopping for food. The application of
cluster analysis to the dimensions factor scores revealed six segments of food shoppers. The
characteristics of each cluster were described by average factor scores on the dimensions of
shopping motivations, demographic characteristics, and behavioural variables.
The most important retail outlet attributes in the choice of where to buy food were, in
descending order, food safety, quality of products, quality of service, speed of service, and variety
of products. The findings also indicated that on all items supermarkets performed the best; except
for freshness of products and in-store credit (traditional markets were perceived as superior on
freshness of products and independent stores for in-store credit). Only for one attribute (car parking)
were differences in the mean scores between supermarkets, traditional markets and independent
stores not statistically significant.
Page 3
ii
Econometric modelling considered the possible relationships between shopping behaviour
and the demographic and socioeconomic characteristics of the respondents. This confirmed a major
finding of the qualitative research - that females were significantly less likely than males to visit
traditional markets and spent proportionally more in supermarkets. Supermarket visitors were more
concerned with social acceptability whereas, patrons of traditional markets placed greater emphasis
on freshness. Heavy users of independent stores placed greater emphasis on in-store credit.
Page 4
iii
Acknowledgement
In The Name Of Allah Most Gracious Most Merciful
“Who does not thank people does not thank Allah” (Prophet Mohammed peace be upon him)
First of all, my grateful thanks are due to Allah, the Lord of the universe, the most beneficent
and compassionate, for providing me with the health, patience, and knowledge to complete the
requirements for my academic career.
I am deeply indebted to my supervisors, Dr. Matthew Gorton and Dr. Elizabeth Jackson for
their professional advice, excellent guidance and continuous encouragement, which contributed to
the success of the work.
I wish to express my profound gratitude to my examiners, Prof. Dr. Michael Bourlakis
(Business School, Brounel University) and Dr. Sharron Kuznesof (Agriculture School, Newcastle
University) for their valuable criticisms.
I am also delighted to acknowledge all the kindness and support that I have received from
Prof Faisal. M. Shalloof (member of staff at Omar Al mukhtar University in Libya) during the
period of my study in the UK.
I am very grateful to my family. I am truly indebted to my father, my ideal whom I will
always cherish, and to my mother, whose love, prayers, patience, and encouragement have inspired
me to achieve my goals. I also wish to thank my brothers and sisters for their love, encouragement
and support. Of course, gratitude is also, to my life flowers, my nieces and nephews.
Of course, my most heartfelt acknowledgement must go to my best friends Kawakeb Saad,
Marfoua Ali, Mariam Alshibani, and Tefaha Altewaty. Their support, encouragement, and
companionship have turned my challenging doctoral life into a pleasurable journey. For all that,
they have my everlasting respect and love.
To my home country Libya, for its support despite of the tough conditions that has faced. The
best regards and great thanks to everyone martyred for a free Libya.
Page 5
iv
Last but not least, it is not possible to name all of the people to whom I would wish to express
my thanks. Therefore, I wish to thank all the people who created and added to my knowledge.
To all of you, thank you.
Page 6
v
In recognition of the constant support and
encouragement of my family, this PhD thesis is
respectfully dedicated to them.
Page 7
vi
Table of Contents
Abstract ................................................................................................................................................. i
Acknowledgement .............................................................................................................................. iii
Table of Contents ................................................................................................................................ vi
List of Figures ..................................................................................................................................... xi
List of Tables ..................................................................................................................................... xii
Chapter 1 Study Background .......................................................................................................... 1
1.1. Introduction .......................................................................................................... 1
1.2. Research Background ........................................................................................... 1
1.2.1. Modern Formats versus Traditional Formats ....................................................... 2
1.2.2. Modern Retail Formats ......................................................................................... 2
1.2.3. Diffusion of Modern Retail .................................................................................. 5
1.2.4. Why Modern Formats Spread Rapidly ................................................................. 5
1.2.5. Implications of the Spread of Supermarket Sector ............................................... 5
1.2.6. Traditional Retail Formats .................................................................................... 6
1.2.7. Arguments for the Superiority of Traditional Formats ......................................... 7
1.2.8. How Traditional Formats are Changing ............................................................... 7
1.2.9. How Supermarkets Deal with this Challenge ....................................................... 8
1.3. Background of Libya ............................................................................................ 8
1.3.1. Location ................................................................................................................ 9
1.3.2. Population ............................................................................................................. 9
1.3.3. Culture .................................................................................................................. 9
1.3.4. Religion ................................................................................................................ 9
1.3.5. The Role of Women ............................................................................................. 9
1.3.6. Social and Economic Restructuring ................................................................... 10
1.4. Statement of the Problem ................................................................................... 12
Page 8
vii
1.5. Research Aim ..................................................................................................... 13
1.6. Research Objectives ........................................................................................... 13
1.7. Research Questions............................................................................................. 13
1.8. An overview of the Research Design ................................................................. 14
1.9. Significance of the Study .................................................................................... 17
1.10. Outline of the Thesis........................................................................................... 17
1.11. Conclusion to the Chapter .................................................................................. 18
Chapter 2 Food retailing Sector in Libya ..................................................................................... 19
2.1. Introduction ........................................................................................................ 19
2.2. An Overview of the Libyan Economy ................................................................ 19
2.2.1. Privatisation Policy ............................................................................................. 21
2.2.2. Subsidy Program................................................................................................. 22
2.3. Structure of Food Retailing in Libya .................................................................. 22
2.3.1. The State Registered Supermarket (Popular Market) ......................................... 23
2.3.2. Consumer Cooperatives (Jemiah store) .............................................................. 25
2.3.3. Independent Stores ............................................................................................. 26
2.3.4. Traditional Markets (Souk Shaabi) ..................................................................... 27
2.3.5. Modern Formats ................................................................................................. 29
2.4. Expenditure on Food .......................................................................................... 33
2.5. Food Expenditure Patterns.................................................................................. 34
2.6. Food Consumption Patterns................................................................................ 35
2.7. Food Retailing in Saudi Arabia .......................................................................... 36
2.7.1. Convenience Stores (Bakalahs) .......................................................................... 36
2.7.2. Traditional Markets ............................................................................................ 37
2.7.3. Supermarkets ...................................................................................................... 37
2.7.4. Hypermarkets ...................................................................................................... 38
2.8. Conclusion .......................................................................................................... 38
Page 9
viii
Chapter 3 Literature Review ......................................................................................................... 40
3.1. Introduction ........................................................................................................ 40
3.2. Shopping Decision .............................................................................................. 41
3.2.1. Motives for Shopping ......................................................................................... 41
3.2.2. Shopper Typologies ............................................................................................ 46
3.3. Store Patronage ................................................................................................... 54
3.4. Store Image Attributes ........................................................................................ 54
3.4.1. Location .............................................................................................................. 56
3.4.2. Price .................................................................................................................... 59
3.4.3. In Store Convenience .......................................................................................... 61
3.4.4. Atmosphere ......................................................................................................... 61
3.5. Models of Store Choice ...................................................................................... 65
3.6. A Theoretical Framework Model of the Study ................................................... 68
3.7. Conclusion .......................................................................................................... 73
Chapter 4 Research Methodology ................................................................................................ 75
4.1. Introduction ........................................................................................................ 75
4.2. Research Philosophy........................................................................................... 75
4.2.1. Positivism ........................................................................................................... 76
4.2.2. Interpretative ....................................................................................................... 76
4.3. Research Approach ............................................................................................. 78
4.4. Data Sources ....................................................................................................... 79
4.5. Research Methods............................................................................................... 79
4.5.1. Qualitative Research ........................................................................................... 80
4.5.2. Quantitative Research ......................................................................................... 86
4.6. Conclusion ........................................................................................................ 105
Chapter 5 Qualitative Research .................................................................................................. 107
5.1. Introduction ...................................................................................................... 107
Page 10
ix
5.2. Research Findings............................................................................................. 109
5.2.1. Retail Formats................................................................................................... 110
5.2.2. Social Acceptability of Traditional Food Markets ........................................... 111
5.2.3. Social Acceptability of Supermarkets .............................................................. 113
5.2.4. Comparison of the Social Acceptability ........................................................... 114
5.2.5. Cultural Change ................................................................................................ 114
5.2.6. Shopping Frequency ......................................................................................... 115
5.2.7. Motives for Shopping ....................................................................................... 116
5.2.8. Retail Attributes ................................................................................................ 120
5.2.9. Evaluation of Retails Formats .......................................................................... 121
5.2.10. Shopper Typologies ................................................................................... 123
5.3. Conclusion ........................................................................................................ 126
Chapter 6 Quantitative Research Results ................................................................................... 128
6.1. Introduction ...................................................................................................... 128
6.2. Descriptive Analysis ......................................................................................... 128
6.2.1. Demographic Profile ......................................................................................... 128
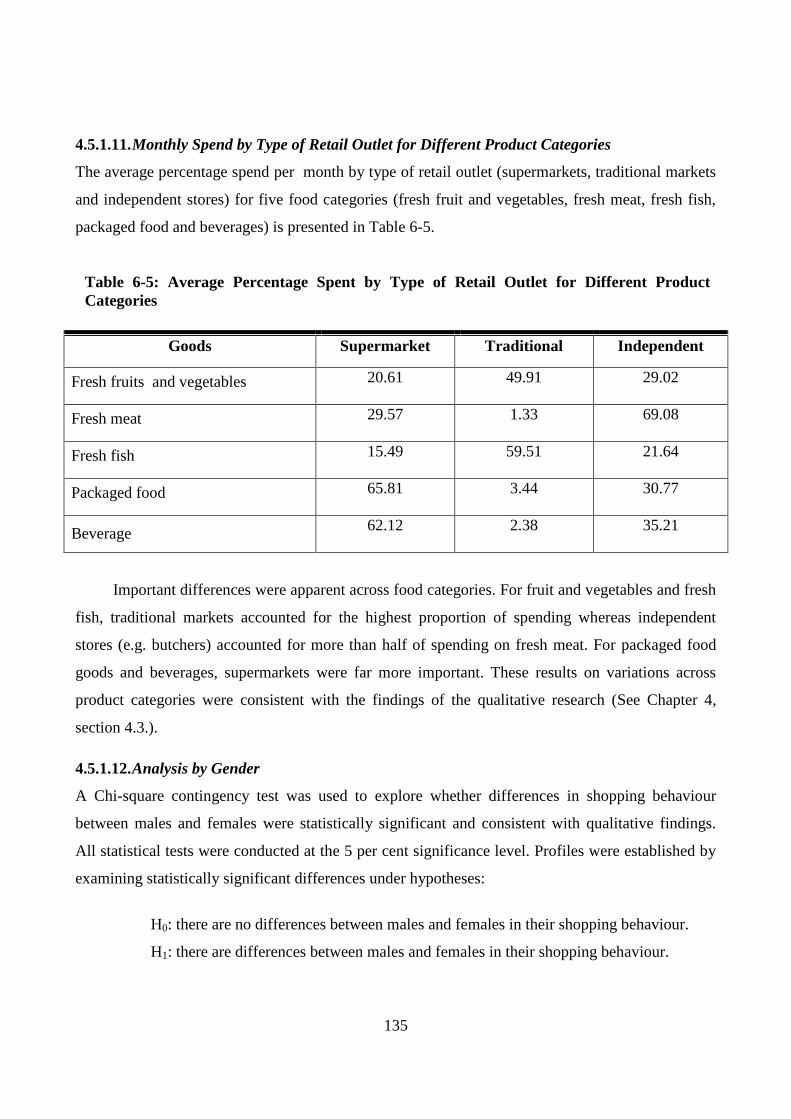
6.2.2. Shopping Behaviour ......................................................................................... 132
6.2.3. Importance of Retail Outlet Attributes ............................................................. 136
6.3. Confirmatory Factor Analysis .......................................................................... 139
6.4. Exploratory Factor Analysis (EFA) .................................................................. 142
6.4.1. Confirmation of the Correlation of Data .......................................................... 142
6.4.2. Factor Extraction .............................................................................................. 143
6.4.3. Evaluate the Goodness of Fit of the Solution ................................................... 143
6.5. Cluster Analysis (CA) ...................................................................................... 147
6.5.1. Cluster Profiles ................................................................................................. 148
6.5.2. Clusters Profiling Using Demographic and Behavioural Variables ................. 151
6.5.3. Econometric Analysis ....................................................................................... 161
Page 11
x
6.5.4. Ordered Probit Model ....................................................................................... 161
6.5.5. Tobit Models..................................................................................................... 162
6.6. Effect of the 17th
Revolution in Consumer Food Shopping Behaviour ............ 171
6.7. Conclusion ........................................................................................................ 172
Chapter 7 Discussion .................................................................................................................. 174
7.1. Introduction ...................................................................................................... 174
7.2. Qualitative Research ......................................................................................... 174
7.2.1. Retail Formats................................................................................................... 174
7.2.2. Gender Shopping and Social Acceptability ...................................................... 175
7.3. Quantitative Research ....................................................................................... 177
7.3.1. Shopping Patterns ............................................................................................. 177
7.3.2. Shopping Styles and Typologies ...................................................................... 178
7.3.3. Motives for Retail Outlet Choice ...................................................................... 182
7.3.4. Evaluation of Supermarkets, Traditional Markets, and Independent Stores .... 182
7.3.5. Pattern of Store Choice Based on Particular Categories of Products ............... 184
7.4. Conclusion ........................................................................................................ 186
Chapter 8 Conclusion, Implications and Limitations ................................................................. 188
8.1. Introduction ...................................................................................................... 188
8.2. Summary of the Study ...................................................................................... 188
8.3. Conclusions related to the Research Questions ................................................ 192
8.4. Contributions of the Study ................................................................................ 195
8.5. Implications for Practitioners ........................................................................... 196
8.6. Limitations of the Study ................................................................................... 198
8.7. Recommendations for Future Research ............................................................ 199
8.8. Conclusion ........................................................................................................ 200
Appendix 1: Interview Guide ........................................................................................................... 202
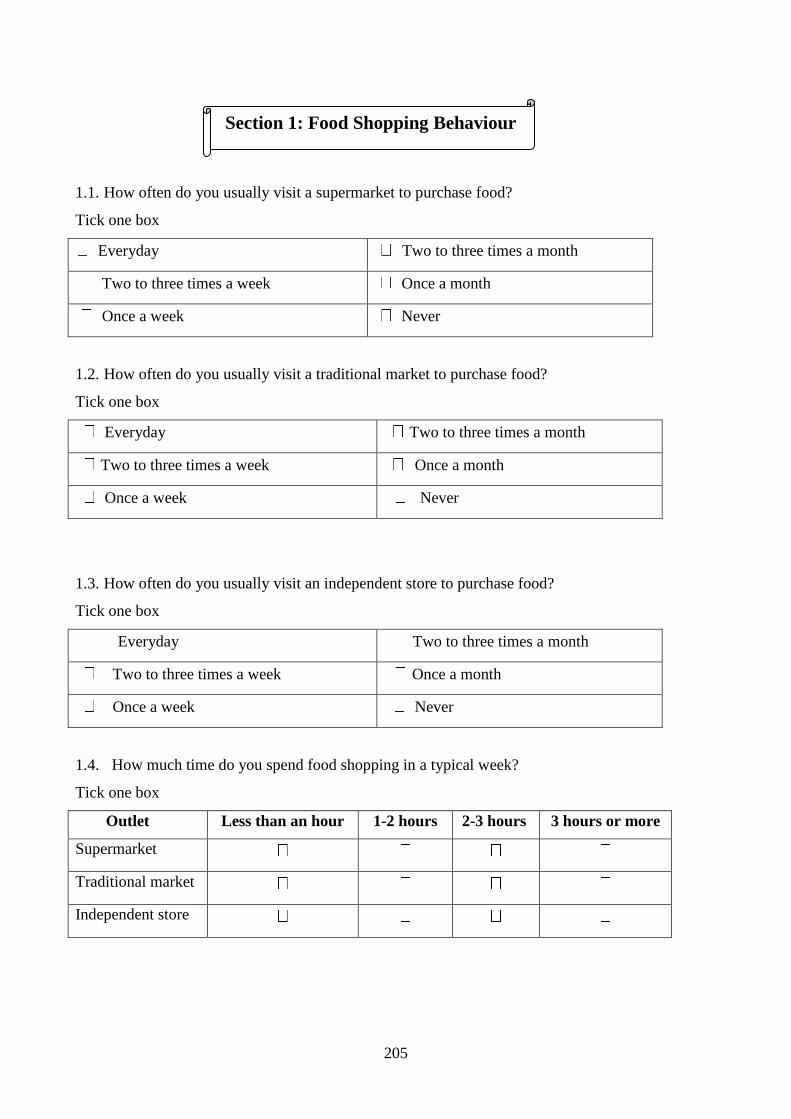
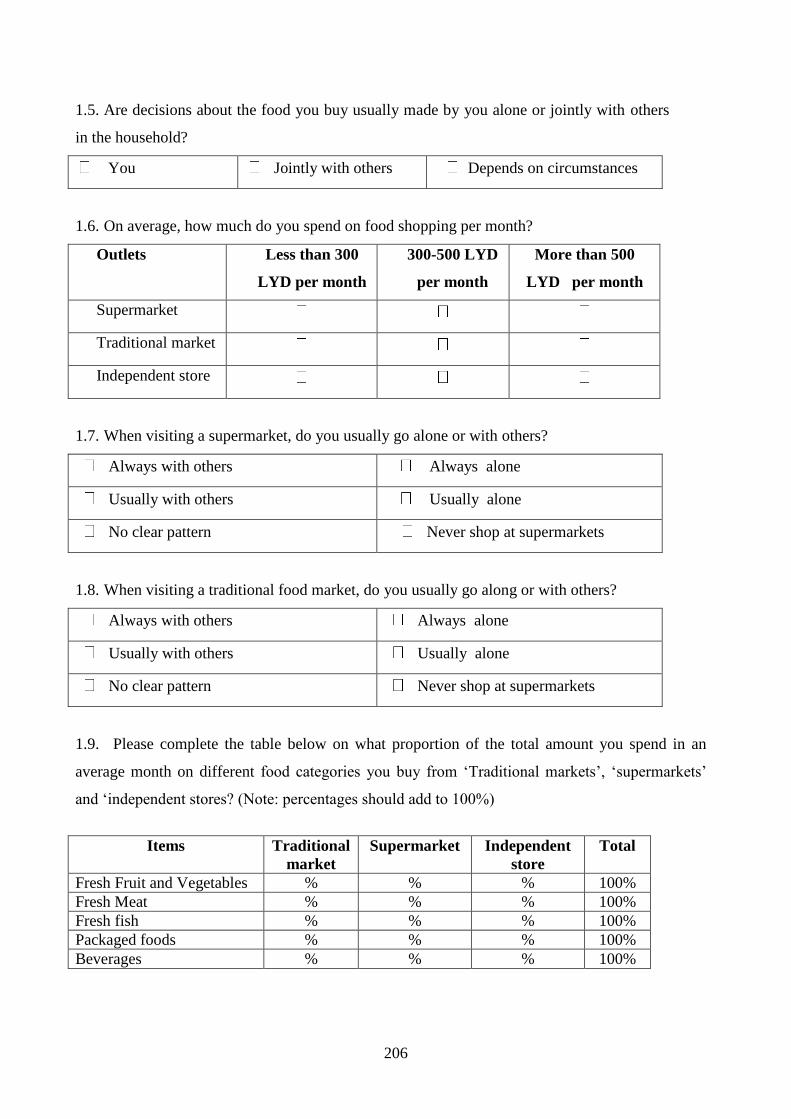
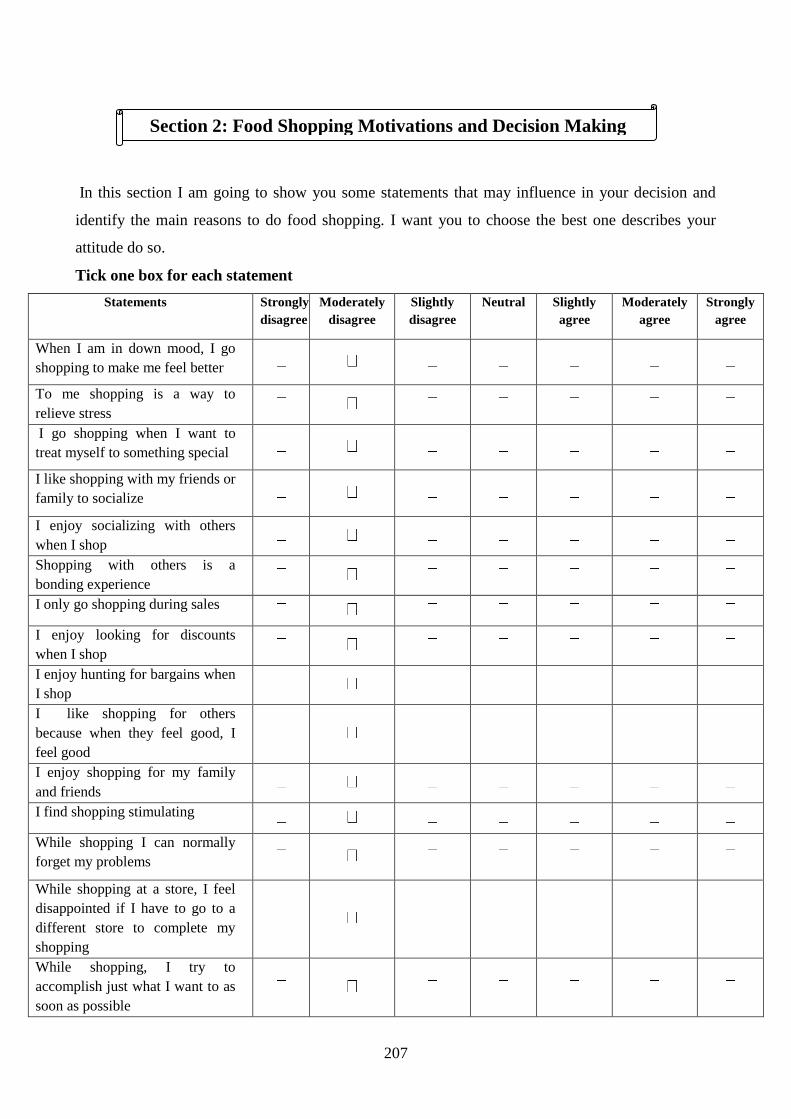
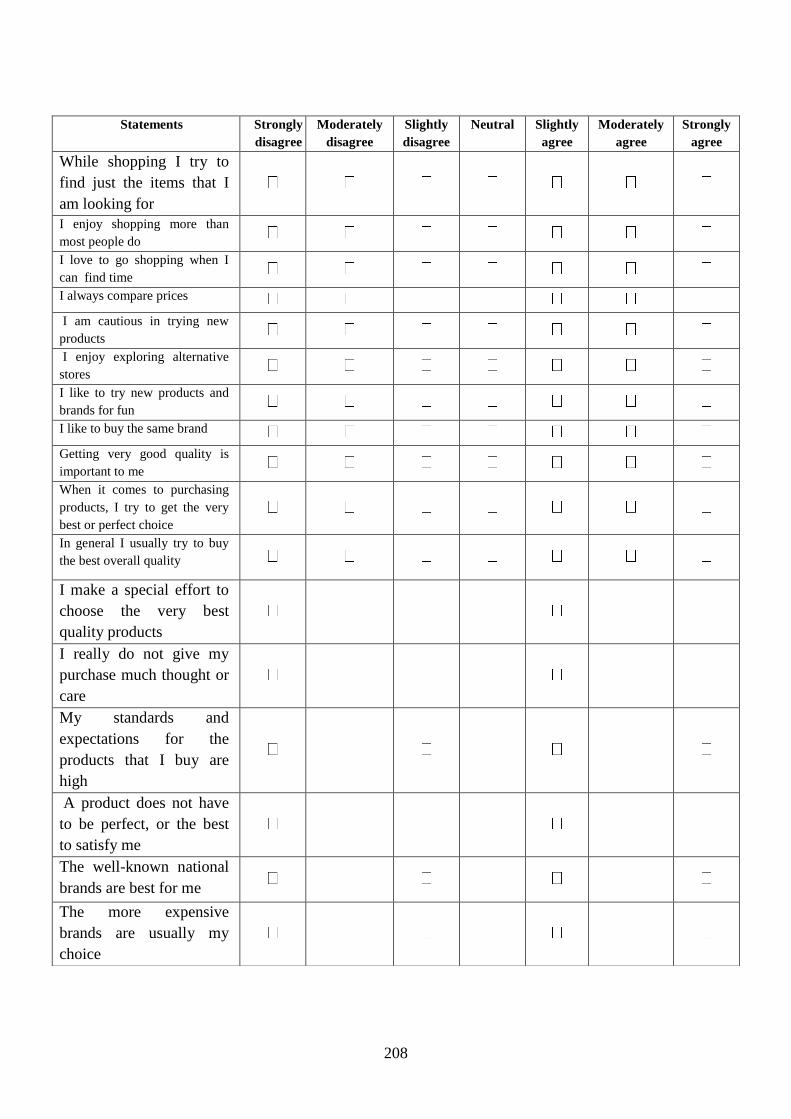
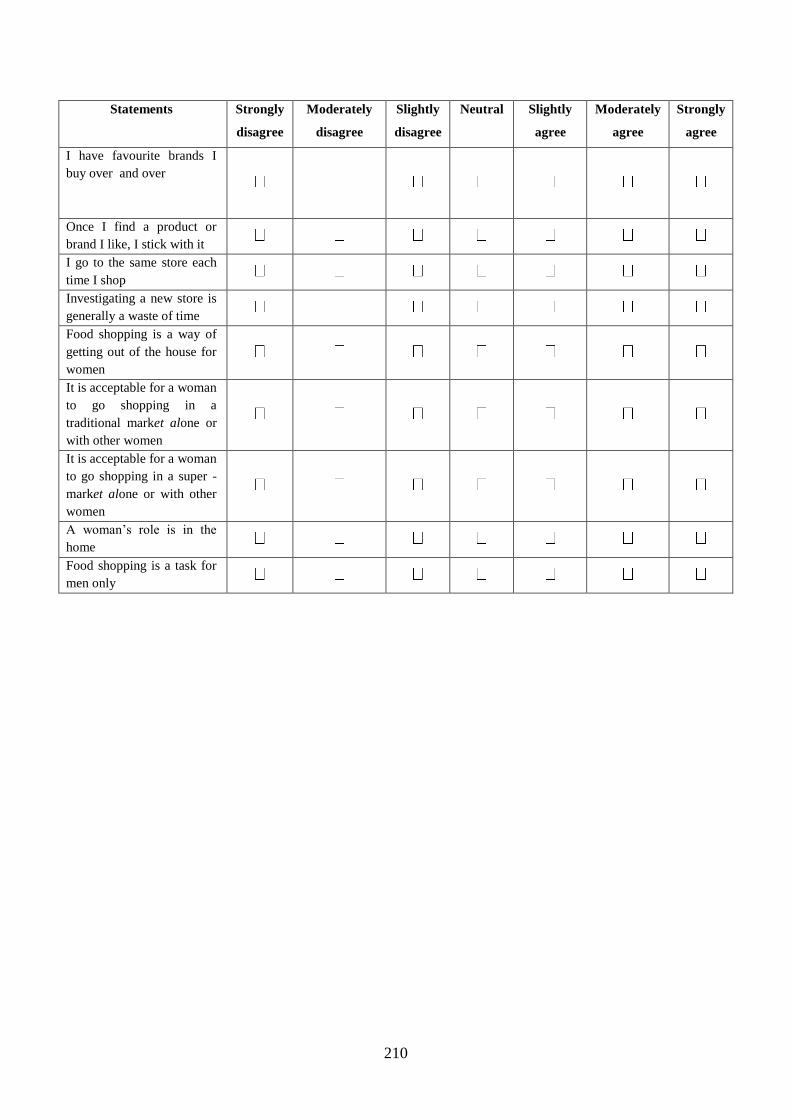
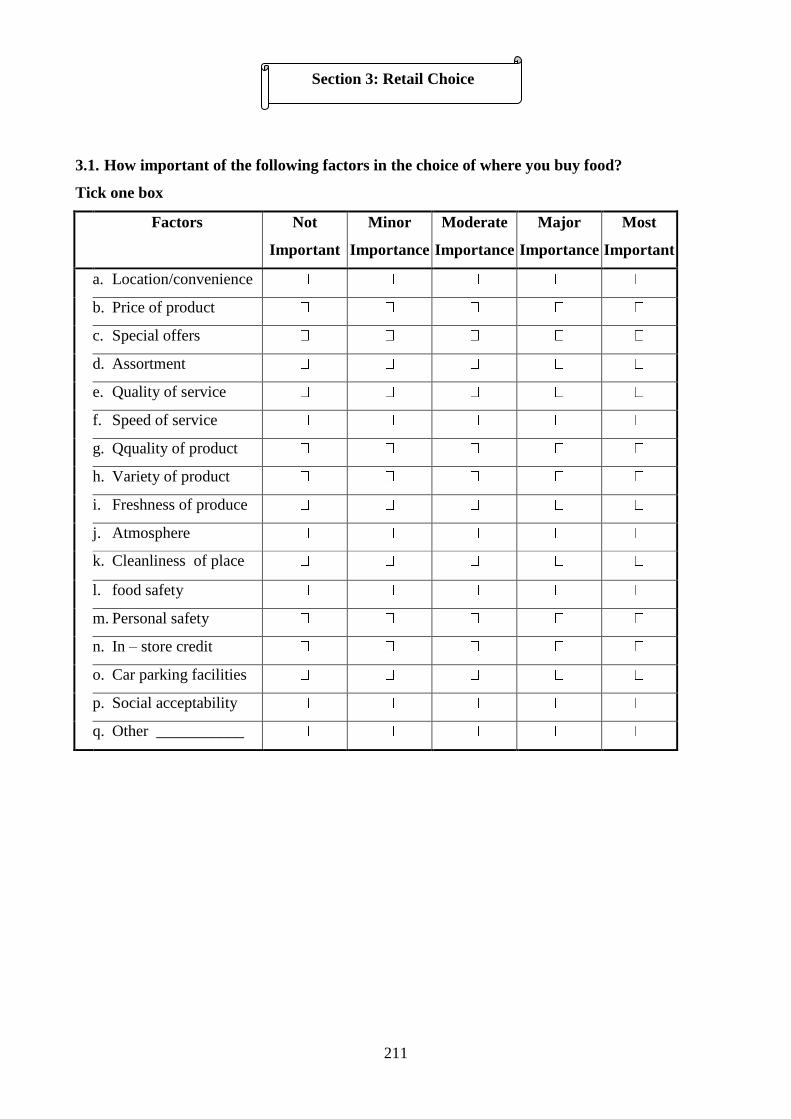
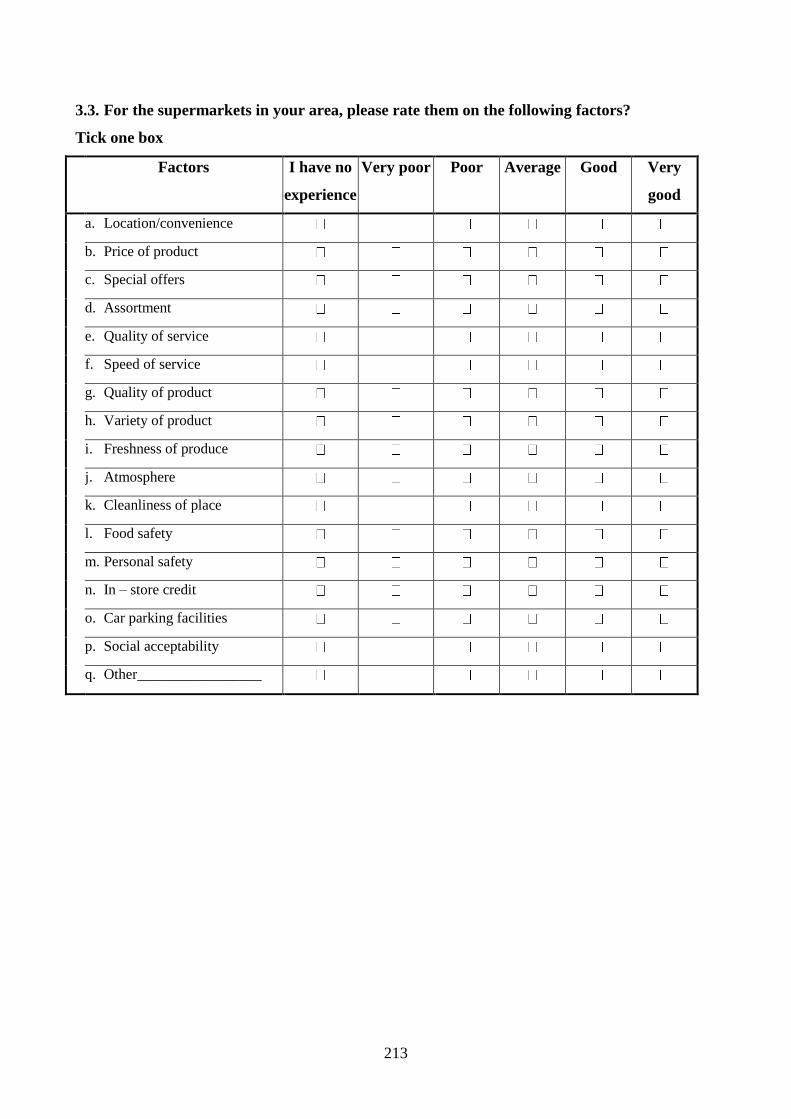
Appendix 2: English Version of Questionnaire ............................................................................... 204
Page 12
xi
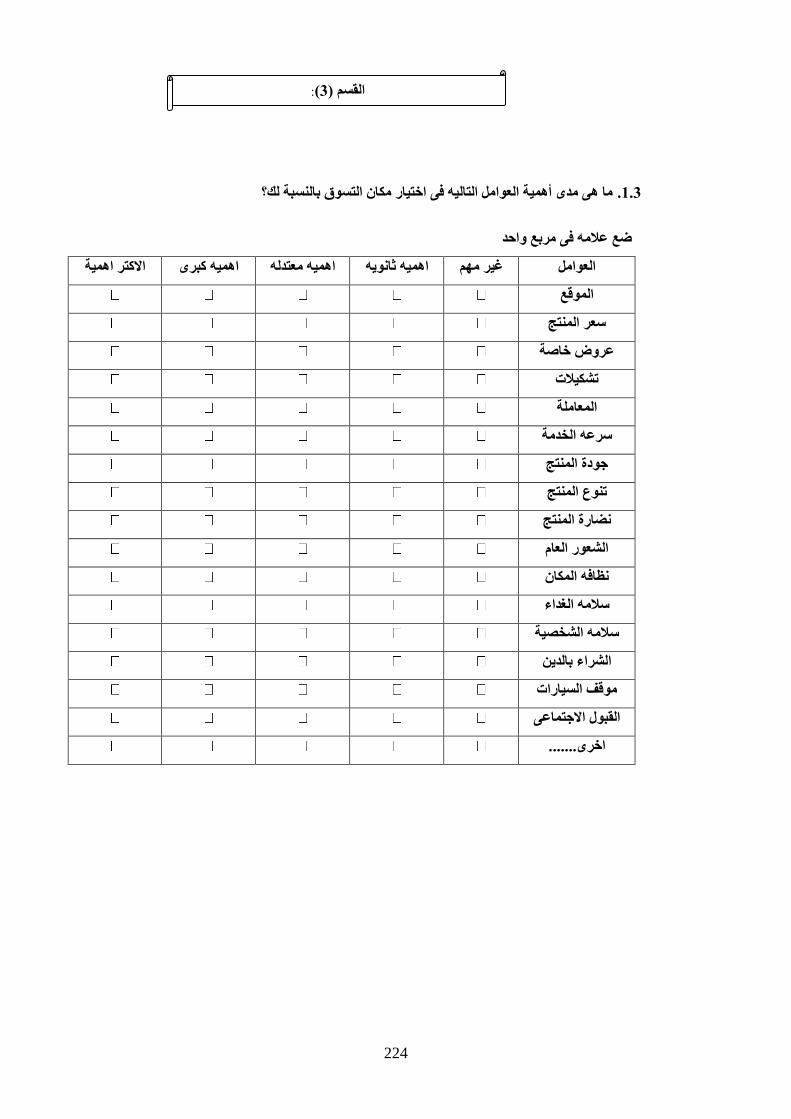
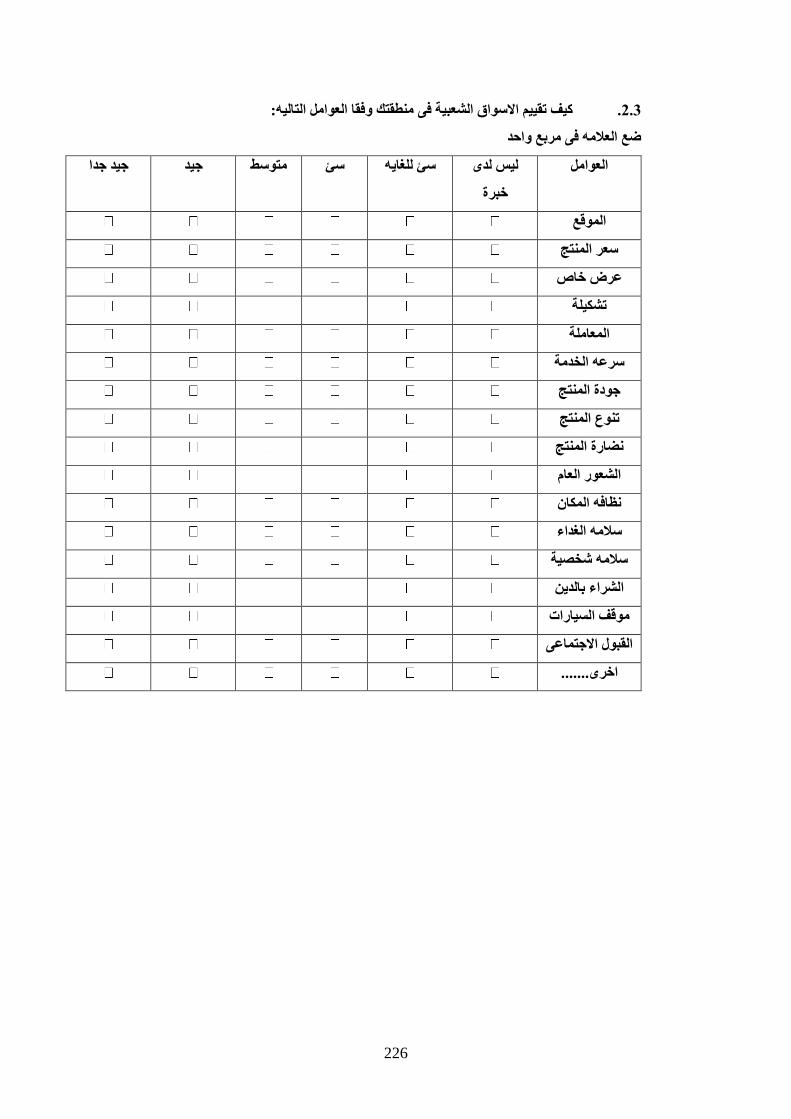
Appendix 3: Arabic Version of Questionnaire ................................................................................ 217
Appendix 4: NVivo Out Put ............................................................................................................. 230
List of References ............................................................................................................................ 233
List of Figures
Figure 1-1: Research Design .............................................................................................................. 14
Figure 2-1: Libyan State Supermarket in 1981 ................................................................................. 24
Figure 2-2: Grocery Shop .................................................................................................................. 26
Figure 2-3: Specialized Store (butcher............................................................................................... 27
Figure 2-4: Traditional Market (Fruits and Vegetables Souk) ........................................................... 28
Figure 2-5: Traditional Market (Spices Souk) ................................................................................... 28
Figure 2-6: Traditional Market (Souk El- Hout) ................................................................................ 29
Figure 2-7: Souk Al-Thalat Mall ........................................................................................................ 30
Figure 2-8: Venesia Market ................................................................................................................ 31
Figure 2-9: Benghazi Shopping Centre .............................................................................................. 32
Figure 2-10: Monoprix Supermarket ................................................................................................. 33
Figure 3-1 : Maslow’s Hierarchy of Needs ......................................................................................... 41
Figure 3-2: A Theoretical Framework of the Study ........................................................................... 69
Figure 4-1: Process of Deduction ....................................................................................................... 79
Figure 4-2: The Methods used to Establish Validity and Reliability of Measures ............................ 91
Figure 4-3: Map of Benghazi city ...................................................................................................... 94
Figure 4-4: Summary of the Research Methodology ....................................................................... 106
Figure 5-1: Libyan Shoppers Typologies......................................................................................... 124
Page 13
xii
Figure 6-1: Mean Performance Scores for Supermarkets, Traditional Markets and Independent
Stores on Retail Attributes ............................................................................................................... 137
Figure 6-2: Plot of Distances to Cluster Centres.............................................................................. 148
Figure 6-3 : Typology of Libyan Shoppers ...................................................................................... 151
Figure 6-4: Gender and Shoppers Typologies ................................................................................. 154
List of Tables
Table 1-1: Gross Domestic Product (GDP), Current Prices during ................................................... 10
Table 2-1: Shares of Household Expenditure for Pre-Crisis and Crisis Periods ............................... 34
Table 2-2: The Relative Importance of Household Expenditure on Food Groups ............................ 35
Table 3-1: Summary of Shopper Typology Studies........................................................................... 48
Table 3-2: Summary of the Findings of Individual Studies Assessing Factors that Determine Store
Choice ................................................................................................................................................ 57
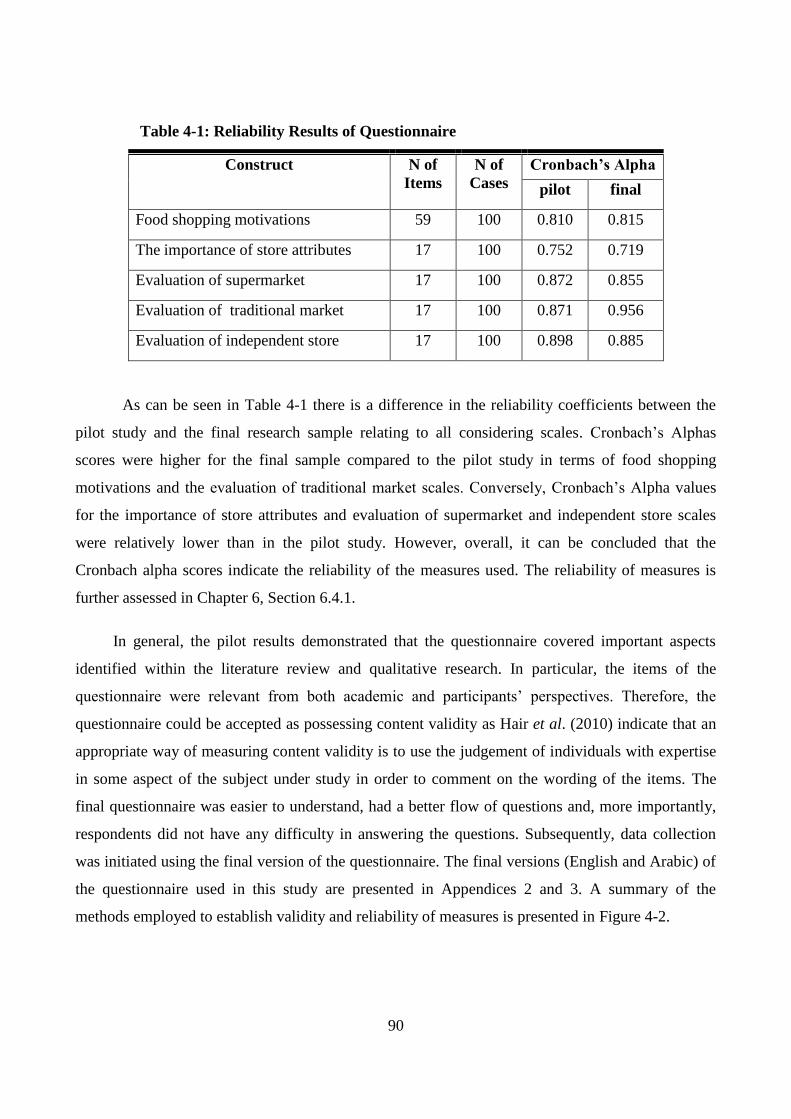
Table 4-1: Reliability Results of Questionnaire ................................................................................. 90
Table 4-2: Guidelines for identifying significant factor loading ....................................................... 97
Table 4-3: KMO Index ..................................................................................................................... 100
Table 5-1: Details of Interview Participants .................................................................................... 108
Table 6-1: Demographic Profile of the Respondents ....................................................................... 130
Table 6-2: Frequency of Shopping ................................................................................................... 133
Table 6-3: Time Spent on a Shopping Trip...................................................................................... 134
Table 6-4: Shopping Alone or With Others ..................................................................................... 134
Table 6-5: Average Percentage Spent by Type of Retail Outlet for Different Product Categories . 135
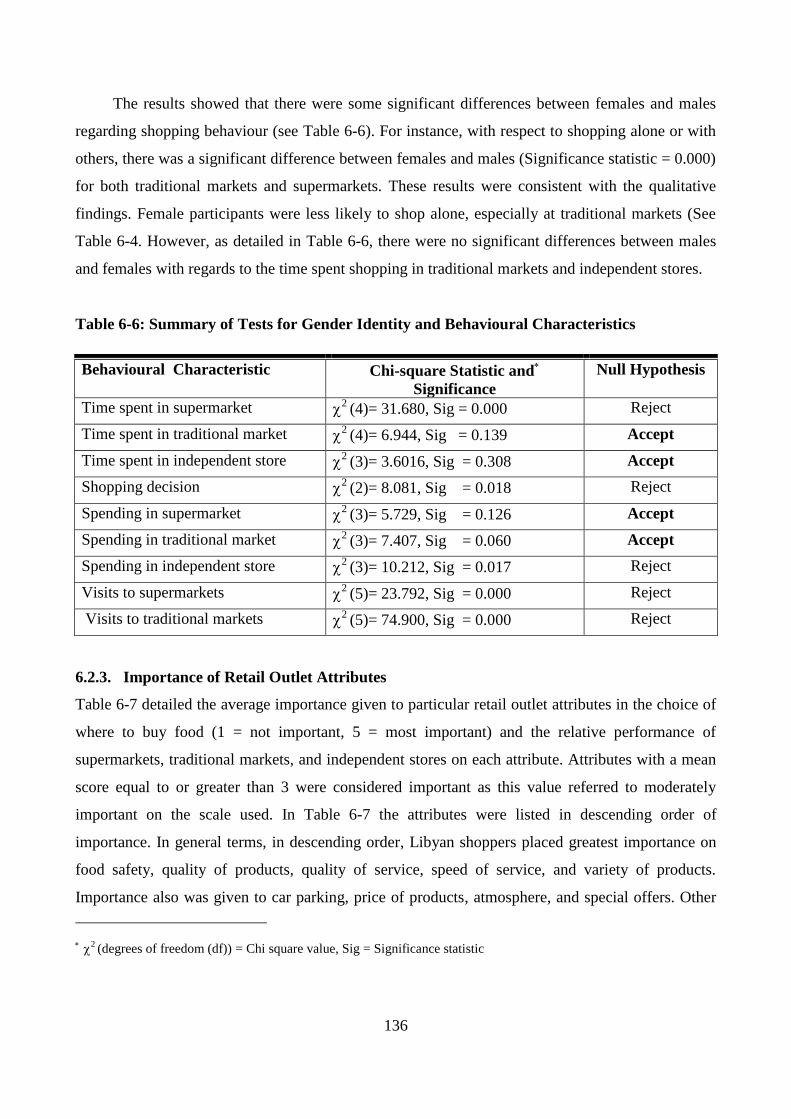
Table 6-6: Summary of Tests for Gender Identity and Behavioural Characteristics ....................... 136
Page 14
xiii
Table 6-7: Importance Weightings for Retail Outlet Attributes and Mean Score on those Attributes
for Supermarkets, Traditional Markets and Independent Stores ...................................................... 138
Table 6-8: Confirmatory Factor Analysis (Goodness of Fit Statistics) ........................................... 140
Table 6-9: Standardized Factor Loading .......................................................................................... 141
Table 6-10: CR and AVE Estimates ................................................................................................ 142
Table 6-11: KMO and Bartlett's Test ............................................................................................... 143
Table 6-12: Reliability Statistics ...................................................................................................... 144
Table 6-13: Exploratory Factor Analysis (EFA) Results ................................................................ 145
Table 6-14: Results of the Non-Hierarchical Cluster Analysis and Mean Scores for Each Factor . 150
Table 6-15: Summary of Tests for Cluster Identity and Demographic, Socioeconomic and Shopping
Behaviour Characteristics ................................................................................................................ 153
Table 6-16: Summary of Cluster Profile Based on Demographic- Socioeconomic Characteristic . 156
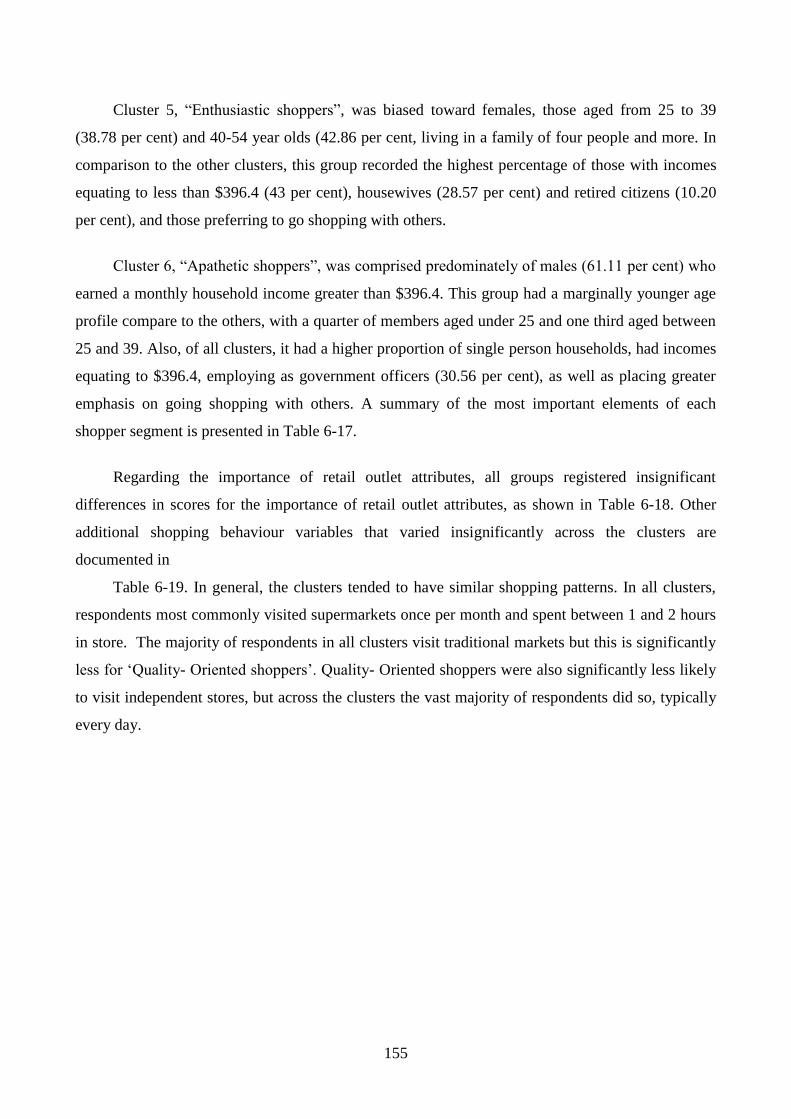
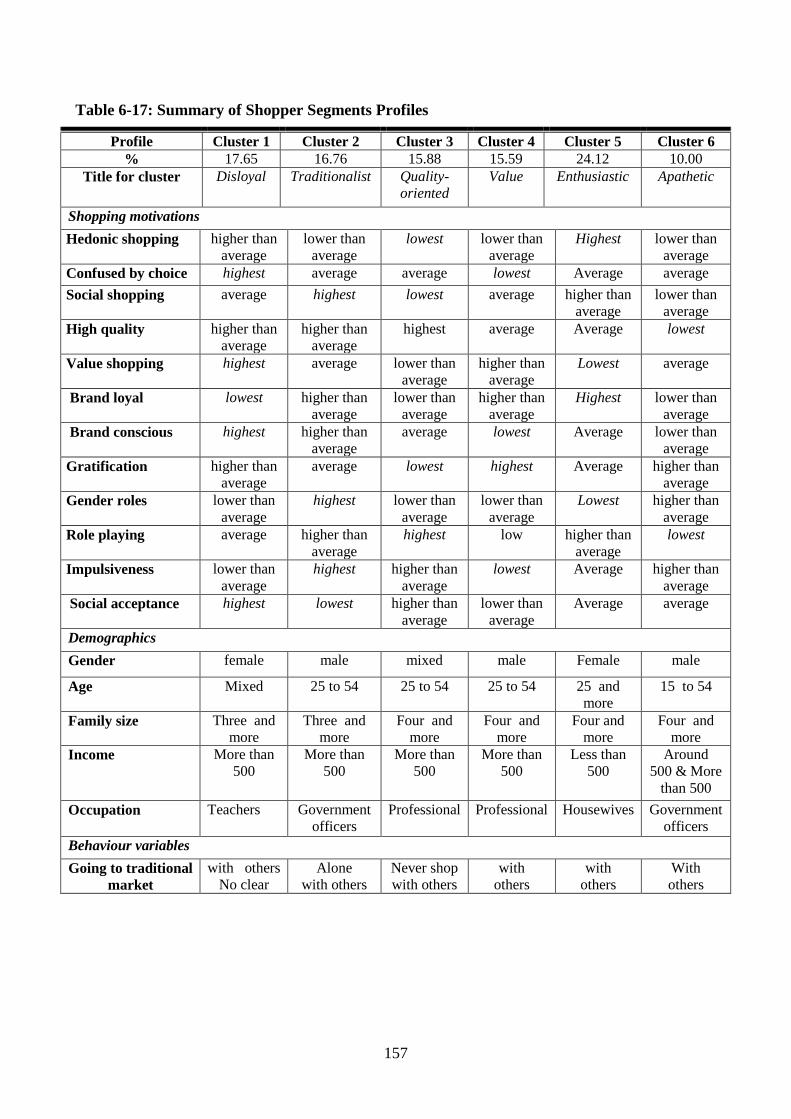
Table 6-17: Summary of Shopper Segments Profiles ...................................................................... 157
Table 6-18: Average Scores for Importance of Retail Outlet Attributes by Cluster ........................ 158
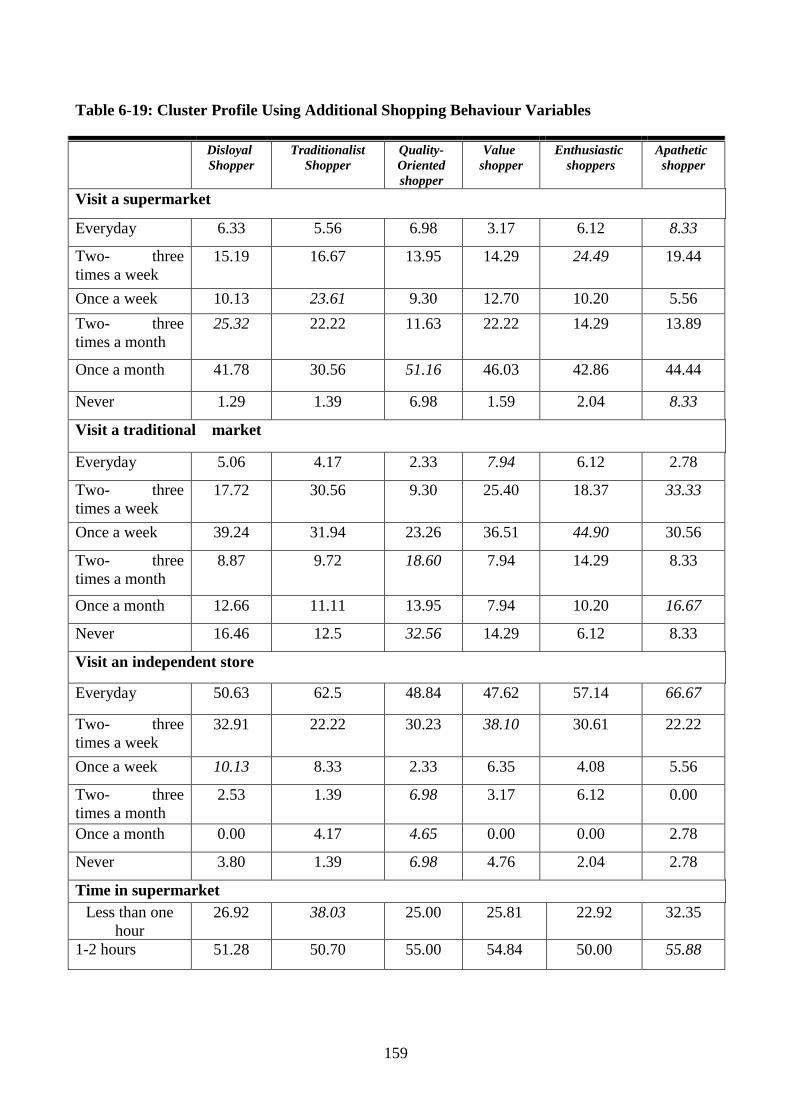
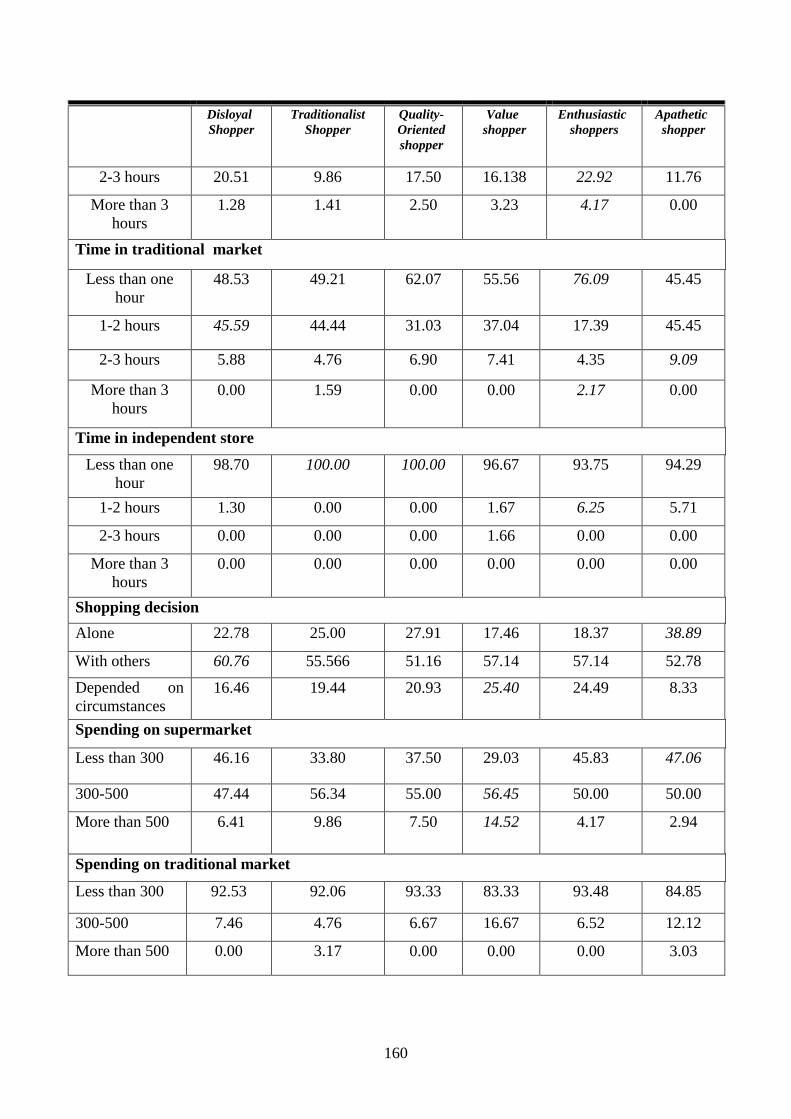
Table 6-19: Cluster Profile Using Additional Shopping Behaviour Variables ................................ 159
Table 6-20: Bootstrapped Ordered Probit Models ........................................................................... 163
Table 6-21: Bootstrapped Tobit Models for Percentage of Spending on FFV at Different Retail
Outlet ................................................................................................................................................ 165
Table 6-22: Bootstrapped Tobit Models for Percentage of Spending on Fresh Meat Accounted for
by Different Retail Formats ............................................................................................................. 166
Table 6-23: Bootstrapped Tobit Models for Percentage of Spending on Fresh Fish Accounted for by
Different Retail Formats .................................................................................................................. 167
Table 6-24: Bootstrapped Tobit Models for Percentage of Spending on Packaged Food Accounted
for by Different Retail Formats ........................................................................................................ 169
Page 15
xiv
Table 6-25: Bootstrapped Tobit Models for Percentage of Spending on Beverages Accounted for by
Different Retail Formats .................................................................................................................. 170
Page 16
1
Chapter 1 Study Background
1.1. Introduction
This introductory chapter is divided into ten sub-sections. The second section discusses the
background of the research, outlining the scope of the study. The Libyan context is then introduced
in the third section, followed by a statement of the research problem. The purpose and objectives of
the study are outlined in sections five and six respectively. Section seven provides an overview of
the study questions. Section eight outlines the significance of the study while section nine presents
an overview of the structure of the thesis. The final section summarises the main themes of the
chapter.
1.2. Research Background
Recently, much attention has been focused on consumer food shopping behaviour. In developing
countries, consumer food shopping behaviour has undergone rapid changes, because of many social
and economic factors. Understanding consumers and their shopping behaviour is vital for marketers
to develop marketing strategies. Marketing is a complex and multifaceted phenomenon because of
interlocking relationships with the various dimensions in society whether economic, political, and
social (Moreira et al., 2012). As a result, marketing outcomes are strongly correlated with
consumers (who represent the demand side) and producers (who represent the supply side). Both
consumers and producers, in turn, influence and are affected by economic, political and social
circumstances and conditions. In addition, governments also play an important role in shaping
marketing systems through their policies(Reardon et al., 2009).
Food marketing systems have been changing rapidly in the last 30 years. But this change is
not the same in all parts of the world. The food marketing system in the developed world altered
earlier and faster than the developing world. Developing countries have witnessed the rapid spread
of supermarkets, squeezing the market share of traditional small-scale grocery stores and food
markets in the early to mid-1990s (Reardon et al., 2007). This process is often labelled retail
modernization (Goldman et al., 2002). Modernization has, however, been geographically uneven,
with the penetration of supermarkets also varying by product category. In order to understand these
Page 17
2
changes some questions must be asked about when, how and why these changes happen. Moreover,
it is important to identify whether modernization has encountered success and acceptance in all
countries or not. To this end, previous studies in the relevant field were reviewed.
1.2.1. Modern Formats versus Traditional Formats
Over the last decade, the developing world has witnessed a rapid expansion of supermarkets and
modern distribution in the food-marketing sector, at the expense of traditional retail outlets. Much
previous research on developing countries (Goldman et al. 1999; Reardon et al. 2003; Cadilhon et
al. 2006; Reardon et al. 2007) and transitional economies (Dries et al., 2004) distinguished between
‘traditional’ and ‘modern’ food retail formats. Two theories are apparent. In the first theory,
traditional formats are thought to have enduring advantages, and this direction has been reported in
some Asian countries such as Hong Kong, Malaysia and Singapore (Goldman et al., 1999).
However, not all accept Goldman and his colleagues’ analysis. Reardon et al. (2007) argued
that modern retail formats in East Asia “took off” in the late 1990s whereas Goldman et al.’s (1999)
conclusions drew on data for the mid-1990s. Reardon et al. (2007 argued that they underestimated
the ability of supermarkets to develop rapidly and successfully in emerging markets.
Modern retail formats include hypermarkets, superstores, supermarkets and convenience
chains (Reardon et al., 2007). Cash and carry stores are also often included into modern retail, as
while formally belonging to the wholesale sector, “in most developing countries they de facto mix
retail and wholesale” (Reardon et al., 2007, p.400). Supermarkets are typically the most popular
modern retail format when measured by share of sales and have been the main focus of studies of
retail modernization (Goldman et al. 2002; Reardon et al. 2003). Traditional formats include
markets, often labelled wet or fresh markets, street stalls, and independent small-scale outlets which
may be specialists (e.g. butchers, bakers) or general stores (D'Haese et al. 2008; Goldman et al.
2002; Ho, 2005; Reardon et al. 2007).
1.2.2. Modern Retail Formats
There is no doubt that the retail food sector has been undergoing substantial change in developing
countries, with the rapid spread of modern retail formats. A plethora of studies document the spread
of supermarkets in developing countries, for instance in Costa Rica (Irene and Kiupssy, 2002);
Argentina (Gutman, 2002); Croatia (Reardon et al. 2003); Africa (Weatherspoon and Reardon,
2003); Kenya (Neven and Reardon, 2004; Humphrey, 2007); Madagascar (Minten et al., 2005);
Vietnam (Cadilhon et al., 2006); Nicaragua (D’Haese et al. 2008); China (Uncles and Kwok, 2009);
Page 18
3
India (Minten et al., 2010); and Thailand(Gorton et al., 2011). Notwithstanding a few notable
exceptions (Tessier et al., 2010; Amine and Lazzaoui, 2011), to date there has been little research
on the restructuring of food retail markets in North Africa. As Tessier et al. (2010, p.1417) note
“studies providing evidence regarding consumers’ motivations...with respect to the type of food
outlet for food shopping are rare in south Mediterranean countries”.
In his pioneering work, Goldman (1974) identified three sets of factors that influence the
adoption of supermarkets in developing countries: spatial, informational and social – cultural.
Spatial factors refer to transport costs and the ease with which goods can be carried back to the
purchaser’s home. Informational factors relate to the awareness of shopping alternatives and price
differences. Social and cultural factors, for Goldman (1974), refer to the emphasis on personal
relationships, empathy and social interaction. He argued that the adoption of supermarkets would be
limited as “low income consumers in developing countries tend to place a great deal of emphasis on
personal relationships with their retailers and shy from unfamiliar environments” (Goldman, 1974,
p.11). Adoption of supermarkets would also be limited where traditional markets and independent
stores are regarded as social centres where friends and neighbours meet. Samiee (1993) makes
similar points relating to the role of personal relationships.
In later empirical work, Goldman et al. (2002), distinguished between the diffusion of
supermarkets across consumer segments and product categories. Drawing on data for Hong Kong,
they identified positive relationships between supermarket adoption and the density of population
and car ownership. Negative relationships with the number of non-working adults in the household
and the purchase of perishable foods were also identified. Relationships with cultural factors were
not explicitly modelled. Their work on Hong Kong led Goldman et al. (1999, p. 126) to argue that
the penetration of supermarkets in East Asia would remain substantially below that in North
America and Western Europe, because of the “persistent competitive advantage of traditional food
retailers”. They asserted that traditional retailers possess cost advantages and are more suited to the
values of consumers in developing countries which they label “indifference to variety, quality,
service, shopping environment, emphasis on price” (Goldman et al., 1999, p. 128).
Reardon and Berdegué (2002) reported that modern retail formats can be divided into three
types: (1) hypermarkets that refer to stores with more than 50,000 square feet of floor space, and a
wide variety of food and non-food products, with extensive car parks; (2) supermarkets that refer to
Page 19
4
self-service grocery stores with between 3,000 to 50,000 square feet, which sell food, beverages,
and other goods with car parking provision and (3) convenience stores that can be considered to be
small self-service retail outlets with between 500 and 3,000 square feet in total selling area. The
most important characteristics of these formats are self-service sales of food and other goods that
are packaged and branded, with trolleys and /or baskets and a payment point. These can be
compared with traditional markets which are a group of individual stalls situated in an open space
within a street or a multi-story building. Traditional market retailers sell a wide variety of food
products, such as fruit, live seafood, poultry, vegetables. Sellers of related products are usually
grouped together in the same location, so that customers can easily compare the cost and quality of
goods being offered (Ho, 2005).
Regarding research on North Africa, Tessier et al. (2010) and Amine and Lazzaoui (2011)
studied food shopping behaviour in Tunisia and Morocco respectively. Evidence from Greater
Tunis (Tunisia) indicated that the use of supermarkets remains biased to wealthier and better
educated consumers. Consumers overwhelmingly shopped at both ‘modern’ and ‘traditional’ retail
outlets: only 4.2% of those sampled used supermarkets to the exclusion of all other formats. Amine
and Lazzaoui’s (2011) qualitative study of the use of hypermarkets in Rabat (Morocco) also linked
the use of “modern” retail formats to socio-economic status, with the authors interpreting the format
as offering the middle classes with a means ‘to differentiate themselves from the lower classes and
to express a sense of belonging and a unique social identity” (p. 570).
Recent research on the food shopping behaviour of citizens of Middle East explicitly
considered religious factors (Hino, 2010). Regarding religion, Hino (2010, p. 64) argued that “high
levels of religiosity can be indicative of a stronger sense of community, belonging, and commitment
to collective standards”. He hypothesizes that in Islamic societies, the requirement for Halal food
leads consumers to prefer traditional stores rather than supermarkets, as the Halal accreditation of
the goods stocked in the latter is questionable. Regarding ethnic-cultural factors, Hino (2010)
asserts that the importance placed on freshness, cooking and meal preparation in Arab culture leads
to a higher use of traditional formats. Econometric evidence supported the notion of positive
linkages between the use of traditional outlets and religiosity and ethnic-cultural variables. However
it is important to note that the unit of analysis in Hino’s (2010) study was the household and the role
of gender was not explicitly considered.
Page 20
5
1.2.3. Diffusion of Modern Retail
The spread of modern retail formats in developing countries may be classified into four waves
(Reardon and Berdegué, 2008): the first wave, “take off”, occurred in some states of East Asia
beyond China and Japan, South America, Northern-Central Europe and the Baltic States, and South
Africa in the early to mid of 1990s. The share of supermarkets in these countries has increased on
average from 10% to 60%. The second wave, which started with the end of the first wave, focused
on Mexico and much of Southeast Asia, Central America, and Southern-Central Europe. The rate of
increase in the contribution of supermarkets to food retail sales was about 55%. At the turn of the
millennium, the third wave took place in parts of Africa, some countries in Central and South
America, Southeast Asia and China and India and Russia. Currently the fourth wave is taking place
in West Africa where supermarkets are novel.
1.2.4. Why Modern Formats Spread Rapidly
Most of the studies conducted on this subject indicate that the factors that have led to the rapid rise
in modern formats in developing countries mirror the factors that underpinned their growth in
developed countries. According to several commentators (Neven and Reardon, 2004; D'Haese et
al., 2008; Reardon and Berdegué, 2008) the main drivers of this trend can be summarized as
following: demand-side factors which are considered the cornerstone of change in the marketing
system such as, urbanization; the rapid increase in real incomes per capita and its distribution and
the opportunity cost of women’s time. Supply-side factors, such trade liberalisation and foreign
direct investment, have also facilitated the spread of modern retail formats. In addition, the
modernization of supermarket procurement systems has also played an important role
(centralisation through distribution centres [DCs]; shift from traditional brokers to specialised
wholesalers; shift from sourcing via spot markets to using preferred suppliers; shift from local
procurement to regional sourcing; and development of private standards for quality and safety).
Moreover, governments may directly invest in modern retail; encouraging the spread of
supermarkets by offering some incentives and facilities. Examples of the latter include tax incentive
policies (tax exoneration for supermarkets) and the enactment of legislation in order to restrict the
development and growth of wet markets in South Korea (Reardon et al., 2012).
1.2.5. Implications of the Spread of Supermarket Sector
Proviso research highlighted (Irene and Kiupssy, 2002; Reardon and Swinnen, 2004) that modern
retail chains and the new procurement systems have a significant effect on other segments of the
agri-food system such as consumers, traditional retailers, and suppliers. The benefits of modern
Page 21
6
retailing may accrue to both consumers and to producers. Advocates argued that the shift to
supermarkets is consumer driven as they provide several advantages: good quality, the convenience
of self-service, which is considered an opportunity to hold and inspect the products, as well as low
price, which is very attractive to low-income consumers as retail modernization achieves cost
savings through economies of scale (Hagen, 2002).
This growth of supermarkets presents a big challenge to traditional retailers. However, a
challenge occasionally is necessary to achieve some positive results. For instance, the traditional
retail (wet market) in Hong Kong, which constitutes a major challenger to modern formats, has
survived by focusing on the weaknesses of modern markets, particularly in the marketing of fresh
food. This trend led to a counter theory, which posits that traditional formats have enduring
advantages.
1.2.6. Traditional Retail Formats
Several studies focus on traditional retail formats in developing countries (Goldman et al., 1999;
Goldman et al., 2002; Ho, 2005; Gorton et al., 2011). In many developing countries, traditional
retailers (markets and independent stores) are considered the major outlet delivering services that
are valued by many customers. This is not only because of some structural factors but also as a
result of a deep relationship with traditional customs and habits, which are integral to the culture
and history of each country. Usually, a wet market consists of many small vendors, each
specializing in one fresh food line (meat, fish, fruit, or vegetables) or in a sub-line (e.g., leaf
vegetables, exotic fruits) (Goldman et al., 1999). Retailers complement each other offering a full
variety of fresh food. As a result, a comparison between the prices and qualities of different goods
is possible and easy to make.
Even though, modernization researchers have shown the significance of the rise of modern
formats in both developing countries and South Asia, supermarkets’ share of fresh food sales is
notably lower than for non-perishables (Othman, 1987;Goldman et al., 1999). Many studies in
developing economies (Othman, 1987; Goldman et al., 1999; Goldman et al., 2002; Ho, 2005;
Gorton et al., 2011) have reported cases of supermarket failure as consumers continue to buy their
food in traditional formats. For example, in Hong Kong (Ho, 2005) wet markets remain dominant.
Rather than supermarkets setting the pace, they are adopting some of the characteristics of
traditional formats in an effort to improve their presence in fresh food markets (Goldman et al.,
1999).
Page 22
7
1.2.7. Arguments for the Superiority of Traditional Formats
A number of studies seek to explain wet markets’ continued strength compared against
supermarkets in fresh foods (Goldman et al., 1999; Goldman et al., 2002; Ho, 2005). In Hong
Kong, the supermarkets started to sell fresh food during the 1980s, and today all supermarkets carry
fresh food lines. In these supermarkets, the marketing of fresh food is characterised by a focus on
Western products, rather than Chinese products, and variety is relatively low.
Several factors were identified as the reasons for superiority of traditional formats in
developing countries (Samiee, 1993; Goldman et al., 1999): one reason is that their supply and
distribution system is more suited to the local market, enabling them to meet consumers’ needs by
providing higher levels of service, better quality products, and cheaper prices. Another reason is
consumers’ abilities and preferences (e.g., income, storage facilities, emphasis on price, frequent
store visits). A final reason is government attitudes and actions. The government may actively
support one of the formats while constraining the operation of another. Foreign owned retail chains
have found access to some developing countries difficult.
Goldman, et al. (1999) claimed that the superiority of wet markets in Hong Kong is based on
functional advantages in variety and service (ability to respond more effectively than supermarkets
to the particular fresh food needs of Hong Kong’s consumers). As well as providing consumers with
greater freshness in fish and meat items, Goldman et al. (1999) claimed they also offer cheaper
prices. This is because weak production and distribution systems raise the cost of supermarkets,
limiting their ability to compete on price. In contrast, according to Goldman and his colleagues
(2002), the strengths of supermarkets on convenience, variety, and cleanliness attributes are
regarded as relatively less important to Asian shoppers.
1.2.8. How Traditional Formats are Changing
In Hong Kong, in order to modernize, wet markets improve their shopping environments, following
two broad strategies. One method is a partial transfer modernization strategy. Modifications of
elements in the traditional formats, not their replacement, are at the centre of this strategy. These
elements are transferred from abroad either by foreign retailers purchasing local companies or
traditional retailers importing selected elements from modern retail formats. Another strategy is the
endogenous modification modernization strategy where no transfer from abroad is involved. Local
retailers respond to changes in local conditions by modifying and adapting their existing traditional
formats (Goldman et al. 1999; Ho, 2005).
Page 23
8
1.2.9. How Supermarkets Deal with this Challenge
The challenge is not easy for supermarket executives. In order to overcome this problem they are
forced to reformulate their strategies and develop new ones. Consequently, a repertoire of strategies
is followed: one strategy is to concentrate its commercial operations on products which the
supermarkets believe that they have a competitive advantage (e.g., fruit, chicken, Western
vegetables, pork) and conceding the most difficult products to the wet markets to deal with it (e.g.,
fish, seafood and Chinese vegetables...etc). Another strategy is that of imitation by mimicking the
feel of wet markets in supermarkets such as incorporating wet floors, live fish in aquariums, and
butchers cutting meat to consumer specifications. If modern formats need to be more successful
they must remove consumers’ perceptions that their fresh food is inferior. In actual fact, both
strategies represent an acknowledgment by the supermarket companies of the success and reliability
of wet markets, as argued by supporters of the theory that traditional formats having enduring
advantages (Goldman et al., 1999).
Supermarkets have already emerged in Libya especially, in the capital and other large cities.
Up to the present time, no such research on the spread of supermarkets has been undertaken in
Libya, and only a few studies specifically address the issue of food retail modernization in Arab
societies explicitly or implicitly (e.g., El-Adly, 2007; Alhemoud, 2008; Sohail, 2008; Hino, 2010;
Tessier et al., 2010; Amine and Lazzaoui, 2011) . Basic information about Libya is presented in the
next section. However, analysis is limited as there are no official publications concerning the retail
sector in Libya, for example documenting the number of food retail outlets, the number of
supermarkets and markets, food sales, retail sales, and foreign direct investment in retailing.
1.3. Background of Libya
In general, the marketing systems of developing countries have undergone massive change as a
consequence of, globalisation and the liberalisation of international trade. Furthermore, the
evolution of food retailing systems has been uneven due to variations in domestic economic
reforms. A number of questions must be raised about the developments in the marketing system in
Libya. Given the limited previous research, data sources and information on this domain, the focus
of the study and analysis of the situation without a doubt was challenging. On the other hand,
studying this emerging development was very interesting and stimulating.
Page 24
9
1.3.1. Location
Libya is the fourth largest country in Africa, covering 1.5 million km2 (Al-Hengari et al., 2007). It
lies on the north coast of Africa, adjoining the Mediterranean Sea. Libya is bordered by Tunisia and
Algeria to the west, Egypt to the east; and to the south are the Sudan, Chad, and Niger. Much of the
country lies within the desert.
1.3.2. Population
At present there is no reliable and up to date statistics regarding Libya’s population. A World Bank
(2011) report estimated that Libya’s population was approximately 6.4 million, with a growth rate
about 1.1%. About a half of the population is female (49.6%). According to the 2010 census, the
number of households was estimated to be 981,190 with an average size of 5.77 members (General
Authority for Information, 2010).
1.3.3. Culture
Libyan culture is structured around an Arab/Berber tribal system of society (Attir and Al-Azzabi,
2004). Tribes (qabila) are often broken into sections (bayt). Each bayt is, in turn, subdivided into
families, then branches into a number of smaller family groups (Najem, 2004). Libya has an
estimated 140 tribes, only about 30 of which are viewed as having any real significance.
1.3.4. Religion
The vast majority of the Libyan population are Sunni Muslims (Attir and Al-Azzabi, 2004). The
people are fundamentally attached to their Islamic faith. Therefore religion permeates all facets of
life. Thus Libyans differ from many Arab countries where there are more than one religion and
more than one rite. However, there were more than one million foreigners in Libya before the
revolution of 17th
of February 2011, many of whom belong to different Christian sects and to many
Indo-China religions (Attir and Al-Azzabi, 2004).
1.3.5. The Role of Women
In the first half of the 20th
Century, women in urban Libya were largely confined to their homes and
would not venture out without wearing the veil. While Libya’s constitution is one of the minority
of Arab nations that grants females equal rights to employment and education (World Bank, 2006),
there are still deeply-embedded socio-cultural norms that mean that women’s participation in the
labour force remains low (World Bank, 2006). For instance, in 2008 women accounted for only
22% of the workforce (World Bank, 2011), a figure unchanged from 1996 (Attir and Al-Azzabi,
2004). In part this reflects the primary importance of the oil industry in Libya, which is male
Page 25
10
dominated (Ross, 2008). The vast majority of working women in Libya (87%) are employed in the
public sector, particularly health and education (World Food Programme and FAO, 2011). In some
Libyan families it remains unacceptable for women to work away from the home. In these cases,
while food preparation remains a female activity, the male head of household typically undertakes
food shopping.
1.3.6. Social and Economic Restructuring
In the past decade, however, Libya has undergone rapid social and economic restructuring, which
has been apparent in the recent uprisings and revolutions in the wider Arab world (Gelvin, 2012).
From the late 1990s onwards Libyan government policy shifted to encourage private sector
investment and attract foreign capital. Between 2000 and 2010, Gross Domestic Product (GDP)
grew on average by 4.6 per cent per annum (International Monetary Fund, 2010). Changes in GDP
during the period 2000-2010 were documented in Table 1-1.
Supermarkets and fast food outlets are common in the capital and other large cities. Tripoli
and Benghazi, the two largest cities, possess several shopping malls. Social changes are also
significant. Over fifty per cent of the population is below 25 years of age, with young people often
enjoying lifestyles far removed from those of their parents. The role of women in household and
employment activities is also changing, with traditional boundaries being, albeit unevenly,
contested and transgressed (Elbendak, 2008).
Table 1-1: Gross Domestic Product (GDP), Current Prices during
(2000- 2010)
Years GDP1
0222 38.228
0222 34.074
0220 21.916
2003 26.431
2004 34.647
2005 44.031
2006 56.479
2007 71.603
2008 88.887
2009 60.238
2010 77.912
Source: International Monetary Fund (IMF) (2010).
1 Billions U.S. Dollars
Page 26
11
Given Libya’s level of GDP per capita, one would expect significant foreign direct investment
in the “modern” grocery retailing sector (Dries et al., 2004). Western grocery retailers such as
Walmart, Tesco and Carrefour, have invested substantially in emerging markets, motivated by the
“push” of saturated domestic markets and the “pull” of higher growth in currently underserved
foreign markets (Alexander, 1990; McGoldrick, 2002). However, the supermarket sector in Libya to
date remains entirely in domestic ownership. This reflects the restrictions on foreign direct
investment in the country and its uncertain political outlook both during the era of the Gaddafi
regime and its immediate aftermath (Emporiki Bank, 2012).
The Libyan economy depends primarily upon revenues from the oil and gas industry (Al-
Hengari et al., 2007). The non-oil manufacturing and construction sectors, which accounts for more
than 20% of GDP, has expanded from processing mostly agricultural products to include the
production of petrochemicals, iron, steel, and aluminium. By African standards, Libya has a high
level of GDP – equivalent to approximately $10,000 per person in the mid-2000s (United Nations
Development Programme, 2009). Incomes were boosted by high oil revenues. However, Libya’s
economy is underdeveloped compared to the oil exporting states of the Middle East (World Bank,
2006). The sentiment that Libyans failed to benefit sufficiently from the country’s energy resources
under the Gaddafi regime contributed significantly to the popular uprising. The effect of the
uprising on the economy varied geographically but, by and large, shops remained open with
supermarkets and traditional markets well stocked (Audley et al. 2011;World Food Programme and
FAO, 2011).
Many Libyan citizens joined the uprisings of 2011 and the country witnessed a popular
revolution in order to change the political and economic conditions that were in place for 42 years
under the Gaddafi regime. In the civil war period, the National Transitional Council that was
formed on 27th
of February 2011 to act as “the political face of the revolution” played the primary
role in the leadership of the state, with support from the tribal-based system (Gelvin, 2012). A
majority of countries recognized the National Transitional Council as the sole governmental
authority. This interim body governed Libya for a period of ten months after the end of the war.
Currently, the National Transitional Council has been replaced by General National Congress
which was elected on 7th
of July 2012. This body appointed a prime minister and cabinet, with Dr
Page 27
12
Ali Zeidan succeeding Dr Abdel Rahim Al- Keeb as an interim prime minister in October 2012.
However, Libya’s political future remains uncertain; the government and the General National
Congress are an interim body, in place only until elections are held in accordance with the country’s
new constitution (The United Nations, 2013).
1.4. Statement of the Problem
Libya is an emerging market that is currently attracting considerable international interest. A
number of global retailers are planning to enter this market or increase their investments, after the
opening of the door to foreign investment according to Foreign Investment Law No. (5) for the year
1997 on the promotion of investment of foreign capital, which was amended in 2006 and Law No.
(9) (2001) covering the organization of transit trade and free zones (Shamia, 2007 ). In addition,
Libya has been facing important economic and social changes since the end of the 1990s, the
influence of which is reflected at all levels, including patterns of food shopping behaviour.
Government policy also changed. Measures were introduced to promote restructuring programs,
encourage the private sector to participate seriously in economic life, attract foreign capital and
achieve economic growth and stability. To date the achievements have been modest, and
participation is less than the desired level, and the continued dominance of public economic
institutions is clear. Moreover, the changes in the marketing system are still unclear as well up to
now no evidence could be relied upon to analyse the situation.
Even though, some of the large European retail chains (e.g. Marks & Spencer) have a
presence in Libya, especially in the capital city of Tripoli, and a large number of modern retail
stores have emerged in recent years competing with traditional markets, there is a dearth of research
on this topic and it is yet to receive the attention it deserves. Consequently, there is a need to
examine consumer food shopping behaviour, addressing this gap in the literature by investigating
the specific situation in Libya. This study makes an important contribution to the existing literature
by extending our knowledge of food shopping behaviour to an Arab and North African background.
However, taking into account recent events, although the door is still open for foreign
investment in Libya, it would be a mistake not to recognise that the political and security outlook
for the country remains uncertain and that a number of factors will impact on the Libyan business
environment, in the aftermath of the revolution that took place in Libya in February 2011.
Page 28
13
1.5. Research Aim
The main aim of this study is to explore consumer food shopping behaviour in Libya. Although
there is an expectation that the Libyan shopper has several characteristics in common with non-
Libyans, they may have many distinguishing features and merit consideration as an independent
case. To this end, the main attention was paid to review the literature on Arab and developing
countries to better understand and develop the research’s empirical framework, as well as to focus
the study in the correct manner.
1.6. Research Objectives
The key issue of this thesis is to understand Libyan food shopping behaviour. Based on a review of
the literature, some specific objectives were identified as follows:
1. To explore the key determinants of consumer’s patronage of the three main retail formats in
Libya, namely traditional markets, modern supermarkets, and independent stores.
2. To identify the underlying factors that influence consumer food shopping motivations in
Libya.
3. To classify the consumers to segments, identifying the membership of each group on the
basis of food shopping motives, values and decision-making styles and, profiling them in
terms of food shopping behaviour, and demographic characteristics.
4. To identify whether there are differences between respondents in terms of patronage of
supermarkets, traditional markets, and independent stores in terms of demographic
characteristics and the identified image dimensions.
5. To identify the determinants of variations in expenditure across particular product categories
(fresh fruit and vegetables, fresh meat, fresh fish, packaged food, and beverages).
1.7. Research Questions
The research project sets out to answer a number of questions. The key questions are as follows:
1. What are the main factors that influence retail outlet formats choice in Libya?
2. What are the shopping motivations, values and decision making styles that drive
consumers’ patterns of food shopping?
3. What are the consumer segments that could be developed on the basis of food shopping
motives, values and decision-making styles?
Page 29
14
4. Do consumers differ in terms of patronage of supermarkets, traditional markets, and
independent stores across their demographic characteristics and the identified image
dimension?
5. How do consumers differ in their expenditure across selected product categories?
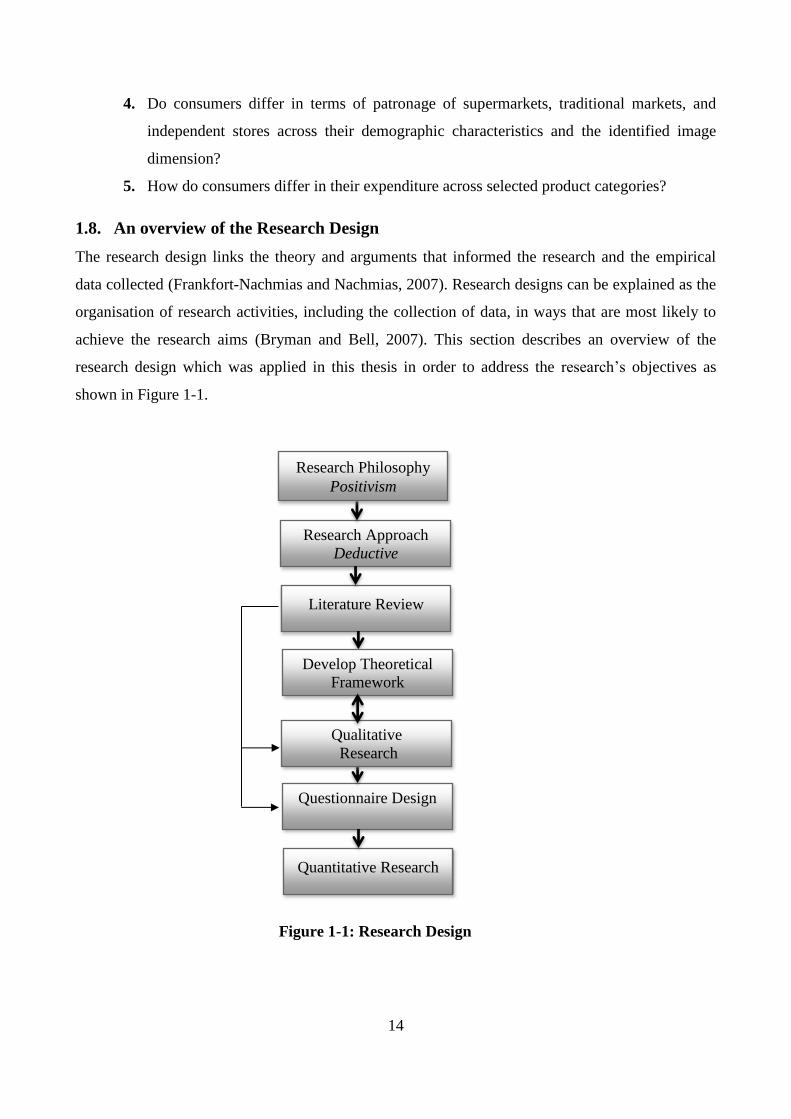
1.8. An overview of the Research Design
The research design links the theory and arguments that informed the research and the empirical
data collected (Frankfort-Nachmias and Nachmias, 2007). Research designs can be explained as the
organisation of research activities, including the collection of data, in ways that are most likely to
achieve the research aims (Bryman and Bell, 2007). This section describes an overview of the
research design which was applied in this thesis in order to address the research’s objectives as
shown in Figure 1-1.
Figure 1-1: Research Design
Quantitative Research
Research Approach
Deductive
Questionnaire Design
Literature Review
Research Philosophy
Positivism
Develop Theoretical
Framework
Qualitative
Research
Page 30
15
The research design assists researchers to draw a general outline for the collection and
analysis of the data of a study (Frankfort-Nachmias and Nachmias, 2007). In any attempt at
explanation, prediction and understanding of a phenomenon, the researcher should clearly declare
the assumptions and delimitations of the study. In order to conduct any research, it is therefore
important to consider some underlying philosophical assumptions about what constitutes valid
research and which, as a first step, research methods were appropriate for the development of
knowledge in a given study. Various factors were considered in formulating the research design.
Each stage of the research and its methodology was described extensively, including the procedures
for collecting the required data, in Chapter 4.
This study was within the positivistic paradigm of research philosophy with a deductive
approach to the collection and analysis of data. Positivism can be defined as “an organised method
for combining deductive logic with precise empirical observations of individual behaviour in order
to discover and confirm a set of probabilistic causal laws that can be used to predict general patterns
of human activity” (Neuman, 2010, p. 58). Hussey and Hussey (1997) noted that under a
positivistic paradigm the process is to study the literature to establish an appropriate theory and
construct a hypothesis. The theory, hypothesis and model in a study are derived from the literature,
with hypotheses tested using statistical analysis. The deductive approach was chosen for this study
because there is an existing, strong theoretically driven literature on consumer behaviour, on which
this research could be based.
The purpose of the research was to investigate which factors influence Libyan consumer food
shopping behaviour. In order to answer the research questions, a theoretical framework was
formulated from the existing literature. On one hand, having reviewed the literature in the field of
consumer behaviour, it was found that extensive work has been conducted, suggesting that this is a
mature area. On the other hand, however, little of this work focuses on non-Western markets and an
Arab context in particular. Therefore, this study will build on existing research by developing a
theoretical framework and empirically validating this framework in a particular context, namely
Libya.
The research took place in two stages, during which both exploratory and analytical research
approaches were undertaken employing mixed methods research. The first stage, which adopted an
exploratory research design, collected qualitative data to: clarify problems, elicit information about
consumer views regarding the topic at hand, refine questionnaire design and, construct research
Page 31
16
hypotheses for the following stage. The second stage adopted an analytical focus involving
statistical analysis, to quantify the relationships between variables.
The empirical part of the study, the research strategy chosen for this study was a mixed
method approach including qualitative and quantitative stages. A mixed method design can be
described as where the researcher combines quantitative and qualitative research techniques,
methods, approaches, concepts, or language into a single study. The goal of mixed methods
research is to draw on the strengths and minimize the weaknesses of both types of research
(Tashakkori and Teddlie, 2009).
Qualitative research was conducted as a preparatory step for the quantitative study in order to
get an initial understanding of Libyan consumer food shopping behaviour and to check that
concepts and survey questions taken from other countries fitted with the Libyan case. However,
collecting only qualitative data can be problematic, limiting the generalisation of findings (Saunders
et al., 2009). To overcome this, qualitative research was linked to a subsequent quantitative study.
A quantitative method was adopted in this thesis to test the validity of hypotheses derived
from theory. The main data collection technique was a self-administered questionnaire that was
developed for some constructs based on the exploratory interviews along with previous scales found
in the literature. Data were collected using a drop-off / pick-up survey method. In order to clarify
the questions and the appropriateness of the proposed scales both pretesting and a pilot study were
conducted. The sample technique and sample size used in the research were influenced by the
unrest in the place of study (Libya) as well as by the availability of the resources (Saunders et al.
2009), consequently, a non-probability sampling method was employed.
The Unit of Analysis
One important idea in a research project is the unit of analysis, since this is linked with the strategy
for data collection. The unit of analysis is the major entity to be analysed in a particular study. It is
the “what” or “who” that is being studied (Babbie, 2011). In social science research, there are
several units of analysis that are commonly used, including: individuals, groups, and organizations
(ibid). Regarding “who” that is being studied, this study investigates the factors that affect
consumer food shopping behaviour at the household level. Following previous studies, therefore,
persons who regularly purchased food and grocery items for themselves and/or their families were
identified as the unit of analysis.
Page 32
17
Concerning what is being studied, attention was paid to shopping motivations and decision
making styles, determinants of store patronage and choice between the three main formats including
traditional markets, supermarkets, and independent stores, and the average percentage of
respondents’ total spending on fresh fruit and vegetables (FFV), fresh meat, fresh fish, packaged
goods, and beverages accounted for by different retail formats. These five categories were chosen in
the light of the qualitative research findings. According to the interviews, the supermarkets
accounted for the majority of purchases of packaged foods while traditional markets were
frequented more for fruit and vegetables and fresh fish. Butchers as one type of independent store
accounted for most purchases of fresh meat. Not surprisingly, some other staple goods such as
bread, flour, and rice despite their importance in the food consumption pattern of the Libyan people,
were not mentioned specifically. This is mainly because they are supplied at subsidized prices in
consumer co-operatives and in bakeries for bread, and thus comprise a smaller percentage of family
income.
Choosing the Correct Statistical Test
The analysis of the data firstly dealt with the description of the data. Then, various statistical tests
were applied to analyse the data thoroughly taking into account differences in the nature of data and
the research objectives. The major techniques were factor analysis (including confirmatory and
exploratory analysis), cluster analysis, and econometric analysis including Probit and Tobit models.
1.9. Significance of the Study
The current study is one of the first empirical studies done on consumers in an Arabic culture (i.e.
Libya) dealing with consumer behaviour in an emerging market taking into account different types
of store formats. The vast majority of previous food consumer shopping studies were conducted
within a Western context. Answering the research questions documented in this chapter will help
retail managers and consumer researchers interested not only in Libya but also in other markets
with similar consumer lifestyles, cultural values, and retail market structures. Jamal et al., (2006)
argued that an understanding of the reasons consumers go shopping is important for retailer’s
strategic marketing activities, segmenting and understanding different consumer groups. Similarly,
effective communication with different consumer groups can be improved by developing a proper
understanding of shopping motives, perceived values, and decision-making styles.
1.10. Outline of the Thesis
For the purposes of the study this thesis was divided into seven chapters as follows: the current
chapter introduced the background of the study and the major themes to be investigated within the
Page 33
18
context under examination, providing some understanding of factors that shape shopping behaviour
in developing countries, the Libyan context and the aims of the study. In chapter two a review of the
literature on consumer shopping behaviour is presented, including a detailed assessment of the
factors influencing store choice. Chapter three describes the methodology (mixed qualitative and
quantitative approach). The latter involved survey based research undertaken in Benghazi during
summer 2011. The findings of the research are presented in the next two chapters. Chapter four
documents the findings of the qualitative study whereas chapter five presents the quantitative
research results. This is followed by a discussion of the results in chapter six. The major findings
and the main themes of the study, the policy implications and recommendations, and suggested
directions for future research, are documented in the concluding chapter of the thesis.
1.11. Conclusion to the Chapter
To sum up, modern retail formats have rapidly multiplied worldwide. Much research has been
conducted relating to this phenomenon from different angles. Two theories in the literature are
relevant. One is that consumers will switch to modern formats in developing countries while the
other argues that wet markets will retain an advantage. Both have evidence supporting their view.
Each format has its own methods to develop and adapt itself to competitors. Attracting the
consumer is the final goal for both of them. Several authors (Goldman et al., 2002; Uncles and
Kwok, 2009; Minten et al., 2010; Tessier et al., 2010; Amine and Lazzaoui, 2011; Gorton et al.,
2011) therefore attempt to identify the factors that explain variations in consumers’ supermarket
adoption, with most concentrating on economic variables especially incomes, population density
and private car ownership while some identify religious and ethnic-cultural as factors affecting the
structure of food retailing in developing countries (Hino, 2010). In general, the literature identifies
urbanization, increases in real incomes, and foreign direct investment as the main driving forces for
the spread of supermarkets whereas the ability to respond more effectively to consumer needs,
particular for fresh foods, is the main reason behind the survival of wet markets.
In Libya, the three most important formats are supermarkets, independent stores and
traditional markets. Even though there have been several initiatives to reform the Libyan economy,
the phenomenon of change in the food marketing system has not yet been addressed. Despite of the
severe lack of information sources, an attempt to shed light on the food retail sector in Libya is
presented in the next chapter.
Page 34
19
Chapter 2 Food retailing Sector in Libya
2.1. Introduction
Retailing, specifically food retailing, has been one of the most dynamic and rapidly changing
sectors in most developing economies, including in Libya. Business Monitor International (2012),
expect grocery retail sales in Libya to increase by 21.4 per cent in 2013, with up to 2017, compound
annual growth of 12.0 per cent.
To understand the current situation of the Libyan food retail market, it is necessary to
understand the economic reforms undertaken and their impact on the food retailing sector.
Particular attention is focused on the policy of privatization and the subsidy system. Both of these
have stimulated important changes in both the retailing system and Libyan consumer behaviour.
The purpose of this chapter is to provide an overview of the structure of food retailing in
Libya, highlighting the most important developments and issues. It provides information on the
history and marketing strategies of food retailing in Libya through an overview of the Libyan
economy and the most important policies that have directly or indirectly impacted on the sector, in
particular privatization and subsidy policies. At the end, an overview of the structure of the retail
industry in Saudi Arabia as one of the most developed, Arab, oil exporting countries is provided to
consider how Libya’s food retailing sector may evolve. According to the United Nations
Development Program’s 2013 Human Development Index (HDI), Libya was ranked 64th of 186
countries (behind Saudi Arabia (57th
) (Human Development Report, 2013).
2.2. An Overview of the Libyan Economy
After 1969, under the umbrella of socialist policies, the major economic policy objective of the
Libyan government was to reduce the country’s dependence on oil and foreign companies’ control
of its production and exports (Abdussalam, 2006). Through its General People’s Congresses (GPC),
the state established legislation to assume control of all educational and social activities, and the
organisation of economic sectors, investments, production, commercialization, and foreign trade.
For the last, the GPC announced that the government would take control of all import, export and
distribution functions, replacing privately owned businesses. As a result, by the early of 1970s the
Page 35
20
public sector expanded and became the main source of investment in Libya. As a result of this
policy, by 1990 private sector investments decreased from about 30 to 10 per cent of total
investment, and state investments increased from about 70 to 90 per cent (Antipolis, 2002). The
role of the government in economic activities gradually increased and the state became directly
responsible for all sectors of the economy and all aspects of social life. Regarding food retailing,
during this era, all privately owned shops were closed and a new system was established based on
state registered supermarkets (Malcolm and Losleben, 2004).
After two decades of reliance on the public sector, the government became dissatisfied with
the performance of the public sector and concluded that the inefficiency associated with the public
sector was higher than expected (Aboujdiryha, 2011). Thus, the Libyan government began to
change its policies, seeking greater private sector activity in the economy. A package of laws was
introduced such as Resolution No. 461 of 1987 to allow the private sector to practise some
commercial activities. Subsequently, the role of the private sector was confirmed in the field of
retail distribution of goods, under Law No. 8 of 1988. Later, the role of the private sector was
expanded by Act Number. 9 of 1992, which opened the door for the private sector to engage in
various business activities (General Planning Council, 2002). Foreign private investment in Libya
become possible after modifications to Investment Act Number 5/1997 (Shamia, 2007 ).
The effectiveness of these laws, however, remained limited, as they did not greatly stimulate
the private sector. This reflected the public sector’s continued monopoly in several areas which had
a negative impact on the willingness and capacity of the private sector to participate in economic
life. Administrative constraints and complex bureaucratic procedures also deterred the entry of the
private sector (Shernanna, 2012).
However, Libyan authorities encouraged the emergence of private operators by issuing law
Number 21/2001 which covered economic activities and the abolition of import licenses. They also
believed that many legal and administrative measures should be taken to stimulate the role of the
private sector in economic activity, especially in light of changes and new economic policies
adopted after 2002. Accordingly, in 2004, Act Number 21/2001 has been modified correspondingly
and Act Number 1 was issued concerning and redefining the practice of economic activities. This,
in 2004, was followed by the Resolution of the General People’s Committee No. 53 on the
executive regulation of Laws 21 and 1 (Shernanna, 2012). Under this legislation the private sector
Page 36
21
was permitted to engage in commercial activity through individuals, families, cooperatives, and
joint-stock companies. Moreover, in 2005, the General People’s Committee issued Resolution No.
34 permitting limited liability companies to conduct business, whether in exports, imports or
marketing (Shernanna, 2012). The process of privatization has, however, been slowed down by the
maintenance of subsidies on certain products, to the extent that today, they remain 90 per cent
subsidized and are distributed at extremely low prices (Audsley et al., 2011). To interpret recent
developments in Libyan food retailing, it is necessary to understand the process of privatisation in
the country.
2.2.1. Privatisation Policy
In Libya, three waves of privatisation have taken place since the mid-1980s (Aboujdiryha, 2011).
However, even though there were three attempts at privatization in Libya, efforts taken to improve
the performance of firms failed each time, reflecting the constraints that existed in each phase of
privatization. Moreover, the privatization law which was issued by the General People Congress to
regulate private sector businesses was only passed in September 1992 (Abokaresh et al., 2013).
The first wave of privatization in Libya began in 1987 as a response to a drop in international
oil prices in the mid-1980s. It introduced the concept of Tashrukiyya, collective ownership, that
allowed for the creation of co-operatives to which some partners contribute labour and capital
(Vandewalle, 1998). The Tashrukiyya system allowed limited private investments in Libya for the
first time since 1970S. The aim was to encourage the private sector to participate in the service and
light industry sectors as a means of overcoming the inefficiency of the public sector. Therefore,
only small scale private sector activity was allowed in retailing, service and light industries as
means of overcoming inefficiency in the sectors.
Following this first wave of privatisation, in the early 1990s, the government announced a
second wave which began in 1992. Again this was in response to the drop in oil prices in the early
1990s and the poor financial performance of many public sector firms in terms of low productivity.
It introduced the concept of Sharika Musahima (joint-stock company) (Aboujdiryha, 2011) and was
an effort to surpass the previous privatisation experience and stimulate the private sector
(Vandewalle, 1998). The programme aimed to liberalise wholesale trade and attract foreign
investments in response to international sanctions (Vanderwalle, 1998).
The third wave of privatization (Al Tamleek) began in 2003 and this was a large scale
privatization program. It was described as a programme of broadening the ownership base through
Page 37
22
encouraging residents to own public firms and avoiding concentrated ownership. The programme
also sought to make the country eligible for World Trade Organization (WTO) membership
(Abokaresh et al., 2013). In other words, the program aimed to restructure the Libyan economy
towards building popular capitalism through spreading share ownership more widely. It also aimed
to transfer the role of the state from the owner to encourager of economic activities.
2.2.2. Subsidy Program
For many years, Libya strongly subsidized consumers. The programme of subsidies covers basic
food commodities such as flour, rice, and sugar, which are imported by the National Supply
Corporation (NASCo) as well as non-food commodities such as petrol. Government subsidies on
foodstuffs fell considerably in 2000 and 2001, after the suspension sanctions, and increased
significantly after, particularly for flour and rice. The cost of subsidy system, by 2003, amounted to
3.5% of GDP (Abidar and Laytimi, 2005). Around 2003‐2004, responsibility for the subsidy system
transferred to a newly formed Price Stabilization Fund (PSF). This was followed by a period of
gradual economic liberalization beginning in 2007 that saw an increasing role for the private sector
in Libya’s food supply chain (Audsley et al., 2011).
However, the clearest disadvantage of the commodity subsidy program is that the products
subsidized are sold in neighbouring countries, initially in Tunisia where the population of the South
largely benefits from the products. In each big Tunisian city there exists a big market called “‘Souk
Libya or Libya’s Market”, in which is gathered a variety of smuggled Libyan products. Algeria also
profits through Tunisian borders. Another disadvantage is that bread is used for animal feed because
its price is very low (Afahama and AboShah, 2007). As a result currently, in Libya, there is a plan
to improve the food distribution system by changing the food subsidy system from commodities to
a cash subsidy. After this brief overview of the Libyan economy, the structure of food retailing in
Libya is presented in the next section. It is worth mentioning that there are no publications
dedicated to food retailing or supermarkets in Libya. As such, reliable food retailers’ sales data and
floor space figures are not readily available. Consequently, the next section relies heavily on
personal communications and the knowledge of the researcher.
2.3. Structure of Food Retailing in Libya
The food distribution sector in Libya is composed of a chain of distribution cooperatives, retail
networks, and commercial centres. Retail outlets are generally operated by small private businesses
of licensed individuals based on specific laws. Most products sold through retailers are imported by
Page 38
23
private importers. Since Libya re-joined the international community, more import businesses have
been established, and new stores opened in all cities.
The share of the food retail market controlled by modern retail is still relatively small. In
2009, total licenced food retail outlets in Libya amounted to 30,667 enterprises representing about
38.86 per cent of total licenced retail outlets, employing 61,731 people. The retail outlets accounted
for 78.87 per cent of the total licensed activities in internal trade. By using the number of full time
employees as a measure of size, those with less than 9 full time employees accounted for 98.4 per
cent of all retail establishments and there were only 480 enterprises with 9 or more full time
employees (General Authority for Information, 2013).
Tripoli in particular has witnessed shopping centre development. In 1999, there were roughly
1,838 licenced food retail outlets: 6 supermarkets and 1,832 independent stores (Chamber of
Commerce and Industry, 1999). By 2013, the total number of licenced food retail outlet had
increased to 7,244 representing about 13.82 per cent of the total licensed retail activities (Chamber
of Commerce and Industry, 2013). In the medium term, more foreign retailers are expected to enter
the market, enticed by a sector poised to expand more aggressively over the next decade displacing
traditional grocery shops. Political and economic changes that the country witnessed since the 17th
February revolution as well as increased per capita income and a growing urban middle class with
more sophisticated consumption patterns and shopping habits are all factors underpinning this on-
going transformation of the Libyan food retail landscape. The main types of food retail outlets are
detailed below.
2.3.1. The State Registered Supermarket (Popular Market)
Throughout the 1970s to the mid-1980s Libya only had a one type of food retailer - government
owned supermarkets. The establishment of state supermarkets resulted from the government’s
control of foreign trade and the retail sector. Very little is documented in the literature about state
registered supermarkets. All private retail stores were to be closed down and replaced by state
supermarkets. About 1,279 centralised supermarkets were opened in various parts of Libya with the
aim to meet the daily needs of Libyans consumers (Alafi and Bruijn, 2010). Figure 2-1 pictures one
of the state supermarkets in 1981 (Pargeter, 2012).
Page 39
24
Figure 2-1: Libyan State Supermarket in 1981
However, the state supermarket system, although, once seen as vital for eliminating private
traders and shop keepers, and as a source of subsidized goods for the population, suffered from
corruption and disorganization. Vandewalle (1998, p. 145) stated that “whatever sporadically
appeared in the popular market seldom matched Libya’s daily needs and became the source of
much anger and innumerable jokes”. This reflected the government’s monopoly and lack of
competition. As noted by Abdussalam (2006, p. 102) “the lack of competitiveness of these public
projects added insult to injury producing further deterioration in the balance of trade and a
continuing need for subsidies producing further deficits” . Black markets emerged to fill gaps in
inadequate state provision (Abdussalam, 2006).
In supporting Vandewalle, (1998), Malcolm and Losleben (2004) conclude that the state
supermarket system failed badly, it was poorly organized and political interference led to
bottlenecks in supply with basic goods being unobtainable. Moreover, given its heavy dependence
on oil exports, the Libyan economy was very vulnerable to external factors, especially fluctuations
in world oil prices (Aboujdiryha, 2011). Hence, during the mid-1980s, the Libyan economy was
severely affected by a fall in oil revenues which led to the cancellation of various economic projects
including the state supermarkets. In other words, because of declining oil revenues, the government
was unable to finance much of its ambitious drive to replace the private sector (Abdussalam, 2006).
In order to overcome to some of these financial difficulties the expansion of the state-run
Page 40
25
supermarket system was abandoned. Most of these supermarkets have been taken over and
transformed by private sector retailers.
2.3.2. Consumer Cooperatives (Jemiah store)
Consumer cooperative outlets were established according to a Resolution of the General People's
Congress in its second ordinary session in 1976 (Shernanna, 2012). A wide distribution network of
cooperatives buys food and processed commodities at subsidized prices. The Government pays the
difference between the market and subsidized prices. The consumer cooperatives serve only Libyan
nationals. Migrants are not entitled to subsidized food and have to pay full prices. Consumer co-
operatives are used by all Libyan families. They are considered an entitlement for all, not just a way
for the poor to access cheap food. This is because consumer cooperatives were the only source of
flour, rice, sugar, vegetable oil, and canned tomatoes which were not on sale elsewhere.
Each cooperative should have at least fifty members in order to be licensed and permitted.
Each Libyan family has a family booklet that enables it to purchase commodity rations at
subsidized prices in the cooperative where they are registered (FAO, 2011) . In other words, the
consumer cooperatives (Jemiah), or associations, operate as discount food retailers. Households
would present a “family book” that note the family size and would buy the corresponding
subsidized ration.
Distribution cooperatives are present in virtually all neighbourhoods. A quota system was
established to provide a specific quantity of products to each household in the area, usually once a
month. At the beginning, they provided not only essential food items, such as commodities
primarily based upon wheat flour and wheat products, but also other food items such as sugar,
canned milk and vegetable oil. Latterly, however, these cooperatives are still subsidised by the state
but with just essential food items such as wheat flour and rice.
Nowadays, some cooperatives extended themselves to become independent stores. They are
responsible for organising the supply of imported and non-imported products to consumers residing
in the neighbourhood along with the main task of providing subsidized merchandise to their
members and some of them just open when they receive subsidized goods, commonly once a
month.
Page 41
26
2.3.3. Independent Stores
As previously mentioned, the private sector is now permitted to engage in retail activities.
Independent stores are small stores located in both shopping and residential areas. They are
individually owned with typically no more than two employees. Independent stores can be
classified into two groups: grocery shops and specialized stores. Grocery shops, locally called
Dokan or Mahal, are found in every Libyan neighbourhood selling grocery items, dairy products
and staple products as well as sometimes fruits and vegetables as showed in Figure 2-2.
A typical outlet has a selling area of between 20 and 50 square meters. These outlets still
dominate the retail sector despite the growth of supermarkets. Both Libyan and non-Libyan citizens
can buy from such retailers.
Figure 2-2: Grocery Shop
Specialized stores as the name indicates, concentrate on one line of products such as fresh
meat and poultry (butcher) as can be seen in Figure 2-3. The latter are usually found in shopping
areas. The main attribute of this format is in-store credit - where the buyer can pay at the end of the
month, which is particularly attractive to low income consumers. The availability of in-store credit
depends on longstanding knowledge of customers.
Page 42
27
Figure 2-3: Specialized Store (butcher
2.3.4. Traditional Markets (Souk Shaabi)
A traditional market is a type of market where rural and urban households alike can buy fresh fruits
and vegetables, fish and seafood products as well as spices. Souks and street venders are the main
feature of traditional markets in Libya. Each souk consists of many small vendors, open air or
closed, however, all of them specialise in one fresh food line (fish, fruit and vegetables or spices
and herbs). Vendors complement each other by offering a full variety of fresh food. As a result, a
comparison between the prices and qualities of different goods is possible and easy to make.
Markets traditionally have attracted the largest number of shoppers in most towns of Libya. In
Libya traditional markets can be classified into three types: fruits and vegetables souk, fish market
(Souk El- Hout), and spices and herbs souk.
A fruits and vegetables souk may be an open air or closed market, locally called (Al- fondok
market), especially in Eastern part of Libya. An example of this retail outlet is presented in Figure
2-4. In Libya like many other countries, all cities have their weekly traditional markets (souk) such
as souk Al-Ahad (Sunday market), souk Al- Jumaa (Friday market), and souk Al-Thalat (Tuesday
market) that used to open on a particular day.
Page 43
28
Figure 2-4: Traditional Market (Fruits and Vegetables Souk)
A spices souk is a particular market for buying traditional herbs and spices as well as dry
groceries such as legumes. Usually, they are kept in large containers which are open for customers
to see and taste, and in the case of spices to smell as can be seen in Figure 2-5. This kind of market
is popular with Libyan shoppers, especially during Ramadan and for some special occasions, such
as weddings.
Figure 2-5: Traditional Market (Spices Souk)
Page 44
29
Souk El- Hout is one of the most active types of souk in Libyan coastal towns. It is usually a
big square dedicated largely to fish and seafood with ice keeping the products cool and fresh. Figure
2-6 shows souk El- Hout (fish market) in Tripoli and BanKina souk in Benghazi.
Tripoli Benghazi
Figure 2-6: Traditional Market (Souk El- Hout)
2.3.5. Modern Formats
In Libya, supermarkets are the main ‘modern retail’ format and can be divided into two classes (A
and B) depending on their size. Class A supermarkets are retail stores with more than 1,000 square
meters, five or more checkout counters with complete self - service, modern IT systems and carry a
wide range of grocery and other products. Class B supermarkets are smaller, using grocery carts
with up to 500 square meters of store space and two or more checkout counters. A considerable
number of Class B stores are found in all major urban areas and medium-sized cities in Libya. The
most popular local class A supermarkets in Libya are located in Souk Al-Thalat mall in Tripoli,
Benghazi shopping centre, and the Venesia supermarket in Benghazi.
Page 45
30
Souk Al-Thalat mall (Tuesday Market) is Tripoli’s newest shopping mall opened in 2008,
with five floors covering an area of 27000 square meters, of which 9000 square meters is a
shopping area and about 18000 square meters car parking. On the ground floor a large supermarket
along with a bakery and fruit and vegetable market hall can be found. The supermarket, covering an
area of 4500 square meters, is shown in Figure 2-7.The supermarket stocks a wide range of foods
with modern IT systems and 24 checkout counters, twelve on each side.
Figure 2-7: Souk Al-Thalat Mall
Venesia market is one of Benghazi’s supermarkets. It opened in 2010 and was redeveloped in
2012. It is one of the best stores in Libya with a strong reputation for the quality of food, vegetables,
meat and sweets. The store covers an area of 1000 square meters with five counters, along with a
bakery, fruit and vegetable department, butcher, cafe, and restaurant, using modern IT systems. It
employs 35 people. Some pictures are shown in Figure 2-8.
Page 46
31
Figure 2-8: Venesia Market
The Benghazi mall is one of the old state supermarket buildings that were bought by private
investors in 2002. It consists of five floors, employing 170 people (see Figure 2-9). The food
department is located on the first floor, covering an area of 2000 square meters, with 8 checkout
counters with modern IT systems. The supermarket stocks a wide range of foods.
Page 47
32
Figure 2-9: Benghazi Shopping Centre
To date, supermarkets in Libya are overwhelmingly domestically owned. However, some
foreign investors have started to enter the Libyan market. One notable new foreign entrant to the
Libyan market is Tunisia’s largest food retailer, Monoprix. They entered the Libyan market in 2013
beside Momento Italian coffee and restaurant chain and Cinnabon, an American bakery. Monoprix
is an affiliate of a French supermarket group and has planned to open many stores throughout Libya
(Libya Business News, 2013). Monoprix is a Tunis-based chain, which is separate from but linked
to the French company of the same name, has been brought to Libya in a joint venture with Husni
Bey Group, one of Libya's largest private-sector firms.
The first Monoprix store in Libya opened in Tripoli in March 2013. The store, employing 70
people, covers an area of 5.000 square meters, of which 3,000 square meters is a shopping area
called Almadrar mall, with six checkout counters and payment by cash only (see Figure 2 -10). A
second store will open in Tripoli in May 2013. The plan is to open one store every month. They
intend to eventually have 52 stores located in all big cities across the country, employing 4,000
people directly and another 4,000 indirectly (Libya Herald, 2013).
Page 48
33
Figure 2-10: Monoprix Supermarket
Finally, it is important to note that e-commerce is not well developed in Libya yet, especially
for groceries.
2.4. Expenditure on Food
In Libya, as in most developing countries, food expenditure represents a high percentage of total
household expenditure. Based on research carried out in 2011 by the FAO, on average, about 25 per
cent of household expenditure is devoted to food; about 17 per cent to transportation, telephone (13
per cent), utilities (20 per cent) and less than 1 per cent for health and education(see Table 2-1).
While 2011 was a year of crisis and upheaval, the share of expenditure accounted for by food was
little changed compared to pre-crisis levels. Rental expenses for the overall population are low,
because most Libyan people own their own houses (FAO, 2011) . The salience of research into
Libyan food shopping behaviour is high given that food is the single most important component of
family budgets.
The importance of food in household budgets has been relatively stable since 2002, based on
The Economic and Social Survey, part three (the Libyan household income, and expenditure data),
which was conducted by the official statistical agency of Libya, the General Authority for
Information. This possibly reflects the fact that the population has already reached an income level
Page 49
34
after which the quality of food consumed improves as income continues to rise, but the amounts or
type of food consumed do not vary significantly.
Table 2-1: Shares of Household Expenditure for Pre-Crisis and Crisis Periods
Source: Food and Agriculture Organisation, Emergency Food Security Assessment (2011)
2.5. Food Expenditure Patterns
In 2002, the most recent year for which there is information, total monthly household expenditure
on food was about 263.11 Libyan Dinar (Table 2-2). Meats, including red and white meat and fish,
and packaged foods were the most important categories by share of total food expenditure,
accounting for 29.49 and 27.37 per cent respectively. Fresh vegetables and fruits were also
important and accounted 17.49 per cent followed by subsidized goods with 8.71 per cent then
beverages (10.9 per cent). Finally, other foods accounted for 3.16 per cent and tobacco and
cigarettes for 2.84 per cent (General Authority for Information, 2002).
Largest Expenditure
Percentage of Monthly Expense
Pre-crisis 2011 (Crisis)
Food 25 25
Transportation, diesel for car or truck 15 17
Telephone communications 11 13
Gas, electricity, other cooking fuel 9 13
Soap, hygiene products 9 7
Water 9 9
Ceremonies (including funerals) 7 3
Health care, drugs 6 1
Clothing 3 2
Rental of housing 1 0.2
Debt or credit repayment 0.5 0.3
Removal of rubble 0.3 0.1
Schooling 0.1 0.1
Page 50
35
Table 2-2: The Relative Importance of Household Expenditure on Food Groups
Items Annual
Expenditure
Monthly
Expenditure
Per cent
Meats 931.06 77.59 29.49
Packaged Food 864.13 72.01 27.37
Fresh Vegetables and Fruits 552.18 46.01 17.49
Beverages 345.49 28.79 10.94
Subsidized Goods 275.07 22.92 8.71
Others 99.71 8.31 3.16
Tobacco and Cigarettes 89.74 7.48 2.84
Total 3157.38 263.11 100
Source: General Authority for Information, 2002.
2.6. Food Consumption Patterns
Based on FAO Food Balance Sheet calculations (FAO, 2013) , the average dietary energy supply
was 3157 kilocalories per person per day according to the latest data available (for 2009). The share
of vegetal products in total calorie consumption is relatively high by international standards (87.58
per cent) while the share accounted for by animal sources is relatively low (12.42 per cent).
In keeping with other Arab countries (El-Droubi, 2004; Dawoud, 2005), traditionally, eating
habits among all Libyan families are similar, with three regular daily meals. Lunch is the main meal
of the day. It usually consists of main dish as such rice or pasta, meat or poultry or fish, vegetables,
and fruits. Lunch is generally prepared and consumed in the home.
It is worth mentioning, that consumption patterns are slightly different from one area to
another depending mainly on geographical location, consumer’s preferences, and the level of food
production within the same region. For example, in the western region, that has high levels of home
production of olive oil, its consumption is relatively high and expenditure on this food item is low.
Also, in the western part couscous is most popular whereas rice is more common in eastern Libya.
In addition, fish is an important food commodity for consumers in areas near the sea such as Tripoli
and Benghazi but is much rarer in non-coastal cities.
Page 51
36
Notably, in all societies, urban food consumption patterns have witnessed rapid change
recently because of many social and economic reasons including urbanization and economic
openness that has led in turn to an increased consumption of fast food and ready meals, especially
among young people. Families can also eat at fast food restaurants, some of which provide special
services labelled “for families only”. Also, takeaways are playing an increasing role in food
consumption; however there is a lack of reliable data to quantify this trend.
2.7. Food Retailing in Saudi Arabia
While Libya has witnessed important changes in its food retailing sector, its structure remains far
more traditional than the Arabic speaking, oil exporting states of the Middle East. To consider how
Libya’s food retailing sector may evolve, it is useful to consider the case of Saudi Arabia. Saudi
Arabia is the largest retail market in the Arabian peninsula (Sohail, 2013). It combines both
traditional souks, small shops with rapidly expanding supermarket and hypermarket chains (Al-
Sudairy and Tang, 2000). Several major retailers are engaged in aggressive expansion plans in
response to changing consumers’ preferences and increased competition (Ahmed, 2012).
There are thousands of small traditional shops, such as grocery and convenience stores
(locally called bakalas) and bazaars (locally called souks) and markets that sell a narrow range of
products, particularly to low-income consumers ((Al-Sudairy and Tang (2000); Ahmed (2012)).
Recently, supermarkets and hypermarkets subsectors have become very important distributing high
value food products in Saudi Arabia compared to wholesalers and convenience stores which used to
dominate the sale of packaged food products (Ahmed, 2012).
2.7.1. Convenience Stores (Bakalahs)
Convenience stores (corner grocery stores), commonly referred to as bakalahs are found in every
Saudi Arabian neighbourhood. Al-Sudairy and Tang (2000) described Bakalas as a single man
operation with a floor area of about 20–50 square feet. Over 150,000 such stores were estimated to
operate all over Saudi Arabia (Al-Sudairy and Tang, 2000). They deal on a cash basis and purchase
most of their stock from wholesalers except for a few fast moving brands that are delivered by
importers. Ahmed (2012) asserted that despite the growing number of modern supermarkets in
Saudi Arabia, the food retailing role of bakalahs continues to be important. The neighbourhood
grocery stores are the main retail outlet for soft drinks, bread, bottled water and eggs (Zairi and Al-
Rasheed, 2010).
Page 52
37
Although, prices tend to be relatively higher in bakalahs, they have an advantage over
supermarkets by providing services to shoppers looking to quickly buy a few items. A number of
bakalahs have developed a credit system that allows customers to pay at the end of the month.
Ahmed (2012, p. 13) claimed that “women in Saudi Arabia are not permitted to drive and depend
on bakalahs within walking distance of their homes”. Also bakalahs are very important to third
country nationals working in Saudi Arabia who do not own automobiles. Most compounds housing
expatriates contain one or more corner grocery stores. Bakalahs are filled with many products
originating from the United States and most have refrigeration and the capacity to store frozen
foods. In addition to corner grocery stores, there are hundreds of ethnic stores in Saudi Arabia,
catering to Indians, Pakistanis, Filipinos, and other Asians (ibid).
2.7.2. Traditional Markets
There are both bazaars (souks) and wholesale markets. Bazaars traditionally have attracted the
largest number of shoppers in most towns of Saudi Arabia. These are places located in the centre of
each town or city, consisting of numerous small shops, often clustered on the basis of the type of
merchandise handled. The merchandise is basically commodities, cheap products, or counterfeit
brands catering mainly to the needs of buyers from lower socioeconomic groups (Sohail, 2008).
However, with increasing urbanization in the kingdom, traditional bazaars could no longer cope
with shoppers’ demands leading to the establishment of shopping malls, particularly in cities and
suburbs (ibid).
Traditional wholesale markets cover a large area and are divided by product category: a fresh
fruit and vegetable market; cold storage shops selling meats, cheeses, and poultry; and stores selling
a wide range of dry goods. The largest wholesale markets in Riyadh are the Utega Centre and
Rabwa (Ahmed, 2012). Wholesalers have store space ranging from 100 to 500 square meters. They
sell in bulk to institutional customers, caterers, bakalahs and large families. They offer some credit
facilities to selected institutional customers and retailers.
2.7.3. Supermarkets
In 2012, there were more than 300 Class A and 150 Class B supermarkets operating in Saudi Arabia
(Ahmed, 2012). Numbers are growing rapidly. The main factors that have contributed to the growth
of supermarkets include more exposure to the West via satellite television and travel, changing
lifestyles, and a craving by Saudi consumers for variety (Ahmed, 2012).
Page 53
38
2.7.4. Hypermarkets
Since 2004, a number of hypermarkets including international chains such as Géant and Carrefour
and local chains such as Panda have appeared in Saudi Arabia, mainly in large cities (Al-Saffy,
2009). The emergence of local and international chains in the same year has launched a new era of
retailing in the Kingdom. Hypermarkets have up to 100,000 square feet of selling space and stock
more than 55,000 items including foodstuffs, clothing, tools, toys, and electronics (Ahmed, 2012).
More than 60 hypermarkets were opened in the three major cites of Saudi Arabia (Riyadh,
Jeddah and Dammam) in 2012. These major hypermarkets have succeeded in attracting a significant
number of shoppers due to a wide range of product offerings, convenient location mainly in
shopping malls. Having made a presence in the Saudi market, Carrefour plans to open more than 20
stores by 2015 (Sohail, 2008).
Major Saudi owned supermarkets such as Panda, Tamimi, Al Sadhan and Danube, as well as
the French hypermarket Carrefour; import a significant percentage of dry goods directly from the
United States, employing consolidators whereas corner grocery stores and convenience stores
source their products locally from wholesalers. If Libya follows the pattern of Saudi Arabia it is
likely to witness increased competition between local and foreign chains based on larger stores and
diversified product offerings.
2.8. Conclusion
From 1969 to the mid-1980s, Libya pursued a socialist model of retail development. In the 1970s
state registered supermarkets (Popular Markets) sold non-subsidized food whereas the consumer
cooperatives (Jemiah) distributed subsidized goods. However, because of declining oil revenues,
the government was unable to finance much of its ambitious drive to replace the private sector. The
socialist experiment was also beset by inefficiency. Since the mid-1980s, there has been a
significant movement towards liberalisation, especially the privatisation of the state-owned
enterprises. Recently, after more than two decades of excessive reliance on the public sector, Libya
has pursued a strategy of privatisation. Thus, the Libyan food retail sector has witnessed
momentous change in the last several years, with the emergence of privately owned supermarkets.
Since Libya re-joined the international community, more import businesses were created, and
new stores opened, especially in large cities. Nowadays, the retail market in Libya is strongly
dominated by local shops and an informal sector of souks. Some small supermarkets and shopping
Page 54
39
centres are developing in the country; however, hypermarkets and online grocery retailing remain
absent. Most products sold through retailers are also imported by private importers except
subsidized goods that are still imported by the state.
In larger towns and cities, a considerable number of supermarkets are appearing: these are
small trading companies, offering food products (dry and fresh products), and household goods.
Large foreign retail chains have also shown an interest in the Libyan market. Monoprix is the first
internationally-branded food retailer to enter the Libyan market. In general, Libyan food
consumption patterns are similar to those witnessed in other Arab states. Food is a major
component of family expenditure.
However despite important changes in the Libyan retail sector, there is a clear lack of data. In
particular it was not possible to access food retailers’ sales data and floor space figures. Thus, to
overcome this problem, the chapter relies heavily on personal communications and the knowledge
of the researcher.
Page 55
40
Chapter 3 Literature Review
3.1. Introduction
In recent years, there has been increasing interest in consumer food shopping behaviour which
refers to “the process that underlies an individual’s decision of what, when, where, how, and from
whom to purchase goods and services” (Omar, 1999, p. 51). However, researchers still encounter
problems when trying to answer the question ‘How do customers make their shopping decisions?’
These difficulties may be due to rapid changes in consumer behaviour, which in many cases are
unexpected. Although economic theory typically assumes that the only significant variable to be
considered is price, in fact, consumer behaviour is complex with multiple phases and dimensions
(Omar, 1999). Shoppers are usually subject to many external and the internal (psychological)
influences which affect their shopping decisions.
A considerable amount of literature has been published on food shopping behaviour (e.g.
Darden and Reynolds, 1971; Darden 1980; Westbrook and Black, 1985; Boedeker, 1995; Geuens et
al., 2001; Ness et al., 2002; Arnold and Reynolds 2003; Ganesh et al., 2007;Webber et al., 2010),
which principally focuses on Western countries. Very little research has looked at non-Western
cases. A review of previous studies was a necessary initial step to identify influencing factors.
Particular attention was paid to the determinants of food shopping behaviour in developing
countries as well as in some key studies from Western countries. This may give a better
understanding about consumer food shopping behaviour as a consequence of similarities and
differences in cultural values, retail market structures, the economic and social environment and
other conditions related to the study’s subject matter. To be effective, the literature in the relevant
fields was reviewed by addressing consumer behaviour from different angles including: shopping
decision (shopping motivations and shopper typologies) and store patronage (store selection criteria
and store choice models).
This chapter is organized into three sections. The first begins by considering how consumers
make shopping decisions, by identifying some of the specific motives associated with shopping
activity and shopper typologies. Second, the criteria employed in choosing between stores are then
considered. Finally, models of store choice are presented.
Page 56
41
3.2. Shopping Decision
3.2.1. Motives for Shopping
People's motives for shopping are a function of numerous variables, which may be unrelated to the
actual buying of products. As background for examining the motivational underpinnings of
shopping, it is instructive to consider human motivation more generally. According to motivational
theorists, human behaviour typically can be regarded as the product of both internal need states as
well an external need (Westbrook and Black, 1985). Numerous attempts have been made to classify
the diversity of human motives (Maslow, 1970; McGuire, 1974).
One of the most influential theories of human needs has been presented by Maslow (1970),
which was initially developed in the 1940s. As indicated in Figure 3-1, the needs according to this
theory have been ranked in hierarchical order from the most basic or primitive through to the most
civilised or mature (McGoldrick, 2002).
Figure 3-1 : Maslow’s Hierarchy of Needs
Another a major study in the psychological literature was presented by McGuire (1974) who
identified a total of 16 fundamental human motivations, depending on whether the motives are
viewed as principally cognitive or affective in representation, self-growth or self-preservation in
purpose, active or passive in character, and external or internal in goal orientation.
Self-actualization
Esteem needs
Belongingness needs
Safety needs
Physiological needs
Page 57
42
The fundamental motivations underlying shopping behaviour have been discussed by
(Tauber, 1972). The latter argued that people go shopping not only to buy products, but also for
other, non-product-related, reasons. As a result, the way has been opened for researchers to pay
attention to the primary motivations that determine shopping activity, rather than simply assume
that need to purchase products is the only, or even the main, reason for shopping (McGoldrick,
2002). Tauber (1972, p.46) reported that:
“People's motives for shopping are a function of many variables, some of which are
unrelated to the actual buying of products. It is maintained that an understanding of
shopping motives require the consideration of satisfactions which shopping
activities provide, as well as the utility obtained from the merchandise that may be
purchased. If needs other than those associated with particular products motivate
people to go to a store, the retailer should incorporate this information into his
marketing strategy”.
According to Tauber’s study, shopping motivations can be divided into two types of hidden
motives: personal and social motives.
Personal motives
Role-playing motive: reflects activities that are learned and are expected as part of a
certain role or position in society such as mother, housewife, husband or student.
Diversion: shopping can offer opportunities to the shopper to escape from the routines
of daily life and therefore, represents a type of recreation and leisure activity.
Self-gratification: the shopping trip may be to alleviate depression, loneliness and
boredom as shopping can improve consumers’ mood by spending money and buy
something good.
Learning about new trends: people may go shopping to see new fashions, styling and
product innovations as well to obtain new ideas.
Physical activity: shopping can provide people with a considerable amount of walking
in spacious and appealing retail centres, particularly those who live in urban and
crowded environments.
Page 58
43
Sensory stimulation: highlights the ability of retail institutions to provide many
sensory benefits to consumers such as a pleasant background (light, colour, music the
scents) and handling of products.
Social motives
Social experiences outside the home: shopping represents an opportunity for meeting
people and social interaction especially in traditional markets.
Communication with others having similar interests: when people shop for hobby-
related goods it may provide the opportunity to meet and communicate with other
shoppers who have the same interest.
Peer group attraction stresses consumers’ desires to be with their reference group.
Status and authority: reflect shopping’s ability to provide opportunities for consumers
to command attention and respect from others.
Pleasure of bargaining: for many shoppers, bargaining is a degrading activity whereby
haggling implies that one is “cheap”. Others, however, appear to enjoy the process
believing that, with bargaining, goods can be reduced to a more reasonable price.
Various researchers have extended Tauber’s (1972) work on consumer’s shopping behaviour.
For example, Westbrook and Black (1985) tried to link Tauber’s (1972) framework to the typology
of 16 basic human motivations that was noted by McGuire (1974), suggesting that shopping
behaviour arises for three fundamental reasons: to acquire a product, to acquire both a desired
product and provide satisfaction with non-product-related needs, or to primarily attain goals not
related to product acquisition.
These fundamental shopping motives can be divided into seven categories (Westbrook and
Black, 1985): anticipated utility of prospective purchases; enactment of an economic shopping role;
negotiation to obtain price concessions from the seller; choice optimization; affiliation with
reference groups; exercise of power and authority in marketplace exchanges; and sensory
stimulation from the marketplace itself. While all motivations can be described as containing both
hedonic and utilitarian elements, Westbrook and Black (1985) noted that some were more utilitarian
in nature while others were more hedonic in nature.
Page 59
44
Furthermore, according to Arnold and Reynolds (2003), by focusing on motivations that are
primarily hedonic and non-product in nature, six hedonic shopping motives can be identified: (1)
Adventure shopping which refers to shopping for stimulation, and adventure. (2) Social shopping
which refers to the enjoyment of shopping with friends and family, socializing, and connecting with
others. (3) Gratification shopping which refers to shopping for stress release, to alleviate a negative
mood, and shopping as a special treat to oneself. (4) Idea shopping refers to shopping to keep up
with trends and new fashions, and to see new products and innovations. (5) Role shopping refers to
shopping for others. (6) Value shopping relates to, looking for discounts, and hunting for bargains.
Jamal et al. (2006) investigated the reasons why consumers shop in Doha, Qatar. Four
hundred supermarket shoppers completed self-administered surveys regarding their attitudes toward
57 individual shopping motivation items. By applying factor analysis the findings revealed that
gratification seeking, social shopping, high quality seeking, confused by over choice, value seeking,
brand loyal, brand consciousness, utilitarian shopping, hedonic shopping and role playing were
found to be the significant factors in explaining shopping motivations within an Arab state.
However, the study did find support for some other potential motivations (adventure shopping,
impulsiveness and novelty seeking).
Kaur and Singh (2007) applied factor analysis to identify the underlying purchase decisions
motives for young people in India. The analysis yielded an eight-factor solution with the factors
labelled as follows: (1) Hedonic shopping motive: this factor suggests that the main driver for
shopping is personal and social reasons unrelated to the actual consumption criteria including
rational/convenience motives. (2) Market maven: the factor suggests that respondents prefer to visit
the shopping place to escape from daily routines, and may be to reduce fatigue. (3) Peer group
association: reflects the instinct in these consumers to stay associated with friends while going on a
shopping trip or to meet at a particular shop. (4) Utilitarian shopping motive: the factor structure
suggests that people who tend to go out shopping only with an exact intention of buying specific
product(s), at the same time generate plans for future purchases and their shopping activity is
affected by noisy surroundings. (5) Status conscious personal shoppers: look for discounts available,
but dislike bargaining directly. They do not like to shop with family members or play the role of a
shopper for the whole family. (6) Recreational shopping motive: they tend to act as leisure shoppers.
(7) Impulse shopping motive: shopping is based on sensory stimulation such as a pleasant odour,
making quick / impulse purchases or buying for the reason that one has been to the market. (8)
Page 60
45
Economic shoppers: make a purchase only after comparing prices and state that they are unaffected
by environmental cues or sensory stimulants such as background music or the feel of products.
Ahmed et al. (2007) assessed consumer behaviour in regard to shopping malls in a non-
Western context (Malaysia). The results revealed that Malaysian students were motivated to visit
malls primarily by the interior design of the mall; products that interested them; opportunities for
socializing with friends; and convenient one stop shopping. Further analysis indicated that younger
respondents had more favourable dispositions or shopping orientations towards malls than older
respondents (Ahmed et al., 2007). The authors concluded that in general, Malaysian shopping
motivations were similar to that observed of Western shoppers in prior shopping studies.
Nguyen et al. (2007) sought to examine the roles of hedonic shopping motivations (HSM) and
supermarket attributes (SMA) in the loyalty of shoppers (SLO) in Vietnam. A two-step approach in
structural equation modelling (SEM) was employed to analyse the data. Confirmatory factor
analysis was used to validate the measures and SEM was used to test the theoretical model. Both
hedonic shopping motivations and supermarket attributes were found to have positive effects on
shopper loyalty. However, supermarket attributes were found to be a key factor that underlies the
loyalty of shoppers compared to that of hedonic shopping motivations. The results provided
evidence of the important role hedonic motivations play in relation to the loyalty of shoppers.
Shoppers driven by hedonic motivations paid more attention to the quality of supermarket
attributes, and therefore, are more likely to be loyal customers. In addition, the findings revealed
that the role of HSM motivations in supermarket loyalty were different between younger and older
shoppers as well as between lower and higher income groups of shoppers. However, no difference
was found between female and male shoppers. The study, however, was limited in that the sample
comprised only students.
A recent qualitative study of the use of hypermarkets in Rabat (Morocco) by Amine and
Lazzaoui (2011) also linked the use of modern retail formats to socio-economic status, with the
authors interpreting the format as offering the middle classes with a means “to differentiate
themselves from the lower classes and to express a sense of belonging and a unique social identity”
(p.570). The findings indicated that for the upper and middle class shopping in hypermarkets was
principally a utilitarian task with a small allocation of time dedicated for this activity. Moreover, for
these customers, the hypermarket would be an ideal store in order to minimise time spent on a
Page 61
46
shopping trip. However, for lower classes hypermarkets were considered as relaxing and strolling
environments. In other words, they usually went there with family, not necessarily shopping, but for
entertainment and to roam around to discover what is in these large stores. They usually went to all
the shelves to find cheap items and dropped prices. However, although, there are many conceptual
bases that might inform shopper typologies, repeated studies now identify a fairly consistent set of
underlying shopping motivations.
3.2.2. Shopper Typologies
Taxonomies of retail shoppers provide a basis for understanding the varying motivations behind
shopping decision (Arnold and Reynolds, 2003). The development of shopper typologies is well-
established and an extensive number of studies have been published (Stone, 1954; Darden and
Reynolds, 1971; Darden and Ashton,1974; Williams et al.,1978; Westbrook and Black, 1985;
Lesser and Hughes, 1986; Boedeker, 1995; Geuens et al., 2001; Anić and Vouk, 2005; Jamal et al.,
2006; El-Adly, 2007; Ganesh et al., 2007; Anic et al., 2012).
Grouping shoppers in particular segments may help marketing managers identify and promote
a shopping experience that will drive shopping value and create potential for patronage. Different
psychographic statements and analytic techniques have been used. The structures of such typologies
were largely determined by empirical observation of shopping motivations including recreation,
experience and convenience and shoppers’ attitudes focusing on time orientation, incomes,
lifestyles, psychographics characteristics and demographics. A considerable number of taxonomies
of shoppers are also based upon actual patronage behaviour, and retail attribute preferences as well
(Boedeker, 1995). Accordingly, a brief review of the various studies is useful in appraising current
knowledge of shopper types. This review is summarized in Table 3-1.
One of the first typologies was developed by Stone (1954), who was interested in
understanding the social relationships binding urban residents to the community. Four fairly distinct
groups of shoppers were discerned based on consumers’ attitudes towards shopping using depth
interviews with a sample of 124 female department store shoppers. The first was economic shoppers
who looked for value for money and quality predominately. The second segment was labelled
personalizing shoppers because they gave significant attention to interaction and personal
relationships with retail personnel. Ethical shoppers appeared to seek types of products compatible
with personal ethical standards. In other words, this group in contrast to economic shoppers tended
to sacrifice lower prices and wide selections of goods in order to behave consistently with moral
Page 62
47
beliefs. Finally, apathetic shoppers considered shopping as an onerous chore because they were not
interested in the whole process.
Since Stone’s seminal work, numerous empirical studies have been conducted and many of
these studies have attempted to develop typologies (Darden and Reynolds, 1971). The latter
investigated general consumer shopping orientations in relation to health and personal care products
and largely the results mirrored those of Stone (1954).
Regarding shopping typologies linked to grocery shopping, several studies have been reported
in the literature. Darden and Ashton (1974) presented psychographic profiles of patronage
preference groups. In particular, this study considered suburban housewives who were personally
interviewed and asked to respond to a self-administered questionnaire. Both factor analysis and
cluster analysis were applied to the resulting dataset. Seven segments of shoppers were reported in
this article that was hypothesized to relate to select supermarket attribute preferences. The specific
shoppers types identified were (1) Apathetic shopper, who did not express preference for any
supermarket attributes;(2) the Demanding shopper, who insisted almost on all considering
attributes; (3) Quality shoppers, who gave the greatest importance to freshness and the quality of
products; (4) The Fastidious shoppers, who preferred tidy, hygienic stores; (5) Stamp preferring
shopper, who preferred supermarkets offering trading stamps; (6) convenient location shoppers,
whose essential characteristic was that supermarkets required merely to be conveniently located; (7)
Stamp hater shopper, who was in the contrast to the stamp preferer shopper. However the attributes
considered in this study were not exhaustive and focused only on supermarkets.
Williams et al. (1978) also, developed a typology of grocery shoppers based on consumers'
involvement with either the price policies or customer service policies of retail food stores.
Analysing the data by applying cluster analysis on the store image evaluations of 298 grocery
shoppers in Salt Lake City (USA), four types of shoppers were identified. The names applied to the
four groups were the Involved, Apathetic, Convenience, and Price shoppers. The involved shoppers
were highly concerned with both price policies of the stores and consumer service; Apathetic
shoppers in contrast were unconcerned with both dimensions. The other two groups (convenience
and price shoppers) also tended to show opposing store images, whereby convenience shoppers
were more concerned with consumer service but unconcerned by the pricing policies of the stores
whereas price shoppers were highly concerned with the price policies of the stores but unconcerned
by consumer service.
Page 63
48
Table 3-1: Summary of Shopper Typology Studies
Author and
Date
Shopper
Population
Sample
Size/
Technique
Measurement
Basis
Shopper Type
Stone (1954) Female
department
store shopper
(Chicago)
124
In person,
depth
interview
Depth interview 1. Economic
2. Personalizing
3. Ethical
4. Apathetic
Darden and
Reynolds
(1971)
Female heads
of households
(Athens,
Georgia).
167
A self-
administered
questionnaire
AIO statements
1. Economic
2. Personalizing
3. Moralistic
4. Apathetic
Darden and
Ashton (1974)
Female
supermarket
shoppers
116
A self-
administered
questionnaire
Store attribute
preferences
1. Quality oriented
2. Fastidious
3. The stamp preferer
4. The stamp hater
5. Demanding
6. Convenience
7. Apathetic
Williams et
al., (1978)
Adult grocery
shopper
(Salt Lake,
USA)
298
Personal
interviews
Store semantic
differentials
1. Low price
2. Convenience
3. Involved
4. 4. Apathetic
Westbrook
and
Black(1985)
Adult female
(USA)
203
Personal
interviews
Shopping
motivation
1. Shopping process involved
2. Choice optimizing
3. Apathetic
4. Economic
5. Average shopper
Lesser and
Hughes
(1986)
(Heads of
households,
female or male)
(USA)
5813
Telephone
interviews
Psychographic
statements
1. Inactive
2. Active
3. Service
4. Traditional
5. Dedicated fringe
6. Price shoppers
7. Transitional
Boedeker
(1995)
Households
(Turku,
Finland)
1475
A self-
administered
survey
Psychographic
characteristics
1. New type
2. Traditional
Geuens et al.
(2001)
Consumers
(Belgium)
(8) focus
groups
consisting of
(9)
Shopping
motivation
1. Convenience
2. Low-price
3. Social
4. Experiential
5. Recreational
Page 64
49
Author and
Date
Shopper
Population
Sample
Size/
Technique
Measurement
Basis
Shopper Type
Arnold and
Reynolds
(2003)
Consumers
(female or
male)
USA
266
In person, depth
interviews
Shopping
motivation
1. Minimalists
2. Gatherers
3. Providers
4. Enthusiasts
5. Traditionalists
Anić and
Vouk (2005)
Grocery
consumers
(Croatia)
243
A self-
administered
questionnaire
Store patronage
motives
1. Location-driven
2. Involved
3. Price-driven
4. Convenience-driven
Bourlakis. et
al. (2006)
Grocery
shoppers
(Tessaloniki,
Greece)
535
Face to face
interviews
Store attribute 1. Price sensitive variety
seeking
2. Apathetic
3. Enthusiastic loyal, quality
and variety seeking
4. Indifferent loyal habitual
Jamal et al.,
(2006)
Supermarket
food and
grocery
shoppers
(Doha, Qatar)
400
A self-
administered
survey
Shopping
motivations,
shopping
value and
decision-making
styles
1. Socializing
2. Disloyal
3. Independent perfectionist
4. Escapist
5. Apathetic
6. Budget conscious
El-Adly
( 2007)
University staff
(United Arab
Emirates)
404
A self-
administered
Questionnaires
Mall
attractiveness
image
1. Relaxed
2. Demanding
3. Pragmatic
Ganesh et al.,
( 2007)
Shoppers
Traditional
mall (USA)
832
Mall intercept
survey
Store attribute
and
Shopping
motivation
1. Apathetic
2. Destination
3. Bargain seekers
4. Basic
Anic et al.
(2012)
Young
consumers
(Bosnia and
Herzegovina)
600
A self-
administered
survey
Decision-
making styles
1. Impartial, middle ground
2. Fashion-oriented,
hedonistic
3. Traditional, pragmatic
4. Hedonistic
5. Confused by over choice,
perfectionistic
Lesser and Hughes (1986) identified seven different shopping segments in the U.S. using
factor analysis. The segments were (1) Inactive shoppers: the most important characteristics of this
category were that they were disinterested in shopping, not concerned about price, employee service
or product selection and they preferred retailers who can make their shopping less complicated. (2)
Active shoppers: price, enjoyment of shopping, dealing with retailers with an upper middle class
Page 65
50
appeal, and an interest in exclusive products are the most important features of this group. (3)
Service shoppers: demanded a high level of service when they shopped regardless of the price. They
seek convenient stores with friendly personnel and helpful employees. (4) Traditional shoppers
were uninterested in shopping, were not particularly price sensitive and did not have other strong
shopper requirements (5) Dedicated fringe shoppers: in general, seemed to like change and risk
trying new products and new ways of shopping, but do not pay attention to brands and are not loyal
to one store. (6) Price shoppers: constantly seek to obtain the lowest price by tracking
advertisements to find bargains. (7) Transitional shoppers: quick decision-making was the main
feature of this group if the product is available without regard to the price.
Boedeker (1995) segmented consumers into ‘‘new type shoppers’’ and ‘‘traditional
shoppers”. These types were derived by cluster analysis using the factor scores obtained from factor
analysis. New type shoppers refer to those consumers who simultaneously value both the
recreational and economic / convenience characteristics of a retail outlet. Compared to traditional
shoppers they were more active shoppers, and did not pre-plan their purchases. In contrast, desire
for the recreational aspects of shopping was much lower for traditional shoppers. They buy pre-
planned products and avoid impulse purchases, not daring to buy new products before others, and
tend to compare prices and look for bargains.
Geuens et al. (2001) by employing a qualitative research method, focus groups, indicated that
shoppers could be classified into six different segments based on three factors including time
poverty, social needs, and experiential needs. Time poverty refers not only to the amount of time
consumers are able to spend on grocery shopping, but also to the amount of time they are willing to
devote to it. Some respondents who were objectively not time pressured (e.g. part-time employment
and no kids), had an active lifestyle and preferred doing other things rather than grocery shopping.
Some people were looking for social interactions with peer groups and/or preferred to engage in
social relationships with store personnel, while other consumers were not looking for social contacts
during grocery shopping. Experiential needs reflect the extent to which the consumer looks for
sensory gratification and/or his or her desire for new experiences such as new retail forms, new
stores, and/or new products. From these factors the six identified clusters were: (1) convenience
shoppers (time-poor, no social nor experiential interest), (2) low-price shoppers (time-rich, neither
social nor experiential interest), (3) social shoppers (time-poor, social but no experiential interest),
Page 66
51
(4) intense social shoppers (time-rich, social but no experiential interest), (5) experiential shoppers
(time-poor, experiential interest), and (6) recreational shoppers (time-rich, experiential interest).
Anić and Vouk (2005) identified four different types of shoppers based on store patronage
motives, using cluster analysis. The characteristics of each cluster can be discussed in turn.
Location-driven shoppers considered convenient store location to be the most important factor,
followed by shopping convenience and in-store stimuli, while prices were not the primary concern
for this shopper segment. Involved shoppers expressed both a desire for the lowest prices and very
high level of convenience. Price-driven shoppers perceived prices to be the most important factor
driving store patronage. Convenience-driven shoppers required convenience the most, but also
lower than average prices.
Bourlakis et al. (2006) investigated food shopping behaviour in Greece. Using face to face
interviews, 535 adults were sampled. Regarding their shopping behaviour and attitudes to store
features four segments of shoppers were identified. Price sensitive variety seeking shoppers: the
main reason for shopping at favourable store was “low prices” whilst variety of merchandise was a
secondary reason. Apathetic shoppers revealed a negative evaluation on all three dimensions
(“Store design and variety”, “Personnel and service”, and “Convenient location”). The most
negative attitude was to “personnel and service”. Low price and convenient location were the main
reasons for their choice of store. The third group revealed positive evaluations on all three
dimensions so it was named as Enthusiastic loyal, quality and variety seeking shopper. Indifferent
loyal habitual shoppers showed the most negative view on store design and variety and the most
positive view on “personnel” and “location”.
El-Adly (2007) in his study of the United Arab Emirates, also using cluster analysis,
identified three mall shopper segments. Relaxed shoppers: look for comfort, mall essence,
convenience, store variety, product quality, and after-sales service as well as prices appropriate to
their income. Demanding shoppers: this group give greater importance to all attractiveness factors
than the other two segments, especially, to entertainment, diversity, and luxury. Pragmatic
shoppers: this segment was concerned only with mall essence. In other words, a products’ quality,
appropriateness of prices to their income, popularity and variety of stores were considered very
important in choosing the shopping mall for this segment.
Page 67
52
In addition, Ganesh et al. (2007) distinguished four types of shoppers. Apathetic shoppers:
this category did not care about all mall/store attribute dimensions, particularly the mall/store
quality dimension. Destination shoppers looked for the brand name, image and fashion oriented
items. Bargain seekers: the main motivation for this category was to seek discounted goods.
Finally, basic shoppers, who went shopping knowing exactly what they wanted to buy and sought
to accomplish this in the least amount of time. They considered shopping as a necessary chore.
Regarding shopper typologies based upon underlying consumer shopping motivations, several
studies have been presented (Westbrook and Black, 1985; Arnold and Reynolds 2003; Jamal et al.,
2006). Westbrook and Black (1985) identified six types of department store shoppers using a
personal interview method with 203 adult females in Tucson, Arizona. Shopping process- involved
consumers were distinguished by high values on almost all considered dimensions (except choice
optimization and power and authority) including anticipated utility, economic role enactment,
negotiation, affiliation, and stimulation. Choice optimizing consumers, in contrast to shopping
process-involved consumers, scored the highest level on choice optimization and the lowest on
negotiation motivations. Shopping-process apathetic: this segment scored low on all motivation
dimensions except choice optimization. Economic shoppers: this segment consisted of two
subgroups: shoppers for whom economic motivations were primary, scoring high on economic role
enactment and choice optimization motivation dimensions. The main difference between them was
that one subgroup scored high on choice optimization while the other subgroup scored high on
economic role enactment and choice optimization. The motivational dimension of negotiation was
absent from both groups. The final segment “average shopper” scored in the average range on all
shopping motivations dimensions.
Arnold and Reynolds (2003) proposed a conceptual taxonomy of shoppers based on a six-
factor, hedonic shopping motivations, using cluster analysis. The study revealed five shopper
segments, termed Minimalists, Gatherers, Providers, Enthusiasts, and Traditionalists shoppers. The
minimalists scored lower on all hedonic motivations with the exception of value shopping. The
gatherers scored higher on idea and role shopping, and the lowest level for value shopping. The
gatherers appeared to be motivated by the hedonic aspects of gathering information on new
products and trends, perhaps in anticipation of future purchases. The providers scored highly on role
and value shopping, and scored the lowest for non-generosity (unwillingness to give or share
possessions with others, a reluctance to lend or donate possessions to others, and negative attitudes
Page 68
53
toward charity). The enthusiasts scored highly on all hedonic motivations. Traditionalists scored
moderately high on most hedonic dimensions.
Jamal et al. (2006) using cluster analysis, identified six groups of shoppers in Qatar.
Socializing shoppers: for whom the main motivations for shopping, in descending order, were:
social reason, utilitarian, brand loyalty, quality, and value and brand consciousness. Disloyal
shoppers: this group was primarily concerned with value, quality and hedonic enjoyment.
Confusion, gratification, social and utility were ranked as of below average importance while, brand
loyalty was the lowest in this group. Independent perfectionist shoppers: members of this cluster
scored the lowest for social orientation, gratification and role-playing, whereas they scored above
average on quality, brand loyalty, confusion and utilitarian shopping. Escapist shoppers: this group
scored the highest on gratification and hedonic shopping, and above average on confusion and
slightly above average for brand loyalty, role playing, brand consciousness and quality. Apathetic
shoppers: scored the lowest on quality, utilitarian and gratification motives, and below average on
brand consciousness and role playing while, slightly above average on hedonic motives and
confusion. Finally, budget conscious shoppers: this group scored the least on hedonic preferences,
second lowest on confusion but highest on value, gratification, and brand loyalty, and above
average on brand consciousness and slightly below average on quality.
A recent study by Anic et al. (2012) investigated decision-making styles of young consumers
in Bosnia and Herzegovina, using exploratory and confirmatory factor analysis and cluster analysis.
They identified five groups of consumers. These segments according to their decision-making styles
were labelled as: (1) impartial, middle ground consumers scored average, non-extreme opinions on
all consumer decision-making style dimensions. However, they appeared to be a little bit
perfectionistic and brand conscious. (2) Fashion-oriented, hedonistic consumers were the most
novelty and fashion conscious. For them it was important to be up-to-date with styles. At the same
time, they were the most recreational and hedonistic consumers and found shopping a pleasant
activity. (3) Traditional, pragmatic consumers who saw shopping as an unpleasant activity. They
were the least brand and fashion conscious. (4) Hedonistic consumers appeared to be the most
recreational and hedonistic consumers, who found shopping a pleasant activity and (5) Confused by
excessive choice, perfectionistic consumers were the most confused. At the same time, the latter
segment was shown to be also high-quality conscious, with consumers who searched for the best
quality products, and were not satisfied with ‘‘good enough’’ products. In other words, these
Page 69
54
consumers had difficulty in making choices, and experienced information overload. However, even
though this study examined consumer styles it was limited to only students.
Briefly, while there is much research which classified types of shoppers, only a few groups
appear consistently across different studies, notably economic and apathetic shoppers. Shopper
taxonomies have been based on a variety of different bases although most share the common goal of
categorizing consumers into a limited number of groups.
3.3. Store Patronage
A clear understanding of why consumers patronize a particular store has long been an objective of
retail strategists and researchers because it allows them to identify and target those consumers most
likely to purchase (McGoldrick, 2002). Many significant advances have been made in the
construction and refinement of comprehensive models that offer helpful insights into the patronage
decision process. Patronage motives are those which encourage consumers to shop at one store
rather than another (Omar, 1999). Jantan and Kamaruddin (1999) reported that store image and
patronage have been found to be closely related in many instances.
Store choice has been a subject of wide research and has been studied from various
perspectives. Store image management is concerned with the congruity between the image desired
by the store and that perceived by its targeted customers or wider publics (Ness et al., 2002). The
latter stated that “store-managed image may be viewed as a consequence of its retail strategy, how
the store is positioned relative to customers and competitors, location, merchandise, atmosphere and
the marketing mix elements”(Ness et al., 2002, p. 510).
The distinction between the image desired by retailers and that perceived by consumers is
well established. However, because the consumer is the unit of analysis in this study, the discussion
in this section, therefore, concentrates on consumer perceptions of store image. It reviews the
literature on store image attributes in the context of consumer shopping behaviour with a particular
emphasis on the conceptual models related to store patronage.
3.4. Store Image Attributes
Store image, as one of the determinants of store choice, is largely based on store attributes. Store
attributes can be defined as the “summation of all attributes of a store as perceived by the shoppers
through their experience of that store” (Omar, 1999.p.103). The study of retail store image can
Page 70
55
provide a wealth of information concerning how consumers choose a specific store. Although the
concept of store image has existed for a long time, there is no precise or universal definition of it.
The concept was first introduced by Martineau (1958) who suggested that a retail store has a
personality and described store images as “the way in which the store defined in the shopper’s mind
partly by the functional qualities and partly by an aura of psychological attributes” (Martineau,
1958, p. 49). The author also, stated that “regardless of the ability to pay, all shoppers seek stores
whose total image is acceptable and appealing to them individually” (Martineau, 1958, p. 49).
Since Martineau’s seminal paper, many researchers have defined store image based on
consumer perception. In one of the prominent and widely cited studies on the subject of store choice
and image, image is defined as consumer perceptions of both functional (objective) and
psychological (subjective) attributes of a store (Lindiquist, 1974). Doyle and Fenwick (1974, p. 40)
described store image “. . . as the consumer’s evaluation of all salient aspects of the store as
individually perceived and weighted”. In other words, store image is assumed to be based upon the
individual’s experiences concerning a number of salient store attributes (Hildebrandt, 1988).
Engel et al. (1995) suggested that the consumer determines acceptable and unacceptable
stores by comparing the importance of store attributes with the store image (i.e. overall perception).
Positive consumers’ perceptions of the store attributes means that they may decide to purchase from
the store. On the other hand, if consumers’ perceptions of the store attributes are negative, then
consumers are unlikely to shop in the store. Solgaard and Hansen (2003, p. 170) stated that “The
overall store assessment is termed as store image, which is a function of the service output offered,
of advertising and promotion campaign as well as of the pricing strategy selected by the stores”.
As previously mentioned, store image has been used interchangeably with attitude towards
the store to describe the overall impression a consumer has of it. Literature focusing on various
retail formats found different sets of store attributes to constitute what is defined as “image” (e.g.
Martineau, 1958; Lindquist, 1974; Arnold et al., 1983; Tuncalp and Yavas, 1990). Martineau
(1958) categorized store attributes into two main categories: functional and psychological. The
functional category includes attributes such as location, assortment of products and store layout.
The psychological category represents the feelings generated by the functional elements of the
store.
Lindquist (1974) expanded Martineau’s concept by focusing on the meaning of store image.
By summarizing the key image dimensions of 26 scholars and 19 separate researches from the field
Page 71
56
of retail image, Lindquist (1974) determined nine key attributes: merchandise, service, clientele,
physical facilities, comfort, promotion, store atmosphere, institutional factors and post-transaction
satisfaction. Of these nine dimensions, three were apparently dominant (merchandise, service, and
locational factors), and of the three dimensions, the merchandise factor including selection, quality,
pricing, and styling/fashion appeared to be the key image factor. The following section considers
some of the most important attributes which contribute to store image. Table 3-2 below presents the
findings of individual studies assessing factors that determine store choice.
3.4.1. Location
Location suggests customers’ accessibility to the store and includes factors such as distance, and
time travelled to the store (Ting, 2009). Consumers prefer to shop at stores that they have easy
access to and are convenient for them. Store location is one of the main attributes that has received
attention. However, the findings regarding location are not entirely consistent. On one hand, much
research found that store location plays an important part in determining the store choice (Arnold et
al., 1983; Burns and Warren, 1995; Jantan and Kamaruddin, 1999; Severin et al., 2001; Baltas and
Papastathopoulou, 2003; Bourlakis et al., 2006; Virdi, 2011). A study by Arnold et al. (1983),
based on extensive analyses of six North American and European markets over a seven-year period
revealed that location, price, assortment, fast checkout, friendly and courteous service, and pleasant
shopping environment were critical determinants of store patronage. The first two determinants,
location and price appeared to dominate the choice process. Additionally, in this context, Burns and
Warren (1995) found that since the store mix and product offerings of many regional shopping
malls are very similar; often the primary discriminator between many of these centres is merely
location.
Likewise, Jantan and Kamaruddin (1999) in their study in Malaysia, stated that “at its heart,
the finding suggest that location and service have a strong impact on consumers’ choice” (Jantan
and Kamaruddin, 1999, p. 78). Similarly, Severin et al. (2001) in his study identified geographical
location as a significant factor in the choice of a shopping centre. Also, the in the case of Greece,
Baltas and Papastathopoulou (2003) and Bourlakis et al. (2006) showed that a considerable
importance was attached to store location, despite the density and the relatively small distances that
characterise the examined retail structure. More recently, Virdi (2011) revealed that on an overall
basis, customers give prominence to proximity of the store, merchandise and the service. Food/
grocery stores were chosen more on the basis of their proximity.
Page 72
57
Table 3-2: Summary of the Findings of Individual Studies Assessing Factors that Determine Store Choice
Author Geographical
coverage
Location Merchandise
quality
Price Service
quality
Variety Assortment Atmosphere Layout Cleanness Personnel
Arnold et
al. (1983)
North
American
and
European
X X
(Seiders and
Costley,
1994)
USA X X X
Burns and
Warren
(1995)
USA X
Spies et al.
(1997)
Germany X
Jantan and
Kamaruddi
n (1999)
Malaysia X X X X
Severin et
al. (2001)
Canada
USA
Norway
X X X X X
Juhl et al.
(2002)
European
countries
X
Babin et al.
(2003)
USA X X
Baltas and
Papastathop
oulou
(2003)
Greece X X X X
Page 73
58
Author Geographical
coverage
Location Merchandise
quality
Price Service
quality
Variety Assortment Atmosphere Layout Cleanness Personnel
Baltas and
Papastathop
oulou
(2003)
Greece X X X
Solgaard
and Hansen
2003
Denmark X X X
El-Droubi
(2004) Qatar X X
Fox et al.
(2004)
USA X X X
Bourlakis et
al. (2006)
Greece X X
(Alhemoud,
2008)
Kuwait X X X
Sohail
(2008)
Saudi Arabia X X
Swoboda et
al. (2009) Romanian X X X
Theodoridis
and
Chatzipana
giotou
(2009)
Greece X X X X
Zairi and
Al-Rasheed
(2010)
Saudi Arabia X X X
Gorton et
al. (2011)
Thailand X X X X
Khraim et
al. (2011)
Jordan X X
Virdi
(2011)
India X X X
Page 74
59
On the other hand, a few researchers found that store location was relatively less important in
determining the store choice and at odds with above conclusions (El-Droubi, 2004; Alhemoud,
2008; Sohail, 2008). Interestingly, all three studies were carried out in Arabian countries including
Qatar, Saudi Arabia, and Kuwait.
From this extensive discussion, location appears to be the most important driver for the choice
between stores in European countries and USA but of less importance in the Arab world. A reason
for this could be the overall high transportation cost in the former countries. In Arab countries most
modern format stores are located in city centres, whereas they are almost always located on the
outskirts of cities or suburbs in Western countries. Thus for many shoppers without a car the
perceived marginal costs of shopping at a store located far away may well exceed the perceived
benefits. Moreover, there is relationship between the importance of location and store type. For
example, it has scored high in the case of grocery/fruits and vegetables, and chemists. However, in
the case of durables, books and music, apparels and accessories, merchandise was a more important
reason (Sinha et al., 2002; Fox et al., 2004). In Arab countries, the fact that location is relatively
less important may reflect high levels of car ownership and the poor system of public transportation,
as El-Droubi (2004, p. 219) stated:
“Using cars for shopping, which is common in Qatar, means that more stores are equally
convenient and accessible for consumers, therefore, it could be argued that such convenience
is not an important factor in store choice”.
3.4.2. Price
Another determinant is price which plays an important role because marketers uses price as
communication medium with customers where the message is being clearly perceived by customer
as what it meant to the marketers (Jakpar et al., 2012). Price is a very important attribute for
consumers, as it is a common and salient product attribute for most consumers in any purchase
decision (Ting, 2009). Thus, researchers have investigated how consumers form their perceptions in
response to various types of retail pricing and price related promotion strategies (Seiders and
Costley, 1994; Solgaard and Hansen, 2003). As can be seen in Table 3-2, again, the importance of
price in store patronage is clearer in developed countries. A main reason for this could be that there
is a fairly large common set of standardized products and brands between store chains across store
formats. As a result of this customers gave more concentration for the price in their choice.
However, in developing countries such as India may be a reflection of the standard of living.
Page 75
60
Seiders and Costley (1994) found that price to be a major determinant of store choice in the
context of grocery shopping. However, Fox et al. (2004) examined the relationship of price to
grocery shopping behaviour and found that it was less important than promotion, location, and store
assortment for supermarket shoppers in the USA. Additionally, Sohail (2008) revealed that price,
shop atmosphere, and store location were not important determinants of store selection for Saudi
shoppers. However, a little importance was given to staff courtesy. Another study for Saudi Arabia,
however, found that price of one of the top three factors that influence Saudi consumer choice with
good quality and wide selection of goods (Zairi and Al-Rasheed, 2010) The effect of the quality
and variety of goods and their influence on store patronage and store image has also been
highlighted in several studies (Arnold et al., 1983; Baltas and Papastathopoulou, 2003; Gorton et
al., 2011).
In an Arab context, Alhemoud (2008) explored the factors influencing patronage decisions for
supermarkets in Kuwait. The results revealed that respondents highly rated the importance of
quality of merchandise, fairness of merchandise prices, range of merchandise, friendliness of staff,
and variety of merchandise brands. The lowest ratings of importance were attached to supermarket
design and layout, external appearance and ease of mobility through aisles. Also, opening hours and
accepted methods of payment appeared to be unimportant for the customers of supermarkets in
Kuwait.
Theodoridis and Chatzipanagiotou (2009) assessed the relationship between store image
attributes and customer satisfaction. Six major attributes were highlighted including: products,
pricing, atmosphere, personnel, merchandising, and in store convenience. In particular, four of these
six attributes emerged as significant determinants of satisfaction. However, atmosphere and
merchandising did not have a significant impact on satisfaction formation. Pricing and products
were found to be the key determinants.
In conclusion, from above discussion, the physical environment is less influential than the
products themselves. Yet this is not to say that the physical environment is unimportant but rather in
certain contexts consumers are willing to trade off environmental factors for lower prices and / or
location convenience (Babin and Darden, 1996; Spies et al., 1997; Babin et al., 2003; El-Droubi,
2004; Theodoridis and Chatzipanagiotou, 2009).
Page 76
61
3.4.3. In Store Convenience
In store convenience refers to a store’s layout and design, which helps customers plan their trip in
terms of orientation and direction (Theodoridis and Chatzipanagiotou, 2009). This represents an
important attribute of store environmental stimuli allowing the merchandise to be exposed, which in
turn will affect the customers’ in-store expenditure and choice (Davies and Rands, 1992). In order
to attract consumers to shop through the whole store, space design and allocation, placement of
merchandise, grouping of merchandise and placement of equipment are some of the factors that
retailers need to consider carefully (Ting, 2009). The successful layout of a store depends on
whether it has a clear and legible concept; i.e. one can easily find products and find them the first
time on different trips. The various labels, information posters and signs can contribute to creating a
favourable and attractive store environment (Spies et al., 1997). By doing so, consumers will save
time and effort in their shopping trip while obtaining higher quality merchandise, feeling that
shopping at a store is more convenient, which, in turn, positively influences their likelihood of
repeat visits.
3.4.4. Atmosphere
Kotler (1973, p. 50) defines atmosphere as “the effort to design buying environments to produce
specific emotional effects in the buyer that enhance his purchase probability”. According to
Theodoridis and Chatzipanagiotou (2009) store atmosphere refers to the environment that is created
by combining a set of visual elements of the physical store environment (colours, displays,
decorative features, ease of movement etc.) and stimulation of senses (smell, cleanliness,
temperature, and lighting) enabling an aesthetic consumer response.
Much evidence exists supporting the effect of atmosphere on shopper patronage in the field of
marketing and retailing (Spies et al., 1997; Babin et al., 2003). Stores with a favourable atmosphere
are likely increase the time a consumer spends in the store, affects their behaviour, and ultimately
increases the positive buying experience and store patronage. In other words, stores with a pleasant
atmosphere are likely to be more favoured by shoppers than those with less pleasant atmospheres
(Spies et al., 1997; Babin et al., 2003). Spies et al. (1997) indicated that for purchasing behaviour
the effects of store atmosphere could be completely ascribed to mood-effects. Thus, depending on
the type of reactions shown by customers, different intervening variables are responsible for the
effects of store atmosphere. In all cases, however, the positive effect of a pleasant store atmosphere
on customers' reactions could be clearly demonstrated. Babin et al. (2003) suggested that although
Page 77
62
colour, lighting, and price are linked to shopping intentions, the effect is indirect and other factors
that also influence affect and price fairness must be considered as well.
From another angle, some research has found that the importance of various store attributes
varies by store types. In the context of USA, Seiders and Tigert (2000) studied the effects of
supercentres market entry on local traditional food retailers. By comparing supercentre shoppers
with traditional supermarket shoppers, they found that supercentre shoppers identified low prices
and assortment of products as the primary reasons for their format choice. In contrast, consumers
choose traditional supermarkets primarily for convenience, quality, and service. Carpenter and
Moore (2006) study’s provided interesting insights into the US consumer’s choice of grocery
format. With regard to store attributes, cleanliness was the most important attribute regardless of
format. The price competitiveness attribute appeared to be most important among shoppers in the
traditional supermarket format and the supercentre format. Surprisingly, price competitiveness did
not rank among the top five attributes for occasional shoppers in the supercentre format or the
specialty grocery format and ranked only fifth among these shoppers for the warehouse format.
Carpenter and Moore (2006, p. 448) stated that “while many assert that the grocery industry is
strongly driven by price competitiveness, the results suggest that product selection and courtesy of
personnel are also very important in determining format choice”.
Ting (2009) found that the importance of attributes varies across retail formats. Shoppers who
preferred hypermarkets indicated that product and price were the two most important attributes. For
those respondents who preferred supermarkets, they mentioned that product quality and location are
the top two store attributes that affect their choice. On the other hand, convenience store shoppers
placed location and price as the two most important attributes in forming their preference towards
the store. Shoppers who preferred traditional stores indicated that location, and product quality
influenced their store choice preferences.
Despite the obvious importance of detecting store attributes that influence consumer
decisions, other research (Lumpkin et al., 1985; McCurley Hortman et al., 1990; Tuncalp and
Yavas, 1990; Sinha et al., 2002; El-Droubi, 2004; Tessier et al., 2010; Khraim et al., 2011),
however, suggested that variations in perceived importance of specific store attributes may be
partially determined by the personal characteristics of the consumers such as age, income, gender,
occupation, religion, culture, and education fulfilment. This may lead to heterogeneous preferences,
with significant differences across groups.
Page 78
63
Researchers found several differences between demographic segments with regard to the
importance placed on varying store attributes. For example, regarding age, Lumpkin et al. (1985)
conducted a study on the importance of attributes for elderly consumers. They found that strong
emphasis was placed on the quality/price ratio. In addition, convenient parking was preferred, while
entrance to the premises, fast check-out counters, close to other stores, close to home, phone order,
and home delivery were not as important. Moreover, the findings highlighted that elderly
consumers are more concerned with of the issues of the physical environment, transportation, and
price than non-elderly consumers. Similarly, McCurley Hortman et al. (1990) suggested that the
elderly placed importance mainly on low prices, atmosphere of the stores and the quality of
merchandise and convenience.
Considering culture, Tuncalp and Yavas (1990) examined the transferability of supermarkets
into developing countries by using Saudi Arabia as a case study, comparing the grocery shopping
habits of Saudi and Western expatriates. Results of this empirical study revealed that although
Saudis and expatriates attached similar levels of importance to most criteria in choosing where to
shop for groceries, there were some areas of disagreement. For instance Saudis rated the importance
of parking, social connections, and free samples much higher than the expatriates. On the other
hand, the latter attached greater importance to the availability of leading brands and past experience.
For Saudis the importance of parking may reflect the high level of car parking. In addition, Saudis
have traditionally shopped at independent grocery stores where most food items are sold
unpackaged, so they have a chance to see, to feel, and to taste them (ibid). The importance given to
brand names by expatriates may reflect unfamiliarity or past unsatisfactory experience with local
brands; as Tuncalp and Yavas (1990, p. 63) claimed “the supermarkets in Saudi Arabia tend to
carry off- brand products manufactured or packaged in Far Eastern countries”.
Regarding the gender of shoppers, Sinha et al. (2002) found that men selected more on the
basis of proximity whereas women gave greater importance to merchandise. El-Droubi (2004)
investigated the underlying factors affecting consumer shopping behaviour in Qatar. The study
revealed that women preferred to deal with outlets that have a nice physical environment whereas
men were more concerned with car parking and low prices.
Evidence for Greater Tunis (Tunisia) was provided by Tessier et al. (2010). They found that
supermarkets were preferred by wealthier and better educated consumers. Consumers
overwhelmingly shopped at both ‘modern’ and ‘traditional’ retail outlets: only 4.2% of those
sampled used supermarkets to the exclusion of all other formats. The choice of large supermarkets
Page 79
64
often reflected the leisure dimension of shopping whereas the nearby grocer was chosen mainly
because of the availability of credit and proximity for emergency shopping.
Research also indicates that religion appears to influence some aspects of retail store
evaluative criteria. For example, McDaniel and Burnett (1990) examined the effects of multiple
measures of religiousness on selected retail store evaluative factors in the United States. They found
a positive relationship between high self-perceived religiousness (the cognitive component of
religious commitment) and the desire for shopping efficiency, sales personnel
friendliness/assistance and product quality in a retail store. In addition, religious contribution (the
behavioural component of religious commitment) was positively and significantly associated with
sales personnel friendliness/assistance and credit availability.
Mokhlis (2006) explored the influence of religion on consumer behaviour in the context of
Malaysian culture, covering four religious categories (Islam, Hinduism, Buddhism and
Christianity). Overall, the results indicated that there was a significant relationship between
religious affiliation and consumer religiosity and store patronage. However, consumer religiosity, as
compared to religious affiliation, was more useful in predicting aspects of retail patronage
behaviours. Thus, it was suggested that a religiosity variable should be given consideration in future
patronage behaviour model building and research efforts.
In Jordan, Khraim et al. (2011) revealed that among the six factors considered (locational
convenience, service, post purchase services, merchandise, kinship and local goods), the most
important factor for Jordanian consumers was merchandise, which included product variety,
cheaper prices, frequent sales offers, and controlled items are well stocked. Among these items,
cheaper prices received the highest mean rating. Regarding religion, the study indicated that there
was a difference between high, moderate and low levels of religiosity in evaluating the importance
of all retail store factors except for the service factor, where there was no difference between high
and moderate levels. The study also hypothesized that the emphasis on the availability of local food
and non-alcoholic items and beverages was an important and unique feature for retail stores in
Islamic societies. However it is important to note that the unit of analysis in Khraim et al.’s (2011)
study was the shopping centre and the role of gender was not explicitly considered.
In conclusion, numerous studies have been conducted to explain store patronage behaviour.
Research showed that store patronage is influenced by various factors including store attributes, and
consumers’ personal and demographics characteristics. A set of attributes was identified to play a
Page 80
65
critical role in consumers’ decisions as to where to shop. The most important attributes identified in
Table 3-2 are geographical location, prices, product assortment, speed of service, service quality,
special offers, shopping environment, food safety, cleanliness of place, paying by card facilities,
and car parking. Some of these attributes are more salient in a non-Western context. Although, these
studies focus on multiple criteria they do not properly address the issues of social acceptability and
personal safety. Moreover, the majority of these studies concern shopping malls and / or
supermarkets and hypermarkets, with very little attention given to factors determining the choice of
other retail outlets such traditional markets and independent stores.
3.5. Models of Store Choice
In order to better understand store choice, researchers have attempted to model the process of
information evaluation. This has typically drawn on the work of social psychologists who
developed models to predict attitudes from individuals' salient beliefs about objects, which have
then been applied in business and marketing research (Ahtola, 1975).
The main model utilised in the marketing literature was developed by Fishbein (1967), which
was designed to explain an individual’s attitude formation. Besides Fishbein’s model, there are lots
of other models such as the Rosenberg Model (1956) which mainly focused on attitudes toward a
product’s benefits (Lindgren and Konopa, 1980); an attitude model for the study of brand
preferences (Bass and Talarzyk, 1972); the vector model of preferences which distinguished
between belief strength and the content of beliefs and which does not require the utilization of
negative probabilities (Ahtola, 1975); and the ideal-point model which provided information
concerning an “ideal brand” as well as how existing brands are viewed by consumers(Engel et al.,
1995). The aim of these models was to measure consumer attitudes toward objects in the
marketplace and to determine the specific attributes associated with those objects. Given the
importance and popularity of the application of the approach of Fishbein (1967), the main focus
here will be on this model.
Fishbein’s (1967) model was based upon principles of mediation and conditioning. This
predicted that an individual’s attitude toward any object is a function of (1) the strength of her / his
beliefs about the object and (2) the evaluative aspect of those beliefs (Fishbein, 1967). Expressed
algebraically in Equation 1:
Page 81
66
∑ ( ) [1]
Where:
A0 = the attitude toward object 0
Bi = the strength of belief i about the attitude object o, that is, the “probability” or
“improbability” that o is related to some other concept xi
i = the evaluative aspect of Bi, that is, the evaluation of xi
N = number of beliefs
The marketing applications of the Fishbein’s model have in most cases changed its basic
nature to such an extent that the resultant models are no longer based on the same theoretical
foundations as the original model. For example Fishbein’s model was adapted by Bass and
Tallarzyk (1972) to more specifically model attitudes towards stores. They argued that attitudes
could be expressed as presented in Equation 2:
Where:
Ajk = consumer k’s attitude score for j
Wik = the importance weight assigned by consumer k to attribute i
Bijk = consumer k’s belief as to the amount of attribute i offered by store j
N = the number of attributes important in the selection
However, Meyer and Eagle (1982) argued that the major weakness of the multi-attribute
model was that consumer decisions are more likely to involve a hierarchical evaluation of
alternatives. This means there will be a breach of an assumption of the multi-attribute models, that
there are stable multi-attribute utility functions.
Monroe and Guiltinan (1975) developed a general patronage behaviour model by using time-
path analysis in order to find out which elements and relationships are important in patronage
[2]
Page 82
67
behaviour. The results of this study confirmed that general beliefs about the benefits of store special
offers, brand names, and other shopping variables would influence the specific shopping benefits
sought. Moreover, the results indicated that general opinions and beliefs were more stable and did
not readily change, whereas attribute importance was more susceptible to change (Monroe and
Guiltinan, 1975).
Darden (1980) proposed a patronage model of consumer behaviour based on multi-attribute
attitude theories. Three important elements were incorporated in this patronage model: shopping
orientations, experience, and patronage behaviour. Darden strongly believed that “patronage choice
behaviour might actually be more important than that of brand choice behaviour” (Darden 1980, p.
43) because “many consumers make shopping trips to a retail store either to “buy something” or to
“see what is available”, so that patronage choice is logically prior to brand choice (Darden 1980, p.
44). In other words, consumers choose stores that they want to shop at first without a consideration
of brands. Then the comparisons will be made between the brands that are carried by the store that
is visited on a particular shopping trip (Mokhlis, 2006).
Sheth (1983) developed a theory of patronage behaviour that included two sub- theories
(shopping preference theory and an integrative theory of patronage behaviour). The first theory is
limited to establishing a shopping preference for an outlet focused on four constructs, which were
shopping predisposition, choice calculus, shopping motives, and shopping options whereas the
second theory is focused on the determinants of actual purchase behaviour with respect to a specific
product or service from an outlet involving planned purchase, unplanned purchase, foregone
purchase and no purchase behaviour. Further, four types of unexpected events were included into
Sheth’s model that were socio-economic setting, in-store marketing, personal setting and product
setting. Sheth (1983, p. 26-27) reported that “the Patronage Behaviour is a function of Preference –
Behaviour Discrepancy caused by unexpected events that have either no effect or an inducement or
inhibition effect on customer’s shopping preference”.
Malhotra (1986) recommended a stochastic model for predicting store choice based on
censored preference. He argued that this proposed approach could be applied not only in the context
of measuring store preferences, but also in a variety of other situations which arise in retailing. The
characteristics identified as salient were variety, selection, personnel and service, acceptability of
price, convenience of location, and physical facilities. The student sample was divided into four
segments using cluster analysis. The results showed that variety, selection, personnel and service,
Page 83
68
price, convenience of location were significant for all the segments. Physical facilities were
significant for only one segment.
Regarding religious influence, based upon a review of two existing models, namely Darden’s
(1980) patronage model of consumer behaviour and Sheth’s (1983) shopping preference theory, a
model of religious influences on retail patronage was developed and tested by Mokhlis (2006). Use
of information sources, shopping orientation, importance of store attributes and store patronage
were the specific retail patronage aspects hypothesized to be influenced by religious variables
namely Islam, Buddhism, Hinduism and Christianity. The proposed model was empirically tested
by applying Multiple Linear Regression Analysis. The results were generally supportive of the
study’s hypothesis that the religious background of the consumers played a significant role in
affecting certain aspects of retail patronage behaviours. Compared to their Christian counterparts,
the people of Islamic faith placed greater emphasis on traditional family values.
3.6. A Theoretical Framework Model of the Study
In order to answer the research question, a conceptual framework was formulated from the existing
literature regarding consumer shopping behaviour. On one hand, having reviewed the literature in
the consumer shopping behaviour field, it was found that extensive work has been conducted,
suggesting that this is a mature area. On the other hand, however, what is not known is the extent to
which the findings from previous studies can be generalised to other countries. Furthermore, no
investigative framework exists for the research problem under study. Therefore, this study will
build on existing research by developing a theoretical framework and empirically validating this
framework for the particular context of Libya.
Past theoretical and empirical efforts assisted the researcher to propose a conceptual model of
shopping behaviour, as detailed in Figure 3-2. The following sets of constructs were incorporated
into the model due to their prevalence in the literature and their use in describing the basic process
of shopping behaviour: demographic characteristics, store attribute importance, shopping value,
decision-making style, shopping motivations and store patronage.
Page 84
69
Figure 3-2: A Theoretical Framework of the Study
Shopping
Motivations
Shopping
Value
Decisions
Making Style
Socio-demographic
Characteristics
Shopping
Decision
Supermarket
Traditional
Market
Independent
Store
Importance of
Store Attributes
Store
Choice
Consumer Spending
Fresh Meat
Packaged FoodFresh Vegetables
and Fruit
Fresh Fish Beverages
Store
Patronage
Shoppers
Typologies
Shopping Behaviour
Page 85
70
The theoretical foundation of this model draws on Jamal et al.’s (2006) study because of the
convergence in the customs and traditions across Arab countries. Moreover, most of the existing
literature has sought to develop typologies of shoppers based either on shopping motives, shopping
values or on decision-making styles, however, Jamal et al.’s study profiled consumers on the basis
of all three dimensions (decision-making styles, shopping value and shopping motivations).
A decision-making style can be defined as “a mental orientation characterising a consumer's
approach to making shopping choices (Sprotles and Kendall, 1986, p. 268)”. Sprotles and Kendall
developed a model of eight categories decision making styles which are as follows:
1. Habitual, brand loyal orientation (the tendency to have favourite brands and stores and
to have formed habits in choosing them).
2. Value consciousness (the tendency to be careful about product price and seek bargains
and look for deals; they are likely to be concerned about getting best value for money
and may engage in comparison shopping).
3. Confusion (the tendency to get confused by over-choice of brands and information;
they are likely to experience information overload and have difficulty making
choices).
4. Impulsiveness (the tendency to be impulsive and careless; they are likely not to plan
their shopping and remain unconcerned about how much they spend).
5. Perfectionism/quality consciousness (the tendency to seek perfection or highest
possible quality in products; they are expected to shop more carefully, more
systematically and are not likely to be satisfied with good enough brands).
6. Brand consciousness (the tendency to buy the more expensive, well known famous
brands; they are likely to perceive price–quality link, are likely to have positive
attitudes towards departmental and speciality stores selling expensive and popular
brands and may prefer best-selling, heavily advertised brands with strong believe in
that a higher price means better quality).
Page 86
71
7. Hedonic shopping (the tendency to seek pleasure, fun, recreation and entertainment
out of shopping), and
8. Novelty consciousness refers to the tendency to buy novel and fashionable items; they
are likely to seek pleasure and excitement out of seeking and discovering new things
and are likely to keep up to date with style with variety seeking as part of their
orientation.
These categories can be divided into utilitarian shopping styles because of the focus on price,
quality, and value (value consciousness, confusion, impulsiveness, and quality consciousness) and
hedonic shopping styles, including the four shopping styles that reflect some non-essential, non-
product aspects of shopping behaviour (brand loyal orientation, brand consciousness, novelty
consciousness, and hedonic shopping) (Zhou et al., 2010). A number of studies investigated and
assessed the applicability of Sprotles and Kendall’s (1986) inventory to examine the major
characteristics of consumer decision-making (Hafstrom et al. 1992; Lysonski et al. 1996; Walsh et
al. 2001; Jamal et al. 2006; Zhou et al. 2010; Zhang and Kim, 2013). Overall, these studies have
confirmed the eight decision-making styles. However, consumers from these different cultures
appear to differ in the extent to which they behave based on these styles.
Value is one of the most powerful forces in the marketplace to understand consumer
behaviour. Value is “responsible for the selection and maintenance of the goals (or ends) toward
which individuals strive, while simultaneously regulating the manner in which this striving takes
place” (Shim and Eastlick, 1998, p. 142). Value comes from the confrontation between what the
customer receives (e.g., quality, benefits, worth, utilities) and what they give up to acquire the
benefits (e.g., price, sacrifices) and thus in simple way the term of value can be defined as a
consumer’s overall judgment of benefits and sacrifices (Irani and Hanzaee, 2011). Jamal et al.
(2006) noted that values are consumers’ broad life goals and they often involve the emotional affect
associated with such goals and needs. Since the establishment of the Personal Shopping Value scale
(Babin et al., 1994), much research has focused on defining shopping value and identifying specific
dimensions of shopping value and supported the notion that shopping can provide both hedonic and
utilitarian value (e.g., Babin and Darden, 1995; Griffin et al., 2000; Jamal et al.,. 2006; Jones et al.,
2006; Irani and Hanzaee, 2011; and Davis and Hodges, 2012).
Page 87
72
Hedonic shopping value reflects the value received from the multisensory, fantasy and
emotive aspects of the shopping experience (Babin et al., 1994). Compared to utilitarian value,
hedonic shopping value is more subjective and individualistic. Hedonic value is perceived through
fun and pleasure as opposed to goal achievement. Utilitarian shopping value reflects the acquisition
of products and/or information in an efficient manner and can be viewed as reflecting a more task-
oriented, cognitive, and non-emotional outcome of shopping (Babin et al., 1994). Perceived
utilitarian shopping value is determined by how much of the consumption need that prompts the
shopping experience, is met (Irani and Hanzaee, 2011). In other words, utilitarian shopping value
reflects the task-related value of a shopping experience while hedonic shopping value reflects the
value found in the shopping experience itself independent of task-related activities (Jones et al.,
2006).
Motivation is normally defined as “an inner drive that reflects goal-directed arousal” (Arnould
et al., 2002, p. 378). In a shopping context, motivation can be described as the driving force within
consumers that makes them shop. Contrary to the traditional belief that consumers go shopping just
to purchase products and/or services, Tauber (1972) argued that consumers shop because they
experience a need and recognize that shopping activities may satisfy that need and hypothesized
that shopping motivations can be either personal include role playing, diversion from daily routine,
self-gratification, physical activity, learning about new trends, fashions, and innovations, and
sensory stimulation or social include social experiences outside the home, communication with
others having a similar interest, affiliation with peer groups, obtaining status and authority, and
gaining pleasure from bargaining and negotiation (Tauber, 1972).
Since Tauber's seminal article (1972), a stream of research has sought to segment consumers
using their motivations for shopping, as documented in Section 2.2.1 (e.g. Westbrook and Black,
1985; Arnold and Reynolds, 2003; Jamal et al., 2006; and Kaur and Singh, 2007). The various
segments of shoppers were found to exhibit some differences in decision making styles, shopping
values, shopping motivation and demographic characteristics. Therefore, this study aims to explore,
compare and discuss similarities and differences between the Libyan case and previous studies for
other geographical contexts.
To date the literature is generally restricted to comparisons of behaviour within the same store
format, i.e. limited to only supermarkets or to only department stores. However, a small number of
studies examine consumer choice across different retail formats (Gorton et al., 2011). This present
study contributes to the literature summarized above by providing an analysis of consumer choice
Page 88
73
between traditional and newly available shopping formats in Benghazi, Libya. It differs from other
research discussed above by considering the choices between three different formats (supermarkets,
traditional markets, and independent stores) and examines the effects of demographic characteristics
on format choice.
Key factors that have been found in this literature to affect food-shopping behaviour include
attributes of store and shopper characteristics. Store attributes include location, level of prices,
product variety, quality of service, quality of produce, and store environment. Shopper
characteristics including a wide variety of characteristics such as personal preferences, cultural
characteristics, income, and various demographic variables also have been taken into account.
However, since the vast majority of the Libyan population are Muslims, variation in religion is not
an appropriate variable for the Libyan case. Other key sources used in designing the survey
instrument are documented in the methodology chapter.
3.7. Conclusion
This chapter analyses previous research on determinants of food shopping behaviour. To be
effective, the literatures in the relevant field were reviewed by addressing consumer behaviour from
different angles including: shopping motivations and shopper typologies, store selection criteria and
patronage behaviour, and consumer behaviour models.
Drawing on the literature, a considerable amount of research has been published on food
shopping behaviour, which principally focuses on Western countries. Very little research has
considered non-Western cases as well as in food categories. In answering the most basic question
‘why do people shop’ many reasons or motivations have been highlighted. The most important
motivations suggested by Tauber (1972) include several types of personal motive (role-playing,
diversion, self-gratification, learning about new trends, physical activity; sensory stimulation) and
social motives (social experiences, communication, peer group attraction, status and authority, and
pleasure of bargaining).
Shopper segmentation is an important tool for marketers to understand groups of consumers
and plan their marketing strategy. A large number of studies have been published in order to
recognize typologies of shoppers since Stone’s (1954) seminal study. Different psychographic
statements and analytic techniques were used to this end for example; store attribute importance
ratings, store image characteristics, and shopping motivations. A brief review of various studies was
Page 89
74
considered. The results of these studies highlighted some frequent segments common to most cases
(e.g. apathetic shoppers).
In addition, much research has focused on studying the principal attributes that influence a
customer’s decisions regarding where to shop. This stream of research identified that a set of
attributes collectively plays a critical role. Regardless of store type, the core attributes that were
identified are: geographical location, price, product assortment, service quality, special offers,
shopping environment, food safety, cleanliness of place, pay by card facilities, and car parking.
Some of them are more salient in a non-Western context and others not.
Furthermore, attention was also paid to models that may help understand consumer food
shopping behaviour. Several social psychologists have developed models to predict attitudes from
individuals' salient beliefs about objects. Regarding store attribute research, most models originate
from the work of Fishbein (1967).
Previously proposed models were reviewed to introduce a theoretical framework of this study.
The most relevant existing model was presented by Jamal et al (2006). This served as the
theoretical foundation for the development of the conceptual model because of the convergence in
the customs and traditions across Arab countries. Lastly, the conceptual framework containing the
key factors, the variables, and presumed relationships between them was developed.
Page 90
75
Chapter 4 Research Methodology
4.1. Introduction
This chapter presents and justifies the research methodology chosen for this study. Firstly, the
chapter outlines data sources. Secondly, the research methods utilised are presented, justifying the
use of both qualitative and quantitative methods. Next, the chapter discusses how the questionnaire
was designed and data collected. Finally, the chapter concludes with a discussion of the statistical
methods that were used in this study. However, before discussing the research methodology, it is
useful to consider some recurring issues in business research such as justifying the appropriateness
of the adopted philosophical approach. This is necessary because the choice of a research position
has implications for what, how and why research is carried out (Carson et al., 2001).
4.2. Research Philosophy
A research philosophy is a belief about the way in which data about a phenomenon should be
gathered, analysed and used (Bryman and Bell, 2007). Research is directly associated with the
researcher’s perception of reality (ontology) and what counts as knowledge (epistemology). An
understanding of research philosophy can help researchers form a clearer picture about how and
why research is implemented. According to Easterby-Smith et al. (2012) there are three reasons
for why an understanding of “philosophical issues” of research is useful. Firstly, it can help the
researcher to clarify the overall components and procedures of the research to be undertaken.
Secondly, knowledge of philosophy can help the researcher to recognise which design will work
and which will not in solving the research problems. Thirdly, it can help the researcher to identify
and even create designs that may be beyond his or her past experience.
There are two major research philosophies, namely positivist and interpretivist approaches,
with others lying on a continuum between the two extremes (Carson et al., 2001; Bryman and Bell,
2007). Positivists emphasise an inductive or deductive procedure to establish and explain patterns of
behaviour while interpretivists seek to establish the motivations and actions that lead to these
patterns of behaviour (Baker, 2001). The positivistic paradigm is often applied to quantitative
research, and the interpretivistic paradigm is often related to qualitative research. However, on one
hand, even within these two broad stances there are a number of possible approaches. Silverman
(2010) argued that there are no universal principles underlying all qualitative social research;
Page 91
76
qualitative research draws on a plurality of research paradigms. On other hand, in terms of the use
of sources, data collection and interpretation, a degree of overlap exists between most of these
paradigms (Tien, 2009).
4.2.1. Positivism
Positivism can be defined as “an organised method for combining deductive logic with precise
empirical observations of individual behaviour in order to discover and confirm a set of
probabilistic causal laws that can be used to predict general patterns of human activity” (Neuman,
2010, p. 58). Positivists seek to maintain a clear distinction between facts and value judgements.
The positivist approach relates to the facts or causes of social phenomena and attempts to explain
causal relationships by means of objective facts (Carson et al., 2001). In this approach, research
focuses on description, explanation and uncovering facts, accompanied by explicitly stated theories
and hypotheses (Neuman, 2010). Collis and Hussey (2009) identified a number of the
characteristics of the positivist approach. The most important concern is hypothesis testing, with a
tendency toward quantitative data, which drives statistical analysis.
In consumer research, studies within the positivistic tradition focus on consumer decision-
making, encompassing economic, behavioural, cognitive, motivational / trait / attitudinal, and
situational perspectives. These perspectives are sometimes referred to as traditional perspectives as
they pre-date the development of the non-positivist (Interpretative) paradigm (Pachauri, 2002).
4.2.2. Interpretative
Interpretative epistemology suggests that the researcher should seek to understand differences
between humans in our role as social actors (Saunders et al., 2009). This philosophical stance is
concerned with the complexity of human sense making, and it focuses on understanding human
behaviour from the participant's own frame of reference (Collis and Hussey, 2009). According to
Lee (1991, p. 347) “the social scientist must collect facts and data describing not only the purely
objective, publicly observable aspects of human behaviour, but also the subjective meaning this
behaviour has for the human subjects themselves”. In actual fact, essential to the interpretivist
philosophy is that the researcher has to adopt an empathetic stance (Saunders et al., 2009). This
implies that under this paradigm, the meaning, rather than the measurement, of social phenomena is
emphasised.
In brief, the positivist approach has been applied in scientific research to explain causal
relationships through objective facts. However, interpretivist epistemology is more concerned with
Page 92
77
understanding the social world. Carson et al. (2001) pointed out that the key criteria differentiating
the two paradigms are:
In positivism, the researcher is independent, but in interpretivist research the researcher
is involved.
In positivism, large samples may be used whereas interpretivist research uses small
numbers.
In positivism, testing theories predominates whereas interpretivist-type research focuses
on generating theories or “theory building”.
In the interpretivist paradigm, it is not easy to control the pace, progress and end-point of
the study.
Deciding about whether to use one or the other, or both of these paradigms, is a significant
task, mainly because it depends on a number of issues, including the researcher’s own beliefs about
the appropriate way to study human behaviour, the research questions, the rigour of the research
which includes both the universality and verifiability of results; the degree of understanding of the
problem provided by the method; the extent to which the results will generalise to other settings and
persons; and the usefulness of the findings (Patton, 1990). In marketing research, projects can be
considered positivist if there is evidence of formal propositions, quantifiable measures of variables,
hypothesis testing, and the deduction of inferences concerning the phenomena from the
representative sample to a stated population
Accordingly, after considering the options, a positivist approach was adopted in this research.
This is because consumer behaviour is well defined and considered to be one of most mature areas
within social research. Moreover, because of its long tradition of research, a number of theories and
models have been suggested and validated to study a variety of marketing phenomena. In addition,
a number of constructs (dependent and independent variables) are available which can be adapted to
study consumer shopping behaviour as an applied marketing science.
However, although this current research adopts a positivistic approach, it crosses the borders
between the two philosophies by conducting some interpretative analysis of interview responses.
Page 93
78
Thus, it is difficult to state that the current research is purely positivistic in nature as qualitative
findings inform the quantitative study (Weber, 2004).
4.3. Research Approach
According to research theory (Bryman and Bell, 2007) the establishment of systematic relationships
between the research and theory has been achieved with the aid of two general strategies including
deductive and inductive approaches. Induction describes moving from specific observations to the
general (to wider generalizations and theories), while deduction begins with the general (theory)
and ends with specific (observations). Both processes have been put forward as suitable models for
research in business. There is an on-going controversy as to which strategy most rapidly enhances
scientific progress as the two schools of thought disagree. As Bryman and Bell (2007, p. p15) state
“however, as the previous discussion has implied, the issues are not as clear- cut as they are
sometimes presented”. The difference between them is mainly concerned with the sequence of the
research process (Bryman and Bell, 2007).
The present study followed the deductive strategy, as it first established a theoretical model,
based mainly on qualitative research, and a literature review. It investigated consumer shopping
behaviour, using empirical data with statistical testing designed to produce generalizable findings
by focusing on specific factors and determine their statistical effect on shopping behaviour.
Employing the deductive approach enhances the generalizability of the research (Saunders et
al., 2009). In addition, the use of structured questions and quantitative data improved the reliability
and validity of the findings. According to Bryman and Bell (2007) and Saunders et al. (2009), the
main steps in the process of deductive research are: firstly, forming hypotheses from theory;
secondly, expressing the hypotheses in operational terms which propose a relationship between two
specific concepts or variables; thirdly, testing these hypotheses; fourthly, examining the outcome of
the inquiry; in terms of confirming the theory or not; and finally, modifying the theory in the light
of the findings if necessary (Saunders et al., 2009). Figure 4-1 presents the process of deduction.
Having discussed the empirical approach of this study, the next section describes the research
design and methods of data collection.
Page 94
79
Figure 4-1: Process of Deduction1
4.4. Data Sources
Because of the lack of secondary data sources regarding the determinants of food shopping
behaviour in Libya, the study mainly depended on primary data collection. This generated
necessary data to analyse the phenomenon under consideration. In designing the collection of
primary data, it was important to refer to former studies, especially in Arab and developing
countries, to focus the study in the correct manner.
4.5. Research Methods
The researcher believed that the quantitative approach, where the effects of independent variables
on dependent variables are statistically assessed, would be more appropriate and a reliable way to
understand the nature of relationships among variables, as well as providing a rich contextual basis
for interpreting and validating the results. This is because the interpretation and findings derived
1Source: Bryman and Bell, 2007, p11.
Theory
Hypothesis
Data collection
Findings
Hypothesis confirmed or
rejected
Revision of theory
Page 95
80
from quantitative research are solely based on measured quantities rather than impressions
(Denscombe, 2010). Even though the qualitative methodology provides very detailed descriptions
of the phenomenon under investigation (Patton, 1990), it is less useful for generalising and testing
hypotheses about relationships between variables. Accordingly, the quantitative approach is more
appropriate for the main part of study which rests on hypothesis testing and generalisation.
In this study both qualitative and quantitative research were used to obtain rich information
about the topic of study and to an increase validity and obtain more robust results (Creswell, 2003).
As noted by Tashakkori and Teddlie (2009, p. 33) “The utility of using mixed methods research
provides better inferences and the opportunity for a greater assortment of divergent views”.
Qualitative research was carried out as preparatory step for quantitative research to give an initial
picture of the research topic as well as to provide more in-depth insights before conducting the main
survey. Quantitative research was conducted to understand the phenomenon under study in-depth,
drawing on statistical measurement and testing of hypotheses and theories.
4.5.1. Qualitative Research
Recently, qualitative techniques have become increasingly popular in marketing research (Kaynak
et al., 2005; Jackson et al., 2006; Webber et al., 2010). “Qualitative” is generally used as a
synonym for any data collection technique (such as interview, observation and focus group) or data
analysis procedure (e.g. categorising data) that generates or uses non-numerical data. Given the
limited previous research, data sources and information on consumer food shopping behaviour in
Libya, it was decided to conduct initial, qualitative research to overcome this deficiency and to
identify the correct conceptual basis.
4.5.1.1. Research Motivations
The interviews encouraged respondents to provide an overview of their shopping habits,
motivations, and attitudes. The main motivations for conducting this research were:
To gain an initial understanding of consumer food shopping behaviour at the local level.
To check that concepts / survey questions taken from research on other countries fitted with
the Libyan case.
Page 96
81
4.5.1.2. Research Methods
There are several qualitative methods such as participant observation, in-depth interviews, and
focus groups (Bryman and Bell, 2007), with the last two being the most common. Focus groups and
in-depth interviews both have advantages and disadvantages. However, this study relied on face to
face interviews. The choice of in-depth interviews was due to a desire to respect certain customs
and traditions, and cultural sensitivities which in many cases do not allow women to meet with
unknown men and also sometimes even with unknown women. This is highlighted later in the
findings of the study regarding social acceptability issues. It would also have been difficult to find a
suitable place and time for conducting focus groups. Although there are some disadvantages related
to in-depth interviews such as the costs in time and money, it is generally considered to be
beneficial in terms of providing a deep understanding of a phenomenon from the consumer’s
perspective and yields high response rates because of the interaction between the researcher and
interviewees (ibid).
4.5.1.3. Sampling
Sampling procedures in qualitative research are not so rigidly prescribed as in quantitative studies
(Coyne, 1997). This flexibility in sampling, however, may be confusing for some researchers and
mistakes may be made (ibid). However, in Patton’s view (1990), all types of sampling in qualitative
research may be encompassed under the broad term of purposeful sampling. Patton (1990) describes
15 different purposeful sampling strategies including snowball sampling, maximum variation
sampling, and convenience sampling. According to Patton (1990) the main aim of purposeful
sampling is to select participants according to the purpose of the research. In this study the objective
was to investigate consumer food shopping behaviour, thus, the target participants were people who
were responsible for food shopping with initially a mixture of ages and both genders selected.
4.5.1.4. Data Collection
Qualitative in-depth interviews were conducted and data collection proceeded in two rounds. All
interviewees regularly purchased food and grocery items for themselves and/or their families.
The First Round
In keeping with Patton’s (1990) notion of purposeful sampling, the first round of interviewing
adopted combination purposeful sampling including snowball and maximum variation sampling to
meet multiple interests and needs. The maximum variation sampling method aims to select study
units which encompass a wide range of variation in the dimensions of interest. In this case, the
researcher was interested in the motives underpinning food shopping behaviour, and assumed that
Page 97
82
gender and socio-economic status were important background variables. Thus, to consider a wide
range of respondents, taking into account a variety of different socio-economic groups, maximum
variation sampling was used by targeting schools, the University, and some government
departments in Tripoli to ensure that men and women as well as different standards of living were
included in the sample. An attempt was made to draw interviews from a variety of different socio-
economic groups as documents in Table 5-1 in Chapter 5.
A snowball sample is a non-probability sampling technique that is appropriate to use in
research when the members of a population are difficult to locate. According to Bryman and Bell
(2007) snowball sampling is regarded as a convenient form of sampling, in which the researcher
collects data on the few members of the target population he or she can locate, then asks those
individuals to provide information needed to locate other members of that population whom they
know (Bryman and Bell, 2007). In other words, this meant in practice that an interviewee
recommended the next interviewee so that “the snowball gets bigger and bigger as you accumulate
new information-rich cases” (Patton, 1990, p. 176). Snowball sampling was used to locate
respondents, who then were asked to suggest other potential participants so that more and more
respondents were obtained.
In the first phase, in-depth interviews were conducted face to face in Tripoli in Summer 2010.
The capital was chosen as it has the most developed network of supermarkets in the country,
providing inhabitants with a clear choice between different types of retail format. Regarding sample
size, in qualitative research, there is no set, initial number of interviews. The research continues
expanding the sample size until a point of theoretical saturation is reached whereby the marginal
interview yields no or minimal fresh insights (Douglas, 2003).
The face to face interviews were designed to encourage respondents to discuss their food
shopping behaviour and underlying motivations in order to provide new insights into this topic from
the point of view of particular Libyan shoppers. This phase of data collection included adult males
and females (thirteen female and nine male) as well as a cross-section of different standards of
living1. The researcher started by identifying some individuals who were relevant to the study, for
example, the managers of schools, friends of university academic staff, and the heads of
1 Interviewees were segmented into rich, middle and poor groups based on monthly income.
Page 98
83
government departments, and then asking them to locate other useful informants, who were
responsible for food shopping.
All interviews were conducted in Arabic. The interviews lasted approximately 35 minutes,
and participation was completely voluntary. The majority of the interviews were conducted in the
interviewees’ workplace. In the first round of data collection, interviews continued until there were
no new data obtained (theoretical saturation) to the questions asked (Bryman and Bell, 2007). In
total twenty two interviews were conducted. Following analysis of the first wave of interviews a set
of theoretical gaps were identified, principally relating to social acceptability and the role of food
shopping as a leisure activity. These issues informed the second stage of interviewing.
The Second Round
This phase of interviews, by focusing on theoretical gaps identified from initial data collection,
again adopted purposeful sampling, drawing on a convenience sample (Coyne, 1997). In general,
convenience sampling refers to use of what is available at the time of data collection not what is
wanted. Interviewees were selected to explore in greater depth important themes that emerged from
the first round of interviews. The main purpose of the second round of interviews was to focus on
gender, social acceptability and shopping roles, and included only female interviewees. Each
interview, conducted by a female Libyan national, began with a statement of the research purpose
and assured respondents of anonymity. Interviewees were happy to discuss their food shopping
behaviour and the interviewer did not encounter any refusals based on religious, cultural or tribal
grounds.
In this phase, ten women were interviewed in December 2010. Interviews were conducted via
Skype. Interviews ranged between 25 and 40 minutes in length. By the end of the second stage, the
marginal interview yielded little new information and a point of theoretical saturation was reached
(Glaser and Strauss, 2009).
4.5.1.5. Ethical Concerns
The ethical implications of the research were carefully considered when planning the research
design and methodology. The research methodology was therefore adapted in line with suitable
ethical principles. Burton (2000, p. 299) stated that “ethical concerns are present in all research
designs and go beyond data collection to include analysis and publication”. These issues should be
at the forefront of the researcher’s mind throughout the research process. Of course, first of all,
formal letters were prepared by the researcher’ supervisors in both English and Arabic language to
Page 99
84
grant permission to conduct interviews, confirming that the researcher is a PhD student at
Newcastle University with the title of project and the aim of the study. Interviewees were not
hostile to being asked to participate and positive responses were received from all those
approached.
Before the interviews took place, a short briefing induction was given to each interviewee.
This informed all interviewees as to the goals and the purpose of the study and asking them if they
would be willing to take part in the research on food shopping behaviour, confirming that the data
collected would only be used for academic purposes. Finally regarding ethical considerations, it was
the task of the researcher to be careful about personal values, morality and ethics in the research
process. Respondents were not asked for their names and addresses, hence their anonymity was
preserved. Rather, the labels (interview1,2,........32) were used to refer to them. Interviewees were
told that they are free to withdraw at any time without giving any reason, and without any
repercussions. Interviews were recorded with the permission of the participants and transcribed
immediately after the interview sessions. The overall process followed all University ethical
guidelines and the code of conduct of the Market Research Society.
4.5.1.6. Interview Questions
In order to generate rich and detailed answers, open-ended questions were utilised. Open-ended
questions are typically more flexible, they allow greater spontaneity and adaptation of the
interaction between the researchers and the respondent and respondents can answer in their own
words. An interview guide (see an Appendix 1) was used in order to keep the conversation focused
upon the main themes. To capture top of the mind imaging the main part of the interview began
with the question ‘When confronted with the words supermarket and market, what comes to mind?’
Subsequent questions considered patterns of food shopping, the use of traditional retail formats and
supermarkets, the advantages and disadvantages of each and shopping styles such as: ‘How often do
you usually shop for food?’. ‘How often do you usually visit the supermarket and the market?’.
‘What are the main factors that influence your patronage of traditional markets and supermarkets?’
In addition, some questions addressed proposed sections of the questionnaire for their applicability
to the Libyan case.
Gorton et al. (2009: p 6) “argued that the scales and research instruments designed to
understand consumer shopping behaviour in Western markets may not incorporate the critical
attributes that underpin decisions elsewhere”. For instance cleanliness and food safety have been
suggested as important factors for declining use of wet markets in Asia (Ho, 2005; Gorton et al.,
Page 100
85
2009) but are not included as attributes in research on Western markets (Lindquist, 1974; Ness et
al., 2002). In addition, in Western contexts the main consideration was to understand consumers’
choice between different types of ‘modern retail’ stores whereas in Libya the main retail choice is
between supermarkets and traditional markets. As a result, several questions were raised to make
sure that the questions to be included in a survey instrument were suitable to the Libyan case.
This first phase identified the importance of social acceptability and culture in explaining
shopping patterns. The second phase of interviews explored these issues in greater depth. Questions
included: is it socially acceptable in Libya for a woman to go shopping in a traditional food market,
is it socially acceptable for a woman to go shopping in a supermarket, and for women are there any
differences between traditional food traditional markets and supermarkets in terms of social
acceptability? answers were explored in depth.
4.5.1.7. Data Analysis
All the interviews were audio-taped, translated semi-verbatim into English, checked for accuracy,
and entered into NVivo8&10, a software program designed for the analysis of qualitative data.
Interview data were analysed using textual analysis to identify key issues and concepts. All data that
related to a particular topic or theme were categorized and given a code name under each research
question and according to topic areas. Data were coded initially through the creation of free nodes.
Coding helped the organization of data and facilitated interpretation. Tree nodes were created as
well as free nodes to record the characteristics of interviewees. The three main types of retail outlets
(supermarkets, independent stores and traditional markets) were used as free nodes for data
analysis. Some themes (parent nodes) were found to have sub-themes (child nodes) such as motives
for shopping; shopper typologies and social acceptability were therefore tree nodes.
Moreover, attribute case nodes recorded descriptive information pertaining to each interview
(e.g. age, sex, income, occupation of interviewee). A cross-consideration of cases and attributes was
useful for comparative analysis, for example, comparing male and female responses to the question
why do you shop?. Sets were used to cluster nodes together into broader concepts based on
potentially meaningful relationships (Hutchison et al., 2009) where the participations were
classified into sets according to for example; gender, cities, occupation as short cut to the item that
was stored elsewhere. In addition, matrices were used to examine how the contents of different
nodes related to each other and to make multiple comparisons between cases and concepts. The
latter were created by querying the data using the matrix coding option (Richards, 1999) such as
Page 101
86
how do female of different occupations and cities group discuss the social acceptability and role of
food shopping as shown in Appendix 4.
4.5.2. Quantitative Research
Drawing on insights from the qualitative research, quantitative research sought further to measure
and understand consumer food shopping in Libya. So in order to obtain the necessary data in the
light of the study purposes, a survey instrument was designed drawing on the literature and the
results of the qualitative research. The initial questionnaire was split into four parts and written in
English. The questionnaire was first translated into Arabic and then translated back into English by
a professional service office (World Translations Limited Company) that is licensed by the United
Kingdom government for official translation from English to Arabic and vice-versa to enhance
translation equivalence.
4.5.2.1. Validity and Reliability
Assessing the validity and reliability of measures is a vital part of the research process (Hair et al.,
2010). Although to a large extent, the scales used in this research were adopted from validated
preceding studies, careful attention was paid to ensuring an accurate fit within the context of this
study. The evaluation of the measures used in this study involved an assessment of the validity and
reliability of the instrument. To this end, it is appropriate to reflect on to what extent the data are
valid and reliable before and after carrying out the main study.
In order to maintain and maximise the questions’ validity and reliability, both pre-testing and
a pilot study were conducted. Green et al. (1988) distinguished between a pre-test and a pilot
survey. Pre-testing is concerned with whether or not the questionnaire asks good questions, flows
smoothly and the questions sequences are logical. A pilot survey is concerned with the validity of
the survey questions. The procedures employed to establish validity and reliability were as follows:
Validity
One criterion for evaluating the soundness of a research instrument is validity. An assessment of
validity indicates how well a particular measure captures what it is designed to measure. In other
words, validity can be defined as the extent to which any instrument measures what it is intended to
measure (Bryman and Bell, 2007). There is no one clear-cut indicator of a scale's validity. Validity
can be divided into two sub-categories: content and construct validity (Hair et al., 2010).
Page 102
87
1. Content Validity
Content validity, also, known as face validity, is the degree of correspondence between the
items selected to constitute a summated scale and its conceptual definition. In this study,
content validity was assessed by asking experts (research supervisors and Libyan academic
staff) to examine survey items and constructs and provide feedback for both the English and
Arabic versions of the questionnaire as part of the pretesting of the study.
2. Construct validity
Construct validity is the approach to validating a measure by determining what construct,
concept or trait the instrument is in fact measuring. There are two categories of content
validity, both of which are of interest in this study: convergent validity and discriminant
validity.
Convergent validity refers to the degree to which items correlate with other measures
within the same construct. In other words, it means that the variables within a single
factor are highly correlated.
Discriminant validity refers to the extent to which factors are distinct and
uncorrelated. In other words, discriminant validity means that individual measured
items should represent only one latent factor.
It is expected that an item is related with other items that measure the same construct
(convergent validity), but differs from items which measure different constructs (discriminant
validity). These two types of validity in this study were assessed using factor analysis. Such
analysis provided an empirical assessment of the relationships between items forming the
conceptual and empirical foundation of a summated scale. On the other hand, content validity was
examined by conducting both pre-test and pilot studies as well as experts’ feedback that is
considered in more detail latter in this chapter.
Reliability
Measures of variables should have reliability in order to draw valid inferences from the research.
Reliability is an assessment of the degree of consistency between multiple measurements of a
variable (Hair et al., 2010). Simply put, reliability refers to the extent to which a scale produces
consistent results if repeated measurements are made on a particular characteristic. Thus, the scale
is free from random error. Although there is more than one approach for assessing reliability such
Page 103
88
as test-retest, intra-observer and internal consistency, this study, however, focused on internal
consistency reliability that can be practically measured by calculating a Cronbach’s Alpha
coefficient, which is a ubiquitous approach within the literature (ibid). The value of Cronbach’s
alpha can range from 0 to 1, with higher values indicating greater reliability. There is much debate
amongst researchers as to appropriate cut-off points for reliability. However, Hair et al., (2010, p.
125) have reported that “the generally agreed upon lower limit for Cronbach’s alpha is 0.70,
although it may decrease to 0.60 in exploratory research”. Therefore, in this study, an alpha value of
0.6 was set as a cut-off point for the acceptance of the measure. In order to quantify scale
reliabilities, Cronbach’s alpha coefficients were computed using SPSS before and after running the
main study.
4.5.2.2. Pre-testing
Pre-testing refers to a trial test of a specific aspect of the study such as the method of data collection
or data collection instrument before finalising it (Dekeba, 2001). Pretesting has several purposes
(ibid):
1. To test whether the instrument obtains responses required to achieve the research objectives.
2. To test whether the content of the instrument is relevant and adequate.
3. To test whether the questions are clear and understandable to respondents.
4. To test the other qualitative aspects of the instrument like question structure and question
sequence.
Pre-testing was divided into two stages: in the first stage, the initial drafts of the questionnaire
in English were revised and modified by the research supervisors who are specialised in the area of
marketing and consumer behaviour at Newcastle University. Comments for improvement were
received from them in respect to the structure of questions, wording and its formats. Also, the
comments of Libyan research students that are particularly related to the translation of the
questionnaire from English to Arabic language besides other comments were taken into account at
this stage. In addition, pretesting was conducted in May 2011 with a total of ten Libyan students at
Newcastle University who were seen as similar to the population for the study and regularly
purchased food and grocery items for themselves and/or their families. Based on the feedback,
minor adjustments in wording were necessary to the questionnaire.
Page 104
89
After designing the questionnaire and prior to commencing the pilot study, some comments
on the suitability of the structure and the design of the questionnaire from some of academic staff at
Omar Al-mukhtar University were obtained. This helped improve the survey instrument (Arabic
version). Obtaining advice from a group of experts should enhance validity and help to make
necessary alterations prior to pilot testing (Saunders et al., 2009; Hair et al., 2010).
4.5.2.3. Pilot Study
A pilot study is a small test conducted prior to the full survey; in order to improve the latter’s
quality and efficiency (Thabane et al., 2010). A pilot study is more formal than pretesting, typically
involving responses from approximately 10% of the required full sample, drawing on respondents
as similar as possible to the survey population (Teijlingen and Hundley, 2001). The main aim was
to check if there were any problems that the respondents may experience, such as the time required
by the participants to fully complete the questionnaire, the clarity of the instruction, if there were
unclear or ambiguous questions, if there was any question which was not easy to answer, whether
the layout was clear and attractive, and if they had any other comments. In other words, this aimed
to ensure that there were no unanticipated difficulties and to further enhance content validity.
At this stage, draft of the questionnaire in Arabic version was tested using a convenience
sample of 100 respondents in El Bayda city in the Eastern part of Libya in June 2011. In order to
maximize feedback, data collection occurred via face to face interviews. The pilot test sample was
excluded from the final sample. As a result a number of adjustments were made to the running order
of the questions and their layout in the light of the findings from the pilot study. For example, “I
have no experience” was added as a response category because some participants stated that they
had never shopped at a particular retail format, so they could not evaluate it as good or bad. In
addition, respondents found it difficult to understand a question relating to the average percentage
of their total spending accounted for by different retail formats across food product categories.
Accordingly, more details were provided as a footnote to improve comprehension.
As shown in Table 4-1, Cronbach’s alpha values for all the scales used in the study exceeded
the 0.6 threshold suggested by Hair et al. (2010). Thus, no items were selected for deletion based on
this analysis. Since the pilot test indicated no cause for concern, consequently, the questionnaire
was considered satisfactory for conducting the main research.
Page 105
90
Table 4-1: Reliability Results of Questionnaire
Construct N of
Items
N of
Cases
Cronbach’s Alpha
pilot final
Food shopping motivations 59 100 0.810 0.815
The importance of store attributes 17 100 0.752 0.719
Evaluation of supermarket 17 100 0.872 0.855
Evaluation of traditional market 17 100 0.871 0.956
Evaluation of independent store 17 100 0.898 0.885
As can be seen in Table 4-1 there is a difference in the reliability coefficients between the
pilot study and the final research sample relating to all considering scales. Cronbach’s Alphas
scores were higher for the final sample compared to the pilot study in terms of food shopping
motivations and the evaluation of traditional market scales. Conversely, Cronbach’s Alpha values
for the importance of store attributes and evaluation of supermarket and independent store scales
were relatively lower than in the pilot study. However, overall, it can be concluded that the
Cronbach alpha scores indicate the reliability of the measures used. The reliability of measures is
further assessed in Chapter 6, Section 6.4.1.
In general, the pilot results demonstrated that the questionnaire covered important aspects
identified within the literature review and qualitative research. In particular, the items of the
questionnaire were relevant from both academic and participants’ perspectives. Therefore, the
questionnaire could be accepted as possessing content validity as Hair et al. (2010) indicate that an
appropriate way of measuring content validity is to use the judgement of individuals with expertise
in some aspect of the subject under study in order to comment on the wording of the items. The
final questionnaire was easier to understand, had a better flow of questions and, more importantly,
respondents did not have any difficulty in answering the questions. Subsequently, data collection
was initiated using the final version of the questionnaire. The final versions (English and Arabic) of
the questionnaire used in this study are presented in Appendices 2 and 3. A summary of the
methods employed to establish validity and reliability of measures is presented in Figure 4-2.
Page 106
91
Figure 4-2: The Methods used to Establish Validity and Reliability of Measures
4.5.2.4. Questionnaire Structure
The main elements of the questionnaire that were developed for some constructs based on the
exploratory interviews along with previous scales found in the literature were as follows:
a. Food Shopping Behaviour
This section addressed three main aspects of food shopping behaviour. Firstly, with respect to
shopping activity, specific questions concerned frequency of shopping, and frequency of visits to
traditional markets, supermarkets and independent stores (Ness et al., 2002; Gorton et al., 2009). In
addition, in recognition that patterns of behaviour may vary across food product categories,
questions about the average percentage of respondents’ total spending on fresh fruit and vegetables
(FFV), fresh meat, fresh fish, packaged goods and beverages accounted for by traditional markets,
supermarkets, and independent stores in a typical month was included (Gorton et al., 2009). Finally,
financial aspects were investigated with nominal questions concerning monthly expenditure on food
(Ness et al., 2002; Gorton et al., 2009).
Content validity
Pre-test and pilot
Studies
Construct validity
Convergent validity (High correlation)
Factor analysis
Discriminant validity (Low correlation)
Factor analysis
Validity and reliability of
measures
Validity Reliability
(Cronbach’s Alpha ≥ 0.6)
Page 107
92
b. Shopping Motivations and Decision Making Styles
To understand shopping motivations and decision making styles, a set of items adapted from Jamal
et al. (2006) were included. In addition, based on the findings of the qualitative research, items
relating to gender and shopping tasks and social acceptance were added as they were presumed to
be important in understanding the Libyan case. The use of Jamal’s study reflects the convergence in
a lot of factors such as culture and religion between the two countries studied (Qatar and Libya).
Questions were in the form of Likert-scale items, scoring from 1 (strongly disagree) to 7 (strongly
agree). According to widely acknowledged studies of shopping motivations and decision making
styles, these motivations were identified as role playing, utilitarian shopping, hedonic shopping,
social shopping, gratification seeking, adventure shopping, brand loyal orientation, value seeking,
confusion, impulsiveness, high quality consciousness, brand consciousness and novelty seeking
(Tauber, 1972, Arnold et al., 1983, Jamal et al., 2006). This type of response scale offers the
researcher a wider range of possible scores, and increases the options for statistical analysis
(Pallant, 2010).
c. The Consumer’s Patronization Decisions
Several attributes have been identified in the marketing literature as determinants of store patronage
and choice. To identify salient retail outlet attributes and other determinants of food shopping
behaviour, respondents were asked to rate the importance of various potential factors in influencing
their choice of retail format. This drew on items identified as salient within the retailing literature
(Lindquist, 1974; Arnold et al., 1983; Solgaard and Hansen, 2003; Sohail, 2008 Gorton et al.,
2011).
Specifically, the items included were: convenient location, assortment, variety of products,
quality of product, food safety, price, assortment, special offers, speed and quality of service,
method of payment, cleanliness, atmosphere, and other facilities. Respondents rated the importance
of each potential factor (e.g. cleanliness of place) in determining their choice of retail format for
purchasing food on a five-point Likert-type scale ranging (1 = not important, 5 = most important).
To understand how different retail formats performed on each of these potential factors, respondents
rated the performance of supermarkets, traditional markets, and independent stores for each
attribute again a five point scale (1 = very poor, 5 = very good) was used.
Page 108
93
d. Demographic Characteristics
The aim of this section was to classify respondents in terms of their demographic and socio-
economic characteristics. Specifically this included nominal questions relating to a respondent’s
age, gender, level of education, employment, marital status, number of the household members,
nationality and monthly income (Ness et al., 2002; Alhemoud, 2008).
4.5.2.5. Measurement and Scaling of the Research Concepts
The survey drew on a mixture of closed question formats including Likert, ordinal, and nominal
scales. Measurement is important in accurately representing the concepts of interest and it is
instrumental in the selection of the appropriate method of analysis (Hair et al., 2010). The Likert
scale is assumed to be an interval scale that is used to ask respondents to indicate whether for
example they agree or disagree with a series of mental beliefs or behavioural belief statements
(Saunders et al., 2009). In this regard, there is no single optimal number of categories because the
number of scale categories is influenced by the data collection method, the respondents’ knowledge
about the subject, the nature of the objects, and the type of analysis (Malhotra and Birks, 2007). In
this context, the research employed a mixture of 5 and 7 points scales to be consistent with the scale
measurements and procedures those were previously employed to validate the scales. This allowed
for direct comparison with mean scores in previous studies. In the pilot study, considering the two
different points of scale, none of the respondents felt uncomfortable or confused, so no changes
were made in this regard.
4.5.2.6. The Study Area
Initially it was planned to conduct the survey in the capital city (Tripoli). However, due to the
uprising that took place in Libya in February 2011 and NATO military action, the study area was
changed to Benghazi. Benghazi was chosen as an alternative location for the study for several
reasons; firstly, it is the second largest city in Libya. Secondly, Benghazi accounted for
approximately 12 per cent of Libya’s total population according to the 2010 census (General
Authority for Information, 2010). Thirdly, although the concept of supermarket-anchored shopping
centres has yet to fully appear in Libya, Benghazi is one of the most important urban centres and
has witnessed a rise in foreign investment as well as an increase in the number of supermarkets.
Finally, at the time of data collection it was located in the liberated part of Libya, where the
researcher could work in a relatively safe atmosphere.
Page 109
94
4.5.2.7. Sampling Methods
According to the General Authority for Information (2009), Benghazi can be divided into 32
neighbourhoods including the suburbs. Only the main districts inside Benghazi are shown in Figure
4-3. The neighbourhoods where data were collected are indicated in blue font. However, there is a
lack of information about household characteristics. To overcome this limitation, households were
classified based on the neighbourhoods to which they belong. In general there is clear classification
of neighbourhoods based on standard of living (rich, middle, and poor classes).
To construct the sample, quota sampling was employed first. The aim of quota sampling is to
produce a sample that reflects a population in terms of the relative proportions of people in different
categories (Bryman and Bell, 2007). By using this sampling approach however, because of several
challenges that were confronted by the researcher such as the lack of safety and cooperation of
people, especially after the killing of General Abdul Fatah Younis Al- Obeidi, which occurred
during the compilation of the questionnaire, the rate of response was very low.
Figure 4-3: Map of Benghazi city
To ensure a target of 300 responses was achieved (a minimum required for the statistical
analysis employed); the sample was augmented using a team of data collectors consisting of the
friends and relatives of the researcher. Thus, the sample consisted of Libyans known to the
fieldworkers (relatives, friends and neighbours).
Page 110
95
4.5.2.8. Data Collection
This study relied on self-administered questionnaires using a drop-off / pick-up method. Kaynak et
al (2005, p. 39) claimed that “the drop-off /p ick-up is a data-gathering method incorporates the
advantages of both personal interviews and self-administered questionnaires”. Although there are
some disadvantages related to this method such as no control over participant interpretation, it is
generally considered to be beneficial in terms of everybody answering the same questions which
assisted in minimising interviewer bias, the possibility of asking more complex questions and
saving time and money (Bernard, 2006).
To increase the response rate, more than one visit was made to collect completed
questionnaires. Of the 1,700 questionnaires that were delivered, a total of 600 questionnaires (35
per cent) were returned. Of this total, 371 completed questionnaires were used in the data analysis.
The survey was conducted from July to September 2011. The reason why the survey took nearly
three months to administer was the 17th February revolution and surrounding events which
substantially hampered data collection.
4.5.2.9. Analytical Techniques
The data was statistically analysed by using appropriate software packages (Amos 19 (CFA), SPSS
19 (EFA& CA), and Stata 11(SEM) taking into account differences in the nature of data and the
research objectives. To understand shopping behaviour, the major techniques were factor analysis
(including confirmatory and exploratory analysis) and cluster analysis. In addition, econometric
analysis was applied. These techniques have been considered in some previous research in this area
(Ness et al., 2002; Arnold and Reynolds, 2003; El-Droubi, 2004; Bai, 2006; Alhemoud, 2008;
Sohail, 2008; Gorton et al., 2009). Of course, descriptive analysis was applied initially to
summarise sample characteristics.
4.5.2.10. Confirmatory Factor Analysis (CFA)
Confirmatory factor analysis is a means of testing how well measured variables represent a smaller
number of constructs (Hair et al., 2010). The primary objective of CFA is to determine the ability of
a predefined factor model to fit an observed set of data. CFA was used to test how well a number of
factors that were determined by previous research (Jamal et al., 2006) fit the Libyan case. The key
was to identify significant factors that affect food shopping behaviour in the Libyan context. CFA
relies on several statistical tests to determine the adequacy of model fit to the data:
Page 111
96
1. The chi-square test indicates (χ2) the amount of difference between expected and observed
covariance matrices. A chi-square value close to zero indicates little difference between the
expected and observed covariance matrices. In addition, the probability level must be greater
than 0.05 when chi-square is close to zero. The hypotheses of perfect fit were:
H0: there is no statistically significant difference in the observed sample and
estimated covariance matrices, meaning that the model fits perfectly.
H1: there is statistically significant difference in the observed sample and
estimated covariance matrices.
However, one disadvantage of using the x2
test is its sensitivity to sample size, rendering
it unclear in many situations whether the statistical significance of the chi square statistic is due
to poor fit of the model or to the size of the sample. This uncertainty has led to the use of many
other measures to assess overall model fit (Hair et al., 2010). These statistics include: Absolute
Fit Indices such as Goodness of Fit Index (GFI), Root Mean Square Error of Approximation
(RMSEA), and Normed chi-squared test (GOF). Absolute Fit Indices are a direct measure of
how well the model that was specified reproduces the observed data (ibid). Incremental fit
indices include the: Normed Fit Index (NFI), Tucker-Lewis Index (TLI), and Comparative Fit
Index (CFI). Parsimony Fit Indices provide information about which model among a set of
competing is best, such as the Adjusted Goodness of Fit Index (AGFI) and the Parsimony
Normed Fit index (PNFI) (ibid). However, Hair, et al. (2010, p. 672) argued that “at least one
increment index and one absolute index, in addition to the chi square test (x2) value and the
associated degrees of freedom should be reported to provide adequate evidence of model fit”.
This analysis follows the recommendations of (Hu and Bentler, 1999) by focusing on:
2. Root Mean Square Error of Approximation (RMSEA), which is one of the most widely used
measures that attempts to correct for the tendency of the x2 test statistic to reject models with a
large sample or a large number of observed variables (ibid). RMSEA values range from 0 to 1
with a smaller RMSEA value indicating better model fit.
3. The Comparative Fit Index (CFI) is an incremental fit measure, equal to the discrepancy
function adjusted for sample size. CFI ranges from 0 to 1 with a higher value indicating better
model.
Page 112
97
The question of what constitutes a good fit is debatable. Even though several cut off values
have been discussed in the literature, the rules of thumb that were suggested by Hu and Bentler
(1999) were applied to evaluate the model’s goodness of fit in this study. Following this, acceptable
model fit is indicated by an RMSEA value close to 0.06 and a CFI value close to 0.95. Hu and
Bentler (1999) claimed that using these cut off criteria contribute to lower Type II error rates with
acceptable costs in terms of Type I error rates.
After undertaking CFA, it was necessary to assess construct validity. Construct validity is the
extent to which a set of items actually reflects the theoretical latent construct those items are
designed to measure. Construct validity can be assessed in several regards:
1. Convergent Validity: There are several possible ways to estimate it:
a. Factor Loading: sufficient or not loadings depend on the sample size. Generally, the
smaller the sample size, the higher the required loading as shown in Table 4-2. Even
though, Hair et al. (2010), suggested that factor loadings in the range of± 0.3 to ± 0.40
are considered acceptable for interpretation of the structure, values greater than ±0.5 are
considered necessary for practical significance.
Table 4-2: Guidelines for identifying significant factor loading
Sample size Sufficient factor loading
50 0.75
60 0.70
70 0.65
85 0.60
100 0.55
120 0.50
150 0.45
200 0.40
250 0.35
350 0.30
Source: Hair et al. (2010)
Page 113
98
b. Average Variance Extracted (AVE): it is calculated as the mean variance extracted for the
items loading on a construct and is a summary indicator of convergence. An AVE of 0.5 or
higher is a good rule of thumb suggesting adequate convergence (Hair et al. 2010). An AVE
of less than 0.5 implies that more error remains in the items than variance explained by the
latent factor (ibid). In other words, the latent factor is not well explained by its observed
variables. The general computational form of AVE as presented in Equation 3
∑
[3]
Where:
Li = the standardized factor loading and i= the number of items.
2. Discriminant Validity: one way to examine discriminant validity is to compare the AVE
estimates for each factor with the Maximum Shared Squared Variance (MSV), and Average
Shared Squared Variance (ASV). Both MSV and ASV should be less than AVE (Lim et al.,
2006; Gaskin and Oakley, 2010).
3. Construct Reliability (CR): is computed from the squared sum of factor loading (Li) for
each construct and the sum of the error variance terms for a construct(ei) as shown in
Equation 4:
(∑ )
(∑ )
(∑
)
[4]
The rule of thumb is that values of 0.7 or higher indicator good reliability. CR scores
between 0.6 and 0.7, however, may be acceptable if accompanied with other good indicators
of a model’s construct validity.
Page 114
99
4.5.2.11. Exploratory Factor Analysis (EFA)
Given the poor degree of fit of Jamal et al.’s (2006) model (as discussed in Chapter 6, section 6.4)
exploratory factor analysis was applied. The main purpose of the EFA was to identify the
underlying dimensions in original variables. Factor analysis can be defined as “a statistical approach
that can be used to analyse interrelationships among a large number of variables by defining sets of
variables that are highly interrelated, known as factor with a minimal loss of information” (Hair et
al., 2010: p. 16). Factor analysis is used to determine the number of common factors influencing a
set of measures and identify the strength of the relationship between each factor and each observed
measure. The most important requirements to apply factor analysis are that the variables should be
quantitative at the interval or ratio level (metric) and correlated. However, factor analysis can be
used with ordinal data if the scale is five or more, and data can be treated as interval data.
c. Data Correlation
To confirm that the data are correlated there are two approaches:
1. Bartlett’s test for Sphericity: this is a statistical test that used to examine whether the
variables are uncorrelated (ibid). This method is implemented by comparing the significance
statistic produced in the output with a chosen level of significance, for example 5 per cent or
0.05. The test is based on the following hypotheses:
H0: none of the variables are correlated.
H1: the variables are correlated.
If the statistic is greater than the level of significance, the null hypothesis (H0) will be
accepted. This implies that the data are not related and therefore unsuitable for factor analysis
(Hair et al., 2010).
Kaiser-Meyer-Olkin test (KMO test). The KMO test is a measure of sampling adequacy
which “compares the observed correlation coefficients to the partial correlation coefficients”
(Ahmad el at., 2008: p.7). This test is based upon an index, as classified by Kaiser (1974) and Hair
et al. (2010) and shown in Table 4-3. Large values for the KMO measure indicate that the data are
suitable for factor analysis.
Page 115
100
Table 4-3: KMO Index
KMO Index Description
0.9 Marvellous
0.8 Meritorious
0.7 Middling
0.6 Mediocre
0.5 Miserable
<0.5 Unacceptable
Source: Hair et al. (2010)
The extraction technique principal axis factoring with Varimax rotation method (Arnold and
Reynolds, 2003; Jamal et al., 2006) was applied. Although both principal component and common
factor analysis using principal axis factoring models yield similar results in common research
settings, the common factor analysis is most appropriate if the primary objective is to identify the
latent dimensions in the original variable whereas principal component is most appropriate when
data reduction is the paramount objective (Hair et al., 2010). Varimax rotation of factors, which is
one of the orthogonal approaches, is performed to simplify the interpretation of result (ibid). By
simplifying the rows and columns of the factor matrix, the interpretation may improve and some of
the ambiguous factors in a non-rotated solution may reduce (Mai, 1997). In order to determine the
number of factors to be included in the final statistics, all of the variance of each of the variables
must be accounted for by all of the factors. The determination of the appropriate number of factors
was based on the eigenvalue criterion and examination of the scree plot. The factors scores were
saved and used as the basis for cluster analysis.
d. Evaluation of the Goodness of Fit of the Solution
Goodness of fit of the solution can be evaluated using two main methods:
1. Communality: is the proportion of the variance of a specific variable explained by all the
derived factors, or total amount of variance of an original variable shared with all other
variables included in the analysis. Communalities > 0.6 are respectable for social science
data (Ness, 2009).
2. Total Variance Explained: the total Variance Explained is the combined contribution to
total variance of the set of all derived factors. Total variance explained > 0.6 is respectable
for social science data (ibid).
Page 116
101
4.5.2.12. Cluster Analysis
Cluster analysis is used to classify objects into meaningful groups. It is therefore “a group of
multivariate techniques whose primary purpose is to group objects based on the characteristics they
possess” (Hair et al., 2010, p. 508). Clustering techniques have been applied to a wide variety of
marketing research issues (Ness et al., 2002; Arnold and Reynolds 2003; Jamal et al., 2006;
Milošević et al., 2012).
The main aim of cluster analysis is to group things (people, products…etc.) on the basis of
similarity, so that the objects in the same cluster should be as similar (homogenous) as possible. In
contrast, the objects belonging to a different group should be as dissimilar (heterogeneous) as
possible. Cluster analysis was applied to produce a typology of Libyan shoppers. The cluster
analysis followed two stages.
In the first stage, hierarchical cluster analysis was employed to group shoppers into
homogeneous groups based upon their attitudes to shopping behaviour. The main purpose of using
hierarchical clustering was to ascertain the number of clusters and establish seed points for the
application of the non-hierarchical method (k means) that was applied as a second stage (Milošević
et al., 2012; Jamal et al., 2006; Arnold and Reynolds 2003).
1. Hierarchical Clustering
Following the agglomerative approach, hierarchical clustering begins with ungrouped objects
and merges them into a successively smaller number of groups (Everitt et al., 2011). At first,
there are as many clusters as there are objects. At the end, there is a single cluster of all
objects. The merger takes place between the objects that are most similar (nearest) so that at
each stage the number of clusters is reduced by one (ibid). The researcher has to decide the
appropriate number of clusters (solutions) by considering the agglomeration schedule and
Gower diagram. The latter shows that the distances at which mergers took place.
2. Non-Hierarchical Techniques
In the second stage, a k-means clustering procedure was conducted with the initial seeds that
were provided by the hierarchical analysis solution. According to (Hair et al., 2010), to select
seed points there are different approaches: research specified and sample generated. One
common approach within the research specified method is the use of a hierarchical clustering
solution to generate seed points. Following this, the results can be refined because of the ability
Page 117
102
of the non-hierarchical methods that allow for the changing of cluster membership (Punj and
Stewart, 1983).
4.5.2.13. Outlier Detection
Outliers are “observations with a unique combination of characteristics identifiable as different
from the other observations” (Hair et al., 2010, p. 64). In other words, outliers are the cases that
have data values that are very different from the majority of cases in the data set. Outlier analysis
was undertaken because they can affect the results of the data analysis. For outlier detection there
are various approaches depending on the application and number of observations in the data set
including: a univariate (an unusual value for a single variable), bivariate (an unusual value for two
variables), and multivariate (an unusual combination of values for a number of variables)
perspective (ibid). This study utilized box plots to identify outliers by plotting the distance of cases
to their cluster centres (Norusis, 2011).
4.5.2.14. Analysis of Variance (ANOVA)
Analysis of variance (ANOVA) was applied to investigate the factors that affect consumers’ choice
of retail format, as well as to profile how supermarkets, traditional markets, and independent stores
scored on each attribute (location, price of products special offers, assortment, quality of service,
speed of service, quality of product, variety of product, freshness of produce, atmosphere,
cleanliness of place, food safety, personal safety, in-store credit, car parking facilities, and social
acceptability). The null hypothesis was that the mean scores between the three retail outlets were
equal against the alternative hypothesis that they were not equal to indicating if there were
significant differences between them in each attributes.
4.5.2.15. Chi- Squared Test
A Chi-square contingency test using cross tabulations was applied to profile consumer food
shopping behaviour groups using nominal variables. This included demographic and socio-
economic characteristics, frequency of retail outlets visits, time spent in store, and percentage of
spending in retail outlets. The test was established by examining statistically significant differences
between clusters based on the null hypothesis that target variables and consumer groups are
independent.
4.5.2.16. Econometric Analysis
To better understand the determinants of consumer food shopping behaviour, the study incorporated
the estimation of a bootstrapped ordered Probit model and a bootstrapped Tobit model using
Page 118
103
Stata11 software. Bootstrap methods are powerful tools that can be defined as “a computer- based
method for assigning measures of accuracy to statistical estimates” (Efron and Tibshirani, 1993, p.
10). The main purpose of using the bootstrap procedure was to check the reliability of a model,
applying a simple stochastic resampling procedure (Efron, 1979; Jeong and Maddala, 1993). The
bootstrap procedure (1000 replications) was used to estimate standard errors and to construct
confidence intervals (Jeong and Maddala, 1993; MacKinnon and Smith, 1998).
1. Ordered Probit Model
The ordered Probit models sought to identify the determinants of frequency of visits to
supermarkets, traditional markest, and independent stores. Demographic, socio-economic and
retail outlet image dimensions were incorporated as independent variables. The ordered Probit
approach is appropriate for ordered dependent outcomes (Okoye et al., 2010).
The Ordered Probit model can be derived from a latent variable model. The key idea is
that there is a latent continuous metric underlying the ordinal responses observed by the
analyst. The latent continuous variable, y* is a linear combination of some predictors, x, plus a
disturbance term that has a standard normal distribution (Jackman, 2000). The ordered Probit
model takes the following form (Maddala, 1983):
yi* = xiβ +εi , ε ≈ N(0,1), i= 1,……N. [5]
Where yi, is the observed ordinal variable, ß is vectors of unknown parameters, x, is a
set of explanatory variables, ε is the error terms, which is assumed to be normally distributed,
and subscript i denotes the individual observation. The observed data is assumed to be
generated from yi* in the following way:
yi* = 1 if y*≤ c1
yi* = 2 if c1≤ y* ≤c2
(……)
yi* = J if cJ-1≤ yi*
The unknown cut-offs points (c's) are defined as thresholds between the categorical
responses that are estimated. According to Maddala (1983), the thresholds’ parameters should
Page 119
104
satisfy two conditions: the thresholds should meet the relationship c1< c2< ... < cJ-1, and all of
them must be positive. Failure to meet these conditions means that there is some specification
error in the model (ibid). The thresholds c's indicate the range of the normal distribution
associated with specific values of the response variable (Abdel-Aty, 2001). To estimate the
Probit models, the Maximum Likelihood (ML) method was employed.
The categorical dependent variables y, in this case was frequency of visits to
supermarkets, traditional markets, and independent stores following categories “1” for
“everyday”, “2” for “2-3 times a week”, “3” for “once a week”, “4” for 2-3 times a month”,
“5” for “ once a month”, and “6” for “never shop in particular format”. The vectors of
explanatory variables x contain the following independent variables related to retail outlet
attributes: location, price of product, special offers, assortment, quality of service, speed of
service, quality of product, variety of product, freshness of produce, atmosphere, cleanliness
of place, food safety, personal safety, in-store credit, car parking facilities, and social
acceptability. Respondents rated the importance of each of the retail outlet attributes on a five-
point scale (1= not important, 2= minor importance, 3= moderate importance, 4= important,
5= very important). Socio-economic characteristics that were included in the models were:
gender, marital status, age, number of family members, income, level of education,
nationality, whether the respondent had lived abroad, migration, and occupation.
2. Bootstrapped Tobit Model
The second stage of the econometric analysis was the estimation of Tobit models (Tobit, 1958).
The latter are defined by Maddala (1983) as follows:
yi* = βxj + εj [6]
Once again the observed data is assumed to be generated from yi* in the following way:
yj = yi* if yi* > 0
yj = 0 if yi*≤0
Page 120
105
Where y* is latent variable, where it is observed only if it is larger than zero; β is the corresponding
vector of unknown parameters; xj is vector of known constants. The model error εj is assumed to be
independent and normally distributed.
The Tobit model is used for a ‘limited’ metric dependent variable (Bierens, 2004). It was
chosen to empirically investigate the determinants of the percentage of household expenditure
accounted for by markets and supermarkets for selected product categories. Specifically, the
censored dependent variables were the percentage of spending accounted for by supermarkets,
traditional markets, and independent stores for the following product categories: fresh fruit and
vegetables, fresh meat, fresh fish, and packaged goods. Retail outlet attributes and socioeconomic
variables were used again as the independent variables. Values of the dependent variable, by design,
had to be within the range 0 and 100. In order to evaluate model performance, several tests can be
evaluated such as Likelihood Ratio test (LR), Wald test, and Pseudo R-Squared measure.
4.6. Conclusion
In brief, this chapter provided a discussion of the methodological approach to the study, which
serves as a basis for fulfilling the research objectives. A summary of the research methodology is
presented in Figure 4-4. The research design was based on the positivistic paradigm with a
deductive approach to the process of collecting and analysing data. In this study multiple research
methods, combining qualitative and quantitative research were employed. In order to obtain the
necessary quantitative data to investigate the phenomenon under study, a structured questionnaire
was designed. The initial development of the questionnaire was based on the research objectives,
lessons from the literature and the findings of the qualitative research. In order to clarify the
questions and the appropriateness of the proposed scales both pretesting and a pilot study were
conducted. After some minor modifications in the light of the pilot study were made, the
questionnaire was distributed relying typically on self-administered questionnaires using a drop-off/
pick-up method. Various statistical and econometric tests were applied to analyse the data
thoroughly.
Page 121
106
Methodology
Positivistic Paradigm with Deductive Approach
Quantitative
Interviews (32)
Final Questionnaires
(371)
Data Analysis
Con
firm
ato
ry
Fact
or
An
aly
sis
Pilot test
(100)
Pre-test
(10)
Questionnaire Design Process
Revise
Revise
Qualitative C
lust
er
An
aly
sis
Explo
rato
ry
Fact
or
An
aly
sis
Tex
tua
l
An
aly
sis
Eco
nom
etri
c
An
aly
sis
Figure 4-4: Summary of the Research Methodology
Page 122
107
Chapter 5 Qualitative Research
5.1. Introduction
Given limited previous research, data sources, and information on consumer food shopping
behaviour in Libya, qualitative in-depth interviews were conducted. Data collection proceeded in
two rounds. In the first phase, interviews were conducted face to face in Tripoli in summer 2010.
Following analysis of the first wave of interviews a set of theoretical gaps were identified,
principally relating to social acceptability and the role of food shopping as a leisure activity. Given
the limited literature on these issues, a second stage of interviewing was undertaken. The objective
was to better understand patterns of food shopping and patronage in Libya as well as to formulate
research propositions that would be examined and tested in the quantitative phase.
In the first round of data collection, interviews continued until a point of theoretical
saturation, where no or little new information was gained (Bryman and Bell, 2007). In both stages,
the sample was purposeful, looking for cases that gave maximum information. In total, twenty-two
face to face interviews (thirteen female and nine male) and ten interviews via Skype (female) were
conducted in the first and second rounds respectively (see Table 5-1).
Open-ended questions in order to generate rich and detailed answers were raised. An
interview guide (see an Appendix 1) was used in order to keep the conversation focused upon the
main themes. As a starting point, ‘Are you the person who undertakes food shopping for your
household?’ was used as a filter question. To capture top of the mind imaging the main part of the
interview began with the question ‘When confronted with the words supermarket and market, what
comes to mind?’ Subsequent questions included ‘How often do you usually shop for food? ’. ‘How
often do you usually visit the supermarket and the market?’. ‘What are the main factors that
influence your patronage of markets and supermarkets?’. In addition, some questions addressed
proposed sections of the questionnaire to check their applicability to the Libyan case.
Page 123
108
Table 5-1: Details of Interview Participants
Interviewee Gender Young
couple1
Socioeconomic2
status2
Age Interview
location
Occupation3
1 Male No Rich 56 Tripoli An engineer
2 Female No Rich 57 Tripoli A teacher
3 Female Yes Poor 30 Tripoli A teacher
4 Male No Rich 45 Tripoli A lecturer
5 Female No Poor 25 Tripoli An officer
6 Female No Poor 28 Tripoli A teacher
7 Male No Rich 50 Tripoli A businessman
8 Female No Poor 40 Tripoli A teacher
9 Male No Rich 49 Tripoli A lecturer
10 Male No Middle 42 Tripoli A teacher
11 Female No Poor 46 Tripoli A housewife
12 Female No Rich 33 Tripoli An engineer
13 Male No Rich 54 Tripoli A lecturer
14 Female No Poor 38 Tripoli A teacher
15 Male No Poor 40 Tripoli An officer
16 Female Yes Poor 29 Tripoli An officer
17 Female No Rich 42 Tripoli A lecturer
18 Female Yes Rich 35 Tripoli A lecturer
19 Female No Rich 45 Tripoli A lecturer
20 Female Yes Poor 34 Tripoli A teacher
21 Male No Middle 68 Tripoli A retired
22 Male No Poor 44 Tripoli A teacher
23 Female No Rich 37 Tripoli A lecturer
24 Female Yes Poor 32 El-Bayda A demonstrator
25 Female No Rich 42 El-Bayda a lecturer
26 Female No Rich 41 Benghazi A lecturer
27 Female No Rich 35 Tripoli A lecturer
28 Female Yes Poor 31 Misrata A teacher
29 Female No Rich 58 Benghazi A businesswoman
30 Female Yes Rich 31 Benghazi A lawyer
31 Female No Poor 28 El-Bayda A teacher
32 Female No Rich 35 Benghazi A doctor
1 The participants who are under 35 years old and married are considered a ‘young couple’.
2 Socioeconomic status: ‘Rich’ = monthly income is above 550 LYD per month, ‘Middle’ = monthly income is between
450 and 550 LYD per month, ‘Poor’ = monthly income is below 450 LYD per month (where 1 USD = 1.27 LYD on 1
August 2010).
3 Part time including: teachers, a lawyer, and a demonstrator; full time such as lecturers, engineers, businesspeople,
officers, and doctors.
Page 124
109
5.2. Research Findings
Textual analysis of the interview data provided insight into perceptions of the competing retails
formats in Libya, the social acceptability of traditional food markets, the social acceptability of
supermarkets, how the social acceptability of supermarkets differs from that of traditional food
markets for females, cultural change in Libyan society, retail attributes, evaluation of retails
formats, and, finally, typologies of shoppers. In presenting the findings particular emphasis is
placed on the themes of social acceptability and gender, given their salience in the Libyan case and
their lack of prominence in the literature relating to the adoption of supermarkets in developing
economies. Quotations illustrate, unless otherwise indicated, common perspectives.
In this section the findings of the in-depth interviews are presented and discussed. First of all
the participants, when confronted with the words “supermarket” and “market” stated different
views. Interview evidence indicated that supermarkets compared to traditional food outlets offer a
safer shopping environment, which is cleaner, bigger, offers a wider range of products and less
crowded.
The first thing that comes to mind is that the supermarket is bigger than the market. As a result, there
will be a wide range of products. The second thing, in my opinion, the prices in supermarkets are
lower so commodities will be in continuing movement (male, interviewee1, 56, an engineer).
The supermarket is a very interesting place not only for buying food, but also for spending enjoyable
time (female, interviewee6, 28, a teacher).
The supermarket is a very large shop which sells all things. The market especially the traditional
market usually, is an open market for buying fresh vegetables and fruits that was, in past open weekly
on a particular day (souk Al thalatha) which means (Tuesday market), but now it has been opening
every day (female, interviewee19,45, a lecturer).
The supermarket is a big place. Also there are a lot of products where I can get all my requirements
instead of shopping at more than one market (female, interviewee23, 37, a lecturer).
In the supermarket there is a great chance to do comfortable shopping, because of expansiveness of
the place, availability of baskets and trolleys, and variety of products (female, interviewee24, 32, a
demonstrator).
However, not all were positive about supermarkets. As one interviewee remarked:
Page 125
110
The first thing which comes to mind is that there is a very boring and long queue waiting for me. In
my opinion, the supermarket is just decor (female, interviewee8, 40, a teacher).
In brief, although, answering the previous question was taken up from multiple angles, in
general, all participants had a basic understanding of the differences between supermarkets and
traditional markets by identifying the most important attributes of supermarkets versus traditional
markets such as variety of products and prices, large area and atmosphere.
5.2.1. Retail Formats
Interviewees identified three main types of food retail formats in Libya: supermarkets, independent
stores and traditional markets. The identification of the principal types of food retail outlet led to a
discussion concerning their features and relative merits. The vast majority of respondents revealed
that they shopped in a combination of traditional markets, independent stores and supermarkets,
although if respondents did use just one format it was a supermarket as:
In a supermarket, I can find anything I look for (female, interviewee5, 25, an officer).
In general supermarkets accounted for the majority of purchases of packaged foods and long
life products, while traditional markets accounted for most purchases of fruit and vegetables, where
such products were perecieved as cheaper and fresher, and butchers for fresh meat. The main reason
for buying fresh meat from butchers is the ability to select the specific cuts of meat according to the
consumer’s requirements as well as to get fresh meat.
For buying vegetables and fruits I prefer open traditional markets for getting it fresh. Also, sometimes,
I go to the nearest independent store for getting some daily needs (male, interviewee7, 50, a
businessman).
I prefer to go to the supermarket. However, I prefer to go the butcher's for buying the meat and to
traditional market for buying the vegetables and fruits (male, interviewee9, 49, a lecturer).
I prefer to go to the supermarket because in the supermarket I can find anything I look for.
However, for buying fruits and vegetables, I prefer to go traditional markets for getting fresh
one (male, interviewee10, 42, an officer).
I go to the supermarket for buying the long life products, and I go to market (Souk Al thalatha) for
getting cheap and fresh vegetables and fruits (female, interviewee19, 45, a lecturer).
Page 126
111
I prefer to go to the supermarket because in the supermarket I can find anything I look for. However,
for buying fruits and vegetables, I prefer to go traditional markets in order to get it fresh and cheap
(male, interviewee22, 44, a teacher).
I prefer to go to the supermarket because I can find anything I want, and it is cheaper than the
traditional market. However, for buying fruits and vegetables there are some traditional markets that
my husband prefers to shop in for getting them cheap and fresh (female, interviewee24, 32, a
demonstrator).
I prefer to go to the supermarket. However, for buying vegetables, fruits I used to go to traditional
market. Now I have some health problems so my son does not allow me to go alone when there is
overcrowding, so I cannot look around at all on my feet. Sometimes, I go with him and stay in the car
and give my advice (female, interviewee29, 58, a businesswoman).
I prefer to go to the supermarket. However, for buying vegetables, fruits my dad goes to a traditional
market (female, interviewee31, 28, a teacher).
Interviewees highlighted the role of gender in shaping format choice; in particular females
were less frequent visitors to traditional markets compared to males:
I never have been there (female, interviewee6, 28, a teacher).
I never have been. Just men can go to a place like this (traditional market) in our culture (female,
interviewee14, 38, a teacher).
I go sometimes to traditional markets if my husband has free time for buying fresh vegetables and
fruits, because I cannot go alone (female, interviewee20, 34, a teacher).
This led to a discussion of the social acceptability of shopping in different formats.
5.2.2. Social Acceptability of Traditional Food Markets
The interviews generated mixed views regarding the social acceptability of females shopping in
traditional markets and supermarkets. Around half of interviewees deemed traditional markets
unacceptable for women:
In my home city, El Bayda, I can say that it is not acceptable to visit traditional markets alone or
with other women. The man is responsible to do this. Because of the overcrowding ... [it]... is
uncomfortable for women (female, interviewee24, 32, a demonstrator).
Page 127
112
It is not acceptable to visit traditional markets alone or with other women. I remember when I
bought my car my brothers told me that I can shop at any place apart from a traditional market! In
my opinion, this may be due to two reasons: the majority of shoppers, ninety per cent, are men so
women will feel uncomfortable to go in. Another thing is that [in Tripoli] many of the customers in
the traditional markets are foreign, which means women may not feel safe. In our culture it is
considered shameful for women to go to a place like this where they may be exposed to unsuitable
behaviour of some rude people and because of the overcrowding (female, interviewee25, 42, a
lecturer).
It is unacceptable for a woman to go shopping in a market alone or with other women. I do not know
why exactly, you can ask my husband (female, interviewee28, 31, a teacher).
At this point the latter interviewee’s husband commented ‘that the market is a large and open
place; a lot of men will be there, some of them are good and some of them are rude. She may hear
impolite words or bad behaviour. So I do not allow her entry into such traditional markets, just to
protect her’.
For those for whom traditional markets are regarded unacceptable, the introduction of
supermarkets has been especially welcomed. However, for other respondents it was acceptable for
females to shop alone in traditional markets:
Yes, it is acceptable for a woman to go shopping in a market alone or with other women in Tripoli.
Because there are a lot of nationalities, that means there are more than one culture in Tripoli as
capital city. In these cultures it is normal for women to go to the market. As a result, the number of
women in the supermarket is a lot. I think this is the main factor in the social acceptance of Libyan
women going shopping in Tripoli (female, interviewee27, 35, a lecturer).
I can say that it is acceptable for a woman to go shopping in a market alone or with other women.
However, in my case I cannot go there. My husband does not allow me. As my husband says, it is not
suitable for a woman in terms of safety and cleanliness. There are a lot of foreign employees and
teenagers who often behave unacceptably (female, interviewee30, 31, a lawyer).
Several respondents were able to identify clear divisions between Tripoli and Benghazi
(Libya’s two largest cities), and smaller towns. The interviews revealed that in the largest cities it is
generally more socially acceptable for females to shop at traditional markets than in provincial
towns.
Page 128
113
At first, I will answer in a general way then I will answer in more detail. In general, the answer may
be yes and no at the same time. It depends on the nature of the community itself and it is different from
one city to another in the same community. There is no general rule. In conservative societies the idea
of women shopping is unacceptable, in a market or a supermarket, alone or with another. Libyan
society is a very close and realistic example... women can shop freely in Tripoli, in both the market
and supermarket in contrast the women in Zliten [a city near to Tripoli] cannot shop alone. In
addition, in El Bayda it is not acceptable for a woman to go shopping in a market alone or with other
women but it is acceptable in a supermarket. This is due to the nature of society….I think the reason is
the nature of the place where there are a lot of men, who become angered when they see a woman
shopping. However, there is no objection if a woman is forced to do so with extreme caution whether
alone or with other women to avoid the harassment that they may encounter. In my opinion, in this
case the woman has to go with other women, not alone (female, interviewee31, 28, a teacher).
It is acceptable for a woman to go shopping in a market alone or with other women in Benghazi,
because presently, women have become primarily responsible for shopping. Also, the men have more
open minds than before. However, the situation is very different in other cities such as Derna, where I
grew up, where it is still not so acceptable for a woman to go shopping in a market alone or with other
women. So I can say that this matter is different from one city to another and from one family to
another, depending on their culture and the openness of societies. So in the big cities … it is
acceptable, taking into account personal differences between families (female, interviewee32, 35, a
doctor).
The contrasting views highlight significant differences in the social acceptability of females
shopping for food across cities and between families.
5.2.3. Social Acceptability of Supermarkets
Regarding whether it is socially acceptable for women to shop in a supermarket either alone or with
other women, more positive views were ascertained:
Yes, of course, the large number of female shoppers in the supermarket is the best evidence because,
as I mentioned earlier, the task of shopping has become related to woman more than before (female,
interviewee23, 37, a lecturer).
Yes, it is acceptable [for women to shop] alone or with other women. Because most of the shoppers
are women, and the supermarket is safe for shopping (female, interviewee25, 42, a lecturer).
Page 129
114
Yes…. Because most of the shoppers are women or family groups, the supermarket is a closed and
clean place for shopping. Also, it is safe because there is some security staff (female, interviewee30,
31, a lawyer).
5.2.4. Comparison of the Social Acceptability
Several women expressed the view that it was acceptable for them to shop at supermarkets, but not
traditional markets, for a variety of reasons.
Yes, it is clear that there is a difference between the supermarkets and the traditional markets in terms
of socially acceptability. In the supermarkets usually most shoppers are families. The supermarket is a
closed space with private employers who certainly will be serious about caring for the security and
safety of customers, particularly females (female, interviewee31, 28, a teacher).
Of course, there is [a difference]. I do not have the courage to go the market alone or with other
women, because I do not feel safe or respectful of my family culture. By the way, it may be useful to
mention a situation I was in after the death of my father. I went to buy meat from the butcher. There
was a queue of men, and I stood in line, suddenly, one of the men mumbled some words to express his
dissatisfaction (female, interviewee32, 35, a doctor).
Of course, there is. Well, at least right now, I do not have the courage to go the market alone or with
other women, because I cannot feel safe and respectful of my culture. I do not want to do anything that
may make my husband feel ashamed of me (female, interviewee28, 31, a teacher).
However, the view of a difference in the social acceptability of females shopping in
traditional markets and supermarkets was not shared by all:
There is no difference at all. Because I have full confidence that I do not do anything shameful when I
go shopping wherever or whomever I am with (female, interviewee23, 37, a lecturer).
There is no difference for me at all. This may be due to the culture in my mother’s home (Egypt) where
it is acceptable for a woman to go shopping in a market. In addition, I got married to a Libyan man
who was very busy in his trade between Libya and Egypt, I found myself the main person responsible
for providing my family needs (female, interviewee29, 58, a businesswoman).
5.2.5. Cultural Change
In discussing social acceptability and retail formats, interviewees noted a degree of cultural change,
appreciating that what counted as socially acceptable may shift over time:
Page 130
115
In Tripoli, I can say that it is very acceptable. Before, up to about ten years ago, it was unacceptable
because of the customs and traditions. The man was responsible to meet the family requirements. A
woman going shopping in general was considered a big shame. Now, lifestyles have changed and
developed, the woman has become responsible for shopping for her family (female, interviewee23, 37,
a lecturer).
Well, it is not acceptable for a woman to go shopping in a market alone or with other women in our
family; I think it is just customs and traditions. I cannot say it is unsafe. I think it is only a matter of
time; in the future it may be acceptable. In the past it was not acceptable for a woman to go to the
supermarket but now it is acceptable. However, it is acceptable for some women who live alone or do
not have a suitable man to do this duty, and for foreign women (female, interviewee26, 41, a lecturer).
5.2.6. Shopping Frequency
Considering shopping frequency, with the exception of one participant who reported that she has no
particular system for shopping, the interviewees indicated regular patterns. A high proportion of
them said that they shopped for food once a week for buying fresh vegetables and fruits and
monthly to buy packaged food:
Once a week for getting vegetables and fruits, monthly to buy dry goods (male, interviewee7, 50, a
businessman).
I shop regularly, once a week with my husband for getting fresh vegetables and fruits, monthly for
packaged food, daily for bread (female, interviewee12, 25, an engineer).
Almost, weekly for buying fruits and vegetables and monthly for other goods (female, interviewee16,
29, an officer).
I go to the supermarket for buying the long life products, and I go to market (Souk Al thalatha) for
getting cheap and fresh vegetables and fruits (female, interviewee19, 45, a lecturer).
Some interviewees shopped every day, in order to obtain fresh produce, control budgets and
because they had available time:
Actually, every day, because there are some goods should be bought fresh such as milk and bread
(male, interviewee1, 56, an engineer).
Almost daily, I find this way more convenient to control the budget (female, interviewee8, 40, a
teacher).
Page 131
116
Actually, every day, I am a retired, so I have a lot of free time, and I prefer to buy fresh food especially
vegetables and fruits (male, interviewee21, 68, a retired).
Regarding what is bought, interviewees tended to make the decision jointly with others:
Usually, the decision is made jointly with all my family members (male, interviewee1, 56, an
engineer).
Of course, the decision is made jointly with my husband (female, interviewee3, 30, a teacher).
Jointly with my wife, because in some cases I have to ask her what kind of food she needs (male,
interviewee15, 40, an officer).
It is worth mentioning, that in the interviews, only female participants tended to make
shopping decisions alone. This was justified by their responsibility for their family, as some
interviewees stated:
The choice is mine. As long as I am the person who is responsible for cooking (female, interviewee6,
28, a teacher).
Alone, because I know what I need exactly (female, interviewee14, 38, a teacher).
Alone, I am the person, who is responsible for preparing the meals for my family so I know what I
have to buy (female, interviewee20, 34, a teacher).
5.2.7. Motives for Shopping
Tauber (1972) argued that people go shopping not only to buy a product, but also for other, non-
product-related, reasons. The interviews in Libya identified both personal and social non-product
related motivations. However, the majority of participants remarked that they tended to go grocery
shopping only for a specific purpose:
I shop just for buying the food. If my wife or whoever forgets to write any items down on the shopping
list, it will be impossible to do the shopping again in the same day (male, interviewee1, 56, an
engineer).
I do not like shopping, but it is necessary for meeting my family’s needs (male, interviewee7, 50, a
businessman).
For fulfilling my family needs, to be honest, I am forced to do shopping, because my husband is
always busy at work (female, interviewee17, 42, a lecturer).
Page 132
117
However, for some grocery shopping was a means to learn about new trends as well to
generate new ideas:
Sometimes, I go to check out the new supermarkets as well as to identify habits and culture of other
peoples in shopping (female, interviewee8, 40, a teacher).
For a few, grocery shopping was a means to escape from the routines of daily life:
Sometimes, I go to shop when I get bored and to escaping from some of the difficult conditions (male,
interviewee10, 42, a teacher).
Social shopping refers to the enjoyment of shopping with friends and family, socializing, and
connecting with others (Tauber, 1972):
I like to go shopping. Sometimes, I go just to spend an enjoyable time with my niece, who usually
insists on going to shopping for this purpose (female, interviewee6, 28, a teacher).
I go to shop to buy food and enjoy the time outside, instead of staying alone at home. I really get a lot
of enjoyment with my friends (female, interviewee 18, 35, a lecturer).
In general, I like shopping with my family. Also, I really enjoy food shopping for my first family (my
children) and my second family (my parents) sometimes. When they feel good, I feel good (female,
interviewee 24, 32, a demonstrator).
In the second round of interviews, further questions were asked about the extent to which food
shopping is considered a leisure activity, a way of getting out of the home and / or a form of
entertainment. Regarding whether food shopping is a leisure activity or just a household duty; all
the participants said that food shopping is only a household duty:
I am a lecturer and I spend a lot of time out of the house. Watching TV and chatting with my family
are the top leisure activities for me. Food shopping is only a household duty (female, interviewee23,
37, a lecturer).
No, in my free time I like to watch TV or give myself more care such as body care... something like
that (female, interviewee30, 31, a lawyer).
No, generally, in my free time I like browsing through the pages of my favourite websites (female,
interviewee31, 28, a teacher).
Page 133
118
Not at all, in my free time, if I get it, I spend it in sleeping in my room (female, interviewee32,
35, a doctor).
With respect to food shopping as a means to escape the family home; the majority did not
view it in such terms:
No, at all, if I want to get out, there are many places that I can spend enjoyable time in, such as public
parks (female, interviewee23, 37, a lecturer).
No, not at all, I am really very busy women, so that I hope to get enough time to spend it in my home
(female, interviewee26, 41, a lecturer).
Not at all, I usually when I want to get out of the home go to my family, my friend or do window
shopping (female, interviewee30, 31, a lawyer).
No, I have my own job so that sometimes I cannot find enough time to spend with my family (female,
interviewee32, 35, a doctor).
However, two of the interviewees reported that it is considered as way of getting out:
Yes, sometime when I am in down mood, I go shopping to make me feel better (female, interviewee29,
58, A businesswoman).
For me personally, in fact, I have not free time, but sometimes when I'm in a bad mood I go to shop
and empty my pocket to buy this and that, to get rid of the negative feeling and make me feel better
and escape from household tasks (female, interviewee31, 28, a teacher).
Considering food shopping as a form of entertainment, only two participants reported that
food shopping is not a form of entertainment:
For me, as I said food shopping is only a household duty. Regarding non- working housewives I can
say that food shopping may be a way for them to get out of the house and have some pleasure. Also,
food shopping from this angle may be considered as a way to raise their morale and feel a responsible
person (female, interviewee23, 37, a lecturer).
No, I do it just as a household duty (female, interviewee26, 41, a lecturer).
However the rest of the interviewees regarded it as a form of entertainment:
Page 134
119
Going food shopping is not only a household duty, but also a pleasant activity and one of the
enjoyable activities for me and my family. In order to make it pleasurable for them, I allow my
children to pick up some their favourites such as chocolate and juice.... something like that and take
their advice in some household needs (female, interviewee24, 32, a demonstrator).
Sometimes, if I go shopping with others and I am in a good mood, it is considered as a form of
entertainment. Sometime, I am forced to do it just as a household duty (female, interviewee25, 42, a
lecturer).
Yes, I can say that it is considered as a form of entertainment. I really like cooking and eating. For
this I like to do food shopping and enjoy it. I find choosing foods fun (female, interviewee29, 58, a
businesswoman).
For me, I can say that it is considered as a form of entertainment. As I said before I like to do food
shopping with others. I take their advice about what I want to buy because I was away from my
country that means I have not a clear idea about it (female, interviewee30, 31, a lawyer).
Yes, sometimes I do food shopping to have fun and break the routine (female, interviewee31, 28, a
teacher).
Briefly it may be useful to consider shopping motivations and patterns in the context of
gender and employment. Males indicated that they tended to go food shopping only for a specific
purpose:
I shop just for buying food (male, interviewee1, 56, an engineer).
I do not like shopping, but it is necessary for meeting my family needs (male, interviewee7, 50, a
businessman).
For those females with full time jobs, food shopping was also perceived as a chore. They
regarded food shopping as a household duty rather than a leisure activity and it was not regarded as
a means of escaping the domestic environment:
… if I want to get out, there are many places that I can have an enjoyable time, such as public parks
(female, interviewee23, 37, a lecturer).
… I have my own work which means there is a chance to spend some time far away from my home
(female, interviewee24, 32, a demonstrator).
Page 135
120
However, for those females without work, food shopping was regarded as a means to escape
the domestic environment:
For … non-working housewives, I can say that food shopping may be a way for them to get out of the
house and have some pleasure. Also, food shopping from this angle may be considered as a way to
raise their morale and feel like a responsible person (female, interviewee23, 37, a lecturer).
Even for some employed females, food shopping still provided a release.
I go to the shops to buy food and spend leisure time outside, instead of staying alone at home.
I really get a lot of enjoyment from my friends (female, interviewee 18, 35, a lecturer).
5.2.8. Retail Attributes
When the interviewees were asked ‘what factors are important in your choice of where to shop for
food?’ they highlighted a number of factors. These can be summarised as: variety, quality, price of
products; hygiene; service quality; special offers; convenience of location; friendly staff; and other
points such as car parking and entertainment. The quality of products was the most salient factor in
choosing a store followed by variety and price of products respectively:
For me, the variety of products and quality are the most important factors I look at in my decision
where I will go to shop (female, interviewee2, 57, a teacher).
Quality and price are the most important factors I look at in my decision as to where I will go to shop.
I watch for the lowest possible price when I shop (male, interviewee4, 45, a lecturer).
Quality, availability and price of products are the most important factors that affect my choice
(female, interviewee8, 40, a teacher).
In addition, some other attributes were highlighted:
The most important factors are product quality, the supermarket reputation and friendly staff who
treat me well (male, interviewee1, 56, an engineer).
The variety of products and cleanliness are the most important factors I look at in my decision where I
will go to shop (female, interviewee3, 30, a teacher).
Variety of products and some other facilities such as car parking are the most important factors for
me (female, interviewee5, 25, an officer).
Page 136
121
Price of products and special offers are the most important factors for me. (female,
interviewee14, 38, a teacher).
Quality of products and quality of service. Is there any coffee shop or restaurant in the supermarket?
(female, interviewee 18, 35, a lecturer).
In short, there were a number of criteria which were taken into account by shoppers in
selecting between competing stores. Variety, quality and price of products are the most important
factors. Hygiene; service quality; special offers; assortment; convenience of location; friendly staff;
and other facilities such as car parking were reported by some interviewees as well.
5.2.9. Evaluation of Retails Formats
Interviewees compared supermarkets against traditional markets on a range of attributes. Almost all
of the participants identified positive aspects of supermarket shopping compared to traditional
markets – convenience, lack of overcrowding, wider selection of products, clear pricing, food safety
and availability of car parking. Interviewees expressed mixed views on whether supermarkets
possessed a price-based advantage.
In more detail, with respect to convenience of location, the findings indicated that almost all
participants stated that supermarkets are usually located more conveniently than traditional markets
although for a minority both were located conveniently. Regarding price of products, over half of
the interviewees reported that the supermarket is more expensive than the market, whereas the rest
of the participants stated the opposite:
It is more expensive than market. May be you are wondering why I like shopping at the supermarket,
well, I tend not to look at the price too much. I look at variety and quality of products (female,
interviewee2, 57, a teacher).
The majority of interviewees believed that quality of service was equally good in
supermarkets and traditional markets, with the remainder believing that quality of service was better
in supermarkets.
Regarding special offers, all interviewees mentioned that these were available only in
supermarkets. However, traditional markets possess an advantage in terms of speed of service:
Page 137
122
The market is better than the supermarket. In some supermarkets it is not so good, because there are
one or two counters at the most, no matter what the shop area is (male, interviewee1, 56, an
engineer).
It is not at the required level in the supermarket, where slow service leads to a long queue and a
boring waiting for payment (female, interviewee2, 57, a teacher).
The market is better than the supermarket. Regarding the supermarket, in some seasons, for example,
in the months celebrating as such Ramadan, there is a jam that influences service speed. However, in
normal circumstances it is good (female, interviewee3, 30, a teacher).
I am not satisfied with it completely in the supermarket. There is a distinct lack of this, because there
are an insufficient number of cashiers (male, interviewee4, 45, a lecturer).
In addition, only a few respondents viewed the supermarket as cleaner than traditional
markets while the majority of respondents stated that both shopping outlets were equally good.
Moreover, all respondents in the qualitative study stated that payment by card was absent from
both:
This factor is missing in both; cards are not used yet in shopping in Libya (male, interviewee1, 56, an
engineer).
Furthermore, respondents emphasized that supermarkets were superior to traditional markets
in variety and quality of products, atmosphere, and assortment. On the other hand, one participant
stated that traditional markets were perceived as possessing a quality advantage for fresh vegetables
and fruits:
Regarding packaged food, there is high quality in supermarkets. However, the vegetables and fruits in
markets are fresher than in supermarkets (male, interviewee21, 68, retired).
With respect to food safety, most of the interviewees rated supermarkets as superior:
The supermarket is better than the market. In the supermarket, usually there are special offers on
products that have nearly reached the expiration date (female, interviewee2, 57, a teacher).
The supermarket is better than the market because of highly developed technology (female,
interviewee6, 28, a teacher).
Page 138
123
The supermarket is better than the market, because there is tighter control on products in terms
of…country of origin labels and expiry date...etc. However, depending on my experience where I was
working as a municipal guard, the market usually deals with food smugglers, which may be unsuitable
for consumption (male, interviewee7, 50, a businessman).
However, one of participants said quite the contrary:
The market is better than the supermarket, because I have great confidence in local products, which I
can get primarily at the market (female, interviewee8, 40, a teacher).
5.2.10. Shopper Typologies
The construction of shopper typologies is a well-established stream of research in retailing, with
over 40 studies investigating retail patronage behaviour using a variety of bases, such as retail
attribute importance, shopping motivations, attitude toward shopping, shopping frequency, and
store loyalty (Ganesh et al., 2010). However, for a better understanding about consumer food
shopping behaviour as a consequence of the similarity in cultural values, retail market structures,
the economic and social environment and most of the other conditions related to the study subject,
interview questions drew on one previous study conducted in an Arabic society that identified six
groups of shoppers (Jamal et al. 2006: pp. 76-77): budget conscious shoppers, independent
perfectionist shoppers, socialising shoppers, apathetic shoppers, disloyal shoppers, and escapist
shoppers.
Interviewees were presented with Jamal et al.’s (2006) shopping typology, with the researcher
introducing each type of shopper verbally. Then interviewees were asked to consider the validity of
each for Libya and, if appropriate, select which group they believed themselves to belong. The
respondents were classified into one of four groups: independent perfectionist shoppers, budget
conscious shoppers, socializing shoppers and escapist shoppers. However, none of the interviewees
categorized themselves as apathetic shoppers or disloyal shoppers (Figure 5-1).
Page 139
124
Figure 5-1: Libyan Shoppers Typologies
In general, the appropriateness of Jamal et al.’s (2006) classification was confirmed in the
Libyan interviews. The interviews also revealed that men appeared to dominate the independent
perfectionist shoppers’ segment:
I think independent perfectionist shopper best describes me. I prefer to patronize the same store and I
tend to buy the same brand. Also, I do my shopping as fast as I can. There is no social reason behind
my shopping trips (male, interviewee1, 56, an engineer).
In general, I look for high quality and I do not care about the price. As any Libyan man, I like doing
food shopping as fast as I can. Shopping for me is just for necessary needs. So, independent
perfectionist shopper is the best style describing me (male, interviewee7, 50, a businessman).
I look for quality and I am loyal to particular brands so, I can say that Independent perfectionist
shopper is the best description of me (male, interviewee9, 49, a lecturer).
However, women appeared to dominate in the socializing shoppers and budget conscious
shoppers segments. Socializing shopper was most common for female interviewees:
Socializing shopper is the best for describing me. In general, I like shopping with my family. Also, I
really enjoy food shopping for my first family (my children) and my second family (my parents)
sometimes. When they feel good, I feel good. Food shopping is one of the enjoyable activities for me
(female, interviewee24, 32, a demonstrator).
Independent
Perfectionist
Shoppers’
25%
Socializing
Shoppers
40.62%
Budget
Conscious
Shoppers
28.13%
Escapist
Shopper’
6.25%
Page 140
125
Socializing shoppers fits best. I prefer go to shop with others and for others. For me, food shopping is
a pleasant activity. I really like doing food shopping and try new stores and brands (female,
interviewee27, 35, a lecturer).
When I shop I feel I have really achieved something useful for my family and enjoy myself at the same
time. I look at the value along with quality. For me, food shopping is a pleasant activity (female,
interviewee29, 58, a businesswoman).
For me, food shopping is a pleasant activity. I like shopping with my friends or family (my husband or
my mother). I like to make my family feel good by buying special products like cakes and so on
(female, interviewee30, 31, a lawyer).
Well, I can say socializing shopper. I enjoy shopping for my family when they feel good, I feel good
too. I really like to do food shopping. Sometime, I take my sisters to shop in chocolate store for fun. I
like to visit the same store and I always compare prices (female, interviewee32, 35, a doctor).
A smaller group of female respondents associated themselves most closely with the budget
conscious group:
I look at the price firstly by comparing the prices; however this is not to say that I am careless about
the quality. I tend to buy the same brand; and visit the same store. So, budget conscious shopper is the
best for describing me (female, interviewee25, 42, a lecturer).
Budget conscious shopper describes me best. I prefer to buy the same brand and I have a preference
for a particular supermarket. I always compare prices. For me, shopping is not a pleasant activity at
all (female, interviewee26, 41, a lecturer).
In addition, two women stated that they were most like ‘independent perfectionist shoppers’:
Independent perfectionist shopper best describes me. I look at the quality first and foremost. Also, I
tend to visit the same store. I do my shopping fast (female, interviewee17, 42, a lecturer).
Independent perfectionist shopper…. In general, when I purchase products, I try to buy the best
quality or perfect choice. I do not care about the price. I make shopping trips as fast as I can.
Shopping is not a social or pleasant activity for me. I tend to buy my favourite brands as well as I have
a specialty store that I visit frequently (female, interviewee23, 37, a lecturer).
Finally, one woman identified herself as an ‘escapist shopper’:
Page 141
126
Escapist shopper is the best fit with me. When I feel down, I go shopping to make me feel better, forget
my problems and reduce stress (female, interviewee31, 28 a teacher).
These findings are in keeping with Jamal et al (2006, p.77) who claimed that “grocery
shopping and the task of maintaining social ties is considered to be ‘women’s work’ putting some
extra pressure and load on women shoppers”.
5.3. Conclusion
To sum up, interviewees overall welcomed the introduction of supermarkets to Libya. Some
households still frequently use other outlets, mostly their neighbourhood grocer in emergency
circumstances, and traditional markets to buy fresh produce. Interview evidence from Libya
indicated that for some females, supermarkets offer a more socially acceptable and safer shopping
environment compared to traditional food markets. In this regard, traditional culture rather than
constraining the spread of supermarkets may facilitate the process. However, the social
acceptability of females shopping in traditional food markets varies across cities and between
families. In some families, the male head of the household remains the exclusive food shopper even
if females are responsible for food preparation in the home. More commonly, shopping for food is
also one of the household tasks undertaken by females.
Patterns of food shopping in Libya, as in the rest of the Arab world, cannot therefore be
understood without recourse to a discussion of gender. For females in full-time employment, food
shopping is largely regarded as another household chore. For those working part-time or not
employed, food shopping may take on greater significance as a leisure activity and opportunity to
escape the domestic environment. The ability to escape the latter, however, depends on family and
local rules governing social acceptability.
Considering shopping patterns, all but one interviewee had a regular system for shopping
and most make shopping decisions jointly with others. A number of factors affect the choice of
where to shop (variety, quality, and price of products; cleanliness; service quality; special offers;
convenience of location). These factors are common to other countries and the only factor identified
in the international literature, which is currently irrelevant for Libya, is facilities to pay by card.
With respect to typologies of shoppers, three clear categories were identified: budget
conscious, independent perfectionist, and socializing shoppers. The main motivators to shop were
personal. In addition, the findings revealed that, even though, the interviewees reported that
Page 142
127
supermarkets offered more advantages than traditional markets, traditional markets retained an
advantage in fresh vegetables and fruits.
However, using only the qualitative method can be problematic, as it may limit the
generalisation of findings (Creswell, 2003). After conducting the interviews it was perceived that
there was scope for further research building on the qualitative findings. Additional work was
deemed useful to quantify the relationships between the choice of retail environment and motivating
factors such as convenience, food safety, shopper comfort, and social acceptability. Clustering
respondents according to shopping behaviour would provide the basis for consumer segmentation
and this could be linked to an assessment of socioeconomic, geographic and cultural factors that
may explain diversity in behaviour. As a result, quantitative research was carried out to address
these themes and is discussed in the next chapter.
Page 143
128
Chapter 6 Quantitative Research Results
6.1. Introduction
This chapter presents the results of the statistical analysis of the quantitative survey data which
sought to measure Libyan consumers’ characteristics, attitudes, preferences and food shopping
behaviour. It includes a report of:
Descriptive Analysis
Confirmatory factor analysis (CFA)
Exploratory factor analysis (EFA)
Cluster analysis (CA)
Econometric analysis
6.2. Descriptive Analysis
This section describes the characteristics of the sample. It first presents the demographic
characteristics of the sample and then the shopping profile of respondents, comparing the
differences between female and male food shoppers. Frequencies and cross-tabulations are
presented.
6.2.1. Demographic Profile
Socio-economic characteristics and demographic variables such as gender, marital status and
income have been considered as important factors that influence the pattern of consumer food
shopping behaviour (Mai, 1997; Priporas, 2002; El-Droubi, 2004; Alhemoud, 2008; Sohail, 2008;
Tessier, 2010; Gorton et al., 2011; Prasad 2011). Table 6-1 detailed the main characteristics of the
sample. The socioeconomic -demographic variables considered in this study include: gender,
marital status, age, household size, level of income, education, nationality, whether the respondent
lived abroad, birthplace, and occupation.
As detailed in Table 6-1, 55.53 per cent of the respondents were males. The majority of them
were married (72.24 per cent), while 19.14 per cent were single. Only 21 respondents (5.66 per
cent) were divorced and 11 respondents (2.96 per cent) were widowed. Regarding age, the vast
majority of respondents were middle-aged or younger; more than 90 per cent of the respondents
Page 144
129
were under 54-years of age. With respect to family size, 133 respondents (35.85 per cent) were part
of families of six or more members and 69 respondents (18.60 per cent) represented five member
households. Just over one-fifth of the sample (21.56 per cent) was part of four member households
while 17.25 per cent of respondents came from three member families. Finally, only 19 and 6
respondents (5.12 per cent and 1.62 per cent) represented two and one member families
respectively. The average size of household (4.6 people) in the sample was slightly less than the
average for both Benghazi and Libya based on the national census of 2010 where it was estimated
to be 5.71 and 5.77 people respectively (General Authority for Information, 2010).
From the 371 respondents that took part in the research, 44.47 per cent had a combined
household income in excess of $396.41 per month. 16.17 per cent of respondents had an income
approximately equivalent to $396.4 and 85 respondents (22.92 per cent) had a monthly income less
than $396.4. The remaining 16.44 per cent preferred not to reveal their income. As far as the level
of education was concerned, 205 respondents (55.26 per cent) of this survey had a university level
of education, 14.82 per cent had postgraduate degrees, and 16.98 per cent had finished secondary
school. Very few respondents (5.12 per cent) had no qualifications. The remainder had completed
secondary or primary school only.
In terms of nationality, the vast majority of respondents were Libyan (97.30 per cent). The majority
of respondents have not lived abroad (77.60 per cent), and most grew up in Benghazi (83.84 per
cent). Finally, considering occupation, the most frequently reported occupation was professional2,
who have typically a high level of education and/or professional training (27.22 per cent). The
second and third largest groups represented in the sample were government officers and teachers
(21.83 per cent and 17.77 per cent respectively). Housewives and businesspeople accounted for
11.59 per cent and 6.7 per cent respectively, followed by students and retired people (5.39 per cent
and 3.77 per cent respectively). The remaining 3.77 per cent belonged to “other” occupations and
1.89 per cent was unemployed.
1 1 Libyan Dinar = 0.79 United States Dollar.
2 Including: lecturers, doctors, engineers, nurses, pharmacist, dentists, and geologists.
Page 145
130
Table 6-1: Demographic Profile of the Respondents
Variables Respondents Census 2010
Frequencies Per cent Per cent
Gender
Male
206 55.53 50.56
Female 165 44.47 49.44
Total 371 100 100
Marital Statue
Single 71 19.14 35.47
Married 268 72.24 61.23
Divorced 21 5.66 0.84
Widowed 11 2.96 2.46
Total 371 100 100
Age
From 15 to 24 39 10.52 31.39
From 25 to 39 154 41.51 39.70
From 40 to 54 143 38.54 16.80
Aged 55 and over 35 9.43 12.11
Total 371 100 100
Household size
One 6 1.62
Mean 5.8
Two 19 5.12
Three 64 17.25
Four 80 21.56
Five 69 18.60
Six and more 133 35.85
Total 371 100
Household Income (Libyan Dinar per month)
NA
Less than 500 85 22.92
Around 500 60 16.17
More than 500 165 44.47
Prefer not to say 61 16.44
Total
371 100
Page 146
131
Variables Respondents Census 2010
Frequencies Per cent Per cent
Level of Education
No qualifications 19 5.12 4.87
Primary education 11 2.96 9.83
Initial secondary education 18 4.85 18.00
Secondary education 63 16.98
35.14
A university education 205 55.26 30.67
Post-graduate 55 14.82 1.49
Total 371 100 100
Nationality
Libyan 361 97.30 93.65
Non Libyan 10 2.70 6.35
Total 371 100 100
Lived Abroad
Yes 83 22.40
NA No 288 77.60
Total 371 100
Migration
Always lived in Benghazi 311 83.84
NA Moved to Benghazi from another part of Libya 48 12.93
Moved from abroad 12 3.23
Total 371 100
Occupation
Professional 101 27.22
Accurate data for
these specific
occupations can
not be estimated
Government officers 81 21.83
Teachers 66 17.77
Housewives 43 11.59
Businesspeople 25 6.74
Students 20 5.39
Retired 14 3.77
Unemployed 7 1.89
Other 14 3.77
Total 371 100
Page 147
132
Comparisons of respondent demographics with general population statistics according to
national census of 2010 (General Statistics Book, 2010) indicated the sample was in fact not
entirely representative of the Libyan population. As can be seen in Table 6-1, the sample tends to be
somewhat over-representative of Libyans, the university educated, and middle aged (40-54 years)
persons. This mainly is due to the non-probability sample method that was used in the study
because of the unrest that occurred in the country during the period of data collection. Additionally,
it may reflect that educated people are more willing to participate in research and field studies. The
middle aged group tend to be more responsible for family shopping than, for example, older people
who usually live in extended families in Libya and young people. The sample population is
however in line with that for the overall population regarding gender. However, the results should
be interpreted with caution and it might not be possible to generalize to the whole population in
Libya. Given the unrest in Libya during the period of data collection this however may be
inevitable.
6.2.2. Shopping Behaviour
This section describes the shopping behaviour of respondents.
4.5.1.8. Frequency of Shopping
Table 6-2 detailed that the majority of households use supermarkets, traditional markets as well as
independent stores. The frequency of use varies remarkably by format. Monthly shopping trips were
most common for supermarkets (35.04 per cent visit supermarkets once per month). 20.22 per cent
of the respondents visited supermarkets two to three times a month, while 9.97 per cent, 16.17 per
cent and 15.63 per cent shopped at supermarkets once a week, two to three times a week and every
day respectively. Only 11 respondents never shopped at a supermarket. The popularity of monthly
shopping at supermarkets may reflect two factors: first, the relationship between shopping patterns
and the system of salaries in Libya which were usually paid monthly. Second, in-store informal
credit is unavailable in supermarkets, which means that households were most likely to visit only
after their salary was received.
Just over one third of respondents (33.16 per cent) visited traditional markets weekly. This
may reflect how traditional markets used to operate on a particular day of the week, although most
now open every day. 21.83 per cent shopped two to three times a week at traditional markets. 55
respondents (14.29 per cent) stated that they never shopped at traditional markets, of whom 61.54
per cent were female. This is consistent with the qualitative findings that some females feel that it is
socially unacceptable to visit traditional markets.
Page 148
133
Table 6-2: Frequency of Shopping
Category
Supermarkets Traditional
markets
Independent
stores
Frequency Per
cent Frequency
Per
cent Frequency
per
cent
Everyday 58 15.63 18 4.85 154 41.51
2-3 times a
week 60 16.17 81 21.83 117 31.54
Once a week 37 9.97 123 33.16 35 9.43
2-3 times a
month
75 20.22 38 10.24 24 6.47
Once a month 130 35.04 58 15.63 25 6.74
Never 11 2.97 53 14.29 16 4.31
Total 371 100 371 100 371 100
41.51 per cent of respondents shopped at independent stores every day. Therefore, frequent
shopping at independent stores was the norm with 31.54 per cent of respondents shopping two to
three times a week at independent stores. The main reason for frequent visits to independent stores,
as noted by respondents, was to buy fresh, and daily consumed commodities such as bread. The
availability of in-store credit promotes the use of independent stores and only 4.31 per cent report
that they never shop at this particular format.
4.5.1.9. Time Spent on a Shopping Trip
With respect to time spent on a shopping trip, in general, respondents tend to spend more time in
supermarkets compared to the other retail outlets that were considered in the study (Table 6-3).
Whereas one half of the respondents spent between one and two hours on a trip to a supermarket,
almost the same proportion spent less than one hour in traditional markets. 93.53 per cent of
respondents spent less than one hour on a shopping trip to independent stores. This pattern reflects
infrequent, but large shopping trips supermarkets and numerous small shopping trips to independent
stores.
Page 149
134
Table 6-3: Time Spent on a Shopping Trip
Category Supermarkets Traditional markets Independent stores
Frequency Per cent Frequency Per cent Frequency per cent
Never shop at 11 2.97 53 14.29 16 4.31
Less than one hour 104 28.03 175 47.17 347 93.53
1-2 hours 189 50.94 120 32.35 7 1.89
2-3 hours 60 16.17 19 5.12 1 0.27
More than 3 hours 7 1.89 4 1.08 0 0.00
Total 371 100 371 100 371 100
4.5.1.10. Buying Decisions
In terms of shopping decisions, a little more than half of the respondents make their decision about
what to buy in conjunction with others, 23.52 per cent alone and 19.96 per cent reported that it
depends on the circumstances (Table 6-4).
Table 6-4: Shopping Alone or With Others
Category Supermarket
Frequency Per
cent
Traditional
market Frequency Per
cent Male Female Male Female
Always
with
others
39 63 102 27.49 36 61 97 26.15
Usually
with
others
56 43 99 26.68 28 46 74 19.95
Never
shop at 9 2 11 2.97 21 32 53 14.29
Always
alone 19 8 27 7.28 41 5 46 12.39
Usually
alone 33 12 45 12.13 39 5 44 11.86
No clear
pattern 50 37 87 23.45 41 16 57 15.36
Total 206 165 371 100 206 165 371 100
Page 150
135
4.5.1.11. Monthly Spend by Type of Retail Outlet for Different Product Categories
The average percentage spend per month by type of retail outlet (supermarkets, traditional markets
and independent stores) for five food categories (fresh fruit and vegetables, fresh meat, fresh fish,
packaged food and beverages) is presented in Table 6-5.
Table 6-5: Average Percentage Spent by Type of Retail Outlet for Different Product
Categories
Important differences were apparent across food categories. For fruit and vegetables and fresh
fish, traditional markets accounted for the highest proportion of spending whereas independent
stores (e.g. butchers) accounted for more than half of spending on fresh meat. For packaged food
goods and beverages, supermarkets were far more important. These results on variations across
product categories were consistent with the findings of the qualitative research (See Chapter 4,
section 4.3.).
4.5.1.12. Analysis by Gender
A Chi-square contingency test was used to explore whether differences in shopping behaviour
between males and females were statistically significant and consistent with qualitative findings.
All statistical tests were conducted at the 5 per cent significance level. Profiles were established by
examining statistically significant differences under hypotheses:
H0: there are no differences between males and females in their shopping behaviour.
H1: there are differences between males and females in their shopping behaviour.
Goods Supermarket Traditional
market
Independent
store Fresh fruits and vegetables 20.61 49.91 29.02
Fresh meat 29.57 1.33 69.08
Fresh fish 15.49 59.51 21.64
Packaged food 65.81 3.44 30.77
Beverage 62.12 2.38 35.21
Page 151
136
The results showed that there were some significant differences between females and males
regarding shopping behaviour (see Table 6-6). For instance, with respect to shopping alone or with
others, there was a significant difference between females and males (Significance statistic = 0.000)
for both traditional markets and supermarkets. These results were consistent with the qualitative
findings. Female participants were less likely to shop alone, especially at traditional markets (See
Table 6-4. However, as detailed in Table 6-6, there were no significant differences between males
and females with regards to the time spent shopping in traditional markets and independent stores.
Table 6-6: Summary of Tests for Gender Identity and Behavioural Characteristics
6.2.3. Importance of Retail Outlet Attributes
Table 6-7 detailed the average importance given to particular retail outlet attributes in the choice of
where to buy food (1 = not important, 5 = most important) and the relative performance of
supermarkets, traditional markets, and independent stores on each attribute. Attributes with a mean
score equal to or greater than 3 were considered important as this value referred to moderately
important on the scale used. In Table 6-7 the attributes were listed in descending order of
importance. In general terms, in descending order, Libyan shoppers placed greatest importance on
food safety, quality of products, quality of service, speed of service, and variety of products.
Importance also was given to car parking, price of products, atmosphere, and special offers. Other
2 (degrees of freedom (df)) = Chi square value, Sig = Significance statistic
Behavioural Characteristic Chi-square Statistic and
Significance
Null Hypothesis
Time spent in supermarket 2
(4)= 31.680, Sig = 0.000 Reject
Time spent in traditional market 2
(4)= 6.944, Sig = 0.139 Accept
Time spent in independent store 2
(3)= 3.6016, Sig = 0.308 Accept
Shopping decision 2
(2)= 8.081, Sig = 0.018 Reject
Spending in supermarket 2
(3)= 5.729, Sig = 0.126 Accept
Spending in traditional market 2
(3)= 7.407, Sig = 0.060 Accept
Spending in independent store 2
(3)= 10.212, Sig = 0.017 Reject
Visits to supermarkets 2
(5)= 23.792, Sig = 0.000 Reject
Visits to traditional markets 2
(5)= 74.900, Sig = 0.000 Reject
Page 152
137
features such as freshness of products, location, and in- store credit were classified as of reasonable
importance. The lowest ratings of importance were allocated to cleanliness of the place, and
personal safety. The importance of food safety has been emphasised by many researches and it is in
keeping with other studies that highlight the increased salience of this attribute in non-Western
markets (Posri et al., 2006; Wang et al., 2008; Gorton et al., 2011).
The latter columns of Table 6-7 report how well supermarkets, traditional markets and
independent stores perform in the respondents’ local area (1 = very poor; 5 = very good) on each of
these attributes. The findings indicated that supermarkets performed the best on all items, except
freshness of products and in-store credit (traditional markets performed the best on freshness of
products and independent stores for in-store credit as shown in Figure 6-1 as well as Table 6-7).
Only for one attribute (car parking) were differences in the mean scores between supermarkets,
traditional markets and independent stores not significant. The greatest dissimilarities between
ratings for the three formats were apparent for social acceptance, personal safety, cleanliness of
place, food safety and, in-store credit. Significant differences in convenience of location,
atmosphere, quality of service, variety of products, and quality of products were also apparent.
Overall, data provides further evidence for the difference between supermarkets and traditional
markets in terms of social acceptance, in line with the results of the qualitative research.
Figure 6-1: Mean Performance Scores for Supermarkets, Traditional Markets and
Independent Stores on Retail Attributes
4.11 3.93 3.93 3.77 3.75 3.28 3.64 3.67 3.38 3.61 3.692.25
3.60 4.10 4.05 3.92
3.53 3.68 3.56 3.56 3.663.15
3.62 3.51 3.343.83 3.15
2.29
3.51 3.25 3.32 3.26
3.82 3.66 3.75 3.70 3.49
3.313.44 3.65
3.023.58
3.76
3.14
3.244.04 3.90 3.79
0
2
4
6
8
10
12
14
Supermarkets Traditional markets Independent store
Page 153
138
Table 6-7: Importance Weightings for Retail Outlet Attributes and Mean Score on those Attributes for Supermarkets, Traditional Markets
and Independent Stores
Attributes Average importance rating Supermarkets
Traditional markets Independent stores F test
Food safety 4.61 4.11A1
3.53C
3.82B
42.61***
Quality of products 4.15 3.93A
3.68B
3.66B
11.871***
Quality of service 4.09 3.93A 3.56
C 3.75
B 16.451
***
Speed of service 4.04 3.77A
3.56B
3.70A
5.341***
Variety of products 3.84 3.75A
3.66A
3.49B
12.831***
Car parking 3.76 3.28
3.15
3.31
2.23
Price of products 3.64 3.64A
3.62A
3.44B
6.631***
Atmosphere 3.63 3.67A
3.51B
3.65A
3.911**
Special offers 3.52 3.38A
3.34A
3.02B
15.361***
Freshness of products 3.46 3.61B
3.83A
3.58B
8.071***
Location 3.46 3.69A
3.15B
3.76A
35.921***
In-store credit 3.41 2.25B
2.29B
3.14A
65.701***
Assortment 3.15 3.60A
3.51A
3.24B
17.251***
Social acceptance 3.00 4.10A
3.25B
4.04A
117.301***
Personal safety 2.54 4.05A
3.32B
3.90A
67.471***
Cleanliness of place 2.52 3.92A
3.26B
3.79A
52.511***
1 Means that do not share a letter are significantly different, using Tukey Method and 95.0% Confidence.
Page 154
139
6.3. Confirmatory Factor Analysis
Given the existence of a priori theory that was presented in Jamal et al.’s (2006) model,
confirmatory factor analysis (CFA) was conducted to identify how well this model fits the
current research data regarding shopping motivations. To achieve this end, a measurement
model was conceptualised with ten latent variables and 35 original items as observed
variables. Data were analysed using the AMOS19 statistical software package. The
measurement model was specified as congeneric, with all indicators and error residuals
restricted to load on a single factor (i.e. no cross-loading). The maximum likelihood
estimation (ML) default in AMOS 19 was used.
Both the overall goodness model fit and the criteria for construct validity were
considered. Indeed, there are several measurements of overall model fit including absolute fit
index and incremental fit indices as well as cut off criteria for fit indices. However, Hair,
et al. (2010, p. 672) argued that “at least one increment index and one absolute index, in
addition to the chi square test (2) value and the associated degrees of freedom should be
reported to provide adequate evidence of model fit”. Regarding the cut-off criterion, Hu and
Bentler (1999, p. 27) recommend thresholds for particular measures that result in lower Type
II error rates (with acceptable costs of Type-I error rates).
The Chi square (2) statistic was used as the most fundamental measure of differences
between the observed and estimated covariance matrices. Root Mean Square Error of
Approximation (RMSEA) and Comparative Fit Index (CFI) are the most widely used
absolute fit indices. Increment indices were also assessed (Hu and Bentler, 1999). Table 6-8
detailed the selected fit statistics from the CFA output as well as guidelines for goodness of
fit.
The overall 2 was 823.62 with 515 degrees of freedom. The p-value associated with
this result was 0.000. This highly significant result indicated that a significant amount of
observed covariance between items remains unexplained by the original model (Milošević et
al., 2012). The value for RMSEA was 0.040. This value appears quite low and is below
commonly accepted limits for a model with a sample size of 371. Therefore, the RMSEA
indicated an unacceptable fit for the Jamal et al. (2006) model. Regarding the incremental fit
indices, CFI is the most widely used measure. CFI was estimated to be 0.93, which provided
additional support for the notion of inadequate model fit (see Table 6-8).
Page 155
140
Table 6-8: Confirmatory Factor Analysis (Goodness of Fit Statistics)
Fit index Threshold Value
Chi-square - 823.62
Degrees of freedom - 515
Probability level Sign p- value expected with large
sample
0.000
RMSEA Close to 0.6 0.040
PClose > 0.05 0.999
CFI Close to 0.95 0.92
Overall, the goodness fit criteria results indicated that Jamal’s et al. (2006) model
provided an unacceptable level of goodness of fit. However, to provide greater understanding
of goodness of fit, further tests of reliability and validity were undertaken. To evaluate the
convergent validity, the standardized factor loading was first examined. As can be seen
however, given the sample size of 371, it is not unexpected that all of the loadings are
statistically significant; as a result some other criteria should be used.
Calculating both the Construct Reliabilities (CR) and Average Variance Estimated
(AVE) for all constructs, revealed that for some items scores were less than the suggested
thresholds of 0.7 for CR and 0.5 for AVE (Hair et al., 2010) (see Table 6-10). These
convergent validity issues indicate that the latent factors are not well explained by the
observed variables. Therefore, this is further evidence to suggest that Jamal et al.’s (2006)
model is not a good fit for the research data.
To conclude, the CFA results indicated that Jamal et al.’s (2006) model is inappropriate
for the Libyan case and as a result, exploratory factor analysis (EFA) was justified to better
understand Libyan shopping behaviour and to answer the research questions.
Page 156
141
Table 6-9: Standardized Factor Loading
Item
Standardized
loading Factor 1—Gratification seeking
When I am in down mood, I go shopping to make me feel better 0.815
To me shopping is a way to relieve stress 0.908
I go to shopping when I want to treat myself to something special 0.4681
While shopping I can normally forget my problems 0.476
Factor 2—Social shopping
I like shopping with my friends or family to socialize 0.713
I enjoy socializing with others when I shop 0.841
Shopping with others is a bonding experience 0.912
Factor 3—High quality seeking
When it comes to purchasing products, I try to get the very best or perfect choice 0.792
In general I usually try to buy the best overall quality 0.895
I make special effort to choose the very best quality products 0.497
My standards and expectations for the products that I buy are high 0.479
Factor 4—Confused by choice
There are so many brands to choose that often I feel confused 0.534
Sometimes it’s hard to choose which stores to shop at 0.553
The more I learn about products, the harder it seems to choose the best 0.899
All the information I get on different products confuses me 0.856
Factor 5—Value shopping
For the most parts, I go shopping when there are sales 0.611
I enjoy looking for discounts when I shop 0.769
I enjoy hunting for bargains when I shop 0.720
Factor 6—Brand loyal/habitual
I have favourite brands I buy over and over 0.829
Once I find a product or brand I like, I stick with it 0.674
I go to the same store each time I shop 0.325
I like to buy the same brand 0.533
Factor 7—Brand conscious
The more expensive brands are usually my choice 0.724
The higher the price of the product, the better is its quality 0.743
Nice department and specialty stores offer me the best products 0.475
The most advertised brands are usually the very good choices 0.320
Factor 8—Utilitarian
I make shopping trips fast 0.420
While shopping, I try to accomplish just what I want to as soon as possible 0.662
While shopping I try to find just the items that I am looking for 0.666
Factor 9—Hedonic shopping
Going shopping is one of the enjoyable activities for me 0.781
I enjoy shopping just for the fun of it 0.794
I enjoy shopping more than most people do 0.765
I love to go shopping when I can find time 0.476
Factor 10—Role playing
I like shopping for others because when they feel good, I feel good 0.793
I enjoy shopping for my family and friends 0.886
1 Figures in bold indicate items that do not meet the minimum criteria
Page 157
142
Table 6-10: CR and AVE Estimates
Factor CR AVE
Role playing 0.83 0.71
Hedonic shopping 0.83 0.55
Gratification seeking 0.77 0.48
Utilitarian 0.61 0.35
Brand conscious 0.66 0.35
Brand loyalty 0.69 0.38
Value shopping 0.74 0.49
Confused by choice 0.81 0.53
High quality seeking 0.77 0.48
Social shopping 0.86 0.68
6.4. Exploratory Factor Analysis (EFA)
Principal axis factoring extraction method with Varimax rotation was conducted to assess the
underlying structures that influence consumer food shopping behaviour. The variables
consisted of the 59 items that were used to measure shopping motivations where each item
was measured on a seven-point scale (1 = strongly = disagree, 7 = strongly agree). The
variables in this study are assumed to be metric. Items were derived from Jamal et al.’s
(2006) study, as well as salient items such as gender and shopping task and social acceptance
which were added in the light of the qualitative research to suit the Libyan case, were used in
the exploratory factor analysis EFA.
6.4.1. Confirmation of the Correlation of Data
Inter-correlation of the variables was confirmed by visual inspection of the correlation
matrix, Bartlett’s test of Sphericity and the Kaiser-Meyer-Olkin test (KMO) (Hair et al.,
2010). Inspection of the correlation matrix revealed the presence of some significant
correlation at 0.01 levels. The Bartlett test of Sphericity was significant (2 (1711) =
Page 158
143
7546.841, Sig = 0.000)1. A significant result (Sig. < 0.05) indicated that the matrix was not an
identity matrix; i.e., the variables do relate to one another enough to run a meaningful EFA.
Furthermore, the KMO measure of sampling adequacy was around 0.7 (KMO = 0.723),
exceeding the threshold value of 0.5 (Hair et al., 2010).
6.4.2. Factor Extraction
A 19- factor solution with eigenvalues greater than one was extracted by applying
exploratory factor analysis using principal axis method with Varimax rotation, explaining
65.85 per cent of the total variance. Examination of the factor loadings, however, revealed
that there was more than one variable which cross loaded and were thus difficult to interpret.
Hair et al. (2010, p. 119) suggested that “if a variable persists in having cross loading, it
becomes a candidate for deletion”. Therefore, after excluding these variables one by one and
inspecting the factor solution, the item loadings and the anti-image correlation matrix, a total
of 26 items were deleted. The remaining 33 items were again subjected to EFA and a 12 -
factor solution was extracted.
The Bartlett test of Sphericity was significant (2 (528) = 4667.535, Sig = 0.000). The
KMO measure of sampling adequacy was = 0.698 (see Table 6-11), and greater than 0.5 for
each individual variable by checking the diagonal of the anti-image correlation matrix.
Table 6-11: KMO and Bartlett's Test
6.4.3. Evaluate the Goodness of Fit of the Solution
By using EFA, the 59 original variables were reduced to 12 factors. The data reduction rate
was 55.93 per cent and information loss was 44.07 per cent. To determine whether a “12
1 Chi-square (degrees of freedom) = Chi square statistic, Significance statistic.
Kaiser-Meyer-Olkin Measure of Sampling Adequacy 0.698
Bartlett's Test of Sphericity Approx. Chi-Square 4667.535
df 528
Sig. 0.000
Page 159
144
Factor Solution” was suitable, the communalities were examined and deemed acceptable
(Communalities > 0.5). In addition, the total variance which was explained by these factors
was 73.75 per cent. Furthermore, by examining the rotated factor matrix, all the factor
loadings were considered practically significant. None of the items presented factor loadings
of less than 0.6 even though a factor loading with 0.3 is acceptable with a sample size of
more than 350 (Hair et al., 2010). Also, the factor loadings that are the most widely used
approach as evidence for both convergent and discriminant validity demonstrated sufficient
validity; the variables within a single factor were highly correlated (convergence) and all
variables loaded significantly only on one factor (discrimination). In order to quantify the
scale reliabilities of the factors identified, Cronbach’s alpha coefficients were computed. The
reliability of the overall was 0.786 (see Table 6-12); none of the Cronbach’s alpha
coefficients were lower than the threshold level of 0.60 as shown in Table 6-13.
Table 6-12: Reliability Statistics
Cronbach's
Alpha N of Items
0.786 33
As detailed in Table 6-13, the 12 factors can be described as follows:
1. Hedonic shopping factor: this factor accounted for 8.14 per cent of total variance and
consisted of four of the variables “enjoy shopping”, “enjoyable activities”, “fun” and
“love shopping”.
2. Confused by choice factor accounted for 7.90 per cent of total variance and was
strongly associated with “the more I learn about products, the harder it seems to
choose”, “all the information I get on different products confuses me”, “there are so
many brands to choose that often I feel confused” and “sometimes it’s hard to choose
which stores to shop at”.
Page 160
145
Table 6-13: Exploratory Factor Analysis (EFA) Results
1 Cronbach’s alpha
2 h
2 refers to communality
Items
Factor
loading
α1 % of
Variance
h2
Factor 1-Hedonic shopping 0.83 8.14 I enjoy shopping more than most people do 0.82 0.73 Going shopping is one of the enjoyable activities for me 0.81 0.72 I enjoy shopping just for the fun of it 0.79 0.72 I love to go shopping when I can find time 0.70 0.62 Factor 2-Confused by choice 0.79 7.90 The more I learn about products, the harder it seems to choose the best 0.88 0.80 All the information I get on different products confuses me 0.84 0.78 There are so many brands to choose that often I feel confused
0.69 0.55 Sometimes it’s hard to choose which stores to shop at 0.65 0.56 Factor 3-Social shopping 0.86 7.24 Shopping with others is a bonding experience 0.88 0.84 I enjoy socializing with others when I shop 0.86 0.81 I like shopping with my friends or family to socialize 0.80 0.71 Factor 4-Value shopping 0.73 7.16 I enjoy looking for discounts when I shop 0.83 0.73 I enjoy hunting for bargains when I shop 0.80 0.69 For the most parts, I go shopping when there are sales 0.73 0.63 Factor 5-Brand loyal/habitual 6.17 I have favourite brands I buy over and over 0.83 0.72 Once I find a product or brand I like, I stick with it 0.78 0.65 I like to buy the same brand 0.75 0.58 Factor 6-Brand conscious 0.67 5.93 The higher the price of the product, the better is its quality 0.84 0.72 The more expensive brands are usually my choice 0.79 0.69
Nice department and specialty stores offer me the best products 0.66 0.50 Factor 7-High quality seeking 0.85 5.64 When it comes to purchasing products, I try to get the perfect choice 0.84 0.73 In general I usually try to buy the best overall quality 0.79 0.68 Getting very good quality is important to me 0.66 0.50 Factor 8- Gratification seeking
0.86 5.36 When I am in down mood, I go shopping to make me feel 0.92 0.88 To me shopping is a way to relieve stress 0.90 0.87 Factor 9- Gender roles and shopping task 0.82 5.28 Food shopping is a task for men only 0.90 0.84 A woman’s place is in the home 0.90 0.83 Factor10- Role playing
5.17 I like shopping for others because when they feel good, I feel good 0.90 0.81 0.85 I enjoy shopping for my family and friends 0.88 0.83 Factor 11-Impulsiveness 0.78 5.00 I am impulsive when purchasing 0.90 0.81 Often I make careless purchases I later wish I had not 0.88 0.81 Factor12-Social acceptance 0.69 4.76 It is acceptable for a woman to go shopping in supermarkets alone or
with other woman
0.86 0.78 It is acceptable for a woman to go shopping in traditional market alone
or with other woman
0.85 0.77 Total variance
73.62
Over all reliability
0.78
Page 161
146
3. The third factor was correlated with “shopping with others is a bonding experience”,
“I enjoy socializing with others when I shop” and “I like shopping with my friends or
family to socialize”, so can be called “social shopping” and accounted for 7.24 per
cent of total variance.
4. High quality seeking factor was correlated with “When it comes to purchasing
products, I try to get the perfect choice”, “in general I usually try to buy the best
overall quality” and “getting very good quality is important to me”, and accounted for
5.64 per cent of total variance.
5. Value shopping was associated with three variables: “I enjoy looking for discounts
when I shop”, “I enjoy hunting for bargains when I shop” and “for the most parts, I go
shopping when there are sales”, and accounted for 7.16 per cent of total variance.
6. Brand loyalty factor was most strongly correlated with: “I have favourite brands I buy
over and over”, “once I find a product or brand I like, I stick with it” and “I like to
buy the same brand”, and accounted for 6.17 per cent of total variance.
7. Brand consciousness: this factor accounted for 5.93 per cent of total variance and had
a strong association with “the higher the price of the product, the better is its quality”,
“the more expensive brands are usually my choice” and “nice department and
specialty stores offer me the best products”.
8. Gratification seeking factor was associated strongly with two variables: “when I am in
down mood, I go shopping to make me feel better” and “to me shopping is a way to
relieve stress” and interpreted 5.36 per cent of total variance.
9. Gender roles and shopping task: it was correlated with “food shopping is a task for
men only” and “a woman’s role is in the home” and accounted for 5.28 per cent of
total variance.
10. Role playing factor was associated with “I like shopping for others because when
they feel good, I feel good” and “I enjoy shopping for my family and friends” and
accounted for 5.17 per cent of total variance.
Page 162
147
11. Impulsiveness factor: this factor was correlated with: “I am impulsive when
purchasing” and “often I make careless purchases I later wish I had not”; and
accounted for 5.00 per cent of total variance.
12. Social acceptance factor: it accounted for 4.76 per cent of total variance and was
associated with: “it is acceptable for a woman to go shopping in supermarket alone or
with other woman” and “it is acceptable for a woman to go shopping in a traditional
market alone or with another woman”.
6.5. Cluster Analysis (CA)
In order to produce a typology of shoppers, CA was applied. This consisted of two stages.
Firstly, hierarchical analysis was performed to define the number of clusters, identify outliers
and profile the cluster centres. Secondly, a non-hierarchical (k-means) method was applied to
determine final cluster membership using centroids from the first stage as initial seed points.
After outliers (12 cases), records with missing data (4 cases) as well as small clusters with 15
cases (4.1 per cent) were removed, as recommended by (Hair et al., 2010), the validated
sample size was 340.
In the first stage of CA, hierarchical analysis was employed to group the respondents
into homogeneous groups based upon their shopping behaviour using Ward’s method,
squared Euclidian distance. There was no need to standardise variables, because all the items
had the same unit of measurement. The variables included in the cluster analysis were the 12
factors derived from the EFA. An examination of the agglomeration schedule suggested a
range of cluster solutions (3-6) were potentially appropriate.
The second stage consisted of employing k-means cluster analysis using the
hierarchical analysis as initial seeds. As the SPSS software does not save the cluster centres
from the hierarchical analysis they were calculated separately using the aggregate procedure
in SPSS (Mooi and Sarstedt, 2011). A k-means cluster analysis was performed for the range
(3- 6) of cluster solutions. By evaluating the (3-6) range of cluster solutions, the solution
which had the best logical interpretation and practical significance, was the six cluster
solution. Outliers were identified by plotting the distances to their cluster centres for all of the
cases (See Figure 6-2). Outliers were removed and the cluster analysis rerun. A six cluster
Page 163
148
solution was still the preferred solution. None of the clusters in the final solution accounted
for less than 10 per cent of the total sample.
Figure 6-2: Plot of Distances to Cluster Centres
6.5.1. Cluster Profiles
As can be seen in Table 6-14, cluster 1 placed least emphasis on the brand loyalty factor (-
0.83), but placed the greatest emphasis on the fourth factor (Value Shopping) (0.71). Cluster
2 had the highest positive impression (1.36) in gender roles, and the lowest negative
impression (-0.47) for the social acceptance factor. Cluster 3 placed the highest positive
emphasis (0.59) on role playing, and the lowest emphasis (-0.81) on the third factor (social
shopping). Cluster 4 placed the least emphasis (-0.82) on brand consciousness, and the
highest on the value factor (0.41). Cluster 5 had the highest positive impression (0.88) for the
hedonic shopping factor, and the lowest emphasis on value shopping (-0.84). Cluster 6 had
1 2
3 4
Page 164
149
the lowest scores (-2.40) for the fourth factor (high quality seeking) and placed greater
emphasis (0.26) on impulsiveness. In more detail the clusters can be interpreted and labelled
as follows:
1. Disloyal shoppers: this cluster accounted for 17.65 per cent of respondents (see
Figure 6-3), and provided the lowest rating on brand loyalty across the six
clusters. In contrast, it placed the highest emphasis on value, followed by brand
consciousness, confused by choice, and social acceptance of all clusters
concerned. This was in harmony with one of Jamal et al.’s clusters that had the
same label.
2. Traditionalist shoppers: This cluster accounted for 16.76 per cent of
respondents. Of all clusters this one scored the highest on gender roles, then social
shopping, followed by impulsiveness. On the other hand, this cluster scored the
lowest on social acceptance.
3. Quality-oriented shoppers: accounted for 15.88 per cent of the respondents. This
group, relative to the others, placed the least emphasis on hedonic motivations, the
second lowest on social acceptance, and the third lowest on gratification, but
scored the highest on role playing, and high quality. This cluster somewhat similar
to independent perfectionist shopper in Jamal et al.’s study.
4. Value shoppers: this was the fourth group of shoppers, which made up the second
lowest percentage (15.59 per cent) of respondents recording the highest score for
value. This cluster scored the lowest rating of any cluster for brand consciousness
followed by confusion by choice and impulsiveness factors but gave the highest
score for gratification. In comparison to the results of Jamal et al. (2006), this
cluster was much like their budget conscious shoppers.
5. Enthusiastic shoppers: This was the largest group of shoppers, which made up
24.12 per cent of respondents. This cluster compared to other clusters, scored the
highest on the hedonic shopping and brand loyalty factors whereas value and
gender roles factors were scored the lowest by this group. The segment was fairly
similar to Jamal et al.’s notion of socializing shoppers.
Page 165
150
Table 6-14: Results of the Non-Hierarchical Cluster Analysis and Mean Scores for Each Factor
Shopping
motivations
Cluster1 Cluster 2 Cluster 3 Cluster 4 Cluster 5 Cluster6
Disloyal
Shoppers
Traditionalist
Shoppers
Quality-Oriented
shoppers
Value
shoppers
Enthusiastic
shoppers
Apathetic
shoppers
Hedonic shopping 0.441 -0.097 -0.825 -0.685 0.878 -0.232
5.281 4.29 2.65 3.07 5.69 3.75
Confused by choice 0.450 0.008 -0.051 -0.659 0.081 -0.045
5.06 4.36 3.97 3.17 4.50 4.09
Social shopping 0.089 0.508 -0.819 0.250 0.177 -0.129
4.54 4.67 2.36 4.11 4.51 3.59
High quality seeking 0.302 0.307 0.358 0.249 0.033 -2.396
5.33 5.34 5.35 5.30 5.15 2.81
Value shopping 0.709 -0.033 -0.222 0.412 -0.556 0.094
4.93 3.77 3.07 4.01 2.83 3.57
Brand loyal -0.825 0.229 -0.118 0.347 0.467 -0.507
4.07 5.30 4.87 5.25 5.52 4.03
Brand conscious 0.471 0.199 -0.039 -0.842 0.072 -0.177
4.86 4.59 3.98 2.91 4.39 3.85
Gratification seeking 0.195 0.054 -0.573 0.299 -0.084 0.254
3.59 3.18 1.52 3.24 3.02 3.24
Gender roles and
shopping task
-0.029 1.358 -0.190 -0.454 -0.555 0.150
1.77 5.03 1.72 1.84 2.10 3.03
Role playing 0.088 0.222 0.591 -0.168 0.230 -0.178
5.15 5.32 5.35 4.71 5.24 4.44
Impulsiveness -0.349 0.427 0.350 -0.541 -0.088 0.257
3.40 4.73 4.52 2.59 3.63 4.51
Social acceptance 0.293 -0.469 0.171 -0.011 0.047 -0.030
4.77 3.32 4.39 4.21 4.40 3.85
N 60 57 54 53 82 34
% 17.65% 16.76% 15.88% 15.59% 24.12% 10.00%
1 Bold italic= mean score.
Page 166
151
Figure 6-3 : Typology of Libyan Shoppers
6. Apathetic shoppers: This was smallest cluster (10 per cent of the respondents), which
in general scored low on almost all of the considered factors, however, compared to
other clusters it had the lowest rating for high quality seeking and role playing factors.
This segment matched the apathetic shoppers that are reported by Jamal et al. (2006).
6.5.2. Clusters Profiling Using Demographic and Behavioural Variables
To profile and compare the clusters in greater depth, their demographic and socioeconomic
characteristics are analysed using relevant variables not included in the initial factor analysis. To
identify any statistically significant differences between clusters, a chi-square contingency test
using Crosstabs and ANOVA test for comparison of means were used. A Chi-square contingency
test was applied with nominal variables, whereas ANOVA was applied for scale variables. All
statistical tests were conducted at the 5 per cent significance level. Profiles using 2
tests were
established by examining statistically significant differences between clusters under hypotheses:
H0: there is no difference between the clusters in the profile variables
H1: there is difference between the clusters in the profile variables
Disloyal
shoppers
17.65%
Traditionalist
shoppers
16.76%
Quality-
oriented
shoppers
15.88%
Value shoppers
15.59%
Enthusiastic
shoppers
24.12%
Apathetic
shoppers
10.00%
Page 167
152
ANOVA tests were conducted, examining statistically significant differences between clusters
under hypotheses:
H0: average scores for cluster identity are equal
H1: average scores for cluster identity are not equal
The results indicated that there were significant differences between the six clusters in six of
the considered profile variables including gender, age, number of family members, income of the
household, occupation, and visits to traditional markets. Findings are detailed in Table 6-15. Only
significant differences variables are highlighted. The clusters were profiled as follows:
As can be seen in Table 6-16, cluster 1 “Disloyal Shoppers” was composed of 62.03 per cent
females, and 37.97 per cent males (see Figure 6-4). There was a high proportion of 25- 36 year olds
(46.84 per cent) in this cluster, however, in comparison to the other clusters; it recorded the highest
percentage of those aged 55 and over (15.19 per cent). People in this segment had a family of six
people or more (34.18 per cent) or three persons (26.58 per cent). Their monthly income was in the
highest category (45.57 per cent) and this cluster had a higher percentage of people who preferred
to not say how much their income is (24.05 per cent) than other clusters. With respect to
occupation, they worked as teachers (25 per cent), housewives (16.46 per cent), and professional
and government officers with 21.52 per cent for both of last two categories. Also, this group had a
high proportion of people who went with others to shop (50.63 per cent). However, of all the
clusters, it had the highest percentage of members (20.25 per cent) who stated that they had no clear
pattern in visits to traditional markets.
Cluster 2 “Traditionalist shoppers”, compared to the other clusters, recorded the highest
proportion of males (80.56 per cent), and respondents aged between 25 and 39 years old (47.22 per
cent). As was also the case for cluster 1, it had a high proportion of those aged 40-54 (37.50 per
cent). Shoppers in this cluster, all lived in more than two person households with a considerable
proportion of families with four (26.39 per cent) or six or more members (27.78 per cent). Over one
half of them had an income equating to more than $396.4 (51 per cent). Although, the group had the
highest percentage of government officers (27.78 per cent), there was also a high proportion of
professionals (23. 61 per cent) and teachers (22.22 per cent). Regarding going to traditional
markets, this segment had the highest percentage going usually alone (26.39 per cent).
Page 168
153
Table 6-15: Summary of Tests for Cluster Identity and Demographic, Socioeconomic
and Shopping Behaviour Characteristics
Variables Chi-square Statistic and
Significance*
Null
Hypothesis
Gender 2 (5)= 39.448, Sig = 0.000 Reject
Marital status 2 (15)= 16.235, Sig = 0.367 Accept
Age 2 (15)= 25.374, Sig = 0.045 Reject
No. of members 2 (25)= 40.288, Sig = 0.027 Reject
Income of the household 2 (15)= 31.272, Sig = 0.008 Reject
Education 2 (15)= 31.871, Sig = 0.162 Accept
Nationality 2 (5)= 3.126, Sig = 0.681 Accept
Lived abroad 2 (5)= 6.918, Sig = 0.227 Accept
Migration 2 (10)= 5.926, Sig = 0.821 Accept
Occupation 2 (110)= 161.975, Sig = 0.001 Reject
Visit a supermarket 2 (25)= 28.590, Sig = 0.281 Accept
Visit a traditional market 2 (25)= 33.753, Sig = 0.113 Accept
Visit an independent store 2 (25)= 26.398, Sig = 0.387 Accept
Time in supermarket 2 (15)= 10.466, Sig = 0.789 Accept
Time in traditional market 2 (15)= 17.739, Sig = 0.277 Accept
Time in independent store 2 (10)= 13.446, Sig = 0.200 Accept
Shopping decision 2 (10)= 10.481, Sig = 0.339 Accept
Spending in supermarket 2 (10)= 10.864, Sig = 0.369 Accept
Spending in traditional market 2 (10)= 12.590, Sig = 0.247 Accept
Spending in independent store 2 (10)= 12.4002, Sig = 0.259 Accept
Going to supermarket 2 (25)= 21.7825, Sig = 0.646 Accept
Going to traditional market 2 (25)= 52.509, Sig = 0.001 Reject
* 2
(degrees of freedom (df)) = Chi square value, Sig = Significance statistic
Page 169
154
Figure 6-4: Gender and Shoppers Typologies
Cluster 3 “Quality-oriented shoppers” was almost equally divided between males (49 per
cent) and females (51 per cent). This cluster was skewed to those aged from 40 to 54 (51 per cent)
and who were a part of households with more than six members (46.51 per cent). It also, relative to
other groups, had a high proportion of 26- 39 year olds (32.56 per cent). Regarding income, 47 per
cent earned more than 500 Libyan dinars ($396.4). Over one-third of members of this cluster (37
per cent) were professionals. 23. 26 per cent of them tended to shop always with others and 18.60
per cent shopped always alone. Compared to the other clusters, Cluster 3 had the highest share of
students (11.63 per cent) and those that had never shopped at traditional markets (30.23 per cent).
Cluster 4: “Value shoppers”. Most members of this group were males (63.49 per cent). This
cluster was weighted to those aged from 25-39 (44.44 per cent) and 40-54 year olds (41.27 per
cent), living in a family of more than six people (46.51 per cent). Compared to others clusters, this
group registered the highest percentage of members who had an income of more than 500 Libyan
dinars ($396.4) (57.14 per cent) and professional people (48.62 per cent).
0
10
20
30
40
50
60
70
80
90
100
37.97
80.56
48.84
63.49
34.69
61.11 62.03
19.44
51.16
36.51
65.31
38.89
%
Male
Female
Page 170
155
Cluster 5, “Enthusiastic shoppers”, was biased toward females, those aged from 25 to 39
(38.78 per cent) and 40-54 year olds (42.86 per cent, living in a family of four people and more. In
comparison to the other clusters, this group recorded the highest percentage of those with incomes
equating to less than $396.4 (43 per cent), housewives (28.57 per cent) and retired citizens (10.20
per cent), and those preferring to go shopping with others.
Cluster 6, “Apathetic shoppers”, was comprised predominately of males (61.11 per cent) who
earned a monthly household income greater than $396.4. This group had a marginally younger age
profile compare to the others, with a quarter of members aged under 25 and one third aged between
25 and 39. Also, of all clusters, it had a higher proportion of single person households, had incomes
equating to $396.4, employing as government officers (30.56 per cent), as well as placing greater
emphasis on going shopping with others. A summary of the most important elements of each
shopper segment is presented in Table 6-17.
Regarding the importance of retail outlet attributes, all groups registered insignificant
differences in scores for the importance of retail outlet attributes, as shown in Table 6-18. Other
additional shopping behaviour variables that varied insignificantly across the clusters are
documented in
Table 6-19. In general, the clusters tended to have similar shopping patterns. In all clusters,
respondents most commonly visited supermarkets once per month and spent between 1 and 2 hours
in store. The majority of respondents in all clusters visit traditional markets but this is significantly
less for ‘Quality- Oriented shoppers’. Quality- Oriented shoppers were also significantly less likely
to visit independent stores, but across the clusters the vast majority of respondents did so, typically
every day.
Page 171
156
Table 6-16: Summary of Cluster Profile Based on Demographic- Socioeconomic Characteristic
Variables Disloyal
shopper
Traditionalist
shopper
Quality-
Oriented
shopper
Value
shoppers
Enthusiastic
shoppers
Apathetic
shopper
Gender %
1 2 3 4 5 6
Male 37.97 80.56 48.84 63.49 34.69 61.11
Female
62.03 19.44 51.16 36.51 65.31 38.89
Age %
From 15 to 24 12.66 6.94 11.63 6.35 6.12 25.00
From 25 to 39 46.84 47.22 32.56 41.27 38.78 33.33
From 40 to 54 25.32 37.50 51.16 44.44 42.86 38.89
Aged 55 and over 15.19 8.33 4.65 7.94 12.24 2.78
Household Size %
One 0.00 1.39 0.00 1.59 0.00 8.33
Two 6.33 4.17 4.65 7.94 4.08 2.78
Three 26.58 19.44 9.30 17.46 12.24 11.11
Four 16.46 26.39 23.26 14.29 34.69 16.67
Five 16.46 20.83 16.28 14.29 26.53 22.22
Six and more 34.18 27.78 46.51 44.44 22.45 38.89
Household Income
Less than 500 15.19 19.44 23.26 20.63 42.86 16.67
Around 500 15.19 12.50 16.28 12.70 18.37 30.56
More than 500 45.57 51.39 46.51 57.14 24.49 33.33
Prefer not to say 24.05 16.67 13.95 9.52 14.29 19.44
Occupation %
Professional 21.52 23.61 37.21 47.62 14.29 11.11
Government officers 21.52 27.78 16.28 19.05 16.33 30.56
Teachers 25.32 22.22 16.28 12.70 18.37 13.89
Housewives 16.46 2.78 9.30 7.94 28.57 8.33
Businesspeople 8.86 8.33 2.33 6.35 4.08 11.11
Students 3.80 4.17 11.63 1.59 4.08 11.11
Retired 2.53 2.78 4.65 1.59 10.20 2.78
Unemployed 0.00 1.39 0.00 0.00 4.08 11.11
Others 0.00 6.94 2.33 3.17 0.00 0.00
Going to traditional market
Always with others 29.11 19.44 23.26 25.40 34.70 25.00
Usually with others 21.52 16.67 4.65 17.46 36.73 25.00
Never shop at 15.19 12.50 30.23 12.70 6.12 11.11
Always alone 6.33 8.33 18.60 17.46 10.20 8.33
Usually alone 7.59 26.39 9.30 14.29 4.08 11.11
No clear pattern
20.25 16.67 13.95 12.70 8.16 19.44
Page 172
157
Table 6-17: Summary of Shopper Segments Profiles
Profile Cluster 1 Cluster 2 Cluster 3 Cluster 4 Cluster 5 Cluster 6
% 17.65 16.76 15.88 15.59 24.12 10.00
Title for cluster Disloyal
Traditionalist
Quality-
oriented
Value Enthusiastic Apathetic
Shopping motivations
Hedonic shopping higher than
average
lower than
average
lowest lower than
average
Highest lower than
average
Confused by choice highest average average lowest Average average
Social shopping average highest lowest average higher than
average
lower than
average
High quality higher than
average
higher than
average
highest average Average lowest
Value shopping highest average lower than
average
higher than
average
Lowest average
Brand loyal lowest higher than
average
lower than
average
higher than
average
Highest lower than
average
Brand conscious highest higher than
average
average lowest Average lower than
average
Gratification higher than
average
average lowest highest Average higher than
average
Gender roles lower than
average
highest lower than
average
lower than
average
Lowest higher than
average
Role playing average higher than
average
highest low higher than
average
lowest
Impulsiveness lower than
average
highest higher than
average
lowest Average higher than
average
Social acceptance highest lowest higher than
average
lower than
average
Average average
Demographics
Gender female male mixed male Female male
Age Mixed 25 to 54 25 to 54 25 to 54 25 and
more
15 to 54
Family size Three and
more
Three and
more
Four and
more
Four and
more
Four and
more
Four and
more
Income More than
500
More than
500
More than
500
More than
500
Less than
500
Around
500 & More
than 500
Occupation Teachers Government
officers
Professional Professional Housewives Government
officers
Behaviour variables
Going to traditional
market
with others
No clear
Alone with others
Never shop with others
with
others
with
others
With
others
Page 173
158
Table 6-18: Average Scores for Importance of Retail Outlet Attributes by Cluster
Attributes
Average Score Overall
Average
F
Sig 1 2 3 4 5 6
Location/Convenience 3.49 3.41 3.60 3.43 3.35 3.42 3.46 0.924
Price of product 3.56 3.76 3.60 3.57 3.80 3.58 3.66 0.763
Special offers 3.56 3.44 3.63 3.63 3.49 3.33 3.52 0.588
Assortment 3.37 3.17 3.00 3.11 3.00 3.17 3.16 0.413
Quality of service 4.20 4.04 4.05 4.06 3.90 4.17 4.08 0.587
Speed of service 4.04 4.07 3.93 4.17 3.98 4.08 4.05 0.727
Quality of product 4.09 4.10 4.12 4.33 4.00 4.33 4.15 0.226
Variety of product 3.78 3.93 3.72 4.00 3.78 3.81 3.85 0.646
Freshness of produce 3.35 3.57 3.51 3.32 3.31 3.90 3.42 0.715
Atmosphere 3.48 3.69 3.56 3.60 3.82 3.69 3.63 0.644
Cleanliness of place 2.47 2.46 2.47 2,56 2.73 2.22 2.49 0.553
Food safety 4.58 4.69 4.70 4.63 4.61 4.56 4.63 0.538
Personal safety 2.51 2.30 2.95 2.57 2.71 2.47 2.56 0.322
In – store credit 3.37 3.57 3.37 3.40 3.33 3.36 3.41 0.425
Car parking 3.81 3.80 3.77 3.89 3.71 3.53 3.77 0.584
Social acceptability 3.83 3.96 3.98 3.86 3.49 3.75 3.82 0.212
Page 174
159
Table 6-19: Cluster Profile Using Additional Shopping Behaviour Variables
Disloyal
Shopper
Traditionalist
Shopper
Quality-
Oriented
shopper
Value
shopper
Enthusiastic
shoppers
Apathetic
shopper
Visit a supermarket
Everyday 6.33 5.56 6.98 3.17 6.12 8.33
Two- three
times a week
15.19 16.67 13.95 14.29 24.49 19.44
Once a week 10.13 23.61 9.30 12.70 10.20 5.56
Two- three
times a month
25.32 22.22 11.63 22.22 14.29 13.89
Once a month 41.78 30.56 51.16 46.03 42.86 44.44
Never 1.29 1.39 6.98 1.59 2.04 8.33
Visit a traditional market
Everyday 5.06 4.17 2.33 7.94 6.12 2.78
Two- three
times a week
17.72 30.56 9.30 25.40 18.37 33.33
Once a week 39.24 31.94 23.26 36.51 44.90 30.56
Two- three
times a month
8.87 9.72 18.60 7.94 14.29 8.33
Once a month 12.66 11.11 13.95 7.94 10.20 16.67
Never 16.46 12.5 32.56 14.29 6.12 8.33
Visit an independent store
Everyday 50.63 62.5 48.84 47.62 57.14 66.67
Two- three
times a week
32.91 22.22 30.23 38.10 30.61 22.22
Once a week 10.13 8.33 2.33 6.35 4.08 5.56
Two- three
times a month
2.53 1.39 6.98 3.17 6.12 0.00
Once a month 0.00 4.17 4.65 0.00 0.00 2.78
Never 3.80 1.39 6.98 4.76 2.04 2.78
Time in supermarket
Less than one
hour
26.92 38.03 25.00 25.81 22.92 32.35
1-2 hours 51.28 50.70 55.00 54.84 50.00 55.88
Page 175
160
Disloyal
Shopper
Traditionalist
Shopper
Quality-
Oriented
shopper
Value
shopper
Enthusiastic
shoppers
Apathetic
shopper
2-3 hours 20.51 9.86 17.50 16.138 22.92 11.76
More than 3
hours
1.28 1.41
2.50 3.23 4.17 0.00
Time in traditional market
Less than one
hour
48.53 49.21 62.07 55.56 76.09 45.45
1-2 hours 45.59 44.44 31.03 37.04 17.39 45.45
2-3 hours 5.88 4.76 6.90 7.41 4.35 9.09
More than 3
hours
0.00 1.59 0.00 0.00 2.17 0.00
Time in independent store
Less than one
hour
98.70 100.00 100.00 96.67 93.75 94.29
1-2 hours 1.30 0.00 0.00 1.67 6.25 5.71
2-3 hours 0.00 0.00 0.00 1.66 0.00 0.00
More than 3
hours
0.00 0.00 0.00 0.00
0.00 0.00
Shopping decision
Cluster Number of Case
1 2 3 4 5 6 Total
shopping decision alone Count 18 18 12 11 9 14 82
% within Cluster Number of Case 22.8% 25.0% 27.9% 17.5% 18.4% 38.9%
24.0%
with others Count 48 40 22 36 28 19 193
% within Cluster Number of Case 60.8% 55.6% 51.2% 57.1% 57.1% 52.8%
56.4%
depends on the circumstances Count 13 14 9 16 12 3 67
% within Cluster Number of Case 16.5% 19.4% 20.9% 25.4% 24.5% 8.3%
19.6%
Total Count 79 72 43 63 49 36 342
% within Cluster Number of Case 100.0% 100.0% 100.0%
100.0% 100.0% 100.0% 100.0%
Alone 22.78 25.00 27.91 17.46 18.37 38.89
With others 60.76 55.566 51.16 57.14 57.14 52.78
Depended on
circumstances
16.46 19.44 20.93 25.40 24.49 8.33
Spending on supermarket
Less than 300 46.16 33.80 37.50 29.03 45.83 47.06
300-500 47.44 56.34 55.00 56.45 50.00 50.00
More than 500 6.41 9.86 7.50 14.52 4.17 2.94
Spending on traditional market
Less than 300 92.53 92.06 93.33 83.33 93.48 84.85
300-500 7.46 4.76 6.67 16.67 6.52 12.12
More than 500 0.00 3.17 0.00 0.00 0.00 3.03
Page 176
161
Disloyal
Shopper
Traditionalist
Shopper
Quality-
Oriented
shopper
Value
shopper
Enthusiastic
shoppers
Apathetic
shopper
Spending on independent store
Less than 300 77.63 74.65 90.24 80.00 87.5O 74.29
300-500 22.37 22.55 7.32 20.00 10.42 25.71
More than 500
0.00 2.82 2.44 0.00 2.083 0.00
Going to supermarket
Always with
others
31.65 20.83 27.91 30.16 26.53 27.78
Usually with
others
21.52 25.00 18.60 38.10 32.65 19.44
Never shop 1.27 2.78 6.98 1.59 2.04 5.56
Always alone 5.06 11.11 6.98 6.35 8.16 5.56
Usually alone 12.66 18.06 13.95 6.35 8.16 16.67
No clear pattern
27.85 22.22 25.58 17.46 22.45 25.00
6.5.3. Econometric Analysis
To understand shopping behaviour in greater depth, econometric analysis was applied in two stages.
6.5.4. Ordered Probit Model
In the first step, three models were estimated. The frequency of visits to supermarkets, traditional
markets, and independent stores were used as dependent variables, with the values for the
dependent variable taking the following: “1 for “everyday”, “2” for “2-3 times a week”, “3” for
“once a week”, “4” for 2-3 times a month”, “5” for “once a month”, and “6” for “never shop at
particular format”. Retail outlet attributes and socioeconomic variables were utilised as
independent variables. The statistically significant bootstrapped ordered Probit models were
reported in Table 6-20. Log- likelihood tests were applied to assess the overall significance of the
various independent variables in explaining differences in the number of visits. Although Log-
likelihood tests rejected the null hypotheses, the probability value of 0.000 for the Wald test
indicated that at least one of the explanatory variables used in the models was appropriate. In other
words, although, the models did not identify many significant variables, the goodness-of-fit
measured by the 2 showed that the choice of explanatory variables included in the ordered Probit
Page 177
162
models were relevant for explaining variation in the frequency of visits to different retail formats in
Libya. In addition, Table 6-20 presented the estimates of cut-offs variables. According to Maddala
(1983), the threshold coefficients should exhibit the relationship c1< c2<c3 <c4 <c5 and must be
positive. As can be seen in Table 6-20, the estimated cut-offs satisfied this condition and were all
positive and ordered properly.
Considering socio-economic characteristics, only gender was important in explaining
variations in the frequency of visits to supermarkets and traditional markets. The significantly
positive coefficient for gender indicated that males were less frequent visitors to supermarkets.
However, frequency of visits to traditional market was negatively related to gender thereby
indicating that males were significantly more frequent visitors to traditional markets. However there
was no significant relationship between frequency of visits to independent stores and all other
considering socio-economic characteristics. Regarding retail attributes, frequency of supermarket
visits was positively related to the importance given to convenience of location, car parking and
social acceptability, and negatively related to speed of service. In other words, for instance, those
who regarded convenience of location, car parking and social acceptability as being more important
in their choice of retail outlet were more frequent visitors to supermarkets. The frequency of
traditional market visits was positively related to the importance given to freshness of produce.
Frequency of independent store visits was positively related to the quality of service and provision
of in-store credit.
6.5.5. Tobit Models
The Tobit models empirically investigate the determinants of proportionate spending in
supermarkets, traditional markets, and independent stores for selected product categories. The
censored dependent variables were the percentage of spending on a particular product category
(fresh fruit and vegetables [FFV], fresh meat, fresh fish, packaged food, and beverages) accounted
for by supermarkets, traditional markets, and independent stores. Retail outlet attributes and
socioeconomic variables were used as the independent variables. In the case of fresh meat,
packaged food and beverages only supermarkets and independent stores were considered. This was
because they were identified as products that make up low proportions of consumers’ spending in
traditional markets (i.e. about 1.33% for fresh meat, 3.44% for packaged food, and 2.38% for
beverages) as shown in Table 6-5.
Page 178
163
Table 6-20: Bootstrapped Ordered Probit Models
Independents Dependents
(N= 371)
frequency of supermarket
visits
frequency of traditional
market visits
frequency of
independent store visits
Coefficient* z- value Coefficient z- value Coefficient z- value
Models 1 2 3
Retail outlet attributes
Location/convenience 0.126**
2.01 -0.070 -1.12 0.012 0.14
Price of products -0.010 -0.15 0.073 1.14 -0.070 -1.17
Special offers 0.003 0.05 0.076 1.12 0.073 0.81
Assortment 0.038 0.66 0.034 0.61 -0.090 -1.41
Quality of service -0.096 -1.36 0.100 1.18 0.150* 1.77
Speed of service -0.132* -1.82 -0.083 -0.81 -0.036 -0.35
Quality of products 0.066 0.77 -0.054 -0.59 -0.001 -0.01
Variety of products 0.016 0.19 -0.066 -1.03 0.086 1.16
Freshness of produce 0.063 1.14 0.394***
5.12 0.007 0.11
Atmosphere 0.039 0.62 0.016 0.27 -0.048 -0.71
Cleanliness of place -0.057 -0.82 -0.036 -0.60 -0.024 -0.40
Food safety 0.062 0.57 -0.100 -1.10 0.041 0.43
Personal safety 0.055 1.12 0.010 0.23 0.034 0.70
In – store credit 0.022 0.45 0.050 1.24 0.495*** 7.31
Car parking facilities 0.190** 2.09 -0.040 -0.57 -0.038 -0.49
Social acceptability 0.268*** 5.00 -0.020 -0.44 0.056 1.10
Socio-economic characteristics
Gender 1.414***
9.58 -0.453*** -4.07 -0.611
*** -3.50
Marital statue -0.063 -0.41 -0.082 -0.50 -0.222 -1.30
Age -0.037 -0.44 0.090 0.88 0.050 0.58
Size of family -0.076 -1.41 -0.064 -1.19 -0.043 -0.86
Income -0.002 -0.04 0.039 0.84 -0.019 -0.28
Education 0.001 0.03 0.028 0.61 0.002 0.05
Nationality 0.077 0.13 -0.046 -0.12 0.207 0.53
Lived abroad -0.122 -0.66 0.140 0.94 0.001 0.01
Migration -0.031 -0.24 -0.167 -1.17 -0.021 -0.15
Occupation 0.003 0.26 0.010 0.79 -0.008 -0.45
cut1 1.014 - -0.987 - -1.191 -
cut2 2.762 - -0.325 - -0.540 -
cut3 3.513 - 0.004 - -0.110 -
cut4 3.872 - 0.992 - 0.359 -
cut5 4.575 2.171 - 1.397 -
Pseudo R2 0.184 0.090 0.135
Log likelihood -497.857 -557.109 -463.608
Wald chi2(26) (Prob>chi2) 632.98***
(0.000) 126.21***
(0.000) 153.50***
(0.000)
*:
*-10%,**-5%,***-1%- level of significance
Page 179
164
Regarding FFV and considering retail attributes, as reported in Table 6-21, the respondents
with a higher proportion of spending in supermarkets rated social acceptability as being of greater
importance, whereas freshness of produce was significantly less important for those depending
more on supermarkets for FFV. Gender and age were significant in explaining variations in the
percentage of total expenditure on FFV accounted by supermarkets. In other words, those relying on
supermarkets for FFV were significantly more likely to be females and younger. Respondents with
a higher proportion of spending in traditional markets recorded freshness of produce as a more
important consideration whereas the cleanliness of place and social acceptability were significantly
less important for this group. Only gender was significant in explaining variations in the percentage
of total expenditure on FFV accounted by traditional markets, where females were significantly
lower users. For those with a higher proportion of spending in independent stores, cleanliness of
place and assortment were rated as significantly more important attributes while, only special offers
was significantly less important for this group. Those relying on independent stores for FFV were
less likely to be female, and biased toward the young.
As detailed in Table 6-22, the Tobit model for the percentage of total spending on fresh meat
accounted for by different retail formats revealed that respondents with a higher proportion of
spending in supermarket rated atmosphere and social acceptability as being of greater importance,
whereas freshness of produce was significantly less important for this group. Gender and age were
significant in explaining variations in the percentage of total fresh meat spend accounted by
supermarkets. Those relying on supermarkets for fresh meat were significantly more likely to be
female, and younger. In contrast, the respondents with a higher proportion of spending in
independent stores recorded freshness of produce as a more important factor, whereas atmosphere
and social acceptability were significantly less important for this group. The significant negative
coefficient for gender indicated that this group was biased toward males.
Analysis of the Tobit models as shown in Table 6-23 for the percentage of total spending on
fresh fish accounted for by supermarkets, traditional markets, and independent stores revealed a
negative relationship between the percentage spent in supermarkets and freshness of produce and a
significantly positive relationship with social acceptability.
Page 180
165
Table 6-21: Bootstrapped Tobit Models for Percentage of Spending on FFV at Different
Retail Outlet
* *-10%,**-5%,***-1%- level of significance
Independents Dependents (Percentage of spending)
(N= 371)
at supermarkets at traditional markets at independent stores
Coefficient*
z-
value
Coefficient z-
value
Coefficient z-
value
Models 1 2 3
Retail outlet attributes
Location/convenience -0.808 -0.47 0.729 0.40 -0.250 -0.15
Price of products 2.606 1.43 -0.253 -0.11 -1.333 -0.76
Special offers 1.657 1.01 0.690 0.33 -3.908** -1.81
Assortment -0.330 -0.20 -2.595 -1.40 4.129** 2.50
Quality of service 0.392 0.18 -3.104 -1.50 2.008 0.87
Speed of service -0.415 -0.19 -0.189 -0.08 -0.475 -0.18
Quality of products -0.148 -0.07 0.044 0.02 -0.132 -0.05
Variety of products -1.905 -1.26 0.950 0.43 0.207 0.10
Freshness of produce -6.563*** -4.00 8.018
** 4.38 -2.067 -1.04
Atmosphere 0.667 0.43 3.420 1.47 -3.073 -1.55
Cleanliness of place 1.426 1.00 -7.929*** -4.18 6.439
*** 3.56
Food safety -3.052 -1.10 0.691 0.26 0.681 0.22
Personal safety 1.190 1.01 -0.325 -0.21 -0.159 -0.12
In – store credit -0.205 -0.15 -1.364 -1.07 1.976 1.64
Car parking facilities 0.427 0.23 2.104 0.87 -2.915 -1.36
Social acceptability 7.703*** 5.59 -6.492
*** -3.63 -0.189 -0.14
Socio-economic characteristics
Gender 16.627*** 5.42 -10.546
** -2.30 -8.237* -1.80
Marital status 3.657 1.32 -4.718 -1.19 -0.661 -0.20
Age -4.112** -2.19 -0.991 -0.35 3.273 1.50
Size of family -0.152 -0.13 1.371 0.80 -1.034 -0.71
Income -0.144 -0.10 -0.150 -0.08 -0.897 -0.52
Education 1.830 1.18 0.421 0.24 -2.171 -1.24
Nationality -2.927 -1.54 18.750 1.26 -3.398 -0.17
Lived abroad -2.666 -0.59 0.484 0.09 1.522 0.29
Migration -0.165 -0.05 2.026 0.55 -0.234 -0.07
Occupation 0.958 1.30 -0.081 -0.15 -0.425 -0.94
Constant 5.704 0.28 53.088 1.59 54.799 1.64
Sigma 26.472 34.693 31.482
Pseudo R2
0.057 0.033 0.017
Log likelihood -1224.172 -1487.750 -1445.208
Wald chi2(26)
(Prob>chi2) 457.50
*** (0.000) 183.81
*** 0.000) 81.82
*** (0.000)
Page 181
166
Table 6-22: Bootstrapped Tobit Models for Percentage of Spending on Fresh Meat Accounted
for by Different Retail Formats
Independents Dependents
(N= 371)
Percentage of spending at
supermarkets
Percentage of spending at
independent stores
Coefficient* z- value Coefficient z- value
Models 1 2
Retail outlet attributes
Location/convenience 2.231 1.01 -2.106 -0.94
Price of products 3.253 1.26 -3.405 -1.11
Special offers -0.065 -0.02 0.226 0.07
Assortment -1.868 -0.97 1.471 0.56
Quality of service -2.893 -0.95 3.098 0.82
Speed of service 3.473 1.27 -3.893 -1.05
Quality of products -4.427 -1.20 4.726 1.39
Variety of products 2.804 0.98 -2.809 -0.96
Freshness of produce -15.632*** -6.74 15.688
*** 5.96
Atmosphere 4.827** 2.28 -4.740
* -1.95
Cleanliness of place -1.657 -0.64 1.591 0.53
Food safety -3.435 -0.92 3.343 0.80
Personal safety 0.480 0.26 -0.460 -0.24
In – store credit 1.992 1.06 -2.592 -1.35
Car parking facilities -1.118 -0.36 1.043 0.34
Social acceptability 5.067** 2.07 -4.993
*** -2.45
Socio-economic characteristics
Gender 11.612** 2.01 -12.270
** -1.96
Marital status -5.527 -1.05 6.318 1.10
Age -1.450 -0.48 1.123 0.32
Size of family 1.870 0.92 -2.017 -0.96
Income -1.155 -0.52 1.218 0.54
Education 1.348 0.64 -1.023 -0.40
Nationality 3.343 0.21 -1.796 -0.11
Lived abroad -1.947 -0.27 3.437 0.58
Migration -3.212 -0.49 2.714 0.46
Occupation -0.037 -0.05 0.026 0.03
Constant 37.476 1.05 59.059 1.71*
Sigma 42.895 43.637
Pseudo R2
0.036 0.035
Log likelihood -1250.764 -1265.227
Wald chi2(26) (Prob>chi2) 253.91***
(0.000) 174.28***
(0.000)
*:
*-10%,**-5%,***-1%- level of significance
Page 182
167
Table 6-23: Bootstrapped Tobit Models for Percentage of Spending on Fresh Fish Accounted for
by Different Retail Formats
Independents Dependents (Percentage of spending)
(N= 371)
at supermarkets at traditional markets at independent stores
Coefficient* z-
value
Coefficient z-
value
Coefficient z-
value Models 1 2 3
Retail outlet attributes
Location/convenience 2.208 0.74 1.863 0.49 -2.179 -0.83
Price of products 1.321 0.45 .820 0.16 -2.477 -0.74
Special offers -4.278 -1.02 6.595 1.01 -1.011 -0.28
Assortment 0.493 0.15 -1.856 -0.40 3.503 1.07
Quality of service -4.037 -1.02 7.480 1.31 -2.674 -0.70
Speed of service -1.467 -0.34 4.081 0.71 -0.333 -0.09
Quality of products 3.300 0.68 -1.047 -0.19 0.441 0.11
Variety of products 4.573 1.20 -5.911 -1.31 2.335 0.83
Freshness of produce -6.690** -1.92 12.766
*** 2.91 -3.372 -1.04
Atmosphere 4.931 1.33 -5.525 -1.22 -1.437 -0.41
Cleanliness of place 1.974 0.69 -19.279*** -4.71 19.809
*** 6.14
Food safety 7.184 1.07 -11.224 -1.33 -1.283 -0.27
Personal safety 8.162*** 3.45 -17.691
*** -5.33 19.705*** 8.93
In – store credit 1.570 0.73 -2.908 -0.78 -0.449 -0.23
Car parking facilities 0.468 0.11 2.037 0.40 0.931 0.31
Social acceptability 7.069*** 2.46 -4.869 -1.38 -1.914 -0.75
Socio-economic characteristics
Gender 16.913** 2.32 -28.955
*** -3.22 11.919* 1.80
Marital status -.300 -0.04 -13.147 -0.96 15.708** 2.08
Age -2.169 -0.62 -9.324 -1.17 1.973 0.50
Size of family 0.789 0.35 -2.709 -0.61 0.545 0.21
Income 0.723 0.22 3.570 0.67 0.100 0.03
Education 0.233 0.08 -1.647 -0.41 -1.535 -0.64
Nationality -1.415 -0.06 12.920 0.43 -2.391 -0.17
Lived abroad 2.250 0.28 -5.576 -0.48 4.062 0.41
Migration -4.958 -0.71 14.516 2.03 -4.996 -0.90
Occupation 0.307 0.28 -0.444 -0.33 0.252 0.27
Constant -125.780*** -2.50 288.837
*** 3.77 -114.952*** -2.69
Sigma 48.224 69.087 44.199
Pseudo R2
0.043 0.0742 0.121
Log likelihood -897.203
Wald chi2(26)
(Prob>chi2)
259.02****
(0.000) 265.6***
(0.000) 442.92***
(0.000)
(0.000)
*:
*-10%,**-5%,***-1%- level of significance
Page 183
168
In other words, those buying a greater proportion of fresh fish from supermarkets rated social
acceptability as being more important and freshness of produce less important. Females spent
proportionally more in supermarkets. With respect to the percentage spent in traditional markets,
cleanliness of place and personal safety were recorded as less important. Males spent proportionally
more in traditional markets. Those whose expenditure was skewed to traditional markets placed
greater emphasis on freshness of produce. For those with a higher proportion of spending in
independent stores, cleanliness of place and personal safety were rated as being of greater
importance. Those relying on independent stores for fresh fish were significantly more likely to be
female and married.
For packaged food, Table 6-24 indicates that those buying a greater proportion of these goods
from supermarkets placed greater emphasis on special offers, atmosphere, and car parking facilities,
whereas in-store credit was rated as less important. In contrast, those buying a greater proportion of
packaged food from independent stores rated special offers and atmosphere as being of less
importance, whereas they placed greater emphasis on in-store credit. Regarding socioeconomic
characteristics, only gender and age were significant in explaining variations in the supermarkets’
share of total expenditure on packaged food. Females and older consumers spent proportionally
more in supermarkets, while males tended to spend more in independent stores.
Finally, Table 6-25, detailed the results of the Tobit models for the percentage of total
spending on beverages accounted for by supermarkets and independent stores. The results indicate
that there were significant positive relationships between the percentage spent in supermarkets and
the importance of special offers, atmosphere and car parking facilities (as in the case of packaged
food), and negative relationships with in–store credit and quality of service. Regarding socio-
economic characteristics, only gender was significant in explaining variations in the percentage of
total expenditure on beverages accounted for by supermarkets and independent stores. Those
relying on supermarkets for beverages were more likely to be female, whereas those relying on
independent stores for beverages were more likely to be males. Those relying on independent stores
for beverages were less concerned with special offers, atmosphere and car parking facilities but
rated quality of service, cleanliness of place and in-store credit as being of greater importance.
Page 184
169
Table 6-24: Bootstrapped Tobit Models for Percentage of Spending on Packaged
Food Accounted for by Different Retail Formats
Independents Dependents
(N= 371)
Percentage of spending
at supermarkets
Percentage of spending
at independent stores
Coefficient* z- value Coefficient z- value
Models 1 2
Retail outlet attributes
Location/convenience -0.585 -0.58 0.620 0.50
Price of products 0.169 0.11 -0.546 -0.30
Special offers 6.518*** 3.84 -6.531
*** -4.25
Assortment -1.209 -1.05 0.975 0.72
Quality of service -0.882 -0.66 0.087 0.05
Speed of service 1.956 0.90 -1.003 -0.61
Quality of products -1.941 -0.97 2.231 1.12
Variety of products 0.726 0.44 -0.626 -0.41
Freshness of produce -0.849 -0.77 1.237 1.24
Atmosphere 6.708*** 4.77 -4.763
*** -3.53
Cleanliness of place -0.319 -0.25 1.465 1.36
Food safety -1.032 -0.42 1.238 0.57
Personal safety -0.037 -0.05 -0.686 -0.90
In – store credit -2.436*** -2.52 2.216
** 2.20
Car parking facilities 3.547** 2.05 -2.502 -1.43
Social acceptability 0.614 0.53 -0.631 -0.62
Socio-economic
characteristics
Gender 6.165*** 2.79 -6.946
*** -3.11
Marital status 3.802 1.06 -4.042 -1.36
Age 3.054* 1.72 -1.536 -1.13
Size of family 0.984 1.11 -1.230 -1.06
Income 0.476 0.42 -0.397 -0.32
Education 0.828 0.59 -1.196 -0.81
Nationality -3.470 -0.49 4.334 0.60
Lived abroad -3.130 -1.02 3.44 1.02
Migration -1.566 -0.62 0.927 0.36
Occupation -0.789 -2.30 0.742 1.33
Constant 6.807 0.38 76.004*** 3.89
sigma 22.191 20.879
Pseudo R2
0.034 0.030
Log likelihood -1540.123 -1522.740
Wald chi2(26) (Prob>chi2) 178.11***
(0.000) 135.59***
(0.000)
*:
*-10%,**-5%,***-1%- level of significance
Page 185
170
Table 6-25: Bootstrapped Tobit Models for Percentage of Spending on Beverages Accounted
for by Different Retail Formats
Independents Dependents
(N= 371)
Percentage of spending at
supermarkets
Percentage of spending at
independent stores
Coefficient*
z- value Coefficient z- value
Models 1
2
2
Retail outlet attributes
Location/convenience -0.412 -0.26 0.467 0.37
Price of products 1.468 0.84 -1.877 -1.17
Special offers 9.908*** 5.15 -9.934
*** -6.66
Assortment -0.3782 -0.31 0.108 0.08
Quality of service -3.472* -1.88 3.869
***
ANOVA test
were established
by examining
statistically
significant
differences
between clusters
under
hypotheses:
2.43
Speed of service 1.924 0.84 -2.14 -1.19
Quality of products -0.356 -0.16 1.331 0.65
Variety of products -0.026 -0.02 -0.299 -0.20
Freshness of produce -2.258 -1.77 2.116 1.43
Atmosphere 5.326*** 3.23 -3.486
** -2.26
Cleanliness of place 0.780 0.55 -.585 -0.33
Food safety -2.754 -0.97 1.211 0.46
Personal safety 1.156 0.97 -1.570 -1.48
In – store credit -2.368** -2.14 2.338
*** 2.16
Car parking facilities 6.182*** 2.77 -5.198
*** -3.04
Social acceptability -0.150 -0.11 -0.329 -0.28
Socio-economic characteristics
Gender 5.767* 1.94 -6.499** -2.27
Marital status 1.398 0.33 -1.151 -0.35
Age 2.091 0.90 -1.609 -0.91
Size of family -0.033 -0.03 0.358 0.31
Income 1.167 0.82 -1.186 -0.96
Education 0.151 0.11 -0.249 -0.21
Nationality 2.747 0.35 -3.176 -0.45
Lived abroad 1.083 0.32 -1.865 -0.47
Migration -1.669 -0.58 1.108 0.31
Occupation -0.410 -0.88 0.443 0.96
Constant -4.790 -0.23 104.291***
4.92
Sigma 26.152 24.733
Pseudo R2
0.032 0.031
Log likelihood -1552.981
Wald chi2(26) (Prob>chi2) 189.60***
(0.000) 308.81***
(0.000)
*: *-10%,**-5%,***-1%- level of significance
Page 186
171
6.6. Effect of the 17th
Revolution in Consumer Food Shopping Behaviour
Finally, taking into account the revolution that occurred in Libya during the period of data
collection the question “Has the revolution of 17th
of February had an impact on your shopping
behaviour?” was added to the questionnaire. This was an open ended question. Some respondents
revealed that there had been an impact in terms of a focus only on basic needs:
Yes, there is an impact; I started shopping weekly with a focus on basic food items, not as
before where I shopped monthly and bought a large amount of food to store for several
months.
There is a lack of liquidity which led to a lack of imports from abroad. Also, the battles that
tore the country apart, affected domestic trade. All these things led to a rise in prices. This
increase imposes the need to order priorities.
Yes there is an effect on shopping behaviour. Due to lack of financial resources and high
prices the main focus is to buy necessities only.
Of course there is an effect. I try to save my money by buying just the necessary items and
ignore luxuries.
In addition, some of the respondents highlighted a positive effect on a personal level such as a
greater sense of the needs of others:
Yes, the events have had a very big impact because of the lack of liquidity I stopped buying
some luxuries, even after the situation has improved as my sense of poor people became more
acute than before.
Yes, there is positive impact in terms of achieving social solidarity and practical cooperation
and the creation of a new spirit and a bright look for a better future.
Yes, I become more flexible and patient when there is a lack of products.
Yes, especially in the early days there was a fear of lack of products, but when the situation
stabilized there was a sense of solidarity with others and their needs.
Yes it has affected all aspects of life, not just shopping. Always, when I go shopping I do not
like to wait. If there was overcrowding, I go and come back at another time when it is less
Page 187
172
busy but now I wait with all the spirit of sport.
Of course, the revolution has an impact on shopping because of the shortage of salaries
which led directly to a reduction in purchasing power. Also an increase in prices led to focus
on the priorities and the important things. I become as economical as much as possible.
Yes I learned to be economical and appreciated of the circumstances of my husband and his
income and taking into account the simple priorities.
Yes, there is a positive influence, thank God, although there is a rise in prices, but the reward
is freedom.
However, some reported a negative impact:
Yes, the impact for me is negative; prices are very high level and there is a lack of food as a
result of some people buying large quantities and stockpiling them in their homes.
6.7. Conclusion
In this chapter, the results of the data analysis were presented to understand Libyan food shoppers’
behavioural patterns by using relevant statistical methods. Descriptive statistics were used to
present the socio-economic characteristics of the sample and detail respondents' food shopping
behaviour. The importance of attributes affecting the choice of retail formats and how well
supermarkets, traditional markets and independent stores performed on these measures were
assessed. After presenting of the descriptive statistics, the analysis of data continued with the use of
factor analysis including confirmatory (CFA) and exploratory (EFA) analysis.
The CFA results indicated that Jamal et al.’s (2006) model was inappropriate for the Libyan
case. EFA identified 12 factors: hedonism, confused by choice, social shopping, value shopping,
brand loyalty, brand conscious, high quality seeking, gratification seeking, gender roles and
shopping task, role playing, impulsiveness and social acceptance. The factors generated provided
the basis for cluster analysis, in order to investigate the existence of distinctive groups of shoppers
(shopper segments) based on shopping motivations. Also, the study provided insights into the
segments’ socio-economic characteristics and shopping behaviour by using crosstabs and ANOVA
tests. Six groups of shoppers were identified: disloyal, traditionalist, quality-oriented, value,
enthusiastic, and apathetic shoppers.
Page 188
173
In addition, econometric modelling considered the possible relationships between shopping
behaviour and the socio-economic characteristics of the respondents and retail outlet attributes. The
Probit models identified determinants of shoppers' frequency of visits to supermarkets, traditional
markets and independent stores while the Tobit models dealt with percentages of spending
accounted for by different retail formats for four selected product categories: fresh fruit and
vegetables, fresh meat, fresh fish, packaged food and beverages. The majority of socio-economic
characteristics except gender, age and marital status were poor predictors of the variation in the
percentage spent on considered categories. The hypotheses were tested for significance and the
results indicated that females were significantly less likely than males to visit traditional markets.
Supermarket visitors were more concerned about social acceptability whereas, patrons of traditional
markets placed greater emphasis on freshness. Heavy users of independent stores placed greater
emphasis on in-store credit. The discussion of the results was presented in the next chapter.
Page 189
174
Chapter 7 Discussion
7.1. Introduction
This empirical study attempts to shed light on consumer food shopping behaviour in Libya with a
view to expanding the body of knowledge in this research area. The objective of this chapter is to
compare the findings of this study with previous work reported in the literature review as well as
some other studies from Western countries to produce a rich discussion. The chapter is organised
into two main sections as follows: in the first section, the results of the qualitative research are
comparatively analysed, considering in particular findings on retail formats and gender roles and
social acceptability. The second section considers similarities and differences between this study’s
quantitative findings and those presented in the literature including shopping styles and typologies
of shoppers, motives for retail outlets choice, evaluation of retail outlets and pattern of store choice
based on particular categories of products.
7.2. Qualitative Research
According to the findings of the qualitative study that was carried out in Tripoli, some fundamental
outcomes were revealed especially in terms of food shopping and gender roles that are presented in
the following discussion.
7.2.1. Retail Formats
Interviewees identified three main types of food retail formats in Libya: supermarkets, independent
stores and traditional markets. Traditional formats include open and closed markets, often utilised
for buying fresh fruits, vegetables, and fish, and which previously opened only on a particular day
of the week such as (Souk Al- Juma (Friday market), and Souk Al- Thalat (Tuesday market).
In general, Libyan consumers shop at multiple formats, dividing their grocery purchases
between several different places: supermarkets, traditional markets, and independent stores. The
greater penetration of supermarkets for buying packaged and long-life goods, traditional markets for
fresh products, and independent stores for daily and emergency provisions, follows many other
studies of food retailing in developing countries (Goldman, 1974; Samiee, 1993; Goldman et
al.,1999; Ho, 2005; Maruyama and Trung, 2007) and in particular the Arab world and North Africa,
for example; Kuwait (Al-Otaibi, 1988), Qatar (El-Droubi, 2004), Saudi Arabia (Tuncalp and
Page 190
175
Yavas,1990; Zairi and Al-Rasheed, 2010; Sohail, 2008), Tunisia (Tessier et al., 2010), and Morocco
(Amine and Lazzaoui, 2011), all of which documented the tendency of consumers to split their food
purchases between more than one retail outlet.
However, despite this combination of traditional markets, independent stores and
supermarkets, the majority of Libyan consumers appeared to prefer shopping at supermarkets.
These findings are in contrast to (Goldman, 1974) who argued that the adoption of supermarkets
would be limited as “low income consumers in developing countries tend to place a great deal of
emphasis on personal relationships with their retailers and shy from unfamiliar environments”.
Goldman (1974) also argued that adoption of supermarkets would be limited where traditional
markets and independent stores are regarded as social centres where friends and neighbours meet.
Samiee (1993) made similar points relating to the role of personal relationships, arguing that
“business in the Middle East [is] conducted on a very personal basis, and if they do not like you,
they will never, never like your products” (Samiee, 1993.p.112). However the findings for Libya
are consistent with (Zairi and Al-Rasheed, 2010) who stated that even though large numbers still
shop at mixed type of grocery outlets, a majority of Saudis show a preference for shopping at
supermarkets.
Interviewees cited the functional benefits of supermarkets (convenience, wider selection of
products, clear pricing and availability of car parking) in motivating the switch to the ‘modern
format’ rather than, as discussed by Amine and Lazzaoui (2011), conceptualizing it as a means for
social differentiation. In contrast to Goldman et al.’s (1999) who concluded consumers in Hong
Kong did not mind inferior shopping environments (e.g. dirt, smell, noise, crowding), Libyan
shoppers were not indifferent to the quality of the shopping environment (e.g. overcrowding, noise
and personal safety) and the latter played an important role in shaping format choice.
7.2.2. Gender Shopping and Social Acceptability
Powerful recurring words and terms emerged from the interview data that highlight the issue of the
social acceptability of women shopping in traditional markets: “courage”, “over-crowding”,
“uncomfortable”, “safe”/ “safety” and “shame”/ “shameful”. It appeared that supermarkets, which
are not over-crowded and where staff and customers are respectful and polite, offer a safer, more
enjoyable and socially-acceptable environment for female shoppers that is in-keeping with Arab
socio-cultural norms.
Page 191
176
In contrast to previous research (Ho, 2005; Uncles and Kwok, 2009; Minten et al., 2010), the
Libyan case highlighted the role of gender in shaping format choice to a greater extent that other
demographic characteristics. In particular females were less frequent visitors to traditional markets
compared to males. The Libyan case provided evidence of a complex picture, highlighting
significant variations, from family to family and geographically, in the social acceptability of
females shopping at traditional markets and other formats. In other words, the contrasting views
highlight significant differences in the social acceptability of females shopping for food across
cities and families. In general, however, it is socially acceptable for women to shop in a
supermarket either alone or with other women.
The importance of gender roles has been underestimated in previous research on
understanding shopping behaviour in Arab societies and developing countries in general (Hino
2010). Visiting supermarkets does not appear to be beneath richer Libyan women, in contrast to
Samiee (1993, p.112) who claimed that “In some African markets, the self-service feature of
supermarkets had to be significantly modified when store owners discovered that women
supermarket shoppers, typically from the upper classes, saw it as beneath their position in society to
push grocery carts or pick and place selected items in them”. As Libyan society and social norms
evolve, the contrast with El Droubi’s (2004, p.205) conclusion for Qatar becomes starker, who
wrote “contrary to the general food shopping situation in the developed countries where over three-
quarters of the main food shopping is done by wives, usually alone, the men in Qatar do not
entertain the idea of allowing their wives to go alone for shopping for food and grocery” (El-
Droubi, 2004.p.205).
For females with full time jobs, food shopping was regarded as a household duty rather than a
leisure activity. However, for females without work, food shopping was often regarded as a means
to escape the domestic environment. For some employed females, food shopping still provided a
release. In this respect the findings confirm those of other studies which indicated that “working
wives tend to shop less frequently, and make greater use of husbands in shopping activities than
non-working wives” (Douglas, 1976, p.16). This is because working wives typically have limited
time available for shopping and other household chores. In addition, this conclusion is in keeping
with El-Droubi (2004, p.216) who noted that “the continuous and steady increase in Qatari female
participation in the formal workforce affects consumption of convenience food products and a move
towards one-stop shopping”.
Page 192
177
While gender relations were a meaningful factor explaining retail format use in Libya, many
studies for other developing countries primarily focus on economic factors, especially incomes,
population density and private car ownership (Ho, 2005; Uncles and Kwok, 2009; Minten et al.,
2010; Gorton et al., 2011). This suggests that the factors governing supermarket adoption are not
homogenous across developing countries thereby making the case for scholars and retail
practitioners to consider variations in gender relations and their impact on retail patronage.
7.3. Quantitative Research
Considering the quantitative results, the next subsections discuss the key themes to uncover both
similarities and differences with previous findings, as follows:
7.3.1. Shopping Patterns
Regarding shopping frequency, Libyan shoppers tended to visit supermarkets regularly (at least
once a month). The popularity of monthly shopping at supermarkets may reflect two factors: first,
the relationship between shopping patterns and the system of salaries in Libya which were usually
paid monthly. Second, in-store informal credit is unavailable in supermarkets, which means that
households were most likely to visit only after their salary was received. This conclusion is in
contrast to (Alhemoud, 2008) who pointed out that consumers in Kuwait tented to visit
supermarkets at least once a week for shopping purposes.
However, visits to traditional markets were typically weekly. This may reflect how traditional
markets used to operate on a particular day of the week, although most now open every day,
especially those selling fruits and vegetables. This is consistent with the qualitative findings that
revealed that weekly visits to traditional markets were more common. Generally, these results are
out of line with El-Droubi (2004) who revealed that Qatari consumers tended to carry out shopping
whenever the need arises and depending on their mood, which indicated that there is no sense of
time preciousness supporting the notion that shopping is a means of enjoyment. This behaviour was
justified as people in Qatar have a little to do after work ends because of a higher probability of
having housemaids and chefs.
In terms of shopping decisions, similar to what is described by (El-Droubi, 2004) for Qatar,
joint husband and wife trips become common for the main shopping trip in Libya, where the results
showed that a little more than half of the respondents make their decision about what to buy in
conjunction with others. These results also are consistent with the findings of the qualitative
Page 193
178
research. However, only females tend to make shopping decisions alone. This may be due to their
responsibility for cooking and family care. The latter conclusion is confirmed by (Al-Otaibi, 1988)
who stated that females are responsible for food shopping in more cases which was considered
surprising in a male dominated society. However a number of factors, contributed to this result.
Firstly, “the co-operative societies are found within the neighbourhood shopping centres”.
Secondly, “an increasing proportion of females are gaining employment and learning to drive cars”
Al-Otaibi (1988, p. 289).
7.3.2. Shopping Styles and Typologies
The shopping motivations scales seek to capture the reasons people go shopping, and have a broad
variety of applications to marketing research. This research has investigated shopping motivations
by addressing the question “what are the shopping motivations, shopping values and decision
making styles that drive consumers’ patterns of food shopping?” as one of the research objectives.
The results revealed that hedonic shopping, confused by choice, social shopping, value
seeking, brand loyalty, brand conscious, high quality seeking, gratification seeking, gender roles
and shopping task, role playing, impulsiveness and social acceptance were important factors that
drive Libyan consumers to shop as reported in Chapter 5; section 5.4.3. These findings differ from
those of previous research. Jamal et al.’s (2006) study was used as a template for questionnaire
design and analysis. However, the confirmatory factor analysis revealed a poor fit between Jamal et
al.’s (2006) model and the Libyan case, even though there were some shared motivations such as
gratification seeking, high quality seeking, confused by choice, social shopping, value seeking,
brand loyalty, brand conscious, hedonic shopping, and role playing.
The main dissimilarity compared to Jamal et al.’s (2006) findings was that the impulsiveness
factor was emphasised strongly by Libyan shoppers, which was not the case in Qatar. The emphasis
on impulsiveness is not surprising given the fact that it is normally considered to be of strategic
importance to retailers and is thought to be linked with hedonic consumption and sensory
stimulation (Arnold and Reynolds, 2003; Jamal et al., 2006). Furthermore, the findings do not
support the importance of three factors commonly attributed to shopping motivations including:
adventure shopping, novelty seeking, and utilitarian shopping. This might be due to the timing of
the study and the direct effect of the uprising that led participants to be more preoccupied n with
prices and food availability in order to meet basic needs rather than to seek to adventure and
Page 194
179
novelty. There is some evidence for this in answers to the final open ended question that was added
to the questionnaire. However, even during times of peace, participants may not be more adventure
and novelty seeking, in that they regard food shopping as an on-going and routine activity which
does not provide any sense of adventure and novelty seeking (Smith and Carsky, 1996). Also, it
might be that any notions of adventure shopping and novelty seeking are subsumed within the
hedonic aspect of the shopping experience. The lack of emphasis on utilitarian shopping may reflect
the specific nature of shoppers in Libya and the fact that for many Libyans, as revealed in the
qualitative research, food shopping is a leisure activity not just a household duty and in line with the
emphasis on hedonic shopping motives which are confirmed in the present study.
The results further indicated that food consumers in Libya can be classified into six consumer
segments according to their decision-making styles: disloyal shoppers, traditionalist shoppers,
quality-oriented shoppers, value shoppers, enthusiastic shoppers, and apathetic shoppers. The
identification of six shopper segments is in the line with some previous studies in the literature in
both Western and non-Western contexts that share a common goal of categorizing consumers into a
limited number of groups (Westbrook and Black, 1985; Geuens et al., 2001; Jamal et al., 2006).
However, the detection of six Libyan shopper segments contrasts with many previous studies (e.g.
Stone, 1954 (4 clusters); Lesser and Hughes, 1986 (7 clusters) ; Boedeker, 1995 (2 clusters); Arnold
and Reynolds, 2003 (5 clusters); Bourlakis et al. 2006 (4 clusters); El-Adly, 2007 (3 clusters);
Ganesh et al., 2007 (4 clusters) ; Anic et al., 2012 (5 clusters)). Economic and apathetic shoppers
were the most common clusters labels among all these studies.
On other hand, with respect the labelling of the segments, the results also revealed the
typology of shoppers for Libya was in harmony with other cases, for example; disloyal shoppers
were identified by Jamal et al. (2006), traditionalist shoppers by Lesser and Hughes (1986),
Boedeker (1995), Arnold and Reynolds (2003) and Anic et al. (2012), quality-oriented shoppers by
(Darden and Ashton, 1974), enthusiastic shoppers by Arnold and Reynolds (2003) and Bourlakis et
al. (2006), and apathetic shoppers by Stone (1954), Darden and Ashton (1974), Westbrook and
Black (1985), Jamal et al. (2006) and Ganesh et al. (2007). Only one cluster (value shoppers) fails
to match any others, but there were similarities to some groups such as economic shoppers (Stone,
1954; Westbrook and Black, 1985; Jamal et al., 2006; Ahmed et al., 2007) and the budget
conscious group (Jamal et al., 2006) in terms of properties.
Page 195
180
The largest segment, labelled enthusiastic shoppers, was interested in almost all aspects of the
shopping process. For this segment the primary shopping motivations are hedonism, brand loyalty,
role playing, and social shopping. These shoppers appeared to see shopping as a leisure activity,
fulfilling an important role in family and social life. However, at the same time, they also preferred
to buy the same brands. The segment was fairly similar to (Jamal et al., 2006) notion of socializing
shoppers and the enthusiasts cluster of Arnold and Reynolds (2003), which scored highly on all
hedonic motivations. The segment was predominantly female and had a large number of
housewives with university education.
The second largest segment, disloyal shoppers, did not appear to patronize the same brands.
They were confused by choice and experienced information overload. At the same time, this
segment was driven by value seeking, brand consciousness, high quality seeking, and tended to
enjoy the hedonic aspects as well. In other words, while they were seeking value, they were also
‘price equals quality’ conscious consumers who were watching out to buy well-known, normally
expensive brands (Jamal et al., 2006). The segment matches the disloyal shoppers reported by
(Jamal et al., 2006), who scored lowly on brand loyalty and highly on value seeking motivation.
However, the main deference was on confusion where there was a high score in the Libyan case and
the opposite in Qatar.
The third largest segment, traditionalist shoppers, placed great emphasis on gender roles, a
moderate emphasis on social shopping, and low emphasis on social acceptance. In other words, they
considered shopping to be the duty of men with a woman’s place being in the home and looking
after children. They did not allow women to shop alone or with other women. However, they tended
to be socially oriented, impulsive, and high quality seeking. Also, they attached little value to brand
loyalty and role playing. The segment was composed of a significant majority of young males, and
had a large number of government officers. Interestingly, this segment was absent from prior
studies. This reflects the modification of the scale to account for the importance of gender roles
highlighted by the qualitative research, and the cultural environment of Libya.
Thus although, one of Arnold and Reynolds’ (2003) segments had the same label, they are
quite different. This difference may due to the use of different scales from Arnold and Reynolds’
(2003) study which focused on shopping motivations that are primarily hedonic and non-product in
nature. This included six categories (adventure shopping, social shopping, gratification shopping,
Page 196
181
idea shopping, role shopping, and value shopping) whereas this study incorporated, alongside
hedonic motivations, utilitarian, confusion, impulsiveness, high quality consciousness, brand
consciousness, novelty seeking, and some new scales that was generated from the qualitative
research including social acceptance and gender roles.
The fourth largest segment, quality-oriented shoppers, was characterised by a high score on
quality seeking, impulsiveness, and role playing. However, this cluster scored low on hedonic
shopping, gratification seeking, brand loyalty, and brand consciousness. In other words, they placed
great importance on high quality but regarded shopping as a chore and not a pleasant social activity.
This cluster appeared to be a fairly similar to Jamal et al.’s (2006) independent perfectionist
shoppers who tended to score high on the importance of quality and brand loyalty. The segment was
gender balanced but biased to middle aged respondents.
The fifth largest segment, value shoppers, placed considerable emphasis on value shopping
and brand loyalty and a moderate emphasis on gratification seeking, high quality seeking and social
shopping. This group scored low in hedonic shopping, impulsiveness, confused by choice and
gender roles. In other words, they paid great attention to value, patronize the same brands and are
not particularly brand conscious. The budget conscious group that was presented by (Jamal et al.,
2006) as well as “economic shoppers” that was reported by Stone (1954) and Westbrook and Black
(1985) are similar to this segment in terms of the emphasis on value shopping.
The final cluster, apathetic shoppers, was almost the mirror image of the first segment
(enthusiastic shoppers). This group cared little about almost all aspects of shopping, except that
there was some moderate value attached to impulsiveness and the gratification aspect of shopping.
Compared to Jamal et al.’s (2006) study, this segment appeared to be fairly different. Despite this,
in both cases shoppers were apparently not driven by many of the motivations usually linked to the
process of shopping, the main driver for Libyan shoppers were impulsiveness and gratification
motivations whereas in Qatar, apathetic shoppers were hedonic and confused. The segment
appeared to be similar to the apathetic shoppers of (Westbrook and Black, 1985) who tended to be
uninterested in all aspects of the shopping process. Since this cluster, in comparison with the other
clusters, was mainly composed of those aged under 25 years, it may reflect that young adults do not
take shopping for food as seriously as older adults.
Page 197
182
7.3.3. Motives for Retail Outlet Choice
Store choice is influenced by a number of factors, which affect the decision-making process. In the
context of understanding the reasons why consumers choose to shop at a particular retail format, the
present study assessed the relative importance of store attributes and examined the reasons behind
store format patronage and choice.
According to the findings of this study, the most important factor that influenced Libyan
shoppers’ store choice was food safety, followed by quality of products, quality of service, speed of
service, and variety of products. The importance of food safety was in the line with other studies
that highlight the increased salience of this attribute in non-Western markets (e.g. Gorton et al.,
2011). Comparing mean scores, Libyan shoppers rated the food safety factor a little higher than
Thai shoppers (scores of 4.61 and 4.34 respectively) . The explicit importance that was given to
food safety may be due to the direct relationship with health issues. Also, this may reflect the
indirect impact of war conditions that prevailed during the study period where there was a major
concern about food safety as a result of the absence of health control and a customs service at the
borders, which were opened without any control.
The importance of quality of products with a mean score of 4.15 (on a 5 point scale) and
service factors (4.09) are consistent with the findings of Gorton et al. (2011) who found that quality
of products is was one of the most important factors affecting store choice in Thailand (mean of
4.45). Also, the results provided clear evidence for the importance of variety of products (3.84), car
parking (3.76), price of products (3.64), atmosphere (3.63), and location (3.46). This is in contrast
to the findings of Sohail (2008), who found that price (1.68), quality and variety of products (1.47),
and store location and shop atmosphere (2.14) were not important determinants of store selection
for Saudi shoppers. Surprisingly, the findings contradicted those of Gorton et al. (2011) in one
regard, in that they argued that cleanliness of the place is more important in a non-Western context
(mean of 4.25), whereas the present study revealed that cleanliness of place appeared to be
unimportant for Libyan consumers regardless of store type with a mean score of 2.52. This might be
due to the nature of Libyan society, which considers hygiene as a foregone conclusion because of
the strong linkage to Islamic religion and culture of the community.
7.3.4. Evaluation of Supermarkets, Traditional Markets, and Independent Stores
Based on the findings in this study, an analysis of retail attributes and the weighting given to them
by consumers revealed that supermarkets, overall, outperform traditional markets and independent
Page 198
183
stores on all salient attributes, except freshness of products and in-store credit (traditional markets
performed the best on freshness of products and independent stores for in-store credit). These
results are in marked contrast to Goldman et al. (1999) who argued that supermarkets only
outperform traditional markets on attributes that are relatively unimportant and that traditional
retailers possess cost advantages and are more suited to the values of consumers in developing
countries which they label “indifference to variety, quality, service, shopping environment,
emphasis on price” (Goldman et al., 1999, p.128).
However, the findings are consistent with more recent studies of retail format choice in
emerging economies (Hino, 2010; Gorton et al., 2011). As Hino (2010, p.69) stated, “the impact of
format outputs is relatively high in terms of both adoption and usage in both studies. This finding is
supported by the perception of the supermarket viewed as providing superior outputs compared to
traditional outlets”. Gorton et al. (2011) pointed out that for data on Thailand, on all items,
supermarkets performed better than wet markets.
Regarding the evaluation of attractiveness ratings, the results revealed that supermarkets had
an advantage in terms of 13 out 15 attributes: food safety, quality of products, quality of service,
speed of service, variety of products, price of products, atmosphere, special offers, location,
assortment, cleanliness, personal safety, and social acceptance. This finding supports a number of
previous studies in the marketing literature (Al-Otaibi, 1988; Tuncalp and Yavas, 1990; El-Adly,
2007; Alhemoud, 2008; Gorton et al., 2011).
Of the 13 attractiveness factors, two were consistent with the findings of Al-Otaibi (1988)
who stated that the primary motivation for both foodstuff and non-foodstuff purchases was found to
be a reasonable price. The second most important motivation in foodstuff shopping was proximity.
Also, the findings echo those of (Tuncalp and Yavas, 1990) who asserted that greater variety, lower
prices, cleanliness, and convenient location were the most important factors that influenced the
patronage behaviour for supermarkets in Saudi Arabia. In addition, these outcomes were to some
extent in line with (El-Adly, 2007). The latter identified six mall attractiveness factors, namely
comfort including cleanness of place and security in the mall, entertainment, diversity, mall essence
such as quality of products and level of price, convenience, and luxury were important determinants
of patronage behaviour. Moreover, they support the conclusion of (Alhemoud, 2008), who
Page 199
184
identified the range, quality and variety of products, and the fairness of prices as the most
important determinants of decisions as to where to shop in Kuwait.
Regarding the evaluation of traditional markets, freshness of products was perceived by the
majority of respondents to be its only advantage. Interestingly, the results indicated that the
availability of in-store credit was the main factor underpinning the patronage of independent stores.
The superiority of independent stores in terms of in-store credit factor is highlighted by some
previous studies (El-Droubi, 2004, Tessier et al., 2010). El-Droubi (2004, p.198) stated that
“grocery shops were once preferred as they offered credit to shoppers who can pay all debts later at
the beginning of the next month without incurring any interest charges”. In addition, Tessier et al.
(2010, p.1416) noted that “overall the reason that most contrasted the choice of grocer v. other types
of retail was availability of credit”.
7.3.5. Pattern of Store Choice Based on Particular Categories of Products
This study analysed Libyan consumer behaviour across different retail formats and how household
demographics (gender, marital status, number of family members, age, income, level of education,
nationality and migration) affected shopping behaviour. Ordered Probit and Tobit models with three
categories of retail outlet formats (supermarkets, traditional markets, and independent stores) were
estimated.
Considering socio-economic characteristics, the results of the ordered Probit models indicated
that only gender was important in explaining variations in the frequency of visits to supermarkets,
independent stores and traditional markets. Females were more frequent visitors to supermarkets. In
this regard, the same finding is quoted by El-Droubi (2004. p.223) who stated that “many women
prefer to shop in large stores rather than in public markets or in small shops for cultural reasons,
particularly in attempts to reduce the possibility of mixing with men”. Frequency of visits to
traditional markets was negatively related to gender thereby indicating that males were significantly
more frequent visitors to traditional markets. However, this finding may not hold for other cultural
environments, for instance (Gorton et al., 2011) found that males were significantly less frequent
visitors to wet markets compared to females in Thailand.
The Tobit models estimated the percentage of consumers’ total spending accounted for by
different retail outlets in four selected product categories: fresh fruit and vegetables, fresh meat,
fresh fish, packaged food and beverages. Considering retail attributes, those with a higher
Page 200
185
proportion of spending on fresh products (fresh fruits and vegetables, fresh meat, and fresh fish) in
supermarkets rated social acceptability and atmosphere as more important considerations whereas
the freshness of produce attribute was rated as less important. In contrast, those spending
proportionally more in traditional markets on fresh products (fresh fruits and vegetables, and fresh
fish) rated freshness of produce and variety of products as more important attributes, while
cleanliness of place, social acceptability, and personal safety were significantly less important.
These results again reflected the superior performance of traditional markets for freshness of
produce. A preference for shopping for fresh food items in traditional markets may reflect the
tendency of Arab families to prepare and eat fresh meals at home on a daily basis, in line with
traditional directives (Hino, 2010). This is consistent with the long held claim that consumers in
developing countries are more likely to buy their fresh food items at traditional outlets rather than
supermarkets (Goldman et al. 1999; Priporas,2002). The latter reported that “the majority of the
respondents purchase fruits and vegetables from laikes (open markets) and meat, bread, and fish
from specialised stores.
Similarly, those for whom independent stores accounted for a high proportion of their
expenditure on fresh meat rated freshness of produce as a more important attribute and rated as less
important atmosphere and social acceptability. Those relying most on independent stores for meat
were significantly more likely to be males. An advantage of independent stores is that they offer
fresh meat and a greater ability to select specific cuts of meat according to consumer choice (El-
Droubi, 2004).
Regarding packaged food and drinks, those with a higher proportion of spending in
supermarkets recorded special offers, atmosphere, and car parking facilities as more important
factors while the provision of in-store credit was rated as less important. For those with a higher
proportion of spending in independent stores, in-store credit was rated as more important while
special offers and atmosphere were deemed less important. The availability of credit in independent
stores may reflect mutual trust between the seller and the buyer as a result of relationships and
friendships built up over many years.
Regarding socio-economic characteristics, only gender was significant in all the Tobit models,
where females tended to spend more in supermarkets compared to males. This is consistent with the
qualitative findings that many females eschew traditional outlets and prefer to shop at supermarkets.
Page 201
186
In addition, age was significant for the percentage of spending on fresh fruits and vegetables and
packaged food in supermarkets where young people spent relatively more on fresh fruits and
vegetables whereas older respondents spent relatively more on packaged food.
However, across the product categories, the rest of the socio-economic characteristics
including size of family, income, level of education, nationality, lived abroad, migration, and
occupation were insignificant for explaining variations in expenditure accounted for by the three
formats. This conclusion again confirmed the results of the qualitative research that highlighted
gender was a significant factor in explaining retail format choice in Libya, rather than economic
factors that were revealed by other studies in developing countries (Uncles and Kwok, 2009; Hino,
2010; Minten et al., 2010; Gorton et al., 2011). In an Arab context, Hino, (2010) reported that
economic variables were found to be the most influential factors affecting format adoption in
Jordan, but this study did not specifically consider gender.
The non-confirmation of the impact of economic variables in the Libyan case may reflect that
income levels in Libya are high enough to support supermarket adoption. Libya had a high gross
domestic product equivalent to approximately $10,000 per person in the mid-2000s (United Nations
Development Programme, 2009). In addition, because the findings may reflect that Libyan shoppers
were more preoccupied with product attributes such as food safety and quality which were
identified as the most important factors that influence Libyan consumer store choice.
7.4. Conclusion
In Libya, even though, food shopping has traditionally been a task for male household members,
with traditional markets regarded as inappropriate spaces for females alone or with other women,
shopping for food is increasingly now one of the household tasks undertaken by females. The safer,
cleaner, and less crowded environment offered by large supermarkets has contributed to women
feeling more comfortable shopping for food and henceforth being able to shop as independent
consumers. For females in full-time employment, food shopping was largely another household
chore. For those working part-time or not employed, food shopping may take on greater
significance as a leisure activity and opportunity to escape the domestic environment. The ability to
escape the latter, however, depends on family and local rules governing social acceptability. This is
leading to radical changes in shopping patterns.
Page 202
187
Six segments of shoppers were identified (disloyal shoppers, traditionalist shoppers, quality-
oriented shoppers, value shoppers, enthusiastic shoppers, and apathetic shoppers). Some of the
clusters resemble those identified in previous studies although there are also some clear contrasts.
For instance, traditionalist shoppers in Libya have very different motivations than those labelled
‘traditionalist’ in Western studies of shopping behaviour. Furthermore, the value shoppers’ cluster
was very similar to the ‘economic shopper’ segment that was reported in much earlier research.
Interestingly, an apathetic shoppers segment was identified, in common with various previous
studies.
Females spent proportionally more in supermarkets and less in traditional markets. The
important factor that predominantly influenced Libyan shoppers’ patronage behaviour regardless of
store type was food safety, following by quality of products, quality of service, speed of service,
and variety of products. The analysis of retail attributes and weighting given to the three formats by
consumers revealed that supermarket, overall, outperformed traditional markets and independent
stores on the most salient attributes. Social acceptability was identified as a major factor governing
the adoption of supermarkets by female shoppers.
The traditional market had superiority in terms of freshness of products. The independent stores
on the other hand enhanced their attractiveness to consumers by offering in-store credit. However,
even though a majority of Libyans prefer shopping at supermarkets, large numbers still shop at
other types of grocery outlets. Overall, the Libyan case has provided interesting evidence that
enhances the existing literature. Subsequent to discussing the research findings, it was imperative to
summarise the findings in terms of the research objectives set, detail implications for marketing
theory and practices, followed by research limitations, recommendations, and suggestions for future
research, which was undertaken in the final chapter.
Page 203
188
Chapter 8 Conclusion, Implications and Limitations
8.1. Introduction
The study was conducted to investigate consumer food shopping behaviour in Libya, an emerging
market. Understanding consumers and their shopping behaviour is important for marketers to
develop their marketing strategy. In a bid to understand the issue, the study commenced with a
detailed review of the existing literature. Moreover, a classification Libyan shopper into different
segments was undertaken and similarities and differences across the segments were examined.
Empirical evidence was presented to support the findings. The results of this research have broad
implications for both researchers and marketers.
This chapter is sub-divided into five main sections. The first section presents conclusions
organised according to the research objectives. Additionally, the implications of research for the
existing literature, the limitations of the results, and the recommendations for retailers are presented
in turn. Recommendations for future research are considered in the final section of the chapter.
8.2. Summary of the Study
Libya is an emerging market that is currently attracting considerable international interest and
investment. A number of global retailers have or are planning to enter this market or increase their
investments. In addition, Libya has been facing important economic and social changes since the
end of the 1990s, the influence of which is reflected at all levels, including patterns of food
shopping behaviour. While the door for foreign investment remains open, it would be a mistake not
to recognise that the political and security outlook for the country remains uncertain and that a
number of factors will impact on the Libyan business environment, in the aftermath of the
revolution that took place in Libya in February 2011.
Even though, some of the large European retail chains (e.g. Marks & Spencer) have a
presence in Libya, especially in the capital city of Tripoli, and a large number of modern shopping
stores have emerged in recent years competing with traditional markets, there is a dearth of research
on this topic and it is yet to receive the attention it deserves. Consequently, this study was
conducted to examine consumer food shopping behaviour, filling this gap in the literature by
Page 204
189
investigating the specific situation in Libya. This study makes an important contribution to the
existing literature by extending our knowledge of food shopping behaviour to an Arab and North
African background.
The main aim of this study was to explore consumer food shopping behaviour in Libya. To
this end, first of all a review of the literature was conducted to better understand and develop the
research’s empirical framework. The construction of shopper typologies is a well-established stream
of research in retailing with many studies investigating retail patronage behaviour using a variety of
bases, such as retail attribute importance, shopping motivations, attitudes toward shopping,
shopping frequency, and store loyalty. The literature review paid particular attention to studies
conducted in Arabic-speaking societies as well as key studies related to the topic in the hand.
Overall, “modern” retail formats such as supermarkets and hypermarkets have multiplied
rapidly worldwide. As food retail markets in developed countries become saturated, attention has
turned to emerging economies as a possible source of growth. There are two theories in the
literature that are relevant. One is that consumers will switch to modern formats in developing
countries while the other argues that traditional formats such as wet markets will retain an
advantage. Both have evidence supporting their view. Attracting the consumer is the final goal for
both of them. Urbanisation, an increase in income, and foreign direct investment are the main
driving forces for the continued spread of supermarkets whereas the ability to respond more
effectively to consumer needs particularly in fresh food is the main reason behind the survival of
wet markets.
Based on the review of the literature and the qualitative research results, specific objectives
were identified. These objectives were as follows:
1. To explore the key determinants of consumer’s patronage of the three main retail formats in
Libya, namely traditional markets, modern supermarkets, and independent stores.
2. To identify the factors that influence consumer food shopping behaviour in Libya on the
basis of food shopping motives, values and decision-making styles.
Page 205
190
3. To classify the consumers to segments, identifying the membership of each group on the
basis of food shopping motives, values and decision-making styles and, profiling the
characteristics (demographic, behaviour) of each cluster.
4. To identify whether there are differences between respondents in terms of patronage of
supermarkets, traditional markets, and independent stores in terms of demographic
characteristics and the identified image dimensions.
5. To identify the determinants of variations in expenditure across particular product categories
(fresh fruit and vegetables, fresh meat, fresh fish, packaged food, and beverages).
To achieve the objectives of this project, a number of research questions were answered. The
key questions were as follows:
1. What are the main factors that influence retail outlet choice in Libya?
2. What are the shopping motivations, values and decision making styles that drive
consumers’ patterns of food shopping?
3. What are the consumer segments that could be developed on the basis of food shopping
motives, values and decision-making styles?
4. Do consumers differ in terms of patronage of supermarkets, traditional markets, and
independent stores across their demographic characteristics and the identified image
dimensions?
5. How do consumers differ in their expenditure across selected product categories?
In the light of the research objectives set, the research design was formulated. Survey work
incorporated some of the psychological scales used in Jamal et al.’s (2006) study whereas scales for
store attributes were derived largely from (Gorton et al., 2011). However, some additional items
were included, based on the qualitative findings relating to gender roles and social acceptability.
This empirical study has attempted to shed light on consumer food shopping behaviour in
Libya with a view to expanding the body of knowledge in this research area by using both
qualitative and quantitative methods. Given limited previous research, data sources, and information
Page 206
191
on consumer food shopping behaviour in Libya, qualitative in-depth interviews were conducted
initially. Data collection proceeded in two rounds. In the first phase, interviews were conducted face
to face in Tripoli in summer 2010. Following analysis of the first wave of interviews a set of
theoretical gaps were identified, principally relating to social acceptability and the role of food
shopping as a leisure activity. These issues informed the second stage of interviewing.
The qualitative research revealed that interviewees overall welcome the introduction of
supermarkets to Libya. Some households still frequently use other outlets, mostly their
neighbourhood grocer in emergency circumstances, and traditional markets to buy fresh produce.
Interview evidence from Libya indicated that for some females, supermarkets offer a more socially
acceptable and safer shopping environment compared to traditional food markets. In this regard,
traditional culture rather than constraining the spread of supermarkets may facilitate the process.
However, the social acceptability of women shopping in traditional food markets varies between
cities and families. In some families, the male head of the household remains the exclusive food
shopper even if females are responsible for food preparation in the home. More commonly,
shopping for food was also one of the household tasks undertaken by females.
Patterns of food shopping in Libya, as in the rest of the Arab world, cannot therefore be
understood without recourse to a discussion of gender. For females in full-time employment, food
shopping is largely regarded as another household chore. For those working part-time or not
employed, food shopping may take on greater significance as a leisure activity and opportunity to
escape the domestic environment. The ability to escape the latter, however, depends on family and
local rules governing social acceptability.
Considering shopping patterns, all but one interviewee had a regular system for shopping
and most make shopping decisions jointly with others. A number of factors affect the choice of
where to shop (variety, quality, and price of products; cleanliness; service quality; special offers;
convenience of location). These factors are common to other countries and the only factor identified
in the international literature, which is currently irrelevant for Libya, is facilities to pay by card.
With respect to typologies of shoppers, three clear categories were identified: budget
conscious, independent perfectionist, and socializing shoppers. The shopper types identified in the
qualitative research are broadly consistent with those identified in the quantitative research. The
Page 207
192
budget conscious segment is consistent with value shoppers. The independent perfectionist shopper
segment is consistent with quality-oriented shoppers. Socializing shoppers are consistent with
enthusiastic shoppers. In addition, the findings revealed that, even though, the interviewees
reported that supermarkets offered more advantages than traditional markets, traditional markets
retained an advantage in fresh vegetables and fruits.
To further meet the objectives of the research, a structured questionnaire was designed for use
in fieldwork. The initial development of the questionnaire was based on the qualitative research
findings plus previous research. In order to clarify the questions and the appropriateness of the
proposed scales both pretesting and a pilot study were carried out. After some minor modifications
in the light of the pilot study were made, the questionnaire was distributed relying on self-
administered questionnaires using a drop-off/ pick-up method. Data collection was completed in
summer 2011. Data were analysed to answer the research questions. To this end several software
packages were utilised (NVivo8&10, SPSS 19, Stata 11, and Amos 16).
Regarding quantitative research, the results of the data analysis were presented to understand
Libyan food shoppers’ behavioural patterns by using relevant statistical methods. Descriptive
statistics were used to present the socio-economic characteristics of the sample and detail
respondents' food shopping behaviour. The study indicated that the majority of households used
supermarkets, traditional markets as well as independent stores. The frequency of use varies by
format. Monthly shopping trips were most common for supermarkets, weekly for traditional
markets and daily for independent stores. With respect to time spent on a shopping trip, in general,
respondents tend to spend more time in supermarkets compared to the other retail outlets that were
considered in the study. In terms of shopping decision, a little more than half of the respondents
make decisions about what to buy in conjunction with others. Moreover, the results showed that
there were some significant differences between females and males regarding shopping behaviour.
For instance, with respect to shopping alone or with others, there was a significant difference
between females and males for both traditional markets and supermarkets.
8.3. Conclusions related to the Research Questions
This section presents conclusions relating to each of the research objectives:
To explore the key determinants of consumers’ patronage of the three main retail formats in
Libya (traditional markets, modern supermarkets, and independent stores) and to answer the first
Page 208
193
research question “What are the main factors that influence store choice in Libya?”, the importance
of attributes affecting the choice of retail format and how well supermarkets, traditional markets
and independent stores performed on these measures was assessed. The findings revealed that the
Libyan shopper attached the greatest importance to food safety, quality of products, quality of
service, speed of service, and variety of products. Importance also was given to car parking, price of
products, atmosphere, and special offers. Other features such as freshness of products, location, and
in-store credit were classified as of reasonable importance. The lowest ratings of importance were
allocated to cleanliness of the place, and personal safety. The ratings for cleanliness might be due to
the nature of Libyan society, which considers hygiene as a foregone conclusion because of the
strong linkage to Islamic religion and culture of the community. The ratings for personal safety may
reflect that almost all participants tend to undertake food shopping with others, engendering feelings
of being comfortable and safe. Also, the findings indicated that supermarkets performed the best on
all items, except freshness of products and in-store credit (traditional markets performed the best on
freshness of products and independent stores for in-store credit). Only for one attribute (car parking)
were differences in the mean scores between supermarkets, traditional markets and independent
stores not statistically significant.
To identify the factors that influence consumer food shopping behaviour in Libya and answer
the second research question, “what are the shopping motivations, shopping value and decision
making styles that drive consumers to shop for food?”, first of all, the analysis of data continued
with the use of confirmatory (CFA) analysis. The CFA results indicated that Jamal et al.’s (2006)
model was inappropriate for the Libyan case. As a result, Exploratory factor analysis (EFA) was
applied identifying 12 factors: hedonism, confused by choice, social shopping, value shopping,
brand loyalty, brand conscious, high quality seeking, gratification seeking, gender roles and
shopping task, role playing, impulsiveness and social acceptance. The factors generated provided
the basis for cluster analysis, in order to investigate the existence of distinctive groups of shoppers
(retail segments) based on shopping motivations.
Classifying and profiling Libyan shoppers in terms of food shopping behaviour, and
demographic characteristics led to an answer to the third research question, “What are the consumer
segments that could be developed on the basis of food shopping motives, values and decision-
making styles?”. For this task cluster analysis was used. Six groups of shoppers were identified:
disloyal, traditionalist, quality-oriented, value, enthusiastic, and apathetic shoppers. Also, the study
Page 209
194
provided insights into the segments’ socio-economic characteristics and shopping behaviour by
using crosstabs and ANOVA tests. Some of the clusters were similar to groups identified in
previous studies but other cases significant contrasts were apparent. For instance, traditionalist
shoppers in Libya have very different motivations than those labelled “traditionalist” in Western
studies of shopping behaviour. Furthermore, the “value shoppers” cluster was very similar to the
“economic shopper” segment that was reported in previous research in terms of the emphasis on
value. In Libya, as in many other countries, a group of apathetic shoppers were discerned.
To identify whether there are differences between respondents in terms of patronage of
supermarkets, traditional markets, and independent stores in terms of demographic characteristics
and the identified image dimensions, econometric analysis was used. The econometric models were
estimated to interpret the possible relationships between retail outlet attributes, the socio-economic
characteristics of the respondents and shopping behaviour. Probit models identified determinants of
shoppers' frequency of visits to supermarkets, traditional markets and independent stores. The
majority of socio-economic characteristics except gender, age and marital status were poor
predictors of variations in the percentage spent on considered product categories by different retail
formats. The hypotheses were tested for significance and the results indicated that females were
significantly less likely than males to visit traditional markets. Supermarket visitors were more
concerned about social acceptability whereas, patrons of traditional markets placed greater
emphasis on freshness. Heavy users of independent stores placed greater emphasis on in-store
credit. The greatest dissimilarities between ratings for the three formats were apparent for social
acceptance, personal safety, cleanliness of place, food safety and, in-store credit. Significant
differences in convenience of location, atmosphere, quality of service, variety of products, and
quality of products were also apparent.
To identify the determinants of variations in expenditure across particular product categories
(fresh fruit and vegetables, fresh meat, fresh fish, packaged food, and beverages) econometric
analysis was used again. Specifically, this involved the application of Tobit models where the
dependent variable was the percentage of household spending for a particular product category
(fresh fruit and vegetables, fresh meat, fresh fish, packaged food and beverages) accounted by
supermarkets, independent stores and traditional markets. The findings revealed that females spent
proportionally more in supermarkets and less in traditional markets.
Page 210
195
The most important factors that influenced Libyan shoppers’ patronage behaviour regardless
of store type was food safety, following by quality of products, quality of service, speed of service,
and variety of products. The analysis of retail attributes and the weightings given to the three
formats by consumers revealed that supermarket, overall, outperformed traditional markets and
independent stores on most salient attributes. Social acceptability was identified as a major factor
governing the adoption of supermarkets by female shoppers. Traditional markets retained
superiority in terms of freshness of products. The independent stores on the other hand improved
their attractiveness to consumers by offering in-store credit. However, even though a majority of the
sample indicated a preference for shopping at supermarkets, large numbers still shop at other types
of grocery outlets.
8.4. Contributions of the Study
The research makes several important contributions to the literature. First, the current study is one
of the first empirical studies undertaken on consumers in an Eastern culture (i.e. Libya) while most
other studies reported in the literature have been conducted in a Western context. According to the
researcher’s knowledge, there has been no previous empirical study that explored consumer food
shopping behaviour in the context of Libyan culture. In other words, this study contributes to the
current literature as one of the first empirical attempts to investigate the dynamics of shopping
behaviour patterns of consumers in a radically different cultural background (Libya).
The second chief contribution of the study is the definition of a typology of shoppers on the
basis of shopping motivations, shopping value, and decision-making styles. This is significant
because most of the existing literature has sought to develop a typology of shoppers based either on
shopping motives, shopping values or on decision-making styles. The research combined the three
perspectives together to seek a better understanding of the reasons consumers go shopping.
Moreover, a new dimension was added by this thesis to theories of retail format adoption as it
captured the impact of gender roles, in changing the consumer behaviour, and explaining patterns of
food shopping and their impact on the grocery market. The results of this study are valuable
because of the linkages between gender and important aspects of shopping behaviour and patronage
of particular retail outlets. Gender often plays a pivotal role in influencing consumer food shopping
activities in Libya.
Page 211
196
Finally, the study contributes from the development of an updated set of attribute and
motivation measures incorporating gender roles and shopping tasks and social acceptance scales.
Previous work utilises a wide range of measures that were developed over 20 years ago (Ganesh et
al., 2007). The findings of the qualitative research highlighted the themes of social acceptability and
gender roles, given their salience in the Libyan case and their lack of prominence in the literature
relating to the adoption of supermarkets in developing economies. The development of a new scale
in the present project has proved to be a reliable (a high alpha coefficient of 0.70 was obtained for
the scale). The reliability tests performed on the two components of the scale, gender roles and
shopping tasks and social acceptance, also showed a high level of internal consistency with alpha
coefficients of 0.82 and 0.69 respectively.
In conclusion, the findings of the study develop understanding of food shopping behaviour in
an emerging economy, taking the Libyan case as an example. Several contributions to the current
body of knowledge about consumer food shopping behaviour in a non-Western context were
highlighted, linked to the research results. The findings can also be used to focus recommendations
for food retailers on improving their role and image, as identified by consumers, in an attempt to
increase satisfaction amongst consumers.
8.5. Implications for Practitioners
Based on the results of the study a number of implications can be suggested of relevance for
practitioners in the food retail sector. The results are useful for companies that are already operating
in or are debating whether to enter the Libyan market.
1. The results revealed that Libyans shop not only for functional reasons, but also want it
to be a social and pleasant activity. Retailers, especially supermarkets, should pay
attention to providing incidental benefits to shoppers which enhance the social
experience, such as restaurants with separate suites for families only, a place for
prayer and so on, to encourage consumers to spend time shopping in an enjoyable
manner.
2. In Libya the introduction of supermarkets has been welcomed by consumers and any
switch to them, and away from traditional markets and independent stores, has been
consumer led. In general, supermarkets are regarded as “a good thing”. Critical to their
success in Libya will be the extent to which they offer a more female friendly and
Page 212
197
safer shopping environment than traditional outlets. Given the role gender relations
play in retail patronage, supermarkets must be female friendly. In an Arab context, this
could be achieved by incorporating, for instance, good lighting, wide aisles, and an
open layout, and providing a high level of security, for example by increasing the
presence and visibility of security officials, better lighting and installing emergency
phones.
3. Regarding the importance of attributes affecting the choice of retail formats and how
well supermarkets, traditional markets and independent stores performed on some
measures, the results revealed that Libyan shoppers placed the greatest emphasis on
food safety, quality of products, quality of service, speed of service, and variety of
products in descending order. Marketers must take food safety seriously by paying
very strict attention to health risk issues. Despite the fact that this apprehension of
health risks may have subsided after the war, it is likely to remain salient.
4. Supermarket managers should concentrate their commercial operations on products for
which the supermarkets have a competitive advantage (e.g non-perishable products).
To improve the offering of fresh fruits and vegetables they could mimic the layout of
the best markets, demonstrating the freshness of such goods.
5. Taking into the account that about 90% of Libyan people are Muslim, and there is a
considerable demand for halal food, international modern formats should offer fresh
halal products to cater for its Muslim customers and launch a halal own brand in
response to demand from the Muslim community.
6. Marketing depends on effective segmentation, targeting and positioning. The profiling
of distinct shopper segments is therefore useful for retail managers. The research
identified six segments, each of which has its own characteristics. Profiling each
segment in terms of attractiveness factors, demographics, and shopping behaviour
helps retail managers in constructing marketing communication strategies and
designing appealing store environments, meeting the needs of particular segments.
For example, traditionalist shoppers showed the highest inclination on gender roles. This
segment considered food shopping traditionally as a task for male household members, and
regarded food shopping as an inappropriate task for females alone or with other women. The
Page 213
198
development of supermarkets in meeting the needs of this segment must think about ways that
would help increase their confidence and sense of comfort when shopping. This could be achieved,
for example, by making the shopping environment safer, for instance with the use of surveillance
cameras and security officers in shopping areas. These steps are likely to be effective in making this
segment more comfortable and confident in allowing women to shop for food as dependent or
independent consumers as long as there is a degree of cultural change, appreciating that what counts
as socially acceptable may shift over time as the study showed.
Enthusiastic shoppers scored the highest on the hedonic shopping factor and thus they are
likely to respond positively as mentioned earlier, to innovative shopping places that accommodate
different stores, restaurants and leisure facilities in order to spend their time as pleasantly as
possible. Value shoppers placed a lot of emphasis on seeking value, looking for discounts, bargains,
and sales. Marketing communication messages with typical sales promotional offers and price
reductions are likely to be very effective for this segment.
8.6. Limitations of the Study
As with any empirical work, there are several limitations associated with the present study.
Specifically, this study was conducted during a period of civil unrest that had a direct effect on the
research and its results that should be interpreted with several unavoidable limitations in mind.
Firstly, due to the uprising, the study area was changed from the capital city Tripoli to the
second city Benghazi. The method of sampling was also affected. These changes have their own
effect on the results of the study to some degree. For example it is difficult to extend the results to
Libya as whole given that data collection only took place within the city of Benghazi only. Also, a
non-probabilistic sampling method was used in both qualitative and quantitative research. Therefore
biases in the selection of respondents may have occurred. Thus, it might not be possible to
generalize the results to the whole population in Libya. Moreover, the sample in the main part of the
study (quantitative research) included only Libyan citizens since the majority of non-Libyan people
dispersed to their countries of origin because of the war.
In addition, the sample size was relatively small compared to some similar studies. The small
sample size hampers the ability to generalise to the overall population and reduces the power of
statistical tests in the data analysis (Herche and Balasubramanian, 1994). A larger sample size,
particularly covering other cities in Libya, would have been useful to assess the stability and
Page 214
199
dependability of the findings (Mokhlis, 2006). However, given the civil unrest during the period of
data collection this was infeasible and it is important to remember that “if statistical tests are
significant, one can consider the sample size as adequate” (Herche and Balasubramanian, 1994,
p.71). Despite the shortcomings in sample size, this study has been able to give a detailed picture of
consumer food shopping behaviour and retail patronage.
As a final limitation, the scope of the present study was strictly limited to only one product
category (i.e. shopping for food). The choice of the product context might limit the range of
shopping motives and that could be perceived as important. Motives and their salience may vary for
non-food items such as cleaning products, and personal care products. As a result of this, the
conclusions drawn from this study are focused on food retail behaviour only. However, despite
these limitations, the results of this study offer useful findings and provide directions for future
research that should be addressed.
8.7. Recommendations for Future Research
The results of this study present a solid basis for further interesting research.
1. Additional work is required to verify the relationships between the choice of retail
environment and motivating factors such as convenience, food safety, shopper comfort,
and social acceptability in different Libyan cities. This would provide the basis for
explaining diversity in consumer food shopping behaviour and how far it can be linked
to socioeconomic, geographic and cultural factors.
2. It would also be useful to document whether the growth of supermarkets in Libya is
leading to changes in diet, health and exercise, for example by increasing consumption
of processed foods. This would require panel data that tracks, amongst other variables,
retail outlet choice, food purchases and calorie consumption over time.
3. Further research could also examine food shopping behaviour within different product
categories, taking into consideration cross-cultural differences. Ackennan and Tellis
(2001, p.77) asserted that “Culture impacts not just the products consumers buy but also
consumers’ shopping and the response of retailers” .
Page 215
200
4. Research could extend the current approach to a comparison of multiple cultures that
would be interesting to see whether the shopping patterns and motivations found in this
study are mirrored elsewhere in developing countries, in the rest of Arabic world as well
as inside Libya itself for example, by considering the expatriates and native Libyan
people.
5. Similarly, it may be worthwhile to study shopping motives over time in order to be able
to take into account the dynamics of consumer behaviour and attitudinal patterns since
all shopping motives were measured at one point in time.
6. A longitudinal study would capture variations over time, such as the effect of particular
events like Ramadan. Ramadan is more than a holy month and has a deep social,
cultural, and economic impact on the daily life of Muslims (Odabasi and Argan, 2009).
The latter stated that Ramadan has to be regarded as month of shopping. Although,
different views were concluded regarding Ramadan consumption patterns in the
literature (some of them highlighted an increase in food consumption during Ramadan
whereas some others pointed to a reduction in total food consumption), the variety of
foods increases, and there are an increase in the expenditure in overall (Odabasi and
Argan, 2009). As a result, it might be interesting to investigate the underlying aspects of
Libyan consumers’ shopping patterns during this specific event, Ramadan.
8.8. Conclusion
This study explored factors affecting consumers’ food shopping behaviour in Libya as a country
whose retail environment has been dominated by traditional markets and small independent stores
for generations. This final chapter presented conclusions on the main findings of the research and its
implications for practitioners as well as the limitations of the study, before discussing suggestions
for future research. In conclusion, although the limitations provide a good starting point for
extending the research, the thesis provides the basis for understanding the nature and salience of
store attributes and shopping motives that drive consumers to shop for food in Libya.
As a closing note, it should be reiterated that because of the war conditions that were
associated with the study period and the limited scope of this study, further research is required to
validate the findings reported in this study. Until these proposals for further research come to
Page 216
201
fruition, the conclusions of the study should be taken carefully, but the study represents to date the
only rigorous and theoretically informed research on consumer food shopping behaviour in Libya.
Page 217
202
Appendix 1: Interview Guide
First round of interviews
Q1. Filter question: Do you undertake food shopping for your household?
Q2. When confronted with the words ‘supermarket’ and ‘market’, what comes to mind?
Q3. How often do you shop for food? Why is this?
Q4. How often do you usually visit? Why is this?
Supermarket
Traditional market
Q5. Are decisions about the food you buy in a supermarket usually made by:
You alone
Jointly with others
Depends on the circumstances
Q6. What factors are important in your choice of where to shop for food?
Q7. Let’s look at a set of potential factors which may influence your choice. How do supermarkets
perform on these factors compared to traditional markets?
1. Convenience of location
2. Price of products
3. Special offers
4. Assortment
5. Quality of service
6. Speed of service
7. Product quality
8. Variety of products
9. Payment by card
10. Atmosphere
11. Cleanliness
12. Food safety
Q8.Which style do you feel best describes you?
Socializing shoppers: this group likes shopping with my friends or family to socialize.
Page 218
203
Disloyal shopper: this group is primarily concerned with enjoyment. Brand and store loyalty
are not important for him.
Independent perfectionist shoppers, who look for quality, brand loyalty, confusion and
utilitarian shopping
Escapist shoppers: this group go to shop when they are in down mood; to feeling better and
looking for hedonic shopping.
Apathetic shoppers: this category does not care about all store attribute dimensions,
particularly the store quality dimension.
Budget conscious shoppers: looking for value, gratification, brand loyalty and brand
conscious with preparing a list of the requirements according to limited budget.
Q9. Gender:
Male
Female
Q10. The average income in Libya is 500 LYD. How does your income compare with this?
Below
Around the same
Above
Additional questions for stage 2 interviews
Q11. Social acceptability
A. In Libya, is it socially acceptable for a woman to go shopping in a market alone? With other
women? Why?
B. In Libya, is it socially acceptable for a woman to go shopping
in a supermarket alone? With other women? Why?
C. For a woman, is there any difference between markets and supermarkets in terms of social
acceptability? Why? Why not?
Q12. Food shopping as a leisure activity
Do you regard food shopping as a leisure activity?
Is food shopping a way of getting out of the home?
Is food shopping a form of entertainment?
Page 219
204
Appendix 2: English Version of Questionnaire
Survey of Consumer Food Shopping Behaviour
I am conducting a survey on consumer shopping behaviour and would be very grateful if you would
spare some time to answer some questions.
The information will remain anonymous and confidential. We are interested in your opinions.
Screening Question
You should recruit:
Do you undertake any food shopping?
Yes Continue with Question 1
No Please, give it to the person who undertakes food shopping in your family.
Page 220
205
1.1. How often do you usually visit a supermarket to purchase food?
Tick one box
Everyday Two to three times a month
Two to three times a week Once a month
Once a week Never
1.2. How often do you usually visit a traditional market to purchase food?
Tick one box
Everyday Two to three times a month
Two to three times a week Once a month
Once a week Never
1.3. How often do you usually visit an independent store to purchase food?
Tick one box
Everyday Two to three times a month
Two to three times a week Once a month
Once a week Never
1.4. How much time do you spend food shopping in a typical week?
Tick one box
Outlet Less than an hour 1-2 hours 2-3 hours 3 hours or more
Supermarket
Traditional market
Independent store
Section 1: Food Shopping Behaviour
Page 221
206
1.5. Are decisions about the food you buy usually made by you alone or jointly with others
in the household?
You Jointly with others Depends on circumstances
1.6. On average, how much do you spend on food shopping per month?
Outlets Less than 300
LYD per month
300-500 LYD
per month
More than 500
LYD per month
Supermarket
Traditional market
Independent store
1.7. When visiting a supermarket, do you usually go alone or with others?
Always with others Always alone
Usually with others Usually alone
No clear pattern Never shop at supermarkets
1.8. When visiting a traditional food market, do you usually go along or with others?
Always with others Always alone
Usually with others Usually alone
No clear pattern Never shop at supermarkets
1.9. Please complete the table below on what proportion of the total amount you spend in an
average month on different food categories you buy from ‘Traditional markets’, ‘supermarkets’
and ‘independent stores? (Note: percentages should add to 100%)
Items Traditional
market
Supermarket Independent
store
Total
Fresh Fruit and Vegetables % % % 100%
Fresh Meat % % % 100%
Fresh fish % % % 100%
Packaged foods % % % 100%
Beverages % % % 100%
Page 222
207
In this section I am going to show you some statements that may influence in your decision and
identify the main reasons to do food shopping. I want you to choose the best one describes your
attitude do so.
Tick one box for each statement
Statements Strongly
disagree
Moderately
disagree
Slightly
disagree
Neutral Slightly
agree
Moderately
agree
Strongly
agree
When I am in down mood, I go
shopping to make me feel better
To me shopping is a way to
relieve stress
I go shopping when I want to
treat myself to something special
I like shopping with my friends or
family to socialize
I enjoy socializing with others
when I shop
Shopping with others is a
bonding experience
I only go shopping during sales
I enjoy looking for discounts
when I shop
I enjoy hunting for bargains when
I shop
I like shopping for others
because when they feel good, I
feel good
I enjoy shopping for my family
and friends
I find shopping stimulating
While shopping I can normally
forget my problems
While shopping at a store, I feel
disappointed if I have to go to a
different store to complete my
shopping
While shopping, I try to
accomplish just what I want to as
soon as possible
Section 2: Food Shopping Motivations and Decision Making
Styles
Page 223
208
Statements Strongly
disagree
Moderately
disagree
Slightly
disagree
Neutral Slightly
agree
Moderately
agree
Strongly
agree
While shopping I try to
find just the items that I
am looking for
I enjoy shopping more than
most people do
I love to go shopping when I
can find time
I always compare prices I am cautious in trying new
products
I enjoy exploring alternative
stores
I like to try new products and
brands for fun
I like to buy the same brand Getting very good quality is
important to me
When it comes to purchasing
products, I try to get the very
best or perfect choice
In general I usually try to buy
the best overall quality
I make a special effort to
choose the very best
quality products
I really do not give my
purchase much thought or
care
My standards and
expectations for the
products that I buy are
high
A product does not have
to be perfect, or the best
to satisfy me
The well-known national
brands are best for me
The more expensive
brands are usually my
choice
Page 224
209
Statements Strongly
disagree
Moderately
disagree
Slightly
disagree
Neutral Slightly
agree
Moderately
agree
Strongly
agree
A product does not have to
be perfect, or the best to
satisfy me
The well-known national
brands are best for me
The more expensive brands
are usually my choice
The higher the price of the
product, the better is its
quality
Nice department and
specialty stores offer me the
best products
I prefer buying the best-
selling brands
The most advertised brands
are usually the very best
choices
Shopping is not a pleasant
activity for me
Going shopping is one of
the most enjoyable
activities for me
Shopping in many stores
wastes my time
I enjoy shopping just for the
fun of it
I make shopping trips fast I should plan my shopping
trip more carefully than I do
I am impulsive when
purchasing
Often I make careless
purchases I later wish I had
not
I take the time to shop
carefully for the best buys
I carefully watch how
much I spend
There are so many brands
to choose that often I feel
confused
The more I learn about
products, the harder it
seems to choose the best
All the information I get on
different products confuses
me
Page 225
210
Statements Strongly
disagree
Moderately
disagree
Slightly
disagree
Neutral Slightly
agree
Moderately
agree
Strongly
agree
I have favourite brands I
buy over and over
Once I find a product or
brand I like, I stick with it
I go to the same store each
time I shop
Investigating a new store is
generally a waste of time
Food shopping is a way of
getting out of the house for
women
It is acceptable for a woman
to go shopping in a
traditional market alone or
with other women
It is acceptable for a woman
to go shopping in a super -
market alone or with other
women
A woman’s role is in the
home
Food shopping is a task for
men only
Page 226
211
3.1. How important of the following factors in the choice of where you buy food?
Tick one box
Factors Not
Important
Minor
Importance
Moderate
Importance
Major
Importance
Most
Important
a. Location/convenience
b. Price of product
c. Special offers
d. Assortment
e. Quality of service
f. Speed of service
g. Qquality of product
h. Variety of product
i. Freshness of produce
j. Atmosphere
k. Cleanliness of place
l. food safety
m. Personal safety
n. In – store credit
o. Car parking facilities
p. Social acceptability
q. Other ___________
Section 3: Retail Choice
Page 227
212
3.2. For traditional food markets in your area, please rate them on the following factors?
Tick one box
Factors I have no
experience
Very
poor
Poor Average Good Very
good
a. Location/Convenience
b. Price of product
c. Special offers
d. Assortment
e. Quality of service
f. Speed of service
g. Quality of product
h. Variety of product
i. Freshness of produce
j. Atmosphere
k. Cleanliness of place
l. Food safety
m. Personal safety
n. In – store credit
o. Car parking facilities
p. Social acceptability
q. Other _______________
Page 228
213
3.3. For the supermarkets in your area, please rate them on the following factors?
Tick one box
Factors I have no
experience
Very poor Poor Average Good Very
good
a. Location/convenience
b. Price of product
c. Special offers
d. Assortment
e. Quality of service
f. Speed of service
g. Quality of product
h. Variety of product
i. Freshness of produce
j. Atmosphere
k. Cleanliness of place
l. Food safety
m. Personal safety
n. In – store credit
o. Car parking facilities
p. Social acceptability
q. Other_________________
Page 229
214
3.4. For the independent store in your area, please rate them on the following factors?
Tick one box
Factors I have no
experience
Very poor Poor Average Good Very
good
a. Location/convenience
b. Price of product
c. Special offers
d. Assortment
e. Quality of service
f. Speed of service
g. Quality of product
h. Variety of product
i. Freshness of produce
j. Atmosphere
k. Cleanliness of place
l. Food safety
m. Personal safety
n. In – store credit
o. Car parking facilities
p. Social acceptability
q. Other ______________
Page 230
215
4.1. Gender
Tick one box
4.2. Marital statue
Tick one box
4.3. Age
Tick one box
From 15 to 24 From 40 to 54
From 25 to 39 Aged 55 and over
4.4. No. of members, including yourself, of the household
Tick one box
4.5. Approximately, what is the combined income of your household (per month)?
Tick one box
LYD
LYD
Section 4: Personal Details
Page 231
216
4.6. Highest level of education completed
Tick one box
-graduate
4.7. Nationality
Tick one box
4.8. Have you ever lived abroad?
Tick one box
Yes
4.9. Have you always lived in
Tick one box
Benghazi
Moved to Benghazi from another
part of Libya
abroad
4.10. Occupation
Please write down your occupation: ____________________
4.11. Where is your house located?
Please write the name of your region:____________________
4.12. Has the revolution of February 17, had any impact on your food shopping behaviour? If the
answer is yes, please write in more detail is the nature of this effect?
Thank You for Your Time
Page 232
217
Appendix 3: Arabic Version of Questionnaire
لشراء المواد الغذائية دراسة لسلوك المستهلك الليبى فى التسوق
:قم الاستبانه التاريخ : ر
اود اجراء دراسة استقصائية عن سلوك المستهلك فى التسوق فى ليبيا . حسن تعاونكم واعطاءكم بعضا من وقتكم لاكمال هذه
الاستبانة سيكون له عظيم الاثر و الامتنان.
من فضلك يجب الاجابة على السؤال التالى كخطوة اولى:
د الغذائية؟ هل انت الشخص المسئول عن التسوق لشراء الموا
.نعم فضلا اذهب الى السؤال الاول
.لا فضلا مررها الى الشخص المسئول عن التسوق للمواد الغذائية فى العائلة
Page 233
218
كم مرة عادة تزور السوبرماركت لشراء المواد الغذائية ؟ .1.1
كل يوم مرتين الى ثلاث مرات في الشهر
مرتين الى ثلاث مرات في الاسبوع مرة واحدة بالشهر
بوع مرة واحدة بالاس أبدا
كم مرة عادة تزور السوق التقليدى لشراء المواد الغذائية ؟ .1.1
كل يوم مرتين الى ثلاث مرات في الشهر
مرتين الى ثلاث مرات في الاسبوع مرة واحدة بالشهر
مرة واحدة بالاسبوع أبدا
كم مرة عادة تزور المحلات الخاصة لشراء المواد الغذائية ؟ .1.1
كل يوم مرتين الى ثلاث مرات في الشهر
مرتين الى ثلاث مرات في الاسبوع مرة واحدة بالشهر
مرة واحدة بالاسبوع أبدا
كم من الوقت تقضي فى رحلة التسوق لشراء المواد الغذائية؟ .1.1
مكان الشراء اقل من ساعة 1-1 ساعة 1-1 ساعة اكثر 1من ساعات
السوبرماركت
السوق التقليدى
متجر خاص
هل تقرر ما يجب شرائه من مواد غذائية بمفردك او بمشاركة مع اخرين ؟ .1.1
انت بمشاركة الأخرين يتوقف على الظروف
(: السلوك التسوقى1القسم )
Page 234
219
من النقود على شراء الطعام في الشهر؟ فى المتوسط كم تصرف .1.1
د.ل فى الشهر 155اكثر من د.ل فى 155-155ما يعادل
الشهر
د.ل فى الشهر 155 مكان الشراء اقل من
السوبرماركت
السوق التقليدى
متجر خاص
هل تذهب للسوبرماركت وحدك او برفقة اخرين؟ .1.1
دائما لوحدى دائما مع الاخرين
عادة لوحدى عادة مع الاخرين
لا اتسوق فى السوبر ماركت ابدا لا يوجد روتين معين
هل تذهب للسوق التقليدى وحدك او برفقة اخرين؟ .1.1
دائما مع الاخرين دائما لوحدى
عادة لوحدي عادة مع الاخرين
لا اتسوق فى السوبر ماركت ابدا لا يوجد روتين معين
شهر كل في الغذائية المنتجات على تصرفه ما معدل حول المئوية النسبة بكتابة ادناه الجدول اكمل سمحت لو .1.1
الخاص؟ او المتجر التقليدي السوق او السوبرماركت من شرائك عند
222ملاحظة المجموع الافقى يجب أن يكون
البيان السوبرماركت السوق التقليدي المتجر خاص الاجمالي
خضروات وفواكه طازجة % % % 100%
لحم طازج % % % 100%
سمك طازج % % % 100%
اغذية معلبة % % % 100%
مشروبات % % % 100%
Page 235
220
فى هذا القسم هناك بعض الاقترحات التى ممكن ان تصف او تشرح بعض الدوافع الرئيسية للتسوق. من فضلك اختار ما يناسبك
او تشعر انه يصف حالتك.
اجابة واحده لكل بيان: اختر .1.1
موافقه
قليلة
موافقة
متوسطه
موافق
بشدة
موافق غير محايد
قليلا
غير موافق
متوسط
غير موافق
بشدة
البيان
اذهب للتسوق عندما
يكون مزاجي متعكر
لأخفف عن نفسي
التسوق بالنسبة لي
يعتبر طريقة للتخفيف
التوتر
اذهب للتسوق عندما
اريد ان ادلل نفسى
بشئ خاص
احب التسوق مع
عائلتي او اصدقائي
لكى اتواصل معهم
احب التواصل مع
الاخرين عندما اتسوق
التسوق مع الاخرين هو
تجربة للتواصل
اتسوق فقط اثناء
التخفيضات
احب ان ابحث عن
اثناء الخصومات
التسوق
أنا احب اصطياد
الصفقات الرابحة عندما
اتسوق
احب ان اتسوق من اجل
الاخرين لانه اذا شعروا
بالسعادة اشعر انا ايضا
بالسعادة
احب التسوق من أجل
عائلتى و اصدقائي
ارى التسوق امر محفز
اتمكن عادة عند التسوق
من نسيان مشاكلى
اثناء التسوق فى متجر
ما اشعر بالاحباط اذا
اضطررت للذهاب الى
متجر اخر لشراء باقى
احتياجاتى
(: دوافع التسوق1القسم )
Page 236
221
موافقه
قليلة
موافقة
متوسطه
موافق
بشدة
غير موافق محايد
قليلا
غير موافق
متوسط
غير موافق
بشدة
البيان
احاول اثناء تسوقي
تحقيق ما اريد فى
اسرع وقت ممكن
اثناء تسوقي احاول ان
اجد الاشياء التى ابحث
عنها فقط
استمتع بالتسوق اكثر
من معظم الناس
احب التسوق عندما
اجد وقت لذلك
انا اقارن الاسعار دائما
انا حذر فى تجربة
المنتجات جديدة
انا احب ان استكشف
متاجر بديلة اخرى
احب تجربة منتجات
وماركات جديدة من
باب الاستمتاع
احب ان شترى نفس
الماركة
الحصول على جودة
ممتازة امر مهم بالنسبة
لي
عندما يتعلق الأمر
بشراء المنتجات،
أحاول الحصول على
أفضل خيار
احاول بشكل عام ان
اشتري المنتجات ذات
الجودة العالية
أنا بذل جهد خاص
لاختيار افضل نوعية
من المنتجات
انا حقيقة لا اعير
اهتماما كبيرا بما
اشتريه
شروطي و معاييري لما
اشتريه من منتجات
عالية جدا
المنتج لا يجب أن يكون
مثاليا، أوهو الافضل
حتى يرضنى
الماركات المعروفة
العالمية هى الافضل
بالنسبة لي
الماركات الأغلى هي
اختياري عادة
Page 237
222
موافقه
قليلة
موافقة
متوسطه
موافق
بشدة
غير موافق محايد
قليلا
غير موافق
متوسط
غير موافق
بشدة
البيان
كلما كان السعر اعلى
كما كان المنتج ذو جودة
افضل
الاقسام الانيقة والمحلات
المتخصصة توفر افضل
المنتجات عادة
ان اشتري اكثرافضل
الماركات مبيعا
العلامات التجارية
المعلن عنها اكثر وعادة
ما تكون أفضل
الخيارات
التسوق امر غير ممتع
بالنسبة لي
الذهاب للتسوق من
اكثر النشاطات امتاعا
بالنسبة لي
التسوق في محلات
كثيرة يضيع وقتي
احب التسوق لمجرد
الاستمتاع به
اتسوق بسرعة
يجب علي ان اخطط
لرحلة تسوقي اكثر مما
افعل
انا متسرع اثناء الشراء
احيانا اشتري حاجيات
غير مهمة اتمنى اني لم
لاحقااشتريها
اخذ وقتي فى التسوق
لأفضل الشرائات
اراقب بحذر ما اصرفه
عند تسوقى
هناك الكثير من
الماركات واحيانا احتار
فى الاختيار بينهم
احيانا هناك صعوبة فى
اختيار فى اى محل
اتسوق
اعرف اكثر عنكلما
المنتجات كلما تزداد
حيرتي في ايهم اشتري
اتلقاها المعلومات التي
عن المنتجات المختلفة
تحيرني
Page 238
223
موافقه
قليلة
موافقة
متوسطه
موافق
بشدة
غير موافق محايد
قليلا
غير موافق
متوسط
غير موافق
بشدة
البيان
لدى ماركات مفضلة
واشتريها مرارا و
تكرارا
عندما اجد منتج او
ماركة تعجبني فانى
اتعلق بها
اذهب لنفس المحل فى
كل مرة
التحقق من محل اخرهو
مضيعة للوقت عادة
الذهاب لشراء الغذاء
هو وسيلة للخروج من
للنساءالمنزل بالنسبة
مقبولا اجتماعيا للمراه
ان تذهب للتسوق فى
الاسواق التقليديه وحدها
او مع غيرها من النساء
مقبولا اجتماعيا للمراه
ان تدهب للتسوق فى
السوبر ماركت وحدها
او مع غيرها من النساء
دور المراة فى البيت
فقط
Page 239
224
ما هى مدى أهمية العوامل التاليه فى اختيار مكان التسوق بالنسبة لك؟ .1.1
ضع علامه فى مربع واحد
العوامل غير مهم اهميه ثانويه اهميه معتدله اهميه كبرى الاكتر اهمية
الموقع
سعر المنتج
عروض خاصة
تشكيلات
المعاملة
سرعه الخدمة
جودة المنتج
تنوع المنتج
نضارة المنتج
الشعور العام
نظافه المكان
سلامه الغداء
سلامه الشخصية
الشراء بالدين
موقف السيارات
القبول الاجتماعى
اخرى.......
:(1القسم )
Page 240
225
كيف تقييم السوبرماركت فى منطقتك وفقا العوامل التاليه: .1.1
ضع علامه فى مربع واحد
العوامل لدى خبرة ليس سئ للغايه سئ متوسط جيد جيد جدا
الموقع
سعر المنتج
عرض خاص
تشكيلة
المعاملة
سرعه الخدمة
جودة المنتج
تنوع المنتج
نضارة المنتج
الشعور العام
نظافه المكان
سلامه الغداء
سلامه شخصية
الشراء بالدين
موقف السيارات
القبول الاجتماعى
اخرى.......
Page 241
226
كيف تقييم الاسواق الشعبية فى منطقتك وفقا العوامل التاليه: .1.1
ضع العلامه فى مربع واحد
لدى ليس سئ للغايه سئ متوسط جيد جيد جدا
خبرة
العوامل
الموقع
سعر المنتج
عرض خاص
تشكيلة
المعاملة
سرعه الخدمة
جودة المنتج
تنوع المنتج
نضارة المنتج
الشعور العام
نظافه المكان
سلامه الغداء
سلامه شخصية
الشراء بالدين
موقف السيارات
القبول الاجتماعى
اخرى.......
Page 242
227
كيف تقييم المتجر الخاص فى منطقتك وفقا العوامل التاليه: .1.1
ضع العلامه فى مربع واحد
العوامل لدى خبرة ليس سئ للغايه سئ متوسط جيد جيد جدا
الموقع
سعر المنتج
عرض خاص
تشكيلة
المعاملة
سرعه الخدمة
جودة المنتج
تنوع المنتج
نضارة المنتج
الشعور العام
نظافه المكان
سلامه الغداء
سلامه شخصية
الشراء بالدين
موقف السيارات
القبول الاجتماعى
اخرى.......
Page 243
228
الجنس: .1.1
ضع علامه على مربع واحد
ذكر انثى
الحاله الاجتماعية: .1.1
ضع علامه على مربع واحد
اعزب متزوج
مطلق ارمل
العمر: .1.1
ضع علامه فى مربع واحد
2 0الى 15من 40الى 02من
93الى 25من و ما فوق 44من
فى المنزل من ضمنهم انت: عدد الافراد .1.1
ضع علامه على مربع واحد
واحد ثلاثة خمسة
اثنان اربعة ستة واكثر
:تقريبا ماهو مجموع دخل اسرتك شهريا .1.1
علامه على مربع واحد ضع
دينار ليبي 422اقل من دينار ليبيى 422حوالى
دينار ليبى 422اكتر من افضل ان لا اقول
بيانات شخصية :1القسم
Page 244
229
اعلى مستوى من التعليم الدى اكملته: .1.1
ضع علامه على مربع واحد
شهادةلا تعليم ابتدائى
تعليم اعدادى تعليم ثانوى
جامعى دراسات عليا
الجنسيه: .1.1
ضع علامه على مربع واحد
ليبيى غير ليبيى
هل عشت فى الخارج؟ .1.1
ضع علامه على مربع واحد
نعم لا
هل عشت دائما فى ؟ .1.1
ضع علامه على مربع واحد
انتقلت من الخارج
بنغازى انتقلت الى بنغازى من منطقه اخرى فى ليبيا
المهنة : .11.1
الرجاء كتابه المهنة .................................................
اين يقع منزلك؟ .11.1
الرجاء كتابه اسم المنطقه .........................
بنوع الكتابة يرجى بنعم الاجابة كانت إذا الغذائية؟ المواد لشراء التسوق فى كسلوك على تأثير اى فبراير ٧١ لثورة كان هل .11.1
التأثير؟ هذا كان كيف التفصيل من
جزيلا لك على وقتك شكرا
Page 245
230
Appendix 4: NVivo Out Put
Page 248
233
List of References
Abdel-Aty, M.A. (2001) 'Using ordered probit modeling to study the effect of ATIS on transit
ridership', Transportation Research Part C: Emerging Technologies, 9(4), pp. 265-277.
Abdussalam, S.M. (2006) Privatization and its future implications in Libya : a case study of the
Libyan National Textile Company. PhD thesis. Northumbria University.
Abidar, A. and Laytimi, A. (2005) National Agriculture Policy - Libya (FP6-2002-SSP-1).
Abokaresh, M.S.M., Kamaruddin, B.H. and Mohd, R. (2013) Privatization and Efficiency: Once
Upon a Time in Libya.
Aboujdiryha, A.A.A. (2011) Privatisation processes and firm performance : the Libyan industrial
sector. PhD thesis. University of Twente.
Ackermana, D. and Tellisb, G. (2001) 'Can culture affect prices? A cross-cultural study of shopping
and retail prices', Journal of Retailing, 77(1), pp. 57-82.
Afahama, G. and AboShah, T. (2007) 'Economic Analytic Study for the Policy of Supporting
Supply Merchandise in Libya Economy', The Third Conference of Sustainable Agricultural
Development. Fayoum University, Faculty of Agricultural 12- 14 November, 2007. pp. 95-110.
Ahmad, T. and Härdle, W. (2008) 'Statistics e-learning platforms evaluation: case study', SFB 649
Discussion Papers.
Ahmed, H. (2012) Retail Foods Update 2012 (SA1215). United States.
Ahmed, Z.U., Ghingold, M. and Dahari, Z. (2007) 'Malaysian shopping mall behavior: an
exploratory study', Asia Pacific Journal of Marketing and Logistics, 19(4), pp. 331-348.
Ahtola, O.T. (1975) 'The Vector Model of Preferences: An Alternative to the Fishbein Model',
Journal of Marketing Research, 12(1), pp. 52-59.
Al-Hengari, S., El-Bousiffi, M. and El-Moudir, W. (2007) 'Libyan Petroleum Institute experience in
evaluation ofdesalination plants in the Libyan oil sector', Desalination, 206(1-3), pp. 633-652.
Al-Otaibi, O.S. (1988) Shopping Centre Development and Consumer Behaviour in Kuwait. PhD
thesis. University of Exeter.
Al-Saffy, T. (2009) Saudi Arabia "Retail Food Sector" (SA9026). United States.
Al-Sudairy, M.A. and Tang, N.K.H. (2000) 'Information technology in Saudi Arabia’s supermarket
chains', Journal:International Journal of Retail & Distribution Management, 28(8), pp. 341-356.
Page 249
234
Alexander, N. (1990) 'Retailers and International Markets: Motives for Expansion', International
Marketing Review, 7(4), pp. 75-85.
Alhemoud, A.M. (2008) 'Shopping Behavior Of Supermarket Consumers In Kuwait', Journal of
Business & Economics Research, 6(3), pp. 47- 58.
Amine, A. and Lazzaoui, N. (2011) 'Shoppers’ reactions to modern food retailing systems in an
emerging country: The case of Morocco', International Journal of Retail & Distribution
Management, 39( 8), pp. 562 - 581.
Anic, I.-D., Rajh, E. and Bevanda, A. (2012) 'Decision-making styles of young consumers in
Bosnia and Herzegovina', Young Consumers: Insight and Ideas for Responsible Marketers, 13(1),
pp. 86-98.
Anić, I.-D. and Vouk, R. (2005) 'Exploring the Relationships Between Store Patronage Motives and
Purchasing Outcomes for Major Shopping Trips in the Croatian Grocery Retailing', Ekonomski
pregled, 56(9), pp. 634-657.
Antipolis, S. (2002) ‘Indicators for sustainable development in the Mediterranean coastal regions:
National report of Libya’. UNEP, MAPand Plan Bleu. [Online]. Available at:
http://www.planbleu.org/publications/idd_cotiers_a.pdf (Accessed: 17/04/2013).
Arnold, M.J. and Reynolds, K.E. (2003) 'Hedonic shopping motivations', Journal of Retailing,
79(2), pp. 77-95.
Arnold, S.J., Oum, T.H. and Tigert, D.J. (1983) 'Determinant Attributes in Retail Patronage:
Seasonal, Temporal, Regional, and International Comparisons', Journal of Marketing Research
(JMR), 20(2), pp. 149-157.
Attir , M.O. and Al-Azzabi, K. (2004) The Libyan jamahiriya: country, people, social and political
development.In Doing Business with Libya (ed. by J. Wallace & W. Wilkinson). Kogan, London.
Audsley, B., Niazi, A. and Bakhiet, E.F. (2011) Rapid Market Assessment: Eastern Libya, World
Food Programme. Available at: http://www.wfp.org/content/libya-rapid-markets-assessment-
eastern-libya-august-2011 (Accessed: 07/03/2012).
Babbie, R. (2011) The Basics of Social Research. Cengage Learning.
Babin, B.J., Darden, W.R. and Griffin, M. (1994) 'Work and/or Fun: Measuring Hedonic and
Utilitarian Shopping Value', Journal of Consumer Research, 20(4), pp. 644-656.
Babin, B.J., Hardesty, D.M. and Suter, T.A. (2003) 'Color and shopping intentions: The intervening
effect of price fairness and perceived affect', Journal of Business Research, 56(7), pp. 541-551.
Bai, J. (2006) Consumers' preferences for dairy products in alternative food store formats in China.
PhD thesis. Washington State University.
Page 250
235
Baker, M.J. (2001) 'Selecting a Research Methodology', The Marketing Review, 1(3), pp. 373-397.
Baltas, G. and Papastathopoulou, P. (2003) 'Shopper characteristics, product and store choice
criteria: a survey in the Greek grocery sector', International Journal of Retail & Distribution
Management, 31(10), pp. 498 - 507.
Bass, F.M. and Talarzyk, W.W. (1972) 'An Attitude Model for the Study of Brand Preference',
Journal of Marketing Research (JMR), 9(1), pp. 93-96.
Bernard, H.R. (2006) Research Methods in Anthropology: Qualitative and Quantitative Approaches
4th edn. Lanham: AltaMira Press.
Bierens, H.J. (2004) 'The Tobit model', Econometrica, 26, pp. 24-36.
Boedeker, M. (1995) 'New-type and traditional shoppers: a comparison of two major consumer
groups', International Journal of Retail & Distribution Management, 23(3), pp. 17- 26.
Bourlakis, M.A., Ness., M.R. and Priporas, C.-V. (2006) 'The Greek food shopper: Segmentation on
the basis of attitudes to store features', EuroMed Journal of Business, 1(2), pp. 29-49.
Bryman, A. and Bell, E. (2007) Business Research Methods. 2nd edn. Oxford: Oxford University
Press.
Burns, D.J. and Warren, H.B. (1995) 'Need for uniqueness: shopping mall preference and choice
activity', International Journal of Retail & Distribution Management, 23(12), pp. 4- 12.
Burton, D. (2000) Research training for social scientists: a handbook for postgraduate researchers.
SAGE.
Business Monitor International (2012) Libya Food and Drink Report Q1 2013 [Online]. Available
at: http://www.reportlinker.com/p01041448/Libya-Food-and-Drink-Report-Q1.html (Accessed:
07/04/2013).
Cadilhon, J.J., Moustier, P., Poole, N.D., Tam, P.T.G., Fearne, A.P., Montpellier, C. and Vietnam,
H.C.M. (2006) 'Traditional vs. modern food systems? Insights from vegetable supply chains to Ho
Chi Minh City (Vietnam)', Development Policy Review, 24(1), pp. 31-49.
Carpenter, J.M. and Moore, M. (2006) 'Consumer demographics, store attributes, and retail format
choice in the US grocery market', International Journal of Retail & Distribution Management,
34(6), pp. 434- 452.
Carson, D., Gilmore, A., Perry, C. and Gronhaug, K. (2001) Qualitative Marketing Research.
SAGE Publications.
Chamber of Commerce and Industry (1999) Economic directory. Tripoil.
Page 251
236
Chamber of Commerce and Industry (2013) Statistical number of companies and individuals
affiliated with the Chamber of Commerce until 31/March/2013.
Collis, J. and Hussey, R. (2009) Business Research: A Practical Guide for Undergraduate and
Postgraduate Students. Palgrave Macmillan.
Coyne, I.T. (1997) 'Sampling in qualitative research. Purposeful and theoretical sampling; merging
or clear boundaries?', Journal of Advanced Nursing, 26, pp. 623–630.
Creswell, J.W. (2003) Research Design: Qualitative, Quantitative, and Mixed Methods Approaches.
2nd edn. SAGE Publications.
D'Haese, M., Van den Berg, M. and Speelman, S. (2008) 'A Country-wide Study of Consumer
Choice for an Emerging Supermarket Sector: A Case Study of Nicaragua', Development Policy
Review, 26(5), pp. 603-615.
Darden, W.R. (1980) 'A patronage model of consumer behaviour', in Stampfl, D.W. and Hirschman,
E. (eds.) Competitive structure in retail markets: the department store perspective. illustrated edn.
New York: American Marketing Association.
Darden, W.R. and Ashton, D. (1974) 'Psychographic Profiles of Patronage Preference Groups',
Journal of Retailing, 50(4), pp. 99- 112.
Darden, W.R. and Reynolds, F.D. (1971) 'Shopping Orientations and Product Usage Rates', Journal
of Marketing Research, 8(4), pp. 505-508.
Davies, G. and Rands, T. (1992) 'The strategic use of space by retailers: a perspective from
operations management', International Journal of Logistics Management, The, 3(2), pp. 63-76.
Dawoud, S. (2005) An analysis of Food Consumtion Patterns in Egypt. PhD thesis. der Christian-
Albrechts-Universität zu Kiel.
Dekeba, A. (2001) Basics of Marketing Research Methods. Globusz Publishing.
Denscombe, M. (2010) The Good Research Guide: For Small-scale Social Research Projects.
McGraw-Hill Education.
Douglas, D. (2003) 'Grounded Theories of Management: A Methodological Review', Management
Research News, 26(5), pp. 44-52.
Douglas, S.P. (1976) 'Cross-National Comparisons and Consumer Stereotypes: A Case Study of
Working and Non-Working Wives in the U.S. and France', Journal of Consumer Research, 3(1),
pp. 12-20.
Page 252
237
Doyle, P. and Fenwick, I. (1974) 'How Store Image Affects Shopping Habits in Grocery Chains',
Journal of Retailing, 50(4), p. 39.
Dries, L., Reardon, T. and Swinnen, J.F.M. (2004) 'The rapid rise of supermarkets in Central and
Eastern Europe: implications for the agrifood sector and rural development', Development Policy
Review, 22(5), pp. 525-556.
Easterby-Smith, M., Thorpe, R. and Jackson, P. (2012) Management Research. SAGE Publications.
Efron, B. (1979) 'Bootstrap Methods: Another Look at the Jackknife', The Annals of Statistics, 7(1),
pp. 1-26.
Efron, B. and Tibshirani, R. (1993) An introduction to the bootstrap 6th edn. New York: Chapman
& Hall.
El-Adly, M.I. (2007) 'Shopping malls attractiveness: a segmentation approach', International
Journal of Retail & Distribution Management, 35( 11), pp. 936-950.
El-Droubi, A.A.S. (2004) Food shopping behaviour in the state of Qatar. PhD thesis. University of
Lincolnshire and Humberside.
Elbendak, O.E. (2008) Urban Transformation and Social Change in a Libyan City: An
Anthropological Study of Tripoli. PhD thesis. National University of Ireland.
EmporikiBank (2012) Country Trading Profiles. Available at:
http://www.emporikitrade.com/uk/countries-trading-profiles/libya/market-access (Accessed:
08/03/2012).
Engel, J.F., Blackwell, R.D. and Miniard, P.W. (1995) Consumer Behaviour 6th edn. Chicago
Dryden Press
Everitt, B.S., Landau, S., Leese, M. and Stahl, D.D. (2011) Cluster Analysis. 5th edn. Oxford John
Wiley and Sonc,Ltd.
Food and Agriculture Organisation (2011) 'Emergency Food Security Assessment'.
Food and Agriculture Organization (2011) Food Security in Libya – An Overview.
Food and Agriculture Organization (2013) Food Balance Sheets. Available at:
http://faostat.fao.org/site/368/DesktopDefault.aspx?PageID=368#ancor (Accessed: 12/04/2013).
Fox, E.J., Montgomery, A.L. and Lodish, L.M. (2004) 'Consumer Shopping and Spending Across
Retail Format', The Journal of Business, 77(S2), pp. S25-S60.
Page 253
238
Frankfort-Nachmias, C. and Nachmias, D. (2007) Research Methods in the Social Sciences. Worth
Publishers.
Ganesh, J., Reynolds, K. and Luckett, M. (2007) 'Retail patronage behavior and shopper typologies:
a replication and extension using a multi-format, multi-method approach', Journal of the Academy
of Marketing Science, 35(3), pp. 369-381.
Ganesh, J., Reynolds, K.E., Luckett, M. and Pomirleanu, N. (2010) 'Online Shopper Motivations,
and e-Store Attributes: An Examination of Online Patronage Behavior and Shopper Typologies',
Journal of Retailing, 86(1), pp. 106-115.
Gaskin, J. and Oakley, T. (2010) 'Bypassing Trust in Online Purchase Decisions by Establishing
Common Ground', Human Computer Interaction, ICIS St. Louis, MO, pp. 1-13.
Gelvin, J.L. (2012) The Arab Uprisings:What Everyone Needs to Know New York, USA: Oxford
University Press.
General Authority for Information (2002) The Economic and Social Survey Tripoli- Libya.
General Authority for Information (2009) Statistic Book. Tripoli- Libya: General Authority for
Information.
General Authority for Information (2010) Statistic Book. Tripoli- Libya: General Authority for
Information.
General Authority for Information (2013) The distribution of the number of establishments and
number of employees in the internal trade activities by economic activity for the year 2009.
General Planning Council (2002) Economic and Social Indicators (1962 – 2000).Tripoli:
Department of Plans and Programs, General Planning Council. Tripoli- Libya.
Geuens, M., Brengman, M. and S’Jegers, R. (2001) 'An exploratory study on grocery shopping
motivations', European advances in consumer research, 5, pp. 135-140.
Glaser, B.G. and Strauss, A.L. (2009) The Discovery of Grounded Theory: Strategies for
Qualitative Research. Aldine Transaction.
Goldman, A. (1974) 'Growth of Large Food Stores in Developing Countries', Journal of Retailing,
50(2), pp. 50-60.
Goldman, A., Krider, R. and Ramaswami, S. (1999) 'The Persistent Competitive Advantage of
Traditional Food Retailers in Asia: Wet Markets’ Continued Dominance in Hong Kong', Journal of
Macromarketing, 19(2), pp. 126-139.
Page 254
239
Gorton, M., Sauer, J. and Supatpongkul, P. (2009) 'Investigating Thai Shopping Behaviour: Wet-
Markets, Supermarkets and Food Quality', The 83rd Annual Conference of the Agricultural
Economics Society. Dublin, 30th March to 1st April
Gorton, M., Sauer, J. and Supatpongkul, P. (2011) 'Wet Markets, Supermarkets and the 'Big Middle'
for Food Retailing in Developing Countries: Evidence from Thailand', World Development, 39(9),
pp. 1624-1637.
Griffin, M., Babin, B.J. and Modianos, D. (2000) 'Shopping values of russian consumers: the
impact of habituation in a developing economy', Journal of Retailing, 76(1), pp. 33-52.
Gutman, G.E. (2002) 'Impact of the rapid rise of supermarkets on dairy products systems in
Argentina', Development Policy Review, 20, pp. 409-427.
Hagen, J.M. (2002) 'Causes and consequences of food retailing innovation in developing countries:
Supermarkets in Vietnam', New York, USA, Cornell University, Department of Applied Economics
and Management.
Hair, J.F., Black, W.C., Babin, B.J. and Anderson, R.E. (2010) Multivariate Data Analysis: A
Global Perspective. 7th edn. USA: Pearson education.
Herche, J. and Balasubramanian, S. (1994) 'Ethnicity and shopping behavior', Journal of Shopping
Center Research, 1(1), pp. 66-80.
Hildebrandt, L. (1988) 'Store image and the prediction of performance in retailing', Journal of
Business Research, 17(1), pp. 91-100.
Hino, H. (2010) 'Antecedents of supermarket formats' adoption and usage: A study in the context of
non-western customers', Journal of Retailing and Consumer Services, 17(1), pp. 61-72.
Ho, S.C. (2005) 'Evolution versus tradition in marketing systems: The Hong Kong food-retailing
experience', Journal of Public Policy & Marketing, 24(1), pp. 90-99.
Howell, D.C. (2002) Statistical Methods for Psychology. 5th edn. London: Duxbury/Thomson
Learning.
Hu, L.t. and Bentler, P.M. (1999) 'Cutoff criteria for fit indexes in covariance structure analysis:
Conventional criteria versus new alternatives', Structural Equation Modeling: A Multidisciplinary
Journal, 6(1), pp. 1-55.
Human Development Report (2013) International Human Development Indicators. [Online].
Available at: http://hdr.undp.org/en/statistics/ (Accessed: 07/04/2013).
Humphrey, J. (2007) 'The supermarket revolution in developing countries: tidal wave or tough
competitive struggle?', Journal of Economic Geography, 7(4), pp. 433-450.
Page 255
240
Hussey, J. and Hussey, R. (1997) Business Research: A Practical Guide for Undergraduate and
Postgraduate Students. McMillan.
Hutchison, A.J., Johnston, L.H. and Breckon, J.D. (2009) 'Using QSR‐NVivo to facilitate the
development of a grounded theory project: an account of a worked example', International Journal
of Social Research Methodology, 13(4), pp. 283-302.
International Monetary Fund (2010) World Economic Outlook Database. Available at:
http://www.imf.org/external/pubs/ft/weo/2010/02/weodata/index.aspx, (Accessed: 30/03/2010).
Irani, N. and Hanzaee, K.H. (2011) 'The effects of Iranian consumers’ buying tendencies on
utilitarian and hedonic shopping value', African Journal of Business Management 5(17), pp. 7449-
7460.
Irene, A. and Kiupssy, C. (2002) 'The Rapid Rise of Supermarkets in Costa Rica: Impact on
Horticultural Markets', Development Policy Review, 20(4), pp. 473-485.
Jackman, S. (2000) 'Models for Ordered Outcomes', Political Science C, 200, pp. 1-20.
Jackson, P., del Aguila, R.P., Clarke, I., Hallsworth, A., de Kervenoael, R. and Kirkup, M. (2006)
'Retail restructuring and consumer choice 2. Understanding consumer choice at the household
level', Environment and Planning A, 38(1), pp. 47-67.
Jakpar, S., Na, A.G.S., Khin, A.J. and Myint, T. (2012) 'Examining the Product Quality Attributes
That Influences Customer Satisfaction Most When the Price Was Discounted: A Case Study in
Kuching Sarawak', International Journal of Business and Social Science, 3(23), pp. 221- 236.
Jamal, A., Davies, F., Chudry, F. and Al-Marri, M. (2006) 'Profiling consumers: A study of Qatari
consumers’ shopping motivations', Journal of Retailing and Consumer Services, 13(1), pp. 67-80.
Jantan, M. and Kamaruddin, A.R. (1999) ' Store Image and Store Choice Decision: An Investigation
of Consumer Shopping Behaviour in Malaysia', Asia Academy of Management 4(2), pp. 69-82.
Jones, M.A., Reynolds, K.E. and Arnold, M.J. (2006) 'Hedonic and utilitarian shopping value:
Investigating differential effects on retail outcomes', Journal of Business Research, 59(9), pp. 974-
981.
Juhl, H.J., Kristensen, K. and Østergaard, P. (2002) 'Customer satisfaction in European food
retailing', Journal of Retailing and Consumer Services, 9(6), pp. 327-334.
Kaur, P. and Singh, R. (2007) 'Uncovering retail shopping motives of Indian youth', Young
Consumers, 8( 2), pp. 128-138.
Kaynak, E., Kara, A., Kucukemiroglu, O. and Abraha, D. (2005) 'An Empirical Examination of the
Characteristics and Behavioral Tendencies of Swedish Consumers in Patronizing Different Retail
Stores', Journal of Euromarketing, 14(4), pp. 35 - 51.
Page 256
241
Khraim, H.S., Khraim, A.S., Al-Kaidah, F.M. and AL-Qurashi, D. (2011) 'Jordanian Consumer’s
Evaluation of Retail Store Attributes: The Influence of Consumer Religiosity', International
Journal of Marketing Studies, 3(4), pp. 105-116.
Kotler, P. (1973) 'Atmospherics as a marketing tool', Journal of retailing, 49(4), pp. 48-64.
Lee, A.S. (1991) ' Integrating Positivist And interpretive Approaches To Organizational Research',
Organization Science, 2(4), pp. 342-365.
Lesser, J.A. and Hughes, M.A. (1986) 'Towards a Typology of Shoppers', Business Horizons, 29(6),
pp. 56-62.
Libya Business News (2013) Monoprix Opens Store in Tripoli. Available at: http://www.libya-
businessnews.com/2013/03/29/monoprix-opens-store-in-tripoli/ (Accessed: 19/04/2013).
Libya Herald (2013) 'online newspaper ', Monoprix opens in Tripoli Available at:
http://www.libyaherald.com/2013/03/29/monoprix-opens-in-tripoli/ (Accessed: 22/04/2013).
Lim, K.H., Sia, C.L., Lee, M.K.O. and Benbasat, I. (2006) 'Do I Trust You Online, and If So, Will I
Buy? An Empirical Study of Two Trust-Building Strategies', Journal of Management Information
Systems, 23(2), pp. 233-266.
Lindgren, J.H. and Konopa, L.J. (1980) 'A Comparative Analysis of Multiattribute Attitude
Models', Journal of the Academy of Marketing Science, 8(4), pp. 374-389
Lindquist, J.D. (1974) 'Meaning of Image', Journal of Retailing, 50(4), pp. 29- 38.
Lumpkin, J.R., Greenberg, B.A. and Goldstucker, J.L. (1985) 'Marketplace Needs of the Elderly:
Determinant Attributes and Store Choice', Journal of Retailing, 61(2), p. 75.
Maddala, G.S. (1983) Limited-Dependent and Qualitative Variables in Econometrics. 1st edn. New
York: Cambridge University Press.
Mai, L.-W.D. (1997) Direct Marketing : An Analysis of Consumers' Characteristics and Their
Perceptions of, and Attitudes to Mail-Order Speciality Food in the UK. PhD thesis. Newcastle
University.
Malcolm, P. and Losleben, E. (2004) Libya. Benchmark Books.
Malhotra, N.K. (1983) 'A Threshold Model of Store Choice', Journal of Retailing, 59(2), pp. 3-21.
Malhotra, N.K. and Birks, D.F. (2007) Marketing research: an applied approach. Pearson
Education, Limited.
Page 257
242
Martineau, P. (1958) 'The Personality of the Retail Store', Harvard Business Review, 36(1), pp. 47-
55.
Maslow, A.H. (1970) Motivation and personality. 2nd edn. New York Harper and Row New York.
McCurley Hortman, S., Allaway, A.W., Barry Mason, J. and Rasp, J. (1990) 'Multisegment analysis
of supermarket patronage', Journal of Business Research, 21(3), pp. 209-223.
McGoldrick, P.j. (2002) Retail Marketing. 2nd edn. London McGraw-Hill
McGuire, W.J. (1974) 'Psychological motives and communication Gratification', in Blumler, J.G.
and Katz, E. (eds.) The uses of mass communication: Current perspectives on gratification
research. illustrated edn. London: Sage Publications, pp. 106–167.
Milošević, J., Žeželj, I., Gorton, M. and Barjolle, D. (2012) 'Understanding the motives for food
choice in Western Balkan Countries', Appetite, 58(1), pp. 205-214.
Minten, B., Randrianarison, L. and Swinnen, J.F.M. (2005) Supermarkets, International Trade and
Farmers in Developing Countries: Evidence from Madagascar.
Minten, B., Reardon, T. and Sutradhar, R. (2010) 'Food Prices and Modern Retail: The Case of
Delhi', World Development, 38(12), pp. 1775-1787.
Mokhlis, S. (2006) The Influence of Religion on Retail Patronge Behaviour in Malasia. PhD thesis.
University of stiring
Monroe, K.B. and Guiltinan, J.P. (1975) 'A Path-Analytic Exploration of Retail Patronage
Influences', Journal of Consumer Research, 2(1), pp. 19-28.
Moreira, J., Silva, M.J., Simões, J. and Sousa, G. (2012) 'Drivers of Marketing Innovation in
Portuguese Firms', The AMFITEATRU ECONOMIC journal, 14(31), pp. 195-206.
Mulaik, S.A. (1987) 'A Brief History of the Philosophical Foundations of Exploratory Factor
Analysis', Multivariate Behavioral Research, 22(3), pp. 267-305.
Najem, F. (2004) Tribe, Islam and state in Libya: analytical study of the roots of the Libyan tribal
society and interaction up to the Qaramanli rule (1711-1835). PhD thesis. University of
Westminster.
Ness, M., Gorton, M. and Kuznesof, S. (2002) 'The student food shopper: Segmentation on the
basis of attitudes to store features and shopping behaviour', British Food Journal, 104(7), pp. 506-
525.
Ness, M.i. (2009) Cluster analysis. Newcastle University
Page 258
243
Neuman, W.L. (2010) Social Research Methods: Qualitative and Quantitative Approaches. W.
Lawrence Neuman. Pearson.
Neven, D. and Reardon, T. (2004) 'The rise of Kenyan supermarkets and the evolution of their
horticulture product procurement systems', Development Policy Review, 22(6), pp. 669-699.
Nguyen, T.T.M., Nguyen, T.D. and Barrett, N.J. (2007) 'Emerald Article: Hedonic shopping
motivations, supermarket attributes, and shopper loyalty in transitional markets: Evidence from
Vietnam', Asia Pacific Journal of Marketing and Logistics, 19(3), pp. 227-239.
Norusis, M. (2011) 'Cluster Analysis', in IBM SPSS Statistics 19 Statistical Procedures
Companion. 1st edn. Pearson p. pp. 672.
Odabasi, Y. and Argan, M. (2009) 'Aspects of Underlying Ramadan Consumption Patterns in
Turkey', Journal of International Consumer Marketing, 21(3), pp. 203-218.
Okoye, B.C., Onyenweaku, C.E. and Ukoha, O.O. (2010) 'An Ordered Probit Model Analysis of
Transaction Costs and Market Participation by Small-Holder Cassava Farmers in South-Eastern
Nigeria', Nigerian Agricultural Journal 41(2), pp. 1-10.
Omar, O. (1999) Retail Marketing. illustrated edn. Financial Times Management, Pitman.
Othman, K.b. (1987) Food retailing in Malaysia : a study of supermarket use in peninsular
Malaysia. PhD thesis. University of Stirling.
Pachauri, M. (2002) 'Consumer Behaviour: a Literature Review', The Marketing Review, 2, pp. 319-
355.
Pallant, J. (2010) SPSS Survival Manual: A Step by Step Guide to Data Analysis Using SPSS.
McGraw-Hill Education.
Pargeter, A. (2012) State of Confusion: Alison Pargeter on visiting Colonel Qaddafi’s Libya.
Available at: http://yalebooks.wordpress.com/2012/06/12/state-of-confusion-alison-pargeter-on-
visiting-colonel-qaddafis-libya/ (Accessed: 30/04/2013).
Patton, M.Q. (1990) Qualitative Evaluation and Research Methods. SAGE Publications.
Posri, W., Shankar, B. and Chadbunchachai, S. (2006) 'Consumer Attitudes Towards and
Willingness to Pay for Pesticide Residue Limit Compliant “Safe” Vegetables in Northeast
Thailand', Journal of International Food & Agribusiness Marketing, 19(1), pp. 81-101.
Priporas, C.V.A. (2002) Store Image and Customer Satisfaction. PhD thesis. Newcastle University.
Punj, G. and Stewart, D.W. (1983) 'Cluster Analysis in Marketing Research: Review and
Suggestions for Application', Journal of Marketing Research (JMR), 20(2), pp. 134-148.
Page 259
244
Reardon, T., Barrett, C.B., Berdegué, J.A. and Swinnen, J.F.M. (2009) 'Agrifood Industry
Transformation and Small Farmers in Developing Countries', World Development, 37(11), pp.
1717-1727.
Reardon, T. and Berdegué, J.A. (2002) 'The Rapid Rise of Supermarkets in Latin America:
Challenges and Opportunities for Development', Development Policy Review, 20(4), pp. 371-388.
Reardon, T. and Berdegué, J.A. (2008) 'The retail-led transformation of agrifood systems and its
implications for development policies', Background paper prepared for the World Development
Report.
Reardon, T., Henson, S. and Berdegué, J. (2007) '‘Proactive fast-tracking’ diffusion of supermarkets
in developing countries: implications for market institutions and trade', Journal of Economic
Geography, 7(4), pp. 399-431.
Reardon, T., Timmer, C.P., Barrett, C.B. and Berdegue, J. (2003) 'Principal Paper Sessions The
Rise of Supermarkets in Developing Countries: Opportunities and Chal-lenges for Agrifood
Products Suppliers (Fred Buttel, University of Wisconsin at Madison, presiding) The Rise of
Supermarkets in Africa, Asia, and Latin', American Journal of Agricultural Economics, 85(5), pp.
1140-1146.
Reardon, T., Timmer, C.P. and Minten, B. (2012) 'Supermarket revolution in Asia and emerging
development strategies to include small farmers', Proceedings of the National Academy of Sciences,
109(31), pp. 12332-12337.
Richards, L. (1999) Using NVIVO in Qualitative Research. SAGE Publications.
Ross, M.L. (2008) 'Oil, Islam, and Women', American Political Science Review, 102(01), pp. 107-
123.
Samiee, S. (1993) 'Retailing and channel considerations in developing countries: A review and
research propositions', Journal of Business Research, 27(2), pp. 103-129.
Saunders, M.N.K., Lewis, P. and Thornhill, A. (2009) Research Methods for Business Students.
Pearson.
Seiders, K. and Costley, C.L. (1994) 'Price awareness of consumers exposed to intense retail
rivalry: a field study', Advances in Consumer Research, 21, pp. 79-79.
Seiders, K. and Tigert, D.J. (2000) 'The impact of supercenters on traditional food retailers in four
markets', International Journal of Retail & Distribution Management, 28(4/5), pp. 181- 193.
Severin, V., Louviere, J.J. and Finn, A. (2001) 'The stability of retail shopping choices over time
and across countries', Journal of Retailing, 77(2), p. 185.
Page 260
245
Shamia, A.I. (2007 ) 'Economic Policies of the Restructuing Phase (1-4)', First National
Confernce on Public Policy in Libya. University of Garyounis Benghaze.
Shernanna, H.F.S. (2012) Critical Perspectives on the Efficient Implementation of Privatisation
Policies in Libya: Assessing Financial, Economic, Legal, Administrative and Social Requirements
PhD thesis. Durham University.
Sheth, J.N. (1983) 'An integrative theory of patronage preference and behavior', in Darden, W.R.
and Lusch, R.F. (eds.) Patronage Behavior and Retail Management. illustrated edn. New York:
North-Holland, pp. 9-28.
Shim, S. and Eastlick, M.A. (1998) 'The Hierarchical Influence of Personal Values on Mall
Shopping Attitude and Behavior', Journal of Retailing, 74(1), pp. 139-160.
Silverman, D. (2010) Qualitative Research. SAGE Publications.
Sinha, P.K., Banerjee, A. and Uniyal, D.P. (2002) 'Deciding where to buy: Store choice behaviour
of Indian shoppers', Vikalpa, 27(2), pp. 13-28.
Sohail, M.S. (2008) 'Shopping Behavior and Evaluation of Store Features: Perspectives from a
Food Market in the Arabian Peninsula', Journal of International Food & Agribusiness Marketing,
20(3), pp. 5-27.
Sohail, M.S. (2013) 'A Study of Mall Shopping Behaviour and Patronage: Perspectives From An
Emerging Nation', Australian Journal of Basic and Applied Sciences, 7(1), pp. 373-382.
Solgaard, H.S. and Hansen, T. (2003) 'A hierarchical Bayes model of choice between supermarket
formats', Journal of Retailing and Consumer Services, 10(3), pp. 169-180.
Spies, K., Hesse, F. and Loesch, K. (1997) 'Store atmosphere, mood and purchasing behavior',
International Journal of Research in Marketing, 14(1), pp. 1-17.
Stone, G.P. (1954) 'City Shoppers and Urban Identification: Observations on the Social Psychology
of City Life', American Journal of Sociology, 60(1), pp. 36-45.
Swoboda, B., Berg, B., Pop, N.A. and Dabija, C. (2009) 'Consumer Perceptions of Grocery Retail
Formats in Romania: The Varying Impact of Retailer Attributes', in European Retail Research.
Springer, pp. 101-123.
Tashakkori, A. and Teddlie, C. (2009) Foundations of Mixed Methods Research: Integrating
Quantitative and Qualitative Approaches in the Social and Behavioral Sciences. illustrated edn.
London: Sage Publications.
Tauber, E.M. (1972) 'Why Do People Shop?', The Journal of Marketing, 36(4), pp. 46-49.
Page 261
246
Teijlingen, E.R.v. and Hundley, V. 35 (2001) 'The importance of pilot studies' 2001. England:
Department of Sociology, University of Surrey, pp. 1-4.
Tessier, S., Traissac, P., Bricas, N., Maire, B., Eymard-Duvernay, S., El Ati, J. and Delpeuch, F.
(2010) 'Food shopping transition: socio-economic characteristics and motivations associated with
use of supermarkets in a North African urban environment', Public Health Nutrition, 13(09), pp.
1410-1418.
Thabane, L., Ma, J., Chu, R., Cheng, J., Ismaila, A., Rios, L.P., Robson, R., Thabane, M.,
Giangregorio5, L. and Goldsmith, C.H. (2010) ' A tutorial on pilot studies: the what, why and how',
BMC Medical Research Methodology, 10(1), pp. 1-10.
The United Nations (2013) Libya: UN welcomes decision on formation of constitution-drafting
body. Available at:
http://www.un.org/apps/news/story.asp?NewsID=44084&Cr=libya#.URZ4q9prRCO (Accessed:
08/02/2013).
Theodoridis, P.K. and Chatzipanagiotou, K.C. (2009) 'Store image attributes and customer
satisfaction across different customer profiles within the supermarket sector in Greece', European
Journal of Marketing, 43(5/6), pp. 708- 734.
Tien, C.-C. (2009) 'What Is the Truth in Market Research?', Asian Journal of Management and
Humanity Sciences, 4(4), pp. 241-258.
Ting, L.W. (2009) The impact of store attributes on consumer shopping behaviour: a study of
grocery stores. MSc thesis. Monash University Australia 2003.
Tuncalp, S. and Yavas, U. (1990) 'Food shopping behavior in the Arabian Gulf region: a
comparative study', International Review of Retail, Distribution & Consumer Research, 1(1), pp.
55-70.
Uncles, M.D. and Kwok, S. (2009) 'Patterns of store patronage in urban China', Journal of Business
Research, 62(1), pp. 68-81.
United Nations Development Programme (2009) Arab Human Development Report: Challenges to
human security in the Arab countries. United Nations Development Programme, New York.
Vandewalle, D. (1998) Libya Since Independence: Oil and State-Building. I. B. Tauris, Limited.
Virdi, S.S. (2011) Malls & hypermarkets: perspectives of contemporary shopping. PhD thesis.
Punjabi University.
Wang, Z., Mao, Y. and Gale, F. (2008) 'Chinese consumer demand for food safety attributes in milk
products', Food Policy, 33(1), pp. 27-36.
Page 262
247
Weatherspoon, D.D. and Reardon, T. (2003) 'The rise of supermarkets in Africa: implications for
agrifood systems and the rural poor', Development Policy Review, 21(3), pp. 333-355.
Webber, C.B., Sobal, J. and Dollahite, J.S. (2010) 'Shopping for fruits and vegetables. Food and
retail qualities of importance to low-income households at the grocery store', Appetite, 54(2), pp.
297-303.
Weber, R. (2004) 'Editor's comments: the rhetoric of positivism versus interpretivism: a personal
view', MIS quarterly, 28(1), pp. iii-xii.
Westbrook, R.A. and Black, W.C. (1985) 'A Motivation-Based Shopper Typology', Journal of
Retailing, 61(1), pp. 78-103.
Williams, R.H., Painter, J.J. and Nicholas, H.R. (1978) 'A Policy-Oriented Typology of Grocery
Shoppers', Journal of Retailing, 54(1), p. 27.
World Bank (2006) Socialist People’s Libyan Arab Jamahiriya Country Economic Report. Social
and Economic Development Group Middle East and North Africa Region (30295-LY).
World Bank (2011) Labor Force and Wages. World Bank GenderStats. Available at:
http://web.worldbank.org/WBSITE/EXTERNAL/TOPICS/EXTGENDER/EXTANATOOLS/EXTS
TATINDDATA/EXTGENDERSTATS/0,,contentMDK:21438813~menuPK:4080948~pagePK:641
68445~piPK:64168309~theSitePK:3237336,00.html (Accessed: 19/04/2011).
Zairi, M. and Al-Rasheed, S. (2010) 'Getting in The Mind of The Customer: An Empirical Study of
Consumer Behaviour in Retailing'.
Zhou, J.X., Arnold, M.J., Pereira, A. and Yu, J. (2010) 'Chinese consumer decision-making styles:
A comparison between the coastal and inland regions', Journal of Business Research, 63(1), pp. 45-
51.