+ All Categories
Home > Documents > Consumer: Leisure & LifestyleLiveXLive Media, Inc. | LIVX ...

Consumer: Leisure & LifestyleLiveXLive Media, Inc. | LIVX ...

Date post: 18-Mar-2022
Category:
Upload: others
View: 1 times
Download: 0 times
Share this document with a friend
25
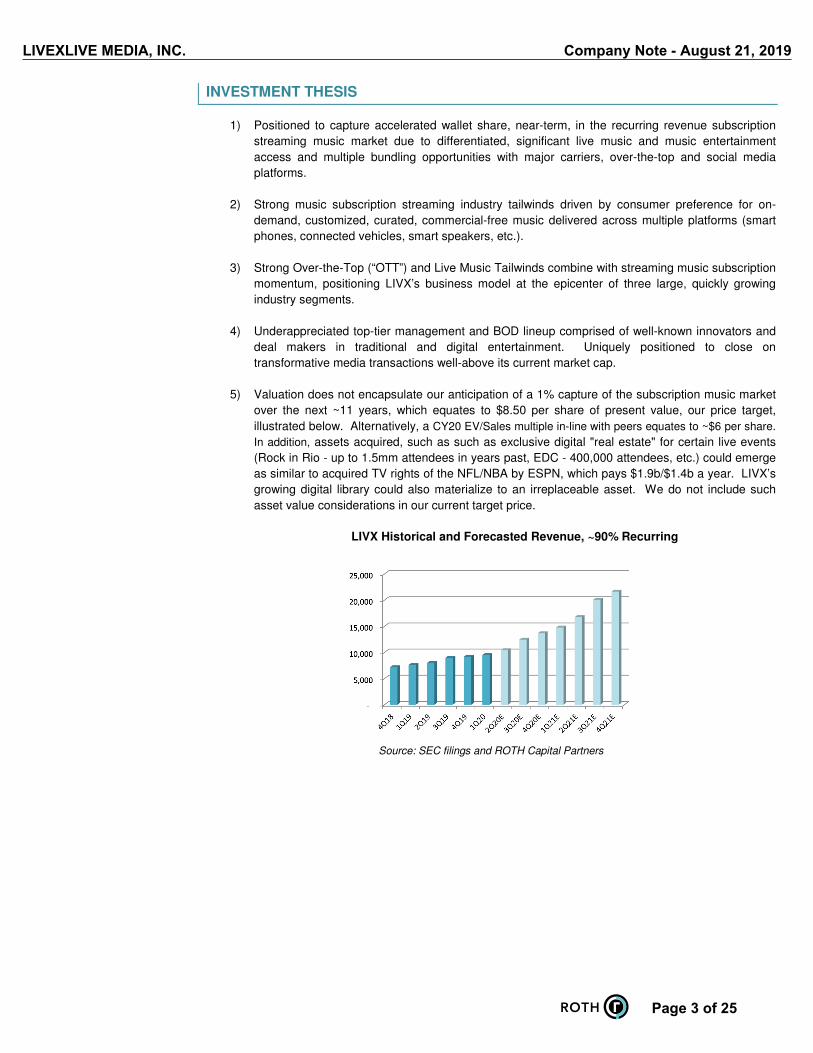
David Bain, (949) 720-7113 [email protected] Sales (800) 933-6830, Trading (800) 933-6820 COMPANY NOTE | EQUITY RESEARCH | August 21, 2019 Consumer: Leisure & Lifestyle LiveXLive Media, Inc. | LIVX - $2.72 - NASDAQ | Buy Initiation of Coverage Stock Data 52-Week Low - High $2.12 - $7.23 Shares Out. (mil) 57.60 Mkt. Cap.(mil) $156.67 3-Mo. Avg. Vol. 88,774 12-Mo.Price Target $8.50 Cash (mil) $20.0 Tot. Debt (mil) $14.7 * Cash estimate includes a $10.5mm registered direct offering, completed July 2019. EPS $ Yr Mar —2019— —2020E— —2021E— Curr Curr 1Q (0.21)A (0.21)A (0.17)E 2Q (0.20)A (0.17)E (0.17)E 3Q (0.13)A (0.17)E (0.16)E 4Q (0.19)A (0.17)E (0.16)E YEAR (0.72)A (0.72)E (0.66)E P/E NM NM NM Revenue ($ millions) Yr Mar —2019— —2020E— —2021E— Curr Curr 1Q 7.6A 9.5A 14.8E 2Q 8.0A 10.4E 16.8E 3Q 9.0A 12.4E 20.1E 4Q 9.2A 13.7E 21.6E YEAR 33.7A 46.0E 73.2E 8.00 7.00 6.00 5.00 4.00 3.00 2.00 1.00 Sep-18 Oct-18 Nov-18 Dec-18 Jan-19 Feb-19 Mar-19 Apr-19 May-19 Jun-19 Jul-19 Aug-19 2.5 2.0 1.5 1.0 0.5 0.0 Price Vol (m) LIVX One-Year Price and Volume History LIVX: Center Stage in Music’s Financial Renaissance; Initiate Buy and $8.50 PT Backboned by long-term rights to stream several of the most highly attended live music festivals and events - similar to prized media rights to the largest sporting events each year - LIVX is uniquely positioned to capture accelerated wallet share in the subscription streaming music market. Paid subscription music is the largest revenue generator of the recorded music industry, growing to 255mm current global subscribers from ~100mm in 2015 with projections for ~1.2b subscribers by 2030. The Holy Grail of Distributed Music Content. LIVX's exclusive live music streaming rights to several of the largest music events each year; major music labels/artist agreements for privileged live content and; original programing with backstage and a community driven live music lifestyle events offer first- mover positioning at the heart of three surging media segments: Digital music streaming, over-the-top streaming and U.S. live music (coalescing to a $70b U.S. market). LIVX at the Eye of the Storm of Music and Media. Driven by streaming, U.S. recorded music revenues have shown a multi-year revival with subscription streaming accounting for more than half of the $10b total. "Over-the-top," a merger between television and digital, has grown to a ~$30b industry from under $20b in 2016. "Live everything" has become must-have content, with live music growing to over $29b through concert and festival expansions and live experiences woven into the fabric of music listeners (RIAA, IFPI). Music's Answer to ESPN for Sports; LIVX Subscriber Acceleration. June quarterly paid subscribers increased ~50% to 733,00 representing 90% of total revenue, all of it recurring. Similar to ESPN for sports, LIVX has captured a significant portion of the live music market with up to 1,000 live music events through exclusive agreements with global media companies, such iHeartMedia and Insomniac, as well as exclusive major album release parties and other original music/artist oriented live programing. Further, LIVX’s partnership with Tesla (TSLA-Neutral-$225.86), pre-installing North America Tesla deliveries with LIVX subscriptions offers visible subscription growth. Valuation: Many ways to win. At just one percent share of 2030's forecasted subscription market, LIVX should generate over $160mm of EBITDA or $51mm PV discounted 11 years at 11%, inferring shares trade at 3.0x EV/ EBITDA. At 10x EV/EBITDA, shares would trade for ~$8.50, our price target. However, we also note: 1) A CY20 EV/Sales multiple in-line with peers equates to ~$6 per share; 2) Assets acquired, such as exclusive digital "real estate" for certain live events (Rock in Rio - up to 1.5mm attendees in years past, EDC - 400,000 attendees, etc.) could emerge as similar to acquired TV rights of the NFL/NBA by ESPN, which pays $1.9b/$1.4b a year and; 3) LIVX live growing digital library could also materialize as an irreplaceable asset. Important Disclosures & Regulation AC Certification(s) are located on page 24 to 25 of this report. Roth Capital Partners, LLC | 888 San Clemente Drive | Newport Beach CA 92660 | 949 720 5700 | Member FINRA/SIPC
Transcript

David Bain, (949) [email protected]

Sales (800) 933-6830, Trading (800) 933-6820

COMPANY NOTE | EQUITY RESEARCH | August 21, 2019

Consumer: Leisure & Lifestyle

LiveXLive Media, Inc. | LIVX - $2.72 - NASDAQ | BuyInitiation of Coverage

Stock Data

52-Week Low - High $2.12 - $7.23Shares Out. (mil) 57.60Mkt. Cap.(mil) $156.673-Mo. Avg. Vol. 88,77412-Mo.Price Target $8.50Cash (mil) $20.0Tot. Debt (mil) $14.7* Cash estimate includes a $10.5mm registered direct offering, completedJuly 2019.

EPS $

Yr Mar —2019— —2020E— —2021E—Curr Curr

1Q (0.21)A (0.21)A (0.17)E2Q (0.20)A (0.17)E (0.17)E3Q (0.13)A (0.17)E (0.16)E4Q (0.19)A (0.17)E (0.16)E

YEAR (0.72)A (0.72)E (0.66)EP/E NM NM NM

Revenue ($ millions)

Yr Mar —2019— —2020E— —2021E—Curr Curr

1Q 7.6A 9.5A 14.8E2Q 8.0A 10.4E 16.8E3Q 9.0A 12.4E 20.1E4Q 9.2A 13.7E 21.6E

YEAR 33.7A 46.0E 73.2E

8.007.006.005.004.003.002.001.00

Sep

-18

Oct

-18

Nov

-18

Dec

-18

Jan-

19

Feb-

19

Mar

-19

Apr

-19

May

-19

Jun-

19

Jul-1

9

Aug

-19

2.5

2.0

1.5

1.0

0.5

0.0

PriceVol (m)

LIVX One-Year Price and Volume History

LIVX: Center Stage in Music’s FinancialRenaissance; Initiate Buy and $8.50 PTBackboned by long-term rights to stream several of the most highly attendedlive music festivals and events - similar to prized media rights to the largestsporting events each year - LIVX is uniquely positioned to capture acceleratedwallet share in the subscription streaming music market. Paid subscriptionmusic is the largest revenue generator of the recorded music industry, growingto 255mm current global subscribers from ~100mm in 2015 with projectionsfor ~1.2b subscribers by 2030.

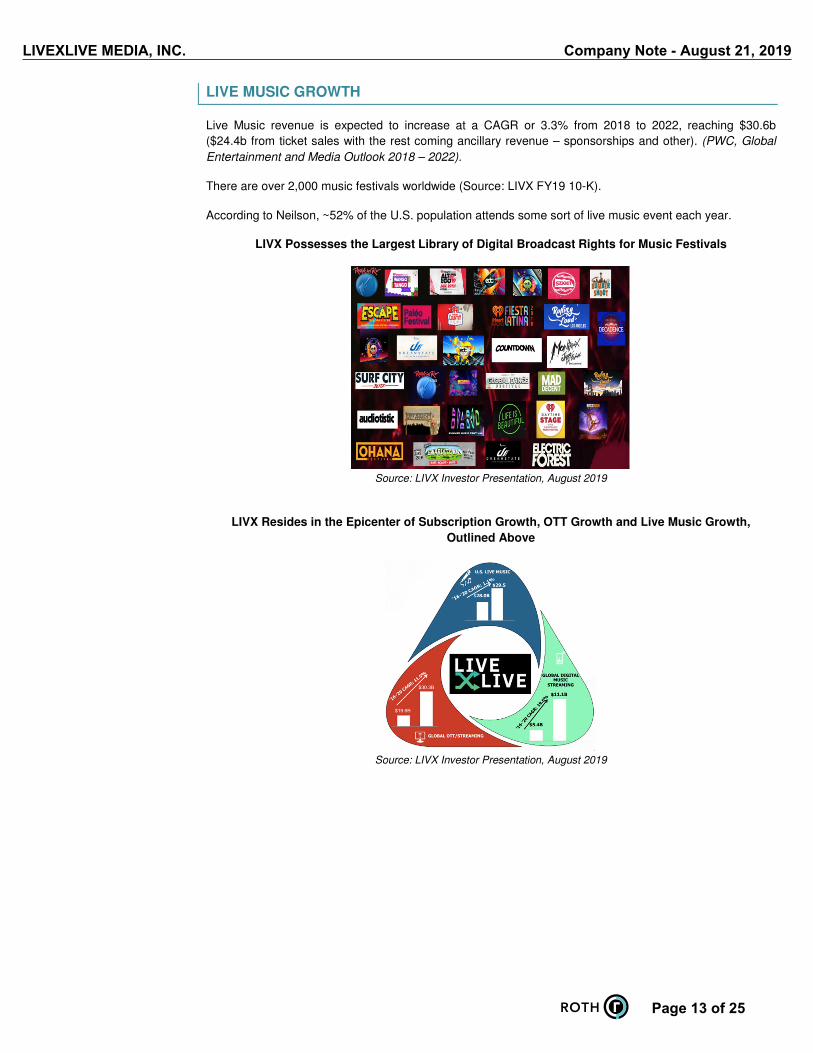
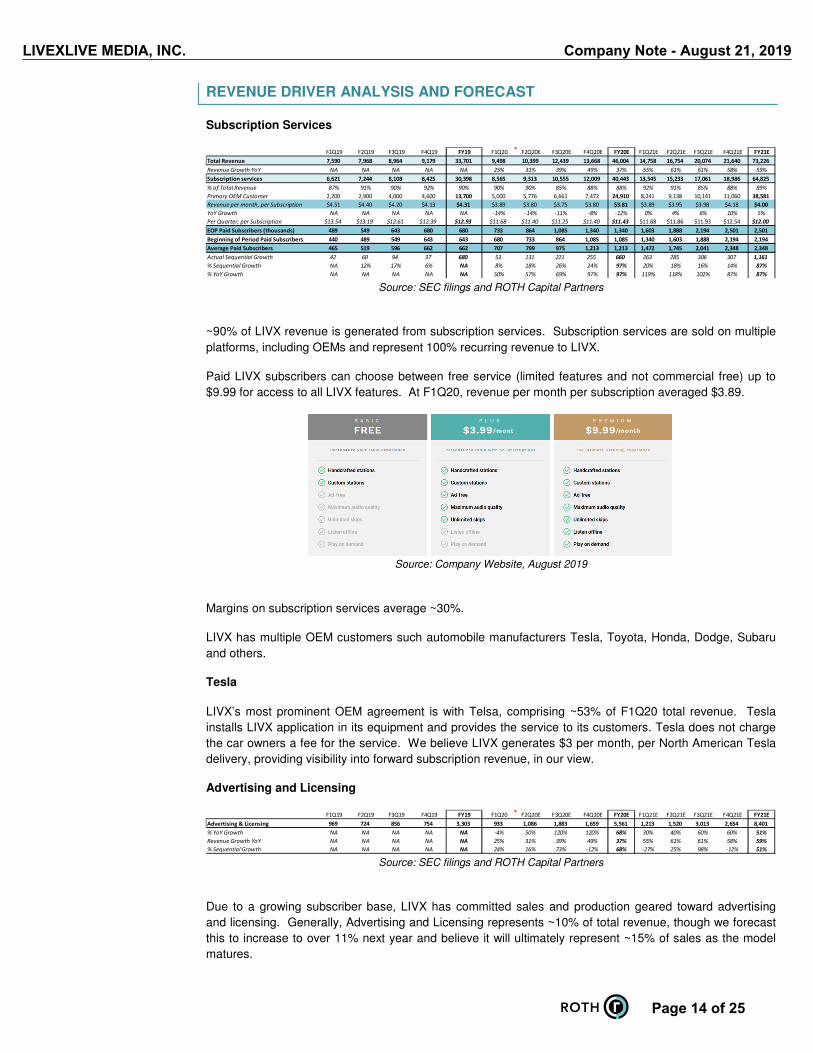
The Holy Grail of Distributed Music Content. LIVX's exclusive live musicstreaming rights to several of the largest music events each year; major musiclabels/artist agreements for privileged live content and; original programingwith backstage and a community driven live music lifestyle events offer first-mover positioning at the heart of three surging media segments: Digital musicstreaming, over-the-top streaming and U.S. live music (coalescing to a $70bU.S. market).

LIVX at the Eye of the Storm of Music and Media. Driven by streaming, U.S.recorded music revenues have shown a multi-year revival with subscriptionstreaming accounting for more than half of the $10b total. "Over-the-top," amerger between television and digital, has grown to a ~$30b industry fromunder $20b in 2016. "Live everything" has become must-have content, withlive music growing to over $29b through concert and festival expansions andlive experiences woven into the fabric of music listeners (RIAA, IFPI).

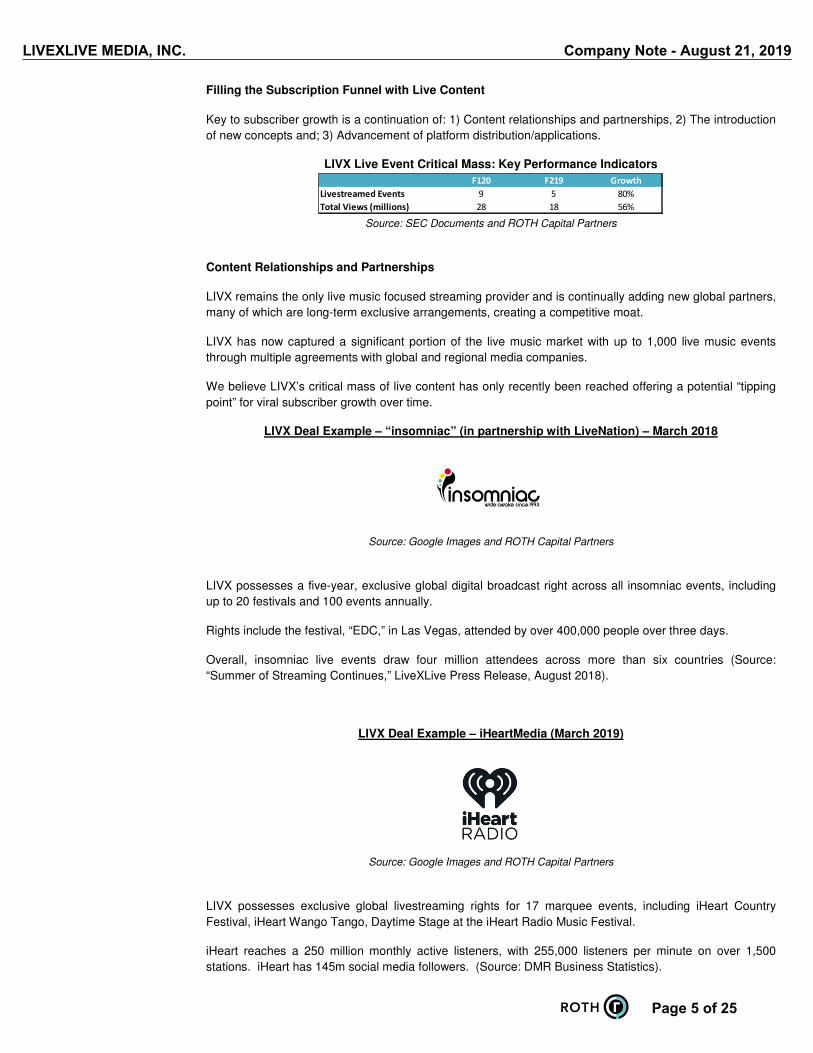
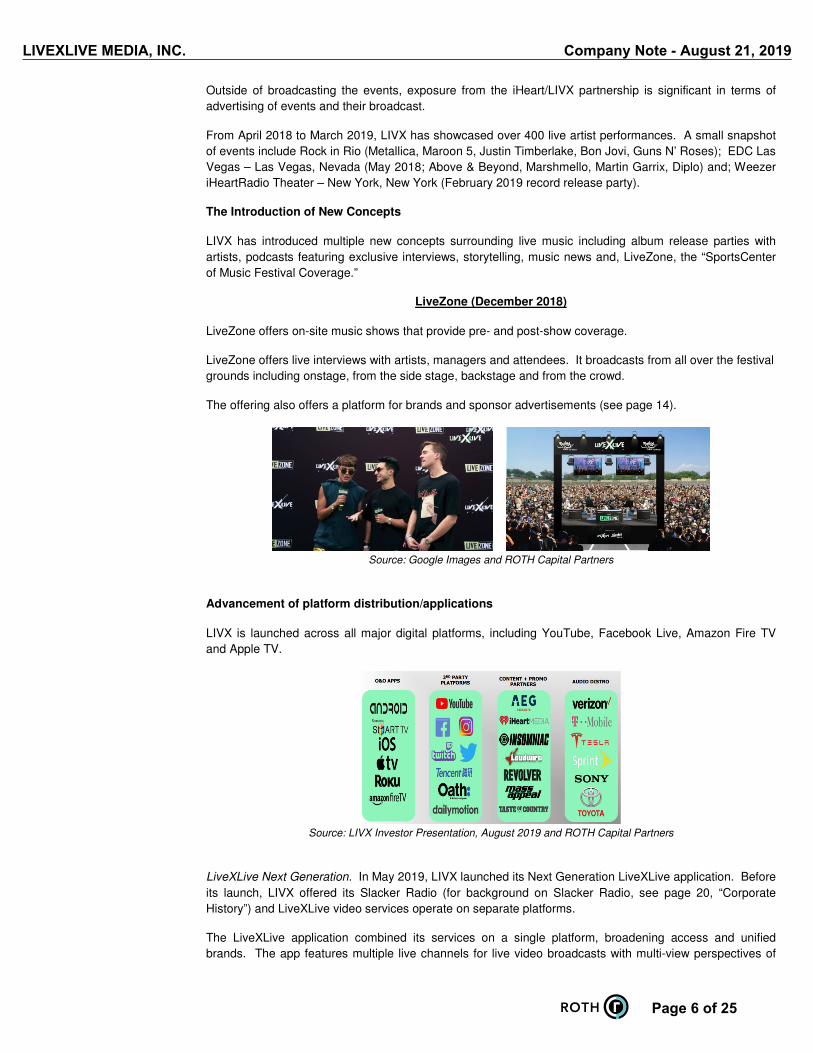
Music's Answer to ESPN for Sports; LIVX Subscriber Acceleration.June quarterly paid subscribers increased ~50% to 733,00 representing 90%of total revenue, all of it recurring. Similar to ESPN for sports, LIVX hascaptured a significant portion of the live music market with up to 1,000 livemusic events through exclusive agreements with global media companies,such iHeartMedia and Insomniac, as well as exclusive major album releaseparties and other original music/artist oriented live programing. Further, LIVX’spartnership with Tesla (TSLA-Neutral-$225.86), pre-installing North AmericaTesla deliveries with LIVX subscriptions offers visible subscription growth.

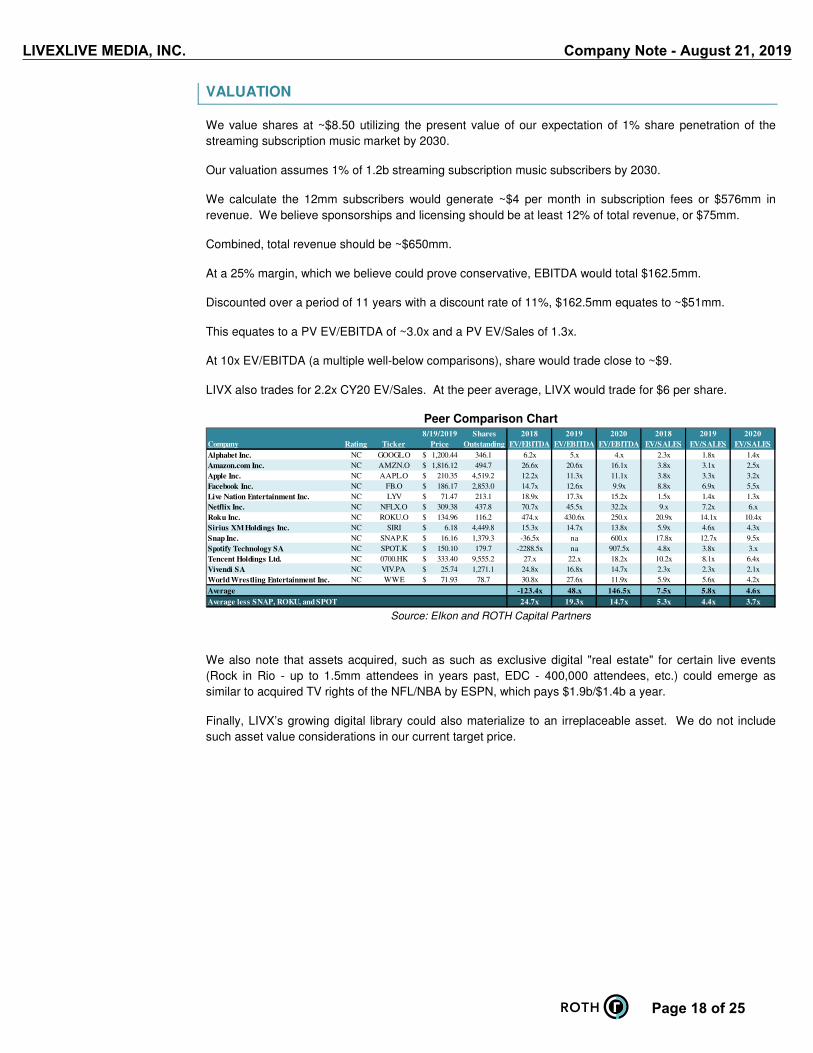
Valuation: Many ways to win. At just one percent share of 2030's forecastedsubscription market, LIVX should generate over $160mm of EBITDA or$51mm PV discounted 11 years at 11%, inferring shares trade at 3.0x EV/EBITDA. At 10x EV/EBITDA, shares would trade for ~$8.50, our price target.However, we also note: 1) A CY20 EV/Sales multiple in-line with peers equatesto ~$6 per share; 2) Assets acquired, such as exclusive digital "real estate" forcertain live events (Rock in Rio - up to 1.5mm attendees in years past, EDC -400,000 attendees, etc.) could emerge as similar to acquired TV rights of theNFL/NBA by ESPN, which pays $1.9b/$1.4b a year and; 3) LIVX live growingdigital library could also materialize as an irreplaceable asset.

Important Disclosures & Regulation AC Certification(s) are located on page 24 to 25 of this report.Roth Capital Partners, LLC | 888 San Clemente Drive | Newport Beach CA 92660 | 949 720 5700 | Member FINRA/SIPC

TABLE OF CONTENTS

Investment Thesis…………………………………………………………………..……………..…..3

A “Live” Differential – LIVX Wallet Share to Increase……………………….................………4

Industry Tailwind One: Music Subscription Streaming …………………………………….…..8

Industry Tailwind Two: Over-the-Top Technologies……………………………………………..12

Industry Tailwind Three: Live Music …………………………………………………………..…...13

Revenue Driver Analysis and Forecast……………………………………………………….……14

Management Team and BOD Positions Forward Opportunities…………………………..…..16

Balance Sheet………………………………………………………………………………...….…..…17

Valuation and Price Target …………………………………………………………………………..18

Description of Company………………………………………………………………………………19

Corporate History …………………………………………….………………………………………..20

Risks..…………………………………………………………………………………………………….21

Page 2 of 25

LIVEXLIVE MEDIA, INC. Company Note - August 21, 2019

INVESTMENT THESIS

1) Positioned to capture accelerated wallet share, near-term, in the recurring revenue subscription

streaming music market due to differentiated, significant live music and music entertainment

access and multiple bundling opportunities with major carriers, over-the-top and social media

platforms.

2) Strong music subscription streaming industry tailwinds driven by consumer preference for on-

demand, customized, curated, commercial-free music delivered across multiple platforms (smart

phones, connected vehicles, smart speakers, etc.).

3) Strong Over-the-Top (“OTT”) and Live Music Tailwinds combine with streaming music subscription

momentum, positioning LIVX’s business model at the epicenter of three large, quickly growing

industry segments.

4) Underappreciated top-tier management and BOD lineup comprised of well-known innovators and

deal makers in traditional and digital entertainment. Uniquely positioned to close on

transformative media transactions well-above its current market cap.

5) Valuation does not encapsulate our anticipation of a 1% capture of the subscription music market

over the next ~11 years, which equates to $8.50 per share of present value, our price target,

illustrated below. Alternatively, a CY20 EV/Sales multiple in-line with peers equates to ~$6 per share.

In addition, assets acquired, such as such as exclusive digital "real estate" for certain live events

(Rock in Rio - up to 1.5mm attendees in years past, EDC - 400,000 attendees, etc.) could emerge

as similar to acquired TV rights of the NFL/NBA by ESPN, which pays $1.9b/$1.4b a year. LIVX’s

growing digital library could also materialize to an irreplaceable asset. We do not include such

asset value considerations in our current target price.

LIVX Historical and Forecasted Revenue, ~90% Recurring

Source: SEC filings and ROTH Capital Partners

Page 3 of 25

LIVEXLIVE MEDIA, INC. Company Note - August 21, 2019

LIVE MUSIC DIFFERENTIAL – LIVX WALLET SHARE TO INCREASE

LIVX offers a unique opportunity to invest in the only live music focused streaming provider with a recently

reached critical mass of live content, in our view.

While deep-pocket competitor providers pose subscription streaming music market share penetration

challenges, LIVX’s acute focus on live music and live music related entertainment divorces it from

companies such as Spotify (SPOT), Pandora Media (PNDORA), Apple Music Unlimited (AAPL) and Sirius

XM (SIRI).

LIVX’s first-mover advantage, numerous exclusive long-term agreements and understanding of

broadcasting coveted live content positions it as a possible acquisition target, in our view (larger peers only

recently acknowledged a new emphasis on live music content).

In the interim, LIVX should continue to gain streaming music market share driven by increasing content

breadth, geographic reach and offered applications.

Of note, LIVX’s partnership with Tesla, calls for North America Tesla deliveries to be pre-installed with LIVX

subscriptions, offering visible baseline subscription growth, in our view (see page 14, “Revenue Driver

Analysis and Forecast,” for more detail)

Source: SEC filings and ROTH Capital Partners

Page 4 of 25

LIVEXLIVE MEDIA, INC. Company Note - August 21, 2019

Filling the Subscription Funnel with Live Content

Key to subscriber growth is a continuation of: 1) Content relationships and partnerships, 2) The introduction

of new concepts and; 3) Advancement of platform distribution/applications.

LIVX Live Event Critical Mass: Key Performance Indicators

Source: SEC Documents and ROTH Capital Partners

Content Relationships and Partnerships

LIVX remains the only live music focused streaming provider and is continually adding new global partners,

many of which are long-term exclusive arrangements, creating a competitive moat.

LIVX has now captured a significant portion of the live music market with up to 1,000 live music events

through multiple agreements with global and regional media companies.

We believe LIVX’s critical mass of live content has only recently been reached offering a potential “tipping

point” for viral subscriber growth over time.

LIVX Deal Example – “insomniac” (in partnership with LiveNation) – March 2018

Source: Google Images and ROTH Capital Partners

LIVX possesses a five-year, exclusive global digital broadcast right across all insomniac events, including

up to 20 festivals and 100 events annually.

Rights include the festival, “EDC,” in Las Vegas, attended by over 400,000 people over three days.

Overall, insomniac live events draw four million attendees across more than six countries (Source:

“Summer of Streaming Continues,” LiveXLive Press Release, August 2018).

LIVX Deal Example – iHeartMedia (March 2019)

Source: Google Images and ROTH Capital Partners

LIVX possesses exclusive global livestreaming rights for 17 marquee events, including iHeart Country

Festival, iHeart Wango Tango, Daytime Stage at the iHeart Radio Music Festival.

iHeart reaches a 250 million monthly active listeners, with 255,000 listeners per minute on over 1,500

stations. iHeart has 145m social media followers. (Source: DMR Business Statistics).

F120 F219 Growth

Livestreamed Events 9 5 80%

Total Views (millions) 28 18 56%

Page 5 of 25

LIVEXLIVE MEDIA, INC. Company Note - August 21, 2019

Outside of broadcasting the events, exposure from the iHeart/LIVX partnership is significant in terms of

advertising of events and their broadcast.

From April 2018 to March 2019, LIVX has showcased over 400 live artist performances. A small snapshot

of events include Rock in Rio (Metallica, Maroon 5, Justin Timberlake, Bon Jovi, Guns N’ Roses); EDC Las

Vegas – Las Vegas, Nevada (May 2018; Above & Beyond, Marshmello, Martin Garrix, Diplo) and; Weezer

iHeartRadio Theater – New York, New York (February 2019 record release party).

The Introduction of New Concepts

LIVX has introduced multiple new concepts surrounding live music including album release parties with

artists, podcasts featuring exclusive interviews, storytelling, music news and, LiveZone, the “SportsCenter

of Music Festival Coverage.”

LiveZone (December 2018)

LiveZone offers on-site music shows that provide pre- and post-show coverage.

LiveZone offers live interviews with artists, managers and attendees. It broadcasts from all over the festival

grounds including onstage, from the side stage, backstage and from the crowd.

The offering also offers a platform for brands and sponsor advertisements (see page 14).

Source: Google Images and ROTH Capital Partners

Advancement of platform distribution/applications

LIVX is launched across all major digital platforms, including YouTube, Facebook Live, Amazon Fire TV

and Apple TV.

Source: LIVX Investor Presentation, August 2019 and ROTH Capital Partners

LiveXLive Next Generation. In May 2019, LIVX launched its Next Generation LiveXLive application. Before

its launch, LIVX offered its Slacker Radio (for background on Slacker Radio, see page 20, “Corporate

History”) and LiveXLive video services operate on separate platforms.

The LiveXLive application combined its services on a single platform, broadening access and unified

brands. The app features multiple live channels for live video broadcasts with multi-view perspectives of

Page 6 of 25

LIVEXLIVE MEDIA, INC. Company Note - August 21, 2019

stages, vertical edge-to-edge video, a video player to support both livestreams and video on-demand

playback. It also utilizes data-informed, human curation for streaming music stations.

*Note the curser hovering over the, “Live Events” offering on the LiveXLive Application

Source: LiveXLive Web Site and ROTH Capital Partners

Page 7 of 25

LIVEXLIVE MEDIA, INC. Company Note - August 21, 2019

MUSIC’S REVITALIZATION – UNDERPINNED BY SUBSCRIPTION STREAMING

REVENUE

Recorded music revenue has grown for the last three consecutive years, the first time since 1999.

Industry revenue still remains 33% below its 1999 peak.

Source: RIAA and ROTH Capital Partners

The primary driver of increased music revenue has been streaming revenue.

Percentage Growth of Subscription Streaming Revenue

Source: IFPI and ROTH Capital Partners

Source: RIAA and ROTH Capital Partners

A paid subscription has been the primary driver of steaming growth - and thus recorded music growth.

There were 255mm global paid music streaming subscribers at the end of CY18 (Source: IFPI).

41.0%35.5%

47.6%

65.1%

41.1%

0

1

2

3

4

5

6

7

8

2013 2014 2015 2016 2017

Bil

lio

ns

Page 8 of 25

LIVEXLIVE MEDIA, INC. Company Note - August 21, 2019

Paid US Subscription Users Reached over ~50mm in CY18 of Global Users

Source: RIAA and ROTH Capital Partners

Estimates, including Goldman Sachs, forecast 1.2b paid music streaming subscribers by 2030 with paid

streaming revenue of $28b.

Source: RIAA and ROTH Capital Partners

LIVX Global

LIVX has continually broadened its global streaming subscriber reach. In May 2019, LIVX announced a

distribution partnership agreement with Tencent Video, allowing Tencent the exclusive rights to distribute

the LIVX produced livestream of insomniac’s EDC Las Vegas throughout China. Tencent has more than 89

million subscribers.

LIVX Current Global Reach

Page 9 of 25

LIVEXLIVE MEDIA, INC. Company Note - August 21, 2019

Source: LIVX Investor Presentation, August 2019 and ROTH Capital Partners

Why Consumers Are Showing a Preference for Subscription Streaming

Consumers have been adopting subscription music streaming for the following reasons:

i. Commercial free.

ii. On-demand access to millions of songs both newly released and catalogued.

iii. Customized/personalized, curated experience. Consumers create their own

playlists and customized genre frames

iv. Ability to follow certain specific artists or bands and share findings with friends or

on social media.

v. Ability for users to “discover” content by searching within their own consumer

preferences with no new purchase risk.

vi. Delivery agnostic. All major delivery systems, including smart phones,

connected vehicles and smart speaker show continued adoption levels.

We believe music subscription streaming is anchored by access to large-scale technology access, including

smart phone growth, connected vehicles and smart speakers.

Smart Phone User Growth

We estimate 7% to 8% of smartphone users use paid streaming services. Along with growing global

smartphone users, penetration of paid streaming users should also increase. We believe global

smartphone user penetration will grow to 18% by 2023, coinciding the 622mm subscription streaming user

base forecast above.

Source: Newzoo

Smart Speakers

Smart speaker growth, anchored by Amzon Echo, has increased to over 50mm global units and growing

(Amazon, SEC filings).

We believe smart speakers (Amazon Echo, Google Home, Sonos One, Apple HomePod, etc.), will continue

to drive higher paid music streaming penetration.

Page 10 of 25

LIVEXLIVE MEDIA, INC. Company Note - August 21, 2019

Source: Techcrunch and ROTH Capital Partners

Connected cars

According to Statista, 98% of new cars sold will be connected to the Internet by 2020. Connected cars provide yet

another growing platform to distribute subscription streaming music.

Source: Google Images and ROTH Capital Partners

Of note, LiveXLive is pre-loaded in Tesla

North American deliveries. The Tesla

partnership, illustrated in our forecast

analysis on page 14, provides solid visibly

to forward estimates, in our view.

Page 11 of 25

LIVEXLIVE MEDIA, INC. Company Note - August 21, 2019

OVER-THE-TOP TECHNOLOGY GROWTH

Over-the-top (OTT) refers to film and television content provided via a high-speed internet connection

rather than a cable or satellite provider (Source, Investopedia).

With the growth of broadband (~82% U.S. penetration, according to Future Insights), OTT technologies are

being quickly adopted.

We believe OTT will become a significant carrier of music subscription streaming. OTT goals include

driving overall viewing time, increasing consumer spending. As such, we believe music is a key content

component yet to be fully exploited. Most recently, LIVX made its application available through the Roku,

Apple TV and Amazon Fire platforms.

Given large content requirements of OTT technologies (such as Netflix), we believe there are significant

opportunities for LIVX to be ported to multiple OTT platforms, potentially creating bundling opportunities.

U.S. OTT revenue is expected to grow at a 10.3% compounded annual growth rate to $23.7b in 2023 from

$14.5b in 2018, with 2023 video-on-demand leading sales at $17.8b (Source: PricewaterhouseCoopers).

Source: Google Images and ROTH Capital Partners

Page 12 of 25

LIVEXLIVE MEDIA, INC. Company Note - August 21, 2019

LIVE MUSIC GROWTH

Live Music revenue is expected to increase at a CAGR or 3.3% from 2018 to 2022, reaching $30.6b

($24.4b from ticket sales with the rest coming ancillary revenue – sponsorships and other). (PWC, Global

Entertainment and Media Outlook 2018 – 2022).

There are over 2,000 music festivals worldwide (Source: LIVX FY19 10-K).

According to Neilson, ~52% of the U.S. population attends some sort of live music event each year.

LIVX Possesses the Largest Library of Digital Broadcast Rights for Music Festivals

Source: LIVX Investor Presentation, August 2019

LIVX Resides in the Epicenter of Subscription Growth, OTT Growth and Live Music Growth,

Outlined Above

Source: LIVX Investor Presentation, August 2019

Page 13 of 25

LIVEXLIVE MEDIA, INC. Company Note - August 21, 2019

REVENUE DRIVER ANALYSIS AND FORECAST

Subscription Services

Source: SEC filings and ROTH Capital Partners

~90% of LIVX revenue is generated from subscription services. Subscription services are sold on multiple

platforms, including OEMs and represent 100% recurring revenue to LIVX.

Paid LIVX subscribers can choose between free service (limited features and not commercial free) up to

$9.99 for access to all LIVX features. At F1Q20, revenue per month per subscription averaged $3.89.

Source: Company Website, August 2019

Margins on subscription services average ~30%.

LIVX has multiple OEM customers such automobile manufacturers Tesla, Toyota, Honda, Dodge, Subaru

and others.

Tesla

LIVX’s most prominent OEM agreement is with Telsa, comprising ~53% of F1Q20 total revenue. Tesla

installs LIVX application in its equipment and provides the service to its customers. Tesla does not charge

the car owners a fee for the service. We believe LIVX generates $3 per month, per North American Tesla

delivery, providing visibility into forward subscription revenue, in our view.

Advertising and Licensing

Source: SEC filings and ROTH Capital Partners

Due to a growing subscriber base, LIVX has committed sales and production geared toward advertising

and licensing. Generally, Advertising and Licensing represents ~10% of total revenue, though we forecast

this to increase to over 11% next year and believe it will ultimately represent ~15% of sales as the model

matures.

F1Q19 F2Q19 F3Q19 F4Q19 FY19 F1Q20 F2Q20E F3Q20E F4Q20E FY20E F1Q21E F2Q21E F3Q21E F4Q21E FY21E

Total Revenue 7,590 7,968 8,964 9,179 33,701 9,498 10,399 12,439 13,668 46,004 14,758 16,754 20,074 21,640 73,226

Revenue Growth YoY NA NA NA NA NA 25% 31% 39% 49% 37% 55% 61% 61% 58% 59%

Subscription services 6,621 7,244 8,108 8,425 30,398 8,565 9,313 10,555 12,009 40,443 13,545 15,233 17,061 18,986 64,825

% of Total Revenue 87% 91% 90% 92% 90% 90% 90% 85% 88% 88% 92% 91% 85% 88% 89%

Primary OEM Customer 2,200 2,900 4,000 4,600 13,700 5,000 5,776 6,661 7,472 24,910 8,241 9,138 10,141 11,060 38,581

Revenue per month, per Subscription $4.51 $4.40 $4.20 $4.13 $4.31 $3.89 $3.80 $3.75 $3.80 $3.81 $3.89 $3.95 $3.98 $4.18 $4.00

YoY Growth NA NA NA NA NA -14% -14% -11% -8% -12% 0% 4% 6% 10% 5%

Per Quarter, per Subscription $13.54 $13.19 $12.61 $12.39 $12.93 $11.68 $11.40 $11.25 $11.40 $11.43 $11.68 $11.86 $11.93 $12.54 $12.00

EOP Paid Subscribers (thousands) 489 549 643 680 680 733 864 1,085 1,340 1,340 1,603 1,888 2,194 2,501 2,501

Beginning of Period Paid Subscribers 440 489 549 643 643 680 733 864 1,085 1,085 1,340 1,603 1,888 2,194 2,194

Average Paid Subscribers 465 519 596 662 662 707 799 975 1,213 1,213 1,472 1,745 2,041 2,348 2,348

Actual Sequential Growth 42 60 94 37 680 53 131 221 255 660 263 285 306 307 1,161

% Sequential Growth NA 12% 17% 6% NA 8% 18% 26% 24% 97% 20% 18% 16% 14% 87%

% YoY Growth NA NA NA NA NA 50% 57% 69% 97% 97% 119% 118% 102% 87% 87%

F1Q19 F2Q19 F3Q19 F4Q19 FY19 F1Q20 F2Q20E F3Q20E F4Q20E FY20E F1Q21E F2Q21E F3Q21E F4Q21E FY21E

Advertising & Licensing 969 724 856 754 3,303 933 1,086 1,883 1,659 5,561 1,213 1,520 3,013 2,654 8,401

% YoY Growth NA NA NA NA NA -4% 50% 120% 120% 68% 30% 40% 60% 60% 51%

Revenue Growth YoY NA NA NA NA NA 25% 31% 39% 49% 37% 55% 61% 61% 58% 59%

% Sequential Growth NA NA NA NA NA 24% 16% 73% -12% 68% -27% 25% 98% -12% 51%

Page 14 of 25

LIVEXLIVE MEDIA, INC. Company Note - August 21, 2019

Advertising revenue primarily consists of revenues generated from the sale of audio, video, and display

advertising space to third-party advertising exchanges.

Current major sponsors include Kia and Samsung. LIVX has cited an expectation to generate ~$250,000 in

sponsorship revenue per major festival event in the near-term.

Licensing revenue primarily consists of sales of licensing rights to digitally stream its live music services in

certain geographies

The Fly-Wheel Below Spins as Content and Subscribers Increase

Illustrated below, we believe LIVX has multiple revenue generating opportunities, including merchandising –

even upcoming festival ticket sales.

Source: LIVX Investor Presentation, August 2019

Costs of Sales

Major costs of sales include royalties to record labels, publishers and digital rights organizations. Further,

production costs of festivals range from $200,000 to $350,000 per festival (depending on size, etc.). LIVX

also provides a revenue share program with festival owners ranging from 35% to 50%.

Our Forecast versus Guidance

Current FY20 guidance is for $50mm and $65mm of revenue and $10mm to $15mm of adjusted operating

loss. We project total revenue of $46mm and a $16mm operating loss. Notably, this does not impact our

stock valuation which is based on longer-term music subscription streaming share penetration.

We believe the Street would view making or exceeding guidance as a positive, though expectations seem

to be muted (consensus revenue estimates are ~2% below the low-end of issued guidance).

We believe the LIVX could introduce major new partnerships, vastly expanding its subscriber reach in the

near-term. However, without additional visibility, we have not included that into our forecast. Further, our

forecast does not include acquisition revenue, which we believe is probable given LIVX’s stated business

growth strategy of “build and buy.”

Page 15 of 25

LIVEXLIVE MEDIA, INC. Company Note - August 21, 2019

MANAGEMENT TEAM AND BOD POSITIONS FORWARD OPPORTUNITIES

LIVX has assembled a team comprised of several of traditional and digital entertainment’s well-known top

innovators and deal makers that investors would more likely expect in billion-dollar media or streaming

companies, in our view.

Management Segmentation

Source: LIVX Investor Presentation, August 2019

Board of Directors

Source: LIVX Investor Presentation, August 2019

Management Relevant Experience

Mr. Rober Ellin * Over 30 years of investment and turnaround experience

Chairman and Chief Executive Officer * Deep relationships in media and entertainment, & prior public company experience as Executive

Chairman of Mandalay Digital Group - now Digital Turbine (APPS: buy)

Mr. Dermot McCormack * Renowned digital media and music executive

President, LiveXLive * Oversaw video and studios at AOL and digital media for Vlacom's music group

Mr. Doug Schaer * Experienced business strategist specializing in franchise asset development in entertainment and sports

Chief Operating Officer

Mr. Michael Zemetra * Built and led financial organizations across multi-billion-dollar companies

Chief Financial Officer * Former Vice President of Finance at J2 Global, and previously the SVP and Chief Accounting Officer at

Demand Media

Directors Relevant Experience

Mr. Ramin Arani * Former lead manager of Fidelity's Puritan Fund

Independent Director * Current Board member of Vice Media, Ellen Digital and Opportunity Network

Mr. Patrick Wachsberger * Founder and CEO of Picture Perfect Entertainment

Independent Director * Former Chairman of Lionsgate Films

Mr. Kenneth Solomon * Chairman and CEO of the Tennis Channel

Independent Director * Partner at Arcadia Investment Partners and Chairman of Ovation TV

Mr. Craig L. Foster * Former Chief Fianncial Officer and Chief Accounting Officer of Amobee, Inc.

Independent Director

Mr. Jay Krigsman * Executive Vice President and Asset Manager of The Krausz Companies

Independent Director

Mr. Tim Spengler * Current President of Dentsu Aegis

Independent Director * Former President of Clear Channel Media and Interpublic Group

Page 16 of 25

LIVEXLIVE MEDIA, INC. Company Note - August 21, 2019

BALANCE SHEET

Source: SEC filings and ROTH Capital Partners

*Note LIVX’s current cash balance is closer to $20mm following a completed public offering of 5mm shares

at $2.10 per share in July, 2019.

Warrant discussion

LIVX has ~$9.8mm in senior secured debentures at a 12.75% rate which mature June 2021. The

conversion strike is $10 per share. LIVX also carries ~$4.9mm in unsecured convertible notes at a 7.5%

rate that mature May 2021. The conversion strike is $3 per share. Chairman and CEO Mr. Robert Ellin

controls the entity owning the unsecured convertible notes.

(in $000) Mar-18 Jun-18 Sep-18 Dec-18 Jun-19

ASSETS

Cash and cash equivalents 10,285 15% 15,855 23% 14,064 22% 14,294 24% 13,704 23%

Restricted cash 3,685 5% 185 0% 185 0% 235 0% 235 0%

Accounts receivable, net 2,990 4% 3,444 5% 3,395 5% 3,714 6% 4,314 7%

Prepaid expense and other assets 1,759 3% 1,508 2% 1,582 2% 1,124 2% 1,311 2%

Property and equipment, net 393 1% 960 1% 1,476 2% 2,036 3% 2,720 5%

Goodwill 5,377 8% 5,377 8% 5,377 8% 9,672 16% 9,672 16%

Intangible assets, net 43,499 64% 41,076 60% 38,653 60% 28,731 48% 26,943 46%

Other assets 39 0% 39 0% 39 0% 39 0% 0 0%

TOTAL ASSETS 68,027 100% 68,444 100% 64,771 100% 59,845 100% 58,899 100%

LIABILITIES AND STOCKHOLDERS' EQUITY

Accounts payable, accrued liabilities 19,874 29% 21,654 32% 25,030 39% 29,495 49% 30,827 52%

Note payable 294 0% 299 0% 303 0% 308 1% 312 1%

Bank debt 3,500 5% 0 0% 0 0% 0 0% 0 0%

Deferred revenue 1,046 2% 932 1% 877 1% 986 2% 950 2%

Secured convertible notes, net 0 0% 0 0% 1,271 2% 1,697 3% 2,111 4%

Unsecured convertible notes, net 4,916 7% 4,199 6% 4,346 7% 4,546 8% 4,741 8%

Secured convertible notes, net of discount and current maturities 0 0% 9,606 14% 8,451 13% 8,090 14% 10,284 17%

TOTAL LIABILITIES 29,630 44% 36,690 54% 40,278 62% 45,104 75% 49,225 84%

TOTAL STOCKHOLDERS' EQUITY 38,397 56% 31,754 46% 24,493 38% 14,741 25% 9,674 16%

TOTAL LIABILITIES AND STOCKHOLDERS' DEFICIT 68,027 100% 68,444 100% 64,771 100% 59,845 100% 58,899 100%

Page 17 of 25

LIVEXLIVE MEDIA, INC. Company Note - August 21, 2019

VALUATION

We value shares at ~$8.50 utilizing the present value of our expectation of 1% share penetration of the

streaming subscription music market by 2030.

Our valuation assumes 1% of 1.2b streaming subscription music subscribers by 2030.

We calculate the 12mm subscribers would generate ~$4 per month in subscription fees or $576mm in

revenue. We believe sponsorships and licensing should be at least 12% of total revenue, or $75mm.

Combined, total revenue should be ~$650mm.

At a 25% margin, which we believe could prove conservative, EBITDA would total $162.5mm.

Discounted over a period of 11 years with a discount rate of 11%, $162.5mm equates to ~$51mm.

This equates to a PV EV/EBITDA of ~3.0x and a PV EV/Sales of 1.3x.

At 10x EV/EBITDA (a multiple well-below comparisons), share would trade close to ~$9.

LIVX also trades for 2.2x CY20 EV/Sales. At the peer average, LIVX would trade for $6 per share.

Peer Comparison Chart

Source: EIkon and ROTH Capital Partners

We also note that assets acquired, such as such as exclusive digital "real estate" for certain live events

(Rock in Rio - up to 1.5mm attendees in years past, EDC - 400,000 attendees, etc.) could emerge as

similar to acquired TV rights of the NFL/NBA by ESPN, which pays $1.9b/$1.4b a year.

Finally, LIVX’s growing digital library could also materialize to an irreplaceable asset. We do not include

such asset value considerations in our current target price.

8/19/2019 Shares 2018 2019 2020 2018 2019 2020

Company Rating Ticker Price Outstanding EV/EBITDA EV/EBITDA EV/EBITDA EV/SALES EV/SALES EV/SALES

Alphabet Inc. NC GOOGL.O 1,200.44$ 346.1 6.2x 5.x 4.x 2.3x 1.8x 1.4x

Amazon.com Inc. NC AMZN.O 1,816.12$ 494.7 26.6x 20.6x 16.1x 3.8x 3.1x 2.5x

Apple Inc. NC AAPL.O 210.35$ 4,519.2 12.2x 11.3x 11.1x 3.8x 3.3x 3.2x

Facebook Inc. NC FB.O 186.17$ 2,853.0 14.7x 12.6x 9.9x 8.8x 6.9x 5.5x

Live Nation Entertainment Inc. NC LYV 71.47$ 213.1 18.9x 17.3x 15.2x 1.5x 1.4x 1.3x

Netflix Inc. NC NFLX.O 309.38$ 437.8 70.7x 45.5x 32.2x 9.x 7.2x 6.x

Roku Inc. NC ROKU.O 134.96$ 116.2 474.x 430.6x 250.x 20.9x 14.1x 10.4x

Sirius XM Holdings Inc. NC SIRI 6.18$ 4,449.8 15.3x 14.7x 13.8x 5.9x 4.6x 4.3x

Snap Inc. NC SNAP.K 16.16$ 1,379.3 -36.5x na 600.x 17.8x 12.7x 9.5x

Spotify Technology SA NC SPOT.K 150.10$ 179.7 -2288.5x na 907.5x 4.8x 3.8x 3.x

Tencent Holdings Ltd. NC 0700.HK 333.40$ 9,555.2 27.x 22.x 18.2x 10.2x 8.1x 6.4x

Vivendi SA NC VIV.PA 25.74$ 1,271.1 24.8x 16.8x 14.7x 2.3x 2.3x 2.1x

World Wrestling Entertainment Inc. NC WWE 71.93$ 78.7 30.8x 27.6x 11.9x 5.9x 5.6x 4.2x

Average -123.4x 48.x 146.5x 7.5x 5.8x 4.6x

Average less SNAP, ROKU, and SPOT 24.7x 19.3x 14.7x 5.3x 4.4x 3.7x

Page 18 of 25

LIVEXLIVE MEDIA, INC. Company Note - August 21, 2019

COMPANY DESCRIPTION

LiveXLive (“LIVX”) is a digital media company focused on live music entertainment. LIVX operates

LiveXLive, a live music video streaming platform and producer of original music-related content, delivering

on-demand music experiences from of the world’s top music festivals and concerts. Listeners also have

access to premium original content, artist exclusives and industry interviews.

LIVX primary source of revenue is from subscriptions to its digital entertainment platform. Additional

revenue comes from sponsorships, licensing and advertisements.

LIVX has globally livestreamed premiere music festivals from all over the world, producing in excess of 360

hours of original content that features more than 440 artists since May 2018. In addition, the company has

developed a slate of original programming that includes more than 300 pieces of short-form content

comprised of live performances, podcasts, artist interviews, lifestyle segments, and show pilots.

Page 19 of 25

LIVEXLIVE MEDIA, INC. Company Note - August 21, 2019

HISTORICAL CORPORATE SNAPSHOT

LiveXLive was originally a subsidiary of Loton Corp, a multimedia and lifestyle OTC Company backed by

Trinad Capital, which was led by LIVX’s Executive Chairman and CEO Robert Ellin.

In August 2017, Loton Corp formally changed its name to LiveXLive Media, Inc. and ticker to LIVX,

reflecting its stated goal of becoming a leading destination for premium music content.

In December 2017, LIVX announced the sale of 5mm shares at $4 per shares and an exercised over-

allotment option to purchase of 460,200 shares. Total gross proceeds were $21.8m.

In February 2018, LIVX was approved for listing on the NASDAQ Capital Market.

In January 2018, LIVX announced it closed the acquisition of Slacker Radio, a streaming music and

personalized radio subscription service.

Net consideration for Slacker Radio was $28.6mm consisting of ~8mm shares of LIVX valued at $26.1mm,

cash of $2.5mm and the assumption of $21.5mm in liabilities.

In July 2018, LIVX sold $10.7mm in 12.75% debentures with a conversion price of $10 per share.

In July 2019, LIVX sold 5mm shares of common stock at $2.10 per share.

Page 20 of 25

LIVEXLIVE MEDIA, INC. Company Note - August 21, 2019

RISKS

The recorded music industry is highly concentrated, with Universal, Warner and Sony commanding over

~80% market share. Should it begin to curtail the supply chain, catalog content and other subscription

based offerings would likely contract, lowering overall subscription streaming music demand.

LIVX business with Tesla accounted for ~41% of revenue for the year ended March 31, 2019. Any

degradation of the business relationship with Tesla would be detrimental to our forecast.

Should the popularity of subscription music streaming decrease, it would be detrimental to our forecast as

~90% of it is derived from subscription streaming revenue. Similarly, LIVX’s ability to attract and retain

users is sensitive to changing public tastes in music and technology.

Subscription streaming and subscription music streaming is extremely competitive with multiple peers

possessing considerable more liquidity and access to capital than LIVX.

Page 21 of 25

LIVEXLIVE MEDIA, INC. Company Note - August 21, 2019

VALUATION

We value shares at ~$8.50 utilizing the present value of our expectation of 1% share penetration of thestreaming subscription music market by 2030. We calculate the 12mm subscribers (1.2b expected by 2030) willgenerate ~$4 per month in subscription fees or $576mm in revenue. We believe sponsorships and licensingwill be at least 12% of total revenue, or an additional $75mm, totaling $650mm of revenue. At a 25% EBITDAmargin, EBITDA would total $162.5mm. Discounted back a period of 11 years with a discount rate of 11%,$162.5mm equates to $50mm. This equates to a PV EV/EBITDA of ~3.0x. At 10x (a multiple well-belowcomparisons), shares would trade close to ~$8.50. Impediments to our price target include a material changeto key OEM agreements, specifically with with Tesla; lack of ability to convert viewership to paid subscriptions;the absence of key management contract renewals and; lack of ability to fund additional content creation orexecute on certain acquisition strategies.

RISKS

Risks that could impede shares of LIVX from achieving our $9 price target include: 1) Consumer behavioraway from current music and technology trends (“fad” risk); 2) A loss of its Tesla contract, which accountedfor ~41% of revenue in its year ended March 2019; 3) A negative shift in the domestic economy; 4) A lackof market share traction for multiple reasons including but not limited to lack of content creation and largercompetitor dominance given more significant liquidity and access to capital; 5) A lack of profit history and 6)The recording label’s overall ability to control the content supply chain.

COMPANY DESCRIPTION

LiveXLive (“LIVX”) is a digital media company focused on live music entertainment. LIVX operates LiveXLive,a live music video streaming platform and producer of original music-related content, delivering on-demandmusic experiences from of the world’s top music festivals and concerts. Listeners also have access to premiumoriginal content, artist exclusives and industry interviews.

LiveXLive primary source of revenue is from subscriptions to its digital entertainment platform. Additionalrevenue comes from sponsorships, licensing and advertisements.

MENTIONED COMPANIESTSLA

Page 22 of 25

LIVEXLIVE MEDIA, INC. Company Note - August 21, 2019

($000) 2018 Jun-18 Sep-18 Dec-18 Mar-19 2019 Jun-19 Sep-19 Dec-19 Mar-20 2020 Jun-20 Sep-20 Dec-20 Mar-21 2020FY18 F1Q19 F2Q19 F3Q19 F4Q19 FY19 F1Q20 F2Q20E F3Q20E F4Q20E FY20E F1Q21E F2Q21E F3Q21E F4Q21E FY21E

REVENUES

Revenues 7,195 7,590 7,968 8,964 9,179 33,701 9,498 10,399 12,439 13,668 46,004 14,758 16,754 20,074 21,640 73,226 % yoy na na na na 28% 368% 25% 31% 39% 49% 37% 55% 61% 61% 58% 59%

OPERATING EXPENSES

Cost of sales 6,694 8,435 8,135 7,571 7,029 31,170 9,013 8,839 10,324 11,071 39,248 12,249 13,905 15,657 16,879 58,692% of total revenues 93% 111% 102% 84% 77% 92% 95% 85% 83% 81% 85% 83% 83% 78% 78% 80%

Gross Profit 501 (845) (167) 1,393 2,150 2,531 485 1,560 2,115 2,597 6,756 2,509 2,848 4,416 4,761 14,534

% yoy nm nm nm nm 29% 405% NA NA 52% 21% 167% 417% 83% 109% 83% 115%

% of total revenues 7% -11% -2% 16% 23% 8% 5% 15% 17% 19% 15% 17% 17% 22% 22% 20%

Sales and marketing 662 914 1,306 963 1,349 4,532 1,711 1,872 2,115 2,187 7,884 2,214 2,262 2,509 2,489 9,473% of total revenues na 12% 16% 11% 15% 13% 18% 18% 17% 16% 17% 15% 14% 13% 12% 13%

Product development 1,578 1,843 1,969 1,825 2,329 7,966 2,423 2,704 3,172 3,349 11,647 3,468 3,770 4,316 4,436 15,990% of total revenues 22% 24% 25% 20% 25% 24% 26% 26% 26% 25% 25% 24% 23% 22% 21% 22%

General and administrative expenses 10,715 4,077 3,664 4,470 5,210 17,421 4,825 4,077 4,077 4,077 17,056 4,077 4,077 4,077 4,077 16,308% of total revenues 149% 54% 46% 50% 57% 52% 51% 39% 33% 30% 37% 28% 24% 20% 19% 22%

EBITDA (12,454.0) (7,679.0) (7,106.0) (5,865.0) (6,738.0) (27,388) (8,474.0) (7,092.7) (7,248.9) (7,015.7) (29,831.3) (7,250.1) (7,260.2) (6,485.8) (6,241.0) (27,237.1)

Amortization of intangible assets 2,423 2,423 2,410 (117) 1,788 6,504 1,788 1,800 1,800 1,835 7,223 1,835 1,835 1,835 1,835 7,340% of total revenues 34% 32% 30% -1% 19% 19% 19% 17% 14% 13% 16% 12% 11% 9% 8% 10%

Operating income (14,877) (10,102) (9,516) (5,748) (8,526) (33,892) (10,262) (8,893) (9,049) (8,851) (37,054) (9,085) (9,095) (8,321) (8,076) (34,577)

Adjusted Operating income (D&A, Stock-Comp Add-back) (4,554) (4,589) (3,993) (4,149) (3,916) (16,646) (4,150) (4,160) (3,386) (3,141) (14,837)

% yoy na -439% -211% -112% -18% -128% -2% 7% -57% -4% -9% -11% -2% 8% 9% 7%

OTHER INCOME

Interest expense, net (3,922) (616) (782) (839) (890) (3,127) (870) (874) (874) (874) (3,491) (874) (874) (874) (874) (3,495)

Other expense (215) (50) (27) 24 (325) (378) 166 0 0 0 166 0 0 0 0 0

Total other income (4,137) (666) (809) (815) (1,215) (3,505) (704) (874) (874) (874) (3,325) (874) (874) (874) (874) (3,495)

Pretax income (19,014) (10,768) (10,325) (6,563) (9,741) (37,397) (10,966) (9,767) (9,923) (9,724) (40,380) (9,959) (9,969) (9,195) (8,950) (38,072) % of total revenue nm nm nm nm nm nm nm nm nm (1) (1) (1) (1) nm (0) (1)

Income tax provision (benefit) 6 0 66 0 7 73 0 0 0 0 0 0 0 0 0 0 % tax rate na na na na na na na na na na na na na na na na

Loss from discontinued operations (19,020) 0 0 0 0 0 0 0 0 0 0 0 0 0 0 0Consolidated net income (loss) (23,336) (10,768) (10,259) (6,563) (9,748) (37,338) (10,966) (9,767) (9,923) (9,724) (40,380) (9,959) (9,969) (9,195) (8,950) (38,072)

EPS (0.59) (0.21) (0.20) (0.13) (0.19) (0.72) (0.21) (0.17) (0.17) (0.17) (0.72) (0.17) (0.17) (0.16) (0.16) (0.66)

Shares outstanding 39,595 51,528 51,950 51,985 52,136 51,899 52,320 57,620 57,620 57,620 57,620 57,620 57,620 57,620 57,620 57,620

Source: ROTH Capital and SEC Filings

David Bain

Roth Capital Partners, LLC

(949) 720-7113

8/20/2019

Page 23 of 25

LIVEXLIVE MEDIA, INC. Company Note - August 21, 2019

Regulation Analyst Certification ("Reg AC"): The research analyst primarily responsible for the content of this report certifiesthe following under Reg AC: I hereby certify that all views expressed in this report accurately reflect my personal viewsabout the subject company or companies and its or their securities. I also certify that no part of my compensation was, is orwill be, directly or indirectly, related to the specific recommendations or views expressed in this report.

Disclosures:ROTH makes a market in shares of LiveXLive Media, Inc. and Tesla, Inc. and as such, buys and sells from customers ona principal basis.

Shares of LiveXLive Media, Inc. may be subject to the Securities and Exchange Commission's Penny Stock Rules, whichmay set forth sales practice requirements for certain low-priced securities.

Rating and Price Target History for: LiveXLive Media, Inc. (LIVX) as of 08-20-2019

100

80

60

40

20

0Q2 Q3 2017 Q1 Q2 Q3 2018 Q1 Q2 Q3 2019 Q1 Q2 Q3

Created by: BlueMatrix

Rating and Price Target History for: Tesla, Inc. (TSLA) as of 08-20-2019

400

350

300

250

200

150Q2 Q3 2017 Q1 Q2 Q3 2018 Q1 Q2 Q3 2019 Q1 Q2 Q3

11/01/18I:N:$270

04/11/19N:$240

04/25/19N:$238

06/10/19B:$238

07/22/19N:$238

07/25/19N:$224

Created by: BlueMatrix

Each box on the Rating and Price Target History chart above represents a date on which an analyst made a change to arating or price target, except for the first box, which may only represent the first note written during the past three years.Distribution Ratings/IB Services shows the number of companies in each rating category from which Roth or an affiliatereceived compensation for investment banking services in the past 12 month.

Distribution of IB Services FirmwideIB Serv./Past 12 Mos.

Page 24 of 25

LIVEXLIVE MEDIA, INC. Company Note - August 21, 2019

as of 08/21/19Rating Count Percent Count PercentBuy [B] 272 75.35 152 55.88Neutral [N] 45 12.47 18 40.00Sell [S] 5 1.39 2 40.00Under Review [UR] 39 10.80 19 48.72

Our rating system attempts to incorporate industry, company and/or overall market risk and volatility. Consequently, at anygiven point in time, our investment rating on a stock and its implied price movement may not correspond to the stated 12-month price target.

Ratings System Definitions - ROTH employs a rating system based on the following:

Buy: A rating, which at the time it is instituted and or reiterated, that indicates an expectation of a total return of at least10% over the next 12 months.

Neutral: A rating, which at the time it is instituted and or reiterated, that indicates an expectation of a total return betweennegative 10% and 10% over the next 12 months.

Sell: A rating, which at the time it is instituted and or reiterated, that indicates an expectation that the price will depreciateby more than 10% over the next 12 months.

Under Review [UR]: A rating, which at the time it is instituted and or reiterated, indicates the temporary removal of theprior rating, price target and estimates for the security. Prior rating, price target and estimates should no longer be reliedupon for UR-rated securities.

Not Covered [NC]: ROTH does not publish research or have an opinion about this security.

ROTH Capital Partners, LLC expects to receive or intends to seek compensation for investment banking or other businessrelationships with the covered companies mentioned in this report in the next three months. The material, information andfacts discussed in this report other than the information regarding ROTH Capital Partners, LLC and its affiliates, are fromsources believed to be reliable, but are in no way guaranteed to be complete or accurate. This report should not be usedas a complete analysis of the company, industry or security discussed in the report. Additional information is available uponrequest. This is not, however, an offer or solicitation of the securities discussed. Any opinions or estimates in this report aresubject to change without notice. An investment in the stock may involve risks and uncertainties that could cause actualresults to differ materially from the forward-looking statements. Additionally, an investment in the stock may involve a highdegree of risk and may not be suitable for all investors. No part of this report may be reproduced in any form without theexpress written permission of ROTH. Copyright 2019. Member: FINRA/SIPC.

Page 25 of 25

LIVEXLIVE MEDIA, INC. Company Note - August 21, 2019


Recommended