Problem One and Solution Issue – FFIEC had no guidelines of market risk based potential for federal regulators Housed and modeled a credit agencies master file of over 300 STAG and demographics for each individual in US, creating segmentation models targeting mortgages, refinance-home equity, credit cards, personal, and auto loans. Testified before congressional banking sub-committee and sold business to credit agency. Details – Financial Modeling Concepts had a joint venture with Bear Stearns for CRA Securitization and partially owned by Trans Union. Co-Founder, Partner and Chief Scientist – Financial Modeling Concepts Solution – Recoded and Lifestage Trans Unions Master Credit and Demographic File Scored TU Master file against existing COOP of 5MM+ CRA loans by product Filtered by Current FICO and geography against current housing stock Provided FFIEC Bank examiners expected local area potential, sold banks pre-qualified prospects
Transcript
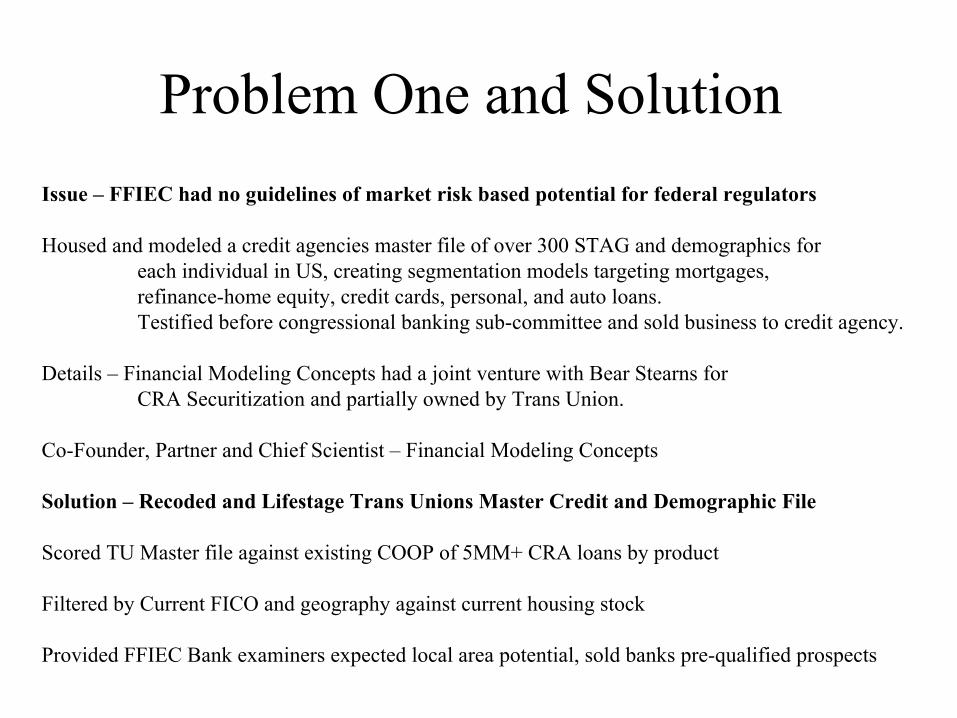
Problem One and SolutionIssue – FFIEC had no guidelines of market risk based potential for federal regulators
Housed and modeled a credit agencies master file of over 300 STAG and demographics for each individual in US, creating segmentation models targeting mortgages, refinance-home equity, credit cards, personal, and auto loans. Testified before congressional banking sub-committee and sold business to credit agency.
Details – Financial Modeling Concepts had a joint venture with Bear Stearns for CRA Securitization and partially owned by Trans Union.
Co-Founder, Partner and Chief Scientist – Financial Modeling Concepts
Solution – Recoded and Lifestage Trans Unions Master Credit and Demographic File
Scored TU Master file against existing COOP of 5MM+ CRA loans by product
Filtered by Current FICO and geography against current housing stock
Provided FFIEC Bank examiners expected local area potential, sold banks pre-qualified prospects
Definitions : Using a combination of data from TU, the Government, and several Client banks, a series of algorithms where developed that identified Prospects for various financial products ( New Mortgage, Refinance, Home Improvement, Installment, & Automobile). All data were Aggregated to Tract level geography. Using a GAP analyses approach each area was segmented based upon the current presence and potential. Essentially a spreadsheet and map were provided that was capable of demonstrating each clients performance.
Specifics : The essentials of the LOANTRAX Algorithms consist of pre-processing the TU master file which created a single Lifestage dimension from several raw variables, householded the file to create a single last name-street address combination, eliminated and audited anomalies found with the data, tagged and classified records according to FFIEC definitions. In addition all bank sourced data was matched to this file and coded to be used in the modelling.
Data Mart
Loantrax Algorithms
Raw Files from CPUS System 2/1997 Demographic lrecl = 384 & Credit lrecl=786
from FFIEC lrecl=836 N=46,641from List & Insurance Services Combined single file lrecl=930 N=127,030,251
RecodesCreates Matchkey (Household versus Individuals - Single Address-Last Name Combo)Lifestage (Age-DOB&Infered, Sex, Marital Status, Kids)Owner (Credit and Demo side with Opendate for LOR)Geocodes (Classification into LMI / MUI)
Bank Sourced CIFFirst Chicago = 918,571 AccountsFleet Boston = 833,523 Accounts
LOANTRAX 1997 HOME PURCHASE PRODUCT PENETRATION INDEX(TM)
Nassau
Hempstead Village
Levittown
Valley Stream Village
Oceanside
Freeport Village
Elmont
East Meadow Lindenhurst Village
West BabylonWest Islip
Hicksville
Plainview
Dix Hills
Huntington Station
Deer Park
Brentwood
Central Islip
Commack
Smithtown
Holbrook
Centereach
Coram
Hewlett
North Valley Stream
New Hyde Park Village
North New Hyde Park
Manhasset
Port Washington
Williston Park Village
Albertson
East Hills Village
Glen Cove
Bayville Village
Roosevelt
Bellmore
Wantagh
North Wantagh
North Massapequa
East Massapequa
Salisbury
New Cassel
Jericho
Syosset
Old Bethpage
Farmingdale Village
Melville
Wyandanch Bay Shore
Islip
Oyster Bay
West Hills
Huntington
Centerport
Elwood Hauppauge
East Northport
Fort Salonga
Kings Park St. James
Islip Terrace Oakdale
Bohemia
Nesconset
Sayville
Patchogue Village
Holtsville
Lake Grove Village
Stony Brook
Setauket-East Setauket
Terryville
Medford
East Patchogue
North Bellport
Yaphank
Middle Island
Overlays
Delineation Area Type
All Cities
County Name
Charts
Branches
CBCs
Interstate Highways
Census Tract Data
Census Tracts
Income IndexBy Minority Population
Low Mod Income, Minority Pop < 50%
Low Mod Income, Minority Pop >= 50%
Mid Upr Income, Minority Pop < 50%
Mid Upr Income, Minority Pop >= 50%
Missing Data
Excluded
Not Selected
Home PurchaseProduct Penetration Index
(Performance Vs. Potential)
-1
-1.5
+2.5
+3A
+3B
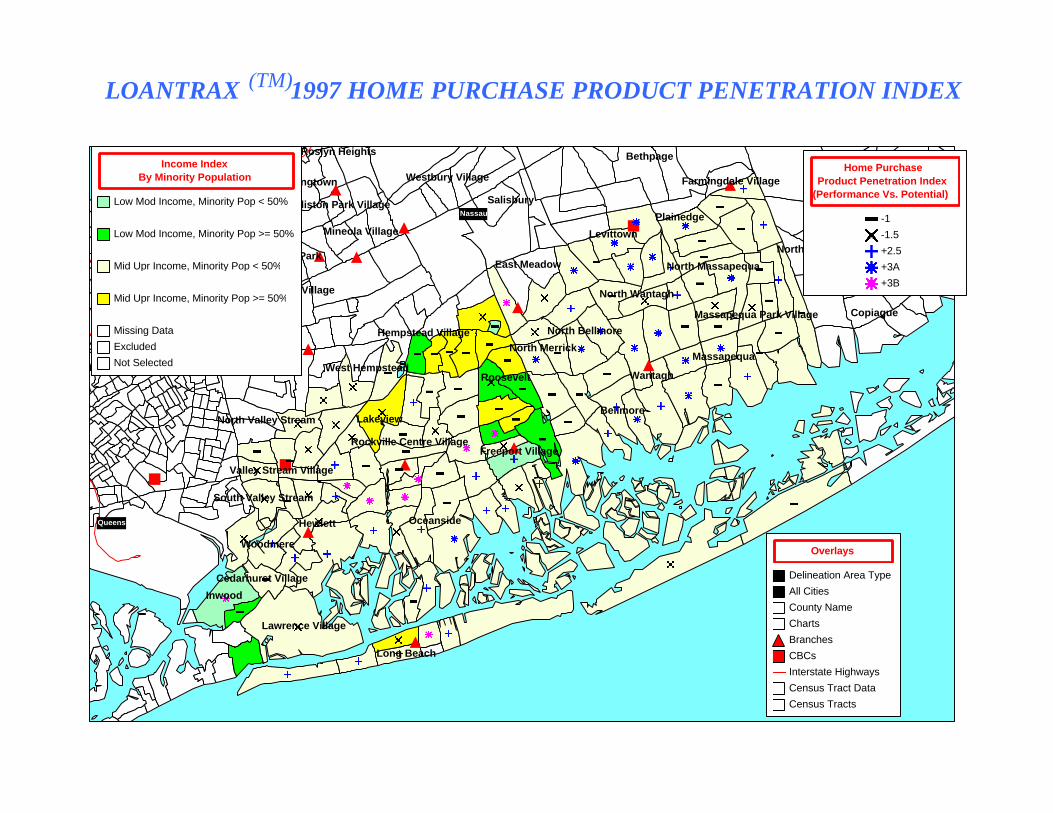
LOANTRAX 1997 HOME PURCHASE PRODUCT PENETRATION INDEX(TM)
Queens
Nassau
Hempstead Village
Levittown
Long Beach
Valley Stream Village
Oceanside
Freeport Village
Elmont
East Meadow Lindenhurst Village
West Babylon
Inwood
Lawrence Village
Cedarhurst Village
Woodmere
South Valley Stream
Hewlett
Floral Park Village
North Valley Stream Lakeview
Rockville Centre Village
West Hempstead
New Hyde Park Village
North New Hyde Park
Great Neck Plaza Village
Williston Park Village
Searingtown
Roslyn Heights
Mineola Village
Roosevelt
Bellmore
North Merrick
North Bellmore
Wantagh
Massapequa
North Wantagh
North Massapequa
Massapequa Park Village
North Amityville
Westbury Village
Salisbury
Plainedge
Bethpage
Farmingdale Village
Copiague
North Lindenhurst
Overlays
Delineation Area Type
All Cities
County Name
Charts
Branches
CBCs
Interstate Highways
Census Tract Data
Census Tracts
Income IndexBy Minority Population
Low Mod Income, Minority Pop < 50%
Low Mod Income, Minority Pop >= 50%
Mid Upr Income, Minority Pop < 50%
Mid Upr Income, Minority Pop >= 50%
Missing Data
Excluded
Not Selected
Home PurchaseProduct Penetration Index
(Performance Vs. Potential)
-1
-1.5
+2.5
+3A
+3B
Performance Context QuantificationUsing these Maps and the accompanied spreadsheets, BankExaminers could quickly and effectively assess the Real MarketPotential in an area and see the banks performance, product byproduct. Potential was now defined by Lifestage appropriateness and Risk/Credit worthiness. Banks could now address the exact locationswhere the potential was high yet the current presence was low.CRA was one application based upon FFIEC defined Geographies. HMDA issues where another application based upon Census countsby race concentrations. Both laws could now be quantitativelymeasured and defended by client banks.