Page 1
Consumer preferences for country‐of‐origin, geographical indication, and protected designation of origin labels
Luisa Menapace, Gregory Colson, Carola Grebitus, Maria Facendola
Working Paper No. 09021 November 2009
IOWA STATE UNIVERSITY Department of Economics Ames, Iowa, 50011‐1070
Iowa State University does not discriminate on the basis of race, color, age, religion, national origin, sexual orientation, gender identity, sex, marital status, disability, or status as a U.S. veteran. Inquiries can be directed to the Director of Equal Opportunity and Diversity, 3680 Beardshear Hall, (515) 294‐7612.
Page 2
1
“Consumer preferences for country-of-origin, geographical indication, and protected designation of origin labels”
Luisa Menapace Department of Economics
Iowa State University Ames, IA 50010
Tel: (515) 451-7012 Email: [email protected]
Gregory Colson Assistant Professor 314 Connor Hall
The University of Georgia Athens, GA 30602
Tel: (706) 583-0616 Email: [email protected]
Carola Grebitus Abteilung für Marktforschung der Agrar- und Ernährungswirtschaft
Institut für Lebensmittel- und Ressourcenökonomik Universität Bonn
Nussallee 21 53115 Bonn, Germany
Tel: +49 (0228) 73-3582 Email: [email protected]
Maria Facendola ISMEA
Direzione Mercati e Risk Management Analisi Economiche e Finanziarie
Settore Rating
The authors would like to thank GianCarlo Moschini for his helpful comments. Luisa
Menapace was supported in part by the U.S. Department of Agriculture through a
cooperative research project with Iowa State University.
Page 3
2
Consumer preferences for country-of-origin, geographical indication, and protected
designation of origin labels
Abstract
Motivated by the recognition that geography is often correlated with, or an important
determinant of, the overall quality of agricultural products, consumer groups, industry
representatives, and domestic and trade representatives have increasingly considered the
potential role of geographical origin labels as consumer information and marketing tools.
We investigate whether consumers recognize and value the informational content of a
variety of nested geographical origin labels. In particular, this study disentangles and
assesses three nested types of origin labels: country of origin (COOL), geographical
indications (GI), and PDO/PGI. We find that, within the context of a high quality value-
added commodity such as extra virgin olive oil, consumers' willingness to pay varies
across different countries of origin, and that within a country consumers have a greater
willingness to pay for GI-labeled than non-GI labeled products. We also find evidence
that consumers value PDOs more than PGIs, but the result is not as strong as that found
for GI versus non-GI. Overall, our findings support the recent surge in interest by both
developed and developing nations in reaching an agreement for stricter and more
widespread protection of GIs within ongoing WTO discussions and harnessing them as
marketing tools for expanding shares in export markets.
Key words: Consumer preferences, geographical indications, country of origin labels,
PDO, PGI, olive oil
Page 4
3
INTRODUCTION
The primary overarching economic motivation for product labels is to facilitate the
resolution of market failures associated with the supply of high-quality goods under
asymmetric information (e.g., Akerlof 1970). In the crowded, heterogeneous food
product space, information asymmetries are particularly problematic given the abundance
and importance of credence and experience attributes. As a result, food labeling is
viewed as a critical mechanism to help ensure consumers can correctly match with
products, enable producers to adapt production to meet consumer demands and
expectations, and promote social or political economy objectives (e.g., health outcomes,
growth in desirable sectors, increased exports).
One particular category of labels that has recently received extensive attention
among regulators and trade representatives are "geographical origin" labels (i.e., labels
that denote, with some degree of specificity, the location of origination of the end-
product, inputs, or production). Informing consumers of the origin of food products via
labeling is motivated by the recognition that geography is often correlated with a
product's overall quality or, in the stronger case, geography may even be a determinant of
a product's ultimate realized quality (i.e., the concept of terroir). Recently, interest in
geographic origin labeling for foods has been invigorated as a result of (1) an increased
demand by consumers for production and safety related information following a string of
food scares,1 (2) a surge in global culinary awareness and demand for foreign cuisine, and
(3) a movement of many nations away from traditional agricultural price supports
towards promotion of value-added and high quality products.
Page 5
4
Two types of origin labels, country of origin labels (COOL) and geographical
indications (GI), have received extensive attention in the economic and marketing
literature and are currently the subject of domestic and international policy debates.2 An
abundant economic and marketing literature has analyzed COOL as signals of a broadly
defined concept of product quality (i.e., the aggregation of many intrinsic and extrinsic
product attributes linked to origin).3 These variations in quality across countries are
determined in part by differences in the natural environmental and climatic conditions as
well as differences in national quality standards, production and processing technologies,
quality audit systems, etc. This feature has even led to the reference of COOL as
"country brands" (e.g., Unterschultz 1998; Gilmore 2002; Clemens and Babcock 2004).
Although geographical indications are similar to COOL, these two forms of origin
labeling differ in several regards which significantly impact their informational content
and potential value to both consumers and producers. Compared to COOL, GIs typically
denote a much smaller geographical area of origin like a town or region (e.g.,
Champagne, France or Pelee Island, Canada). Hence, GIs are capable of communicating
characteristics specific to a specialized area that are not necessarily reflected by the
country as a whole. As well, in contrast to COOL, for a geographic name to be
recognized and receive intellectual property (IP) protection as a GI, producers must
demonstrate the existence of a link between the characteristics of the geographic
environment of production and the quality of the product that seeks the GI status.
Furthermore, in order for eligible producers in the delineated region to use the GI, they
must adhere (subject to third-party inspection) to established production specifications,
Page 6
5
including input and processing requirements, that are unique to the GI and beyond those
of standard non-GI products. Finally, one further distinction exists for European GIs. In
the European GI system two distinct types of GIs are granted IP rights, Protected
Designation of Origin (PDO) and Protected Geographical Indication (PGI), that differ
depending upon how closely a product's quality is linked to geography. This distinction
introduces an additional level of quality differentiation among GI labeled products,
reserving the PDO status for the highest qualities (for more details on PDO vs. PGI see
Moschini, Menapace, and Pick 2008 and EU Regulation 2081/92).
Conceptually, to understand how these distinctions between different
geographical origin labels provide information to consumers, consider a purchase
situation in which a consumer faces a distribution of products over a spectrum of
qualities. From the prospective of a consumer that takes the product quality distribution
as exogenous, we can consider a purchase from a set of unlabelled (or generic) products
as a draw from an unconditional distribution that spans the entire quality range. Similarly,
a purchase of a product with a "geographical origin" label is a draw from a conditional
distribution, whereby the conditional distribution varies by type of label. For country-
specific products the distribution is over a sub-set of the quality spectrum and centered
around a country-specific mean (that could be above or below the unconditional mean).
The GI distribution is a sub-set of the country-specific distribution, consisting of qualities
above a truncation point determined by the GI's quality standards. Finally, PDOs are
clustered in the upper portion of the GI distribution. At each iteration (from COOL to GIs
to PDOs), the derived conditional distribution is characterized by a higher mean and a
Page 7
6
smaller variance. Based on this conceptual framework, geographical origin labels are
valuable to consumers for two reasons: (i) they provide a more precise indication of the
expected quality of a given product, thus improving the ability of the consumer to match
with a desired quality (valued by both risk neutral and risk averse consumers) and (ii)
they reduce the quality dispersion around the expected mean thereby reducing uncertainty
regarding the purchase (valued by risk averse consumers).
In this paper, we investigate whether consumers indeed value the informational
content of geographical origin labels. While several empirical studies have attempted to
quantify the value of specific GIs in isolation,4 our contribution is the first to consider
three nested levels of geographically-based quality differentiation (COOL, GIs, and
PDO/PGI). In order to disentangle and assess the value of these origin labels, a stated-
choice experiment was constructed and administered to a random sample of adult
Canadian consumers. The focus product, extra virgin olive oil, was selected because this
type of oil represents a value-added product for which COOL and GI labeling are a
potentially powerful information and marketing tool.
Our empirical findings correspond with the outlined theoretical framework of
geographical origin labels. We find that consumers' willingness to pay varies across
countries, and that within a country consumers have a greater willingness to pay for GI-
labeled than non-GI labeled products. We also find evidence that consumers value PDOs
more than PGIs, but the result is not as strong as that found for GI versus non-GI. As a
whole, our findings support the recent surge of interest by both developed and developing
nations in protecting GIs and harnessing them as a marketing tool for expanding shares in
Page 8
7
export markets.5 In particular our findings are supportive of recent shifts in EU
agricultural policy away from price support programs towards policy tools such as GIs
that promote food quality.6
In what follows we first briefly present background information on the focus
product, extra virgin olive oil. Then, we outline the choice experiment methodology
employed for assessing consumers' valuations for geographical origin labels. The core of
the article presents a discussion of the estimation results from a Bayesian mixed logit
model with correlated coefficients using the full sample and three sub-samples obtained
by partitioning consumers based on their purchasing location. Then, we conclude.
RESEARCHED PRODUCT
There are several different governing bodies that establish standards for different types of
olive oil. The International Standards under resolution COI/T.15/NC no. 3-25 (revised
June 2003) lists nine grades of olive oil in two primary categories, olive oil and olive
pomace oil. Extra virgin is the highest grade of olive oil. It is obtained solely from the
fruit of the olive tree (Olea europa L.) with a chemical-free process that involves only
pressure and is characterized by a natural level of low acidity (0.8%) (IOOC, 2007).
As a traditional component of the Mediterranean diet, olive oil consumption has
historically been significant in the Mediterranean countries. But, as this diet has gained
popularity worldwide, consumption has grown considerably in many countries including
Australia, Brazil, Canada, Japan, and the United States (global demand has risen at an
annual rate of about 5.3% since 1995/96 according to Türkekul et al., 2007). According
Page 9
8
to the International Olive Oil council, imports of olive oil in Canada and the United
States have increased from 64 million pounds in 1982 to 563 million pounds in 2005
(IOOC, 2006).
Global olive oil production is concentrated in the Mediterranean countries with
Italy, Greece, and Spain accounting for more than 70% of worldwide production.
Smaller producing countries include Morocco, Portugal, Syria, Turkey, and Tunisia.
Italy is the leader in the Canadian market, representing over 70% of total olive oil imports
to Canada (IOOC, 2006).
Several empirical studies, all of which were conducted in European countries,
have specifically considered consumer preferences for olive oil. Krystallis and Ness
(2005) find that GIs are relevant cues for several consumer segments in Greece. Freitas
Santos and Cadima Ribeiro (2005) find that Portuguese consumers are willing to pay up
to a 30% price premium for GI-labeled olive oil. Van der Lans et al. (2001) find for
Italian consumers of extra virgin olive oil that PDO labels influence preferences only
indirectly through perceived quality. Finally, a study by Scarpa and Del Giudice (2004)
on extra virgin olive oil in Italy finds that origin matters differently across cities and that
there is a bias in preferences towards local products.
EXPERIMENTAL PROCEDURE
The data for this study was collected via face-to-face interviews of consumers in the
Toronto area of Ontario, Canada. Choosing Canada, a country not involved in the
production chain of olive oil, has the advantage of preventing “domestic or home biases”
Page 10
9
effects on the results (Van Ittersum et al. 2007). Respondents were interviewed based on
a convenience sample with each interview lasting approximately 15 minutes. Participants
were screened for inclusion in the study based on two questions: whether they had (1)
purchased and (2) consumed olive oil in the previous six months and three months
respectively. Only those who answered positively to both questions qualified for the
study. Interviews were conducted during the course of a week at four food retail stores
including one gourmet store, two medium-sized grocery stores and a farmers market in
three different cities (Guelph, Hamilton, and Toronto). Different store types were chosen
to capture different consumer segments. A total of 207 individuals completed the full
interview process and provided complete responses. The interview consisted of several
sections including questions regarding the participants’ knowledge of the product and a
section collecting demographic information about the participants. Table 1 summarizes
participants’ socio-demographics.
Insert Table 1 here.
The core section of the interview consisted of a stated-choice experiment,
following standard procedures (Louviere, Hensher and Swait, 2000; Street and Burgess,
2007), in which the surveyed customers were shown sets of alternative product
descriptions and asked to select the one they would purchase. Specifically, in each of ten
product scenarios, each participant was asked to select between two different olive oils
and the “none-of-them” alternative, providing a total of 2070 responses. Each alternative
olive oil was defined by a full set of characteristics (full-profile) including price,
appearance, color, packaging size, production method (organic vs. non-organic), country
Page 11
10
of origin and GI-labels.7 Following van der Lans et al. (2001), color and appearance were
chosen as attributes describing olive oil visually. They are search quality attributes used
by consumers to evaluate the product before purchase (Nelson 1970, 1974). Specifically,
two colors (green, yellow) and two types of appearances (opaque, non-opaque) were
included. Three bottle sizes (0.5 lt., 0.75 lt. and 1 lt.) were also included. Based on the
actual price range of extra virgin olive oils in the Canadian market, a minimum and
maximum price level were identified. While usually the price spread should not be too
large (Green and Srinivasan, 1978), because of the presence of both conventional and
organic olive oils, GI and non-GI labeled olive oils, as well as different bottle sizes, a
price spread from 7 to 35 CAD $ was considered.8
With regard to credence attributes, we included two production methods (organic
and non-organic) and several COOL and GI labels. COOL labels included oils from the
three main olive oil producer countries: Greece, Italy and Spain. GI-labels included three
Italian GI oils: Terra di Bari PDO, Garda PDO and Tuscany PGI. As our study includes
several attributes and levels, we employed a fractional factorial design to define the set of
alternatives used in the experiment applying the SAS macro as described in Kuhfeld
(2001).
A MIXED LOGIT MODEL OF CONSUMERS' CHOICES
Consumers’ choices of olive oils are modeled utilizing a random utility based discrete
choice model, the multinomial mixed logit (MXL) with random and correlated
coefficients. The MXL model is selected because, unlike the fixed coefficient
Page 12
11
multinomial logit (and related variants), it allows for taste heterogeneity unconditional on
socio-economic covariates. Previous studies have shown that taste variation is only
partially linked to, and poorly explained by, demographics such as age, education,
gender, and income (Baker and Burnham 2001; West et al. 2003). Moreover, as Scarpa
and Del Gudice (2004) note, a correlation structure across tastes for different attributes is
typically present in the case of gourmet foods (such as extra virgin olive oil). This
supports consideration of a correlated, over independent, distribution of taste parameters.
Model specification and estimation
Each of the study participants, i (i=1,…, N; N=207), faced ten choice situations (t=1,…,
T; T=10). At each choice situation, the consumer was presented with a set of alternatives.
Each set contained three elements: two olive oils and the “none-of-them” alternative. In
total, there were twenty-one alternatives, indexed by j (j=1,…, J; J=21), including twenty
olive oils and the “none-of-them” option. Let tJ represent the set of alternatives at choice
situation t. The utility of person i from alternative j, in choice situation t is specified as
ijtijtijt VU ε+= where
( )ijt Oi j Ai j Yi j Ii j Ki j Gi j j Ni j P jV O A Y I K G Size N pβ β β β β β β β= + + + + + + + Equation (1)
where ijtε is distributed iid extreme value over individuals, alternatives and time, jp is the
price in CAD$ of alternative j and jSizeis the size of the bottle in liters. All remaining
variables are dummies and described in table 2. In addition to the dummies capturing the
olive oil attributes (organic, appearance, country-of-origin and GI labels), we included
Page 13
12
one dummy variable capturing the “none-of-them” alternative (Hu, Veeman and
Adamowicz 2005).
The utility specification, where size multiplies the attributes’ dummies, implies a
proportional increase in utility with an increase in size for all olive oil attributes (Alfnes
et al. 2006). To investigate the effect of bottle size per se on consumer choices, we also
test an alternative utility specification that includes size as an additional explanatory
variable but rejected the model via a likelihood ratio test. In addition to the main model
in (1) we estimated two alternative models that differ with regards to their classification
of the GI variable, as summarized in table 2.
Insert Table 2 here.
Let iTii yyy ,...,1= denote individual i’s sequence of choices. Conditional on
, ,{ ,..., }i O i N iβ β β= , and given the independent error structure, the probability of i’s
sequence of choices is equal to
∏∑= ∈
=
T
t Jj
V
V
i
t
ijt
titiy
e
eyL
1
)|( β Equation (2)
which corresponds to a product of logits. The unconditional probability of individual i’s
sequence of choices is the integral of the expression )|( βiyL over β ,
∫= βββ dWbfyLWbyL ii ),|()|(),|( , where ),|( Wbf β is the multivariate distribution
of the parameters. Summing the logarithm of the unconditional probabilities gives the
log-likelihood function, ∑i i WbyL ),|(ln . We assume a fixed price coefficient and
Page 14
13
multivariate normally distributed coefficients for the remaining variables in the model
(Bonnet and Simioni 2001; Scarpa and Del Giudice 2004). The normal distribution,
having support on both the negative and positive range, implies that some consumers like
and some consumers dislike the considered attributes.
Parameter estimates forPβ , b and W can be obtained by simulated maximum
likelihood methods or via a hierarchical Bayesian procedure following the approach
developed by Allenby (1997) and generalized by Train (2001). We use the second
method.9 Specifically, we estimate the mixed logit model using Matlab code written by
Train for panel data with correlated coefficients based on hierarchical Bayes.10 The
Bayesian approach has been used in previous studies of consumers’ preferences for food
products (e.g., Hu et al. 2006).
EMPIRICAL RESULTS
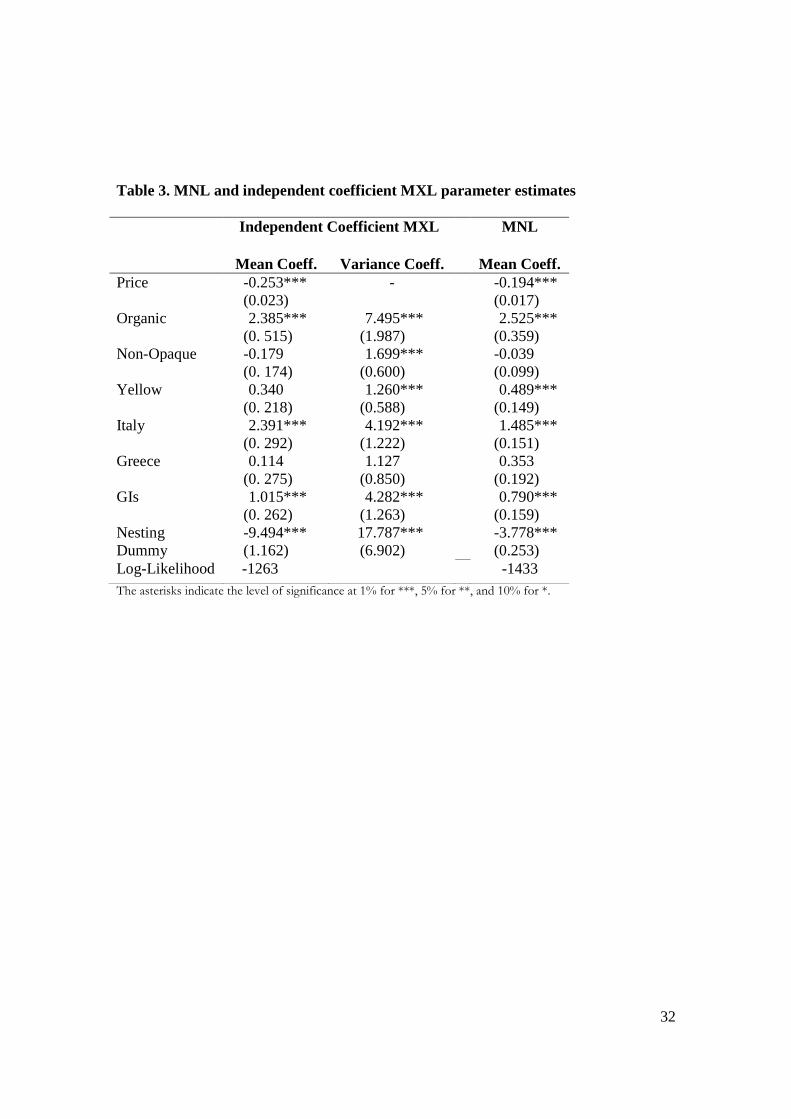
As a baseline set of estimates, Table 3 presents results for the fixed coefficient
multinomial logit and MXL with random (normal) independent coefficients for the utility
specification in (1).
Insert Table 3 here.
Based on the likelihood ratio test we reject both models in favor of the MXL
model with random correlated coefficients that is presented in Table 4 (model 1).
Insert Table 4 here.
Page 15
14
Table 4 also presents estimates for two alternative models that differ with regards
to their classification of the GI variable(s).11 In the base model (model 1), a single
dummy variable “GIs” is included (equal to 1 for PDO Terra di Bari, PDO Garda or PGI
Tuscany oils). In model 2, two dummy variables are used to separate the two types of
GIs, PDO and PGI (one dummy equal to 1 for PGI Tuscany and one dummy equal to 1
for PDO Terra di Bari or PDO Garda oils). Finally, model 3 includes three dummy
variables, one for each of the considered GI labels (Tuscany, Terra di Bari and Garda).
In all three models price is negative and statistically different from zero as one
would expect. With regard to COOL, in each of the three models the posterior mean for
the Italy coefficient is found to be positive and statistically different from zero. The
estimates reveal that Canadian consumers (81-86% depending upon the model) prefer
Italian olive oils over Spanish oils and are willing to pay a considerable premium
(ranging from 7.68 to 9.48 CAD$/Liter) for Italian oils.12 As well, the variance
coefficient for Italy is found to be significant and sizable indicating that consumers are
heterogeneous in their preferences for Italian oils. The posterior mean of the Greece
coefficient is not found to be significant indicating that the sample of Canadian
consumers does not prefer Greek over Spanish oils or vice versa.
In model 1, the coefficient for the single included GI dummy variable is positive
and significant indicating that consumers respond to and are willing to pay a premium for
GI olive oils. But, when comparing the estimates for Italian labels and GI labels, an
interesting result emerges. For both types of oils, Italian and Italian GI, a large percentage
of consumers are estimated to have a positive preference, but the percentage is greater for
Page 16
15
Italian oils over GI oils (86% versus 70%). As well, the average WTP for Italian oils is
twice that of the GI oils (9.48 versus 4.74 CAD$/Liter). This indicates that, while
consumers are willing to pay a premium for Italian COOL and GI labels, the country-of-
origin label captures much of the premium. This result is found to be consistent across the
three models.
To test the hypothesis that consumers value PDO more than PGI, in model 2
dummy variables are included to separate the PGI (Tuscany PGI) from the PDO labels
(Terra di Bari PDO and Garda PDO). Consistent with expectations, we find that
consumers are willing to pay slightly more on average for the PDO than for the PGI oils
(5.66 versus 4.48 CAD$/Liter). While this result provides evidence that PDOs are
considered superior to PGIs (in fact, PDOs require a stronger geography-quality link in
order to obtain certification than PGI), particularly given that the PGI used in this study is
from a well-known tourist region associated with fine food products while the PDOs are
from lesser known regions, it presents only part of the picture. We also find that for the
PDOs, the estimated variance coefficient is quite large indicating sizable heterogeneity
among the sample’s preferences for these GIs. As well, the estimated share of consumers
with positive preferences is only slightly more than half (57%). Conversely, for the
Tuscan GI, the variance is magnitudes less and a larger share has positive preferences
(76%). These results combined indicate that Tuscany is a more recognizable and widely
valued GI, even though the premium consumers are willing to pay is lower than for the
less recognized, but higher geography-quality linked, PDO oils.
Page 17
16
Of the other considered attributes, neither of the two appearance features (opaque
vs. non-opaque and yellow vs. green) are found to play a significant role in determining
consumers’ choices of oils. This falls in line with expectations that visual attributes of
olive oils are not reliable cues for quality.13
The estimates across the three models provide strong evidence that consumers
have favorable views of organic olive oils. In models 1 and 2 the estimated percentage of
consumers with positive preferences for organic olive oils is 77% and 91% respectively.
These results straddle the findings by Scarpa and Del Giudice (2004) that about 80% of
their sample of Italian consumers prefer organic olive oils. For the two models, we
estimate that consumers are willing to pay a sizable premium for organic olive oils of
between 8.30 and 8.42 CAD$/Liter.
Taste variation based on consumer shopping location
While the results presented in the previous section provide strong evidence that
consumers value both COOL and GI labels (with a greater value for the former), the
models also indicate that there is significant taste heterogeneity among individuals. In
lieu of considering commonly available socio-economic attributes (e.g., gender or age),
which have been shown to be poor explanatory variables for taste heterogeneity, we
consider differences in preferences based upon consumer shopping locations. Under the
assumption that attributes unobserved by the researcher result in consumer self-selection
in terms of their shopping locale, we can exploit this to compare preferences across
consumer segments.
Page 18
17
As discussed in the experimental procedure section, the sample for this study was
drawn from three store types: supermarkets, gourmet stores, and farmers markets. One
would expect preferences and unobserved individual level attributes to be related to
consumers’ selection of their primary shopping markets. For example, one might
postulate that an individual who chooses to shop at a gourmet store would have a greater
preference for ethnic or traditional products. As well, one might expect that individuals
who choose to shop at farmers markets would have stronger preferences for natural, local
and fresh foods when compared to shoppers at other locations.
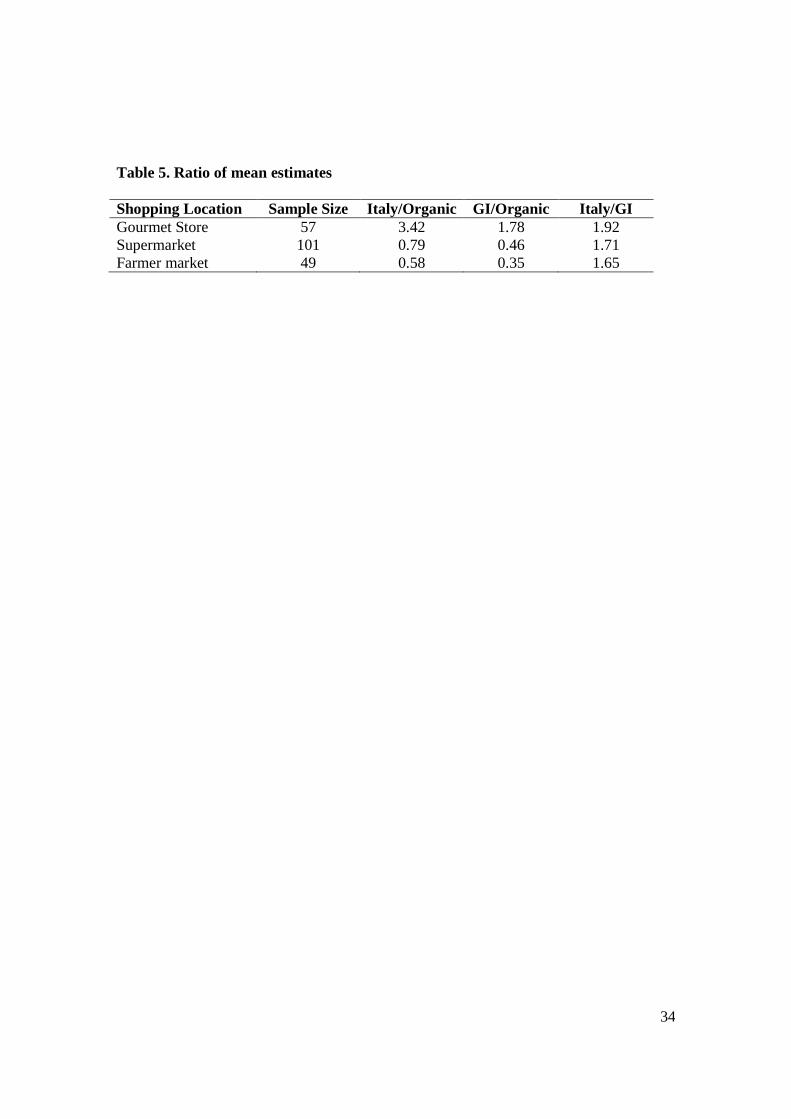
To compare estimates across shopping locations, model 1 from the previous
section was re-estimated using data from three sub-samples of consumers partitioned
based upon their interview location. Table 5 presents, for each of the shopping locations,
the ratio of the estimated posterior means for three measures comparing relative
valuations: Italy COOL / Organic, GI / Organic, and Italy COOL / GI.
Insert Table 5 here.
From the ratios presented in table 5, it is evident that there are significant
differences in preferences across the three shopping location sub-samples. Ceteris
paribus, gourmet store patrons prefer Italian over organic olive oils by a significant factor
of 3.42. Conversely, for supermarket and farmers market shoppers, the ratios are less
than one indicating that they prefer organic over Italian oils. When considering GI versus
organic olive oil, the picture is similar with gourmet store patrons preferring the former
and supermarket and farmer market patrons preferring the latter. Interestingly, the
relative preference for Italy versus GI is fairly similar across the three shopping locations
Page 19
18
and ranges from a factor of 1.65 to 1.92. This indicates that preference for Italy COOL
over Italy GI labels is consistent across consumers in different shopping segments. As a
whole, the results presented in table 5 tend to support the hypothesis that consumers who
self-select in terms of their shopping location do have varying preferences. But the
greatest variation is found to be between gourmet and non-gourmet shoppers in terms of
their relative valuations for geographical origin labeled olive oils and organic olive oils.
CONCLUSIONS
Motivated by the recognition that geography is often correlated with, or an important
determinant of, the overall quality of agricultural products, regulators, consumer groups,
and industry representatives have increasingly considered the potential role of
geographical origin labels as consumer information and marketing tools. In this article
we investigate whether consumers indeed recognize and value the informational content
of a variety of nested geographical origin labels. In particular, this study has
disentangled three nested forms of geographical origin labels.
Our findings are consistent with the outlined theoretical framework. We find that,
within the context of a high quality value-added commodity such as extra virgin olive oil,
consumers' willingness to pay varies, ceteris paribus, across countries, and that within a
country consumers have a greater willingness to pay for GI-labeled than non-GI labeled
products. We also find evidence that consumers value PDOs more than PGIs, but the
result is not as strong as that found for GI versus non-GI. Finally, to better account for
Page 20
19
taste heterogeneity among consumers, we partition the sample on the basis of consumers'
choice of shopping location and find that different consumer groups vary to a large
degree in their valuations for COOL, GI, and organic olive oils.
As a whole, our findings are consistent with the hypothesis that geographical
origin labels are valued by consumers for their ability to provide information regarding
the quality of the product and that the value is increasing with the informational content.
Nevertheless, as the data show, the additional premia for GIs and PDO are relatively
smaller than the premium for COOL, indicating that there might be decreasing returns to
geographical labeling. Therefore, given that pursuing and receiving protected
geographical indication status and meeting the required standards is not without cost,
producers considering further geographical differentiation of their products beyond the
country of origin level should interpret our findings with caution.
Page 21
20
Footnotes 1 Examples include bovine spongiform encephalopathy (BSE), E-coli, Salmonella,
botulism, and harmful bacteria.
2 For country of origin, the debate is largely between advocates who argue that
mandatory COOL requirements would provide vital information to consumers regarding
safety and opponents who assert that it imposes unnecessary or costly regulatory burdens
on producers and retailers which ultimately hurt consumers. Additionally, opponents
contend that COOL requirements effectively impose new non-tariff trade barriers that
hamper international trade (e.g., see Rude, Iqbal, and Brewin 2006). For geographical
indications, the debate regards the conflicting forms of cross-country legal protection for
GIs and the level of exclusiveness reserved to GI names (Josling 2006).
3 The empirical literature on COOL has grown to be quite large. Recent works focusing
on agriculture include Loureiro and Umberger (2003), Alfnes and Rickertsen (2003),
Umberger (2004), Tonsor, Schroeder, and Fox (2005), Carter, Krissoff and Peterson
Zwane (2006), and Chung, Boyer and Han (2009). For reviews of works outside of the
agricultural product space see Bilkey and Nes (1982) and Verlegh and Steenkamp (1999).
4 See for example Bonnet and Simioni (2001), van der Lans et al. (2001), Scarpa and Del
Giudice (2004), Santos and Ribeiro (2005), and Krystallis and Ness (2005). For an
overview of empirical studies see Réquillart (2007).
5 The so-called “friends of geographical indications” consists of a group of WTO member
countries that includes the European Union, Guinea, India, Jamaica, Kenya, Kyrgyz
Republic, Macedonia, Madagascar, Morocco, Pakistan, Sri Lanka, Switzerland, Tanzania,
Page 22
21
Thailand and Turkey (see the Intellectual Property Watch’s website at http://www.ip-
watch.org).
6 The EU and member States have been at the forefront in investing substantial resources
to sponsor the GI certification system and to promote specific GIs in international
markets, including the United States, Russia and China (see e.g., the Italian ministry of
Agriculture’ website at http://www.agricolturaitalianaonline.gov.it). However, while the
EU may have a longer history with GIs, other countries are introducing or expanding
their own GI systems and promotion programs. Examples include China (Xiaobing and
Kireeva 2007), India (Rao 2006), South Korea (Suh and MacPherson 2007), Colombia
(Teuber 2007). Kenya and Switzerland have an ongoing project aimed at developing a GI
system of protection in Kenya and at raising awareness on GIs in the East African
Community member states (see the Swiss Institute of Intellectual Property’s website at
https://www.ige.ch/en.html).
7 Profiles are characterized by unbalanced levels. Related studies (Van der Lans et al.
2001; Scarpa and Del Giudice 2004) also rely upon unbalanced profiles.
8 For example, organic olive oils in Spain capture a price premium varying from 30-35%
for loose oil to 100% for bottled oil (Medicamento and De Gennaro 2006).
9 For readers who may be less familiar with Bayesian methods, the Bernstein-von Misen
theorem guarantees that the estimators resulting from the Bayesian procedure has the
same properties as the large sample maximum likelihood estimator. “The researcher can
therefore use the Bayesian procedures to obtain parameter estimates and then interpret
Page 23
22
them as if they were maximum likelihood estimates” (Train 2003 Ch. 12 p. 287), where
“…the mean of the posterior provides the point estimate and the standard deviation of the
posterior provides the standard error” (Train 2003 Ch. 12 p. 294).
10 Available at Train's webpage http://elsa.berkeley.edu/~train/software.html.
11 Estimates of the variance-covariance matrix for the three models are available upon
request from the authors.
12 This corresponds with the “informal notion” that Italy enjoys an unrivaled international
reputation for olive oil (Lusk et al. 2006; Anania and Pupo D’Andrea 2007).
13 The appearance (opaque vs. non-opaque) and the color of olive oil widely depend on
the olives’ variety and the transformation techniques (settling and filtration) and are
generally not reliable indications of the quality of olive oil.
Page 24
23
References
Alfnes, F., A.G. Guttormsen, G. Steine, and K. Kolstad. 2006. Consumers’
Willingness to Pay for the Color of Salmon: a Choice Experiment with Real
Economic Incentives. American Journal of Agricultural Economics 88(4):1050-
1061.
Alfnes, F., and K. Rickertsen. 2003. European Consumers' Willingness to Pay for U.S.
Beef in Experimental Auction Markets. American Journal of Agricultural
Economics 85(2):396-405.
Allenby, G. 1997. An introduction to hierarchical Bayesian modeling. Tutorial Notes,
Advanced Research Techniques Forum, American Marketing Association.
Akerlof, G.A. 1970. The Market for Lemons: Quality Uncertainty and the Market
Mechanism. Quarterly Journal of Economics 84: 488-500.
Anania, G. and M. R. Pupo D’Andrea. 2007. The global market for olive oil: actors,
trends, prospects and research needs. Paper prepared for presentation at the I
Mediterranean Conference of Agro-Food Social Scientists, 103rd EAAE Seminar
“Adding Value to the Agro-Food Supply Chain in the Future Euro-Mediterranean
Space.” Barcelona, Spain, April 23rd - 25th, 2007.
Baker, G.A. and T.A. Burnham. 2001. Consumer Response to Genetically Modified
Foods: Market Segment Analysis and Implications for Producers and Policy
Makers. Journal of Agricultural and Resource Economics 26:387-403.
Bech, M. and D. Gyrd-Hansen. 2005. Effects coding in discrete choice experiments.
Health Economics 14:1079-1083.
Page 25
24
Bilkey, W.J. and E. Nes. 1982. Country-of-origin effects on product evaluations. Journal
of International Business Studies 8(Spring/Summer):89-99.
Bonnet, C. and M. Simioni. 2001. Assessing consumer response to protected
designation of origin labeling: a mixed multinomial logit approach. European
Review of Agricultural Economics 28 (4) 433-449.
Carter, C., B. Krissof and A. Peterson Zwane. 2006. Can Country-of-Origin Labeling
Succeed as a Marketing Tool for Produce? Lessons from Three Case Studies.
Canadian Journal of Agricultural Economics, 54:513-530.
Chung, C.,T. Boyer and S. Han. 2009. Valuing Quality Attributes and Country of
Origin in the Korean Beef Market. Journal of Agricultural Economics, 60 (3):682-
698.
Clemens, R. and B.A. Babcock. 2004. Country of Origin as a Brand: The Case of New
Zealand Lamb. MATRIC Briefing Paper 04-MBP 9 November 2004.
Gilmore F. 2002. A country - can it be repositioned? Spain - the success story of country
branding. Journal of Brand Management 9(4/5):281-293.
Green, P.E. and V. Srinivasan. 1978. Conjoint Analysis in Consumer Research: Issues
and Outlook. Journal of Consumer Research 5 (September):103-23.
Hu, W., M.M. Veeman and W.L. Adamowicz. 2005. Labelling Genetically Modified
Food: Heterogeneous Consumer Preferences and the Value of Information.
Canadian Journal of Agricultural Economics 53(1):83-102.
Page 26
25
Hu, W., M.M. Veeman, W.L. Adamowicz and G. Gao. 2006. Consumers’ Food
Choices with Voluntary Access to Genetic Modification Information. Canadian
Journal of Agricultural Economics 54(4):585-604.
IOOC. 2006. International Olive Oil Council, http://www.internationaloliveoil.org,
August 1st, 2006.
IOOC. 2007. International Olive Oil Council, http://www.internationaloliveoil.org/web
/aa-ingles/oliveWorld/aceite.html, December, 5th, 2007.
Josling, T. 2006. The War on Terroir: Geographical Indications as a Transatlantic Trade
Conflict. Journal of Agricultural Economics 57:337-363.
Krystallis, A. and M. Ness. 2005. Consumer Preferences for Quality Foods from a South
European Perspective: A Conjoint Analysis Implementation on Greek Olive Oil.
International Food and Agribusiness Management Review, 8 (2): 62-91.
Kuhfeld, W.F. 2001. Multinomial Logit, Discrete Choice Modeling: An Introduction to
Designing Choice Experiments, and Collecting, Processing, and Analyzing
Choice Data with SAS. TS-643. SAS Institute Inc., Cary, NC, USA.
Lence, S.H., S. Marette, D. Hayes, and W. Foster. 2007. Collective Marketing
Arrangements for Geographically Differentiated Agricultural Products: Welfare
Impacts and Policy Implications. American Journal of Agricultural Economics
89:947–963.
Loureiro, M.L., and J.J. McCluskey. 2000. Assessing Consumer Response to Protected
Geographical Indication Labeling. Agribusiness 16(3): 309-320.
Page 27
26
Loureiro, M.L., and W.J. Umberger. 2003. Estimating Consumer Willingness to Pay
for Country-of-Origin Labeling. Journal of Agricultural and Resource Economics
28: 287-301.
Louviere, J.J., D.A. Hensher and J.F. Swait. 2000. Stated Choice Methods and
Analysis. Cambridge: Cambridge University Press.
Lusk, J.L., J. Brown, T. Mark, I. Proseku, R. Thompson, and J. Welsh. 2006.
Consumer Behavior, Public Policy, and Country-of-Origin Labeling. Review of
Agricultural Economics 28(2): 284–292.
Medicamento, U. and B. De Gennaro. 2006. Social Networks and Supply chain
Management in Rural Areas: A Case Study Focusing on Organic Olive Oil. Poster
paper prepared for presentation at the International Association of Agricultural
Economists Conference, Gold Coast, Australia, August 12-18, 2006.
Moschini, G.C., L. Menapace and D. Pick. 2008. Geographical Indications and the
Competitive Provision of Quality in Agricultural Markets. American Journal of
Agricultural Economics 90:794-812.
Nelson, P. 1970. Information and Consumer Behaviour. Journal of Political Economy
78:311-329.
Nelson, P. 1974. Advertising as information. Journal of Political Economy 82:729-754.
Rao, S.S. 2006. Indigenous knowledge organization: An Indian scenario. International
Journal of Information Management 26:224–233.
Réquillart, V. 2007. On the Economics of Geographical Indications in the EU. Paper
presented at the workshop “Geographical Indications, Country of Origin and
Page 28
27
Collective Brands: Firm Strategies and Public Policies. Toulouse, June 14-15,
2007.
Rude, J., J. Iqbal and D. Brewin. 2006. This Little Piggy Went to Market with a
Passport: The Impacts of U.S. Country of Origin Labeling on the Canadian Pork
Sector. Canadian Journal of Agricultural Economics 54:401–420.
Santos, J.F. and J.C Ribeiro. 2005. Product attribute saliency and region of origin:
Some empirical evidence from Portugal. Paper prepared for presentation at the
99th seminar of the EAAE (European Association of Agricultural Economists),
“The Future of Rural Europe in the Global Agri-Food System.” Copenhagen,
Denmark, August 24-27, 2005.
Scarpa, R. and T. Del Giudice. 2004. Market segmentation via Mixed Logit: Extra-
Virgin Olive Oil in Urban Italy. Journal of Agricultural and Food Industrial
Organization 2(7). Available at: http://www.bepress.com/jafio/vol2/iss1/art7.
Street, D.J., and L. Burgess. 2007. The Construction of Optimal Stated Choice
Experiments. New York: Wiley.
Suh, J., and A. MacPherson. 2007. The impact of geographical indication on the
revitalisation of a regional economy: a case study of ‘Boseong’ green tea. Area
39(4):518-527.
Teuber, R. 2010. Geographical Indications of Origin as a Tool of Product Differentiation
– The Case of Coffee. Journal of International Food and Agribusiness Marketing,
forthcoming.
Page 29
28
Tonsor, G.T., T.C. Schroeder, and J.A. Fox. 2005. European Preferences for Beef
Steak Attributes. Journal of Agricultural and Resource Economics 30(2):367-380.
Train, K.E. 2001. A comparison of hierarchical Bayes and maximum simulated
likelihood for mixed logit. Working Paper, Department of Economics, University
of California, Berkeley.
Train, K.E. 2003. Discrete Choice Methods with Simulation. Cambridge, MA:
Cambridge University press.
Türkekul, B., C. Günden, C. Abay, and B. Miran. 2007. A Market Share Analysis of
Virgin Olive Oil Producer Countries with special respect to Competitiveness.
Paper prepared for presentation at the I Mediterranean Conference of Agro-Food
Social Scientists. 103rd EAAE Seminar “Adding Value to the Agro-Food Supply
Chain in the Future Euromediterranean Space.” Barcelona, Spain, April 23 - 25,
2007.
Umberger, W.J., D.M. Feuz, C. R. Calkins and B.M. Sitz. 2003. Country of Origin
Label of beef products: U.S. Consumers’ Perceptions. Journal of Food
Distribution Research 34(3):103-116.
Unterschultz, J., K.K. Quagrainie, M. Veeman and R.B. Kim. 1998. South Korean
Hotel Meat Buyers’ Perceptions of Australian, Canadian and U.S. Beef Canadian.
Journal of Agricultural Economics 46:53–68.
Van der Lans, I.A., K. van Ittersum, A. De Cicco and M. Loseby. 2001. The role of
the region of origin and EU certificates of origin in consumer evaluation of food
products. European Review of Agricultural Economics, 28(4):451-477.
Page 30
29
Verlegh, P.W.J. and J-B.E.M. Steenkamp. 1999. A review and meta-analysis of
country-of-origin research. Journal of Economic Psychology 20(5):521-546.
Van Ittersum, K., M.T.G. Meulenberg, H.C.M van TRij p and M.J.J.M Candel.
2007. Consumers’ Appreciation of Regional Certification Labels: A Pan-
European Study. Journal of Agricultural Economics 58(1):1-23.
West, G.E., B. Laruce, C. Gendron and S.L. Scott. 2003. Consumer Confusion over
the Significance of Meat Attributes: The Case of Veal. Journal of Consumer
Policy 25:65-88.
Xiaobing, W. and I. Kireeva. 2007. Protection of Geographical Indications in China:
Conflicts, Causes and Solutions. The Journal of World Intellectual Property 10(2):
79–96.
Zago, M.A., and D. Pick. 2004. Labeling Policies in Food Markets: Private Incentives,
Public Intervention, and Welfare Effects. Journal of Agricultural and Resource
Economics 29(1): 150-165.
Page 31
30
Table 1. Socio-economic characteristics of sample
Variable Variable Definition Count % of Sample Gender Male
Female 83 124
40 60
Age in years 19 – 34 35 – 50 51 – 60 Older than 60
38 82 49 38
18 40 24 18
Education Primary / Secondary Undergraduate Graduate
51 113 43
24 55 21
Income Less than CAD $ 49,999 CAD $ 50,000 – 99,999 More than CAD $ 100,000 No Answer
40 86 52 30
19 42 25 14
Household Size 1 Person 2 Persons 3 Persons 4 Persons More than 4 Persons
46 82 34 34 11
22 39 17 17 5
Page 32
31
Table 2. Summary of other variables used in the analysis
Variable Variable Definition O 1 if organic A 1 if non-opaque, 0 if opaque Y 1 if yellow, 0 if green Ia 1 if Italian oil Ka N
1 if Greek oil 1 if "none-of-them"
Model 1 Model 2 Model 3 GI Variable Definition
G 1 if any GI (Tuscany, Terra di Bari, Garda) PGI 1 if PGI Tuscany PDO 1 if PDO Terra di Bari or PDO Garda T 1 if PGI Tuscany B 1 if PDO Terra di Bari R 1 if PDO Garda
a An indicator for Spanish olive oil is omitted.
Page 33
32
Table 3. MNL and independent coefficient MXL parameter estimates Independent Coefficient MXL
MNL
Mean Coeff. Variance Coeff. Mean Coeff. Price -0.253***
(0.023) - -0.194***
(0.017) Organic 2.385***
(0. 515) 7.495***
(1.987) 2.525***
(0.359) Non-Opaque -0.179
(0. 174) 1.699***
(0.600) -0.039
(0.099) Yellow 0.340
(0. 218) 1.260***
(0.588) 0.489***
(0.149) Italy 2.391***
(0. 292) 4.192***
(1.222) 1.485***
(0.151) Greece 0.114
(0. 275) 1.127
(0.850) 0.353
(0.192) GIs 1.015***
(0. 262) 4.282***
(1.263) 0.790***
(0.159) Nesting Dummy
-9.494*** (1.162)
17.787*** (6.902)
-3.778*** (0.253)
Log-Likelihood -1263 -1433 The asterisks indicate the level of significance at 1% for ***, 5% for **, and 10% for *.
Page 34
33
Table 4. Parameters estimates of Mixed Logit Models with random correlated coefficients
Model 1 Model 2 Model 3
Mean Coeff.
Variance Coeff.
S>0a
WTPb
Mean Coeff.
Variance Coeff.
S>0a
WTPb
Mean Coeff.
Variance Coeff.
S>0a
WTPb
Price -0.306*** (0.029)
- - - -0.373*** (0.046)
- - - -0.393*** (0.053)
- - -
Organic 2.576*** (0.617)
5.227*** (2.064)
77% 8.42 3.096*** (0.638)
4.967* (2.584)
91% 8.30 5.187*** (0.983)
7.043*** (2.726)
97% 13.20
Non-Opaque 0.041 (0.245)
2.977*** (0.858)
67% 0.13 -0.202 (0.543)
6.710*** (2.074)
67% -0.54 0.486 (0.630)
6.139*** (2.213)
53% 1.24
Yellow 0.000 (0.303)
3.089*** (1.048)
51% 0.00 0.054 (0.367)
5.074*** (1.644)
64% 0.14 1.009* (0.490)
4.784*** (1.659)
67% 2.57
Italy 2.899*** (0.415)
9.558*** (2.951)
86% 9.48 2.915*** (0.449)
10.750*** (3.231)
85% 7.81 3.017*** (0.596)
11.801*** (3.786)
81% 7.68
Greece 0.368 (0.395)
5.826*** (2.120)
60% 1.20 0.016 (0.412)
6.489*** (2.353)
54% 0.04 0.128 (0.442)
8.355*** (3.197)
52% 0.33
GIs 1.451*** (0.284)
3.955*** (1.263)
70% 4.74 - - - - - - - -
PGI Tuscany - - - -
1.669*** (0.296)
3.321*** (1.209)
76% 4.48 1.612*** (0.327)
3.499*** (1.255)
78% 4.10
Other GIs c - - - -
2.109* (1.278)
20.611*** (7.045)
57% 5.66 - - - -
PDO Terra di Bari - - - -
- - - -
-0.769 (1.825)
17.963 (12.500)
82% -1.96
PDO Garda - - - -
- - - -
1.535 (1.533)
30.083* (14.506)
60% 3.91
None-of-Them -9.185*** (1.070)
24.452*** (7.771)
- - -10.904***
(1.857) 38.647*** (16.217)
- - -8.673***
(2.059) 24.336 (15.836)
96% -
Log-Likelihood -1232 -1215 -1204
The asterisks indicate the level of significance at 1% for ***, 5% for **, and 10% for *. a S > 0 denotes share of consumers with positive preferences. b Willingness to pay is measured in Canadian dollars per Liter. c Other GI denotes a PDO Terra di Bari or PDO Garda olive oil (i.e. not a Tuscan GI)
Page 35
34
Table 5. Ratio of mean estimates
Shopping Location Sample Size Italy/Organic GI/Organic Italy/GI Gourmet Store 57 3.42 1.78 1.92 Supermarket 101 0.79 0.46 1.71 Farmer market 49 0.58 0.35 1.65