2.6 0.6 Weighted median 2.5 0.4 Trimmed mean 2.2 0.1 All groups CPI, seasonally adjusted CPI analytical series 1.2 0.6 Insurance and financial services 5.2 0.1 Education 1.9 0.6 Recreation and culture –1.8 –1.4 Communication 0.2 –0.1 Transport 4.7 –0.2 Health 0.4 0.4 Furnishings, household equipment and services 2.3 0.5 Housing –2.7 –1.0 Clothing and footwear 7.3 1.1 Alcohol and tobacco 3.5 1.2 Food and non–alcoholic beverages 2.3 0.5 All groups CPI % change % change Sep Qtr 2013 to Sep Qtr 2014 Jun Qtr 2014 to Sep Qtr 2014 W EIGHTED AVERAGE OF EIGH T CAPITAL CITIES KEY FIGURES THE ALL GROUPS CPI rose 0.5% in the September quarter 2014, compared with a rise of 0.5% in the June quarter 2014. rose 2.3% through the year to the September quarter 2014, compared with a rise of 3.0% through the year to the June quarter 2014. OVERVIEW OF CPI MOVEMENTS The most significant price rises this quarter were for fruit (+14.7%), new dwelling purchase by owner-occupiers (+1.1%), property rates and charges (+6.3%) and other services in respect of motor vehicles (+5.8%). The most significant offsetting price falls this quarter were for electricity (–5.1%) and automotive fuel (–2.5%). KEY POINTS E M B A R G O : 1 1 . 3 0 A M ( C A N B E R R A T I M E ) W E D 2 2 O C T 2 0 1 4 CONSUMER PRICE INDEX AUSTRALIA 6401.0 S E P T E M B E R Q U A R T E R 2 0 1 4 For further information about these and related statistics, contact the National Information and Referral Service on 1300 135 070. All Groups CPI Quarterly change Sep 2005 Sep 2008 Sep 2011 Sep 2014 % –0.5 0 0.5 1.0 1.5 2.0 Contribution to quarterly change All groups CPI F. & n–a.b. A. & t. C. & f. Housing F.,h.e & s. Health Transp. Comm. R. & c. Educ. I. & f.s. –0.2 0 0.2 0.4 0.6 0.8 Index points INQUIRIES www.abs.gov.au
Transcript
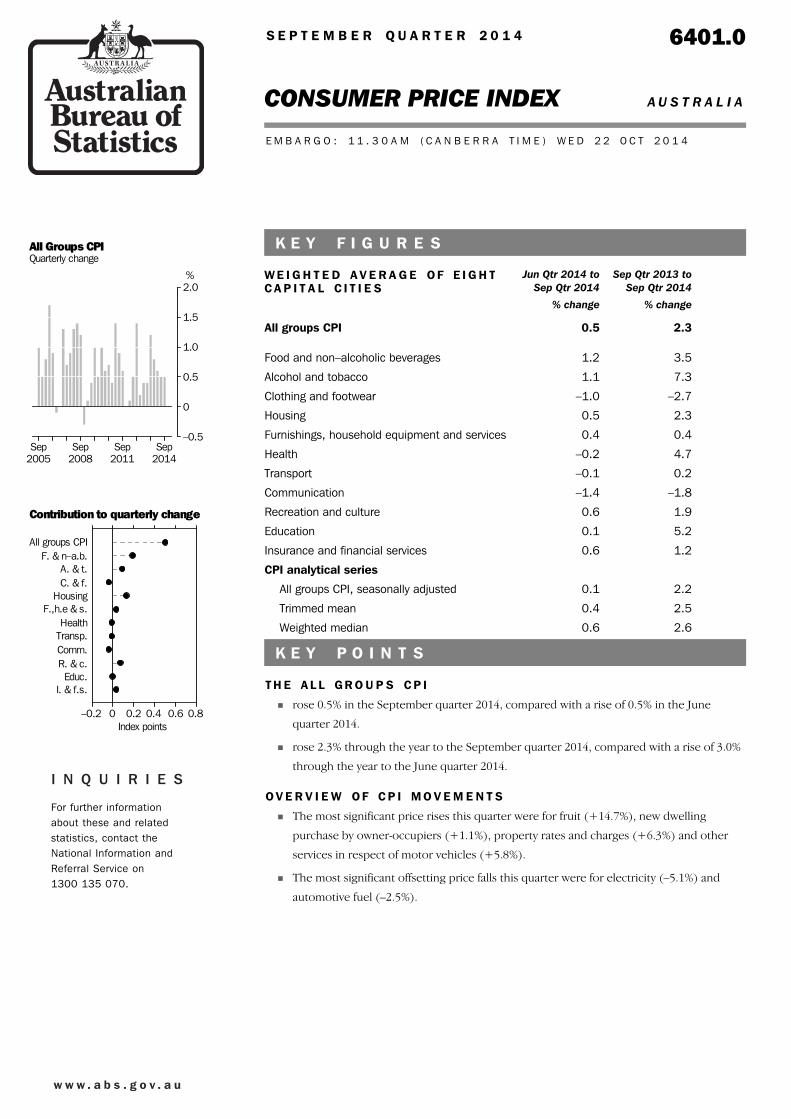
2.60.6Weighted median
2.50.4Trimmed mean
2.20.1All groups CPI, seasonally adjusted
CPI analytical series
1.20.6Insurance and financial services
5.20.1Education
1.90.6Recreation and culture
–1.8–1.4Communication
0.2–0.1Transport
4.7–0.2Health
0.40.4Furnishings, household equipment and services
2.30.5Housing
–2.7–1.0Clothing and footwear
7.31.1Alcohol and tobacco
3.51.2Food and non–alcoholic beverages
2.30.5All groups CPI
% change% change
Sep Qtr 2013 toSep Qtr 2014
Jun Qtr 2014 toSep Qtr 2014
W E I G H T E D A V E R A G E O F E I G H TC A P I T A L C I T I E S
K E Y F I G U R E S
T H E A L L G R O U P S C P I
rose 0.5% in the September quarter 2014, compared with a rise of 0.5% in the June
quarter 2014.
rose 2.3% through the year to the September quarter 2014, compared with a rise of 3.0%
through the year to the June quarter 2014.
O V E R V I E W O F C P I M O V E M E N T S
The most significant price rises this quarter were for fruit (+14.7%), new dwelling
purchase by owner-occupiers (+1.1%), property rates and charges (+6.3%) and other
services in respect of motor vehicles (+5.8%).
The most significant offsetting price falls this quarter were for electricity (–5.1%) and
automotive fuel (–2.5%).
K E Y P O I N T S
E M B A R G O : 1 1 . 3 0 A M ( C A N B E R R A T I M E ) W E D 2 2 O C T 2 0 1 4
CONSUMER PRICE INDEX A U S T R A L I A
6401.0S E P T E M B E R Q U A R T E R 2 0 1 4
For further informationabout these and relatedstatistics, contact theNational Information andReferral Service on1300 135 070.
All Groups CPIQuarterly change
Sep2005
Sep2008
Sep2011
Sep2014
%
–0.5
0
0.5
1.0
1.5
2.0
Contribution to quarterly change
All groups CPIF. & n–a.b.
A. & t.C. & f.
HousingF.,h.e & s.
HealthTransp.Comm.R. & c.Educ.
I. & f.s.
–0.2 0 0.2 0.4 0.6 0.8Index points
I N Q U I R I E S
w w w . a b s . g o v . a u
28 October 2015September 2015
22 July 2015June 2015
22 April 2015March 2015
28 January 2015December 2014
RELEASE DATEISSUE (Quarter)FO R T H C O M I N G I S S U E S
Any discrepancies between totals and sums of components in this publication are due to
rounding.
RO U N D I N G
The Consumer Price Index (CPI) measures price change for consumption goods and
services acquired by Australian resident households. The Australian Government
repealed carbon pricing with effect from 1 July 2014. It is not possible to quantify the
impact of removing the carbon price on the price change measured by the CPI.
The CPI Annual Seasonal Re-analysis (ASR) process was conducted in the September
quarter 2014. The ASR assesses the CPI seasonal patterns in more detail than is possible
in the quarterly processing cycle. The outcomes of the ASR are provided in the Appendix
to this issue.
Changes to the seasonally adjusted CPI series do not affect the original CPI index series.
For more information about seasonal adjustment see paragraphs 14 to 17 of the
Explanatory notes.
CH A N G E S IN TH I S I S S U E
not elsewhere classifiedn.e.c.
Consumer Price IndexCPI
Australian Bureau of StatisticsABSAB B R E V I A T I O N S
J o n a t h a n Pa l m e r
Ac t i n g Au s t r a l i a n S t a t i s t i c i a n
2 A B S • CO N S U M E R P R I C E I N D E X • 6 4 0 1 . 0 • SE P QT R 2 0 1 4
N O T E S
The main contributor to the rise in the alcohol and tobacco group for the September
quarter 2014 was tobacco (+2.3%), mainly due to the effects of the federal excise tax
increase from 1 September 2014.
AL C O H O L AN D TO B A C C O
GR O U P (+ 1 . 1 % )
The main contributors to the rise in the housing group for the September quarter 2014
were new dwelling purchase by owner-occupiers (+1.1%) and property rates and
charges (+6.3%). The rise was partially offset by a fall in electricity (–5.1%), which fell
mainly due to the removal of the carbon price from 1 July 2014.
Over the twelve months to the September quarter 2014, the housing group rose 2.3%.
The main contributors to the rise were new dwelling purchase by owner-occupiers
(+3.8%), rents (+2.5%) and property rates and charges (+6.3%). The rise was partially
offset by a fall in electricity (–4.4%).
In seasonally adjusted terms, the housing group fell 0.4% in the September quarter 2014.
The main contributor to the fall was electricity (–8.1%).
HO U S I N G (+ 0 . 5 % )
The main contributor to the rise in the food and non-alcoholic beverages group for the
September quarter 2014 was fruit (+14.7%). The rise was partially offset by a fall in bread
(–3.0%).
Over the twelve months to the September quarter 2014, the food and non-alcoholic
beverages group rose 3.5%. The main contributors to the rise were fruit (+19.2%),
vegetables (+10.0%), restaurant meals (+2.2%) and takeaway and fast foods (+1.9%).
The rise was partially offset by a fall in breakfast cereals (–6.0%).
In seasonally adjusted terms, the food and non-alcoholic beverages group rose 0.9% in
the September quarter 2014. The main contributor to the rise was fruit (+9.3%).
FO O D AN D
NO N - A L C O H O L I C
BE V E R A G E S GR O U P
(+ 1 . 2 % )
All groups CPIFood and non-alcoholic beverages
Alcohol and tobaccoClothing and footwear
HousingFurnishings, household equipment and services
HealthTransport
CommunicationRecreation and culture
EducationInsurance and financial services
–2 –1 0 1 2%
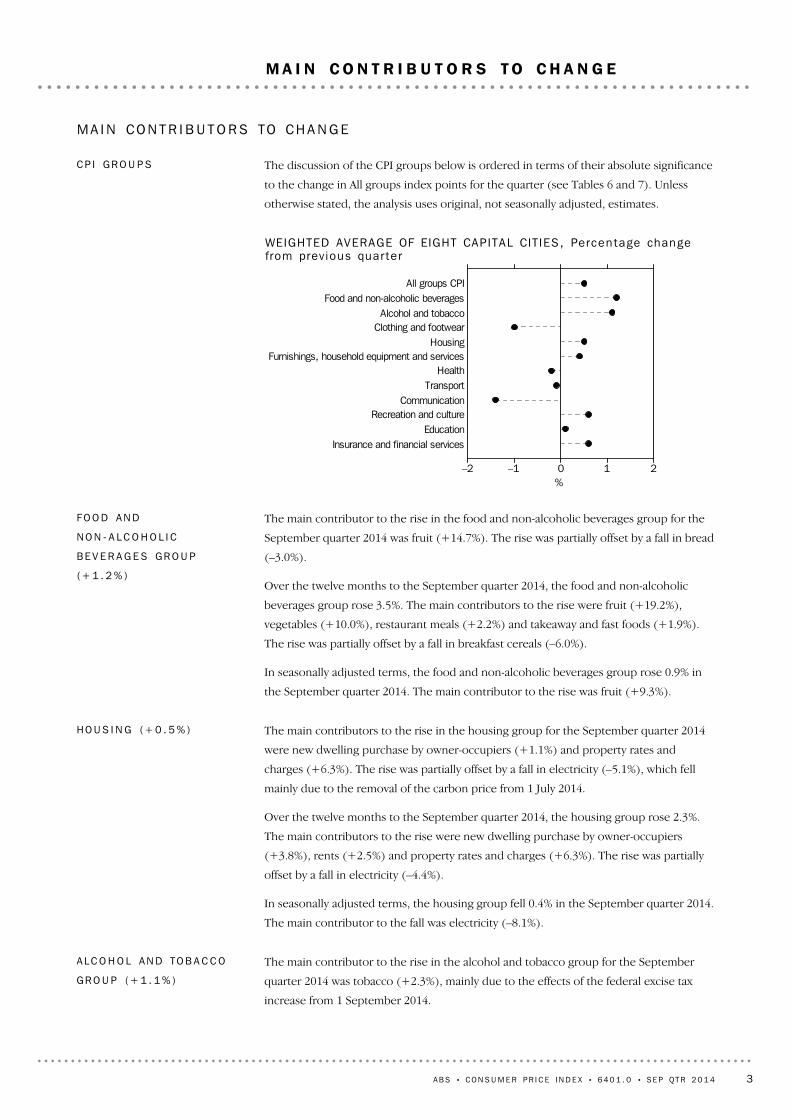
WEIGHTED AVERAGE OF EIGHT CAPITAL CIT IES, Percen tage changefrom prev ious quar te r
The discussion of the CPI groups below is ordered in terms of their absolute significance
to the change in All groups index points for the quarter (see Tables 6 and 7). Unless
otherwise stated, the analysis uses original, not seasonally adjusted, estimates.
CP I GR O U P S
MA I N CO N T R I B U T O R S TO CH A N G E
A B S • CO N S U M E R P R I C E I N D E X • 6 4 0 1 . 0 • SE P QT R 2 0 1 4 3
M A I N C O N T R I B U T O R S T O C H A N G E
The main contributors to the rise in the insurance and financial services group for the
September quarter 2014 were insurance (+0.7%) and other financial services (+0.5%).
Over the twelve months to the September quarter 2014, the insurance and financial
services group rose 1.2%. The main contributor to this rise was other financial services
(+1.8%).
I N S U R A N C E AN D
F I N A N C I A L SE R V I C E S
GR O U P (+ 0 . 6 % )
The main contributors to the fall in the clothing and footwear group for the September
quarter 2014 were garments for men (–3.7%) and garments for women (–0.4%). This was
partially offset by accessories (+0.4%).
Over the twelve months to the September quarter 2014, the clothing and footwear group
fell 2.7%. The main contributors to the fall were garments for men (–3.7%) and garments
for women (–2.3%).
In seasonally adjusted terms, the clothing and footwear group fell 2.0% in the September
quarter 2014. The main contributor to the fall was garments for men (–5.5%).
CL O T H I N G AN D
FO O T W E A R GR O U P
( – 1 . 0 % )
The main contributor to the fall in the communication group for the September quarter
2014 was telecommunication equipment and services (–1.5%).
Over the twelve months to the September quarter 2014, the communication group
fell 1.8%. The main contributor to the fall was telecommunication equipment and
services (–2.1%).
The communication group is not seasonally adjusted.
CO M M U N I C A T I O N GR O U P
( – 1 . 4 % )
The main contributor to the rise in the recreation and culture group for the September
quarter 2014 was international holiday travel and accommodation (+1.3%). The rise was
partially offset by falls in pets and related products (–1.8%) and games, toys and hobbies
(–1.3%).
Over the twelve months to the September quarter 2014, the recreation and culture
group rose 1.9%. The main contributor to the rise was international holiday travel and
accommodation (+5.1%).
In the CPI, airfares are collected in advance (at the time of payment), but are only used
in the CPI in the quarter in which the trip is undertaken. International airfares are
collected two months in advance (July for travel in September) and domestic airfares are
collected one month in advance (August for travel in September).
In seasonally adjusted terms, the recreation and culture group fell 0.7% in the September
quarter 2014. The main contributor to the fall was international holiday travel and
accommodation (–3.5%).
RE C R E A T I O N AN D
CU L T U R E GR O U P (+ 0 . 6 % )
Over the twelve months to the September quarter 2014, the alcohol and tobacco group
rose 7.3%. The main contributor to the rise was tobacco (+15.0%).
In seasonally adjusted terms, the alcohol and tobacco group rose 1.2% in the September
quarter 2014. The main contributor to the rise was tobacco (+2.4%).
AL C O H O L AN D TO B A C C O
GR O U P (+ 1 . 1 % ) continued
4 A B S • CO N S U M E R P R I C E I N D E X • 6 4 0 1 . 0 • SE P QT R 2 0 1 4
M A I N C O N T R I B U T O R S T O C H A N G E continued
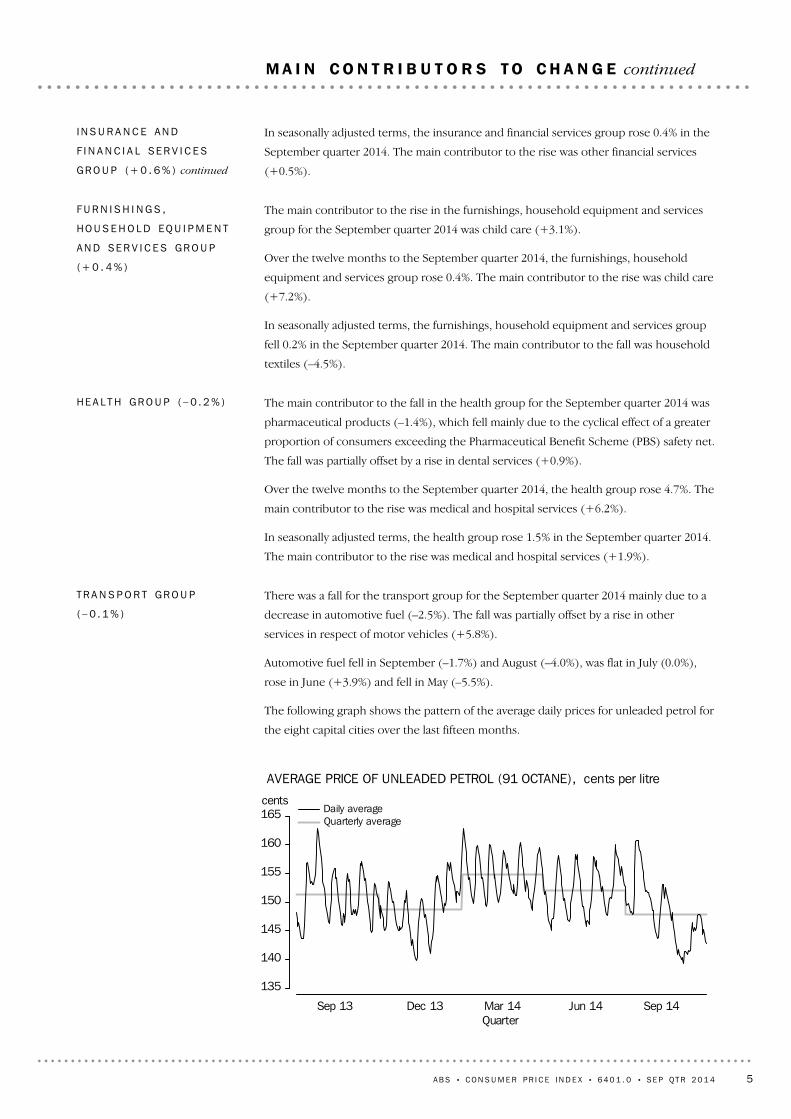
AVERAGE PRICE OF UNLEADED PETROL (91 OCTANE), cents per litre
Sep 13 Dec 13 Mar 14 Jun 14 Sep 14Quarter
cents
135
140
145
150
155
160
165 Daily averageQuarterly average
There was a fall for the transport group for the September quarter 2014 mainly due to a
decrease in automotive fuel (–2.5%). The fall was partially offset by a rise in other
services in respect of motor vehicles (+5.8%).
Automotive fuel fell in September (–1.7%) and August (–4.0%), was flat in July (0.0%),
rose in June (+3.9%) and fell in May (–5.5%).
The following graph shows the pattern of the average daily prices for unleaded petrol for
the eight capital cities over the last fifteen months.
TR A N S P O R T GR O U P
( – 0 . 1 % )
The main contributor to the fall in the health group for the September quarter 2014 was
pharmaceutical products (–1.4%), which fell mainly due to the cyclical effect of a greater
proportion of consumers exceeding the Pharmaceutical Benefit Scheme (PBS) safety net.
The fall was partially offset by a rise in dental services (+0.9%).
Over the twelve months to the September quarter 2014, the health group rose 4.7%. The
main contributor to the rise was medical and hospital services (+6.2%).
In seasonally adjusted terms, the health group rose 1.5% in the September quarter 2014.
The main contributor to the rise was medical and hospital services (+1.9%).
HE A L T H GR O U P ( – 0 . 2 % )
The main contributor to the rise in the furnishings, household equipment and services
group for the September quarter 2014 was child care (+3.1%).
Over the twelve months to the September quarter 2014, the furnishings, household
equipment and services group rose 0.4%. The main contributor to the rise was child care
(+7.2%).
In seasonally adjusted terms, the furnishings, household equipment and services group
fell 0.2% in the September quarter 2014. The main contributor to the fall was household
textiles (–4.5%).
FU R N I S H I N G S ,
HO U S E H O L D EQ U I P M E N T
AN D SE R V I C E S GR O U P
(+ 0 . 4 % )
In seasonally adjusted terms, the insurance and financial services group rose 0.4% in the
September quarter 2014. The main contributor to the rise was other financial services
(+0.5%).
I N S U R A N C E AN D
F I N A N C I A L SE R V I C E S
GR O U P (+ 0 . 6 % ) continued
A B S • CO N S U M E R P R I C E I N D E X • 6 4 0 1 . 0 • SE P QT R 2 0 1 4 5
M A I N C O N T R I B U T O R S T O C H A N G E continued
In the September quarter 2014, the All groups CPI seasonally adjusted rose 0.1%,
compared to the original All groups CPI which recorded a rise of 0.5%.
SE A S O N A L L Y AD J U S T E D
AN A L Y T I C A L SE R I E S
The tradables component (see Table 8) of the All groups CPI rose 0.3% in the September
quarter 2014. Prices for the goods and services in this component are largely
determined on the world market. The tradables component represents approximately
40% of the weight of the CPI. The most significant contributors to the 0.3% rise in
tradable goods component were fruit and tobacco. The most significant offsetting fall in
the tradable goods component was automotive fuel. The rise in the tradables services
component of 1.3% was driven by international holiday travel and accommodation.
The non-tradables component of the All groups CPI rose 0.5% in the September quarter
2014. Prices for the goods and services in this component are largely determined by
domestic price pressures. The non-tradables component represents approximately 60%
of the weight of the CPI. The non-tradable goods component fell 0.1% mainly due to
electricity. The most significant offsetting rise was for new dwelling purchase by
owner-occupiers. The non-tradable services component rose 0.8% mainly due to
increases in property rates and charges, other services in respect of motor vehicles and
rents. The most significant offsetting fall was for telecommunication equipment and
services.
Over the twelve months to the September quarter 2014, the tradables component
rose 2.0% and the non-tradables component rose 2.4%. This compares to a rise of 2.9%
and a rise of 3.1% respectively through the year to the June quarter 2014.
In seasonally adjusted terms, the tradables component was flat (0.0%) in the September
quarter 2014 and the non-tradables component rose 0.2%.
A detailed description of which expenditure classes are classified as tradable and
non–tradable in the 16th series is shown in Appendix 1 of the September quarter 2011
issue of Consumer Price Index, Australia (cat. no 6401.0).
I N T E R N A T I O N A L TR A D E
EX P O S U R E – TR A D A B L E S
AN D NO N – T R A D A B L E S
The education group recorded a movement of 0.1% in the September quarter 2014.
Over the twelve months to the September quarter 2014, the education group rose 5.2%.
The main contributor to the rise was secondary education (+6.0%).
In seasonally adjusted terms, the education group rose 1.3% in the September quarter
2014. The main contributors to the rise were secondary education (+1.6%) and tertiary
education (+1.1%).
ED U C A T I O N GR O U P
(+ 0 . 1 % )
Over the twelve months to the September quarter 2014, the transport group rose 0.2%.
The main contributor to the rise was other services in respect of motor vehicles
(+7.7%). The rise was partially offset by a fall in automotive fuel (–2.5%).
In seasonally adjusted terms, the transport group rose 0.4% in the September quarter
2014. The main contributor to the rise was other services in respect of motor vehicles
(+4.6%).
TR A N S P O R T GR O U P
(– 0 . 1 % ) continued
6 A B S • CO N S U M E R P R I C E I N D E X • 6 4 0 1 . 0 • SE P QT R 2 0 1 4
M A I N C O N T R I B U T O R S T O C H A N G E continued
A detailed explanation of the seasonal adjustment of the All Groups CPI is available in
Information Paper: Seasonal Adjustment of Consumer Price Indexes, 2011 (cat. no.
6401.0.55.003) available on the ABS website. This paper includes a description of the
seasonal adjustment methodology used to calculate the trimmed mean and weighted
median measures of underlying inflation.
Revisions to the seasonally adjusted estimates can be the result of the application of
concurrent seasonal adjustment, described in paragraph 15 of the Explanatory Notes.
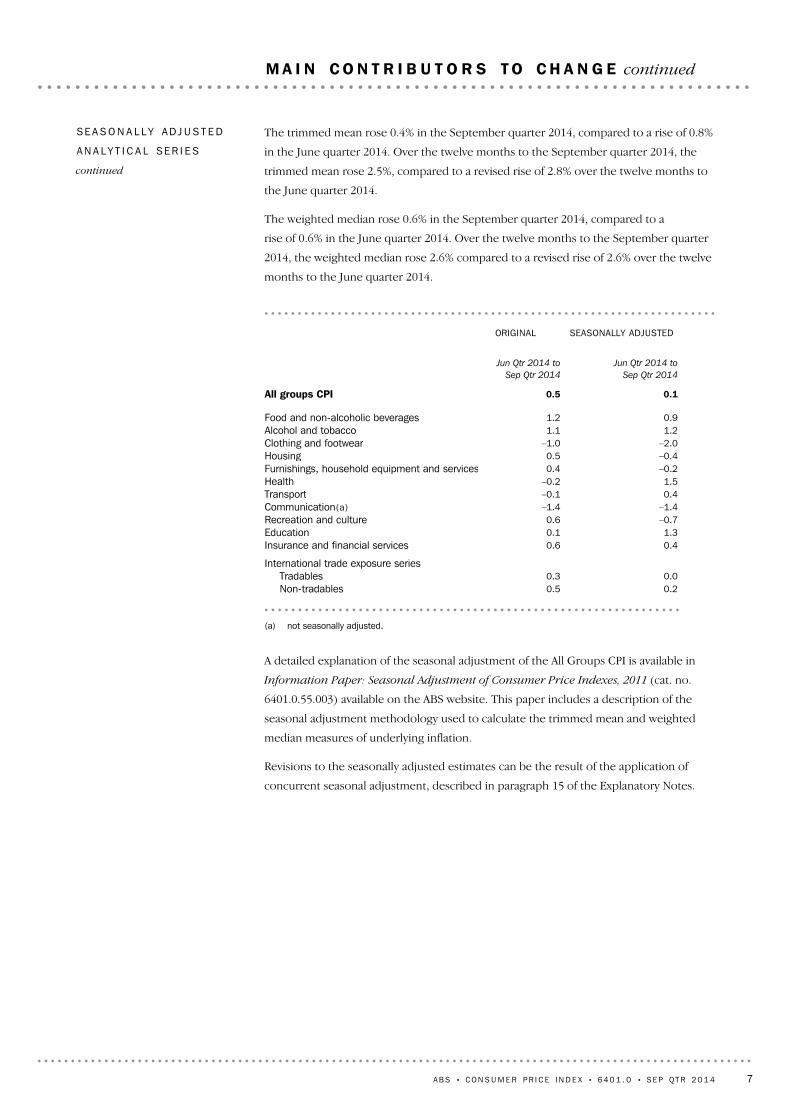
(a) not seasonally adjusted.
0.20.5Non-tradables0.00.3Tradables
International trade exposure series
0.40.6Insurance and financial services1.30.1Education
–0.70.6Recreation and culture–1.4–1.4Communication(a)0.4–0.1Transport1.5–0.2Health
–0.20.4Furnishings, household equipment and services–0.40.5Housing–2.0–1.0Clothing and footwear1.21.1Alcohol and tobacco0.91.2Food and non-alcoholic beverages
0.10.5All groups CPI
Jun Qtr 2014 to
Sep Qtr 2014
Jun Qtr 2014 to
Sep Qtr 2014
SEASONALLY ADJUSTEDORIGINAL
The trimmed mean rose 0.4% in the September quarter 2014, compared to a rise of 0.8%
in the June quarter 2014. Over the twelve months to the September quarter 2014, the
trimmed mean rose 2.5%, compared to a revised rise of 2.8% over the twelve months to
the June quarter 2014.
The weighted median rose 0.6% in the September quarter 2014, compared to a
rise of 0.6% in the June quarter 2014. Over the twelve months to the September quarter
2014, the weighted median rose 2.6% compared to a revised rise of 2.6% over the twelve
months to the June quarter 2014.
SE A S O N A L L Y AD J U S T E D
AN A L Y T I C A L SE R I E S
continued
A B S • CO N S U M E R P R I C E I N D E X • 6 4 0 1 . 0 • SE P QT R 2 0 1 4 7
M A I N C O N T R I B U T O R S T O C H A N G E continued
At the All groups level, the CPI rose in all eight capital cities during the September
quarter 2014.
The food and non-alcoholic beverages group was the most significant positive
contributor to the All groups quarterly movement. The group recorded rises in all eight
capital cities. Hobart (+2.3%) recorded the largest movement, mainly driven by
increases in fruit.
At the eight capital cities level, the housing group was the second most significant
contributor to the All groups quarterly movement (+0.5%), recording rises in five capital
cities. The largest city movement was recorded by Adelaide (+2.0%), driven by the
removal of a government Emergency Services Levy remission for non-concession
ratepayers. Brisbane (+1.4%) recorded rises, mainly due to increases in electricity
network charges.
The most significant negative contributors to the quarterly movement were the
communication group (–1.4%) and the clothing and footwear group (–1.0%). The
communication group recorded decreases in all eight capital cities, mainly due to falls in
telecommunication equipment and services. The clothing and footwear group recorded
falls in all cities with the exception of Brisbane where the most significant positive
contributor was garments for men. The largest decreases for the clothing and footwear
group was recorded in Darwin (–3.2%), mainly driven by falls in footwear.
Over the twelve months to the September quarter 2014, the All groups CPI rose in all
capital cities with the largest positive movements recorded in Darwin (+2.7%) and Perth
(+2.6%). Hobart (+1.9%) recorded the smallest rise over the twelve months to the
September quarter 2014.
Sydney
Melbourne
Brisbane
Adelaide
Perth
Hobart
Darwin
Canberra
Weighted average of eight capital cities
0 0.2 0.4 0.6 0.8 1.0 1.2%
ALL GROUPS CPI , Percen tage change from prev ious quar te rAL L GR O U P S CP I
CA P I T A L C I T I E S CO M P A R I S O N
8 A B S • CO N S U M E R P R I C E I N D E X • 6 4 0 1 . 0 • SE P QT R 2 0 1 4
C A P I T A L C I T I E S C O M P A R I S O N
(a) Index reference period: 2011–12 = 100.0.
2.30.5106.4Weighted average of eight capital cities2.00.4105.2Canberra2.70.2108.3Darwin1.90.1104.6Hobart2.60.5106.9Perth2.10.4105.9Adelaide2.60.7106.5Brisbane2.00.2106.1Melbourne2.20.6106.6Sydney
Sep Qtr 2013 to
Sep Qtr 2014
Jun Qtr 2014 to
Sep Qtr 2014
Sep Qtr
2014
PERCENTAGE CHANGEINDEXNUMBER(a)
ALL GROUPS CPI , Al l groups index numbers and percen tage changesAL L GR O U P S CP I continued
A B S • CO N S U M E R P R I C E I N D E X • 6 4 0 1 . 0 • SE P QT R 2 0 1 4 9
C A P I T A L C I T I E S C O M P A R I S O N continued
citiesCanberraDarwinHobartPerthAdelaideBrisbaneMelbourneSydneyQua r t e r s
CPI GROUPS, Index numbers (a ) co n t i n u e d5
20 A B S • CO N S U M E R P R I C E I N D E X • 6 4 0 1 . 0 • SE P QT R 2 0 1 4
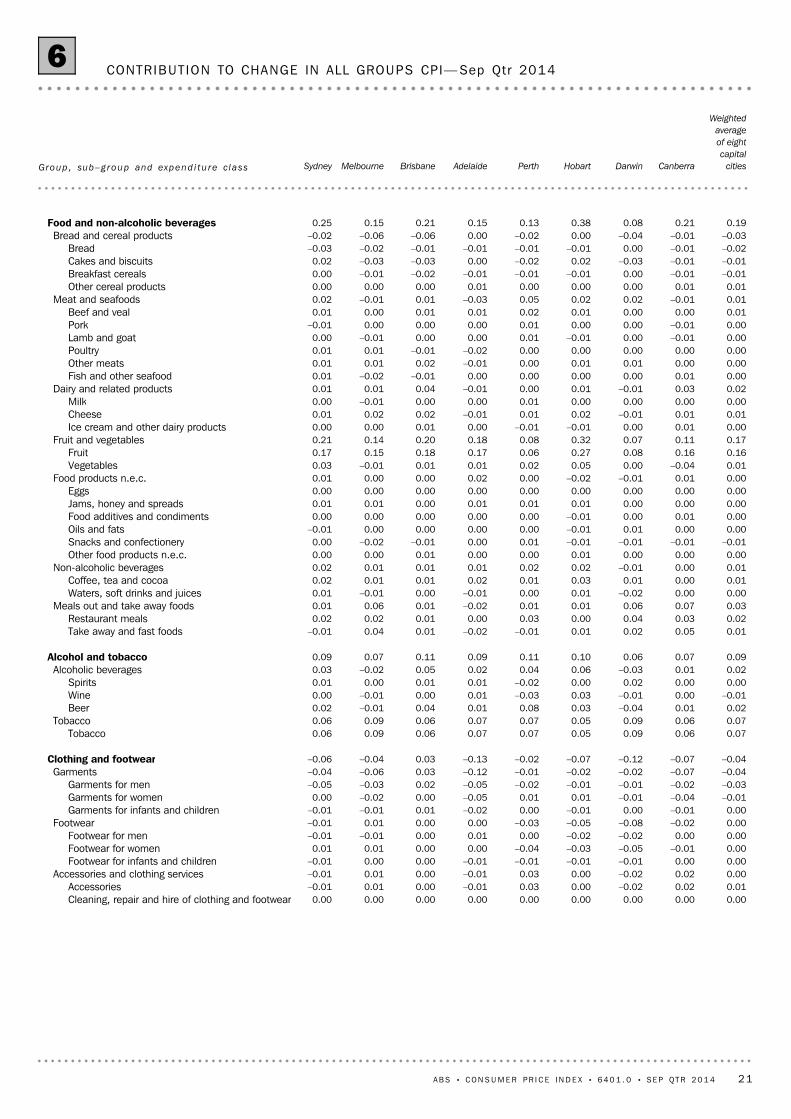
0.000.000.000.000.000.000.000.000.00Cleaning, repair and hire of clothing and footwear0.010.02–0.020.000.03–0.010.000.01–0.01Accessories0.000.02–0.020.000.03–0.010.000.01–0.01Accessories and clothing services0.000.00–0.01–0.01–0.01–0.010.000.00–0.01Footwear for infants and children0.00–0.01–0.05–0.03–0.040.000.000.010.01Footwear for women0.000.00–0.02–0.020.000.010.00–0.01–0.01Footwear for men0.00–0.02–0.08–0.05–0.030.000.000.01–0.01Footwear0.00–0.010.00–0.010.00–0.020.01–0.01–0.01Garments for infants and children
–0.01–0.04–0.010.010.01–0.050.00–0.020.00Garments for women–0.03–0.02–0.01–0.01–0.02–0.050.02–0.03–0.05Garments for men–0.04–0.07–0.02–0.02–0.01–0.120.03–0.06–0.04Garments–0.04–0.07–0.12–0.07–0.02–0.130.03–0.04–0.06Clothing and footwear
–0.010.00–0.010.03–0.030.010.00–0.010.00Wine0.000.000.020.00–0.020.010.010.000.01Spirits0.020.01–0.030.060.040.020.05–0.020.03Alcoholic beverages0.090.070.060.100.110.090.110.070.09Alcohol and tobacco
0.010.050.020.01–0.01–0.020.010.04–0.01Take away and fast foods0.020.030.040.000.030.000.010.020.02Restaurant meals0.030.070.060.010.01–0.020.010.060.01Meals out and take away foods0.000.00–0.020.010.00–0.010.00–0.010.01Waters, soft drinks and juices0.010.000.010.030.010.020.010.010.02Coffee, tea and cocoa0.010.00–0.010.020.020.010.010.010.02Non-alcoholic beverages0.000.000.000.010.000.000.010.000.00Other food products n.e.c.
–0.01–0.01–0.01–0.010.010.00–0.01–0.020.00Snacks and confectionery0.000.000.01–0.010.000.000.000.00–0.01Oils and fats0.000.010.00–0.010.000.000.000.000.00Food additives and condiments0.000.000.000.010.010.010.000.010.01Jams, honey and spreads0.000.000.000.000.000.000.000.000.00Eggs0.000.01–0.01–0.020.000.020.000.000.01Food products n.e.c.0.01–0.040.000.050.020.010.01–0.010.03Vegetables0.160.160.080.270.060.170.180.150.17Fruit0.170.110.070.320.080.180.200.140.21Fruit and vegetables0.000.010.00–0.01–0.010.000.010.000.00Ice cream and other dairy products0.010.01–0.010.020.01–0.010.020.020.01Cheese0.000.000.000.000.010.000.00–0.010.00Milk0.020.03–0.010.010.00–0.010.040.010.01Dairy and related products0.000.010.000.000.000.00–0.01–0.020.01Fish and other seafood0.000.000.010.010.00–0.010.020.010.01Other meats0.000.000.000.000.00–0.02–0.010.010.01Poultry0.00–0.010.00–0.010.010.000.00–0.010.00Lamb and goat0.00–0.010.000.000.010.000.000.00–0.01Pork0.010.000.000.010.020.010.010.000.01Beef and veal0.01–0.010.020.020.05–0.030.01–0.010.02Meat and seafoods0.010.010.000.000.000.010.000.000.00Other cereal products
–0.01–0.010.00–0.01–0.01–0.01–0.02–0.010.00Breakfast cereals–0.01–0.01–0.030.02–0.020.00–0.03–0.030.02Cakes and biscuits–0.02–0.010.00–0.01–0.01–0.01–0.01–0.02–0.03Bread–0.03–0.01–0.040.00–0.020.00–0.06–0.06–0.02Bread and cereal products0.190.210.080.380.130.150.210.150.25Food and non-alcoholic beverages
Weighted
average
of eight
capital
citiesCanberraDarwinHobartPerthAdelaideBrisbaneMelbourneSydneyGroup , sub–g r oup and expend i t u r e c l a s s
CONTRIBUT ION TO CHANGE IN ALL GROUPS CPI— Sep Qtr 20146
A B S • CO N S U M E R P R I C E I N D E X • 6 4 0 1 . 0 • SE P QT R 2 0 1 4 21
0.010.000.000.000.020.010.010.000.01Urban transport fares0.010.000.000.000.020.010.010.000.01Urban transport fares0.090.150.070.040.250.070.000.160.01Other services in respect of motor vehicles0.010.020.060.010.010.030.020.00–0.02Maintenance and repair of motor vehicles
–0.10–0.030.03–0.04–0.05–0.14–0.11–0.09–0.12Automotive fuel0.000.020.000.000.000.000.000.000.00Spare parts and accessories for motor vehicles
0.010.030.010.010.000.000.020.010.00Dental services0.000.010.030.01–0.010.01–0.020.010.00Medical and hospital services0.000.030.030.00–0.010.010.000.02–0.01Medical, dental and hospital services0.000.000.000.000.00–0.010.000.000.00Therapeutic appliances and equipment
–0.02–0.02–0.02–0.03–0.02–0.02–0.02–0.02–0.01Pharmaceutical products–0.02–0.02–0.02–0.04–0.02–0.02–0.01–0.02–0.01Medical products, appliances and equipment–0.010.010.01–0.04–0.03–0.01–0.020.01–0.02Health
0.000.000.000.01–0.020.000.000.010.02Other household services0.010.010.010.000.020.000.010.000.01Hairdressing and personal grooming services0.030.010.02–0.010.030.010.040.010.04Child care0.040.010.020.000.030.030.040.020.07Domestic and household services
–0.010.04–0.030.010.02–0.04–0.02–0.020.00Other non-durable household products–0.010.02–0.010.00–0.030.01–0.01–0.03–0.01Personal care products0.000.010.010.010.000.010.000.000.01Cleaning and maintenance products
–0.020.05–0.030.02–0.01–0.02–0.03–0.030.00Non-durable household products0.00–0.010.010.010.000.000.010.00–0.01Tools and equipment for house and garden0.01–0.020.00–0.01–0.020.020.000.030.03Glassware, tableware and household utensils0.00–0.01–0.010.000.000.000.000.000.01Small electric household appliances0.00–0.020.000.000.00–0.010.000.000.01Major household appliances0.02–0.05–0.010.00–0.010.010.020.030.03Household appliances, utensils and tools
–0.01–0.05–0.040.00–0.02–0.08–0.01–0.01–0.01Household textiles–0.01–0.05–0.040.00–0.02–0.08–0.01–0.01–0.01Household textiles0.000.000.000.000.010.00–0.010.000.00Carpets and other floor coverings0.000.050.00–0.030.03–0.03–0.06–0.020.06Furniture0.010.05–0.01–0.020.04–0.03–0.07–0.020.06Furniture and furnishings0.030.03–0.050.000.03–0.10–0.05–0.020.15Furnishings, household equipment and services
0.010.10–0.010.000.000.110.01–0.080.07Gas and other household fuels–0.14–0.17–0.21–0.31–0.100.010.09–0.22–0.21Electricity–0.010.030.000.030.050.050.09–0.130.03Water and sewerage–0.14–0.04–0.21–0.27–0.060.160.19–0.43–0.11Utilities0.090.130.020.050.090.260.070.110.06Property rates and charges0.010.000.020.000.010.010.020.030.01Maintenance and repair of the dwelling0.120.140.050.060.100.270.080.140.08Other housing0.110.070.010.040.040.000.040.110.19New dwelling purchase by owner-occupiers0.110.070.010.040.040.000.040.110.19New dwelling purchase by owner-occupiers0.04–0.060.070.000.020.020.030.050.07Rents0.04–0.060.070.000.020.020.030.050.07Rents0.130.10–0.07–0.180.090.460.34–0.130.23Housing
Weighted
average
of eight
capital
citiesCanberraDarwinHobartPerthAdelaideBrisbaneMelbourneSydneyGroup , sub–g r oup and expend i t u r e c l a s s
CONTRIBUT ION TO CHANGE IN ALL GROUPS CPI— Sep Qtr 2014 co n t i n u e d6
22 A B S • CO N S U M E R P R I C E I N D E X • 6 4 0 1 . 0 • SE P QT R 2 0 1 4
0.50.40.20.10.50.40.70.20.6All groups CPI
0.01–0.060.030.01–0.030.000.030.010.05Other financial services0.000.000.000.000.000.000.000.000.00Deposit and loan facilities (direct charges)0.02–0.060.030.01–0.030.010.040.000.05Financial services0.020.000.030.010.00–0.040.010.020.02Insurance0.020.000.030.010.00–0.040.010.020.02Insurance0.03–0.060.060.03–0.03–0.040.050.030.07Insurance and financial services
0.000.000.000.000.000.000.000.000.00Tertiary education0.000.000.000.000.000.000.000.000.00Secondary education0.010.000.000.000.000.000.000.000.00Preschool and primary education0.000.000.000.000.000.000.000.000.01Education0.000.000.000.000.000.000.000.000.01Education
0.010.010.020.020.020.020.000.01–0.01Other recreational, sporting and cultural services0.010.020.010.010.010.000.020.00–0.02Sports participation0.000.000.030.010.010.000.020.000.00Veterinary and other services for pets
–0.010.000.00–0.010.00–0.01–0.01–0.01–0.02Pets and related products–0.010.00–0.020.00–0.010.00–0.010.00–0.02Games, toys and hobbies0.000.000.000.010.030.000.000.010.00
Equipment for sports, camping and open-airrecreation
0.000.020.030.020.070.020.010.03–0.04Other recreation, sport and culture0.030.030.030.070.000.030.040.040.03International holiday travel and accommodation0.00–0.020.14–0.180.01–0.050.000.000.02Domestic holiday travel and accommodation0.030.010.17–0.110.01–0.020.040.040.05Holiday travel and accommodation0.010.000.000.000.010.010.020.000.01Newspapers, magazines and stationery0.000.030.000.010.000.000.000.010.00Books0.020.030.010.010.020.010.020.010.01Newspapers, books and stationery0.010.000.000.000.000.030.010.000.00Audio, visual and computing media and services0.000.01–0.03–0.030.01–0.020.010.01–0.01Audio, visual and computing equipment0.010.00–0.03–0.030.010.010.030.020.00Audio, visual and computing equipment and services0.070.070.18–0.100.110.030.110.110.02Recreation and culture
–0.04–0.04–0.04–0.05–0.04–0.04–0.05–0.05–0.05Telecommunication equipment and services0.000.000.000.000.000.000.000.000.00Postal services
citiesCanberraDarwinHobartPerthAdelaideBrisbaneMelbourneSydneyGroup , sub–g r oup and expend i t u r e c l a s s
CONTRIBUT ION TO CHANGE IN ALL GROUPS CPI— Sep Qtr 2014 co n t i n u e d6
A B S • CO N S U M E R P R I C E I N D E X • 6 4 0 1 . 0 • SE P QT R 2 0 1 4 23
(a) Unless otherwise specified, reference period of each index: 2011–12 = 100.0.
0.000.130.132.31.6106.9105.2104.5Cleaning, repair and hire of clothing and
footwear
0.010.750.74–2.20.4100.4100.0102.7Accessories0.000.870.87–1.70.6101.3100.7103.0Accessories and clothing services0.000.120.12–4.3–3.396.699.9100.9Footwear for infants and children0.000.340.34–5.20.595.394.8100.5Footwear for women0.000.140.14–3.3–2.998.0100.9101.3Footwear for men0.000.600.60–4.6–1.196.197.2100.7Footwear0.000.300.30–0.6–1.498.399.798.9Garments for infants and children
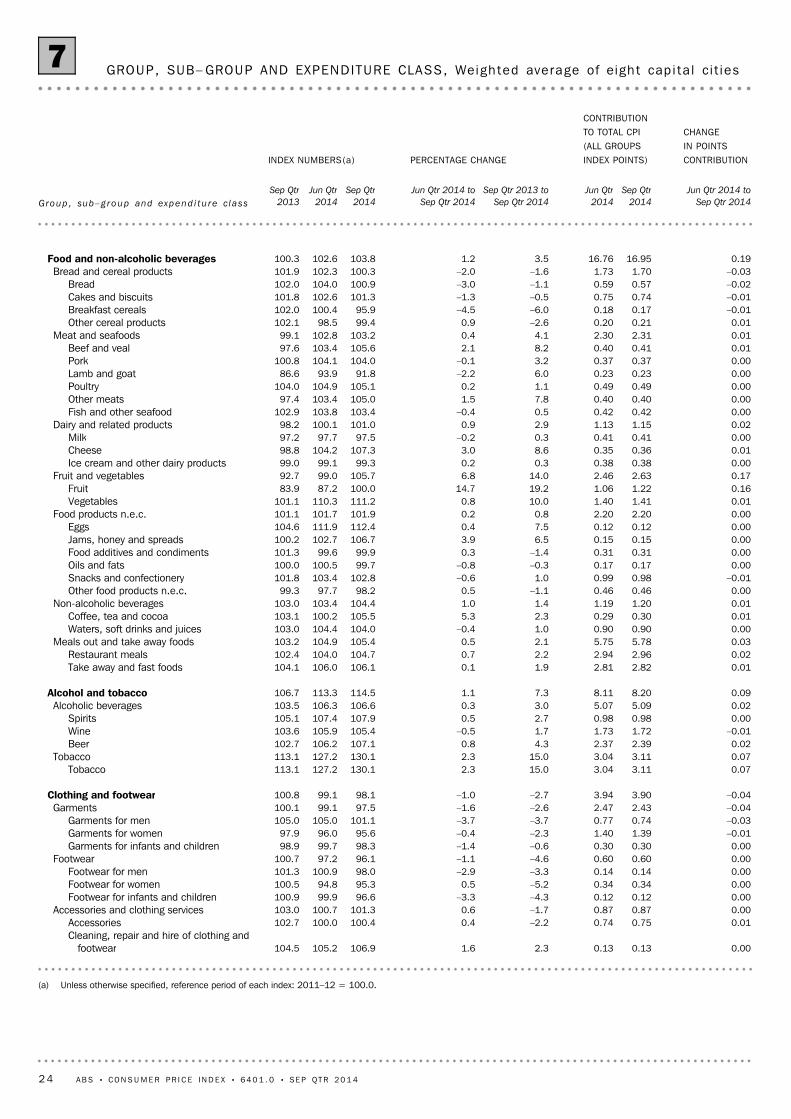
–0.011.391.40–2.3–0.495.696.097.9Garments for women–0.030.740.77–3.7–3.7101.1105.0105.0Garments for men–0.042.432.47–2.6–1.697.599.1100.1Garments–0.043.903.94–2.7–1.098.199.1100.8Clothing and footwear
–0.011.721.731.7–0.5105.4105.9103.6Wine0.000.980.982.70.5107.9107.4105.1Spirits0.025.095.073.00.3106.6106.3103.5Alcoholic beverages0.098.208.117.31.1114.5113.3106.7Alcohol and tobacco
0.012.822.811.90.1106.1106.0104.1Take away and fast foods0.022.962.942.20.7104.7104.0102.4Restaurant meals0.035.785.752.10.5105.4104.9103.2Meals out and take away foods0.000.900.901.0–0.4104.0104.4103.0Waters, soft drinks and juices0.010.300.292.35.3105.5100.2103.1Coffee, tea and cocoa0.011.201.191.41.0104.4103.4103.0Non-alcoholic beverages0.000.460.46–1.10.598.297.799.3Other food products n.e.c.
–0.010.980.991.0–0.6102.8103.4101.8Snacks and confectionery0.000.170.17–0.3–0.899.7100.5100.0Oils and fats0.000.310.31–1.40.399.999.6101.3Food additives and condiments0.000.150.156.53.9106.7102.7100.2Jams, honey and spreads0.000.120.127.50.4112.4111.9104.6Eggs0.002.202.200.80.2101.9101.7101.1Food products n.e.c.0.011.411.4010.00.8111.2110.3101.1Vegetables0.161.221.0619.214.7100.087.283.9Fruit0.172.632.4614.06.8105.799.092.7Fruit and vegetables0.000.380.380.30.299.399.199.0Ice cream and other dairy products0.010.360.358.63.0107.3104.298.8Cheese0.000.410.410.3–0.297.597.797.2Milk0.021.151.132.90.9101.0100.198.2Dairy and related products0.000.420.420.5–0.4103.4103.8102.9Fish and other seafood0.000.400.407.81.5105.0103.497.4Other meats0.000.490.491.10.2105.1104.9104.0Poultry0.000.230.236.0–2.291.893.986.6Lamb and goat0.000.370.373.2–0.1104.0104.1100.8Pork0.010.410.408.22.1105.6103.497.6Beef and veal0.012.312.304.10.4103.2102.899.1Meat and seafoods0.010.210.20–2.60.999.498.5102.1Other cereal products
–0.010.170.18–6.0–4.595.9100.4102.0Breakfast cereals–0.010.740.75–0.5–1.3101.3102.6101.8Cakes and biscuits–0.020.570.59–1.1–3.0100.9104.0102.0Bread–0.031.701.73–1.6–2.0100.3102.3101.9Bread and cereal products0.1916.9516.763.51.2103.8102.6100.3Food and non-alcoholic beverages
Jun Qtr 2014 to
Sep Qtr 2014
Sep Qtr
2014
Jun Qtr
2014
Sep Qtr 2013 to
Sep Qtr 2014
Jun Qtr 2014 to
Sep Qtr 2014
Sep Qtr
2014
Jun Qtr
2014
Sep Qtr
2013
CHANGEIN POINTSCONTRIBUTION
CONTRIBUTIONTO TOTAL CPI(ALL GROUPSINDEX POINTS)PERCENTAGE CHANGEINDEX NUMBERS(a)
Group , sub–g r oup and expend i t u r e c l a s s
GROUP, SUB– GROUP AND EXPENDITURE CLASS, Weighted average of eigh t cap i ta l ci t ies7
24 A B S • CO N S U M E R P R I C E I N D E X • 6 4 0 1 . 0 • SE P QT R 2 0 1 4
(a) Unless otherwise specified, reference period of each index: 2011–12 = 100.0.
0.010.840.833.31.1110.7109.5107.2Urban transport fares0.010.840.833.31.1110.7109.5107.2Urban transport fares0.091.631.547.75.8117.7111.2109.3Other services in respect of motor vehicles0.011.791.78–2.20.2103.3103.1105.6Maintenance and repair of motor vehicles
0.010.610.603.50.9107.8106.8104.2Dental services0.004.154.156.20.0120.8120.8113.7Medical and hospital services0.004.764.766.00.2119.0118.8112.3Medical, dental and hospital services0.000.150.15–0.30.398.698.398.9Therapeutic appliances and equipment
–0.021.161.181.0–1.4103.1104.6102.1Pharmaceutical products–0.021.311.330.9–1.2102.6103.8101.7Medical products, appliances and equipment–0.016.086.094.7–0.2115.0115.2109.8Health
0.030.900.877.23.1123.1119.4114.8Child care0.042.642.603.41.5112.5110.8108.8Domestic and household services
–0.011.461.47–0.9–0.5101.4101.9102.3Other non-durable household products–0.011.061.07–3.8–1.196.397.4100.1Personal care products0.000.290.29–0.71.599.798.2100.4Cleaning and maintenance products
0.010.410.40–1.23.997.193.598.3Glassware, tableware and household
utensils
0.000.220.22–0.40.294.394.194.7Small electric household appliances0.000.470.474.00.597.797.293.9Major household appliances0.021.361.341.11.497.596.296.4Household appliances, utensils and tools
–0.010.550.56–8.0–3.390.393.498.1Household textiles–0.010.550.56–8.0–3.390.393.498.1Household textiles0.000.280.281.60.5101.5101.099.9Carpets and other floor coverings0.001.591.591.90.3100.299.998.3Furniture0.011.881.871.90.4100.4100.098.5Furniture and furnishings0.039.239.200.40.4102.1101.7101.7
Furnishings, household equipment andservices
0.010.950.942.51.2127.0125.5123.9Gas and other household fuels–0.142.562.70–4.4–5.1118.2124.5123.6Electricity–0.011.101.110.4–0.6113.6114.3113.1Water and sewerage–0.144.614.75–1.9–2.8118.7122.1121.0Utilities0.091.601.516.36.3121.4114.2114.2Property rates and charges0.012.172.162.60.9106.4105.5103.7Maintenance and repair of the dwelling0.123.783.664.23.1112.3108.9107.8Other housing0.119.329.213.81.1108.2107.0104.2
New dwelling purchase byowner-occupiers
0.119.329.213.81.1108.2107.0104.2New dwelling purchase by owner-occupiers0.047.417.372.50.7108.3107.6105.7Rents0.047.417.372.50.7108.3107.6105.7Rents0.1325.1224.992.30.5110.6110.1108.1Housing
Jun Qtr 2014 to
Sep Qtr 2014
Sep Qtr
2014
Jun Qtr
2014
Sep Qtr 2013 to
Sep Qtr 2014
Jun Qtr 2014 to
Sep Qtr 2014
Sep Qtr
2014
Jun Qtr
2014
Sep Qtr
2013
CHANGEIN POINTSCONTRIBUTION
CONTRIBUTIONTO TOTAL CPI(ALL GROUPSINDEX POINTS)PERCENTAGE CHANGEINDEX NUMBERS(a)
Group , sub–g r oup and expend i t u r e c l a s s
GROUP, SUB– GROUP AND EXPENDITURE CLASS, Weighted average of eigh t cap i ta l ci t ies
co n t i n u e d7
A B S • CO N S U M E R P R I C E I N D E X • 6 4 0 1 . 0 • SE P QT R 2 0 1 4 25
(a) Unless otherwise specified, reference period of each index: 2011–12 = 100.0.
0.5106.4105.92.30.5106.4105.9104.0All groups CPI
0.013.063.051.80.5104.7104.2102.8Other financial services0.000.760.761.20.3101.4101.1100.2Deposit and loan facilities (direct charges)0.023.823.801.80.4104.0103.6102.2Financial services0.021.591.57–0.40.7108.5107.7108.9Insurance0.021.591.57–0.40.7108.5107.7108.9Insurance0.035.415.381.20.6105.3104.7104.1Insurance and financial services
0.001.621.624.30.0113.7113.7109.0Tertiary education0.001.501.506.00.0115.9115.9109.3Secondary education0.010.610.605.50.4113.1112.7107.2Preschool and primary education0.003.733.735.20.1114.5114.4108.8Education0.003.733.735.20.1114.5114.4108.8Education
0.011.221.214.20.6111.0110.3106.5Other recreational, sporting and cultural
services
0.011.071.063.90.2111.4111.2107.2Sports participation0.000.440.443.91.2108.6107.3104.5Veterinary and other services for pets
–0.010.380.39–2.8–1.899.3101.1102.2Pets and related products–0.010.710.721.1–1.394.695.893.6Games, toys and hobbies0.000.590.592.71.3100.298.997.6
Equipment for sports, camping andopen-air recreation
0.004.414.412.80.2105.4105.2102.5Other recreation, sport and culture0.032.492.465.11.3108.4107.0103.1
International holiday travel andaccommodation
0.002.662.660.3–0.1103.3103.4103.0Domestic holiday travel and
accommodation
0.035.155.122.60.6105.7105.1103.0Holiday travel and accommodation0.010.750.743.91.3110.8109.4106.6Newspapers, magazines and stationery0.000.380.382.01.898.496.796.5Books0.021.141.123.31.5106.3104.7102.9Newspapers, books and stationery0.010.970.961.00.799.899.198.8
Audio, visual and computing media andservices
0.001.071.07–6.00.376.876.681.7Audio, visual and computing equipment0.012.042.03–2.70.686.385.888.7
Audio, visual and computing equipment andservices
0.0712.7412.671.90.6102.0101.4100.1Recreation and culture
–0.042.932.97–2.1–1.5100.2101.7102.3Telecommunication equipment and
CONTRIBUTIONTO TOTAL CPI(ALL GROUPSINDEX POINTS)PERCENTAGE CHANGEINDEX NUMBERS(a)
Group , sub–g r oup and expend i t u r e c l a s s
GROUP, SUB– GROUP AND EXPENDITURE CLASS, Weighted average of eigh t cap i ta l ci t ies
co n t i n u e d7
26 A B S • CO N S U M E R P R I C E I N D E X • 6 4 0 1 . 0 • SE P QT R 2 0 1 4
(b) Unless otherwise specified, reference period of each index: 2011–12 = 100.0.. . not applicabler revised(a) Refer to paragraphs 11 and 12 of the Explanatory Notes for a description of
these series.
0.37100.0999.722.10.4106.5106.1104.3'Volatile items'0.4985.2184.722.50.6106.5105.9103.9Food and energy0.44102.22101.782.10.5105.9105.4103.7Medical and hospital services0.2875.8575.572.30.4105.1104.7102.7
Housing, Insurance andfinancial services
0.41100.97100.562.30.4106.4106.0104.0Insurance and financial services0.44102.65102.212.10.4106.1105.7103.9Education0.3793.6493.272.30.4107.0106.6104.6Recreation and culture0.48103.31102.832.40.5106.6106.1104.1Communication0.4494.4193.972.60.5106.8106.3104.1Transport0.45100.3099.852.10.5105.9105.4103.7Health0.4097.1496.742.40.4106.8106.4104.3
Furnishings, householdequipment and services
0.3181.2680.952.20.4105.1104.7102.8Housing0.48102.48102.002.40.5106.7106.2104.2Clothing and footwear0.3598.1897.831.90.4105.8105.4103.8Alcohol and tobacco0.2489.4289.182.00.3106.9106.6104.8Food and non-alcoholic beverages
Analytical Living Cost Indexes and Pensioner and Beneficiary Living Cost Index:
16th Series Weighting Patterns (cat. no. 6472.0)
Consumer Price Index: Concordance with Household Expenditure Classification,
Australia (cat. no. 6446.0.55.001)
Information Paper: Seasonal Adjustment of Consumer Price Indexes, 2011
(cat. no. 6401.0.55.003)
Information Paper: Experimental Price Indexes for Financial Services
(cat. no. 6413.0)
Information Paper: The Introduction of Hedonic Price Indexes for Personal
Computers (cat. no. 6458.0)
Analytical Living Cost Indexes for Selected Australian Household Types
(cat. no. 6463.0)
Selected Living Cost Indexes, Australia (cat. no. 6467.0)
Residential Property Price Indexes: Eight Capital Cities (cat. no. 6416.0)
Producer Price Indexes, Australia (cat. no. 6427.0)
International Trade Price Indexes, Australia (cat. no. 6457.0)
Wage Price Index, Australia (cat. no. 6345.0)
RE L A T E D PU B L I C A T I O N S
21 CPI original indexes are revised only in exceptional circumstances, such as to
correct a significant error. As is the case with all price indexes, the index reference period
(i.e. the period in which the index is set equal to 100.0) will be changed periodically. The
index number levels for all periods will be changed by this process and it may also result
in differences, due to rounding, between the percentage changes published on the old
base and those on the new base. Seasonally adjusted indexes (including the Trimmed
mean and Weighted median) for some quarters will be revised as extra quarters are
included in the series analysed for seasonal influences (see paragraphs 14 to 17).
RE V I S I O N S
A B S • CO N S U M E R P R I C E I N D E X • 6 4 0 1 . 0 • SE P QT R 2 0 1 4 35
E X P L A N A T O R Y N O T E S continued
1 The Annual Seasonal Re-analysis (ASR) reviews the seasonal adjustment of the CPI
series in more detail than is possible in the quarterly processing cycle.
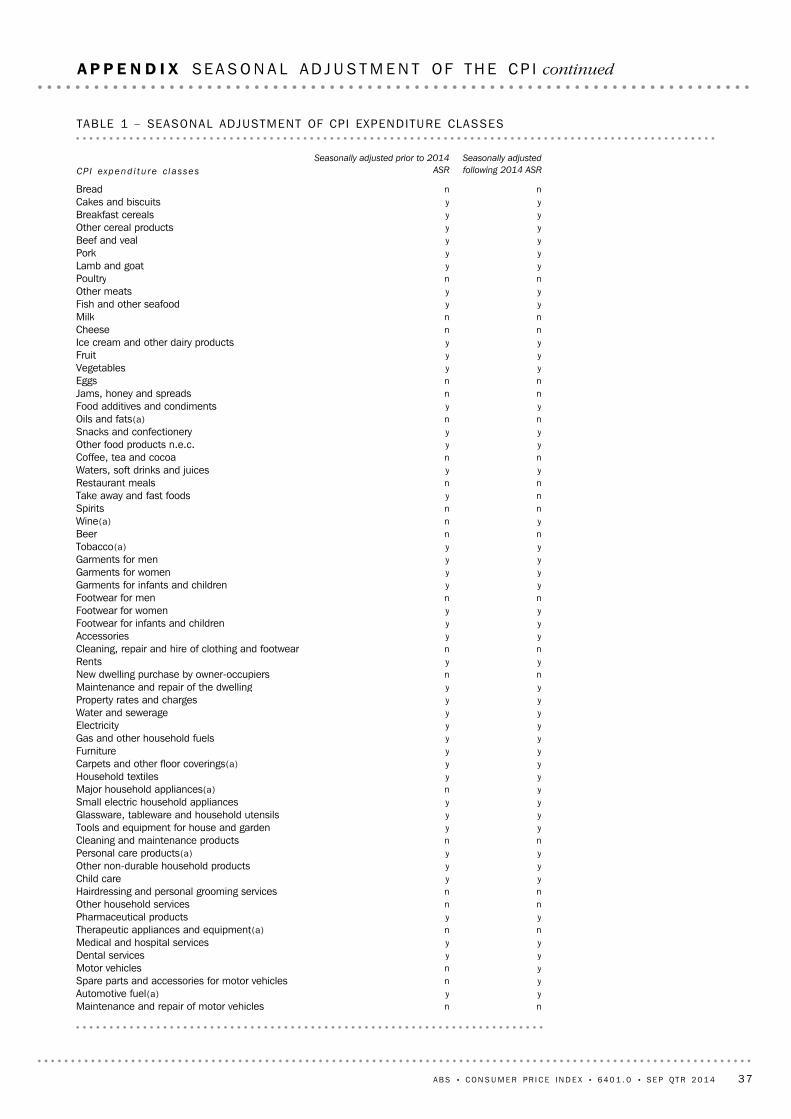
2 Following the 2014 ASR, 61 of the 87 expenditure classes are considered seasonal and
will be seasonally adjusted for the Analytical series; 'All Groups CPI, seasonally adjusted'
and 'Underlying trend series - Trimmed mean and Weighted median'. Seasonally adjusted
index numbers can be found in 'TABLE 15. CPI: Expenditure Class Index Numbers,
Seasonally adjusted, Weighted Average of Eight Capital Cities' and combined seasonal
adjustment factors can be found in 'TABLE 16. CPI: Expenditure Class, Combined
seasonal adjustment factors, Weighted Average of Eight Capital Cities'. These tables can
be downloaded from the 'Downloads' tab of this issue on the ABS website
<http://www.abs.gov.au>.
3 As a result of the 2014 ASR, the following series has ceased being seasonally adjusted,
with no clear seasonal pattern in recent years:
Take away and fast foods from September quarter 2010.
4 The following series have had adjustments introduced due to changes in seasonal
pattern:
Audio, visual and computing equipment from June quarter 2010;
Major household appliances from September quarter 2000;
Motor vehicles from March quarter 2007;
Spare parts and accessories for motor vehicles from March quarter 2010; and
Wine from March quarter 2009.
5 Changes to the seasonally adjusted series do not affect the original CPI index series.
6 For more details on the seasonal adjustment of the CPI please refer to the Explanatory
notes of this issue or the Information Paper: Seasonal Adjustment of Consumer Price
Indexes, 2011 (cat. no. 6401.0.55.003).
SE A S O N A L I T Y OF CP I
EX P E N D I T U R E CL A S S E S
36 A B S • CO N S U M E R P R I C E I N D E X • 6 4 0 1 . 0 • SE P QT R 2 0 1 4
A P P E N D I X S E A S O N A L A D J U S T M E N T O F TH E CP I
nnMaintenance and repair of motor vehiclesyyAutomotive fuel(a)ynSpare parts and accessories for motor vehiclesynMotor vehiclesyyDental servicesyyMedical and hospital servicesnnTherapeutic appliances and equipment(a)yyPharmaceutical productsnnOther household servicesnnHairdressing and personal grooming servicesyyChild careyyOther non-durable household productsyyPersonal care products(a)nnCleaning and maintenance productsyyTools and equipment for house and gardenyyGlassware, tableware and household utensilsyySmall electric household appliancesynMajor household appliances(a)yyHousehold textilesyyCarpets and other floor coverings(a)yyFurnitureyyGas and other household fuelsyyElectricityyyWater and sewerageyyProperty rates and chargesyyMaintenance and repair of the dwellingnnNew dwelling purchase by owner-occupiersyyRentsnnCleaning, repair and hire of clothing and footwearyyAccessoriesyyFootwear for infants and childrenyyFootwear for womennnFootwear for menyyGarments for infants and childrenyyGarments for womenyyGarments for menyyTobacco(a)nnBeerynWine(a)nnSpiritsnyTake away and fast foodsnnRestaurant mealsyyWaters, soft drinks and juicesnnCoffee, tea and cocoayyOther food products n.e.c.yySnacks and confectionerynnOils and fats(a)yyFood additives and condimentsnnJams, honey and spreadsnnEggsyyVegetablesyyFruityyIce cream and other dairy productsnnCheesennMilkyyFish and other seafoodyyOther meatsnnPoultryyyLamb and goatyyPorkyyBeef and vealyyOther cereal productsyyBreakfast cerealsyyCakes and biscuitsnnBread
Seasonally adjusted
following 2014 ASR
Seasonally adjusted prior to 2014
ASRCPI expend i t u r e c l a s s e s
TABLE 1 – SEASONAL ADJUSTMENT OF CPI EXPENDITURE CLASSES
A B S • CO N S U M E R P R I C E I N D E X • 6 4 0 1 . 0 • SE P QT R 2 0 1 4 37
A P P E N D I X S E A S O N A L A D J U S T M E N T O F TH E CP I continued
(a) In using this seasonally adjusted series, care should be exercised because of the difficulties associated withreliably estimating the seasonal pattern.
nnOther financial servicesnnDeposit and loan facilities (direct charges)yyInsurance(a)yyTertiary educationyySecondary educationyyPreschool and primary educationyyOther recreational, sporting and cultural servicesyySports participationyyVeterinary and other services for petsyyPets and related productsyyGames, toys and hobbiesnn
Equipment for sports, camping and open-airrecreation
yyInternational holiday travel and accommodationyyDomestic holiday travel and accommodationyyNewspapers, magazines and stationeryyyBooksnnAudio, visual and computing media and servicesynAudio, visual and computing equipmentnnTelecommunication equipment and servicesnnPostal servicesyyUrban transport faresyyOther services in respect of motor vehicles
Seasonally adjusted
following 2014 ASR
Seasonally adjusted prior to 2014
ASRCPI expend i t u r e c l a s s e s
TABLE 1 – SEASONAL ADJUSTMENT OF CPI EXPENDITURE CLASSES co n t i n u e d
38 A B S • CO N S U M E R P R I C E I N D E X • 6 4 0 1 . 0 • SE P QT R 2 0 1 4
A P P E N D I X S E A S O N A L A D J U S T M E N T O F TH E CP I continued
www.abs.gov.auWEB ADDRESS
All statistics on the ABS website can be downloaded freeof charge.
F R E E A C C E S S T O S T A T I S T I C S
Client Services, ABS, GPO Box 796, Sydney NSW 2001POST
Our consultants can help you access the full range ofinformation published by the ABS that is available free ofcharge from our website. Information tailored to yourneeds can also be requested as a 'user pays' service.Specialists are on hand to help you with analytical ormethodological advice.
I N F O R M A T I O N A N D R E F E R R A L S E R V I C E
www.abs.gov.au the ABS website is the best place fordata from our publications and information about the ABS.