Page 1
Consumer Response to
Sponsorship Leveraged Packaging –
a Fast Moving Consumer Goods Context
Frances M Woodside
B. Bus (Marketing) (First Class Honours)
Submitted in fulfilment of the degree of
Doctor of Philosophy
University of Southern Queensland
2010
Page 2
i
CERTIFICATION OF DISSERTATION
I certify that the ideas, results, analyses and conclusions reported in this dissertation are entirely my
own effort, except where otherwise acknowledged. I also certify that the work is original and has not
been previously submitted for any other award, except where otherwise acknowledged.
______________________ ______________
Signature of candidate: Date
ENDORSEMENT
______________________ ______________
Signature of Supervisor/s Date
______________________ ______________
Signature of Supervisor/s Date
Page 3
ii
Abstract
In the last decade, sponsorship has become a mainstream marketing communications
tool with worldwide sponsorship spending approaching US$45 billion. However, the
rapid growth of corporate sponsorship has led to the emergence of ‗sponsorship
clutter‘, a major challenge for companies seeking sponsorship opportunities. As the
market for sponsorship becomes intensely competitive, it is essential that sponsorship
investments be carefully managed to ensure their effectiveness.
One type of sponsorship leveraging that is widely used in the Australian Fast Moving
Consumer Goods industry (FMCG) is sponsorship leveraged packaging (SLP). SLP
involves depicting the sponsored property‘s image and logos on the sponsoring
brand‘s packaging. Despite its widespread use, little empirical research exists to
explain whether sponsorship leveraged packaging (SLP) impacts consumer
behaviour in low involvement settings. This research specifically addresses these
gaps in the known body of literature relating to sponsorship, packaging and
marketing communications by empirically investigating the relationship between
SLP and consumer behaviour.
Given the current trend of large sponsorship leverage investments, it becomes
increasingly important to have a clear understanding of what to expect when SLP is
used and how to maximise its impact on consumers and the marketplace. In this
research, image transfer theory, together with an attention-trial-response model are
presented in order to develop a framework to explain factors impacting consumer
response to SLP. Empirical results indicate that consumer response to SLP is
impacted by identification with the sponsored property and perceived fit of the
property and sponsor. Furthermore, the relationship is moderated by type of
sponsored property, awareness of the sponsorship, frequency of purchase of the
sponsoring brand and respondent characteristics. Theoretically, this research
provides understanding of a little explored context for sponsorship, i.e. FMCG. It
also provides strategic relevance for brand managers in guiding sponsorship
investment and package design decisions.
Page 4
iii
Table of Contents
Abstract .................................................................................................... ii
Publications Produced in Conjunction With This Thesis ................... x
Acknowledgements ................................................................................. xi
1 Introduction .......................................................................................... 1
1.1 Sponsorship as a Marketing Communications Tool: an Overview ....................... 1
1.2 Purpose of the Research ......................................................................................... 3
1.3 Justification for the Research ................................................................................. 3
1.3.1 Academic Contributions .................................................................................. 4
1.3.2 Contributions to Practice ................................................................................. 5
1.4 Methodology .......................................................................................................... 5
1.4.1 Stage One: Literature Review and Research Design. ...................................... 6
1.4.2 Stage Two: Study 1 .......................................................................................... 7
1.4.3 Stage 3: Study 2 ............................................................................................... 7
1.4.4 Research Paradigm and Methodology ............................................................. 8
1.5 Delimitations of Scope and Definitions ................................................................. 9
1.6 Outline of the Thesis ............................................................................................ 10
1.7 Conclusion ........................................................................................................... 11
Chapter 2 Literature Review ............................................................... 12
2.1 Introduction .......................................................................................................... 12
2.2 Marketing Communications ................................................................................ 13
2.3 Sponsorship .......................................................................................................... 16
2.3.1 Sponsorship Defined ...................................................................................... 17
2.3.2 Sponsorship Types ......................................................................................... 21
2.3.3 Sponsorship Research .................................................................................... 22
2.4 Theoretical Framework – Sponsorship Processing Mechanics ........................... 23
2.4.1 Low Level Processing .................................................................................... 25
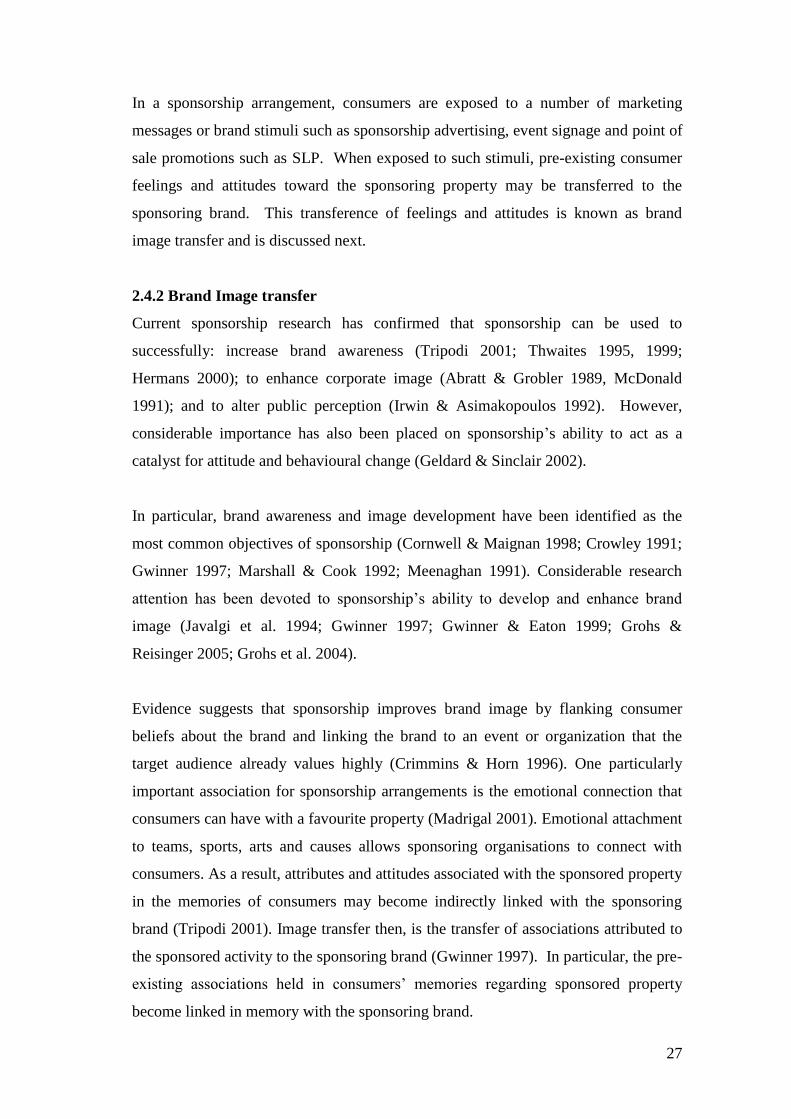
2.4.2 Brand Image transfer ..................................................................................... 27
2.4.3 Sponsored Property Identification ................................................................. 30
2.4.4 Perceived Fit .................................................................................................. 32
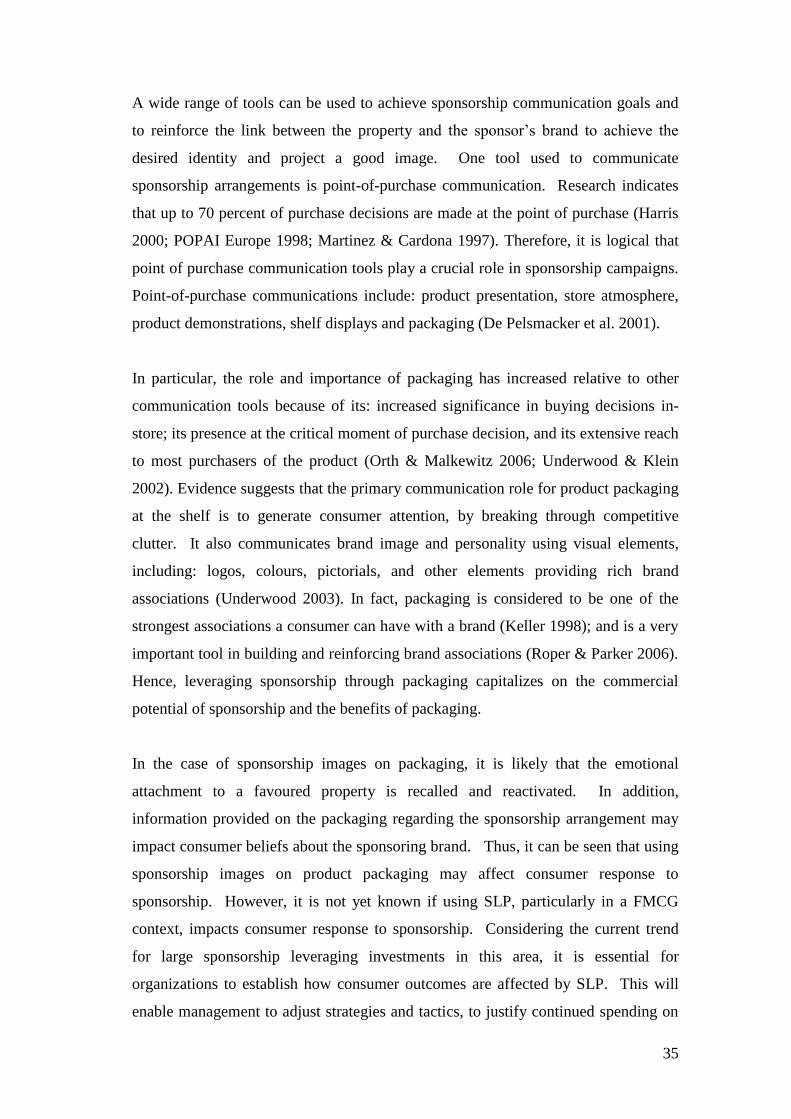
2.5 Leveraging Sponsorship Through Packaging ...................................................... 34
Page 5
iv
2.6 Consumer Response to Sponsorship Messages ................................................... 36
2.6.1 Hierarchy of Effects Model ........................................................................... 36
2.6.2 Attention, Trial, Reinforcement Model ......................................................... 37
2.6.3 Consumer Attitudes Toward the Sponsoring Brand ...................................... 39
2.6.4 Brand Experience ........................................................................................... 39
2.6.5 Purchase Intention Toward the Sponsor‘s Products ...................................... 40
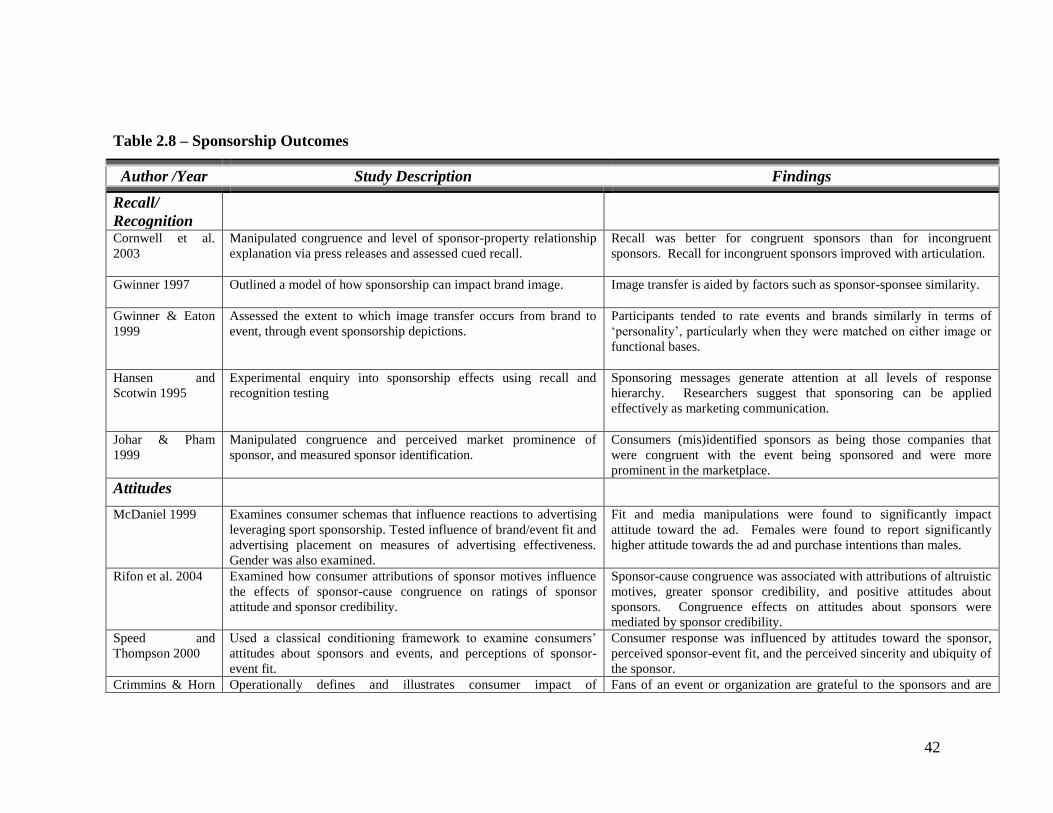
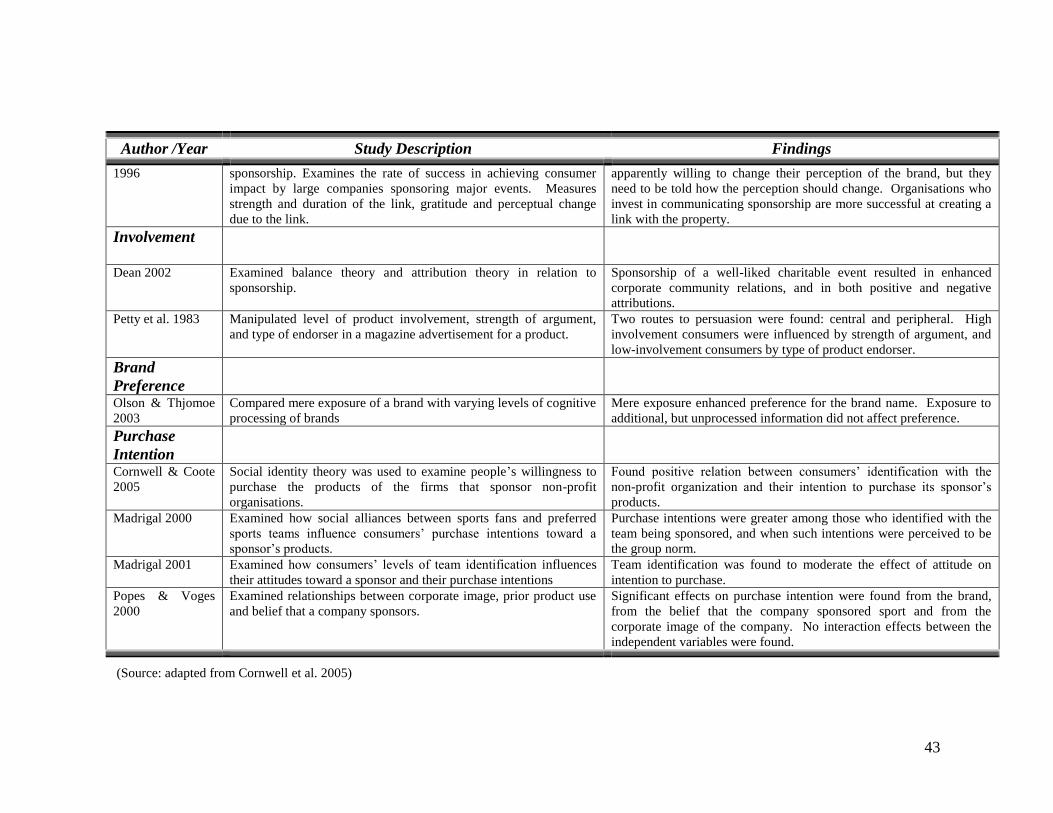
2.6.6 Trial Intention Toward the Sponsor‘s Products ............................................. 41
2.7 Preliminary Model - Factors Impacting Consumer Response to SLP ................. 44
2.8 Conclusion ........................................................................................................... 47
Chapter 3 Study 1.................................................................................. 48
3.1 Introduction .......................................................................................................... 48
3.2 Theoretical Foundations ...................................................................................... 49
3.3 Rationale and Objectives for Study 1 .................................................................. 52
3.4 Methodology for Study 1 - Exploratory Research ............................................... 53
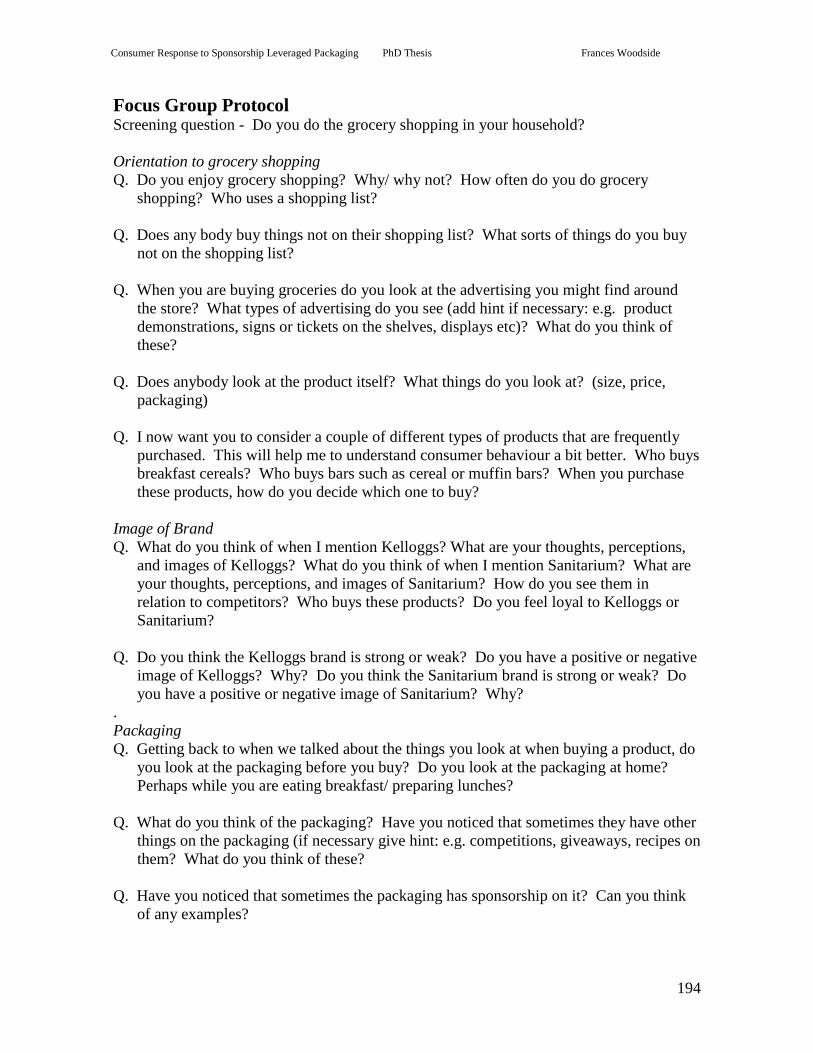
3.4.1 Step 1 - Focus Group Methodology ............................................................... 53
3.4.2 Step - 1 Focus Group Findings ...................................................................... 56
3.4.3 Step 2 - Depth Interview Methodology ......................................................... 60
3.4.4 Step 2 - Depth Interview Findings ................................................................. 62
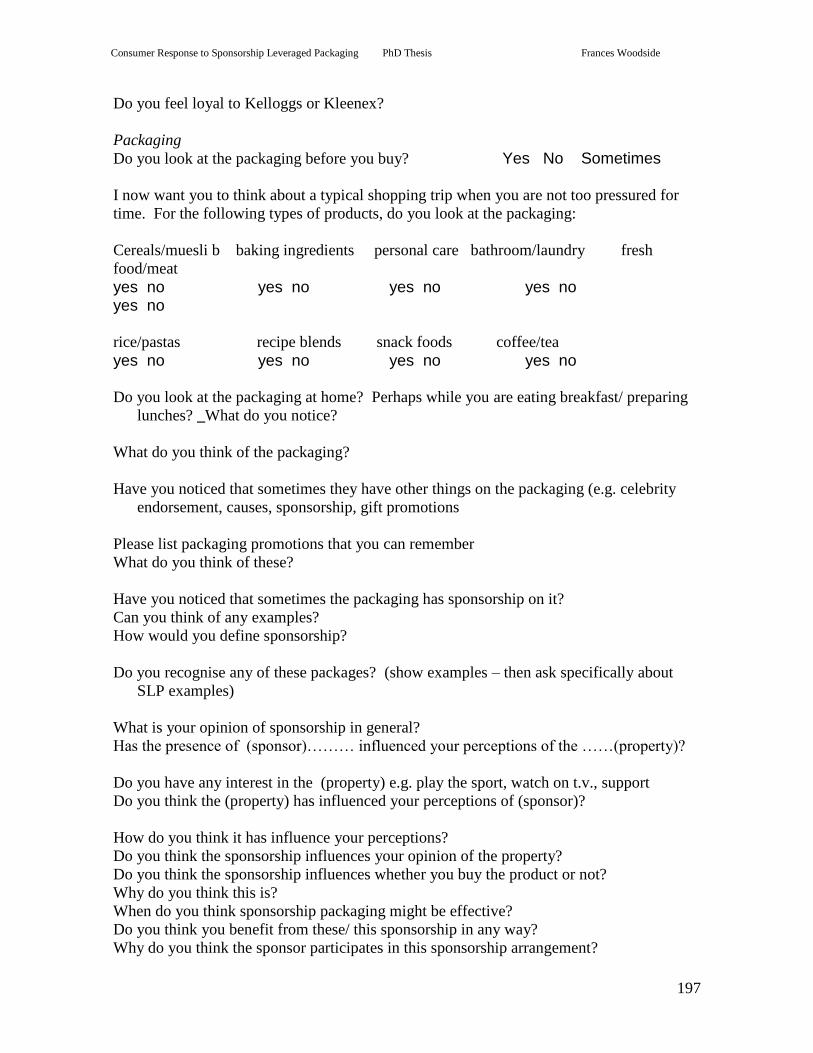
3.4.4 Step 3 - Qualitative Survey Methodology ..................................................... 64
3.4.5 Step 3 - Qualitative Survey Findings ............................................................. 66
3.5 Discussion of Results from Study 1 ..................................................................... 69
3.6 Revised Model and Hypotheses ........................................................................... 75
3.7 Conclusions .......................................................................................................... 76
Chapter 4 – Study 2 Methodology ....................................................... 77
4.1 Introduction .......................................................................................................... 77
4.2 Rationale for Research Method ........................................................................... 77
4.3 Study 2 Methodology ........................................................................................... 79
4.3.1 Experiment Design ........................................................................................ 79
4.3.2 Questionnaire Design and Measurement Scales ............................................ 82
4.3.3 Sampling ........................................................................................................ 97
4.3.4 Ethical Considerations ................................................................................... 98
4.3.5 Data Analysis Strategies ................................................................................ 99
4.4 Conclusion ......................................................................................................... 103
Page 6
v
Chapter 5 – Study 2 Results ............................................................... 104
5.1 Introduction ........................................................................................................ 104
5.2 Development of Conceptual Model and Hypotheses ........................................ 105
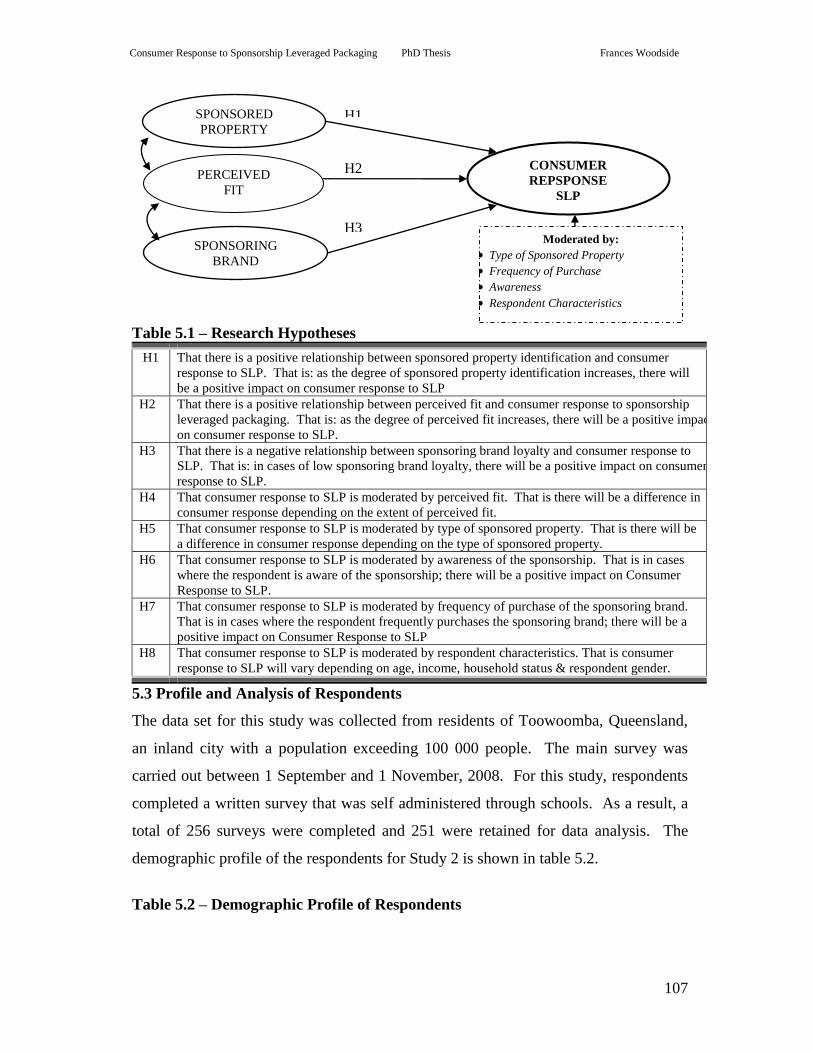
5.3 Profile and Analysis of Respondents ................................................................. 107
5.3.1 Response Rate .............................................................................................. 109
5.3.2 Assessment of Profiles ................................................................................. 109
5.4 Preliminary Analysis .......................................................................................... 109
5.4.1. Cleaning and Screening .............................................................................. 110
5.4.2 Descriptive Statistics .................................................................................... 113
5.5 Measurement Models ......................................................................................... 117
5.5.1 Sponsored Property Identification Scale ...................................................... 121
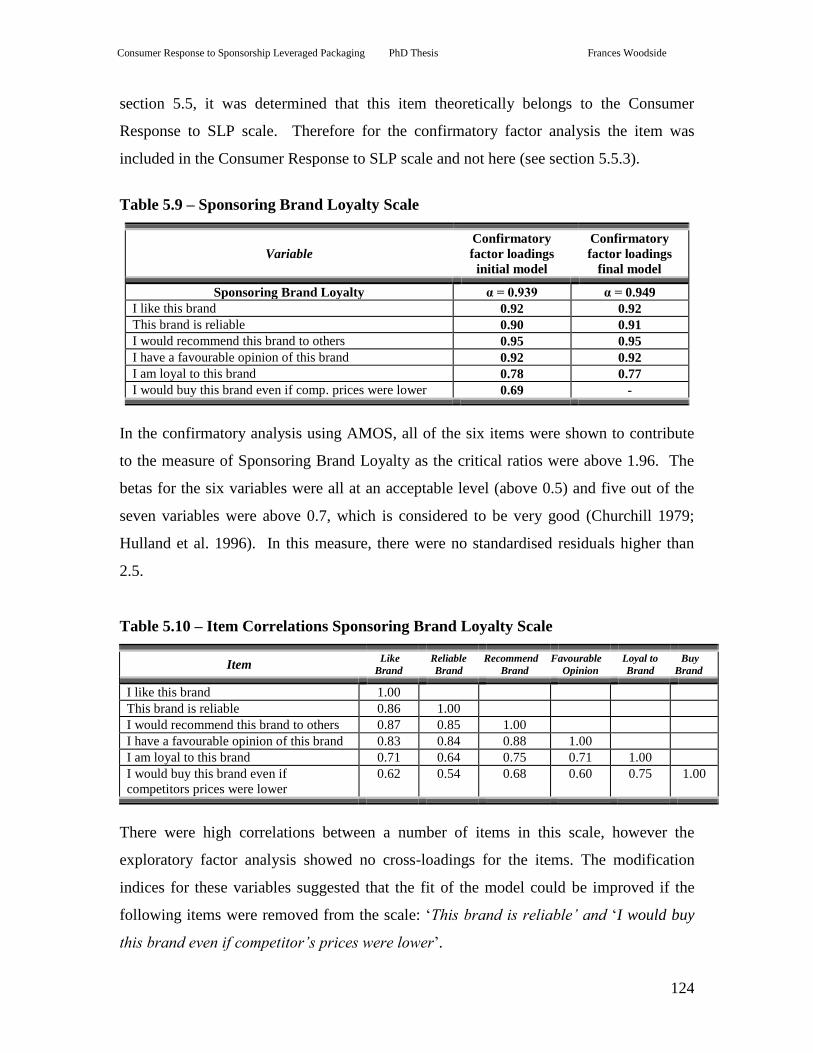
5.5.2 Sponsoring Brand Loyalty scale .................................................................. 123
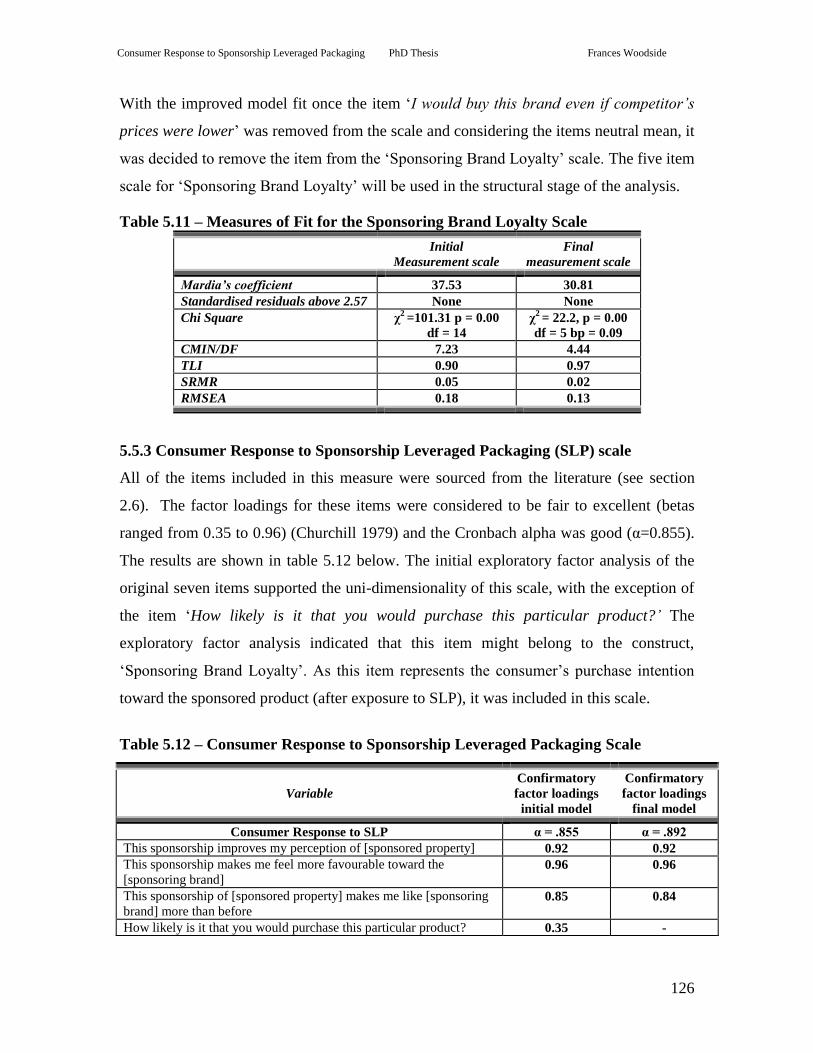
5.5.3 Consumer Response to Sponsorship Leveraged Packaging (SLP) scale ..... 126
5.5.4 Perceived Fit Scale ....................................................................................... 129
5.5.5 Four Factor Measurement Model ................................................................ 131
5.6 Analysis of the Structural Models and Tests of Hypotheses ............................. 136
5.6.1 Descriptive Statistics .................................................................................... 136
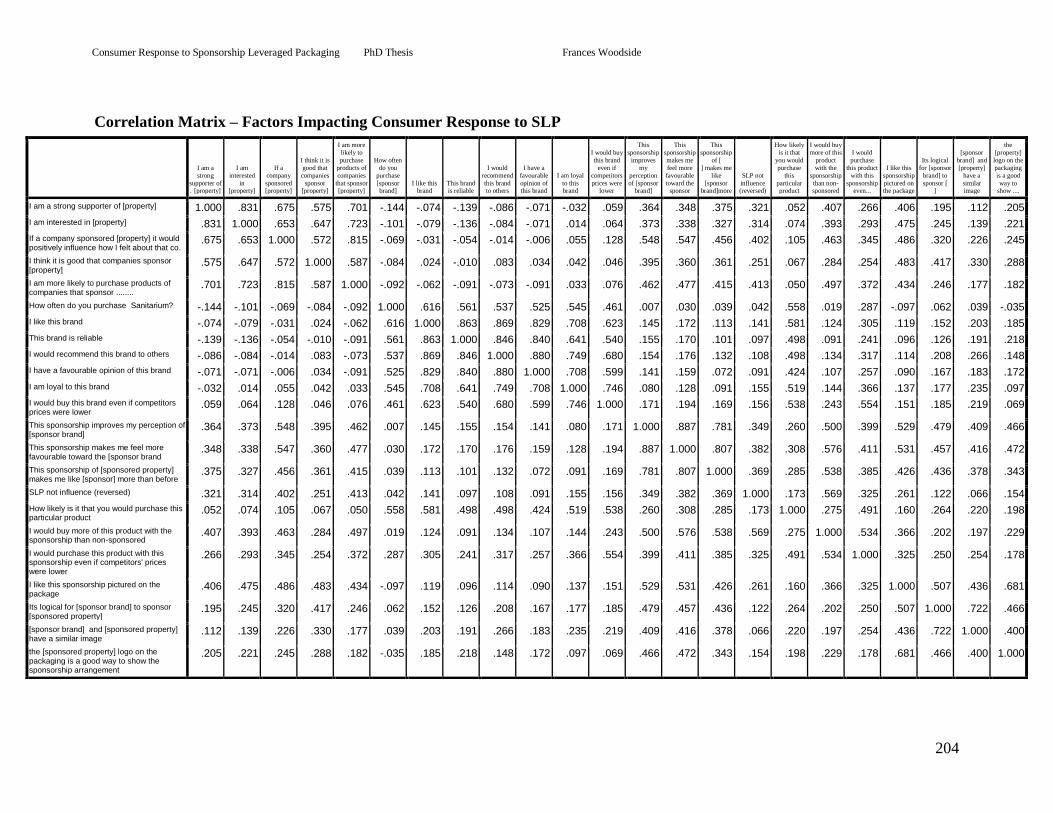
5.6.2 Correlation Analysis .................................................................................... 137
5.6.3 Structural Equation Model Factors Impacting Consumer Response to SLP 138
5.7 Moderating Hypotheses ..................................................................................... 142
5.7.1 Type of Sponsored Property ........................................................................ 143
5.7.2 Awareness of Sponsorship ........................................................................... 145
5.7.3 Frequency of Purchase ................................................................................. 147
5.7.4 Demographic Groups ................................................................................... 150
5.8 Conclusions ........................................................................................................ 152
Chapter 6 .............................................................................................. 154
6.1 Introduction ........................................................................................................ 154
6.2 Implications of Results of Study 2 ..................................................................... 157
6.3 Conclusions about the Research Purpose .......................................................... 165
6.4 Theoretical Contribution .................................................................................... 167
6.5 Implications for Practice .................................................................................... 170
6.6 Limitations and Future Research ....................................................................... 171
Page 7
vi
LIST OF REFERENCES ................................................................... 174
APPENDIX 1 – EXPLORATORY RESEARCH PROTOCOLS .. 193
APPENDIX 2 – STUDY 2 QUESTIONNAIRE VERSIONS .......... 202
APPENDIX 3 – CORRELATION MATRIX ................................... 203
Page 8
vii
List of Tables
Table 1.1 – Summary of Research Program ................................................................ 6
Table 2.1 – Definitions of Sponsorship ..................................................................... 17
Table 2.2 – Types of Sponsorship ............................................................................. 22
Table 2.3 – Sponsorship Research Streams ............................................................... 22
Table 2.4 – Sponsorship Processing Mechanics ........................................................ 24
Table 2.5 – Image transfer Study Findings ................................................................ 29
Table 2.6 – Sponsored Property Identification Study Findings ................................. 31
Table 2.7 – Congruency Study Findings ................................................................... 33
Table 2.8 – Sponsorship Outcomes ........................................................................... 42
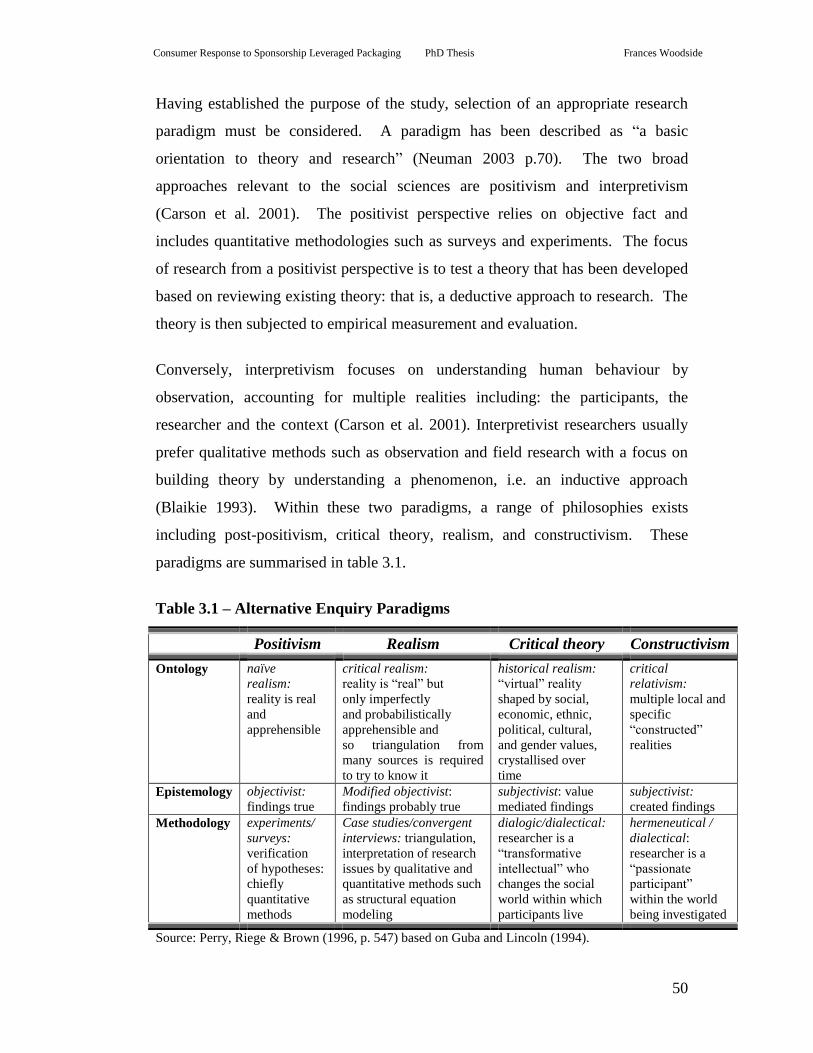
Table 3.1 – Alternative Enquiry Paradigms ............................................................... 50
Table 3.2 – Focus Group Profiles .............................................................................. 55
Table 3.3 – Depth Interview Profiles ......................................................................... 61
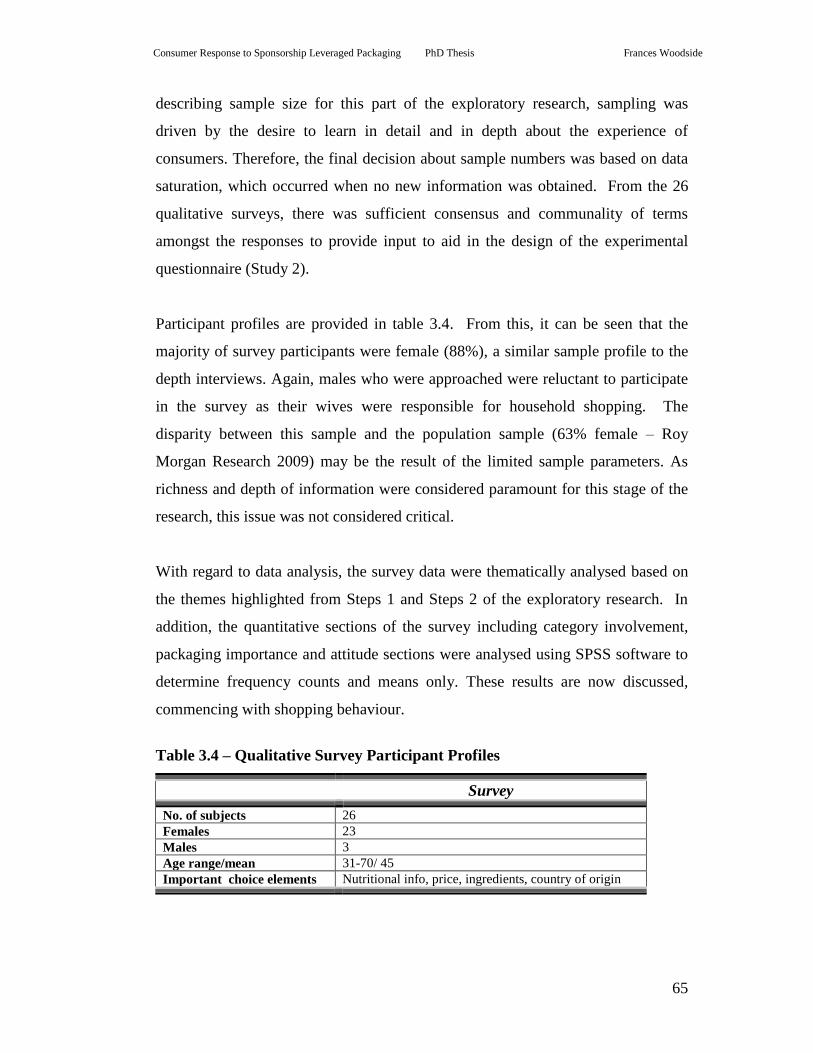
Table 3.4 – Qualitative Survey Participant Profiles .................................................. 65
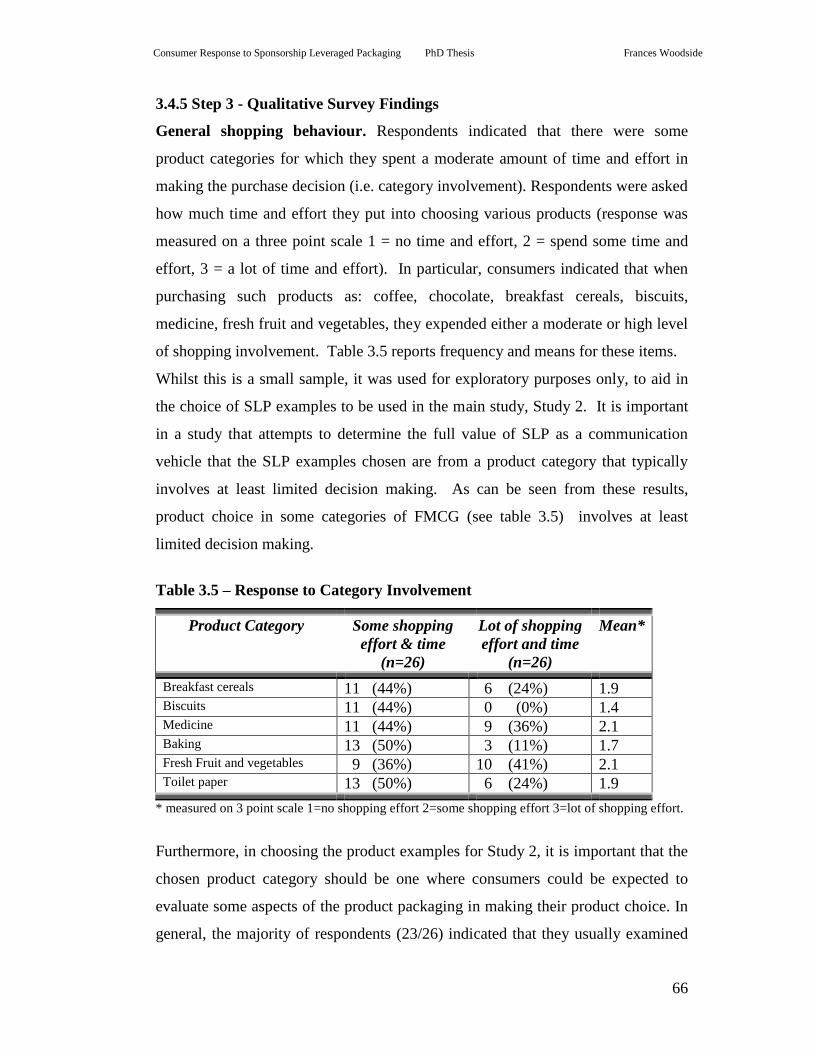
Table 3.5 – Response to Category Involvement ........................................................ 66
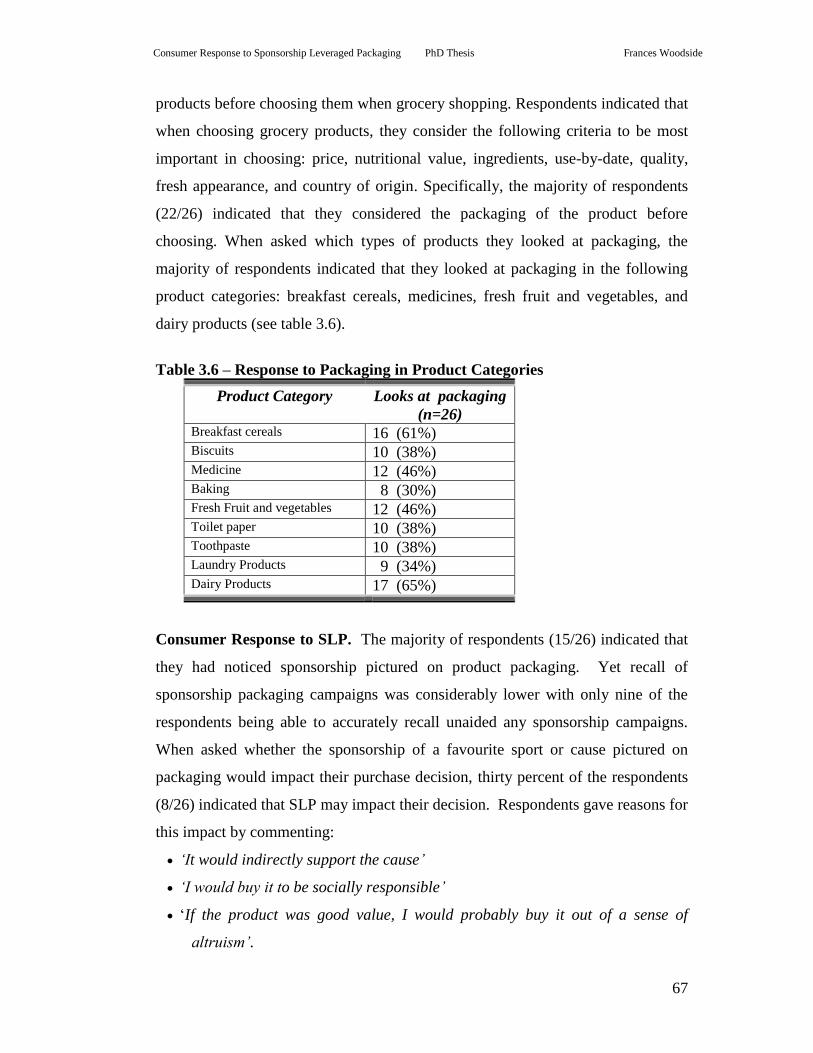
Table 3.6 – Response to Packaging in Product Categories ........................................ 67
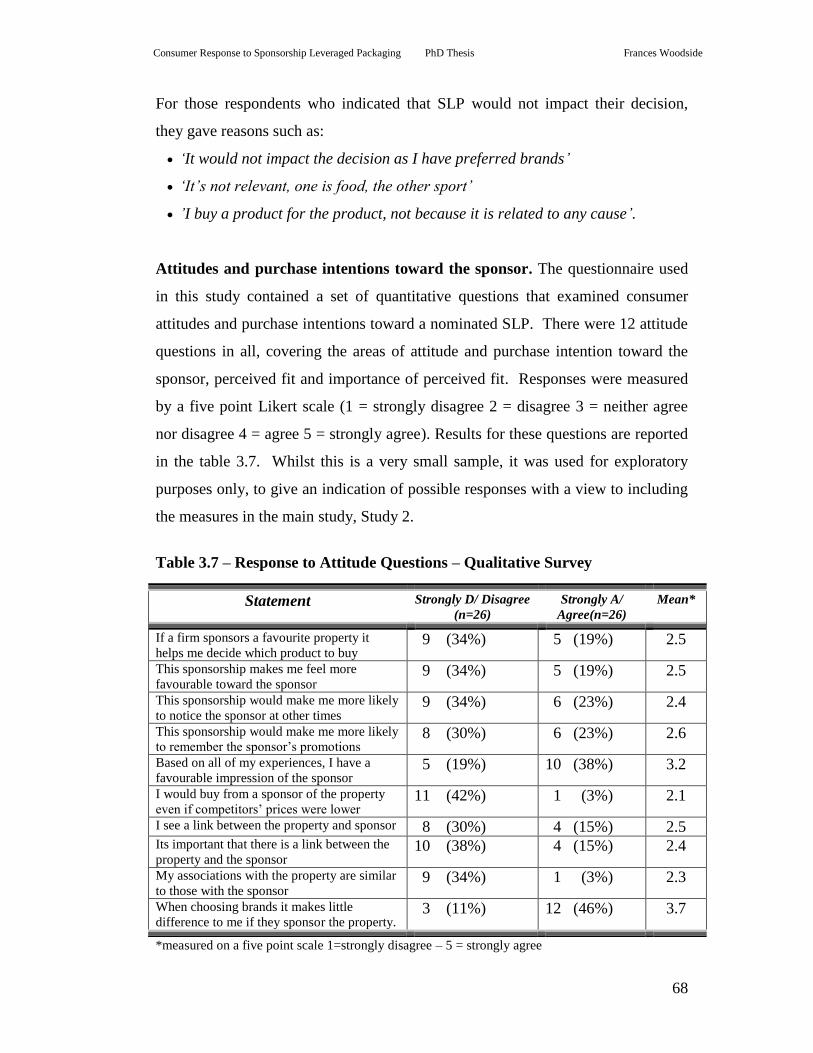
Table 3.7 – Response to Attitude Questions – Qualitative Survey ............................ 68
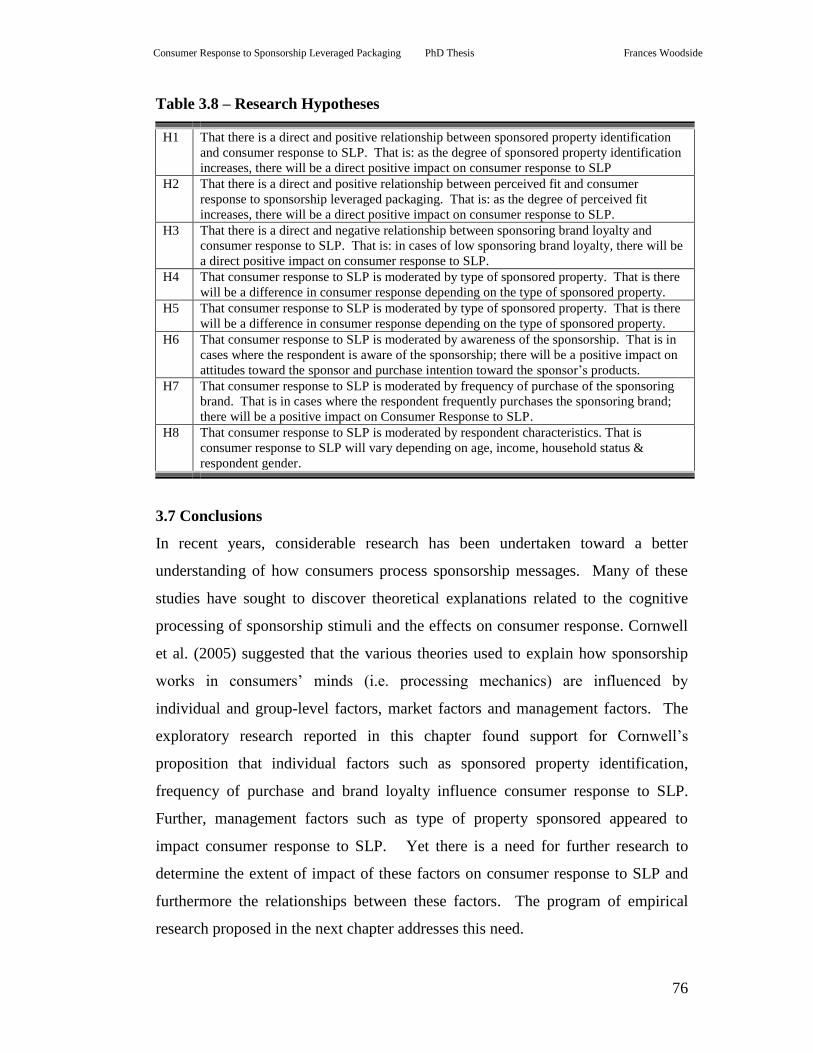
Table 3.8 – Research Hypotheses .............................................................................. 76
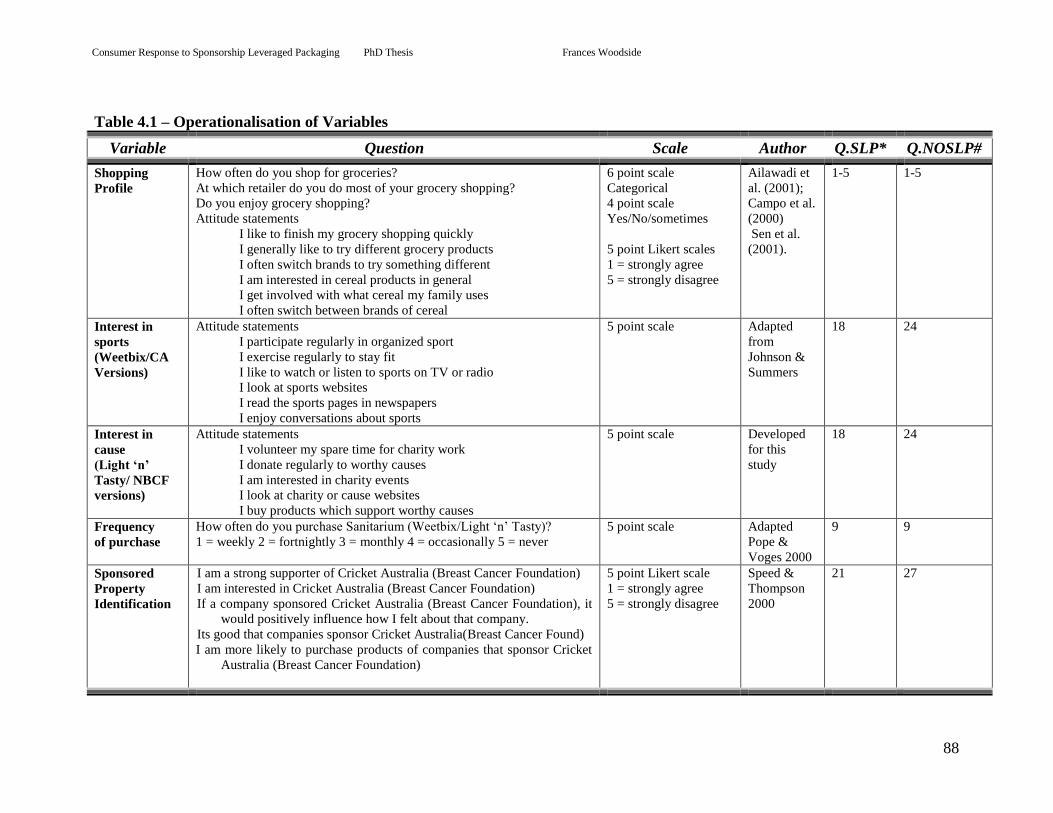
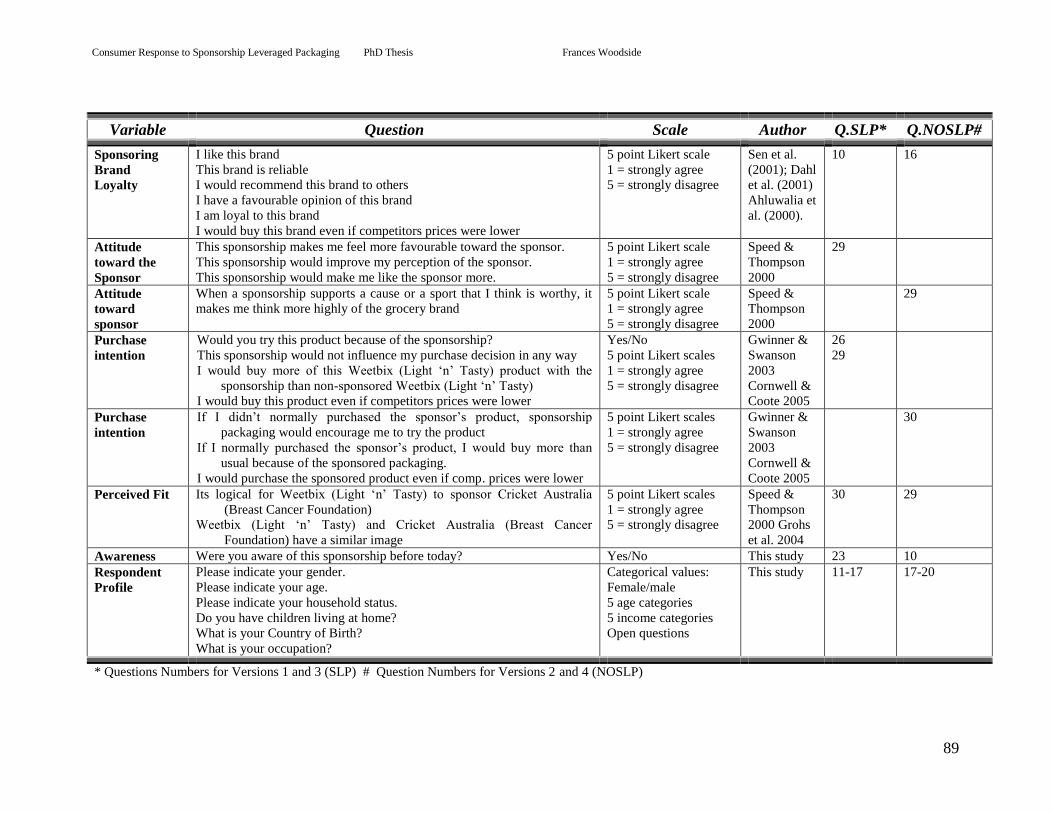
Table 4.1 – Operationalisation of Variables .............................................................. 88
Table 4.2 – Validity and Reliability ........................................................................... 94
Table 5.1 – Research Hypotheses ............................................................................ 107
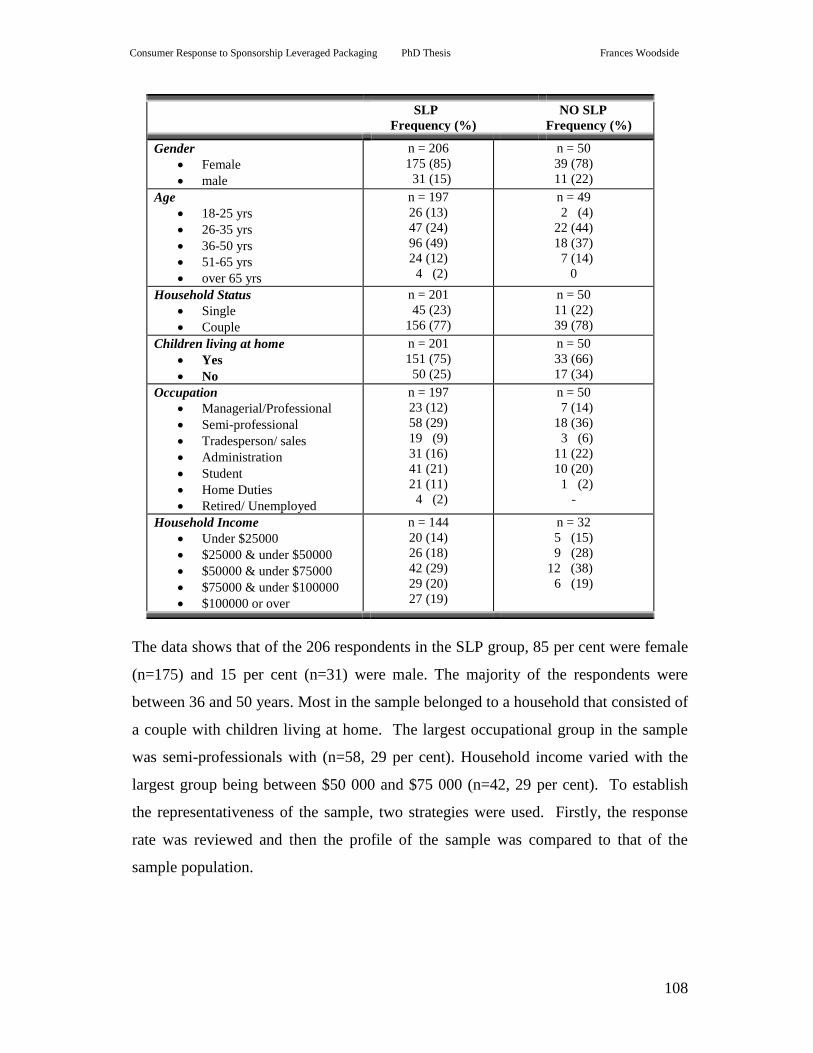
Table 5.2 – Demographic Profile of Respondents ................................................... 107
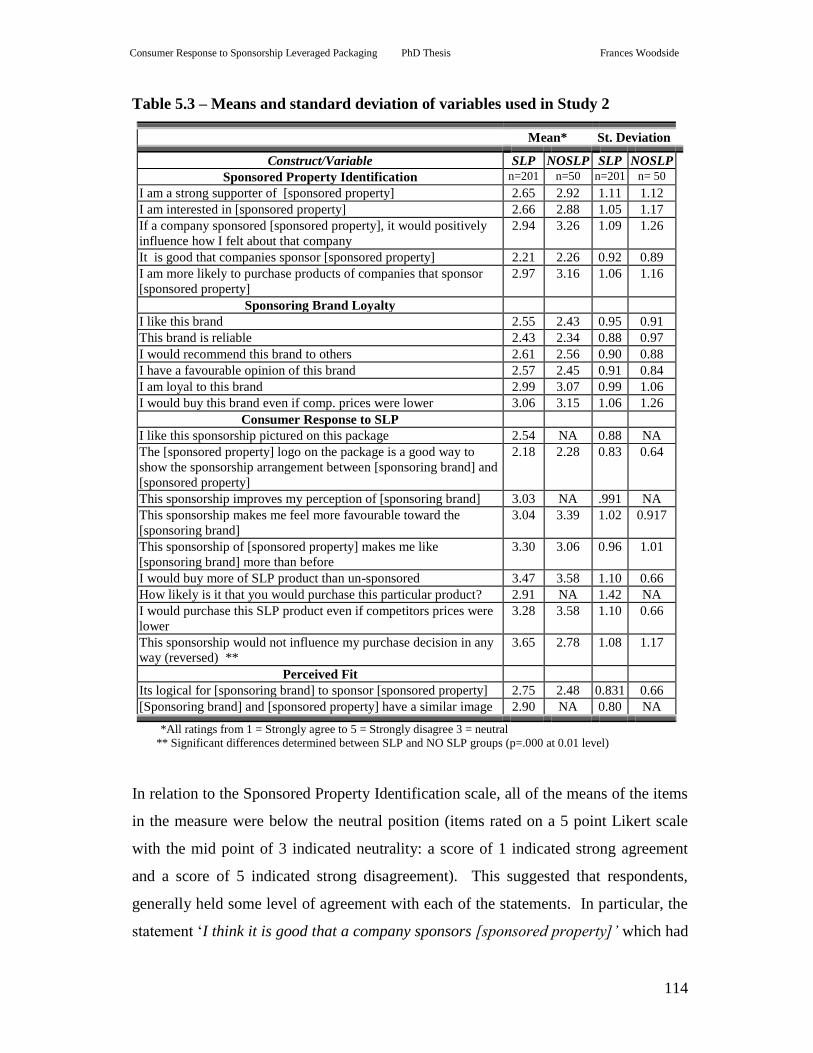
Table 5.3 – Means and standard deviation of variables used in Study 2 ................. 114
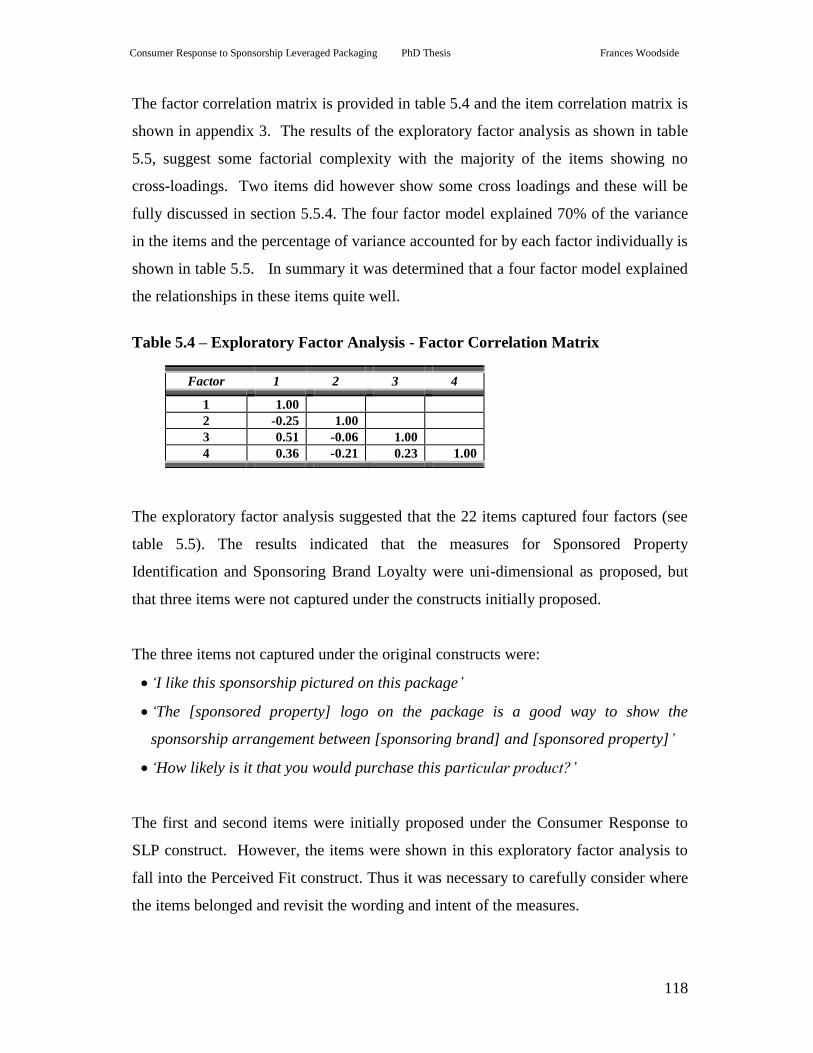
Table 5.4 – Exploratory Factor Analysis - Factor Correlation Matrix .................... 118
Table 5.5 – Pattern Matrix Study 2 .......................................................................... 120
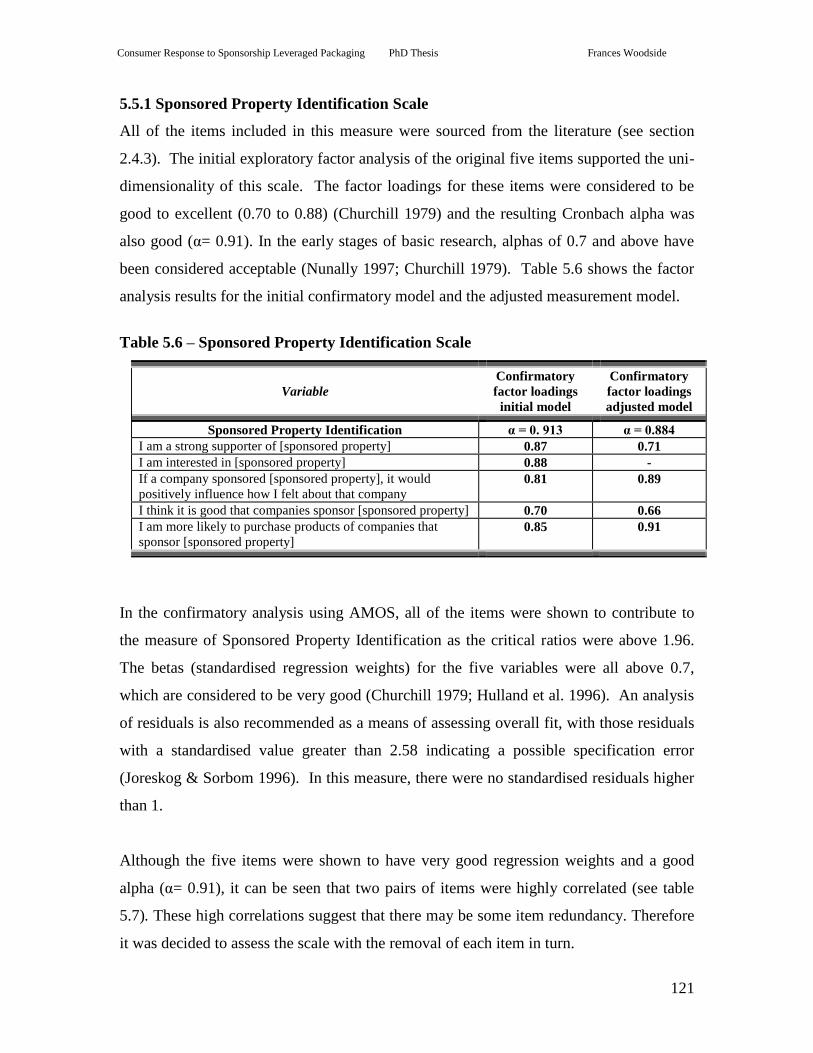
Table 5.6 – Sponsored Property Identification Scale .............................................. 121
Table 5.7 – Item Correlations Sponsored Property Identification Scale ................. 122
Table 5.8 – Measures of Fit for the Sponsored Property Identification Scale ......... 122
Table 5.9 – Sponsoring Brand Loyalty Scale .......................................................... 124
Table 5.10 – Item Correlations Sponsoring Brand Loyalty Scale ........................... 124
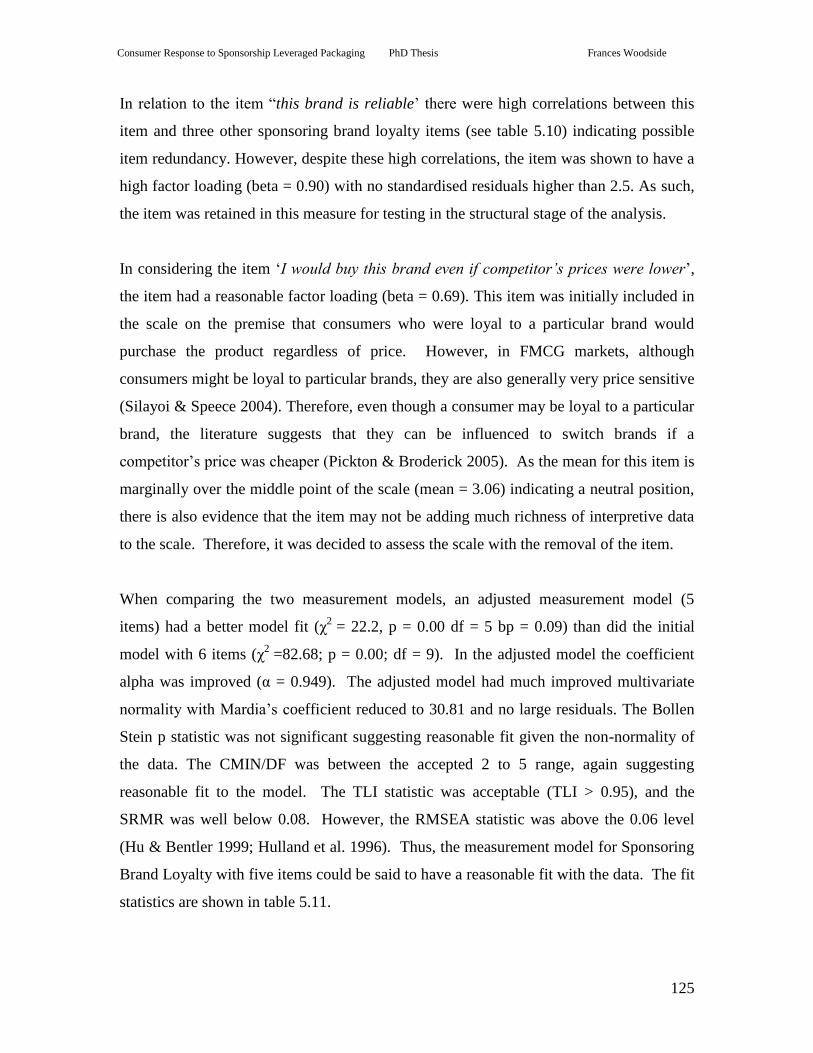
Table 5.11 – Measures of Fit for the Sponsoring Brand Loyalty Scale ................... 126
Table 5.12 – Consumer Response to Sponsorship Leveraged Packaging Scale ..... 126
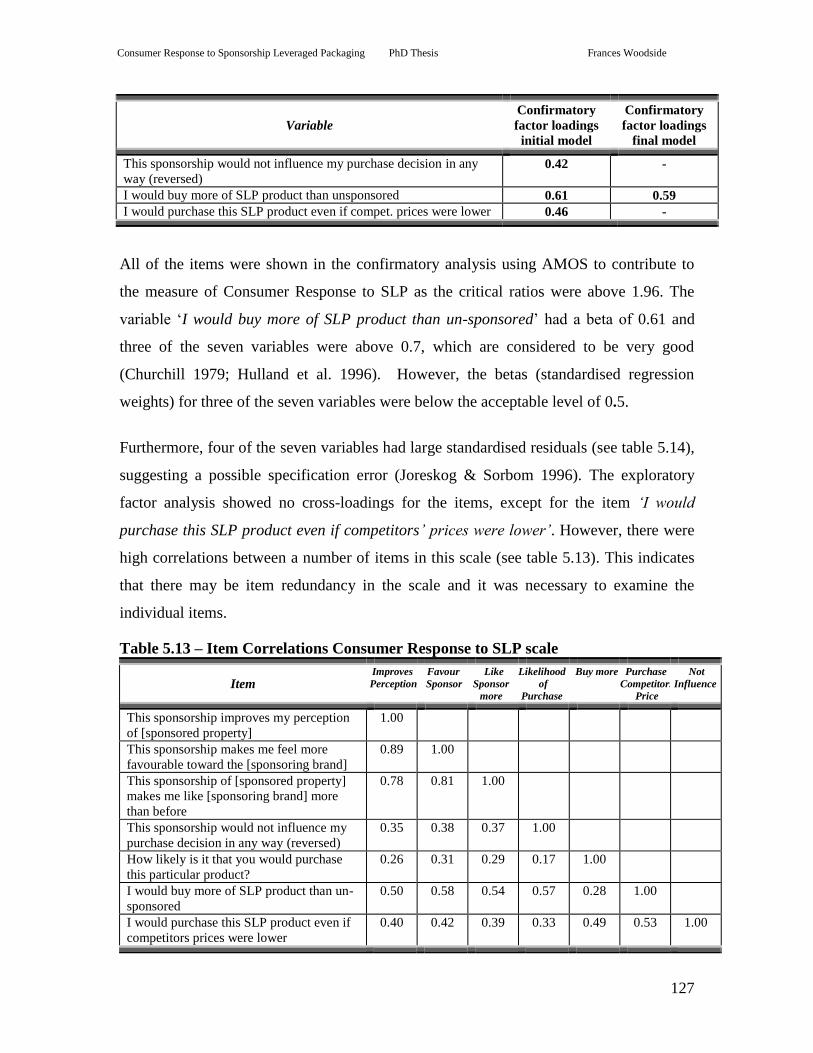
Table 5.13 – Item Correlations Consumer Response to SLP scale ......................... 127
Page 9
viii
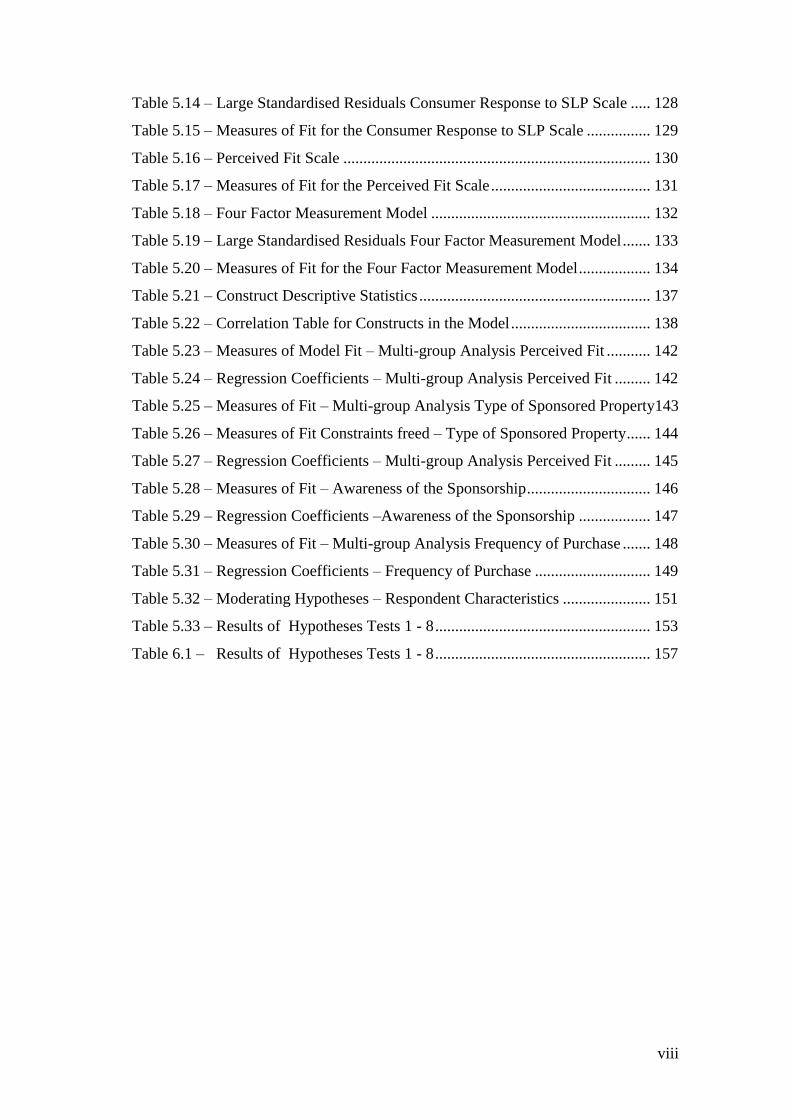
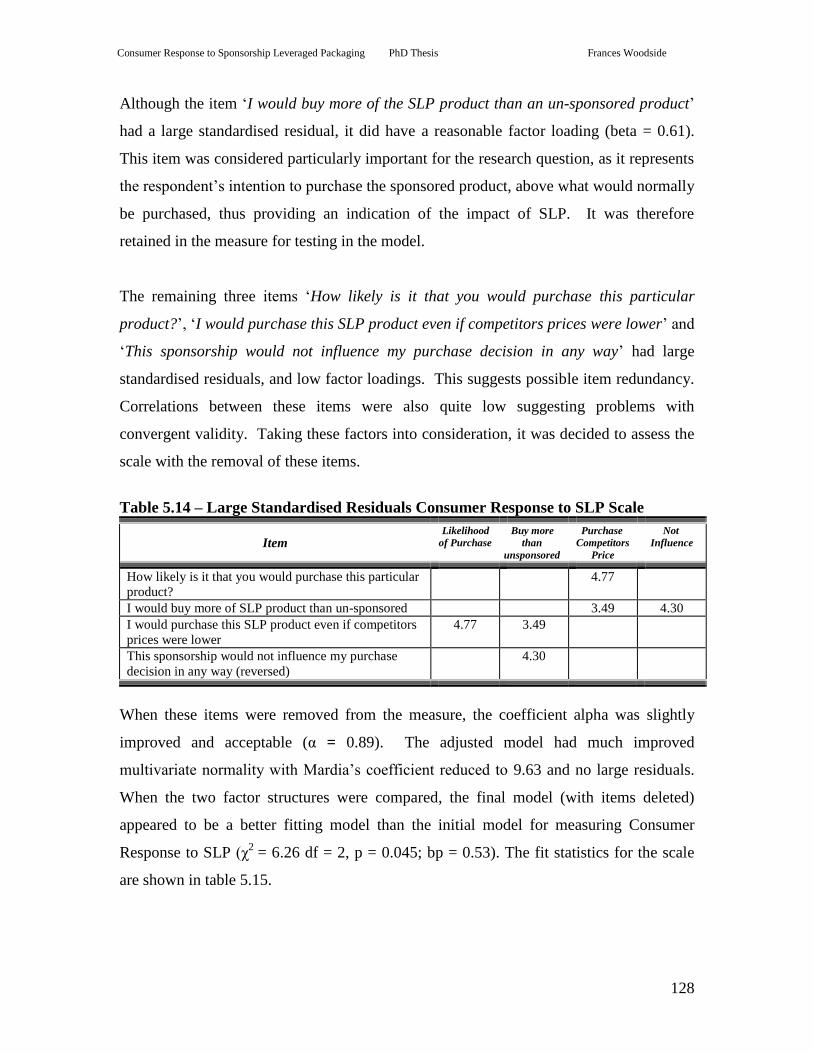
Table 5.14 – Large Standardised Residuals Consumer Response to SLP Scale ..... 128
Table 5.15 – Measures of Fit for the Consumer Response to SLP Scale ................ 129
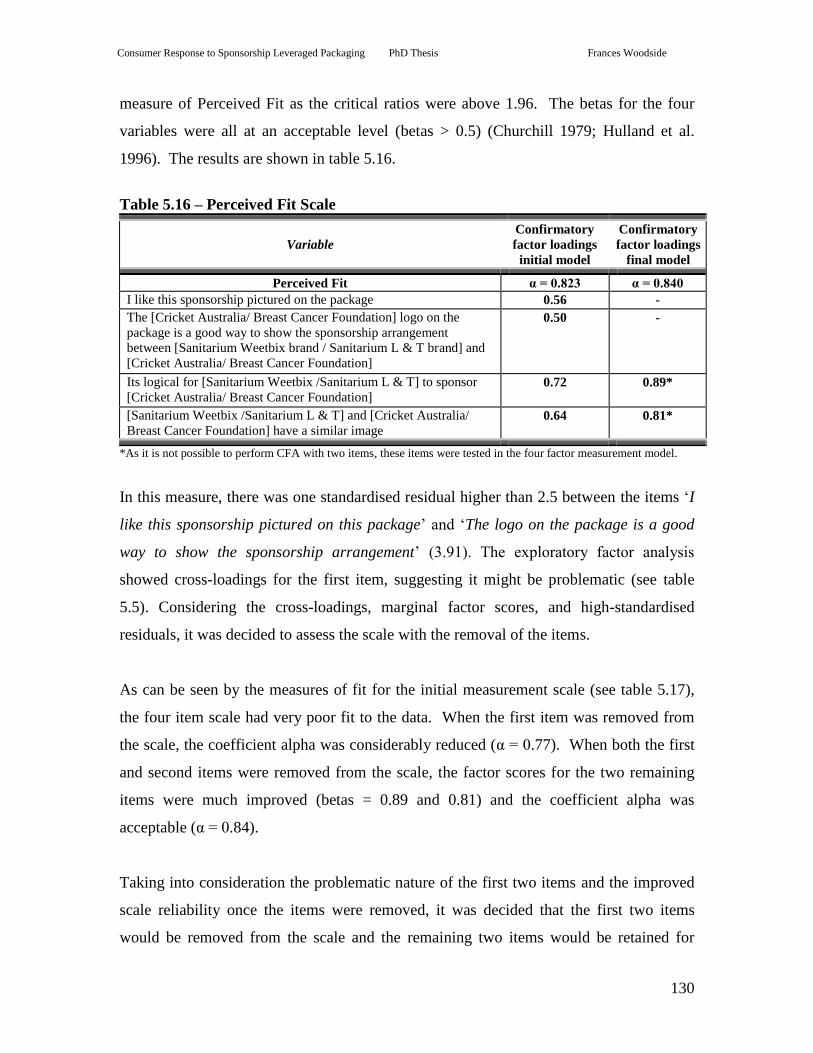
Table 5.16 – Perceived Fit Scale ............................................................................. 130
Table 5.17 – Measures of Fit for the Perceived Fit Scale ........................................ 131
Table 5.18 – Four Factor Measurement Model ....................................................... 132
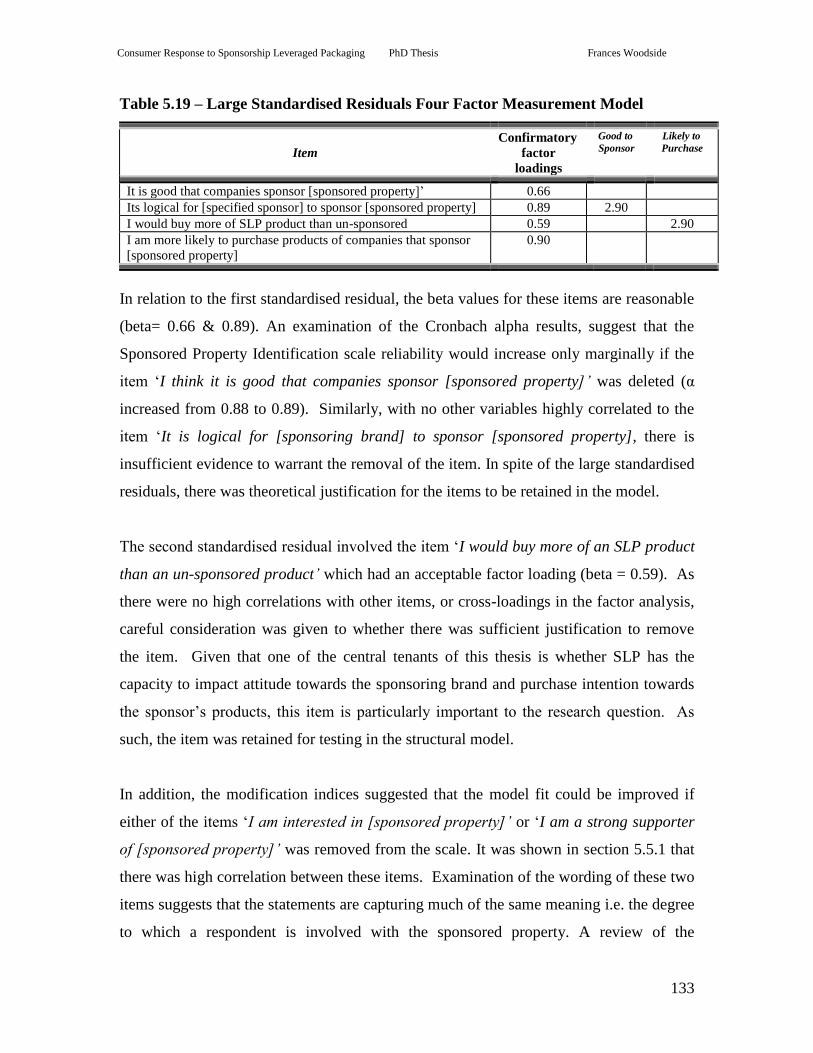
Table 5.19 – Large Standardised Residuals Four Factor Measurement Model ....... 133
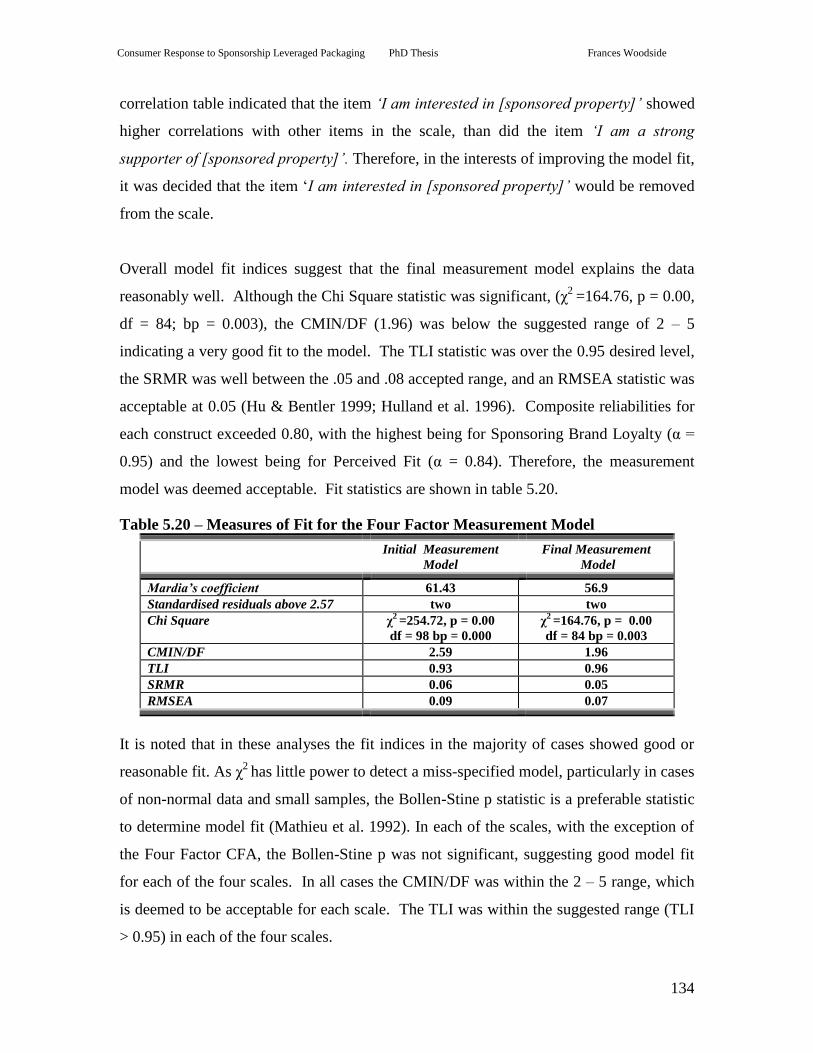
Table 5.20 – Measures of Fit for the Four Factor Measurement Model .................. 134
Table 5.21 – Construct Descriptive Statistics .......................................................... 137
Table 5.22 – Correlation Table for Constructs in the Model ................................... 138
Table 5.23 – Measures of Model Fit – Multi-group Analysis Perceived Fit ........... 142
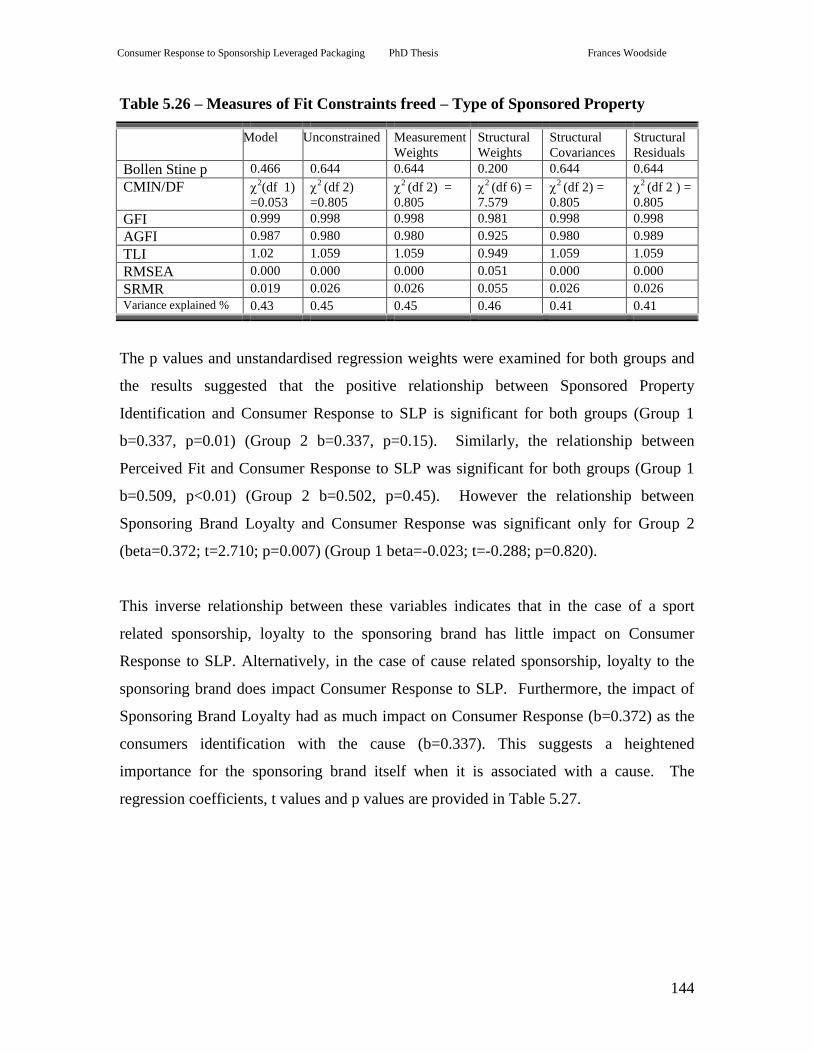
Table 5.24 – Regression Coefficients – Multi-group Analysis Perceived Fit ......... 142
Table 5.25 – Measures of Fit – Multi-group Analysis Type of Sponsored Property143
Table 5.26 – Measures of Fit Constraints freed – Type of Sponsored Property ...... 144
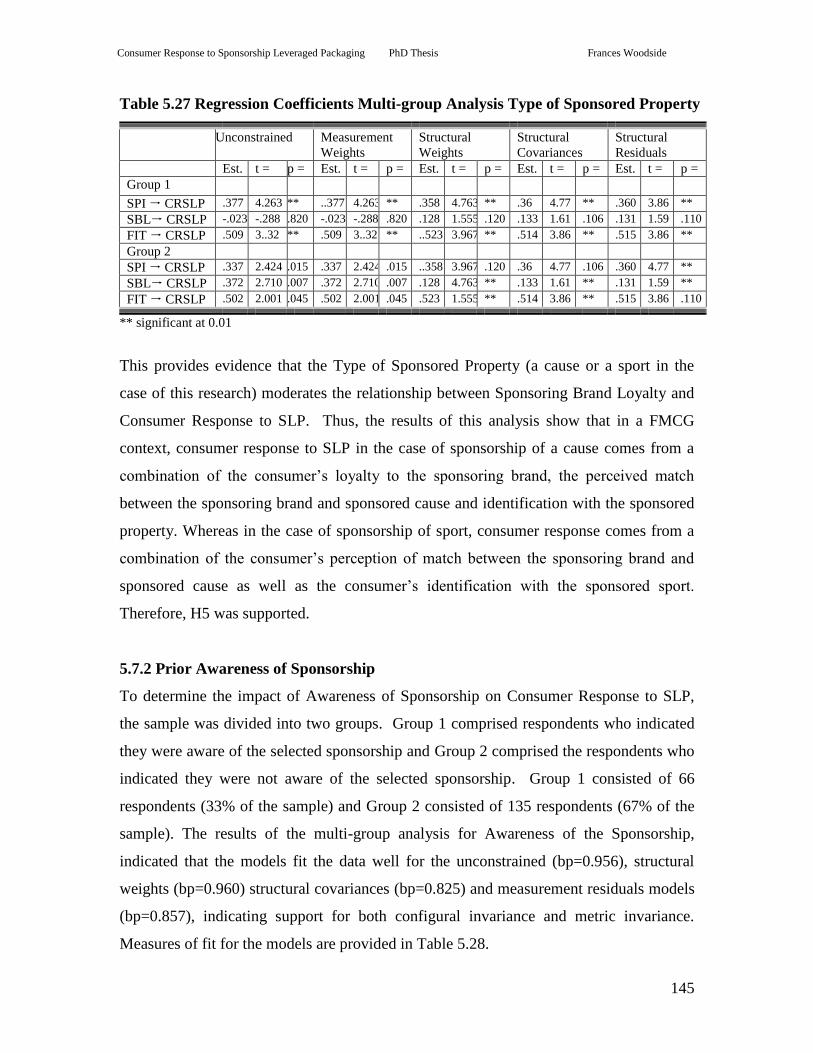
Table 5.27 – Regression Coefficients – Multi-group Analysis Perceived Fit ......... 145
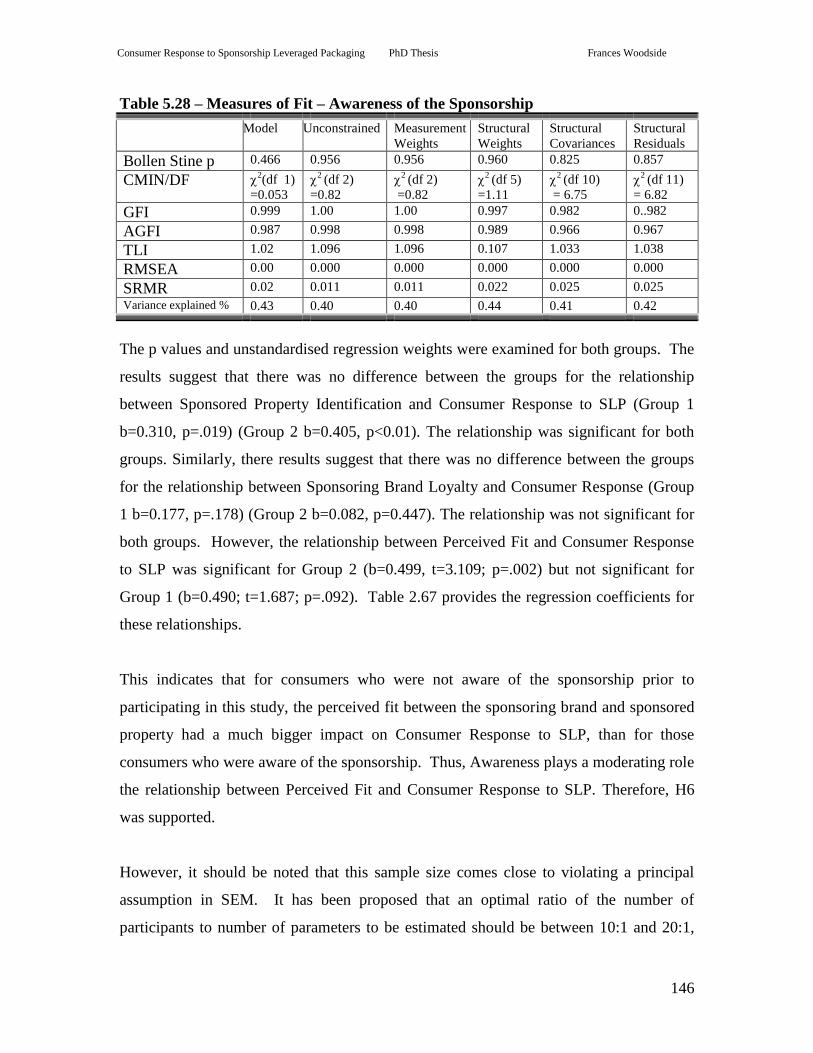
Table 5.28 – Measures of Fit – Awareness of the Sponsorship ............................... 146
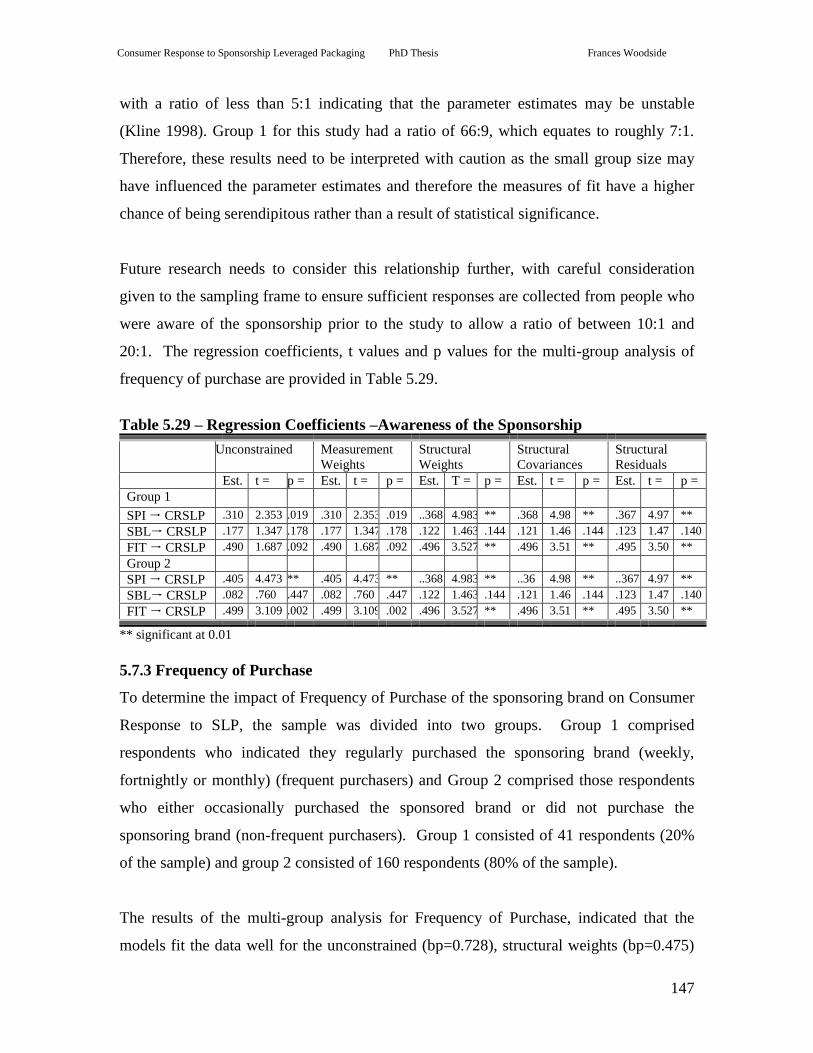
Table 5.29 – Regression Coefficients –Awareness of the Sponsorship .................. 147
Table 5.30 – Measures of Fit – Multi-group Analysis Frequency of Purchase ....... 148
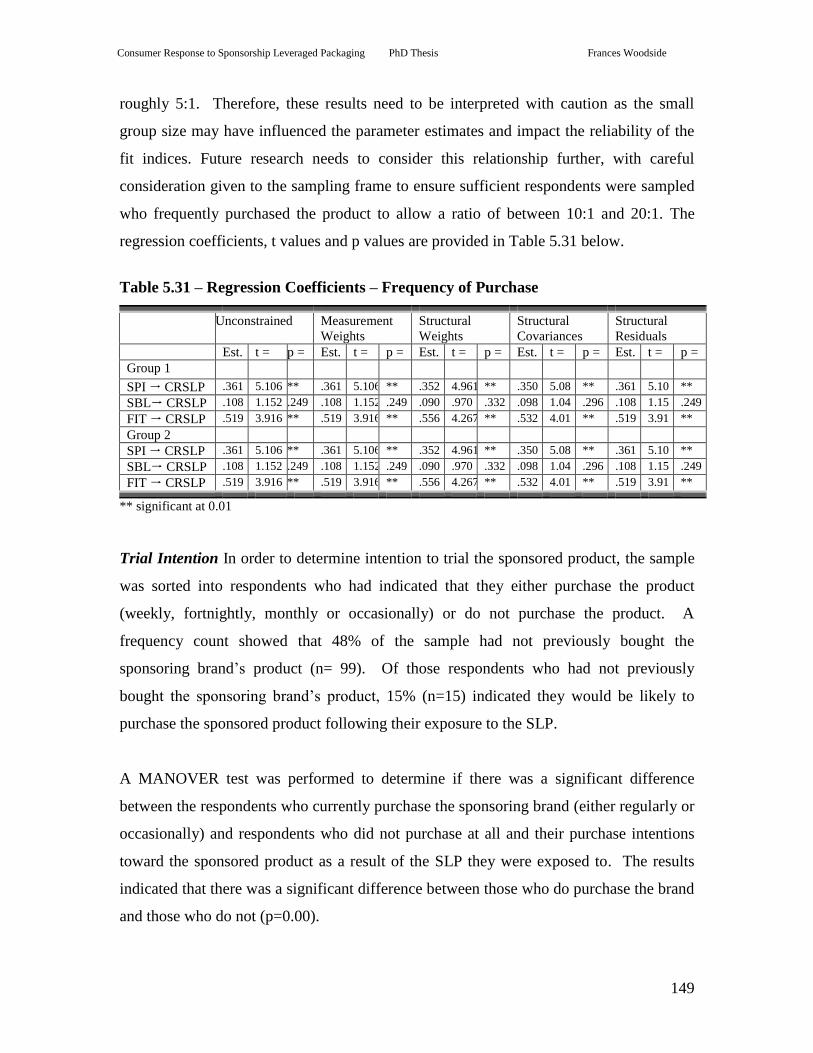
Table 5.31 – Regression Coefficients – Frequency of Purchase ............................. 149
Table 5.32 – Moderating Hypotheses – Respondent Characteristics ...................... 151
Table 5.33 – Results of Hypotheses Tests 1 - 8 ...................................................... 153
Table 6.1 – Results of Hypotheses Tests 1 - 8 ...................................................... 157
Page 10
ix
List of Figures
Figure 1.1 – Outline of the Thesis ............................................................................. 11
Figure 2.1 – Literature Review Sequence .................................................................. 12
Figure 2.2 – Model Sponsorship Linked Marketing Communications ..................... 24
Figure 2.3 – Preliminary Model - Factors Impacting Consumer Response to SLP .. 46
Figure 3.1 – Chapter Outline ..................................................................................... 49
Figure 3.2 – Revised Research Model for Study 2 .................................................... 75
Figure 4.1 – Chapter Outline ..................................................................................... 77
Figure 5.1 – Chapter Outline ................................................................................... 105
Figure 5.2 – Conceptual Model - Factors Impacting Consumer Response to SLP . 106
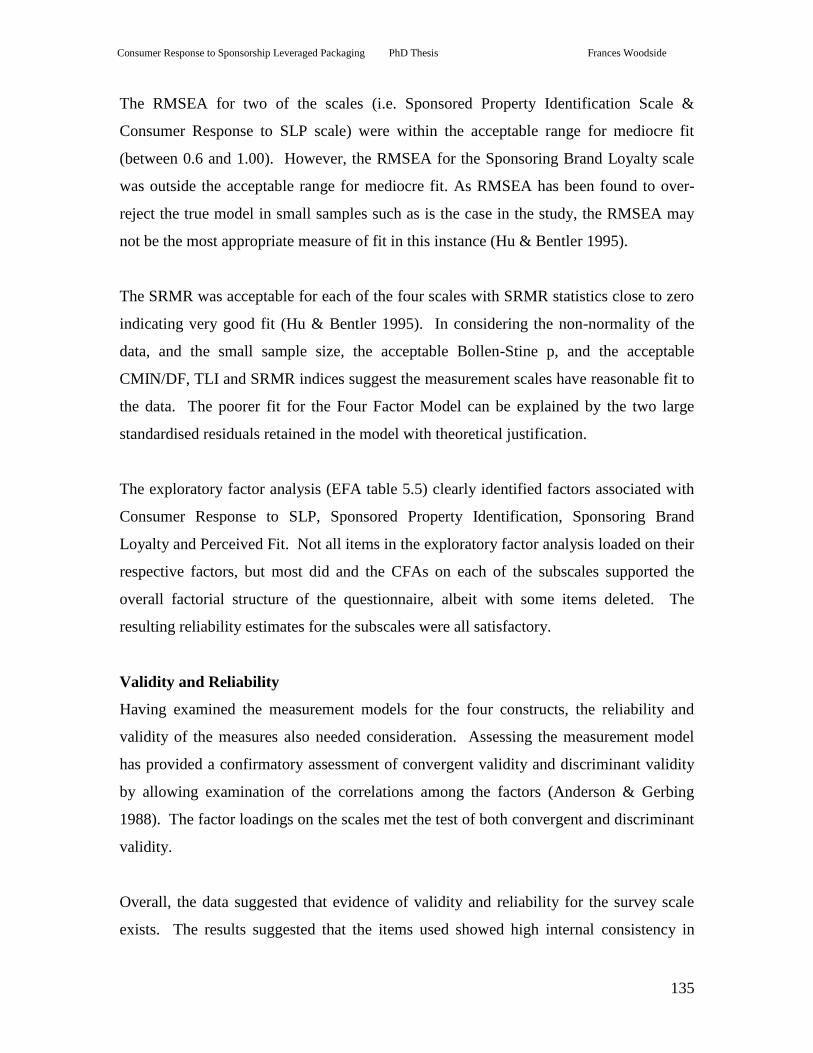
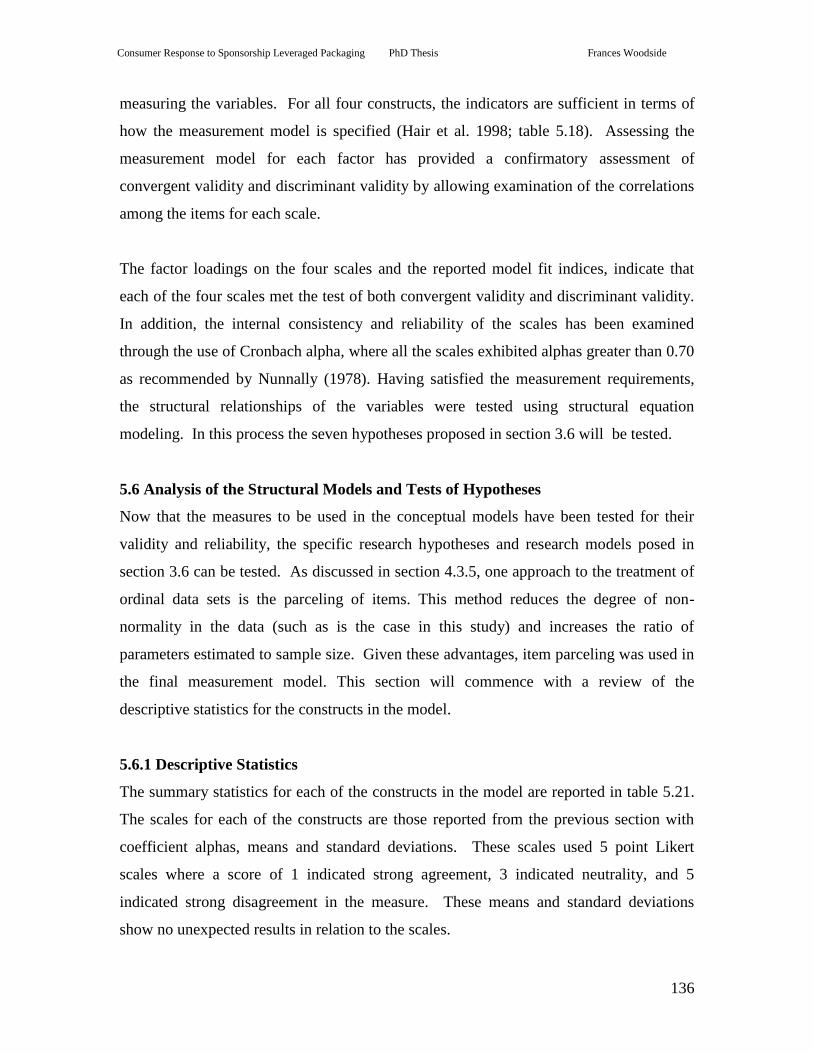
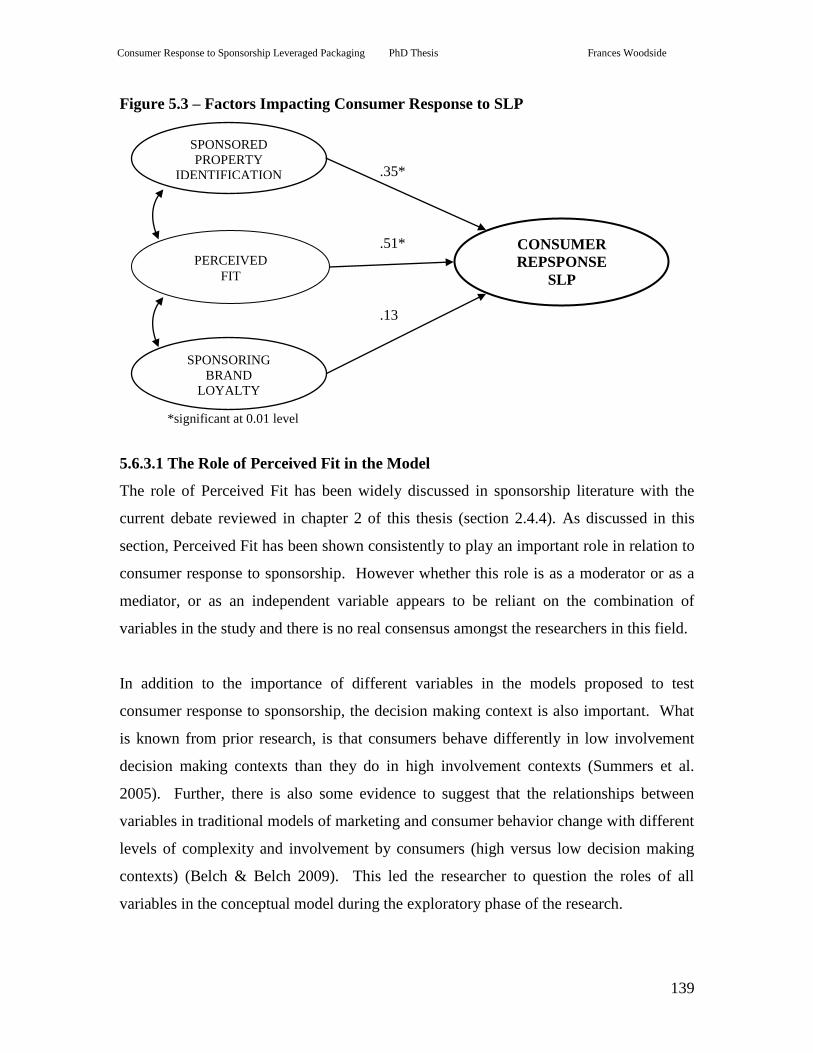
Figure 5.3 – Factors Impacting Consumer Response to SLP .................................. 139
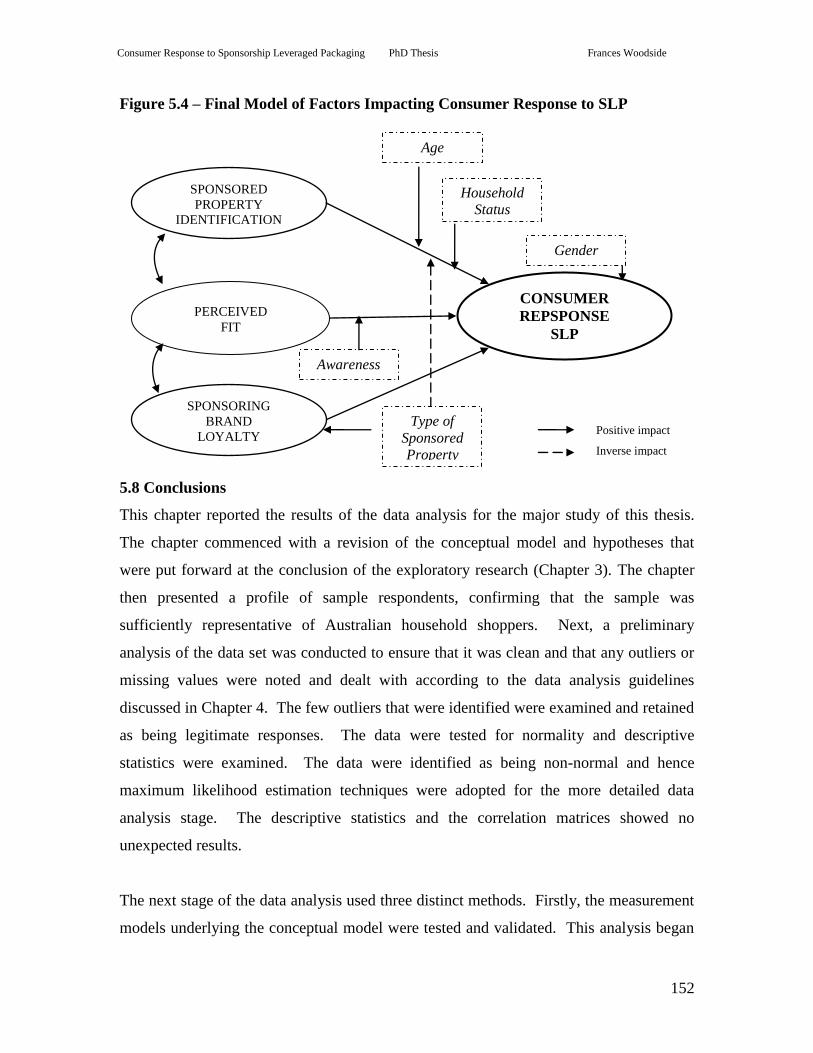
Figure 5.4 – Final Model of Factors Impacting Consumer Response to SLP ......... 152
Figure 6.1 – Chapter Outline ................................................................................... 154
Page 11
x
Publications Produced in Conjunction With This Thesis
Woodside, F, Summers J, and Johnson Morgan M, 2006, ‗Sponsorship of Fast
Moving Consumer Goods – Does packaging endorsement contribute to brand
attitude? A conceptual paper‘ International Business Trends: Contemporary
Readings, Sam Fullerton and David L. Moore, editors, The Academy of Business
Administration: Ypsilanti, MI, 2006, pp213 – 221.
Woodside, F, Summers J, and Johnson Morgan M, 2006, ‗The Effect of Sponsorship
Endorsed Packaging on Consumer Attitudes: a conceptual enquiry‘ Proceedings of
2006 ANZMAC Conference (1 – 3 December) Brisbane QLD.
Woodside, F, Summers, J and Johnson Morgan, M 2007, ‗Sponsorship leveraging
improves consumer attitudes and purchase intentions towards the sponsoring brand –
but is it relevant for FMCG packaging?‘ Proceedings of 2007 ANZMAC Conference
(3-5 December), Dunedin, New Zealand. ** Awarded Best Paper in IMC track
Woodside, F, & Summers, J 2008 ‗Packaging Exploitation In Fast Moving
Consumer Goods: Consumer Processing Of Sponsorship Messages‘, Proceedings of
2008 Global Marketing Conference, Shanghai (March).
Woodside, F, & Summers, J 2008 Sponsorship logos on FMCG packaging – what
factors impact effectiveness? Proceedings of 2008 ANZAM Conference, (4-6
December), Auckland, New Zealand.
Woodside, F, & Summers, J 2009, Consumer Awareness of Sponsorship – a FMCG
context‘ Proceedings of 2009 ANZMAC Conference (1-3 December), Melbourne
VIC.
Woodside, F, & Summers, J, Consumer Awareness of Sponsorship – a FMCG
context, Journal of Marketing Communication, [paper accepted October 2009 -
publication date to be advised]
Page 12
xi
Acknowledgements
This is an excellent opportunity to express my admiration and appreciation to all
those who have greatly assisted me in this work. Firstly, to my husband Malcolm
for his encouragement, assistance and patience, you have made a challenging time
more bearable. To my helpful and supportive children Tiffany, James, Jeremy,
Bronson and Natasha, thanks everyone.
My supervisor, Associate Professor, Dr Jane Summers provided invaluable,
guidance, constructive feedback and encouraging support throughout my research
program, thank you for your expertise and understanding, Jane. I would also like
show my appreciation to my associate supervisor, Dr Melissa Johnson Morgan.
Thanks for your sincere friendship, Melissa. I value greatly the tremendous
assistance you have given by being there and cheering me on.
To my friends and marketing colleagues: Jason, Eric, Tiana, and Dawn, your care
and encouragement, sympathetic ear and humorous adages made the hard work seem
like fun (almost). To my parents, thank you Mum and Dad, for your prayers and
support, and for teaching me by example, to do whatever I do, with wholehearted
dedication and determination.
Finally, thank you to my Lord and Heavenly Father, for granting me wisdom to
understand what I was doing and inspiration to make this thesis happen. Without
God‘s grace, patience and longsuffering, I would not have succeeded in this often
challenging, frequently frustrating but greatly rewarding adventure.
Page 13
1
1 Introduction
This chapter provides an introduction to sponsorship leveraged packaging and
outlines the theoretical framework for the research program. The purpose for the
research and the specific objectives are then discussed. The three-stage program of
research, which includes both qualitative and quantitative studies, is summarised and
finally, the structure of the six chapters of the thesis is described.
1.1 Sponsorship as a Marketing Communications Tool: an Overview
In the last decade, sponsorship has become a mainstream marketing communications
tool with worldwide sponsorship spending reaching US$43 billion (IEG 2009). With
large corporations such as Coca-Cola allocating over US$230 million to sponsorship
(IEG 2007), sponsorship has become a critical strategic tool, with the potential to
generate a sustainable competitive advantage in the marketplace.
Investment in global sponsorship spending has been increasing in the last 10 years
(Alexandris et al. 2008) and continues to show impressive growth (Fenton 2009).
Consequently, the rapid growth of corporate sponsorship has led to the emergence of
‗sponsorship clutter‘ reflecting the intense competition for sponsorship (Fahy et al.
2004). As the market for sponsorship becomes intensely competitive and
challenging, it is essential that sponsorship investments be carefully managed to
ensure their effectiveness.
Calls for better measurement in sponsorship research have been made for some
years, particularly in considering the impact of sponsorship and consumer behaviour
(Ali et al. 2006). One of the most needed areas of research concerns spending that
occurs in addition to the sponsorship contract known as sponsorship leveraging
(Cornwell 2008). While understanding of sponsorship in general is growing, very
little research has attempted to address the integrative effects of sponsorship in
combination with leveraging (Cornwell 2008). This is particularly important as
sponsorship effectiveness has been shown to be directly related to the degree to
which sponsors leverage their investment (Quester & Thompson 2001; Fahy et al.
2004; Grohs et al. 2004).
Page 14
2
One particular type of sponsorship leveraging widely used in the Australian Fast
Moving Consumer Goods (FMCG) Industry is sponsorship leveraged packaging
(SLP). SLP involves depicting the sponsored property‘s image, logos or symbols on
the sponsoring brand‘s packaging. Examples in the Australian FMCG Industry
include: Weetbix and the sponsorship of Kids Triathlon; Arnotts Tim Tams and the
sponsorship of National Breast Cancer Foundation; and Powerade and the
sponsorship of the Wallabies Rugby Union Team. SLP capitalizes on the benefits of
packaging and the commercial potential of sponsorship investment to communicate
sponsorship arrangements to consumers.
Some researchers suggest that sponsorship is particularly suitable for low
involvement products such as FMCG (Lee 2005; Gwinner 1997; McDaniel 1999).
Given that low involvement purchase decisions require consumers to choose between
brands that have many common characteristics, sponsorship‘s effects may provide a
stronger point of differentiation. However, most sponsorship research has examined
high-involvement product categories (e.g. banking; motor vehicles) where evidence
suggests that it is more difficult to change consumers‘ attitudes and behaviour (Lee
2005). Therefore, this research will contribute to the understanding of sponsorship
particular in a FMCG context.
In addition to the suggested appropriateness of sponsorship for FMCG, packaging
has also been suggested as an extremely powerful and unique marketing tool. For
low involvement consumer products, such as FMCG, packaging has been shown to
be a critical stimulus to the creation and communication of brand identity and
communicating brand meaning and strengthening the consumer-brand relationship
(Underwood 2003). In recent years, packaging has developed well beyond its
original function as merely a means of product protection and now plays a key
marketing role in developing on shelf appeal by providing product information and
in establishing brand image and awareness.
Given that both sponsorship and packaging play significant roles in developing brand
image and awareness, it seems logical that they would complement each other in a
marketing strategy such as sponsorship leveraged packaging. Indeed, the synergy
created by integrating elements of the promotions mix is considered to be a crucial
Page 15
3
component of an effective IMC strategy (Sneath et al. 2005; Belch & Belch 2009).
What is not known is whether leveraging sponsorship through packaging contributes
to strengthening the consumer-brand relationship in this FMCG context. This lack of
understanding makes management decisions about whether and how much to invest
in sponsorship leveraged packaging all the more challenging. This research seeks to
overcome this dearth in knowledge by examining consumers‘ reactions to
sponsorship messages on packaging in general and then extends this contribution by
examining sponsorship in a FMCG context.
1.2 Purpose of the Research
As indicated, despite the widespread use of SLP by FMCG organisations, little
empirical research exists to explain its impact on consumers‘ behaviour towards the
sponsors and their products. In addition, little research exists that explains the
factors that impact consumer response to SLP, or the relationship between these
factors. This program of research will address these gaps in the known body of
literature relating to sponsorship, packaging and marketing communications by
empirically investigating the factors that impact consumer response to SLP in FMCG
markets. Therefore, the following question will be answered: ―What factors impact
consumer response to sponsorship leveraged packaging in FMCG markets?‖
In order to answer this research question, this program of research will develop and
test a model of factors that impact consumer response to sponsorship leveraged
packaging. Following on, two specific research objectives to be addressed in this
program of research are:
1. to determine the factors that impact consumer response to sponsorship leveraged
packaging in a FMCG context
2. to develop and test a structural model that describes the network of relations
among these variables.
1.3 Justification for the Research
This research has both academic and practitioner value. Firstly, in terms of the
academic contributions of the research, it will contribute to a greater understanding
of consumer behaviour relating to sponsorship and particularly in a FMCG context.
Secondly, in terms of its contributions to marketing practice the research will provide
Page 16
4
a theoretical framework for sponsorship leveraged packaging decisions. Each
contribution is now examined in more detail.
1.3.1 Academic Contributions
This research will make two contributions to the literature on consumer behaviour
relating to sponsorship. Firstly, this study brings together areas of study not
normally considered: sponsorship and packaging, for a marketing strategy that is
commonly used in practice, yet has received little empirical attention. As little
research has attempted to address the combined effects of sponsorship and
packaging, this research combines these areas into a broader framework
demonstrating how components of sponsorship and packaging interrelate.
This study will provide understanding of SLP and will assess the relationships
among the key variables impacting consumer response to sponsorship: sponsored
property identification; sponsor brand loyalty; and perceived fit. This information is
important because it contributes to our understanding of the role packaging plays in
communicating sponsorship arrangement.
Second, whilst previous research has advanced our understanding of factors that
impact consumer response to sponsorship, this study will explain those factors in a
new context: that of sponsorship leveraged packaging in FMCG. This is important
given the nature of low involvement decision making where little cognitive effort is
expended in purchase decisions.
This research will determine whether leveraging sponsorship through packaging has
the capacity to influence purchase decisions (as the hierarchy of effects suggests), or
whether it acts mainly by reinforcing existing brand attitudes (as the ATR model
suggests). This research will provide answers as to what outcomes SLP has the
capacity to impact, be it attitude, trial intention or purchase intentions. Such
knowledge will not only help generate academic research and discourse, but will also
assist sponsors and properties, to fully realise the business opportunities from
sponsorship leveraged packaging.
Page 17
5
1.3.2 Contributions to Practice
This research program will make two major contributions to the practice of
sponsorship marketing. Firstly, this study provides a valid and empirically tested
structural model for describing consumer response to sponsorship leveraged
packaging. The structural model explains the factors that impact consumer response
to SLP i.e. sponsored property identification, sponsoring brand loyalty and perceived
fit. Furthermore, the model explains the relationships between those factors and the
mediating relationship of perceived fit. In addition, the final model explains the
moderating factors of type of sponsorship, frequency of purchase of the sponsoring
brand, awareness of the sponsorship arrangement and respondent characteristics.
Secondly, this study provides a robust and more detailed understanding of consumer
response to sponsorship. Given the current trend for large sponsorship investments,
it is becoming increasingly important for organisations to establish how consumers
are affected by SLP. The findings from this study will inform management decisions
in relation to sponsorship arrangements through packaging.
This study will provide understanding on two key elements of the sponsorship
management process: (1) the sponsorship selection decision; and (2) the development
of the sponsor leveraging strategy. This information will allow marketers to design
their strategies and tactics more effectively in order to justify continued spending on
sponsorship leveraging and to differentiate their competitive offerings. A further
contribution this study will make is the identification of the role of sponsoring brand
loyalty in consumer response to SLP and how this can be best utilised to improve
sponsorship effectiveness.
1.4 Methodology
This program of research was conducted in three stages. Stage one, consisted of
secondary research, namely a review of the literature and then development of an
appropriate research design to answer the propositions. Stage two, consisted of
Study 1, an exploratory phase designed to investigate in more detail the constructs to
be used in Study 2. Study 1 was designed to enrich the current knowledge about the
constructs of consumer response to sponsorship and the factors impacting that
response. This study also aimed to explore the relationships between these
Page 18
6
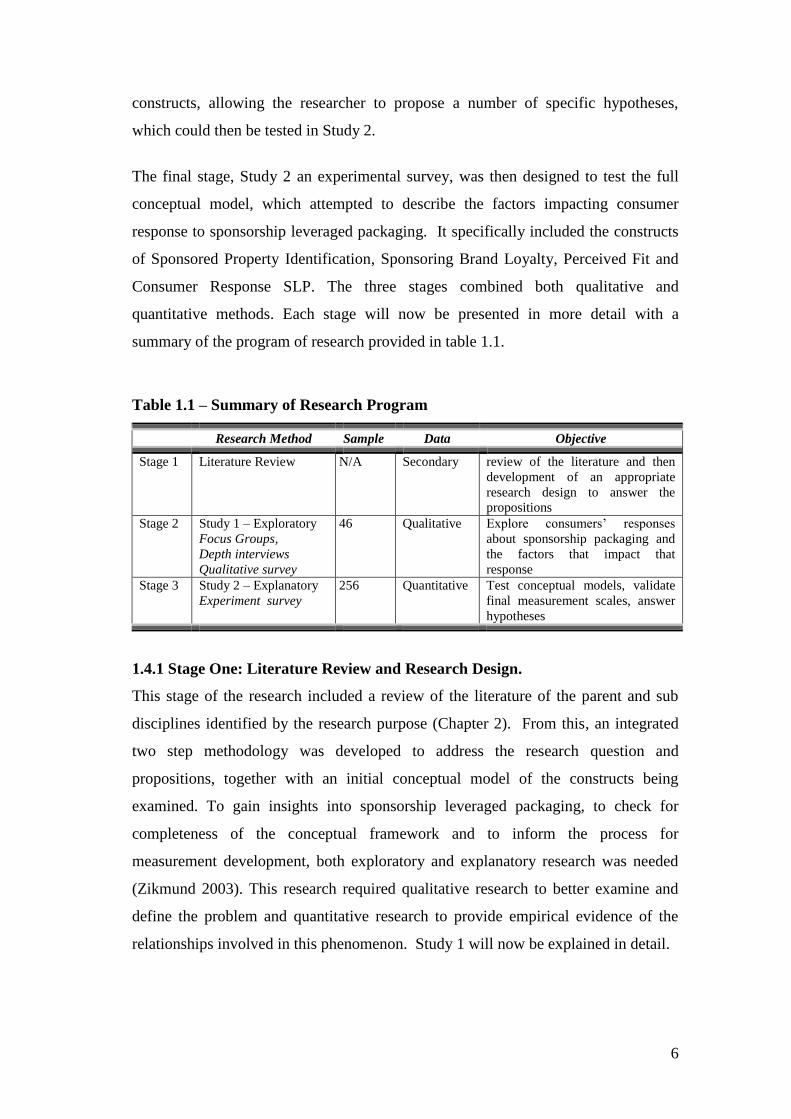
constructs, allowing the researcher to propose a number of specific hypotheses,
which could then be tested in Study 2.
The final stage, Study 2 an experimental survey, was then designed to test the full
conceptual model, which attempted to describe the factors impacting consumer
response to sponsorship leveraged packaging. It specifically included the constructs
of Sponsored Property Identification, Sponsoring Brand Loyalty, Perceived Fit and
Consumer Response SLP. The three stages combined both qualitative and
quantitative methods. Each stage will now be presented in more detail with a
summary of the program of research provided in table 1.1.
Table 1.1 – Summary of Research Program
Research Method Sample Data Objective
Stage 1 Literature Review N/A Secondary review of the literature and then
development of an appropriate
research design to answer the
propositions
Stage 2 Study 1 – Exploratory
Focus Groups,
Depth interviews
Qualitative survey
46 Qualitative Explore consumers‘ responses
about sponsorship packaging and
the factors that impact that
response
Stage 3 Study 2 – Explanatory
Experiment survey
256 Quantitative Test conceptual models, validate
final measurement scales, answer
hypotheses
1.4.1 Stage One: Literature Review and Research Design.
This stage of the research included a review of the literature of the parent and sub
disciplines identified by the research purpose (Chapter 2). From this, an integrated
two step methodology was developed to address the research question and
propositions, together with an initial conceptual model of the constructs being
examined. To gain insights into sponsorship leveraged packaging, to check for
completeness of the conceptual framework and to inform the process for
measurement development, both exploratory and explanatory research was needed
(Zikmund 2003). This research required qualitative research to better examine and
define the problem and quantitative research to provide empirical evidence of the
relationships involved in this phenomenon. Study 1 will now be explained in detail.
Page 19
7
1.4.2 Stage Two: Study 1
The first study was qualitative in nature and was used to explore the constructs
impacting consumer response to sponsorship leveraged packaging, sponsored
property identification, brand experience and perceived fit. Two focus groups, eight
depth interviews and twenty-six qualitative surveys were conducted. In the course of
these discussions, the existence and the role of SLP were explored and a number of
dimensions of consumer response to sponsorship leveraged packaging that were not
specifically captured in the original conceptual model were identified.
As a result, several new items were recommended for inclusion into the model,
which was to be tested in Study 2. The results of Study 1 were used to assist the
development of specific hypotheses and the conceptual model developed at the end
of Chapter 2 was reviewed and updated. The objectives of the study were to: inform
the theory generation process, to assist in the identification of constructs and the
development and purification of measures. This study is explained in Chapter 3.
1.4.3 Stage 3: Study 2
The second study was quantitative in nature and involved experimental research to
test the final empirical model. The study focused on examining the hypothesized
relationships between the constructs of consumer response to SLP, sponsored
property identification, sponsoring brand loyalty, and perceived fit.
The experiment took the form of a four group after only with control design with one
experimental condition, sponsorship type. The four groups can be represented as:
1 – brand A with sponsorship (sport)
2 – brand A without sponsorship (control)
3 – brand B with sponsorship (cause)
4 – brand B without sponsorship (control)
The experiment method was a self-administered survey using real world examples of
SLP packaging and non-SLP packaging currently or recently available in the
Australian FMCG market. In order to apply the experimental condition, four survey
instruments were developed, each one including a different representation of a
FMCG package: brand A with sponsorship; brand A without sponsorship (control);
Page 20
8
brand B with sponsorship; and brand B without sponsorship (control). This research
design has the advantages of randomization of participants and test conditions and
ability to control for sources of error in the experiment. In addition, this method
allows the researcher to isolate the effects of sponsorship from the effects of other
promotional activities as much as possible. This study is discussed in Chapter 4.
1.4.4 Research Paradigm and Methodology
The proposed program of research was based on the post-positivist paradigm (also
known as critical realism). This paradigm allows for the existence of an external
reality that is not known completely and it allows for the integration of both
qualitative and quantitative studies in the research program. The justification for this
paradigm and choice of research design follows.
The purpose of this research (as outlined in section 1.2) was to gain a better
understanding of the marketing tool ‗sponsorship leveraged packaging‘ and how that
marketing tool impacts consumer response. Therefore, to gain insights into
sponsorship leveraged packaging, to check for completeness of the conceptual
framework and to inform the process for measurement development, both
exploratory and explanatory research was needed (Zikmund 2003).
Given the lack of available literature that explains how sponsorship leveraged
packaging works; an exploratory approach was needed to provide a rich
understanding of the consumer behaviour associated with SLP. Exploratory research
is generally qualitative in nature and uses methods such as focus groups and depth
interviews (Aaker et al. 2007). Further, as exploratory approaches are often followed
by more conclusive research, the research problem suggests that explanatory research
was necessary to establish whether there is a relationship between consumer response
to SLP and the factors highlighted in the exploratory research as impacting that
response. Explanatory research typically is quantitative in nature and involves
experiment methodologies.
Research methodology literature gives considerable support for the efficacy of
combining both qualitative and quantitative research, called pluralistic research
(Burns & Bush 1998). Pluralistic research combines the advantages of both
Page 21
9
qualitative research and quantitative research, and is becoming increasingly popular,
especially with complex marketing issues (Burns & Bush 1998). Given that the post
positivist paradigm allows for the integration of both qualitative and quantitative
studies in the research program, this research follows a post positivist paradigm.
The fundamental nature of the post positivist paradigm is that reality is ―real‖ but
only imperfectly and probabilistically apprehensible, suggesting that although the
answers found in this research point in some respect to reality, the research may not
uncover ‗all‘ that is to be known about Consumer Response to SLP and the factors
that impact it. This fallibility is addressed in two ways. Firstly, the data are
triangulated across multiple sources including literature, and Studies 1 and 2.
Secondly, structural equation modeling allows an attempt at generalising to a
population while allowing for measurement error (Perry et al. 1998; Aaker et al.
2007). To this effect, structural equation modeling considers complex
interdependencies while using multi-item scales to measure latent, unobservable
variables (Godfrey & Hill 1995). Theory construction is discussed in Chapter 3.
1.5 Delimitations of Scope and Definitions
This research will operate within the following parameters. Firstly, the sample for
the quantitative stage Study 2 was drawn from the general population of all
household shoppers in Australia. As this study focused on consumer purchase
behaviour, the sample was limited to those people who were regularly responsible for
the main household shopping. Secondly, this research considers sponsorship
leveraged packaging in a FMCG context. Given the unique nature of this type of
product, it will not be possible to apply the conclusions of the study to a high
involvement product.
Thirdly, although the study considers sponsorship leveraged packaging in a FMCG
context, the packaging examples chosen for the experiment questionnaire were from
the breakfast cereal category as this is where this marketing tactic is applied most
often. This sampling decision will limit the capacity to generalize the findings of this
study to other low involvement categories. However, as 80% of Australians adults
and 90% of children consume breakfast cereals (Woods & Walker 2007), a logical
conclusion from this, is that the majority of households purchase breakfast cereals.
Page 22
10
Furthermore, given that the breakfast cereal market contributes $894 million to the
Australian FMCG industry (Woods & Walker 2007), investigation of the impact of
SLP on consumer behaviour is warranted.
With regard to defining common terms used in this research, two concepts will be
defined here, sponsorship and sponsorship leveraged packaging, commencing with
sponsorship. There is general consensus among scholars that sponsorship involves
two principal activities. These are: (1) an exchange between sponsor and property,
whereby the property receives compensation and the sponsor obtains the right to
associate itself with the property; and (2) the sponsor leverages the association by
developing marketing activities to communicate the sponsorship (Cornwell &
Maignan 1998). With the intention of incorporating both these principal activities,
sponsorship will be defined for the purposes of this study as, ‗the provision of
financial support to a property to allow it to pursue its activities thereby creating
opportunities for the sponsor to market the sponsorship association to achieve
corporate and marketing objectives‘ (developed from D‘Astous & Bitz 1995). The
definition of sponsorship is discussed in section 2.3.2.
Secondly, sponsorship leveraged packaging (SLP) involves depicting the sponsored
property‘s image, logos or symbols on the sponsoring brand‘s packaging. SLP
involves two main parties: the sponsoring brand and the sponsored property. In the
sponsorship literature, the sponsoring brand is sometimes referred to as the sponsor
and the sponsored property, the sponsee. For the purposes of this research, the term
‗sponsoring brand‘ is used to represent the party providing financial assistance (e.g.
Weetbix); and the term ‗sponsored property‘ is used to represent the party being
supported be it a sport, event, cause or arts activity (e.g. Kids Triathlon). Whilst both
sets of terms are commonly used in the literature, this stance was taken in order to
avoid confusion given the similarity between the terms of sponsor/sponsee.
1.6 Outline of the Thesis
This thesis is presented in 6 chapters. Figure 1.1 presents an overview of the
structure. Chapters 1 and 2 represent stage 1 of the research and provide an outline
of the research, identifying the key literature that was used to guide the research.
Chapter 3 represents stage two of the research and reports the methodology and
Page 23
11
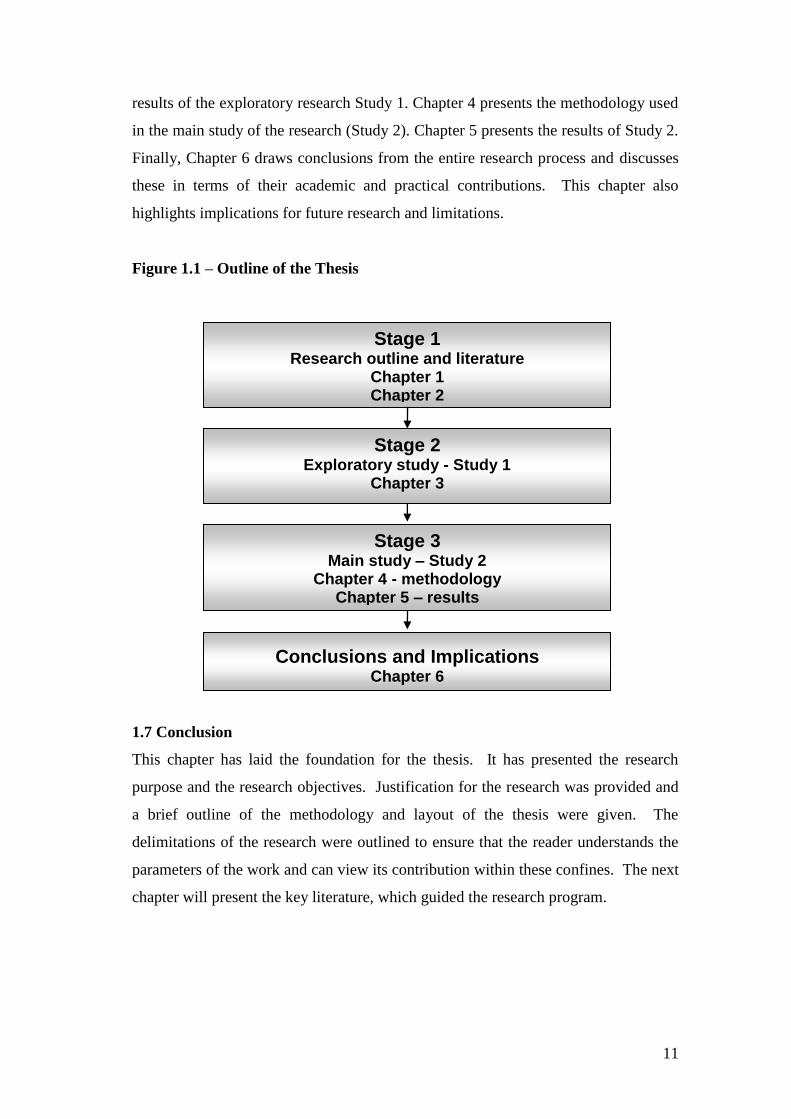
results of the exploratory research Study 1. Chapter 4 presents the methodology used
in the main study of the research (Study 2). Chapter 5 presents the results of Study 2.
Finally, Chapter 6 draws conclusions from the entire research process and discusses
these in terms of their academic and practical contributions. This chapter also
highlights implications for future research and limitations.
Figure 1.1 – Outline of the Thesis
1.7 Conclusion
This chapter has laid the foundation for the thesis. It has presented the research
purpose and the research objectives. Justification for the research was provided and
a brief outline of the methodology and layout of the thesis were given. The
delimitations of the research were outlined to ensure that the reader understands the
parameters of the work and can view its contribution within these confines. The next
chapter will present the key literature, which guided the research program.
Stage 1 Research outline and literature
Chapter 1 Chapter 2
Stage 3 Main study – Study 2
Chapter 4 - methodology Chapter 5 – results
Conclusions and Implications
Chapter 6
Stage 2 Exploratory study - Study 1
Chapter 3
Page 24
12
Chapter 2 Literature Review
2.1 Introduction
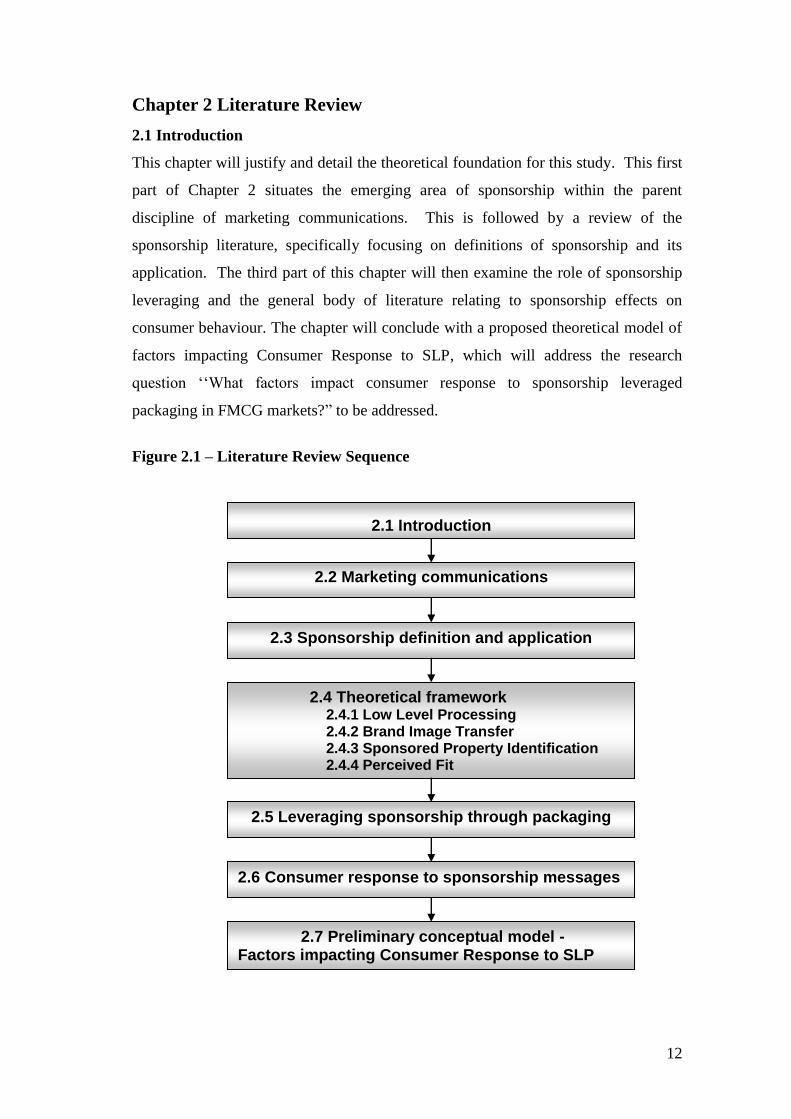
This chapter will justify and detail the theoretical foundation for this study. This first
part of Chapter 2 situates the emerging area of sponsorship within the parent
discipline of marketing communications. This is followed by a review of the
sponsorship literature, specifically focusing on definitions of sponsorship and its
application. The third part of this chapter will then examine the role of sponsorship
leveraging and the general body of literature relating to sponsorship effects on
consumer behaviour. The chapter will conclude with a proposed theoretical model of
factors impacting Consumer Response to SLP, which will address the research
question ‗‗What factors impact consumer response to sponsorship leveraged
packaging in FMCG markets?‖ to be addressed.
Figure 2.1 – Literature Review Sequence
2.1 Introduction
2.4 Theoretical framework 2.4.1 Low Level Processing 2.4.2 Brand Image Transfer
2.4.3 Sponsored Property Identification
2.4.4 Perceived Fit
2.7 Preliminary conceptual model - Factors impacting Consumer Response to SLP
2.6 Consumer response to sponsorship messages
2.5 Leveraging sponsorship through packaging
2.3 Sponsorship definition and application
2.2 Marketing communications
Page 25
13
2.2 Marketing Communications
Marketing communications is the most visible and prominent component of the
marketing mix (De Pelsmacker et al. 2007). Marketing communications are the
attempts of marketing firms or management groups to "inform, persuade, incite, and
remind customers, directly or indirectly, about the brands they sell" (Keller 2001, p.
819). The significance of marketing communications has increased in recent years
due to the increased demand by consumers for product quality and choice, increased
media fragmentation, the focus on reinforcing consumer loyalty and the emphasis on
building and increasing a brand‘s image-based equity (Kitchen 2004).
Marketing communications allow companies to communicate with their target groups
and stakeholders through a variety of tools categorized into four broad areas:
advertising; public relations; sales promotions; and personal selling. In order to see
the different roles and abilities of each element in the marketing communications
mix, a brief overview of each one is now provided, commencing with advertising.
Advertising has been hailed as one of the oldest, most visible and most important
instruments of the marketing communications mix. Advertising is any non-personal
mass communication using mass media, where the content is determined and paid for
by a clearly identified company (Pickton & Broderick 2005). It is capable of reaching
large audiences and is effective and cost efficient at: achieving high levels of
awareness; creating brand differentiation; informing and reminding; and in time,
developing and maintaining brands (Pickton & Broderick 2005).
Advertising has the ability to reach mass audiences, selectively if required, in a cost
effective and efficient manner. However, despite these advantages, advertising in
recent decades has seen a decline in effectiveness as a result of changing technology,
economics and consumer lifestyles (Cornwell 2008). In particular, increasing
advertising clutter is one of the greatest concerns facing the advertising industry
(Danaher et al. 2008). While advertising still remains a vital tool, it is increasingly
becoming one element among equals in the promotion mix (Gilbert 2005). Sales
Promotion is the next element in the promotion mix that is discussed.
Page 26
14
Sales promotions, another form of marketing communications, are generally designed
to stimulate short-term sales. Sales promotions are marketing communications
activities that offer an incentive to consumers to buy a brand where the incentive
temporarily changes its perceived price or value (Shimp 2000). Sales promotions
include a vast array of tools including: sampling, coupons, merchandising, loyalty
schemes and contests. Sales promotions are prolific in consumer markets as
customers have come to expect them as part of the marketing communications effort.
At the same time, consumers have become more price aware and price sensitive,
creating a greater role for sales promotions featuring price incentives. As a result, the
strength of sales promotion is in its impact on purchase behaviour, particularly the
direct and immediate effect on sales and profits (Pickton & Broderick 2005).
Despite the capabilities of sales promotion, the impact on consumers may only be
temporary as consumers are also becoming less brand loyal and displaying brand-
switching behaviour (Pickton & Broderick 2005). This is particularly true in the
FMCG market. Some authors advocate that in these markets, because involvement is
relatively low and distinctions between brands are becoming fewer, consumers
purchase on a portfolio basis as the norm rather than display single brand loyalty
(Ehrenberg, 1988; Uncles et al, 1995; Kennedy and Ehrenberg 2000). What is
important to note here is that, whilst sales promotion is capable of creating positive
short term impacts on sales and profits, the benefits gained from it may be transitory
and may in some cases be detrimental to long term brand equity. The third element in
the marketing communications mix is personal selling and this is discussed next.
Personal selling is a face-to-face communication method used to inform, demonstrate,
persuade, or develop a relationship with members of a target audience (De
Pelsmacker et al. 2007). Personal selling differs from the other one-way
communication elements in that it offers two-way communication with the
prospective customer. Personal selling techniques include: trade selling; retail
selling; business-to business selling; professional selling and direct selling (Blythe
2003). Personal selling can help build consumer trust and satisfaction through its
ability to gain knowledge of current and future customer needs, and provide
customer-oriented solutions. Although personal selling is an important element of the
communications mix, given its focus on face-to-face contact with consumers, it is
Page 27
15
outside the scope of this research and will not be considered in any more depth.
However, the fourth element in the marketing mix, public relations focuses on the
management of communication between an organisation and its publics and is thus
more closely aligned with sponsorship. Public relations then requires closer
examination particularly in regard to its role in marketing communications and its
capacity to impact consumer behaviour.
Public relations plays a vital role in promoting the goodwill of the firm. Essentially,
public relations is the planned and sustained effort to establish and maintain good
relationships, mutual understanding, sympathy and goodwill with a firm‘s publics
(De Pelsmacker et al. 2007). Public relations may be used to achieve a number of
objectives, including: creation and maintenance of corporate identity and image;
improving the company‘s standing as a good corporate citizen; maintaining good
relations with media; attendance at trade exhibits and managing internal
communications. In comparison to advertising, public relations has the advantages of
relatively low cost, extensive visibility and most importantly, higher credibility
(Pickton & Broderick 2005).
A number of important changes and potentially detrimental trends have created a
need and urgency to improve effectiveness of marketing communications. Firstly,
there is a widespread belief that mass media communications are becoming
increasingly cluttered (Lacey et al. 2007; Cornwell 2008; Smith et al. 2008).
Secondly, this increased communications clutter has led to advertising avoidance
behaviour where traditional, impersonalised media is less and less capable of
attracting attention let alone impacting consumer behaviour (Pickton & Broderick
2005; Mason & Cochetel 2006; Lacey et al. 2007). These long terms changes in the
marketing environment have seen a corresponding growth of non-traditional forms of
marketing communications such as product placement, sponsorship, ambush
marketing and viral marketing. In order to understand where sponsorship fits into the
marketing communications mix, the following section outlines its key benefits and
the main difference between it and the other marketing communications tools.
Page 28
16
2.3 Sponsorship
Sponsorship is a promotional activity that plays an important role in supporting an
organisation‘s attainment of communication objectives (Seguin 2007). One of the
most important goals of sponsorship is to develop an association between sponsors
and sponsored properties (Ko et al. 2008). Its premise is that the sponsor‘s name,
brand or products will benefit from the successful association with a property, be it a
sport, an event, the arts or cause related activities (Fleck & Quester 2007).
Throughout the last two decades, sponsorship has outperformed other marketing
communication tools in terms of growth in many international markets, with
worldwide sponsorship spending reaching $43 billion (IEG 2009). Sponsorship
growth has been attributed to factors such as: persistent clutter of print and electronic
media; concerns about effectiveness of traditional media; increased popularity and
commercialisation of events; and an increase in the understanding and practice of
relationship marketing (Quester & Thompson 2001; Cornwell 2008; Dardis 2009).
These factors have mitigated the more widespread use and intensity of sponsorship
with many organizations associating themselves with key image-building events or
sports that are complementary to their own positioning (Fahy et al. 2004).
Additionally, sponsorship users have found that through sponsorship they can achieve
new levels of exposure at lower cost than through traditional advertising methods
(Lyberger & McCarthy 2001). Sponsorship is suggested to have the power to escape
the advertising clutter and to create differentiation (De Pelsmacker et al. 2007).
However, the rapid growth of corporate sponsorship has led to the emergence of
‗sponsorship clutter‘ reflecting the intense competition for sponsorship of certain
properties (Fahy et al. 2004). Sponsorship clutter can occur when events have a large
number of official sponsors, which limits the value of the marketing tool for potential
sponsors. A prime example of this is the reduction in the number of top level
sponsors for the FIFA 2010 World Cup from 15 to 6 with a view to making each of
the sponsorships more valuable (Fullerton 2010). It can be seen that sponsorship has
progressed over time to become a key component of many companies IMC mix. In
order to establish a foundation for this research, the next section discusses the
definition of sponsorship.
Page 29
17
2.3.1 Sponsorship Defined
The increased attention attracted by sponsorship has not been limited to commercial
applicability. There has also been a corresponding interest in sponsorship by
academic scholars, with all taking the view that sponsorship is a distinct promotional
activity within the marketing communications activity of organisations (e.g. Roy &
Cornwell 2004; Cornwell et al. 2005; Cornwell et al. 2006; Tripodi 2001). Within
this research stream there have been a number of differing definitions of what
sponsorship is. Table 2.1 provides a summary of the principal and most often cited
scholars and their perspective on a definition of scholarship.
Table 2.1 – Definitions of Sponsorship
Author/Year Definition Emphasis
Meenaghan
1983
The provision of assistance either financial or in-kind to
an activity e.g. sport, musical event, festival, fair, or
within the broad definition of the Arts by a commercial
organization for the purpose of achieving commercial
objectives.
Reflects phasing out of the
donation mentality and its
replacement by economic-
based sponsorship
arrangements.
Sandler &
Shani 1989
The provision of resources by an organization directly
to an event or activity in exchange for a direct
association of the event or activity.
Reciprocal agreement where
the property obtains funds
and sponsor obtains right to
associate itself with
sponsored property.
D‘Astous &
Bitz 1995
An element of the communication mix where a firm
provides some financial support to an entity, which may
be an individual (e.g. sports), an organization (e.g. a
humane society) or a group (e.g. an orchestra), in order
to allow this entity to pursue its activities (e.g. a cultural
event) and, at the same time, benefit from this
association in terms of image and awareness of the
firm‘s offerings.
Reciprocal agreement where
the property obtains funds
and sponsor obtains right to
associate itself with
sponsored property through
marketing.
Cornwell &
Maignan
1998
Sponsorship involves two activities (1) an exchange
between a sponsor and a sponsee whereby the latter
receives a fee and the former obtains the right to
associate itself with the activity sponsored and (2) the
marketing of the association by the sponsor.
Reciprocal agreement where
the property obtains funds
and sponsor obtains right to
associate itself with
sponsored property through
marketing. Indicates both
activities are necessary if the
sponsorship fee is to be a
meaningful investment.
International
Events
Group 1999
A cash and/or in-kind fee paid to a property (typically a
sports, entertainment, non-profit event or organization)
in return for access to the exploitable commercial
potential associated with that property
Reciprocal agreement where
the property obtains funds
and sponsor obtains right to
associate itself with
sponsored property through
marketing.
Page 30
18
Author/Year Definition Emphasis
Thompson
2005
Sponsorship involves a relationship or exchange
between two entities, which differs from other business-
to-business relationships in that the elements of the
exchange are not always definite. At one extreme,
sponsorship may be equated with patronage (Calderon-
Martinez et al. 2005), while at the other extreme may
involve a joint sharing of resources between two entities
with no clear-ct donor- recipient roles specified.
Reflects movement away
from donor-recipient
position, towards a –
relationship-oriented position,
where mutual sharing of
relative expertise and
resources is becoming the
norm (Harvey 2001)
Farrelly &
Quester
2003, 2005,
Farrelly,
Quester &
Burton,
2006
A form of exchange between a sponsor and sponsored
organisation, with both parties seeking to achieve their
own strategic goals. Sponsors and sponsored
organisations engage in a business relationship where
both parties invest time and efforts to achieve
predetermined and mutually beneficial goals. Involves
multiple stakeholders (e.g. sponsor, sponsored
organisation, consumers, fans, media), multiple
objectives, and potentially, different views of what
constitutes sponsorship value.
Applies a relationship focus
to clarify the dimensions of
the exchange, as well as key
roles and responsibilities of
the relationship partners.
Olkkonen &
Tuominen
2006
A mutually beneficial business relationship between the
sponsor and the sponsee. The sponsors benefit through
two main dimensions: sponsorship objectives connected
to a product or corporate image and awareness of the
product or firm; and secondly, stakeholder relationships
may also be established and developed. The benefits for
the sponsored organisation usually come in the form of
financial resources, products, services and know-how.
Reflects emerging
perspective that builds on the
exchange process, to
incorporate relationship
considerations.
(Source: developed for this study)
As this table shows, some definitions emphasize the exploitable commercial potential
of sponsorship (e.g. Meenaghan 1983), and others stress the importance of exchange
theory in sponsorship (e.g. Sandler & Shanni 1989). Still more recent focus has been
on the stakeholder relationships and relationship quality (Farrelly & Quester 2003,
2005; Farrelly, Quester & Burton 2006; Olkkonen & Tuominen 2006). Regardless of
whose approach is used, there is consensus among all these scholars that sponsorship
involves two principal activities. These are: (1) an exchange between sponsor and
property, whereby the property receives compensation (i.e. a rights fee) and the
sponsor obtains the right to associate itself with the property; and (2) the sponsor
leverages the association by developing marketing activities to communicate the
sponsorship (Cornwell and Maignan 1998).
With the intention of incorporating both these principal activities, sponsorship will be
defined for the purposes of this study as, ‗the provision of financial support to a
property to allow it to pursue its activities thereby creating opportunities for the
sponsor to market the sponsorship association to achieve corporate and marketing
Page 31
19
objectives‘ (developed from D‘Astous & Bitz 1995). This definition reflects the two
principles previously mentioned, in that sponsorship agreements can benefit both the
sponsored property and the sponsoring brand and the sponsorship association can
(and should) be leveraged through marketing communications. Thus, sponsorship
provides the sponsoring company with opportunities for additional advertising and
publicity to create brand awareness and influence consumer attitudes and purchase
behaviours by aligning with properties or products to enhance competitive advantage
(Nicholls & Roslow 1999; Pitts & Stotlar 2002).
Despite general agreement among scholars on the broad principals involved in
sponsorship, some confusion remains about the distinction between sponsorship and
other forms of promotional communications, especially advertising, event marketing
and cause related marketing. The distinctions between sponsorship and these other
forms of promotional communications are discussed next.
It is common in the literature for sponsorship to be considered merely a form of
advertising (Tripodi 2001). This view can be supported by the fact that some forms
of sponsorship share similar goals to advertising (i.e. increasing brand or company
awareness and image). However, in spite of this, the main distinguishing factor
between sponsorship and advertising is the goodwill or positive association of
consumers to the company due to the support of a favoured property. Consumers look
on sponsorship communications in a halo of goodwill, generated by the perception of
benefit to society in general, the subtlety of the message and the disguised
commercial intent of the communication (Meenaghan 2001). This is in contrast to
advertising, which is received in skepticism and suspicion driven by factors such as
the forceful nature of the communication; the obvious commercial intent and
consumer beliefs about advertisers‘ motivation. Additionally, advertising is
associated with directly influencing consumer perception (Crimmins & Horn 1996),
whereas sponsorship is often seen as indirectly influencing consumer perceptions of
the brand. This is due to the fact that some sponsorship materials (e.g. arena signage,
public banners) are not capable of communicating much, if any information about
product attributes (McDaniel 1999). These contrasts then provide strength to the
conclusion that sponsorship should not be considered a form of advertising
(McDonald 1991; Meenaghan 1991, 1998).
Page 32
20
Similarly, researchers have also attempted to clarify the distinction between
sponsorship and event marketing (i.e. the integration of the marking mix elements
around an event) (Cunningham et al. 1993, p. 408). Event marketing may indeed
involve sponsorship, but only when the event‘s organisers sell sponsorship rights in
exchange for a fee, and when the sponsorships are exploited in the sponsors‘
promotions (Cornwell & Maignan 1998). Thus, event marketing can and often does
incorporate sponsorship, but does not always necessarily do so. Similarly,
sponsorship can and often is applied independently of an event. Thus, sponsorship
should also be viewed as an independent activity to event marketing.
Another area often used interchangeably with sponsorship is Cause Related
Marketing (CRM). However, sponsorship and CRM are distinctly different activities
that have been investigated and researched separately in the past (Polonsky & Speed
2000). CRM involves a ‗sponsor‘ acquiring and leveraging the right to be associated
with a cause. This activity differs from pure sponsorship in that it is generally
characterized by an offer from the sponsor to contribute a specified amount to the
cause when a sale is made (Varadarajan & Menon 1998) (e.g. 5 cents will be donated
to the cause per returned proof of purchase). In particular, CRM programs involve
specified customer revenue based on sales: whereas with sponsorship, the
contribution to the property precedes the generation of sales revenue and is made in
anticipation of an outcome. Therefore, CRM and sponsorship should be researched
as separate marketing strategies (Cornwell & Maignan 1998; Polonsky & Speed
2000). (For a fuller explanation of CRM see Polonsky & Speed 2000.)
In summary, although sponsorship is often used in conjunction with, and shares some
similar components and marketing goals to CRM, advertising and event marketing,
there is sufficient theoretical evidence for it to be considered as a distinct and separate
marketing activity to these marketing strategies and as a separate theoretical domain
for research purposes (Seguin 2007; De Pelsmacker 2007). Overall, the lack of
consensus as to what sponsorship encompasses points to the need for further research
regarding sponsorship and its role within the communication mix; a call that this
program of research will take up. In order to understand how sponsorship is used, the
various types of sponsorship are now briefly explained.
Page 33
21
2.3.2 Sponsorship Types
The low cost to the sponsored property that is characteristic of sponsorship
arrangements, has seen it extensively used by a number of different non-profit groups
to extend marketing reach and to raise investment capital. Most notably are groups
such as the arts, sports, causes and events. With this type of sponsorship use there
has also been considerable investigation into the viability and impact of these
sponsorship investments.
Sponsorship investment has been historically directed toward sports with US
spending reaching US$11.4 billion (66%) in 2008 (IEG 2009). This is primarily
because of sport‘s flexibility as a communication vehicle and because of the
opportunity it affords for association with increasingly commercial sport and sports
heroes (Meenaghan 1991). The second largest investment is in sponsorship of the arts
(US$827 million 2008), which although it has attracted little research attention, its
contribution to sponsorship investment is growing (Poon & Prendergast 2003;
Quester & Thompson 2001). Cause sponsorship has also grown significantly in recent
decades, with US spending reaching US$1.52 billion (IEG 2009). Although it
accounts for a significant proportion of sponsorship investment, cause related
sponsorship research is sparse (yet considerable research exists in the CRM domain).
Table 2.2 highlights the main research conducted into these various aspects of
sponsorship and also indicates the contribution of each type to total US spending on
promotional activity. The table shows that sports groups are most likely to use
sponsorship with current spending estimates highlighting that USA sports properties
contribute 69 percent of all sponsorship investments (IEG 2009). It can be seen that
sponsorship is a flexible communications tool that can be used in a variety of ways,
and has been extensively used in relation to sport, the arts and causes. Having briefly
explained what sponsorship is and what it encompasses, the next section outlines
‗how‘ sponsorship works.
Page 34
22
Table 2.2 – Types of Sponsorship
Type Author/ Year (Activity) Proportion of US spending
Sports Crimmins & Horn 1996; Meenaghan 1991;
Cornwell et al. 2001;Stipp 1998; Witcher et al.
1991; Lordinoit & Quester 2001; Thwaites et al.
1998; Grimes & Meenaghan 1998; Madrigal
2000; Gwinner & Eaton 1999; Dean (1999)
69% US$11.4 billion
Causes Dean 2002 (social cause – special Olympics);
Irwin, Lachowetz, Cornwell & Clark 2003,
Varadarajan & Menon 1988; Arnott 1994
11% US$1.52 billion
Tours/attractions Ruth & Simonin 2003 (parade) 10% US$1.3 billion
Arts Thompson 2001, Thompson 2004; Quester &
Thompson 2001 (festival), Farrelly & Quester
1997, Gross et al. 1987, Poon 2003
6% US$827 million
Festivals, fairs,
annual events
5% US$773 million
Associations,
membership
3% US$482 million
(Source: developed for this study – spending figures based on IEG 2009)
2.3.3 Sponsorship Research
Sponsorship research can be generally classified into five streams representing the
topics most commonly addressed: (1) nature of sponsorship; (2) managerial aspects of
sponsorship; (3) measurement of sponsorship effects; (4) strategic use of sponsorship;
and (5) legal and ethical considerations in sponsorship. Table 2.3 provides a summary
of these research streams and main contributing authors. This table shows that the
area of measurement of sponsorship effects has received the most attention from
academics during the late 1990s and early 2000s. It is in this area of measurement of
sponsorship effects that this program of research is framed.
Table 2.3 – Sponsorship Research Streams
Stream Focus Authors/ Year
Nature of
Sponsorship
Definition, objectives,
relation to other
communication tools
Angenendt 1993, Bloxham 1998, Cegarra 1985, 1986,
1994; Cheng & Stotlar 1999; Endogan & Kitchen
1998; Meenaghan 1998b, 2001; Walliser 1997a.
Managerial
Aspects
Objectives,
organisation, control,
audience
Farrelly et al. 1998; Hermanns 1991; Olkkonen et al.
2000; Olkkonen 2001; Pope 1998b; Quester et al.
1998; Thwaites 1995
Measurement
Sponsorship
Effects
Examination of
communication
effectiveness and
sponsorship effects,
determination of
causal relationships
between sponsorship
stimuli and consumer
perception
Cornwell et al. 1997, 2001, 2005; Crimmins & Horn
1996; Daneshvary & Schwer 2000; Gwinner 1997;
Grimes & Meenaghan 1998; Harvey 2001; Hoek et al.
1997; Johar & Pham 1999; Lardinout 1997, 1998,
1999; Madrigal 2001; Pope 1998a; McDaniel 1999;
McDaniel & Mason 1999; Meenaghan 2001;
Meenaghan & Shipley 1999; Pham & Johar 2001;
Pope & Vogues 1997; Quester & Farrelly 1998;
Quester & Thompson 2001; Stipp 1998; Stipp &
Schiavone 1996; Walliser 1996, 1997; Speed &
Thompson 2000; Smith 2006, Alexandris et al. 2008.
Page 35
23
Stream Focus Authors/ Year
Strategic use of
Sponsorship
Strategies and counter
strategies
Amis et al. 1999; McDaniel & Kinney 1998;
Meenaghan 1996, 1998a, Shani & Sandler 1998; Hock
1997; Vignali 1997.
Legal and
Ethical
Considerations
Consumer attitudes
toward sponsorships by
tobacco & alcohol co.
Aitken et al. 1986; Beck 1990; Crabble & Pinkerton
1992; Crawford 1992; Crompton 1993; Furlong 1994;
Hoek et al. 1993; Ledwith 1984; Stotlar 1992;
(Source: adapted from Walliser 2003, Coppetti 2004)
One theme particularly popular in the studies in this research area has been the impact
of sponsorship on the attitudes and behaviours of consumers. Many of these studies
have sought to discover theoretical explanations related to the cognitive processing of
sponsorship stimuli and the effects on response outcome, using various theoretical
approaches or processing mechanics to explain how consumers process sponsorship
messages (e.g. low-level processing; reactivation; matching/congruence). These
theories are expanded in the next section.
2.4 Theoretical Framework – Sponsorship Processing Mechanics
To bring together the understanding gained from previous research of the processing
mechanics, Cornwell et al. (2005) developed a model of consumer-focused
sponsorship-linked marketing communications. The model considers five
dimensions: individual and group factors that influence processing of messages and
responses; market factors that impact outcomes and are largely uncontrollable;
management factors that are controllable and can strongly influence both processing
and outcomes; the mechanics of processing and consumer outcomes of sponsorship.
In this model, various theories explaining how sponsorship works are included as
processing mechanics including:- exposure (Zajonc 1980, Olson & Thjomoe 2003),
low-level processing (Petty, Cacioppo & Schumann 1983, Olson & Thjomoe 2003),
reactivation (Pham & Vanhuele 1997), matching/congruence (Becker-Olsen &
Simmons 2002; Cornwell et al. 2003; Gwinner 1997); and balance/meaning transfer
(Dean 2002; Keller 1993; McCracken 1989). Figure 2.2 below demonstrates this
model. The main research studies conducted in relation to processing mechanics are
outlined in table 2.4.
Page 36
24
Figure 2.2 – Model Sponsorship Linked Marketing Communications
Table 2.4 – Sponsorship Processing Mechanics
Processing Mechanic Authors/ Year Hierarchy of Effects Witcher et al. 1991; Meenaghan 1991 and 2001
Mere exposure Olson & Thjomoe 2003, Bennett 1999
Recall & Recognition Pope & Voges 1995, D‘Stotlar & Johnson 1989; Pope & Voges 2000
Schema McDaniel 1999; Roy & Cornwell 2004; Madrigal 2001; Keller 1993
Low-level processing Petty et al. 1983, Olson & Thjomoe 2003
Balance/ image transfer Dean 2002; Gwinner 1997; Keller 1993; McCracken 1989
Reactivation Pham & Vanhuele 1997
Matching/congruence
(also known as Perceived
Fit)
Becker-Olsen & Simmons 2002; Cornwell et al. 2003; Cornwell et al.
2001, Gwinner 1997; Gwinner & Eaton 1999; Johar & Pham 1999;
McDaniel 1999 and Speed & Thompson 2000
Attribution Riffon et al. 2004; Dean 2002
Identification Cornwell & Coote 2005; Madrigal 2000; Madrigal 2001
Classical Conditioning Speed & Thompson 2000
(Source: adapted from Cornwell et al. 2005)
Importantly, Cornwell et al. (2005) point out that these processing mechanics are
generally not competing theories, but complementary concepts from a management
viewpoint. Given the framework of investigation of FMCG and its low involvement
nature, a discussion of low involvement processing theory establishes the framework
for this research. From a review of the literature, one prominent theory that has been
used to explain the link between the sponsored property and sponsoring brand is
image transfer theory. Other processing mechanics or theories that are relevant for
Outcomes
Cognitive
awareness
image
Affective
liking
preference
Behavioural
purchase intent
purchase commitment
purchase
Processing Mechanics
Mere exposure
Low-level processing
Reactivation
Matching/congruence
Articulation
Balance /meaning transfer
Identification
Others
Individual / Group
Factors
Past experience,
knowledge,
involvement,
arousal, social
alliance
Market Factors
Brand equity
Clutter
Competitor activities
Management Factors
Sponsorship policy
Activation/leverage
(Source Cornwell et al. 2005, p. 22)
Page 37
25
this research are identification (i.e. sponsored property identification) and congruence
theory (also known as perceived fit). The following sections describe these theories,
commencing with low level processing. This is followed by discussion of image
transfer theory, identification theory and perceived fit theory.
2.4.1 Low Level Processing
In the FMCG industry, marketers are aware that most consumer purchase decisions
are made at the point-of-sale or in the store (Harris 2000; POPAI Europe 1998;
Martinez & Cardona 1997). These types of purchases belong to the category of low
involvement purchases characterised by: little cognitive investment by consumers;
emotional decision making; and low brand loyalty (Summers et al. 2005). It has been
suggested that sponsorship is particularly suitable for low involvement products such
as FMCG (Lee 2005; Gwinner 1997; McDaniel 1999; Sandler & Shani 1989), given
that low involvement purchase decisions require consumers to choose between brands
with common characteristics and sponsorship‘s effects may provide a stronger point
of differentiation at the point of purchase.
By contrast, ‗high-involvement‘ decisions involve more complex attributes and
greater risk and thus prompt a more detailed cost-benefit analysis. In a high-
involvement context, sponsorship is less likely to assist in differentiating between
competing offers and so might be expected to have less effect on consumers‘
behaviour (Hoek & Gendall 2001). Given the suitability of FMCG for sponsorship
then, sponsorship leveraged packaging may provide differentiation and might prove
to be an important tool in building and reinforcing valuable brand associations. Yet
how consumers process sponsorship messages depicted on FMCG packaging is not
well understood. A useful approach to understanding how consumers process
marketing messages is provided by the elaboration likelihood model of persuasion.
Petty and Cacioppo‘s (1986) elaboration likelihood model (ELM) demonstrates that
consumers process marketing communications such as advertising and sponsorship
on a continuum ranging from ―low‖ cognition, motivation and consumer involvement
(peripheral route to persuasion) to extensive elaboration, motivation and high
involvement (central route to persuasion). The choice by a consumer as to how much
effort to expend on processing the information (the degree of cognition) is largely a
Page 38
26
factor of the level of involvement that a consumer has with the object of the
marketing communications (degree of involvement) (see Petty & Cacioppo 1986 for a
full account of the ELM and consumer persuasion).
In practical terms then, the preferred route for consumers by marketers will depend
on the company‘s market position and the degree of positive consumer attitudes
toward the brand or product. For products that are market leaders or where there is
high favourable consumer attitudes, marketers would prefer that consumers were
motivated to take the peripheral route to persuasion and use their emotional
attachment to the brand or product to lead to a purchase decision. When the product
or brand is trying to gain consumer attention, to change beliefs or to overtake a
market leader, then marketers would attempt to stimulate consumers to ―think‖ about
or to elaborate on the messages incorporated into their marketing communications
and to activate the central route to persuasion.
When this process is combined with the use of sponsorship as a marketing tool,
consumers become motivated and able to elaborate when the message content (in this
case sponsorship leveraging) is perceived as relevant and when they have the
knowledge and ability to think about the message. In many sponsorship situations,
however, marketing communications are only peripheral to the events that audiences
are involved with. For example, the sidelines, arenas and backgrounds of many
sporting fields, events surrounds and cultural exhibits will be accompanied by dozens
of posters, signs and verbal announcements of sponsoring brands (Olson & Thjomoe
2003). These stimuli are minimal by nature and cannot carry the wealth or quality of
information available in more complex communications.
In contrast, sponsorship leveraged packaging (SLP) may provide the capacity for
more detailed messages incorporating the sponsored property‘s image, logos, symbols
and information on the sponsoring brand‘s packaging. Furthermore, if marketing
messages such as sponsorship leveraged packaging are processed through the central
route, attitudes toward the sponsored property and sponsoring brand may be more
enduring and may have a greater capacity to affect purchase intentions than other
sponsorship advertising does.
Page 39
27
In a sponsorship arrangement, consumers are exposed to a number of marketing
messages or brand stimuli such as sponsorship advertising, event signage and point of
sale promotions such as SLP. When exposed to such stimuli, pre-existing consumer
feelings and attitudes toward the sponsoring property may be transferred to the
sponsoring brand. This transference of feelings and attitudes is known as brand
image transfer and is discussed next.
2.4.2 Brand Image transfer
Current sponsorship research has confirmed that sponsorship can be used to
successfully: increase brand awareness (Tripodi 2001; Thwaites 1995, 1999;
Hermans 2000); to enhance corporate image (Abratt & Grobler 1989, McDonald
1991); and to alter public perception (Irwin & Asimakopoulos 1992). However,
considerable importance has also been placed on sponsorship‘s ability to act as a
catalyst for attitude and behavioural change (Geldard & Sinclair 2002).
In particular, brand awareness and image development have been identified as the
most common objectives of sponsorship (Cornwell & Maignan 1998; Crowley 1991;
Gwinner 1997; Marshall & Cook 1992; Meenaghan 1991). Considerable research
attention has been devoted to sponsorship‘s ability to develop and enhance brand
image (Javalgi et al. 1994; Gwinner 1997; Gwinner & Eaton 1999; Grohs &
Reisinger 2005; Grohs et al. 2004).
Evidence suggests that sponsorship improves brand image by flanking consumer
beliefs about the brand and linking the brand to an event or organization that the
target audience already values highly (Crimmins & Horn 1996). One particularly
important association for sponsorship arrangements is the emotional connection that
consumers can have with a favourite property (Madrigal 2001). Emotional attachment
to teams, sports, arts and causes allows sponsoring organisations to connect with
consumers. As a result, attributes and attitudes associated with the sponsored property
in the memories of consumers may become indirectly linked with the sponsoring
brand (Tripodi 2001). Image transfer then, is the transfer of associations attributed to
the sponsored activity to the sponsoring brand (Gwinner 1997). In particular, the pre-
existing associations held in consumers‘ memories regarding sponsored property
become linked in memory with the sponsoring brand.
Page 40
28
Researchers have found empirical support for the transfer of association from
sponsored property to sponsoring brand. Crimmins and Horn (1996), Otker and
Hayes (1987) as well as Rajaretnam (1994) find a weak but consistently significant
image change for the sponsor as a result of sponsorship. Similarly, Stipp and
Schiavone (1996) find that attitude towards Olympic sponsors has a highly significant
positive impact on the images of sponsors. Grohs et al. (2004) find support for a
basic level of image transfer with magnitude of image transfer depending on two
factors, sponsorship leverage and event-sponsor fit. Grohs and Reisinger (2005)
support these findings with a high perceived fit leading to increased image transfer.
Studies examining brand image transfer are summarised in table 2.5.
The previous discussion reviews research that indicates that the image of a sponsored
property can be transferred to a sponsoring brand through sponsorship arrangements.
In addition, it has been shown that image transfer through sponsorship is more
effective when the pre-existing emotional associations held in consumers‘ memories
regarding a sponsored property become linked in memory with the sponsoring brand
(Gwinner & Eaton 1999). This association with a favourite property is called
Sponsored Property Identification and is discussed next.
Page 41
29
Table 2.5 – Image transfer Study Findings
Author/ Year Focus of Study Methodology Findings
Otker and
Hayes 1987
Measure effects of
sponsorship
Empirical survey The stronger the link between sponsor and event, the greater the impact on sponsor‘s image.
Rajaretnam
1994
Examines effect of
sponsorship in the absence of
other communication.
Case study &
longitudinal
survey
Image strength is greater among those who recall unaided. Sponsorship has greater impact
than advertising on awareness, brand preference and corporate image.
Javalgi et al.
1994
Examines sponsorship and
corporate image relationship
Exploratory Sponsorship can improve image, but results vary from situation to situation.
Stipp &
Schiavone 1996
Discusses the benefits of being
an Olympic sponsor.
Shows significant benefits for Olympic sponsors.
Gwinner 1997 Presents model identifying
factors that influence the
creation of an event‘s image.
Conceptual Proposes that an event‘s image associations are transferred to the sponsor through
sponsorship activities, moderated by degree of fit, level of sponsorship, event frequency,
product involvement.
Gwinner &
Eaton 1999
Assesses degree to which a
sporting event‘s image is
transferred to a brand through
sponsorship activity.
Experiment When event and brand are matched on either an image or functional basis the transfer process
is enhanced, indicating that if the match between event and product can be made stronger,
then the resulting image transfer is more pronounced.
McDaniel 1999 Matching event and brand in
terms of involvement
Subjects rated attitude toward the ad significantly more positively when a highly involving
product (e.g. an automobile) was paired with a highly involving sporting event (e.g. the
Olympics) than when the product was paired with a low involvement sporting event.
Grohs et al.
2004
Pre/post event
survey testing
recall and image
transfer.
Event-sponsor fit, event involvement and exposure positively affected sponsor recall. Brand
prominence only partly affected sponsor recall. Positive relationship was evidenced between
sponsorship leverage and the magnitude of image transfer.
Grohs &
Reisinger 2005
Investigates strength of image
transfer in sponsorship
including event-sponsor fit,
sponsorship exposure and
sponsor prominence.
Questionnaire
Beach Volleyball
World Tour 2002
High Perceived Fit between event and sponsor and a high sponsor prominence lead to an
increased image transfer. Longer sponsorship exposure results in a smaller image transfer. If
sponsorship exposure interacts with event-sponsor fit, then the interaction effect on the
magnitude of image transfer is positive.
(Source: developed for this study)
Page 42
30
2.4.3 Sponsored Property Identification
Sponsored property identification indicates the extent to which consumers identify
themselves with a specific activity (be it leisure activity or a cause) through their
engagement with the property (Grohs et al. 2004). For example, in Australia the
fanatic loyalty of an Australian Cricket Team fan, or the strong affinity by a breast
cancer sufferer toward the National Breast Cancer Foundation, would be considered
high sponsored property identification. Empirical evidence suggests that sponsored
property identification significantly affects image transfer from sponsored property
to sponsoring brand (Cornwell & Coote 2005; Daneshvary & Schwer 2002;
Meenaghan 2001; Madrigal 2000). Studies examining sponsored property
identification are summarised in table 2.6.
The studies in table 2.6 show that image transfer in sponsorship is mainly driven by
the degree to which a consumer identifies with the sponsored property. In particular,
consumers have been shown to have a higher intention to purchase the sponsor‘s
product if they: identify with the sponsored property; if that property or cause is
personally relevant; and if they perceive the source as credible (Daneshvary &
Schwer 2002). This suggests that the extent to which a consumer is involved with the
sponsored property will positively affect the consumer‘s attitude and purchase
intention toward the sponsor and their products. Therefore, whilst it is evident in the
literature that sponsored property identification is positively correlated with
consumer response to sponsorship, whether that relationship remains constant in the
case of SLP in a FMCG context, requires further investigation.
In addition to sponsored property identification impacting image transfer, evidence
suggests that perceived fit between the property and sponsor also positively impacts
image transfer. In order to understand how the fit between sponsoring brand and
sponsored property impacts image transfer, perceived fit is now discussed.
Page 43
31
Table 2.6 – Sponsored Property Identification Study Findings
Author/ Year Focus of Study Methodology Findings
Madrigal 2000 Examined how social alliances between
sports fans and preferred sports teams
influence consumers‘ purchase intentions
toward a sponsor‘s products.
Event
questionnaires
Purchase intentions were greater among those who identified with the team
being sponsored, and when such intentions were perceived to be the group
norm.
Madrigal 2001 Examined how consumers‘ levels of team
identification an influence their attitudes
toward a sponsor and their purchase
intentions
Team identification was found to moderate the effect of attitude on intention
to purchase.
Meenaghan 2001 Defines and explores goodwill, image
transfer and fan involvement and their
contribution to consumer response to
sponsorship.
In-depth
interviews with
industry
spokespeople
and focus group
research
Proposes model that suggests sponsorship is fundamentally driven by the
consumer‘s degree of involvement with and knowledge about the property
and the related extent of goodwill directed toward the sponsor. Based on
findings from qualitative research:- high levels of knowledge about the
property arising from high activity involvement enables the fan/consumer to
recognize the sponsor, judge the congruence of the relationship and associate
the image values the property onto the sponsor, thereby enabling the sponsor
to achieve the primary marketing objectives of awareness creating and brand
image building.
Olsen & Thjomoe
2003
Examined sponsorship with low
involvement products and in cases with
limited processing, comparing mere-
exposure conditions to peripheral route
conditions
Their findings indicated that individuals who had processed the additional
brand information had a greater attitude change than those who were exposed
to the information but did not process it.
Cornwell & Coote
2005
Social identity theory was used to
examine people‘s willingness to purchase
the products of the firms that sponsor
non-profit organisations.
Found positive relation between consumers‘ identification with the non-profit
organization and their intention to purchase its sponsor‘s products.
(Source: developed for this study)
Page 44
32
2.4.4 Perceived Fit
Studies examining perceptions of the sponsor-property relationship consistently
suggest that the impact of a sponsorship is dependent on the fit [or congruence]
between the property and the sponsor (Speed & Thompson 2000; D‘Astous and Bitz
1995; Gwinner 1997; Gwinner & Eaton 1999; Meenaghan 2001; McDaniel 1999). In
particular, a positively perceived sponsor/property fit has been shown to enhance
consumer attitudes toward sponsorship (Cornwell et al. 2003, Becker-Olsen &
Simmons 2002, McDaniel 1999).
Studies examining perceived fit are summarised in table 2.7. Apart from showing
that a positive perceived fit between the sponsor and property enhances consumer
attitudes and purchase intention toward the sponsor, the findings also show a positive
relationship between perceived fit and sponsored property identification. This
suggests that consumers who have a strong personal liking for a property will
respond more positively than other consumers will when the sponsor is able to show
a fit with the property (Speed & Thompson 2000). In addition, congruency theory
also suggests that the similarity of the sponsor and the property influences storage in
memory and recall of information about the sponsorship arrangement (McDaniel
1999). Given the importance of information processing to this research, and
particularly considering the limited processing typical of FMCG, it is necessary to
determine if perceived fit is a factor impacting consumer response to SLP.
The sponsorship literature clearly indicates that perceived fit is a major factor
affecting common attitudinal and behavioral measures (Dardis 2009). A number of
authors (e.g. Dean 2002; Crimmins & Horn 1996; Gwinner & Eaton 1999) suggest
that sponsorship effects are largely due to the perceived linkage between a sponsor
and the property (Dardis 2009). The importance of the brand/property fit has also
been supported in recent studies conducted by Koo et al. (2006), Speed and
Thompson (2000) and Grohs et al. (2004). Yet, despite its importance, research in
this area has focused on outcomes of perceived fit and less attention has been given
to understanding the variables that influence perceived fit. This assertion that
perceived fit is crucial to sponsorship outcomes indicates it is likely to act as a
mediator between particular variables and consumer response to sponsorship. For
example, Rifon et al. (2004) conducted mediation analysis on
Page 45
33
Table 2.7 – Congruency Study Findings
Author/ Year Focus of Study Findings
D‘Astous &
Bitz 1995
Nature of sponsorship,
sponsor/property link and effect on
consumer reactions.
Philanthropic sponsorship has a more positive impact on corporate image than commercial sponsorship. Positive
impact of consumer interest in the event on perceptions of the sponsor‘s image.
Johar & Pham
1999
Three experiments investigating
brand-event fit & market prominence.
Consumers (mis)identified sponsors as being those companies that were congruent with the event being
sponsored and were more prominent in the marketplace
McDaniel
1999
Influence of brand/event fit and
advertising placement on measures of
advertising effectiveness. Gender also
examined
Matching sponsors to sponsored sport may influence consumer response to sport sponsorship advertising.
Consumers may have memory-based expectations of advertised sponsorship relationships, as well as expectations
of where sponsorship advertising should appear. Fit and media manipulations were found to significantly impact
attitude toward the ad. Consumer response moderated by gender (females higher).
Speed &
Thompson
2000
Used a classical conditioning
framework to examine consumers‘
attitudes about sponsors, events,
perceptions of sponsor-event fit.
Response to sponsorship is stronger when consumers perceive there is a sponsor/ property fit. Perceived property
status is associated with a positive response at lower levers of the hierarchy. Attitude toward the sponsor was
positively associated with response to sponsorship. Positive relationship between fit and personal liking of
property. Consumer response was influenced by attitudes toward the sponsor, perceived sponsor-event fit, and
the perceived sincerity and ubiquity of the sponsor. Fit moderates the impact of attitude toward the ad and
preexisting attitude toward the brand.
Becker-Olsen
& Simmons
2002
Compares effects of native fit (the
extent to which the sponsor and the
property are perceived as fitting
together, independent of program
details or communications) and
created fit
Effects of fit on firm equity, as indicated by affective and behavioural responses, were completely mediated by
attitude toward the sponsorship and the perceived clarity of the sponsor‘s positioning. Low fit decreases equity
relative to no sponsorship, while high fit increases equity. Effects of created fit parallel those observed for native
fit and remain significant up to one year later. A non-profit sponsoring organisation generally results in more
favourable responses than a company sponsoring organisation. Created fit strategy improves recall of the
property over a one-year period.
Cornwell et al.
2003
Manipulated congruence and level of
sponsor and property
Recall was better for congruent sponsors than for incongruent sponsors. Recall for incongruent sponsors
improved with articulation
Hamlin &
Wilson 2004
Fit between causes, companies,
products and brands in CRM.
Degree of ‗fit‘ between sponsor and property has a significant effect on consumers‘ evaluations of products that
carry a cause ‗brand identity‘ as part of CRM campaign. Cause cues in low involvement purchase situations
create their impact by disrupting existing decision heuristics
Rifon et al.
2004
Consumer attributions of sponsor
motives & influence on fit
Sponsor-cause congruence was associated with attributions of altruistic motives, greater sponsor credibility, and
positive attitudes about sponsors. Congruence effects mediated by sponsor credibility.
Dardis 2009 Congruence and repeated exposure of
message
For a sponsor initially deemed incongruent, perceived congruence mediated the positive effects of repeated
exposure on other brand evaluations. Perceived congruence is a malleable factor that can be positively influenced
by repeated exposure to sponsorship messages.
Page 46
34
the relationships between congruence and altruistic motives, sponsor credibility and
sponsor attitudes. The findings indicated that congruence had direct effects on
sponsor credibility, as well as indirect effects through altruistic motives, however the
effects of congruence on sponsor attitudes was not significant. More recently, Dardis
(2009) found that perceived fit mediated the relationship between repeated exposure
to sponsorship messages and attitude toward the sponsor and purchase intention.
Similarly, research by Gwinner and Bennett (2009) indicates that the relationships
between brand cohesiveness and sport identification and sponsorship outcomes are
mediated by perceived fit. Alternatively, some studies have found that perceived fit
moderates consumer attitudes and behaviours (e.g Speed & Thomson 2000).
These studies and the reported importance of perceived fit in nearly all sponsorship
studies, suggests that perceived fit may play a moderating or mediating role in
consumer response to SLP. As it is not clear how perceived fit acts in a FMCG
context it will be included as an independent variable in the preliminary model to be
developed at the end of this chapter. In order to understand how sponsorship is
leveraged through packaging, this is considered next.
2.5 Leveraging Sponsorship Through Packaging
It has been well documented that in order to achieve marketing objectives,
sponsorship must be supported by leveraging (Seguin 2003; Kearney 2003, Fahy et
al. 2004 Crimmins & Horn 1996; Quester & Thompson 2001 and Grohs et al. 2004).
Indeed, the latest sponsorship advice to marketers is that to be effective, leverage of
up to three times the original sponsorship investment is required (Seguin 2005).
Leveraging allows the sponsor to increase awareness of the association and to deliver
a message about why the sponsorship is being undertaken (Grohs et al. 2004). Hence,
leveraging sponsorship presents an opportunity to increase the effectiveness of the
sponsorship in terms of its impact on consumers‘ behavior. As consumers are
exposed to messages promoting a property by a sponsor, there is an expectation that
consumers will develop favourable associations with that brand. These associations
may then secure top-of-mind awareness of the brand, create greater preference for
the brand and lead the consumer to purchase the brand (Tripodi 2001), which are all
positive outcomes of sponsorship (Meenaghan & Shipley 1999).
Page 47
35
A wide range of tools can be used to achieve sponsorship communication goals and
to reinforce the link between the property and the sponsor‘s brand to achieve the
desired identity and project a good image. One tool used to communicate
sponsorship arrangements is point-of-purchase communication. Research indicates
that up to 70 percent of purchase decisions are made at the point of purchase (Harris
2000; POPAI Europe 1998; Martinez & Cardona 1997). Therefore, it is logical that
point of purchase communication tools play a crucial role in sponsorship campaigns.
Point-of-purchase communications include: product presentation, store atmosphere,
product demonstrations, shelf displays and packaging (De Pelsmacker et al. 2001).
In particular, the role and importance of packaging has increased relative to other
communication tools because of its: increased significance in buying decisions in-
store; its presence at the critical moment of purchase decision, and its extensive reach
to most purchasers of the product (Orth & Malkewitz 2006; Underwood & Klein
2002). Evidence suggests that the primary communication role for product packaging
at the shelf is to generate consumer attention, by breaking through competitive
clutter. It also communicates brand image and personality using visual elements,
including: logos, colours, pictorials, and other elements providing rich brand
associations (Underwood 2003). In fact, packaging is considered to be one of the
strongest associations a consumer can have with a brand (Keller 1998); and is a very
important tool in building and reinforcing brand associations (Roper & Parker 2006).
Hence, leveraging sponsorship through packaging capitalizes on the commercial
potential of sponsorship and the benefits of packaging.
In the case of sponsorship images on packaging, it is likely that the emotional
attachment to a favoured property is recalled and reactivated. In addition,
information provided on the packaging regarding the sponsorship arrangement may
impact consumer beliefs about the sponsoring brand. Thus, it can be seen that using
sponsorship images on product packaging may affect consumer response to
sponsorship. However, it is not yet known if using SLP, particularly in a FMCG
context, impacts consumer response to sponsorship. Considering the current trend
for large sponsorship leveraging investments in this area, it is essential for
organizations to establish how consumer outcomes are affected by SLP. This will
enable management to adjust strategies and tactics, to justify continued spending on
Page 48
36
sponsorships and to differentiate competitive offerings. In order to understand how
consumer response to SLP is measured, this is discussed next.
2.6 Consumer Response to Sponsorship Messages
Consumer reaction to sponsorship has received extensive research attention,
particularly investigation of consumer‘s psychological processing of sponsorship
(Cornwell 2005; Walliser 2003; Madrigal 2000). The literature highlights the debate
concerning sponsorship‘s effect on consumer behaviour with two emergent schools
of thought. One school is based upon a framework developed from the hierarchical
model of effects by Lavidge and Steiner (1961), and the other school supports the
attention, trial, and reinforcement (ATR) advertising model by Ehrenberg (1974).
The ATR model views the role of promotional stimuli such as sponsorship as
reinforcing purchasing behaviour (Hoek et al. 1997) whilst the Hierarchy of Effects
Model renders sponsorship as an initiator of purchasing behaviour. The majority of
lead authors follow the Hierarchy of Effects Model with few studies considering that
sponsorship may work by reinforcing existing behaviours, rather than by persuading
consumers to take up new behaviours (Hoek & Gendall 2003). As the focus of this
study is not on the order of effects but the effects themselves, this study considers
effects from both models commencing with the Hierarchy of Effects Model.
2.6.1 Hierarchy of Effects Model
The Hierarchy of Effects Model is a derivative of the adoption process and is
designed to explain how consumers move through a number of stages towards the act
of purchase (Tripodi 2001). Although this model is principally used to evaluate
advertising effectiveness, authors such as Witcher et al. (1991) and Meenaghan
(1991) suggest that it can also be applied to the measurement of sponsorship
effectiveness, given the similarities between advertising and sponsorship. Other
sponsorship studies have also suggested that sponsorship aligns to a hierarchical
effects structure with causal properties (McDonald 1991; Olivier and Kraak, 1997)
(cited in Tripodi 2001). In applying this model, improving brand awareness and
brand image via sponsorship are communication effects that then lead to influencing
the purchase decision (Meenaghan 1983).
Page 49
37
This model is underpinned by an acceptance that there are three distinct stages of
psychological response to a marketing communication or purchase situation by
consumers. These are: cognition; affection; and conation. Cognition refers to a stage
when a consumer develops the beliefs about specific attributes of a marketing
communication or overall product offering. Affection refers to the stage when a
consumer develops emotional responses in relation to a marketing communication or
product offering. Finally, conation refers to the stage when consumers develop a
desire for action or behavioural intent as a response to a marketing communication or
product offering (Joyce 1967).
The Hierarchy of Effects Model suggests that consumers progress through these
stages in a different sequence depending on the situation, type of purchase or
marketing communication and the level of involvement they attribute to the purchase
decision. When faced with a sponsorship communication, consumers have been
shown to take a sequence that begins with the cognitive stage, particularly given that
sponsorship messages are often limited to only brand name and logo. The consumer
would then proceed to an emotional stage (affect) as they consider their feelings
about the property. These feelings are thought at this stage to be transferred to the
sponsoring brands, thereby achieving affective goals. The cognitive and affective
goals of creating or improving brand awareness and brand image via sponsorship
then precede and influence the conative stage of the hierarchy, in particular, the
decision to purchase or use a particular brand (Meenaghan 1983).
In contrast, Ehrenberg‘s (1974) Attention Trial Reinforcement Model, suggests that a
reversal of this causal process is in fact the case where attitudes follow behaviour.
This model is now explained in more detail.
2.6.2 Attention, Trial, Reinforcement Model
The Attention Trial Reinforcement Model devised by Ehrenberg (ATR) (1974) is
underpinned by three stages, which are to: create attention; facilitate trial purchase;
and reinforce purchase patterns. Although it has been suggested that sponsorship
may act in each of the three stages; sponsorship‘s cognitive function is thought to be
peripheral to its key role of reinforcing consumers to acquire a repeat purchasing
habit for the sponsoring brand (Tripodi 2001). With this in mind, it is thought that
Page 50
38
sponsorship strengthens consumer affection for the sponsoring brand after its
consumption or usage. A study by Hoek, Gendall and Tweed (1999) found evidence
supporting the functioning of sponsorship in accordance with the ATR model.
Empirical evidence suggests that positive attitudes toward a sponsor are associated
with intentions to: pay attention to; act favourably towards; and be willing to
consider a sponsor‘s product (Speed & Thompson 2000). Whilst consumers
generally declare themselves more likely to support sponsored products compared to
non-sponsored products, there is still conjecture and disagreement among scholars
about declaring a direct link between sponsorship and purchase intentions (Cornwell
& Maignan 1998; Otker and Hayes, 1987; Wilson 1997).
The ATR model when applied to sponsorship, suggests that sponsorship has an effect
on consumers who have prior experience with the brand (Tripodi 2001). Ehrenberg
(1974) suggests that most consumers are already knowledgeable about the product
categories from which they purchase and rather than creating awareness, sponsorship
maintains a brand‘s position in consumers‘ repertoire. Further, as sponsorship‘s
selling message is often confined to signage, packaging or advertising that promotes
the sponsorship association rather than the brand, its ability to persuade consumers to
purchase the sponsoring brand is suggested to be limited (Hoek & Gendall 2003).
Using Ehrenberg‘s ATR model, Hoek and Gendall (2003) argue that sponsorship
increases the overall attractiveness of a brand within a consumer‘s repertoire, but that
the increase is small, insignificant and insufficient to attract new users to the brand.
In Hoek and Gendall‘s (2003) choice modeling experiment involving instant coffee,
sponsorship did not significantly improve the utility of any of the brands tested,
although they afforded minor protection when competing brands offered a price
discount. These results suggest that sponsorship particularly in FMCG may not
prompt new behaviour, but make existing brand choices slightly more attractive.
From a review of the literature, it is unclear whether sponsorship in a FMCG context
follows the hierarchy of effects approach or the ATR approach. Therefore, it is
important to determine how effective sponsorship leveraged packaging is in
persuading consumers in a FMCG context. This study will determine whether
Page 51
39
sponsorship has the capacity to induce trial, improve existing brand attitudes and
increase purchase intent as the hierarchy of effects approach suggests; or whether
sponsorship in a FMCG context follows an ATR approach where it reinforces existing
attitudes but has little capacity to create new behaviours.
2.6.3 Consumer Attitudes Toward the Sponsoring Brand
Enhancing consumer brand attitudes towards a company is one of the most common
reasons companies engage in sponsorship (McDaniel & Kinney 1998). This
perspective has been well supported by both experimental and survey based
sponsorship research, which has highlighted the importance of attitude toward the
sponsor in effective sponsorship (Javalgi et al. 1994; Stipp & Schiavone 1996).
Attitudes are of great importance to marketers as they signify consumers‘ favourable
or unfavourable inclination towards particular products, thus giving an indication of
future consumption patterns. Attitudes are learned, and established as a result of a
personal experience, reasoning or information and the communicated experience of
others (Fishbein et al. 1975).
Cornwell and Coote (2005) have found that there is a positive relationship between
consumer attitudes and purchase intentions towards sponsor‘s products and empirical
evidence suggests that positive attitudes toward a sponsor are associated with
intentions to; act favourably towards; and be willing to consider a sponsor‘s product
(Speed & Thompson 2000). Prior research also suggests that brand experience has
been found to be a significant factor in predicting consumer attitudes. Therefore, in
order to understand how brand experience impacts attitudes towards the sponsoring
brand, it is examined next.
2.6.4 Brand Experience
Within the consumer behaviour research stream and to a certain extent in
sponsorship research, brand experience has also been found to be a significant factor
in predicting consumer attitudes (see for example: Pope & Voges 2000; Peracchio &
Tybout 1996; Sujan & Bettman 1989). Past brand experience may influence
consumer perceptions of marketing stimuli and also may aid the interpretation of
stimuli (Nancarrow et al. 1998). Furthermore, a consumer‘s prior experience with a
sponsor or property can trigger cognitive and affective responses that can impact the
Page 52
40
processing of sponsorship messages. Prior experience (usually derived from the use
of a brand) has been found to increase attitude strength and enhance the ability to
distinguish between brands (Pope & Voges 2000).
Attitude toward the sponsoring brand for more experienced users is more likely to be
based on personal experience and more detailed knowledge of salient brand attributes
(Peracchio & Tybout 1996; Sujan & Bettman 1989). Despite the importance of prior
experience in the processing of additional information regarding the brand, few
studies in sponsorship have considered it. More extensive consideration of past
experience is therefore warranted within the sponsorship domain and in particular the
FMCG context. Therefore, prior brand experience will be included in the preliminary
model of consumer response to sponsorship leveraged packaging. In addition to
brand experience impacting consumer attitudes toward the sponsor brand, it has also
been suggested to impact purchase intention. Purchase intention is discussed next.
2.6.5 Purchase Intention Toward the Sponsor’s Products
Prior research supports the premise that consumers who have previously used the
sponsoring brand have a higher purchase intention, than consumers who have not
previously used the brand (Pope & Voges 2000). Purchase intentions are formed on
the basis of many factors, including: perceptions about attributes such as quality;
endorsement by an association; identification with the sponsored property; and
attitudes that have been formed towards the brand (Westberg & Pope 2005).
Previous research has found that sponsorship is directly effective in influencing
purchase intentions towards sponsor‘s products (Crimmins & Horn 1996; Kohl &
Otker 1985). In addition, anecdotal evidence from commercial research companies
also suggests that sponsorship is directly effective in creating sales (Gordon 2007,
Crompton 2004). However, some researchers are still uncertain that sponsorship
influences purchase intentions [or sales] (e.g. Cornwell & Maignan 1998; Hoek et al.
1997). Hoek and Gendall (2003) suggest that this is because sponsorship may work
in a ―weak‖ sense by reinforcing existing behaviours rather than create new
behaviour. This lack of agreement in the literature highlights an important gap and
points to the need for further research focused on clarification of the effect of
sponsorship on purchase intent, a call this study takes up.
Page 53
41
While it appears then that sponsorship can be effective in gaining attention for brands
and impact brand attitudes; the way that sponsorship leveraged packaging impacts
consumer attitudes towards the sponsor and purchase intention towards the sponsor‘s
products needs to be better understood. The understanding gained from this research
will assist in determining SLP‘s value as a marketing tool and provide information to
enhance its effectiveness. Therefore, this study proposes an examination of
sponsorship leveraged packaging and its impact on consumer attitudes toward the
sponsoring brand and purchase intention towards the sponsor‘s products because of
their crucial importance to marketers. Further as the previous discussion shows
consumer response to sponsorship leveraged packaging may be impacted by the
experience a consumer has had previously with the sponsoring brand, brand
experience also needs to be included in a preliminary model of factors impacting
consumer response to sponsorship leveraged packaging.
2.6.6 Trial Intention Toward the Sponsor’s Products
In the sponsorship literature, there is limited empirical research that has considered
sponsorship‘s trial-inducing capabilities (Hoek et al. 1999). One of the few studies to
consider trial as a result of sponsorship by Hoek et al. (1997) examined Snickers‘
sponsorship of the 1994 Soccer World Cup. Findings indicated that a sponsorship
message created greater awareness among non-users (than advertising did).
However, neither sponsorship nor advertising increased the likelihood of purchase
for either users or nonusers of the brand (Hoek et al. 1997). As little is known about
sponsorship‘s capacity to influence trial of a sponsored product, this study seeks to
provide such information. Therefore, the model of factors impacting consumer
response to SLP will include trial intention as a consumer response to SLP. Research
relating to sponsorship outcomes is summarised in table 2.8.
Page 54
42
Table 2.8 – Sponsorship Outcomes
Author /Year Study Description Findings
Recall/
Recognition
Cornwell et al.
2003
Manipulated congruence and level of sponsor-property relationship
explanation via press releases and assessed cued recall.
Recall was better for congruent sponsors than for incongruent
sponsors. Recall for incongruent sponsors improved with articulation.
Gwinner 1997 Outlined a model of how sponsorship can impact brand image.
Image transfer is aided by factors such as sponsor-sponsee similarity.
Gwinner & Eaton
1999
Assessed the extent to which image transfer occurs from brand to
event, through event sponsorship depictions.
Participants tended to rate events and brands similarly in terms of
‗personality‘, particularly when they were matched on either image or
functional bases.
Hansen and
Scotwin 1995
Experimental enquiry into sponsorship effects using recall and
recognition testing
Sponsoring messages generate attention at all levels of response
hierarchy. Researchers suggest that sponsoring can be applied
effectively as marketing communication.
Johar & Pham
1999
Manipulated congruence and perceived market prominence of
sponsor, and measured sponsor identification.
Consumers (mis)identified sponsors as being those companies that
were congruent with the event being sponsored and were more
prominent in the marketplace.
Attitudes
McDaniel 1999 Examines consumer schemas that influence reactions to advertising
leveraging sport sponsorship. Tested influence of brand/event fit and
advertising placement on measures of advertising effectiveness.
Gender was also examined.
Fit and media manipulations were found to significantly impact
attitude toward the ad. Females were found to report significantly
higher attitude towards the ad and purchase intentions than males.
Rifon et al. 2004 Examined how consumer attributions of sponsor motives influence
the effects of sponsor-cause congruence on ratings of sponsor
attitude and sponsor credibility.
Sponsor-cause congruence was associated with attributions of altruistic
motives, greater sponsor credibility, and positive attitudes about
sponsors. Congruence effects on attitudes about sponsors were
mediated by sponsor credibility.
Speed and
Thompson 2000
Used a classical conditioning framework to examine consumers‘
attitudes about sponsors and events, and perceptions of sponsor-
event fit.
Consumer response was influenced by attitudes toward the sponsor,
perceived sponsor-event fit, and the perceived sincerity and ubiquity of
the sponsor.
Crimmins & Horn Operationally defines and illustrates consumer impact of Fans of an event or organization are grateful to the sponsors and are
Page 55
43
Author /Year Study Description Findings
1996 sponsorship. Examines the rate of success in achieving consumer
impact by large companies sponsoring major events. Measures
strength and duration of the link, gratitude and perceptual change
due to the link.
apparently willing to change their perception of the brand, but they
need to be told how the perception should change. Organisations who
invest in communicating sponsorship are more successful at creating a
link with the property.
Involvement
Dean 2002 Examined balance theory and attribution theory in relation to
sponsorship.
Sponsorship of a well-liked charitable event resulted in enhanced
corporate community relations, and in both positive and negative
attributions.
Petty et al. 1983 Manipulated level of product involvement, strength of argument,
and type of endorser in a magazine advertisement for a product.
Two routes to persuasion were found: central and peripheral. High
involvement consumers were influenced by strength of argument, and
low-involvement consumers by type of product endorser.
Brand
Preference
Olson & Thjomoe
2003
Compared mere exposure of a brand with varying levels of cognitive
processing of brands
Mere exposure enhanced preference for the brand name. Exposure to
additional, but unprocessed information did not affect preference.
Purchase
Intention
Cornwell & Coote
2005
Social identity theory was used to examine people‘s willingness to
purchase the products of the firms that sponsor non-profit
organisations.
Found positive relation between consumers‘ identification with the
non-profit organization and their intention to purchase its sponsor‘s
products.
Madrigal 2000 Examined how social alliances between sports fans and preferred
sports teams influence consumers‘ purchase intentions toward a
sponsor‘s products.
Purchase intentions were greater among those who identified with the
team being sponsored, and when such intentions were perceived to be
the group norm.
Madrigal 2001 Examined how consumers‘ levels of team identification influences
their attitudes toward a sponsor and their purchase intentions
Team identification was found to moderate the effect of attitude on
intention to purchase.
Popes & Voges
2000
Examined relationships between corporate image, prior product use
and belief that a company sponsors.
Significant effects on purchase intention were found from the brand,
from the belief that the company sponsored sport and from the
corporate image of the company. No interaction effects between the
independent variables were found.
(Source: adapted from Cornwell et al. 2005)
Page 56
Consumer Response to Sponsorship Leveraged Packaging PhD Thesis Frances Woodside
44
In summary, it is known that sponsorship can increase brand awareness and contribute to
brand image. It is strongly believed that the combined use of sponsorship with other
communication techniques increases its (awareness and image) impact. Therefore, it is
expected that a sponsored property‘s image would be transferred to the sponsoring
brand‘s image when stimulated by sponsorship leveraged packaging. It is further
expected that this relationship would be affected by sponsored property identification,
perceived fit and brand experience. These findings provide considerable input into the
process of answering the primary research question for this program of research, which
is ‗‗What factors impact consumer response to sponsorship leveraged packaging in
FMCG markets?‖ From this discussion, a theoretical model of Factors Impacting
Consumer Response to SLP is now proposed and discussed.
2.7 Preliminary Model - Factors Impacting Consumer Response to SLP
Based on the literature, the components of a preliminary model of factors impacting
consumer response to SLP are now developed along with a series of propositions that
will guide the next stage of this research program. The literature has indicated that
several constructs are likely to contribute to the understanding of Factors impacting
Consumer Response to SLP. These are: sponsored property identification; perceived fit;
and brand experience. Each of these is now reviewed.
Sponsored Property Identification is proposed to directly impact consumer response to
sponsorship leveraged packaging. That is, as the degree of sponsored property
identification increases, consumer response to sponsorship leveraged packaging will also
increase. Sponsored property identification is a construct that captures the consumer‘s
degree of personal relevance of the sponsored property. Furthermore, a consumers‘
level of sponsored property identification will impact their decision-making in terms of
how they will respond to sponsorship communication. Therefore, this construct is
proposed to have the main effect in predicting consumer response to sponsorship
leveraged packaging. Moreover, it is proposed that this construct is likely to influence
the remaining constructs in their ability to impact consumer response to sponsorship
leveraged packaging.
Page 57
Consumer Response to Sponsorship Leveraged Packaging PhD Thesis Frances Woodside
45
Brand Experience. Brand experience with the sponsoring brand is proposed to directly
impact consumer response to SLP. That is, as the degree of brand experience with the
sponsoring brand increases, consumer response to SLP will also increase.
Perceived Fit. A consumer‘s perceived fit between the sponsoring brand and the
sponsored property is proposed to directly impact consumer response to sponsorship.
That is, as the degree of perceived fit increases, consumer response will also increase.
Prior research reported in section 2.4.4 provides some evidence that perceived fit may
act as a moderator or mediator (depending on the context) between certain variables and
consumer response to sponsorship. Previous research has indicated the importance of
perceived fit in determining sponsored property identification. Therefore, for this study,
it is proposed that perceived fit impacts consumer response to sponsorship leveraged
packaging. As it appears from the sponsorship literature that perceived fit may moderate
the relationship between sponsored property identification and consumer response to
SLP, it will also be tested in the data analysis stage of this research.
Consumer Response to SLP. Image transfer theory suggests that, when exposed to
sponsorship stimuli, such as SLP, consumer feelings toward this stimulus are likely to
become associated with existing information about the brand and property stored in
long-term memory. This results in attitudes toward a favoured property being
transferred to the sponsoring brand. Furthermore, as prior research indicates that
consumers who have previously used the sponsoring brand have a higher purchase
intention than consumers who have not previously used the brand, an examination of the
impact of brand experience on purchase intentions towards the sponsor‘s products is also
warranted. Therefore, consumer attitudes and purchase intention towards the sponsor‘s
products are chosen as the variables of interest because of their importance to marketers.
In addition to attitude and purchase intentions, in order to determine whether
sponsorship acts in a Hierarchy of Effects manner or follows an ATR approach, it is
necessary to include trial intention as a consumer response to SLP. Such information
would help marketers to understand which sponsorship arrangements have the greatest
potential to create trial intention and higher purchase intention among consumers.
Page 58
Consumer Response to Sponsorship Leveraged Packaging PhD Thesis Frances Woodside
46
Figure 2.3 shows the proposed relationships between these constructs. As the exact
interrelationships between the proposed constructs are unknown, they are shown in the
model in figure 2.3 to have equal effect on consumer response to SLP. It is intended that
this model will be reviewed following the completion of exploratory research when
more information is known about the constructs and how they relate to each other.
Figure 2.3 – Preliminary Model - Factors Impacting Consumer Response to SLP
Overall, the literature reviewed here enables a number of research propositions to be
formulated, relating to the relationships between these variables. The propositions are:
P1 Consumer response to SLP is impacted by the consumer‘s identification with the
sponsored property.
P2 Consumer response to SLP is impacted by the consumers‘ degree of experience with
the sponsoring brand.
P3 Consumer response to SLP is impacted by the degree to which the consumer
perceives a match between the sponsoring brand and sponsored property.
SPONSORED
PROPERTY
IDENTIFICATION
CONSUMER
REPSPONSE
SLP
PERCEIVED
FIT
BRAND
EXPERIENCE
Page 59
Consumer Response to Sponsorship Leveraged Packaging PhD Thesis Frances Woodside
47
2.8 Conclusion
In this chapter, a theoretical framework for Consumer Response to SLP has been
proposed. The Elaboration Likelihood Model, Image Transfer and Associate Network
theories provide understanding into this little researched marketing strategy. The
literature indicates that Consumer Response to SLP is likely to be impacted by
Sponsored Property Identification, Brand Experience and Perceived Fit. Yet there is a
need for further research on the impact of sponsorship and SLP on consumer response.
The next chapter considers the design, implementation and findings of the exploratory
phase of this research, Study 1.
Page 60
Consumer Response to Sponsorship Leveraged Packaging PhD Thesis Frances Woodside
48
Chapter 3 Study 1
3.1 Introduction
Chapter 2 provided a review of the literature and identified a number of constructs
that are proposed to impact Consumer Response to SLP. At the conclusion of
Chapter 2, Sponsored Property Identification was proposed to be the main
construct impacting Consumer Response to SLP. Perceived Fit and Brand
Experience were proposed to impact Consumer Response to SLP. Furthermore,
Perceived Fit was proposed to possibly act as a moderator of Consumer Response
to SLP. As the interrelationships between these constructs are not known, and the
combination of these constructs together in a study is unique, it is important that
these constructs be explored more fully to define their composition and to assist in
operationalising them for inclusion in this study. Thus, this program of research
will take the form of two studies. The first will be exploratory in nature and will
investigate the composition and behaviour of some of the constructs proposed in
the research model to allow modification of the proposed model and confirmation
of hypotheses. The second study will be explanatory in nature and will empirically
test the model and research hypotheses. This chapter will focus on the rationale
and results from Study 1.
This chapter commences with a discussion of the theoretical grounding for the
methodology used in this program of research. Specifically, it will provide the
foundation epistemology for the methods proposed in each study and justify the
choice of methods used (section 3.2). The chapter will then provide the rationale
and objectives for Study 1 (section 3.3). The methodology used for this study will
be described, specifying the research design, the sampling methodology, and the
data analysis techniques to be used (section 3.4). The chapter then presents the
results of Study 1 and concludes with a discussion of the implications of this study
for the larger program of research (section 3.5). Finally, the research model
proposed at the completion of Chapter 2 will be amended based on the results, and
a final research model and hypotheses will be presented for testing in the next
stage of the research, Study 2 (section 3.6). Conclusions for the chapter follow.
Page 61
Consumer Response to Sponsorship Leveraged Packaging PhD Thesis Frances Woodside
49
Figure 3.1 – Chapter Outline
3.2 Theoretical Foundations
Prior to discussing the method applied to this research, it is necessary to consider
the purpose of the research as well as the research paradigm appropriate to the
study. The purpose of this research (as outlined in section 1.2) was to gain a better
understanding of the marketing tool ‗sponsorship leveraged packaging‘ and how
the use of that tool impacts consumer behaviour. Given the lack of literature that
explains how SLP works, an exploratory approach was needed to provide a rich
understanding of consumer behaviour associated with SLP. Exploratory research
is generally qualitative in nature and uses methods such as focus groups and depth
interviews (Aaker et al. 2007). Furthermore, as exploratory approaches are often
followed by more conclusive research, it would be appropriate to also include
explanatory research with a view to explaining the factors highlighted in the
exploratory research as impacting consumer response to SLP.
3.1 Introduction
3.5 Discussion of Results from Study 1
3.3 Rationale and objectives for Study 1
3.2 Theoretical Foundations
3.6 Revised model and hypotheses
3.7 Conclusions
3.4 Methodology for Study 1 - Exploratory Research
Page 62
Consumer Response to Sponsorship Leveraged Packaging PhD Thesis Frances Woodside
50
Having established the purpose of the study, selection of an appropriate research
paradigm must be considered. A paradigm has been described as ―a basic
orientation to theory and research‖ (Neuman 2003 p.70). The two broad
approaches relevant to the social sciences are positivism and interpretivism
(Carson et al. 2001). The positivist perspective relies on objective fact and
includes quantitative methodologies such as surveys and experiments. The focus
of research from a positivist perspective is to test a theory that has been developed
based on reviewing existing theory: that is, a deductive approach to research. The
theory is then subjected to empirical measurement and evaluation.
Conversely, interpretivism focuses on understanding human behaviour by
observation, accounting for multiple realities including: the participants, the
researcher and the context (Carson et al. 2001). Interpretivist researchers usually
prefer qualitative methods such as observation and field research with a focus on
building theory by understanding a phenomenon, i.e. an inductive approach
(Blaikie 1993). Within these two paradigms, a range of philosophies exists
including post-positivism, critical theory, realism, and constructivism. These
paradigms are summarised in table 3.1.
Table 3.1 – Alternative Enquiry Paradigms
Positivism Realism Critical theory Constructivism
Ontology naïve
realism:
reality is real
and
apprehensible
critical realism:
reality is ―real‖ but
only imperfectly
and probabilistically
apprehensible and
so triangulation from
many sources is required
to try to know it
historical realism:
―virtual‖ reality
shaped by social,
economic, ethnic,
political, cultural,
and gender values,
crystallised over
time
critical
relativism:
multiple local and
specific
―constructed‖
realities
Epistemology objectivist:
findings true
Modified objectivist:
findings probably true
subjectivist: value
mediated findings
subjectivist:
created findings
Methodology experiments/
surveys:
verification
of hypotheses:
chiefly
quantitative
methods
Case studies/convergent
interviews: triangulation,
interpretation of research
issues by qualitative and
quantitative methods such
as structural equation
modeling
dialogic/dialectical:
researcher is a
―transformative
intellectual‖ who
changes the social
world within which
participants live
hermeneutical /
dialectical:
researcher is a
―passionate
participant‖
within the world
being investigated
Source: Perry, Riege & Brown (1996, p. 547) based on Guba and Lincoln (1994).
Page 63
Consumer Response to Sponsorship Leveraged Packaging PhD Thesis Frances Woodside
51
One paradigm that stands out as being particularly relevant to the purpose of this
program of research is the post-positivist paradigm. The post-positivist paradigm
(also known as critical realism) is consistent with positivism in assuming that an
objective world exists. However, it assumes the world might not be readily
apprehended and that variable relations or facts might be only probabilistic, not
deterministic. Thus, the positivist focus on experimental and quantitative methods
used to test and verify hypotheses is complemented by an interest in using
qualitative methods to gather broader information outside of readily measured
variables (Gephart 1999).
The fundamental nature of the post-positivist paradigm is that reality is ―real‖ but
only imperfectly, suggesting that although the findings of this research point in
some respect to reality, the research may not uncover ‗all‘ that is to be known
about Consumer Response to SLP and the factors that impact it. This fallibility is
addressed in two ways. Firstly, the data are triangulated across multiple sources
including literature from the areas of sponsorship, marketing communications and
consumer behaviour, and Studies 1 and 2. Secondly, structural equation modeling
(used to analyse the data in Study 2) allows an attempt at generalising to a
population while allowing for measurement error and considers complex
interdependencies, using multi-item scales to measure latent, unobservable
variables (Aaker et al. 2007; Godfrey & Hill 1995).
In a critical realism approach, the positivist focus on experimental and quantitative
methods used to test and verify hypotheses is complemented by using qualitative
methods to gather broader information outside of readily measured variables
(Gephart 1999). Given the purpose of this program of research, the post-positivist
paradigm is an appropriate paradigm as its focus is on the integration of qualitative
and quantitative methods. Therefore, this research takes a post-positivist approach.
Page 64
Consumer Response to Sponsorship Leveraged Packaging PhD Thesis Frances Woodside
52
3.3 Rationale and Objectives for Study 1
The literature reviewed in the previous chapter highlighted a general lack of
empirical research examining consumer response to sponsorship leveraged
packaging in a FMCG setting. Nonetheless, theoretical models have been used to
explain and measure antecedents to consumer responses to sponsorship in general
(Alexandris et al. 2007; Gwinner & Swanson 2003; Madrigal 2001; Speed &
Thompson 2000). These research findings have indicated that property-sponsor fit
and sponsored property identification, are most often the dominant factors when
attempting to predict sponsor recall (Grohs et al. 2004).
The context of previous research undertaken in relation to consumer responses to
sponsorship has largely been within the domain of high involvement goods and
services, and generally in relation to advertising or other forms of marketing
communications. Conversely, there has been a corresponding call for research into
sponsorship from a low involvement product perspective (Close et al. 2006; Lacey
et al. 2005). Thus, it is not known whether the pattern of interrelationships
between these constructs will remain consistent in a purchase situation, which is
close to the point of purchase, as is the case with SLP in a FMCG context. It is
anticipated that these constructs are likely to perform differently in this context,
and that some may not be relevant. The gap in the current literature only allows us
to conceptually propose how the constructs are likely to behave (see figure 2.3).
Therefore, it is important before moving to a comprehensive research program to
test the preliminary research model (presented in Chapter 2) that more is known
about how these constructs perform in a low involvement decision setting on
FMCG packaging. Study 1 will use a qualitative approach (justified in section 3.2)
to explore how these constructs behave, their likely relationships to each other and
to determine the measurement of consumer response to SLP. Finally, it will allow
fine-tuning and operationalisation of the measures of these constructs to account
for the change of context. Given that the rationale for Study 1 has been established
and its objectives outlined, the methodological issues relating to Study 1 now need
Page 65
Consumer Response to Sponsorship Leveraged Packaging PhD Thesis Frances Woodside
53
to be discussed. This section will begin with discussion relating to the data
collection method. The results of the study will then be reported and implications
of the results will be considered.
3.4 Methodology for Study 1 - Exploratory Research
The purpose of the exploratory research was to inform the theory generation
process, to assist in the identification of constructs and the development and
purification of measures. Three exploratory research steps were undertaken: focus
groups, depth interviews and a qualitative survey. This approach enabled
triangulation of findings, which is suggested as an appropriate technique for
ensuring the validity of qualitative research (Creswell 1998; Miles & Huberman
1994). Methodology and findings from each step are discussed next, commencing
with the focus group methodology.
3.4.1 Step 1 - Focus Group Methodology
The first step of the exploratory research in Study 1 used two focus groups with
consumers to tease out and better define the issues and patterns of interaction
between the variables under study. Focus groups were chosen as an appropriate
method of gaining rich information given the known advantages of focus groups,
including: respondent interaction, synergy, spontaneity, stimulation and
serendipity (Stokes & Bergin 2006). The use of focus groups to assist in
verification and clarification of the constructs in this study is also consistent with
other research in the field (Hamlin & Wilson 2004; Underwood & Klein 2002;
Silayoi & Speece 2004).
Initially it was proposed that focus groups would be conducted until no new
information was forthcoming. However, during the first two focus groups, the
situation arose on several occasions where a dominant participant in the group was
particularly negative about sponsorship. At this time, the researcher felt that this
may have influenced other members of the group, with the outcome that some
individuals may have felt less able to discuss their views on sponsorship and
Page 66
Consumer Response to Sponsorship Leveraged Packaging PhD Thesis Frances Woodside
54
sponsorship leveraged packaging. In order to avoid this situation, the researcher
decided it would be better to change the method of collection of the information to
one-on-one interviews. This impact on the exploratory research methodology is
discussed in section 3.4.2. Sampling for the two focus groups is discussed next.
The participants for the two focus groups were recruited through a convenience
sampling method, using staff and their personal contacts at University of Southern
Queensland. Though this is not a preferred method to ensure objectivity, the
participants were from a variety of demographic and socio-economic groups,
ensuring a cross section of the target population defined as ‗all household shoppers
living in Australia‘. As richness and depth of information was a key objective of
conducting this exploratory research, randomization was not considered critical.
This view is supported by Zikmund (1997, p.463) who suggests, ―Convenience
samples are best used for exploratory research when additional research will be
conducted with a probability sample‖.
The principal objectives of the focus groups were to: uncover consumers‘ general
feelings toward the use of SLP and to examine the factors that might affect
consumer response to SLP. Additionally, the focus groups provided the
opportunity to check for completeness of the conceptual framework and to inform
the process of measurement modification.
Focus Group Protocol. Both focus groups followed the following format.
Participants of the focus groups were firstly questioned to determine general
grocery shopping habits. Participants were asked to complete an unaided recall
exercise, listing packaging promotional campaigns that they could remember (e.g.
celebrity endorsement, gift inclusions, causes marketing, sponsorship). Participants
were asked to recall any promotional campaigns with no prompts, and then asked
more specifically, to recall any sponsorship packaging campaigns with no prompts.
Participants were shown a variety of packages depicting promotional campaigns
and were asked questions regarding their perceptions of the packages. Participants
Page 67
Consumer Response to Sponsorship Leveraged Packaging PhD Thesis Frances Woodside
55
were asked if they recognised the sponsorship packaging examples. Participants
were then asked about their opinions of sponsorship packaging and how
sponsorship packaging influenced their behaviour.
There were 21 broad topic areas posed for the focus group discussions, which
suggests that these sessions were of a structured nature (Leaderman 1990). The
order of questions was not strictly controlled and the researcher had freedom to
rearrange questions to suit the dynamics and flow of discussion for each group.
The discussions from the focus groups were transcribed and a summary of the
main themes was prepared (Berlson 1971). The Focus Group Protocol is provided
in Appendix 1.
A total of twelve participants were recruited for the two focus groups comprising
nine females and three males aged between 31 and 55 years. Each participant was
allocated to a focus group on the basis of their age and family life cycle to achieve
two relatively homogeneous groups. Participant profiles are provided in table 3.2.
The data were thematically analysed. That is, the data were reviewed and coded
into discrete descriptive themes. The themes were chosen based on the literature
reviewed in Chapter 2. Each theme is presented in turn: consumer response to
FMCG packaging; consumer response to SLP; sponsored property identification;
type of sponsorship; and sponsoring brand loyalty. The results are now discussed.
Table 3.2 – Focus Group Profiles
Focus Group 1 Focus Group 2
No. of subjects 5 7
Females (%) 100% 57%
Males (%) 0 43%
Age range/mean 25-41/ 38 31-55/ 45
Choice elements Price, quality, value for money Price, quality, consistency in quality
Interest in SLP Ranged from not at all interested to very
interested if gift included
not at all interested
Page 68
Consumer Response to Sponsorship Leveraged Packaging PhD Thesis Frances Woodside
56
3.4.2 Step - 1 Focus Group Findings
General shopping behaviour
Participants varied in their shopping habits, particularly with regard to number of
shopping trips per week, where they shopped and their enjoyment of grocery
shopping. Most participants said they used shopping lists, but also bought products
on impulse. Participants varied in the degree to which they considered themselves
to be price conscious, with some participants suggesting that they might be price
sensitive with some products and not with other products.
Focus group participants were asked, ―When choosing grocery products, what
things do you consider to be important?‖ Participants in both the focus groups
identified: price; brand name; quality and weight as being important when
choosing grocery products. Participants indicated that in some product types
(category), the brand was particularly important. For example in cereal products,
one participant felt that the brand leaders (e.g. Kellogg‘s, Sanitarium) were more
consistent as far as taste and quality were concerned, compared to home brands
which varied in these respects.
In addition, participants indicated that there were some categories of products for
which they were extremely brand loyal, including: coffee, breakfast cereals, toilet
paper and particularly tinned goods. In these types of categories, participants
indicated that in most cases they bought their favourite product and would not
consider any substitutes regardless of price or other promotions.
Consumer response to FMCG packaging. Focus group participants were asked,
―When choosing grocery products, do you look at the packaging?‖ Some
participants indicated that they often looked at product packages, whilst others said
they usually did not really look at the packaging but did occasionally. Focus group
participants were asked ―When you do look at the packaging itself, what things do
you consider to be important?‖ Participants indicated that the packaging elements
Page 69
Consumer Response to Sponsorship Leveraged Packaging PhD Thesis Frances Woodside
57
they saw as important in their choice of brand included: ingredient and nutritional
information; package size; colour; country of origin and promotional giveaways.
Participants completed an unaided recall exercise, where they were asked to recall
any promotional campaigns on product packaging. Participants recalled such
campaigns as free-gifts, two-for-one price discounts, competitions, and the Heart
Foundation ‗tick‘; yet no sponsorship or CRM campaigns were recalled (unaided).
When shown the examples, most participants recognised the SLP campaigns.
Consumer Response to SLP. Participants claimed that they noticed that
sometimes the packaging had sponsorship on it; yet, recall of specific campaigns
was very poor with only one participant out of the twelve being able to accurately
list any sponsorship campaigns on FMCG packaging. Although the participants
could not recall any sponsorship or CRM campaigns without prompts, they did
appear to recognize those types of promotions once they were shown examples.
This suggests that although they were unable to recall unaided the sponsorships,
most respondents were aware of the sponsorship. Whether being aware of the
sponsorship impacts consumer response to SLP or not, is not known.
When the respondents were asked, ―What do you think of the ‗sponsorship
packaging‘?‖ the participants indicated that they believed that they were generally
unaffected by SLP with comments such as:
„I never look at packaging. I take absolutely no notice of those campaigns‟
„As long as the packaging keeps the product fresh I don‟t have any interest‟
„Some people might be affected by SLP but I wouldn‟t be‟.
Further, respondents indicated that the sponsorship would not encourage or
influence them to purchase the sponsor‘s products. Most participants felt they were
not influenced by SLP, when asked ―Do you think it would affect whether you
bought the product or not?‖ five out of the twelve participants adamantly said ‗no‘.
Page 70
Consumer Response to Sponsorship Leveraged Packaging PhD Thesis Frances Woodside
58
However, participants were able to suggest when SLP might be effective, by
commenting:
„It might work better depending on what sporting season was current‟
„It might be effective if you supported the team on the packaging.‟
‟If it was a new product you were not familiar with, you might try the product‟
‟I‟d buy it if it had free collectors cards – my son collects the cards‟.
These comments indicate that although the participants suggested they would be
unlikely to be influenced by SLP, there were some conditions under which they or
other consumer may be influenced. These conditions included: involvement with
the sponsored sporting team; currency of the sporting season; trial of an unfamiliar
product; and gift inclusions.
Sponsored Property Identification. Some participants indicated that their
involvement with a favourite sponsored group would impact their response to
sponsorship leveraged packaging. Participants indicated that they were influenced
by the sponsorship of a favourite property, recognizing this relationship through
the pictures on the packaging by commenting:
“I feel that by purchasing the product I am helping out a cause I support.”
It might „tip the balance‟ for the sponsored one if I supported that cause.”
Therefore, it would appear that the findings from Study 1 support the literature
examined in Chapter 2, which indicated that the emotional tie a consumer has with
a sponsored property is a key factor in consumer response to sponsorship.
Type of Sponsorship. Interestingly, participants showed a different response to
their favourite sport using SLP than to a favourite cause using SLP. In the majority
of cases, the participants indicated that if a FMCG had SLP involving a favourite
sport, it would make little difference to their attitude with such comments as:
„I would note it, but not necessarily buy the product‟
„It wouldn't affect me either way‟
„It wouldn't change whether I purchased it or not‟.
Page 71
Consumer Response to Sponsorship Leveraged Packaging PhD Thesis Frances Woodside
59
However when considering SLP involving a favourite cause, their response was
more positive with comments such as:
„I might be more inclined to buy the product‟
„Good, cancer research should be getting a % from the sale‟
„I'd consider buying it, but only if other criteria were also satisfied‟
„Maybe people buy products supporting causes like breast cancer, because
it is only 10 or 20 cents extra, and that doesn't matter that much.‟
These comments indicate that Consumer Response to SLP may be impacted by the
type of property sponsored. In particular, these findings suggest that sponsorship
of a cause is likely to engender a higher attitude and higher purchase intentions
than sponsorship of a sport. Moreover, the comments also indicate that some
participants appeared to confuse SLP with cause related marketing (CRM), which
differs from sponsorship in that a contribution is made to the cause based on sales.
Whilst theoretically there is much effort to distinguish between these marketing
activities (Seguin 2007) it seems that in practice, consumers may respond to and
consider them to be the same. However as this study considers the use of SLP
only, CRM is outside the scope of this study.
Brand Experience. Participants indicated that in considering grocery shopping in
general, over time they had tried a number of brands of the products they generally
purchased. Although they considered that for most products they would have
considerable brand experience, it did not mean they bought those brands regularly.
From this discussion, it would appear that frequency of purchase would be a better
variable to capture the dimension needed. To this end, instead of brand
experience, frequency of purchase will be included in the conceptual model of
factors impacting Consumer Response to SLP.
Furthermore, participants indicated that there were some product categories where
the participants considered they would be loyal to particular brands and not
consider alternative brands. In cases where there was a high degree of brand
Page 72
Consumer Response to Sponsorship Leveraged Packaging PhD Thesis Frances Woodside
60
loyalty, participants indicated that they did not consider alternative brands at all
and therefore any SLP on those brands, even for properties they supported, were
unlikely to gain their attention or impact their purchase decisions. This would
suggest that loyalty to the sponsoring brand is a key variable, which needs to be
included in a model of factors impacting Consumer Response to SLP.
Exposure to Other Media and Promotions. When the participants were asked,
―When might sponsorship packaging impact your behaviour?‖, participants
suggested:
„It might back-up advertising at events etc.‟
„You might see the sponsor‟s ads at the game and then when you go to the
shops you might buy the product‟
This would indicate that Consumer Response to SLP is likely to be impacted by
exposure to other promotions as sponsorship often occurs in conjunction with other
promotional activities such as advertising, merchandising and sales promotions.
Furthermore, participants suggested that consumers would be exposed to other
marketing tools such as television advertising and event signage in addition to the
SLP. This supports the view that Consumer Response to SLP is generally a
combination of information stored in memory from other marketing
communication efforts as well as reactions to the packaging seen in-store.
Therefore, in order to understand the specific contribution of SLP, it would be
necessary to isolate the effect of SLP from other promotional efforts.
3.4.3 Step 2 - Depth Interview Methodology
Initially, focus groups were chosen as an appropriate method for gaining richness
and depth of information. However, the second focus group highlighted a possible
disadvantage of that data collection method, particularly relating to the topic under
discussion i.e. sponsorship. There were some very strong feelings amongst several
of the participants that sponsorship was an advertising gimmick. This negative
perception of sponsorship may have affected the other participants‘ willingness to
Page 73
Consumer Response to Sponsorship Leveraged Packaging PhD Thesis Frances Woodside
61
express their own ideas regarding sponsorship and sponsorship leveraged
packaging. This could have influenced the depth of the information gathered. It
was then necessary to consider how this problem could be overcome. Careful
consideration was given to how the same information could be gathered using a
different method without the negative effects of ―group think‖ involved with focus
groups. With this in mind, it was decided that the second step of the exploratory
research in Study 1 would involve depth interviews with consumers. In this way,
the required information could be gathered from individuals rather than groups.
Participants for the depth interviews were recruited from the staff of University of
Southern Queensland and their personal contacts, using a referral sampling
method. The participants were from a variety of demographic and socio-economic
groups. Eight depth interviews were conducted. During the last two interviews, no
new information was revealed and it was decided to cease the interviews.
The interviewees consisted of six females and two males aged between 30 and 45
years. Although a mixture of males and females were asked to participate,
generally males indicated that the majority of household shopping was conducted
by their wives and they felt unqualified to provide information relating to grocery
shopping. Participant profiles are provided in table 3.3. The data were reviewed
and coded into descriptive themes. The themes were based on the literature
reviewed in Chapter 2 and on the issues highlighted during the interviews. Each
theme is presented in turn: general shopping behaviour; consumer response to
FMCG packaging; Consumer Response to SLP; Sponsored Property Identification;
Sponsoring Brand Loyalty and exposure to other media and promotions.
Table 3.3 – Depth Interview Profiles
Interviews
No. of subjects 8
Females (%) 75%
Males (%) 25%
Age range/mean 30-45/ 35
Important choice elements Price, consistency in quality, new products
Interest in SLP Ranged from not interested to interested depending on cause
Page 74
Consumer Response to Sponsorship Leveraged Packaging PhD Thesis Frances Woodside
62
Depth Interview Protocol Interviewees were initially questioned regarding general
grocery shopping habits and shopping behaviour in various grocery categories.
Following on from this, interviewees were asked a number of questions relating to
packaging in general before completing an unaided recall exercise, listing
packaging promotional campaigns that they could remember (e.g. celebrity
endorsement, gift inclusions, cause marketing, sponsorship). Interviewees were
asked to recall any sponsorship packaging campaigns. The interviewees were then
shown a variety of current market-place packages depicting promotional
campaigns including sponsorship leveraged packaging and were asked questions
regarding their perceptions of the packages. During the interviews, when reference
was made to sponsorship leveraged packaging, it was termed ‗sponsorship
packaging‘. The depth interview protocol provides details of the specific questions
asked (see Appendix 1).
3.4.4 Step 2 - Depth Interview Findings
General shopping behaviour. Interviewees varied in their shopping habits,
regarding the number of shopping trips per week, where they shopped and their
enjoyment of grocery shopping. Most interviewees said they used shopping lists,
but also bought some products on impulse. Interviewees were asked, ―When
choosing grocery products, what things do you consider to be important?‖ As a
result, price, nutritional content and country of origin were identified as being most
important when choosing grocery products. Interviewees indicated that in product
categories such as: clothes detergent, breakfast cereals, coffee and toilet tissue:
brand was particularly important. In these categories, interviewees indicated that
in most cases they bought their favourite product and would not consider any
substitutes regardless of price or other promotion.
Consumer response to FMCG packaging. Interviewees were asked, ―When
choosing grocery products, do you look at the packaging?‖ Some interviewees
indicated that they sometimes considered the packaging, by looking at the front
and back of the package. Participants indicated that the packaging elements they
Page 75
Consumer Response to Sponsorship Leveraged Packaging PhD Thesis Frances Woodside
63
saw as important in their choice of product included: ingredient and nutritional
information; package size; colour, and country of origin.
Participants completed an unaided recall exercise, where they were asked to recall
any promotional campaigns on product packaging. Participants recalled such
campaigns as The Heart Foundation ‗tick‘; Think Pink Breast Cancer Ribbon,
Olympic sponsorship, and cause related promotions. When shown the stimulus
packages, most interviewees recognised the campaigns, including those with SLP.
Consumer Response to SLP. Some interviewees were able to recall without
prompts a number of promotional campaigns including sponsorship of the
Olympics and Breast Cancer Foundation. However when asked, ―What they
thought of the ‗sponsorship packaging‘?‖ the interviewees indicated that despite
being familiar with the concept of ‗sponsorship packaging‘ they were generally
unaffected by it. Interviewees showed little interest in sponsorship packaging by
commenting,
„I am only interested in the product from a nutritional perspective‟
„As long as the product had the same quality and price, I would consider it if
it sponsored a good cause‟.
Further, when asked ―Do you think it would affect whether you bought the product
or not?‖ some interviewees indicated that the sponsorship would not encourage or
influence them to purchase the sponsor‘s products with comments such as,
‗It might affect how I felt about the company, but I wouldn‟t necessarily buy it‟
„The sponsorship packaging might influence whether I buy the product or not
depending on the price.‟
When the interviewees were asked, ―When do you think sponsorship packaging
might be effective?‖ the interviewees indicated that SLP would be unlikely to
impact many consumers unless they were interested in the group pictured on the
packaging.
Page 76
Consumer Response to Sponsorship Leveraged Packaging PhD Thesis Frances Woodside
64
Sponsored Property Identification. The majority of interviewees were not
personally involved in any sport, however most had family members who were
involved and supported both sports and particular teams. In addition, a number of
interviewees regularly donated to charitable causes and were interested in those
causes. Some interviewees indicated that their involvement with a favourite cause
would help them to decide to purchase the product. Thus, there was some support
that the type of sponsorship could impact Consumer Response to SLP.
Sponsor Brand Loyalty. Interviewees indicated that there were some categories
of products for which they were extremely brand loyal. In particular, beverages
(tea and coffee); personal care products (toilet paper, toothpastes, hair care); tinned
foods (fish, vegetables, fruit) and frozen goods. In cases where there was a high
degree of brand loyalty, participants indicated that they did not consider alternative
brands at all and therefore any SLP on those brands, even for properties they
supported, were unlikely to gain their attention or impact their purchase decisions.
This provides support that loyalty to the sponsoring brand is a variable which
needs to be included in a model of factors impacting Consumer Response to SLP.
3.4.4 Step 3 - Qualitative Survey Methodology
The third stage of the exploratory research was to assist in the fine tuning of
measures and wording for the final questionnaire used in the experimental stage of
the research. It also aided in the selection of the specific packaging examples to be
used for the final questionnaire instrument. To this end, a qualitative survey
instrument was developed to clarify issues relating to: product category
involvement; product category elaboration; importance of product packaging;
importance of packaging images and elements; brand loyalty; and participation and
support of sports and causes. A copy of the qualitative survey is included in
Appendix 1.
Participants for the qualitative survey were recruited through a convenience
sampling method, using general and academic staff at University of Southern
Queensland. Twenty-six participants completed the qualitative survey. In
Page 77
Consumer Response to Sponsorship Leveraged Packaging PhD Thesis Frances Woodside
65
describing sample size for this part of the exploratory research, sampling was
driven by the desire to learn in detail and in depth about the experience of
consumers. Therefore, the final decision about sample numbers was based on data
saturation, which occurred when no new information was obtained. From the 26
qualitative surveys, there was sufficient consensus and communality of terms
amongst the responses to provide input to aid in the design of the experimental
questionnaire (Study 2).
Participant profiles are provided in table 3.4. From this, it can be seen that the
majority of survey participants were female (88%), a similar sample profile to the
depth interviews. Again, males who were approached were reluctant to participate
in the survey as their wives were responsible for household shopping. The
disparity between this sample and the population sample (63% female – Roy
Morgan Research 2009) may be the result of the limited sample parameters. As
richness and depth of information were considered paramount for this stage of the
research, this issue was not considered critical.
With regard to data analysis, the survey data were thematically analysed based on
the themes highlighted from Steps 1 and Steps 2 of the exploratory research. In
addition, the quantitative sections of the survey including category involvement,
packaging importance and attitude sections were analysed using SPSS software to
determine frequency counts and means only. These results are now discussed,
commencing with shopping behaviour.
Table 3.4 – Qualitative Survey Participant Profiles
Survey
No. of subjects 26
Females 23
Males 3
Age range/mean 31-70/ 45
Important choice elements Nutritional info, price, ingredients, country of origin
Page 78
Consumer Response to Sponsorship Leveraged Packaging PhD Thesis Frances Woodside
66
3.4.5 Step 3 - Qualitative Survey Findings
General shopping behaviour. Respondents indicated that there were some
product categories for which they spent a moderate amount of time and effort in
making the purchase decision (i.e. category involvement). Respondents were asked
how much time and effort they put into choosing various products (response was
measured on a three point scale 1 = no time and effort, 2 = spend some time and
effort, 3 = a lot of time and effort). In particular, consumers indicated that when
purchasing such products as: coffee, chocolate, breakfast cereals, biscuits,
medicine, fresh fruit and vegetables, they expended either a moderate or high level
of shopping involvement. Table 3.5 reports frequency and means for these items.
Whilst this is a small sample, it was used for exploratory purposes only, to aid in
the choice of SLP examples to be used in the main study, Study 2. It is important
in a study that attempts to determine the full value of SLP as a communication
vehicle that the SLP examples chosen are from a product category that typically
involves at least limited decision making. As can be seen from these results,
product choice in some categories of FMCG (see table 3.5) involves at least
limited decision making.
Table 3.5 – Response to Category Involvement
Product Category Some shopping
effort & time
(n=26)
Lot of shopping
effort and time
(n=26)
Mean*
Breakfast cereals 11 (44%) 6 (24%) 1.9 Biscuits 11 (44%) 0 (0%) 1.4 Medicine 11 (44%) 9 (36%) 2.1 Baking 13 (50%) 3 (11%) 1.7 Fresh Fruit and vegetables 9 (36%) 10 (41%) 2.1 Toilet paper 13 (50%) 6 (24%) 1.9
* measured on 3 point scale 1=no shopping effort 2=some shopping effort 3=lot of shopping effort.
Furthermore, in choosing the product examples for Study 2, it is important that the
chosen product category should be one where consumers could be expected to
evaluate some aspects of the product packaging in making their product choice. In
general, the majority of respondents (23/26) indicated that they usually examined
Page 79
Consumer Response to Sponsorship Leveraged Packaging PhD Thesis Frances Woodside
67
products before choosing them when grocery shopping. Respondents indicated that
when choosing grocery products, they consider the following criteria to be most
important in choosing: price, nutritional value, ingredients, use-by-date, quality,
fresh appearance, and country of origin. Specifically, the majority of respondents
(22/26) indicated that they considered the packaging of the product before
choosing. When asked which types of products they looked at packaging, the
majority of respondents indicated that they looked at packaging in the following
product categories: breakfast cereals, medicines, fresh fruit and vegetables, and
dairy products (see table 3.6).
Table 3.6 – Response to Packaging in Product Categories
Product Category Looks at packaging
(n=26) Breakfast cereals 16 (61%) Biscuits 10 (38%) Medicine 12 (46%) Baking 8 (30%) Fresh Fruit and vegetables 12 (46%) Toilet paper 10 (38%) Toothpaste 10 (38%) Laundry Products 9 (34%) Dairy Products 17 (65%)
Consumer Response to SLP. The majority of respondents (15/26) indicated that
they had noticed sponsorship pictured on product packaging. Yet recall of
sponsorship packaging campaigns was considerably lower with only nine of the
respondents being able to accurately recall unaided any sponsorship campaigns.
When asked whether the sponsorship of a favourite sport or cause pictured on
packaging would impact their purchase decision, thirty percent of the respondents
(8/26) indicated that SLP may impact their decision. Respondents gave reasons for
this impact by commenting:
„It would indirectly support the cause‟
„I would buy it to be socially responsible‟
‗If the product was good value, I would probably buy it out of a sense of
altruism‟.
Page 80
Consumer Response to Sponsorship Leveraged Packaging PhD Thesis Frances Woodside
68
For those respondents who indicated that SLP would not impact their decision,
they gave reasons such as:
„It would not impact the decision as I have preferred brands‟
„It‟s not relevant, one is food, the other sport‟
‟I buy a product for the product, not because it is related to any cause‟.
Attitudes and purchase intentions toward the sponsor. The questionnaire used
in this study contained a set of quantitative questions that examined consumer
attitudes and purchase intentions toward a nominated SLP. There were 12 attitude
questions in all, covering the areas of attitude and purchase intention toward the
sponsor, perceived fit and importance of perceived fit. Responses were measured
by a five point Likert scale (1 = strongly disagree 2 = disagree 3 = neither agree
nor disagree 4 = agree 5 = strongly agree). Results for these questions are reported
in the table 3.7. Whilst this is a very small sample, it was used for exploratory
purposes only, to give an indication of possible responses with a view to including
the measures in the main study, Study 2.
Table 3.7 – Response to Attitude Questions – Qualitative Survey
*measured on a five point scale 1=strongly disagree – 5 = strongly agree
Statement Strongly D/ Disagree
(n=26)
Strongly A/
Agree(n=26)
Mean*
If a firm sponsors a favourite property it
helps me decide which product to buy 9 (34%) 5 (19%) 2.5
This sponsorship makes me feel more
favourable toward the sponsor 9 (34%) 5 (19%) 2.5
This sponsorship would make me more likely
to notice the sponsor at other times 9 (34%) 6 (23%) 2.4
This sponsorship would make me more likely
to remember the sponsor‘s promotions 8 (30%) 6 (23%) 2.6
Based on all of my experiences, I have a
favourable impression of the sponsor 5 (19%) 10 (38%) 3.2
I would buy from a sponsor of the property
even if competitors‘ prices were lower 11 (42%) 1 (3%) 2.1
I see a link between the property and sponsor 8 (30%) 4 (15%) 2.5 Its important that there is a link between the
property and the sponsor 10 (38%) 4 (15%) 2.4
My associations with the property are similar
to those with the sponsor 9 (34%) 1 (3%) 2.3
When choosing brands it makes little
difference to me if they sponsor the property. 3 (11%) 12 (46%) 3.7
Page 81
Consumer Response to Sponsorship Leveraged Packaging PhD Thesis Frances Woodside
69
As can be seen in table 3.7 the most outstanding from these results, were the
responses from two statements relating to purchasing the sponsor‘s products. In
the first instance, relating to the statement ‗I would buy from a sponsor of the
property even if competitors‘ prices were lower‘, 42% disagreed with the
statement. This suggests that respondents would be unlikely to buy a sponsored
product if competitors‘ prices were lower. Secondly, with regard to the statement
‗When choosing brands it makes little difference to me if they sponsor the
property‘, the majority of respondents (46%) indicated that sponsorship would
have little impact on product choice. Thus, it would appear that the respondents
consider that SLP would have little impact on their purchase decisions. This
finding is particularly important, given that the purpose of the majority of
sponsorship promotions is aimed at improving awareness, attitudes, purchase
intentions or brand loyalty. Should SLP be having little impact on consumer
behaviour its effectiveness is limited in this regard.
In summary, the participants from the three steps of Study 1 (focus groups,
interviews and qualitative study) in the exploratory stage of this research strongly
suggested that they were not conscious of paying particular attention to
sponsorship messages depicted on packaging of FMCG. Supporting this claim, the
unaided recall for this form of marketing activity was very poor. When prompted
however, recall improved and participants appeared to be familiar with the concept
of SLP. Furthermore, participants also suggested that they were unlikely to be
influenced in their purchase decisions by SLP. Findings from the three steps in the
exploratory research also indicated that consumer response to SLP is impacted by
sponsored property identification, sponsoring brand loyalty, perceived fit, type of
sponsored property, and exposure to other media and promotions. These results
will now be discussed.
3.5 Discussion of Results from Study 1
Chapter 2 concluded with a preliminary model that posited that Consumer
Response to SLP (i.e. attitudes, trial intention and purchase intention toward the
sponsor‘s product) could be explained by the degree to which a consumer relates to
Page 82
Consumer Response to Sponsorship Leveraged Packaging PhD Thesis Frances Woodside
70
the sponsored property (Sponsored Property Identification) and the previous
experience a consumer has with the sponsoring brand (Brand Experience). It was
further posited that this relationship would be moderated by the degree of
Perceived Fit between the sponsored property and sponsoring brand. It can be
seen that much of what was posited to occur in relation to Consumer Response to
SLP, was supported by the exploratory research.
However, one consumer response not previously considered critical in a FMCG
context was highlighted in the exploratory research, i.e. consumer awareness of the
sponsorship. As this consumer response has not been previously considered in this
study, it will be discussed first. This will be followed by the other constructs
previously mentioned in Chapter 2, consumer response to SLP, sponsored property
identification, brand experience and perceived fit.
Awareness of the Sponsorship. The results of the exploratory research suggest
that consumer response to SLP is very likely to be impacted by the consumer‘s
awareness of the sponsorship arrangement. Several studies support that
sponsorship is an effective tool in increasing brand awareness levels (Johar & Pham
1999; Pham & Johar 2001; Rifon et al. 2004; Speed & Thompson 2000;
Apostolopoulou & Papadimitriou 2004; Chadwick & Thwaites 2005). By increasing
consumer awareness, sponsors try to influence the development and depth of brand
association and increase the chance that consumers will select a brand or product
(Busser et al. 2001; Crompton 2004). Given the importance companies place on
consumers‘ ability to remember the sponsorship (Bennett et al. 2006) awareness of
sponsorship is a critical aspect for organisations to manage.
Some studies show that awareness is impacted by high property involvement
(Meenaghan 2001; Grohs et al. 2004) and perceived fit between the sponsoring
brand and the sponsored property (Crimmins and Horn 1996; Johar and Pham
1999; Speed & Thompson 2000; Grohs et al. 2004). As ninety-three percent of the
companies involved with sport sponsorship have a primary objective of increasing
Page 83
Consumer Response to Sponsorship Leveraged Packaging PhD Thesis Frances Woodside
71
product awareness (Koo 2008), it is becoming increasingly important to determine
how awareness impacts consumer response to sponsorship in a FMCG context.
What is not yet understood is the impact of awareness of the sponsorship on
consumer response to SLP. This program of research seeks to gain understanding
on the role awareness plays in Consumer Response to SLP.
These conclusions prompt changes to the preliminary model proposed at the
conclusion of Chapter 2 and suggest consumer response to SLP is likely to be
impacted by awareness of the sponsorship. This would suggest that awareness
moderates consumer response to SLP. Therefore, awareness of the sponsorship
will be included as a moderator in the conceptual model. It was also posited in the
preliminary research model that consumer response to SLP will be impacted by
sponsored property identification, brand experience and perceived fit. These will
now be discussed, commencing with consumer response to SLP.
Consumer Response to SLP. Participants in Study 1 the exploratory stage of this
research, indicated that in the majority of cases they felt they were unlikely to be
influenced in their attitudes or purchase intentions towards the sponsor‘s products,
as a result of the SLP. However, there was some indication that in the event that
the participant highly valued the sponsoring property (particularly in the case of a
sponsored cause), there was likely to be some impact on purchase behaviour. In
the case of participants being particularly interested in a sport property, there was
some indication that the sponsorship may be noted, but not necessarily impact on
the purchase decision. In addition, there was some suggestion that in the case of a
new product, a valued property may influence a consumer to try the sponsored
product due to the association with the sponsored property.
Sponsored Property Identification. Sponsored property identification was
identified in the exploratory research to impact consumer response to SLP.
Respondents indicated that their response to SLP was impacted by their level of
identification with a particular property. As it is evident in the literature and
Page 84
Consumer Response to Sponsorship Leveraged Packaging PhD Thesis Frances Woodside
72
exploratory research that the degree to which a consumer identifies with the
sponsored property positively impacts consumer response to sponsorship; this
research posits that sponsored property identification will be positively correlated
with consumer response to SLP. That is, the greater the degree of sponsored
property identification the higher will be the consumer response to SLP.
Brand Experience. Although brand experience was highlighted in the literature as
a construct that would impact consumer response to SLP, it was found in the
exploratory research to have a lesser impact on consumer response to SLP. This
could be explained by the transitory nature of the FMCG market, where consumers
may have considerable brand experience but are prone to switching behaviour. In
this case, frequency of purchase and loyalty to the sponsoring brand were thought
to more closely capture a consumers‘ preference for a brand. Therefore, frequency
of purchase and loyalty to the sponsoring brand will be included in the model of
factors impacting consumer response to SLP.
Loyalty to the Sponsoring Brand. The exploratory research indicated that it
would be necessary to include in a model of factors impacting Consumer Response
to SLP, the variable ‗loyalty to the sponsoring brand‘. In today‘s fiercely
competitive FMCG industry, brand managers have attempted to tackle consumers
increasing price sensitivity by creating stronger brands. In light of brand loyalty‘s
significance as a competitive advantage (Helmig, Huber & Leeflang 2006), and the
suggestion that sponsorship is particularly suitable for low involvement products
such as FMCG (Lee 2005) SLP may provide a point of differentiation for
organisations. Moreover, as marketers are aware that most FMCG consumer
purchase decisions are made at the point-of-purchase (Harris 2000); promotion
techniques are considered particularly important since on-pack promotions can
influence the consumer (Royd-Taylor 2007).
However, the literature also suggests that there is an inverse relationship between
brand loyalty and responsiveness to competitive promotion that is: as brand loyalty
Page 85
Consumer Response to Sponsorship Leveraged Packaging PhD Thesis Frances Woodside
73
increases, the vulnerability to competitive action is reduced (Aaker 1991). This
suggests that in the case of SLP, for consumers who are already loyal to a brand,
SLP will have little effect on their purchase behaviour.
Following this logic, when a consumer is not loyal to a particular product, SLP
may provide a point of differentiation and thus prompt consumers to consider the
sponsored product. Thus, it is posited that loyalty to the sponsoring brand would
have an inverse relationship to consumer response to SLP in FMCG. In addition to
sponsored property identification and sponsoring brand loyalty, perceived fit, type
of sponsored property and exposure to other media and promotions were also
highlighted in the exploratory research as factors that may impact consumer
response to SLP. Therefore, these are now discussed in turn.
Perceived Fit. Some participants indicated that in the case where they were
interested in the SLP, the similarity between the property and the sponsor‘s image
would have little impact on whether they bought the product or not. This
indifference to fit (compared to what is cited in the literature) could be explained
by the use of real world SLP examples that logically would have a reasonable fit
and therefore the participants did not see any obvious incongruence. Alternatively,
in a low involvement product context where consumers may not even process the
sponsorship message consciously, unless there was an obvious mismatch between
the sponsoring brand and sponsored property, consumers would be unlikely to
consider the fit between the images.
Although perceived fit between the sponsored property and sponsoring brand was
not found in the exploratory stage to be a crucial factor in consumer response to
SLP, it is considered extremely important in the relevant theory relating to
sponsorship. Therefore, it is retained for further testing in the conceptual model to
determine if the perceived fit between sponsored property and sponsoring brand in
a FMCG context impacts consumer response in the same way as in previous
sponsorship research.
Page 86
Consumer Response to Sponsorship Leveraged Packaging PhD Thesis Frances Woodside
74
Type of Sponsored Property. The exploratory research indicated that consumers
may respond differently to sponsorship of a sport compared to sponsorship of a
cause. The results suggest that consumer response to SLP may be impacted more
in the case of sponsorship of a cause. Given that cause sponsorship is generally
associated with humane causes it is likely to create positive emotions among
consumers.
These positive emotional reactions would then extend to positive attitudes towards
the sponsor, thereby creating a strong association between the cause and the
sponsor. The strong emotional tie between consumers and a favoured cause may
influence consumer response to sponsorship messages. Thus, a consideration of the
type of sponsored property would be a necessary component to a study of
consumer response to SLP. Thus, it is posited that consumer response to SLP will
be impacted by type of sponsored property (sport or cause).
Exposure to Other Media and Promotions. In the exploratory research, an
additional factor was highlighted as impacting consumer response to SLP that is:
exposure to other media and promotions. Logically most organizations involved in
sponsorship, leverage their sponsorship investment in a variety of ways. As
previously mentioned these leveraging tools can include: advertising (both
broadcast and event); merchandising, point-of-purchase and packaging.
To this end, and based on the results reported in the previous sections, consumers
would be exposed to a variety of means of learning of a sponsorship arrangement.
SLP is one component of a sponsorship leveraging campaign used in conjunction
with other tools. Despite this, as sponsorship leveraged packaging has received
little academic and empirical research interest, it is important to determine its value
in isolation before considering its impact in conjunction with other marketing
communication tools. The implications of this are discussed in the next chapter.
Page 87
Consumer Response to Sponsorship Leveraged Packaging PhD Thesis Frances Woodside
75
This discussion provides direction for revising the model proposed at the end of
Chapter 2 before proceeding with the next stage of research, Study 2. The revised
model and associated hypotheses are discussed next.
3.6 Revised Model and Hypotheses
This revised model (shown in figure 3.2) proposes that consumer response to
sponsorship leveraged packaging is impacted by sponsored property identification
and sponsoring brand loyalty. Consumer response to SLP is measured by positive
attitude toward the sponsor, trial intention and purchase intention towards the
sponsor‘s product. This relationship is moderated by type of property sponsored,
frequency of purchase (sponsoring brand), awareness of sponsorship, and
respondent characteristics. There is likely to be a difference in consumer response
to SLP depending on the type of property sponsored (sport or cause).
In addition, when the sponsored property is a cause, there is likely to be a stronger
positive impact on consumer response to SLP than when the sponsored property is
a sport. In cases of frequent purchase of the sponsoring brand, there is likely to be
a strong positive impact on consumer response to SLP. Furthermore, in cases of
high degrees of perceived fit there is likely to be a strong positive impact on
consumer response to SLP. Overall, the literature and exploratory research
conducted so far enables a number of hypotheses to be formulated. These are
summarized in table 3.8.
Figure 3.2 – Revised Research Model for Study 2
H2
SPONSORED
PROPERTY
IDENTIFICATION
CONSUMER
REPSPONSE
SLP
PERCEIVED
FIT
SPONSORING
BRAND
LOYALTY
H1
H3 Moderated by:
Type of Sponsored Property
Frequency of Purchase
Awareness
Respondent Characteristics
Page 88
Consumer Response to Sponsorship Leveraged Packaging PhD Thesis Frances Woodside
76
Table 3.8 – Research Hypotheses
H1 That there is a direct and positive relationship between sponsored property identification
and consumer response to SLP. That is: as the degree of sponsored property identification
increases, there will be a direct positive impact on consumer response to SLP
H2 That there is a direct and positive relationship between perceived fit and consumer
response to sponsorship leveraged packaging. That is: as the degree of perceived fit
increases, there will be a direct positive impact on consumer response to SLP.
H3 That there is a direct and negative relationship between sponsoring brand loyalty and
consumer response to SLP. That is: in cases of low sponsoring brand loyalty, there will be
a direct positive impact on consumer response to SLP.
H4 That consumer response to SLP is moderated by type of sponsored property. That is there
will be a difference in consumer response depending on the type of sponsored property.
H5 That consumer response to SLP is moderated by type of sponsored property. That is there
will be a difference in consumer response depending on the type of sponsored property.
H6 That consumer response to SLP is moderated by awareness of the sponsorship. That is in
cases where the respondent is aware of the sponsorship; there will be a positive impact on
attitudes toward the sponsor and purchase intention toward the sponsor‘s products.
H7 That consumer response to SLP is moderated by frequency of purchase of the sponsoring
brand. That is in cases where the respondent frequently purchases the sponsoring brand;
there will be a positive impact on Consumer Response to SLP.
H8 That consumer response to SLP is moderated by respondent characteristics. That is
consumer response to SLP will vary depending on age, income, household status &
respondent gender.
3.7 Conclusions
In recent years, considerable research has been undertaken toward a better
understanding of how consumers process sponsorship messages. Many of these
studies have sought to discover theoretical explanations related to the cognitive
processing of sponsorship stimuli and the effects on consumer response. Cornwell
et al. (2005) suggested that the various theories used to explain how sponsorship
works in consumers‘ minds (i.e. processing mechanics) are influenced by
individual and group-level factors, market factors and management factors. The
exploratory research reported in this chapter found support for Cornwell‘s
proposition that individual factors such as sponsored property identification,
frequency of purchase and brand loyalty influence consumer response to SLP.
Further, management factors such as type of property sponsored appeared to
impact consumer response to SLP. Yet there is a need for further research to
determine the extent of impact of these factors on consumer response to SLP and
furthermore the relationships between these factors. The program of empirical
research proposed in the next chapter addresses this need.
Page 89
Consumer Response to Sponsorship Leveraged Packaging PhD Thesis Frances Woodside
77
Chapter 4 – Study 2 Methodology
4.1 Introduction
The previous chapter provided details of the exploratory stage of this research (Study
1). The purpose of this chapter is to describe and justify the research methodology
used in the second stage of this program of research (Study 2). The chapter is
organised into three main sections. Firstly, the rationale for the research method will
be discussed (section 4.2). Following on from this the research design will be
described (section 4.3). In this section, specific areas of the research design will be
described, such as: experiment design; questionnaire development; the sampling
method; ethical considerations and data analysis strategies. Finally, conclusions will
be drawn (section 4.4). Figure 4.1 provides a chapter outline.
Figure 4.1 – Chapter Outline
4.2 Rationale for Research Method
Calls for better measurement in sponsorship research have been made for some years
particular in considering the interchange of sponsorship and consumer behaviour (Ali
et al. 2006) and how the image of the property transfers onto the sponsoring
organisation (Close et al. 2006). It is suggested in the literature that the combined use
of sponsorship with other communication techniques increases its impact on
4.1 Introduction
4.3 Study 2 Methodology 4.3.1 Experiment Deign 4.3.2 Questionnaire Development 4.3.3 Sampling 4.3.4 Ethical Considerations 4.3.5 Data analysis strategies
4.2 Rationale for research method
4.4 Conclusions
Page 90
Consumer Response to Sponsorship Leveraged Packaging PhD Thesis Frances Woodside
78
awareness and image development (Walliser 2003). Indeed, one such communication
technique specifically focused on in this study is that of sponsorship leveraged
packaging. In order to determine if the combined use of sponsorship and packaging
as a marketing communication tool does increase the impact on awareness and image
development, it is necessary to examine these constructs in more detail.
Despite the synergy engendered by integrating sponsorship with other promotion
tools, the primary challenge for researchers is the difficulty of separating the effects
of the sponsorship from the effects of other promotional activities (Sneath et al.
2005). Notwithstanding anecdotal evidence of sponsorship effectiveness,
practitioners and academics argue that we cannot effectively measure sponsorship‘s
ability to influence consumer response as the results are influenced by prior
perceptions of the brand, as well as by advertising and promotion spending that is not
directly related to the sponsorship program (Wakefield et al. 2007).
With these difficulties in mind, researchers have made a call for well-controlled
experimental studies to better investigate the processing of sponsorship
communication stimuli (Cornwell et al. 2005; Dudzik & Groppel-Klein 2005; Sneath
et al. 2005). Experimental designs allow for control of extraneous variables
(Cornwell 2005; Pham 1991) and are thus able to assess the true impact of
sponsorship communication tools.
The research question seeks to describe a relationship between consumer response to
SLP and the factors impacting that response. As it was reported in Chapter 3 that
consumers may be impacted by prior perceptions of the sponsoring brand and other
advertising and promotions, it would be important for this study to be able to control
extraneous variables. An experimental design allows this and also allows the
manipulation of independent variables and hypothesis testing. Therefore, with a view
to controlling for extraneous variables as much as possible, Study 2 will take an
experimental approach, to determine the relationships between consumer response
and the factors impacting that response. Having briefly highlighted what direction
this study will take, the research method is now discussed in further detail.
Page 91
Consumer Response to Sponsorship Leveraged Packaging PhD Thesis Frances Woodside
79
4.3 Study 2 Methodology
There are four main methodological issues that need addressing for this study. The
first is the experiment design, which explains the type of experiment and describes
the experiment groups and control groups (section 4.3.1). Secondly, questionnaire
design is described considering questionnaire development and operationalisation of
the variables (section 4.3.2). The third issue relates to the sampling decisions that
were made (section 4.3.3) and ethical considerations (section 4.3.4). Finally, the data
analysis strategy is explained (section 4.3.5). Each of these will now be discussed.
4.3.1 Experiment Design
Experimental research involves decision-making based on three major issues: (1) the
type of experimental design to be used (2), whether a laboratory setting or a field
setting is used and (3) the control of internal and external threats to validity. Each of
these issues will now be addressed.
In determining the experiment design, consideration needed to be given to the
hypotheses to be tested. Hypothesis 8 in particular had an influencing factor in the
type of design. To be able to test the different types of sponsorship, it was necessary
to have two experimental groups: a) sport sponsorship and b) cause sponsorship. In
addition, it was necessary to include corresponding control groups where no
sponsorship was shown on the packaging. The inclusion of the control groups
allowed the study to compare whether the sponsored product had more effect on
attitudes and purchase intentions than the corresponding non-sponsored product.
This indicated that the experiment needed to have four groups. Furthermore, to ensure
a true experiment design, test subjects needed to be randomized (Aaker et al. 2007).
To this end, the experiment took the form of a four group, after only with control
design with one experiment condition: sponsorship type. The respondents were
randomly assigned to the experiment groups represented as:
Experiment group: R x1 O1 Group 1
Control group: R O2 Group 2
Experiment group: R x2 O3 Group 3
Control group: R O4 Group 4
Page 92
Consumer Response to Sponsorship Leveraged Packaging PhD Thesis Frances Woodside
80
In order to determine the appropriate setting for the experiment, consideration was
given as to whether to conduct the experiment in a laboratory or field setting.
Advantages and disadvantages of each setting were taken into account and the cost
and method of administration in each case was calculated. It was determined that a
field setting using self-administered questionnaires (to be completed within
respondents‘ homes) would provide the most realistic and cost effective method of
obtaining the required information. This experiment design had the advantages of
ensuring external validity, generalisability and randomisation of test subjects. This
design also limited the risks of selection bias and interaction effect. Each of these
will be explained next.
External validity
This experiment design capitalises on the advantages of questionnaires and
experiments whilst minimising the disadvantages of both. In self-administered
questionnaires, there are advantages of reduced costs and administration and the
elimination of interviewer bias. However, questionnaires lack the ability to control
conditions and cannot determine causality (Aaker et al. 2007). Experiments, on the
other hand, have the ability to control conditions and can determine causality, yet
suffer from lack of generalisability and managerial application (Speed & Thompson
2000). This research design overcomes many of these problems by combining an
experimental approach with a self-administered questionnaire.
Generalisability
The use of a field setting (in this case respondent‘s homes), mimics a natural setting
as closely as possible whilst containing costs. This research design enables the
respondent to complete the questionnaire in a convenient, relaxed atmosphere, in
their own time, at their own pace, thereby reducing the likelihood of inaccurate
responses. In addition, the use of realistic and current examples of SLP (rather than
ones developed for the experiment) ensures the results are generalizable to current
market conditions and management practice.
Page 93
Consumer Response to Sponsorship Leveraged Packaging PhD Thesis Frances Woodside
81
Randomisation
This experiment design allows for the randomisation of test subjects. Randomisation
ensures that each respondent has an equal likelihood of being assigned to any of the
groups. In this way any individuals with varying characteristics are spread equally
among the groups (Aaker et al. 2007), reducing the impact of extraneous variables.
Selection bias
The experiment design incorporating the experiment treatment (groups 1 and 3)
helped to reduce selection bias. Selection bias occurs where the response to the
experiment is strictly a function of the specific [SLP] example (either sport or cause)
used. Having two groups (with SLP) will ensure that any impact on the dependent
variable is not as a result of the SLP example used. Furthermore, having
corresponding control groups will ensure that any impact on the dependent variable is
not as a result of the particular brand or product example used in the questionnaire.
Interaction effects
The design of the experiment specifies an after-only experiment, which has the
advantages of limiting history and maturation effects (common in before-after
designs). However, it should be noted that in this case, the respondents pre-existing
attitudes toward the sponsoring brand were measured (prior to exposure to SLP). In
addition, the respondent‘s attitudes toward the sponsoring brand were also measured
after exposure to SLP (in the case of the experiment groups) in the construct
Consumer Response to SLP. Both measures occurred in the one questionnaire. This
may be considered by some researchers to be a before/after measure. However, the
purpose of measuring the respondents pre-existing attitude toward the sponsoring
brand, was to create a precise measure of the Consumer Response to SLP.
Unfortunately, a before measure can sensitise respondents and introduce a bias into
the responses to the dependent variable, thereby affecting the validity of the
experiment (Aaker et al. 2007). To overcome this, particular attention was paid to
ensuring that the wording in the questions relating to the Sponsoring Brand Loyalty
Page 94
Consumer Response to Sponsorship Leveraged Packaging PhD Thesis Frances Woodside
82
construct, was sufficiently different to those of the dependent variable (i.e. Consumer
Response to SLP). In this way, the impact of answering before/after questions
relating to the same brand on similar yet different dimensions was reduced.
This section described the experiment design, in particular considering the type of
experiment and the setting for the experiment. The advantages and disadvantages of
this design and setting were explained, with some issues of validity being considered.
Further assessment of reliability and validity of the experiment is considered in
section 4.3.2 Step 6. Having determined the experiment design, it was then necessary
to develop a questionnaire, the process of which will now be discussed.
4.3.2 Questionnaire Design and Measurement Scales
The process used to design the questionnaire broadly followed that suggested by
Malhotra et al. (1996) and Churchill (1991). Initially the information needed was
specified and the type of questionnaire and method of administration were
determined. Following on from this a draft of the questionnaire was prepared based
on measurement scales previously validated and the results of Study 1. The
questionnaire was pre-tested, revised and a final draft was prepared. The
questionnaire was then administered and the details of the reliability and validity tests
are discussed in Step 6 of this section. Each of these steps is now discussed in detail.
Step 1 – Specify the information needed and from whom.
In this thesis, the main purpose for the research was determined in section 1.2 and a
number of propositions that were used to guide the exploratory research were
developed in section 2.7. The information needed to be collected from Australian
residents responsible for household shopping. The issue of target respondents and in
particular the sampling process is discussed in more detail in section 4.3.3.
Step 2 – Determine the type of questionnaire and the process of administration.
Although a number of options are available for questionnaire administration (i.e.
mail, personally administered, telephone, internet or combination), the most
Page 95
Consumer Response to Sponsorship Leveraged Packaging PhD Thesis Frances Woodside
83
appropriate one for this study was self-administered through group networks. This
data collection method was chosen as it would provide easy access to the target
market for the selected product category examples of SLP. Justification for choice of
this method is explained in more detail later in this section (Step 5). This method has
the advantages of: the ability to ask complex questions; the ability to ensure
anonymity; the ability to design a longer questionnaire and reduced requirements for
training/ supervision of interviewers. The advantages of using group networks
included: data collection speed, high response rate and cost savings.
The key disadvantages of using this method of delivery were lack of sample control
and lack of administrative control. However, though these disadvantages existed,
where possible, strategies were designed to minimize these and the disadvantages did
not outweigh the benefits of high response rate, low cost, ability to ask many and
complex questions and short data collection time.
The questionnaire length is bounded at the upper end by the amount of time the
respondent would be prepared to spend in answering the questions (Bagozzi 1994b).
Given the choice of a self-completion questionnaire and considering the type of
questions being asked and the sampling frame (section 4.3.2), the maximum length of
the questionnaire was considered to be 4 pages. The questionnaire took most
respondents in the pilot test around 10 minutes to complete. The type of questionnaire
and its maximum length set the parameters for the remaining design issues.
Step 3 – Draft the questionnaire
Once the type and length of the questionnaire, its objectives and the respondents who
are to complete it, have been determined a first draft can be completed. At this stage,
three issues needed to be considered. These were:
the choice of product examples used in the questionnaires
the development and identification of appropriate measures and
the general principles of questionnaire design considering: question content;
wording; structure; and response format.
Page 96
Consumer Response to Sponsorship Leveraged Packaging PhD Thesis Frances Woodside
84
In determining the product examples to be used for the questionnaires, consideration
was given to the various product categories in FMCG that use SLP. SLP is
commonly used in such categories as sports drink, snack bars, personal care products
and breakfast cereal products. During the exploratory stage of research, a number of
different product categories were used to determine the most often purchased product
categories that use SLP. Furthermore, consideration was also given to each product
category and the extent of promotion used in general in those categories. The
information provided in the exploratory research relating to category involvement and
use of packaging in purchase decisions was particularly useful for this purpose.
One product category that particularly stood out in the exploratory research was
breakfast cereals. All of the respondents regularly purchased breakfast cereals,
however this was not the case with other product categories. It has been reported that
81 per cent of Australian adults (Woods & Walker 2007) and 91 per cent of
Australian children (MJA 2000) regularly eat breakfast cereals, with the majority or
breakfast cereal promotion targeted at children (Chapman et al. 2006). The breakfast
cereal market in Australia is quite substantial with approximately $894.5 million
spent in 2004 on breakfasts cereals (Woods & Walker 2007). Given the large
contribution the breakfast cereal market makes to the Australian FMCG industry,
investigation of the impact of SLP on consumer behaviour is warranted. Based on
these considerations, it was decided that the breakfast cereal category would provide
suitable product examples to be used in the questionnaires.
In order to apply the experiment conditions, four questionnaire instruments were
developed, each one including a different representation of a FMCG package, this
allowed testing of the different experiment conditions. The experiment versions with
sponsorship are identified as ‗SLP‘ versions and the control versions without the
sponsorship are identified as ‗NOSLP‘ versions. The versions were as follows:
1 – brand A with sponsorship (sport)
2 – brand A without sponsorship (control)
3 – brand B with sponsorship (cause)
4 – brand B without sponsorship (control)
Page 97
Consumer Response to Sponsorship Leveraged Packaging PhD Thesis Frances Woodside
85
Each version contained questions that were similar in content adapted to suit the
experiment condition. Five-point Likert scales with all points labeled were used for
the collection of most of the data. Likert scales were used for a number of reasons.
Likert type scales are most popular for gathering attitudinal type responses (Cox
1980) and also promote satisfactory properties in relation to the underlying
distribution of responses (Bagozzi 1994b). In cases where it is possible for the
respondent to adopt a neutral position as is in this thesis, an odd rather than an even
number of scale points is preferred (Cox 1990). Furthermore, while there is no single
number of response categories that is appropriate under all circumstances, fewer than
five does not discriminate enough and more than nine is too many for respondents to
distinguish between (Cox 1990). Given the context of this study i.e. FMCG where
little thought is put into purchase decisions, having too many points may cause the
respondents to put more thought into the answering of the questions than usual in a
natural setting. Based on these considerations it was decided to use a five-point scale.
There is considerable controversy over the using of ordinal scaling and whether they
constitute continuous scales (Davis 2000). There are proponents that take the view
that there are complex scales and indices of an ordinal nature that are useful in certain
situations that allow the use of more powerful parametric statistical techniques.
However opponents suggest that the scales do not provide absolute information
regarding the intervals between the points on the scale (Davis 2000). If the
researcher assumes interval scale measurement (i.e. that the intervals between the
numbers are equal), then more powerful statistical techniques can be used to analyse
the data. For the purposes of this study, the procedure will be to treat the ordinal
measurements as though they were interval, but to be on the alert to the possibility of
inequality of measurement (Davis 2000).
The following section details the questionnaire operationalisation of Versions 1 and 3
of the questionnaire. Versions 1 and 3 differed in minor detail (different cereal
varieties and sponsored properties). Each difference is highlighted in the sections
that follow. Following on from the operationalisation of Versions 1 and 3 (SLP), will
Page 98
Consumer Response to Sponsorship Leveraged Packaging PhD Thesis Frances Woodside
86
be operationalisation of Versions 2 and 4 (NOSLP). Table 4.1 shows the
corresponding question numbers for each version.
Operationalisation of Versions 1 and 3 (SLP) of Questionnaire
Versions 1 and 3 (SLP) of the questionnaires used in the study were divided into four
sections over four pages and included 61 questions (full copy Versions 1 and 3
provided in Appendix 2). Each section of the questionnaire will be discussed in
terms of the measurement items incorporated and a summary of each of these, with
their original sources, is provided in table 4.1.
The survey instrument comprised 61 items relating to the following areas:
1. shopping profile
2. sport/ charity involvement
3. category involvement
4. demographic information
5. prior purchase and loyalty to sponsor brand
6. sponsored property identification
7. attitude toward sponsorship leveraged packaging
8. attitude toward the sponsor
9. purchase intention toward the sponsor‘s products.
The first section of the SLP questionnaires was designed to profile the general
shopping behaviour of the respondent. It opened with a number of questions relating
to grocery shopping preference, including frequency and location of grocery
shopping, enjoyment of grocery shopping, and tendency to try new products. The
section also asked questions relating to breakfast cereal category involvement, and
frequency of purchase of the selected brand. These questions were sourced from
Ailawadi et al. (2001); Campo et al. (2000) and Sen et al. (2001).
Six items measured the respondents‘ prior brand attitude and loyalty and respondents
were asked to rate their level of agreement with the statements on 5-point Likert
scales (a rating of ‗1‘ denoted strong agreement and a rating of ‗5‘ denoted strong
disagreement). These statements were sourced from Sen et al. (2001); Dahl et al.
(2001) and Ahluwalia et al. (2000). Table 4.1 shows the items used and their sources.
Page 99
Consumer Response to Sponsorship Leveraged Packaging PhD Thesis Frances Woodside
87
The second section of the SLP questionnaires was concerned with the collection of
demographic information such as age, gender, family status, occupation, income and
nationality. This demographic information will be used to validate the sample‘s
representativeness and will be incorporated into the examination of sponsored
property identification, sponsor brand loyalty and consumer response to SLP to
determine any interrelationships among these variables. Also in this section were
questions relating to involvement with the type of cause in general (either sport or
cause). These statements were sourced from Fullerton and Johnson (2008). These
variables were included on an exploratory basis for future research purposes.
The third section of the SLP questionnaires commenced with an open response
question ―What is your opinion of sponsorship in general?‖ The section also
contained questions relating to attitude towards sponsorship in general. Respondents
were asked to rate their level of agreement with three statements on 5-point Likert
scales (a rating of ‗1‘ denoted strong agreement and a rating of ‗5‘ denoted strong
disagreement). These statements were sourced from Fullerton and Johnson (2008).
These variables were included on an exploratory basis for future research purposes.
Respondents were then asked questions relating to their involvement of the specific
property from the selected brand (either National Breast Cancer Foundation, or
Cricket Australia, depending on version of questionnaire). The questions
corresponded with the construct ‗Sponsored Property Identification‘ and respondents
were required to rate their level of agreement on 5-point Likert scales (a rating of ‗1‘
denoted strong agreement and a rating of ‗5‘ denoted strong disagreement). These
statements were sourced from Speed and Thompson (2000); Grohs et al. (2004) and
Gwinner and Swanson (2003) (see Table 4.1 for details these items).
Page 100
Consumer Response to Sponsorship Leveraged Packaging PhD Thesis Frances Woodside
88
Table 4.1 – Operationalisation of Variables
Variable Question Scale Author Q.SLP* Q.NOSLP#
Shopping
Profile
How often do you shop for groceries?
At which retailer do you do most of your grocery shopping?
Do you enjoy grocery shopping?
Attitude statements
I like to finish my grocery shopping quickly
I generally like to try different grocery products
I often switch brands to try something different
I am interested in cereal products in general
I get involved with what cereal my family uses
I often switch between brands of cereal
6 point scale
Categorical
4 point scale
Yes/No/sometimes
5 point Likert scales
1 = strongly agree
5 = strongly disagree
Ailawadi et
al. (2001);
Campo et al.
(2000)
Sen et al.
(2001).
1-5 1-5
Interest in
sports
(Weetbix/CA
Versions)
Attitude statements
I participate regularly in organized sport
I exercise regularly to stay fit
I like to watch or listen to sports on TV or radio
I look at sports websites
I read the sports pages in newspapers
I enjoy conversations about sports
5 point scale
Adapted
from
Johnson &
Summers
18 24
Interest in
cause
(Light ‘n’
Tasty/ NBCF
versions)
Attitude statements
I volunteer my spare time for charity work
I donate regularly to worthy causes
I am interested in charity events
I look at charity or cause websites
I buy products which support worthy causes
5 point scale
Developed
for this
study
18 24
Frequency
of purchase
How often do you purchase Sanitarium (Weetbix/Light ‗n‘ Tasty)?
1 = weekly 2 = fortnightly 3 = monthly 4 = occasionally 5 = never
5 point scale
Adapted
Pope &
Voges 2000
9 9
Sponsored
Property
Identification
I am a strong supporter of Cricket Australia (Breast Cancer Foundation)
I am interested in Cricket Australia (Breast Cancer Foundation)
If a company sponsored Cricket Australia (Breast Cancer Foundation), it
would positively influence how I felt about that company.
Its good that companies sponsor Cricket Australia(Breast Cancer Found)
I am more likely to purchase products of companies that sponsor Cricket
Australia (Breast Cancer Foundation)
5 point Likert scale
1 = strongly agree
5 = strongly disagree
Speed &
Thompson
2000
21 27
Page 101
Consumer Response to Sponsorship Leveraged Packaging PhD Thesis Frances Woodside
89
Variable Question Scale Author Q.SLP* Q.NOSLP#
Sponsoring
Brand
Loyalty
I like this brand
This brand is reliable
I would recommend this brand to others
I have a favourable opinion of this brand
I am loyal to this brand
I would buy this brand even if competitors prices were lower
5 point Likert scale
1 = strongly agree
5 = strongly disagree
Sen et al.
(2001); Dahl
et al. (2001)
Ahluwalia et
al. (2000).
10 16
Attitude
toward the
Sponsor
This sponsorship makes me feel more favourable toward the sponsor.
This sponsorship would improve my perception of the sponsor.
This sponsorship would make me like the sponsor more.
5 point Likert scale
1 = strongly agree
5 = strongly disagree
Speed &
Thompson
2000
29
Attitude
toward
sponsor
When a sponsorship supports a cause or a sport that I think is worthy, it
makes me think more highly of the grocery brand
5 point Likert scale
1 = strongly agree
5 = strongly disagree
Speed &
Thompson
2000
29
Purchase
intention
Would you try this product because of the sponsorship?
This sponsorship would not influence my purchase decision in any way
I would buy more of this Weetbix (Light ‗n‘ Tasty) product with the
sponsorship than non-sponsored Weetbix (Light ‗n‘ Tasty)
I would buy this product even if competitors prices were lower
Yes/No
5 point Likert scales
1 = strongly agree
5 = strongly disagree
Gwinner &
Swanson
2003
Cornwell &
Coote 2005
26
29
Purchase
intention
If I didn‘t normally purchased the sponsor‘s product, sponsorship
packaging would encourage me to try the product
If I normally purchased the sponsor‘s product, I would buy more than
usual because of the sponsored packaging.
I would purchase the sponsored product even if comp. prices were lower
5 point Likert scales
1 = strongly agree
5 = strongly disagree
Gwinner &
Swanson
2003
Cornwell &
Coote 2005
30
Perceived Fit Its logical for Weetbix (Light ‗n‘ Tasty) to sponsor Cricket Australia
(Breast Cancer Foundation)
Weetbix (Light ‗n‘ Tasty) and Cricket Australia (Breast Cancer
Foundation) have a similar image
5 point Likert scales
1 = strongly agree
5 = strongly disagree
Speed &
Thompson
2000 Grohs
et al. 2004
30 29
Awareness Were you aware of this sponsorship before today? Yes/No This study 23 10
Respondent
Profile
Please indicate your gender.
Please indicate your age.
Please indicate your household status.
Do you have children living at home?
What is your Country of Birth?
What is your occupation?
Categorical values:
Female/male
5 age categories
5 income categories
Open questions
This study 11-17 17-20
* Questions Numbers for Versions 1 and 3 (SLP) # Question Numbers for Versions 2 and 4 (NOSLP)
Page 102
Consumer Response to Sponsorship Leveraged Packaging PhD Thesis Frances Woodside
90
Finally, in the next section sponsorship [leveraged] packaging was explained using the
words ―Sponsorship packaging is where the logo or pictures of a sponsored group are
pictured on the sponsoring grocery brands packaging (e.g. Coca-Cola & Olympics)‖.
Respondents were asked to list any grocery brands that they could remember that use
sponsorship packaging (including the grocery brand and the sponsored organisation):
this question had an open response format.
Section 4 of the SLP version, commenced with a pictorial representation of the
selected product packaging (Version 1 Sanitarium Weetbix, Version 3 Sanitarium
Light ‗n‘ Tasty) accompanied by the instruction ―for this section, think about
[Sanitarium Weetbix/ or Sanitarium Light „n‟ Tasty - representing the sponsoring
brand] and the sponsorship of [Cricket Australia or National Breast Cancer
Foundation representing the sponsored property]‖. Respondents were asked if they
were aware of the sponsorship before today (1 = yes, 2 = no). Respondents who
answered yes were asked to indicate where they had seen the sponsorship before.
Following on from this, respondents were asked if they had purchased the product
before and if not, would they try the product because of the sponsorship: this question
had a dichotomous response format (1 = yes, 2 = no). An open response item then
asked respondents what else would influence them to try the product. Respondents
were asked to indicate the likelihood of purchasing the sponsored product on a 5-point
scale (1 = very likely and 5 = not at all) (see table 4.1 for details these items).
Respondents were then asked to review a number of statements in three separate
sections that dealt with: buying the sponsored product; the sponsorship arrangement
(including perceived fit); and attitude toward the sponsor. For these ten items,
respondents were required to rate their level of agreement or disagreement with the
statements using 5-point Likert scales (a rating of ‗1‘ denoted strong agreement and a
rating of ‗5‘ denoted strong disagreement) (see table 4.1 for details these items). These
statements were sourced from Cornwell and Coote (2005); Gwinner and Swanson
(2003); and Speed and Thompson (2000) (see table 4.1 for details).
Page 103
Consumer Response to Sponsorship Leveraged Packaging PhD Thesis Frances Woodside
91
Operationisation of Versions 2 and 4 (NOSLP) of Questionnaire
Versions 2 and 4 (NOSLP) of the questionnaires used in the study were divided into
five sections over four pages and included 57 questions (a copy Versions 2 and 4 is
provided in Appendix 2). The measurement items for each section of the
questionnaire will be discussed and a summary of each of these, with their original
sources, is provided in table 4.1.
The first section of the NOSLP questionnaires was designed to profile the general
shopping behaviour of the respondent. Questions in this section relating to shopping
behaviour and breakfast cereal category involvement replicated those in the SLP
questionnaires. Table 4.1 shows the items used and their sources. Brand attitude and
loyalty questions were included in section 2 of the NOSLP versions to enhance the
flow of the questionnaire.
The second section of the NOSLP versions showed the pictorial representation of the
selected product (same product as SLP versions) but without the corresponding
sponsored property logos, symbols or pictures. The picture was accompanied by the
instruction ―for this section, think about [Sanitarium Weetbix/ or Sanitarium Light „n‟
Tasty]”. Respondents were then asked if they were aware of the product before today
with a dichotomous response format (1 = yes, 2 = no). Respondents who answered
yes were then asked where they had seen the product before.
Following on from this, respondents were asked if they had purchased the product
before and if not would they try the product, this question had a dichotomous response
format (1 = yes, 2 = no). An open response item then asked respondents what would
influence them to try the product. Respondents were asked to indicate the likelihood
of purchasing the product on a 5-point scale (a rating of ‗1‘ denoted very likely and a
rating of ‗5‘ denoted not at all) (see table 4.1 for details these items).
Following on from the likelihood of purchase questions, six items measured the
respondents‘ brand attitude and loyalty. These questions replicated those asked in
Page 104
Consumer Response to Sponsorship Leveraged Packaging PhD Thesis Frances Woodside
92
Section 1 of the SLP versions where respondents were asked to rate their level of
agreement with the statements on 5-point Likert scales (a rating of ‗1‘ denoted strong
agreement and a rating of ‗5‘ denoted strong disagreement).
The third section of the NOSLP questionnaires was concerned with the collection of
demographic information such as age, gender, family status, occupation, income and
nationality. This demographic information will be used to validate the sample‘s
representativeness. Also in this section were questions relating to involvement with
the corresponding SLP property (either sport or cause) (see table 4.1 for details of
these items). These questions replicated those in the SLP questionnaire and were
asked in order to test differences between the SLP/NOSLP groups.
The fourth section of the NOSLP questionnaires commenced with an open response
question ―What is your opinion of sponsorship in general?‖ The section also
contained questions relating to attitude towards sponsorship in general. Respondents
were asked to rate their level of agreement with three statements on 5-point Likert
scales (a rating of ‗1‘ denoted strong agreement and a rating of ‗5‘ denoted strong
disagreement). These statements were sourced from (Johnson & Summers 2005).
Respondents were then asked questions relating to their involvement of the
corresponding SLP property from the selected brand (either National Breast Cancer
Foundation, or Cricket Australia). The questions corresponded with the construct
‗Sponsored Property Identification‘ and replicates those asked in the SLP
questionnaire (see table 4.1 for details). These questions were asked in order to test
differences between the SLP/NOSLP groups.
The fifth section of the NOSLP questionnaires commenced with an explanation of
sponsorship [leveraged] packaging with the wording ―Sponsorship packaging is where
the logo or pictures of a sponsored group are pictured on the sponsoring grocery
brands packaging (e.g. Coca-Cola & Olympics)‖. Respondents were asked to list any
grocery brands that they could remember that use sponsorship packaging (including
Page 105
Consumer Response to Sponsorship Leveraged Packaging PhD Thesis Frances Woodside
93
the grocery brand and the sponsored organisation): this question had an open
response format.
Respondents were then asked to review a number of statements in two sections that
dealt with: brands that use SLP and buying products that use SLP. For these seven
items, respondents were required to rate their level of agreement or disagreement with
the statements using 5-point Likert scales (a rating of ‗1‘ denoted strong agreement
and a rating of ‗5‘ denoted strong disagreement) (see table 4.1 for details these items).
It is important to note that these questions differed from those in the SLP
questionnaires in that respondents were not exposed to the SLP and the questions
relating to ‗brands that use SLP‘ and ‗buying products that use SLP‘ were questions
surrounding the SLP concept but not applied to any particular product. These
statements were adapted from the corresponding statements in the SLP questionnaire.
These questions were asked in order to test differences between the groups.
Step 4 – Prepare questionnaire pretest, revise and final draft.
The purpose of pre-testing the questionnaire was to identify problems with the
questionnaire and to ensure the questions would accomplish what was expected of
them (Burns & Bush 2003). The questionnaire was pre-tested on a sub-sample of the
population of interest (Alreck & Settle 1985; Churchill 1991) and colleagues familiar
with the background to the study (Dillman 1978). The questionnaire for Study 2 was
pre-tested with a convenience sample (staff and students of the University of Southern
Queensland) that also met the population characteristics. That is, household shoppers
over the age of 18 years. A total of 75 respondents participated in the pre-test using
the same methodology as intended for Study 2. That is, respondents were randomly
assigned to experiment groups and respondents were given the questionnaire, its
purpose was explained and respondents were then asked to complete it. The
questionnaire took between 10 minutes and 12 minutes for the respondents to
complete. On completion a debriefing occurred to address any problems with wording,
layout or sequencing of the questionnaire. As a result of this pre-test some minor
changes were made to question wording, and layout.
Page 106
Consumer Response to Sponsorship Leveraged Packaging PhD Thesis Frances Woodside
94
Step 5 – Questionnaire administration
The main issue to be considered was the selection of community groups through
which the questionnaire was to be administered. It has been reported that 81 per cent
of Australian adults (Woods & Walker 2007) and 91 per cent of Australian children
(MJA 2000) regularly eat breakfast cereals. With this in mind, a judgment was made
by the researcher that this target market could be accessed through schools. Therefore,
it was decided that local schools would be approached to assist in the administration of
the questionnaire. Questionnaires were administered to each family represented at the
schools with an instruction to return the completed questionnaire back to the school
within one week. An incentive to complete the questionnaire was offered ($3 for each
completed survey was donated to the School Parents and Friends Association).
Step 6 – Assessment of reliability and validity of the instrument.
It is important that any measurement instrument used in research is accurate and
consistently measures what it is supposed to measure. It should therefore be valid and
reliable. A measurement scale is considered to be valid when it measures what it is
intended to measure and reliable if the score from the measurement scale is consistent
and stable (Davis & Consenza 1988; Churchill 1992). Table 4.2 summarises the
common measures of validity and strategies used to assess them.
Table 4.2 – Validity and Reliability
Definition Assessment strategies
Validity A measure is valid when the differences
in observed scores reflect true differences
on the characteristic (Churchill 1979) or it
measures what it is supposed to measure
(Bollen 1989)
structured approach taken in scale
development
use of existing and pre-tested
measurement scales
factor analysis
Content (face)
Validity
The degree to which the scale items
represent the domain of the concept under
study (Davis & Consenza 1988).
Literature review
Pre-testing of questionnaire
Structural equation modeling
Construct
Validity
The degree to which a construct achieves
empirical and theoretical meaning
(Steenkamp & van Trijp 1991)
If all the proposed measures correlate
highly with one another it can be
concluded that they measure the same
thing (Nunnally & Bernstein 1994).
Literature review
Factor analysis
Revising and retesting empirically
the results over time
Page 107
Consumer Response to Sponsorship Leveraged Packaging PhD Thesis Frances Woodside
95
Definition Assessment strategies
Convergent
Validity
The degree of association between two
different measurement scales which are
supposed to measure the same concept
(Davis & Consenza 1988).
Evidence based on correlations
among factors.
Discriminant
Validity
The degree to which the measurement
scale is different form other scales
designed to measure different concepts
(Davis & Consenza 1988)
Evidence based on correlations
among factors.
Criterion
Validity
The degree of correspondence between a
measure and a criterion variable, usually
measured by their correlation (Bollen
1989)
SEM and regression
Reliability A measure is reliable to the extent that
independent but comparable measures of
the same trait or construct agree
(Churchill 1979).
Pre-testing of the questionnaire
Write items clearly
Easily understood instructions
Ensure prescribed conditions for
administration
Approach to scale development
(Churchill 1979)
Reliability analysis
(Source: developed for this program of research)
A number of steps were incorporated into the research design to assist in the
establishment of validity and reliability of the measurement scales used. These
included a thorough literature review, exploratory research, the use of an established
process to develop and adapt measures, following standard principles for questionnaire
design, pre-testing the questionnaire and planned data collection procedures. Strategies
undertaken in this research to ensure validity are included below.
External Validity. Using this method of experiment helped to control for other
confounding variables such as point-of-purchase advertising and displays, sales
promotions, and broadcast and event advertising that are found in ‗real life‘ marketing
environment and had the ability to impact Consumer Response to SLP. This method
allows the researcher to isolate relationships that existed as a result of the
communication vehicle (SLP) in isolation of other factors. Although helpful to ensure
control, future replications of this research may be able to examine the combined
effects of other promotional activities of sponsorship arrangements as a whole, thus
providing greater external validity.
Page 108
Consumer Response to Sponsorship Leveraged Packaging PhD Thesis Frances Woodside
96
Construct validity can be ensured by the triangulation of preliminary research methods
to define and examine the construct of SLP. The literature review, together with input
obtained from consumers in exploratory research allowed for as much completeness of
understanding of the phenomenon as possible. The information gained in the
exploratory stages of the research guided the questionnaire development for the
experimental stage, thus ensuring construct validity for the research as a whole.
Content (face) validity. The information obtained from the exploratory stage, coupled
with the information gained from the literature review guided the measurement scale
development, thus ensuring that scales are representative of the concepts. Further the
pre-testing of the questionnaire by marketing academics and marketing research
experts assists in providing content validity.
Convergent validity can be determined by examining the correlations between the
items for each scale. Convergent validity reflects the extent to which attitude measures
adequately represent a characteristic or variable if it correlates or ‗converges‘ with
other measures of that variable. Correlations between items in each scale are examined
in each scale in sections 5.5.1 – 5.5.4. Unfortunately, an attitude measure may also
converge with measures of other variables in addition to the one of interest. Thus it is
also necessary to establish discriminant validity.
Discriminant validity can be ascertained through exploratory factor analysis and
confirmatory factor analysis (Anderson and Gerbing 1988). Discriminant validity
reflects the extent to which the constructs in a model are different from each other.
Assessing discriminant validity is especially important where constructs are
interrelated. Large correlations between latent constructs (greater than 0.80 or 0.90)
suggest lack of discriminant validity. Each scale is assessed for discriminant validity
with the results of these tests being reported in sections 5.5.1 – 5.5.4.
Page 109
Consumer Response to Sponsorship Leveraged Packaging PhD Thesis Frances Woodside
97
Nomological validity and criterion-related validity can be validated by updating the
literature review throughout the course of the research. In addition, the use of
structural equation modeling and regression analysis ensured the scales demonstrated
the relationships that were revealed in the literature review (Hair et al. 2006).
Having designed the data collection instrument and considered its administration, the
next issue of research design is sampling strategy.
4.3.3 Sampling
The process of sampling involves using a small number of the population to make
conclusions about the whole populations (Zikmund 2003). The sampling methodology
employed here was used to provide the most efficient, cost effective and timely access
to a sample of the population of interest. The population for this study can be defined
as ‗All grocery shoppers in Australia‟.
The sampling frame that was determined to allow the most efficient, cost effective
access to a sample of the population of interest was to contact schools in one city in
Queensland, Australia. With the majority of Australian children regularly eating
breakfast cereals, and the majority of breakfast cereal promotion being targeted at
children (Chapman et al. 2006), a judgment was made that school networks would
provide access to a considerable number of families (and thus household shoppers). It
was expected that mothers, fathers and careers of school age children would fall into
the population for the study defined as ―All grocery shoppers in Australia‘.
Representativeness of the sample is discussed further in section 5.3.
The sample size of 200 was required for this study in order to conduct structural
equation modeling. Researchers also suggest that between four and ten times the
number of variables to be analysed (Hair et al. 1992; Sekaran 2000) is usually
appropriate. Therefore, the sample size determined appropriate for this research was
at least 200. The ethical issues raised in this sampling method were also considered
and these are discussed in detail in the following section.
Page 110
Consumer Response to Sponsorship Leveraged Packaging PhD Thesis Frances Woodside
98
4.3.4 Ethical Considerations
Consideration was given to the ethical issues inherent in this research at each stage of
the process. The guidelines from the Marketing Research Society of Australia‘s
(1995) Code of Professional Behaviour were used as a checklist at each stage of the
research process. Notably these guidelines expressed the importance of
responsibilities to respondents, responsibilities to the administrators and
responsibilities of the researcher. These will now be discussed.
Respondents to the research have the right to anonymity, the right not to be harmed,
the right to check without difficulty the bona fides and identity of researchers and the
right to voluntary co-operation (Market Research Society of Australia 1995). Other
research authors also confirm respondent‘s rights to privacy, confidentiality and
having sufficient information about the procedures of the study (Bagozzi 1994).
Respondents were not given the opportunity to divulge their names on the
questionnaire, hence assuring anonymity. Care was taken in the questionnaire design
to avoid questions that may be psychologically harmful or stressful to respondents.
Participants were given a brief outline at the beginning of the questionnaire including
contact details of the researcher and the university‘s ethical clearance number. This
gave respondents the opportunity to find more information or to have a formal means
of redress if they felt threatened, harmed or unhappy with the process. The
participants were also informed that they had the option to withdraw from completing
the survey at any time. Respondents were given the opportunity to provide informed
consent to participate in the study at the commencement of the questionnaire.
Finally, the researcher ensured that care was taken to remain professional in all
undertakings with respondents and that the research was designed to be as cost
effective and efficient as possible. This meant ensuring that the objectives for the
research were strictly adhered to. In summary, considerable care and attention was
given to the ethical issues at all stages of the research design and administration.
Page 111
Consumer Response to Sponsorship Leveraged Packaging PhD Thesis Frances Woodside
99
4.3.5 Data Analysis Strategies
A suitable data analysis strategy was selected based on the characteristics of the data
and suitability of the statistical techniques (Malhotra et al. 1996). In this study, the
research had three main purposes. These were: (1) to develop a valid and reliable
measurement model for the construct of Factors Impacting Consumer Response to
SLP; (2) to validate the scales for Sponsored Property Identification, Sponsoring
Brand Loyalty, and Perceived Fit; and (3) to test the relationships of Sponsored
Property Identification, Sponsoring Brand Loyalty, and Perceived Fit in the model of
factors impacting Consumer Response to SLP.
Hence, any model depicting these proposed relationships can be considered
multivariate in nature and would contain both a measurement component – are the
constructs Consumer Response to SLP, Sponsored Property Identification, Sponsor
Brand Loyalty, and Perceived Fit, accurately measured: and a structural component –
how do Sponsored Property Identification, Sponsor Brand Loyalty, Perceived Fit
Impact Consumer Response to SLP.
Summary statistics for each of the variables in the model will be reported first. The
means and standard deviations for the variables will be discussed and any irregularities
explained. In addition, tests of differences will be conducted to determine differences
in responses between the NOSLP (control groups) and the SLP groups (experiment).
Having determined what differences (if any) exist between the experiment and control
groups, the rest of the study will then focus on the experiment groups only. It is
important to note that given that the purpose of this research is to determine the factors
that impact Consumer Response to SLP, the data analysis procedures will from this
point on, focus on the SLP group only with a view to determining any structural
relationships amongst the variables in the model.
In this study, due to the exploratory nature of the scale development process, the
measurement model will first be determined using exploratory factor analysis. The
resulting factor structure will then be confirmed using confirmatory factor analysis in a
Page 112
Consumer Response to Sponsorship Leveraged Packaging PhD Thesis Frances Woodside
100
popular structural equation-modeling package (AMOS 16) (Arbuckle & Wothke,
2007). This ordered progression from exploratory factor analysis to confirmatory
factor analysis in developing a measurement model has been supported by a number of
researchers (Gerbing & Hamilton 1996; Ambler, Styles & Xiucum 1999). Data
treated in this manner using both exploratory and confirmatory factor analysis;
generally result in models with good fit statistics (Mueller 1997). The structural
portion of this analysis will utilise structural equation modeling to determine if
Sponsored Property Identification, Sponsor Brand Loyalty, and Perceived Fit impact
Consumer Response to SLP. This technique will now be explained.
Structural Equation Modeling. Structural equation modeling (SEM) is an advanced
multivariate technique, which extends several other multivariate techniques i.e. factor
analysis and regression (Diamantopoulos 1994). SEM is a family of statistical models
that seek to explain the structural relationships among multiple measures or factors
(Hair et al. 2006). This program of research aims to test a model that examines the
structural relationships between Consumer Response to SLP and the factors that
impact that response. SEM provides an estimation of multiple and interrelated
dependence relationships and has the ability to represent unobserved concepts in these
relationships and correct for measurement error in the estimation process; and it
defines a model to explain the entire set of relationships (Hair et al. 2006). The
statistical package used for the structural equation modeling in this research was
AMOS 16 (Arbuckle & Wothke, 2007). This package was chosen because of its ease
of use, advanced graphics capability and the convenience of directly importing data
from SPSS (Arbuckle 1999).
The three major underlying assumptions of structural equation modeling are: the
sample size should be large enough; the data should be multivariate normal and the
discrepancy function chosen should be appropriate (Bentler & Dudgeon 1996). This
study was expected to return a sample size that was sufficient for structural equation
modeling, given the sampling methodology.
Page 113
Consumer Response to Sponsorship Leveraged Packaging PhD Thesis Frances Woodside
101
The data were collected on five-pint Likert scales suitable for use in structural
equation modeling and the maximum likelihood discrepancy function (ML) was
considered to be appropriate for the nature of the data collection owing to its
robustness against possible violations of assumptions of multivariate normality
(Anderson & Gerbin 1988; Diamantopoulos 1994). Further, the ML based fit indices
are known to outperform others in evaluating model fit (Hu & Bentler 1999).
Estimating Model Fit. Structural equation modeling (SEM) has become a widely
used tool in many scientific disciplines and is particularly relevant when investigating
the plausibility of theoretical models explaining the interpretations among a set of
variables (Hu & Bentler 1999). SEM begins with the specification of a model to be
estimated and thus its primary goal becomes assessment of goodness of fit and the
estimation of parameters of the hypothesised model (Hu & Bentler 1999). The most
popular ways to evaluate model fit involve the Chi square (2)
goodness-of-fit statistic
and various other fit indices that have been developed to overcome the weakness in
Chi square (2) with very small and very large samples.
The Chi square (2) goodness-of-fit statistic assesses the magnitude of discrepancy
between the sample and the fitted covariance matrices and is the product of the sample
size minus one and the minimum fitting function (Hu & Bentler 1999). Thus, the Chi
square (2) measure tests the null hypothesis that the estimated variance-covariance
matrix deviates from the sample variance-covariance matrix only due to sampling
error. Hence, a non-significant Chi square (2) is an indication of good fit.
The issue of fit assessment in structural equation modeling has been the subject of
both theoretical and empirical papers for several decades (Tanaka 1993; Hu & Bentler
1999) resulting in multiple perspectives on fit of observed data to structural equation
models and a large number of fit indices available. As it has been common practice to
use at least the Chi square (2) goodness-of-fit statistic and the RMSEA index, these
two measures of fit will be used in this study. In addition, a number of other measures
Page 114
Consumer Response to Sponsorship Leveraged Packaging PhD Thesis Frances Woodside
102
have been proposed to aid in determination of whether the data support a hypothesized
model in SEM.
The Chi square per degrees of freedom (CMIN/DF) will also be reported as this
statistic takes into account the relative size of the model as it divides the Chi-square
value by the degrees of freedom. These measures will be supplemented by the SRMR
(Standardised Root Mean Square Residual) (Steiger & Lind 1980) and TLI (Tucker-
Lewis Index) (Tucker and Lewis 1973).
The cut-off criteria that will be used for each measure will be as follows:
2
goodness-of-fit statistic – a non-significant p value (Hu & Bentler 1999)
CMIN/DF should be in the range from 2 to 5 (Arbuckle 1999)
SRMR < 0.08 (Hu & Bentler 1999)
TLI > 0.95 (Hu & Bentler 1999)
RMSEA < 0.06 (Browne & Cudeck 1993; Hu & Bentler 1999)
Item Parceling in Structural Equation Modeling
One approach to the treatment of ordinal data sets is the parceling of items. Parcels
were constructed from summing and averaging a number of item responses.
Regression coefficients and measurement error variances were calculated using
Munck (1979) formulae based on the standard deviations and Cronbach alpha for each
scale. These parceled items were used as indicator variables of constructs of interest in
SEM. In addition to generating less coarse measurements, item parceling also reduces
the degree of non-normality in the data and hence the data are more likely to meet the
underlying assumptions of SEM. A further advantage is that the parameter estimates
obtained from the analyses when item parceling is used are more stable and therefore
the results have greater generalizability. Item parceling increases the ratio of
parameters estimated to sample size, an appropriate technique when sample sizes are
small (Bandalos 2002; Little et al. 2002). Therefore, in the interests of increasing the
stability of the data and reducing the degree of non-normality of the data, item
parceling will be used in the final measurement model SEM.
Page 115
Consumer Response to Sponsorship Leveraged Packaging PhD Thesis Frances Woodside
103
Other Statistical Techniques. As the hypotheses suggest, an area to be examined in
this study is the impact of a number of moderating variables including: awareness of
the sponsorship; frequency of purchase; type of sponsored property; and respondent
characteristics. Initially, the sample will be divided into the various groups (i.e.
aware/ not aware; frequent/ not frequent; sport/ cause sponsorship; demographic
groups e.g. gender). If the group sizes are large enough, multi-group analyses will be
conducted using the AMOS software. Multi-group modeling techniques in structural
equation modeling allow for factor analysis to be conducted on data from several
populations simultaneously and tests whether the same model holds for each of the
populations. Alternatively, should the group sizes not be large enough, regression
using SPSS will be conducted as there are no assumptions about the sample size or
distribution of the predictor variable (either continuous, discrete or dichotomous).
4.4 Conclusion
This chapter provided an overview of the methodology used for Study 2 in this
program of research. The chapter commenced with a rationale for using an
experiment methodology and mapped the development of the experiment design.
Following on from this, questionnaire development was discussed. The questionnaire
instrument used a combination of existing and newly developed measurement scales to
collect the data required to answer the research problem. Thorough pre-testing and
subsequent revision of the questionnaire was carried out to ensure it was as reliable as
possible. The process followed in the research design also aided in establishing the
validity and reliability of the instrument used.
The target population for the research was defined as household shoppers residing in
Australia over the age of 18 years. The sampling frame used was schools in
Toowoomba, Queensland. A non-probability judgment sampling method was used to
collect the required responses. The major data analysis technique to be used i.e.
structural equation modeling using AMOS was described. Ethical issues concerning
respondents were considered at each stage of the process and research design. The
next chapter outlines the results of the data analysis for Study 2.
Page 116
Consumer Response to Sponsorship Leveraged Packaging PhD Thesis Frances Woodside
104
Chapter 5 – Study 2 Results
5.1 Introduction
The previous chapter justified the methodology used for Study 2. This chapter will
commence with a revision of the conceptual model and hypotheses that were put
forward at the conclusion of Chapter 3. Following on from the review of the research
model and hypotheses, the chapter will then profile and provide an analysis of the
respondents of Study 2. The next section will report the preliminary analysis
undertaken to ensure the data were suitable for structural equation modeling and also
establishes the descriptive elements of the data and provides a detailed description of
the dependent variable in the study. The measurement component of the conceptual
research model is tested with measurement scales for the four constructs being
validated. The structural component of the conceptual model is then tested along with
the hypotheses that underpin the model. Figure 5.1 below provides an outline of
Chapter 5.
Page 117
Consumer Response to Sponsorship Leveraged Packaging PhD Thesis Frances Woodside
105
Figure 5.1 – Chapter Outline
5.2 Development of Conceptual Model and Hypotheses
Based on the literature reviewed in Chapter 2, the components of a preliminary model
of factors impacting consumer responses to sponsorship leveraged packaging were
developed along with a series of propositions that were used to guide Study 1 (section
2.5). The literature suggested that the constructs Sponsored Property Identification,
Perceived Fit, and Brand Experience should all be relevant factors that would play a
role in Consumer Response to Sponsorship Leveraged Packaging.
After conducting exploratory research (Study 1) the conceptual model was revised to
incorporate those findings. The revised conceptual model proposed that Consumer
Response to Sponsorship Leveraged Packaging would be impacted equally by
Sponsored Property Identification and Sponsoring Brand Loyalty.
5.1 Introduction
5.4 Preliminary analysis
5.7 Moderating Hypotheses
5.6 Analysis of structural models and hypotheses
5.5 Measurement Model
5.3 Profile and analysis of respondents
5.2 Development of Model and Hypotheses
5.8 Conclusion
Page 118
Consumer Response to Sponsorship Leveraged Packaging PhD Thesis Frances Woodside
106
As Sponsored Property Identification captures the degree to which a person identifies
with the sponsored property, it was considered to be of particular importance in
influencing a consumer‘s awareness of a particular sponsorship leveraged
arrangement. It was proposed that Sponsored Property Identification would also
impact a consumer‘s attitudes toward the sponsor and further, direct the likelihood of
that consumer purchasing the sponsor‘s product. Thus, the model proposes that when
Sponsored Property Identification is high, there is likely to be a strong positive impact
on Consumer Response to SLP. The results from the literature review also suggest
that this relationship is likely to be moderated by the Perceived Fit between the
sponsoring brand and the sponsored property.
The other important variable in the proposed model is Sponsoring Brand Loyalty.
This variable captures the degree to which a consumer is loyal to the sponsoring
brand. Results from the literature review and study one suggest that when Sponsoring
Brand Loyalty is low, there is likely to be a positive impact on Consumer Response to
SLP. Alternatively, when Sponsoring Brand Loyalty is high there will be little or no
impact on Consumer Response to SLP.
Furthermore, the results of Study 1 in particular indicated that the way that consumers
respond to sponsorship leveraged packaging will be moderated by type of sponsored
property, awareness of sponsorship, frequency of purchase of the sponsored product
and individual respondent characteristics.
In summary then, the relationships proposed by the hypotheses can be considered
diagrammatically in the form of a conceptual model as shown in figure 5.2. Table 5.1
provides a summary of the hypotheses to be tested in Study 2. The next section will
present the profile and analysis of respondents for Study 2.
Figure 5.2 – Conceptual Model - Factors Impacting Consumer Response to SLP
Page 119
Consumer Response to Sponsorship Leveraged Packaging PhD Thesis Frances Woodside
107
Table 5.1 – Research Hypotheses
H1 That there is a positive relationship between sponsored property identification and consumer
response to SLP. That is: as the degree of sponsored property identification increases, there will
be a positive impact on consumer response to SLP
H2 That there is a positive relationship between perceived fit and consumer response to sponsorship
leveraged packaging. That is: as the degree of perceived fit increases, there will be a positive impact
on consumer response to SLP.
H3 That there is a negative relationship between sponsoring brand loyalty and consumer response to
SLP. That is: in cases of low sponsoring brand loyalty, there will be a positive impact on consumer
response to SLP.
H4 That consumer response to SLP is moderated by perceived fit. That is there will be a difference in
consumer response depending on the extent of perceived fit.
H5 That consumer response to SLP is moderated by type of sponsored property. That is there will be
a difference in consumer response depending on the type of sponsored property.
H6 That consumer response to SLP is moderated by awareness of the sponsorship. That is in cases
where the respondent is aware of the sponsorship; there will be a positive impact on Consumer
Response to SLP.
H7 That consumer response to SLP is moderated by frequency of purchase of the sponsoring brand.
That is in cases where the respondent frequently purchases the sponsoring brand; there will be a
positive impact on Consumer Response to SLP
H8 That consumer response to SLP is moderated by respondent characteristics. That is consumer
response to SLP will vary depending on age, income, household status & respondent gender.
5.3 Profile and Analysis of Respondents
The data set for this study was collected from residents of Toowoomba, Queensland,
an inland city with a population exceeding 100 000 people. The main survey was
carried out between 1 September and 1 November, 2008. For this study, respondents
completed a written survey that was self administered through schools. As a result, a
total of 256 surveys were completed and 251 were retained for data analysis. The
demographic profile of the respondents for Study 2 is shown in table 5.2.
Table 5.2 – Demographic Profile of Respondents
H2
SPONSORED
PROPERTY
IDENTIFICATION
CONSUMER
REPSPONSE
SLP
PERCEIVED
FIT
SPONSORING
BRAND
LOYALTY
H1
H3 Moderated by:
Type of Sponsored Property
Frequency of Purchase
Awareness
Respondent Characteristics
Page 120
Consumer Response to Sponsorship Leveraged Packaging PhD Thesis Frances Woodside
108
SLP
Frequency (%)
NO SLP
Frequency (%)
Gender
Female
male
n = 206
175 (85)
31 (15)
n = 50
39 (78)
11 (22)
Age
18-25 yrs
26-35 yrs
36-50 yrs
51-65 yrs
over 65 yrs
n = 197
26 (13)
47 (24)
96 (49)
24 (12)
4 (2)
n = 49
2 (4)
22 (44)
18 (37)
7 (14)
0
Household Status
Single
Couple
n = 201
45 (23)
156 (77)
n = 50
11 (22)
39 (78)
Children living at home
Yes
No
n = 201
151 (75)
50 (25)
n = 50
33 (66)
17 (34)
Occupation
Managerial/Professional
Semi-professional
Tradesperson/ sales
Administration
Student
Home Duties
Retired/ Unemployed
n = 197
23 (12)
58 (29)
19 (9)
31 (16)
41 (21)
21 (11)
4 (2)
n = 50
7 (14)
18 (36)
3 (6)
11 (22)
10 (20)
1 (2)
-
Household Income
Under $25000
$25000 & under $50000
$50000 & under $75000
$75000 & under $100000
$100000 or over
n = 144
20 (14)
26 (18)
42 (29)
29 (20)
27 (19)
n = 32
5 (15)
9 (28)
12 (38)
6 (19)
The data shows that of the 206 respondents in the SLP group, 85 per cent were female
(n=175) and 15 per cent (n=31) were male. The majority of the respondents were
between 36 and 50 years. Most in the sample belonged to a household that consisted of
a couple with children living at home. The largest occupational group in the sample
was semi-professionals with (n=58, 29 per cent). Household income varied with the
largest group being between $50 000 and $75 000 (n=42, 29 per cent). To establish
the representativeness of the sample, two strategies were used. Firstly, the response
rate was reviewed and then the profile of the sample was compared to that of the
sample population.
Page 121
Consumer Response to Sponsorship Leveraged Packaging PhD Thesis Frances Woodside
109
5.3.1 Response Rate
Due to the sampling process, a response rate of approximately 30 per cent was
expected. Four schools were involved in Study 2 with 440 families being represented.
The final number of responses was 256, which translated into a response rate of 58 per
cent. There were 5 incomplete questionnaires returned and thus the final sample size
was 251. This represented a response rate of 57 per cent. In summary, this response
rate is good for self-administered questionnaires (Aaker et al. 2007).
5.3.2 Assessment of Profiles
The demographic profiles of the respondents as summarised in table 5.2 can be
compared to the known population parameters for the sample population (main
grocery buyers) in order to gauge representativeness. Publicly available statistics for
grocery shoppers (Roy Morgan Research 2009) indicate that this sample differs
somewhat in relation to gender and children living at home (this study 85 per cent
female, Roy Morgan 63 per cent female; this study with children living at home 75 per
cent, Roy Morgan 37 per cent). However, given that the sampling method was
specifically chosen to capture families with children, this difference is not surprising.
In spite of the differences between the sample and the target population, when patterns
in the data were examined, similarity was noted between the two groups.
5.4 Preliminary Analysis
The rationale and general approach to be undertaken in the analysis of this data was
outlined in Chapter 4. Hence, the preliminary analysis will focus on the actual
outcomes in each of these areas for Study 2. The preliminary analysis consisted of
three sections: 1) cleaning and screening of the data (specifically in regard to missing
data, examination of outliers and normality); 2) generation of descriptive statistics for
all variables included in the model; and 3) examination of correlations of all variables
included in the model.
Page 122
Consumer Response to Sponsorship Leveraged Packaging PhD Thesis Frances Woodside
110
5.4.1. Cleaning and Screening
The first step in the preliminary analysis was to clean and screen the data to increase
accuracy and ensure that none of the assumptions for data analysis techniques had
been violated. The data were cleaned and screened for missing data, outliers and
normality.
Data Cleaning. The data were entered into SPPS, and were checked for accuracy by
running frequency distributions and any out of range values were checked. In
addition, a random check of every 10 entries was also performed. During this process
the item ‗the sponsorship would not influence my purchase decision in any way‘ which
was negatively phrased was reverse coded to allow for ease of interpretation. This
item is marked ‗reversed‘ in the table of means and standard deviations table 5.3.
The question relating to respondent‘s willingness to try the sponsored product
appeared to be problematic. Although respondents were directed to skip the question
if they had purchased the sponsored product previously, there were a number of
respondents who completed the question (10 per cent) despite indicating they had
already purchased the product. It was therefore decided to eliminate this question
from the analysis due to the possible inaccuracies in its measurement.
As an alternative, two other items were used to determine the respondent‘s willingness
to try the sponsored product. The frequency of purchase variable was used to group
the respondents into two groups, those who had previously purchased the sponsoring
brand and those who had not. These groupings were then used to ascertain significant
differences between the groups and the likelihood of purchasing the sponsored product
(see section 5.7.3).
Missing Data. SPSS was used to check for missing data. During this process, there
were 85 cases, which were missing responses to the household income question. This
could have been a result of the questionnaires being administered and collected by
families from schools, where respondents may have been concerned about privacy of
the information. Although an important variable, it was not considered critical to the
Page 123
Consumer Response to Sponsorship Leveraged Packaging PhD Thesis Frances Woodside
111
research question, and as such, these cases were retained for further analysis. Apart
from this question, there were ten other cases found to have missing data, particularly
in regard to the variables in the full measurement model. Five of these cases, had
missing variables in excess of 15 per cent and were removed from the data set.
Following the principles of Cohan and Cohan (1983), the remaining 5 cases with
missing variables were replaced using a Expectation-Maximisation (EM) algorithm
method, as they were less than 5% of the total number of questions.
Outliers. In order to check for outliers in the data, SPSS was used to generate
frequencies and histograms. Whilst some cases showed the presence of outliers, none
were deemed to be inconsistent and therefore all were retained in the analysis. A
further check using AMOS and the Mahalanobis distance was carried out. Twelve
cases were noted with multivariate outliers and these were reviewed. In all cases it
was judged that the responses were reasonable, and thus they were retained in the
analysis.
Normality. Normality was considered at both the univariate and multivariate levels,
as non-normality will affect the choice of estimation method used for structural
equation modeling. First, all variables were tested at a univariate level for skewness
and kurtosis using AMOS. Skewness reflects the symmetry of a distribution and
distributions in which most of the scores are piled up on the left or on the right are
respectively referred to as positively or negatively skewed distributions. For scores
that are normally distributed, the skewness values will equal zero and the further the
departure from zero, the greater the amount of skewness of the distribution (West,
Finch, & Curran 1995). Kurtosis is the degree of heaviness of the tails of the
distribution. For scores that are normally distributed, the kurtosis value will equal
zero, with values greater than or less than zero denoting different degrees of heaviness
of the tails. West, Finch, and Curran (1995) recommend that absolute values of
skewness and kurtosis respectively exceeding 2 and 7 are indicative of moderately
non-normal distributions.
Page 124
Consumer Response to Sponsorship Leveraged Packaging PhD Thesis Frances Woodside
112
In the scale for Sponsoring Brand Loyalty, no variables showed significant skewness
or kurtosis. In the scale for Sponsored Property Identification, the variable ‗good idea‘
showed considerable skewness (skewness=5.6) and kurtosis (kurtosis=3.6). In the
Consumer Response to SLP scale, the variable ‗buy more‘ showed kurtosis (kurtosis=
-3.10). In the Perceived Fit scale, the variable ‗logical fit‘ showed mild skewness
(skewness=2.56) and mild kurtosis (kurtosis=2.059). Thus it can be seen that the data
for this study, violates a key assumption underlying the use of maximum likelihood
(ML) estimation that of a normal univariate distribution.
Corrections have been developed to adjust ML estimation to account for non-
normality. AMOS produces the ―Bollen-Stine bootstrap p‖ (which is a post-hoc
adjustment to account for non-normality) (Mathieu et al. 1992). The Bollen-Stine
bootstrap p is a bootstrapped modification of the model chi-square used to test model
fit, adjusting for distributional misspecification of the model. Therefore, given the
non-normality of the data, the Bollen-Stine bootstrap p will be used to test model fit in
this study.
The nineteen variables to be used in the model were then tested for multivariate
normality, by the two different methods of Mardia‘s (1974) coefficient and
examination of the distribution of residuals using AMOS. The Mardia‘s coefficient of
multivariate normality for the variables in the final measurement model was 56.9 with
a critical ratio of 17.89 indicating that there was non-normality in the data.
Specifically the data appeared to be mildly skewed and kurtotic. As a further
indication of normality the residuals were examined with a large number of variables
returning a standardized residual value of greater than 2.5 (Joreskog & Sorbom 1996).
This confirmed the non-normality of the data.
On the basis of the univariate and multivariate tests of normality discussed, most of
the variables used in the model were moderately non-normal (Finch, West &
MacKinnon 1997). Within structural equation modeling, previous studies have
confirmed that maximum likelihood estimation is robust to moderate violations of the
normality assumption with estimates of parameters generally unaffected by the non-
Page 125
Consumer Response to Sponsorship Leveraged Packaging PhD Thesis Frances Woodside
113
normality. Therefore, it was decided to use the maximum likelihood estimation
method and not to transform the variables.
Summary. The data cleaning ensured that the observations were accurately entered
for analysis. The data screening identified and addressed the issues of missing data,
outliers and non-normality. Having explained the data cleaning and screening
procedures, the next section considers descriptive statistics.
5.4.2 Descriptive Statistics
Evaluation of the descriptive statistics of the data allows the researcher to become
familiar with the data set before proceeding with bivariate and multivariate analysis
(Hair et al. 1995). Descriptive statistics (means and standard deviations) for the items
to be considered in each of the constructs are reported in table 5.3. The means and
standard deviations for the variables show no unexpected results.
For the purposes of this research, the term [sponsoring brand] is used to represent the
sponsoring brand in the experiment groups i.e. either Sanitarium Weetbix or
Sanitarium Light ‗n‘ Tasty breakfast cereals. Furthermore, the term [sponsored
property] is used to represent the corresponding sponsored property i.e. in the case of
Sanitarium Weetbix, the sponsored property is Cricket Australia; in the case of
Sanitarium Light ‗n‘ Tasty, the sponsored property is National Breast Cancer
Foundation. For example, the item ‗The [sponsored property] logo on the package is
a good way to show the sponsorship arrangement between [sponsoring brand] and
[sponsored property]‟ will be reported in this way to improve readability.
Page 126
Consumer Response to Sponsorship Leveraged Packaging PhD Thesis Frances Woodside
114
Table 5.3 – Means and standard deviation of variables used in Study 2
Mean* St. Deviation
Construct/Variable SLP NOSLP SLP NOSLP
Sponsored Property Identification n=201 n=50 n=201 n= 50
I am a strong supporter of [sponsored property] 2.65 2.92 1.11 1.12
I am interested in [sponsored property] 2.66 2.88 1.05 1.17
If a company sponsored [sponsored property], it would positively
influence how I felt about that company
2.94 3.26 1.09 1.26
It is good that companies sponsor [sponsored property] 2.21 2.26 0.92 0.89
I am more likely to purchase products of companies that sponsor
[sponsored property]
2.97 3.16 1.06 1.16
Sponsoring Brand Loyalty
I like this brand 2.55 2.43 0.95 0.91
This brand is reliable 2.43 2.34 0.88 0.97
I would recommend this brand to others 2.61 2.56 0.90 0.88
I have a favourable opinion of this brand 2.57 2.45 0.91 0.84
I am loyal to this brand 2.99 3.07 0.99 1.06
I would buy this brand even if comp. prices were lower 3.06 3.15 1.06 1.26
Consumer Response to SLP
I like this sponsorship pictured on this package 2.54 NA 0.88 NA
The [sponsored property] logo on the package is a good way to
show the sponsorship arrangement between [sponsoring brand] and
[sponsored property]
2.18 2.28 0.83 0.64
This sponsorship improves my perception of [sponsoring brand] 3.03 NA .991 NA
This sponsorship makes me feel more favourable toward the
[sponsoring brand]
3.04 3.39 1.02 0.917
This sponsorship of [sponsored property] makes me like
[sponsoring brand] more than before
3.30 3.06 0.96 1.01
I would buy more of SLP product than un-sponsored 3.47 3.58 1.10 0.66
How likely is it that you would purchase this particular product? 2.91 NA 1.42 NA
I would purchase this SLP product even if competitors prices were
lower
3.28 3.58 1.10 0.66
This sponsorship would not influence my purchase decision in any
way (reversed) **
3.65 2.78 1.08 1.17
Perceived Fit
Its logical for [sponsoring brand] to sponsor [sponsored property] 2.75 2.48 0.831 0.66
[Sponsoring brand] and [sponsored property] have a similar image 2.90 NA 0.80 NA
*All ratings from 1 = Strongly agree to 5 = Strongly disagree 3 = neutral
** Significant differences determined between SLP and NO SLP groups (p=.000 at 0.01 level)
In relation to the Sponsored Property Identification scale, all of the means of the items
in the measure were below the neutral position (items rated on a 5 point Likert scale
with the mid point of 3 indicated neutrality: a score of 1 indicated strong agreement
and a score of 5 indicated strong disagreement). This suggested that respondents,
generally held some level of agreement with each of the statements. In particular, the
statement ‗I think it is good that a company sponsors [sponsored property]‟ which had
Page 127
Consumer Response to Sponsorship Leveraged Packaging PhD Thesis Frances Woodside
115
a moderately high mean score (mean=2.21: a score of 1 indicated strong agreement)
suggests that most respondents considered that sponsorship of the property was a good
idea. Respondents considered themselves to be supporters of the identified properties
(Cricket Australia and National Breast Cancer Foundation) (mean=2.65: a score of 1
indicated strong agreement).
The mean scores for the items included in the scale to measure Sponsoring Brand
Loyalty were consistent with expectations. Most of the items exhibited a moderately
low mean score (lowest mean = 2.43 where 1 indicated strong agreement). As most of
these statements were worded such that agreement indicated strong loyalty to the
sponsoring brand, this result supported the notion that most respondents had some
loyalty to the sponsoring brand.
In relation to the Consumer Response to SLP scale, many of the means of the items in
this measure were below the neutral position (items rated on a 5 point Likert scale
with the mid point of 3 indicating neutrality and a score of 1 indicating strong
agreement and a score of 5 indicating strong disagreement). This suggested that
respondents generally held some level of agreement with each of the statements. In
particular, the statement ‗The [sponsored property] logo on the package is a good way
to show the sponsor arrangement‘, had a low mean score (mean = 2.18 - a score of 1
indicated strong agreement) suggesting that most respondents considered the SLP
marketing strategy favourably.
Generally, respondents indicated their attitudes towards the sponsor were ambivalent
with three items in the scale having means close to the midpoint or neutral position
(mean=3.03 for item ‗This sponsorship improves my perception of [sponsoring
brand]‘; mean = 3.04 for item ‗This sponsorship makes me feel more favourable
toward the [sponsoring brand]‘; and mean = 3.30 for item ‗This sponsorship of
[sponsored property] makes me like [sponsoring brand] more than before‘).
Page 128
Consumer Response to Sponsorship Leveraged Packaging PhD Thesis Frances Woodside
116
The mean scores for the items included in the scale to measure Perceived Fit were
consistent with expectations. The items exhibited a neutral mean score (mean=2.75
and mean=2.90 - where 1 indicated strong agreement) indicating that respondents
neither agreed nor disagreed with these statements.
In summary, the means and standard deviations reported in table 5.3 show no
unexpected results based on the findings and discussion of the earlier studies and the
literature. The next stage of the research was to conduct t-tests to determine any
differences between the SLP and the NO SLP groups. The results are as follows.
The results of the t-tests indicate that there were significant differences between the
groups for one variable, „This sponsorship would not influence my purchase decision
in any way‟ (p =.000). The SLP group had a mean of 3.65 for this item, whilst the
NOSLP group had a mean of 2.78. In considering these results it should be noted that
the item scores had been reversed for the purposes of analysis with other positively
worded items. Taking this into consideration, the NOSLP group mean of 2.78 is close
to the midpoint (i.e. score of 3) indicating a neutral position, whilst the SLP group
mean of 3.65 would indicate agreement with the statement. In effect, this would
indicate that the SLP group believes the sponsorship would influence their purchase
decision whilst the NOSLP group was rather ambivalent about this statement.
This result was not surprising particularly when we consider that the NOSLP group
was not exposed to the SLP examples. Rather, SLP was explained to this group using
the wording, ―Sponsorship packaging is where the logo or pictures of a sponsored
group are pictured on the sponsoring grocery brands packaging (e.g. Coca-Cola &
Olympics)‖. Furthermore, the questions in the NOSLP questionnaire related to the
concept of SLP in general and sponsored properties were not specified. Thus, the
significant difference between the SLP and NOSLP groups and their response to this
item is logical given the nature of the items and exposure conditions.
Page 129
Consumer Response to Sponsorship Leveraged Packaging PhD Thesis Frances Woodside
117
Having determined that differences exist between the experiment and control groups
and as the purpose of this research is to determine the factors which impact Consumer
Response to SLP, the data analysis procedures will from this point on, focus on the
SLP group only with a view to determining any structural relationships amongst the
variables in the model from their perspective.
The next stage of the research was to validate the measures that were to be used in
testing of the conceptual models as discussed in section 5.2. The analysis will be
conducted in two stages, firstly the measurement models will be tested and then the
structural model will be tested.
5.5 Measurement Models
Exploratory factor analysis incorporating all 22 items was the first technique to be
used to assess the validity of the proposed item groups. Some researchers suggest that
exploratory factor analysis should be followed by confirmatory factor analysis using
structural equation modeling (Anderson & Gerbing 1998; Ambler, Styles & Xiucun
1999). This process was followed in this study where all 22 items were investigated
firstly with exploratory factor analysis and then with confirmatory factor analysis.
To conduct the exploratory factor analysis, an exploratory maximum likelihood factor
analysis was used with an oblimin rotation, which allows correlation between the
factors. The data were considered suitable for factor analysis as the Bartlett Test of
Sphericity was significant (2
= 3687.77; df = 231; p = 0.00). This indicates that there
are sufficient non-zero inter-correlations amongst the measured variables to warrant an
Exploratory Factor Analysis. The KMO measure of sampling adequacy (KMO =
0.870) indicates that over 80% of variance in the measured variables is common
variance. KMO values exceeding 0.6 are recommended for Exploratory Factor
Analysis (Tabachnick & Fidell 1996). Using the root one criterion (Tabachnick &
Fidell 1996), each item was examined and the corresponding factor loadings and
pattern matrix are shown in table 5.5.
Page 130
Consumer Response to Sponsorship Leveraged Packaging PhD Thesis Frances Woodside
118
The factor correlation matrix is provided in table 5.4 and the item correlation matrix is
shown in appendix 3. The results of the exploratory factor analysis as shown in table
5.5, suggest some factorial complexity with the majority of the items showing no
cross-loadings. Two items did however show some cross loadings and these will be
fully discussed in section 5.5.4. The four factor model explained 70% of the variance
in the items and the percentage of variance accounted for by each factor individually is
shown in table 5.5. In summary it was determined that a four factor model explained
the relationships in these items quite well.
Table 5.4 – Exploratory Factor Analysis - Factor Correlation Matrix
The exploratory factor analysis suggested that the 22 items captured four factors (see
table 5.5). The results indicated that the measures for Sponsored Property
Identification and Sponsoring Brand Loyalty were uni-dimensional as proposed, but
that three items were not captured under the constructs initially proposed.
The three items not captured under the original constructs were:
„I like this sponsorship pictured on this package‟
„The [sponsored property] logo on the package is a good way to show the
sponsorship arrangement between [sponsoring brand] and [sponsored property]‟
„How likely is it that you would purchase this particular product?‟
The first and second items were initially proposed under the Consumer Response to
SLP construct. However, the items were shown in this exploratory factor analysis to
fall into the Perceived Fit construct. Thus it was necessary to carefully consider where
the items belonged and revisit the wording and intent of the measures.
Factor 1 2 3 4
1 1.00
2 -0.25 1.00
3 0.51 -0.06 1.00
4 0.36 -0.21 0.23 1.00
Page 131
Consumer Response to Sponsorship Leveraged Packaging PhD Thesis Frances Woodside
119
Originally, the items were modified from existing measures to account for this context
specifically i.e. sponsorship promotion on packaging and were intended to reflect a
consumer response to SLP. However, closer examination of the wording of these items
confirms that they may in fact be also capturing elements of respondent‘s views about
matching in relation to the sponsorship and the packaging. Thus, it is reasonable that
these items may better reflect measures of Perceived Fit rather than just Consumer
Response to SLP. Given the indication of the exploratory factor analysis, the two
items were grouped in the Perceived Fit factor for the confirmatory factor analysis and
these results are discussed more fully in section 5.5.4.
The remaining item ‗How likely is it that you would purchase this particular product?‟
was initially proposed to fit into the Consumer Response to SLP construct. However,
the exploratory factor analysis indicated that this item should be grouped with the
Sponsoring Brand Loyalty scale. Given that Sponsoring Brand Loyalty represents the
consumer‘s attitude and purchase habits toward the unsponsored product, it is
reasonable that the item ‗How likely is it that you would purchase this particular
product?‘ could capture elements of this construct. However as this particular item
represents the consumer‘s purchase intention toward the sponsored product (after
exposure to SLP), theoretically, the item belongs as a Consumer Response to SLP and
therefore it was retained in that measurement scale (section 5.5.3).
Having established that the model captures four factors as initially proposed, the next
step was to examine the individual factors. With this in mind, confirmatory factor
analysis was conducted on each measurement scale in the model with a view to
attempting to purify the measures in terms of uni-dimensionality. Each scale will now
be addressed in turn commencing with the Sponsored Property Identification scale.
Page 132
Consumer Response to Sponsorship Leveraged Packaging PhD Thesis Frances Woodside
120
Table 5.5 – Pattern Matrix Study 2
Proposed Item Membership 1 2 3 4
Sponsored Property Identification
I am a strong supporter of [Cricket Australia/ Breast Cancer Foundation] -0.021 0.046 0.894 -0.044
I am interested in [Cricket Australia/ Breast Cancer Foundation] -0.091 0.041 0.937 0.029
If a company sponsored [Cricket Australia/ Breast Cancer Foundation], it would positively influence how I felt
about that company
0.249 0.042 0.670 0.034
I think it is good that companies sponsor [Cricket Australia/Breast Cancer Foundation] -0.089 -0.022 0.668 0.300
I am more likely to purchase products of companies that sponsor [Cricket Australia/Breast Cancer Foundation] 0.169 0.066 0.772 -0.037
Sponsoring Brand Loyalty
I like this brand -0.015 -0.931 -0.076 0.013
This brand is reliable 0.033 -0.894 -0.159 0.013
I would recommend this brand to others -0.057 -0.949 -0.071 0.064
I have a favourable opinion of this brand -0.049 -0.920 -0.064 0.007
I am loyal to this brand -0.128 -0.807 0.072 0.036
I would buy this brand even if competitors prices were lower -0.019 -0.713 0.102 0.002
Consumer Response to SLP
I like this sponsorship pictured on the package 0.184 -0.017 0.327 0.426
The logo on the package is a good way to show the sponsorship 0.246 -0.049 0.019 0.442
This sponsorship improves my perception of [Sponsored property] 0.839 -0.032 -0.011 0.201
This sponsorship makes me feel more favourable toward the [Sanitarium Weetbix /Sanitarium L & T brand] 0.939 0.014 -0.067 0.151
This sponsorship of [Cricket Australia/National Breast Cancer Foundation] makes me like [Sanitarium Weetbix
brand / Sanitarium L & T brand] more than before 0.784 0.048 -0.009 0.157
Sponsorship would not influence purchase (R) 0.333 -0.113 0.278 -0.155
Likelihood of purchasing product 0.201 -0.595 -0.007 0.024
I would buy more of SLP product than an un-sponsored product 0.514 -0.086 0.261 -0.107
I would purchase this SLP product even if competitors prices were lower 0.253 -0.312 -0.240 0.007
Perceived Fit
Its logical for [Sanitarium Weetbix /Sanitarium L & T] to sponsor [Cricket Australia/ Breast Cancer Foundation] 0.028 -0.025 .078 0.834
[Sanitarium Weetbix /Sanitarium L & T] and [Cricket Australia/ Breast Cancer Foundation] have a similar image 0.036 -0.085 -.016 0.772
Percentage of variance accounted for by each factor 34% 22% 8% 6%
Page 133
Consumer Response to Sponsorship Leveraged Packaging PhD Thesis Frances Woodside
121
5.5.1 Sponsored Property Identification Scale
All of the items included in this measure were sourced from the literature (see section
2.4.3). The initial exploratory factor analysis of the original five items supported the uni-
dimensionality of this scale. The factor loadings for these items were considered to be
good to excellent (0.70 to 0.88) (Churchill 1979) and the resulting Cronbach alpha was
also good (α= 0.91). In the early stages of basic research, alphas of 0.7 and above have
been considered acceptable (Nunally 1997; Churchill 1979). Table 5.6 shows the factor
analysis results for the initial confirmatory model and the adjusted measurement model.
Table 5.6 – Sponsored Property Identification Scale
Variable
Confirmatory
factor loadings
initial model
Confirmatory
factor loadings
adjusted model
Sponsored Property Identification α = 0. 913 α = 0.884
I am a strong supporter of [sponsored property] 0.87 0.71
I am interested in [sponsored property] 0.88 -
If a company sponsored [sponsored property], it would
positively influence how I felt about that company 0.81 0.89
I think it is good that companies sponsor [sponsored property] 0.70 0.66
I am more likely to purchase products of companies that
sponsor [sponsored property] 0.85 0.91
In the confirmatory analysis using AMOS, all of the items were shown to contribute to
the measure of Sponsored Property Identification as the critical ratios were above 1.96.
The betas (standardised regression weights) for the five variables were all above 0.7,
which are considered to be very good (Churchill 1979; Hulland et al. 1996). An analysis
of residuals is also recommended as a means of assessing overall fit, with those residuals
with a standardised value greater than 2.58 indicating a possible specification error
(Joreskog & Sorbom 1996). In this measure, there were no standardised residuals higher
than 1.
Although the five items were shown to have very good regression weights and a good
alpha (α= 0.91), it can be seen that two pairs of items were highly correlated (see table
5.7). These high correlations suggest that there may be some item redundancy. Therefore
it was decided to assess the scale with the removal of each item in turn.
Page 134
Consumer Response to Sponsorship Leveraged Packaging PhD Thesis Frances Woodside
122
Table 5.7 – Item Correlations Sponsored Property Identification Scale
Item Interested Strong
Supporter
Positively
Influence
Good to
Sponsor
Likely
Purchase
I am interested in [sponsored property] 1.00
I am a strong supporter of [sponsored property] 0.83 1.00
If a company sponsored [sponsored property] it would
positively influence how I felt about that company
0.65 0.68 1.00
It is good that companies sponsor [sponsored property] 0.65 0.58 0.57 1.00
I am more likely to purchase products of companies
that sponsor [sponsored property]
0.72 0.70 0.82 0.59 1.00
As can be seen from table 5.6, if the item „I am interested in [sponsored property]‟ was
removed from the measure, the coefficient alpha was sightly reduced but still acceptable
(α= 0.88). However, when the subsequent items were removed, the coefficient alpha
dropped to α= 0.830 (Positively Influence), and α= 0.821 (Likely Purchase). In order to
evaluate the scale with as high an alpha as possible, all the items except the item ‗I am
interested in [sponsored property]‟ were retained and the scale tested for goodness of fit.
The adjusted model had improved multivariate normality with Mardia‘s coefficient
reduced to 4.72 and no large residuals. In addition when the two factor structures were
compared, the adjusted model (with 1 item deleted) appeared to be a better fitting model
than the initial model for measuring Sponsored Property Identification (χ2
=4.85, p =
0.087 df =2). Five measures of goodness of fit were used to evaluate the measurement
models as discussed in section 4.3.5 and these results are shown for this scale in table 5.8.
Table 5.8 – Measures of Fit for the Sponsored Property Identification Scale
Initial measurement
scale
Adjusted
measurement scale
Mardia’s coefficient 9.126 4.72
Standardised residuals above 2.57 None None
Chi Square χ2 =70.36 p = 0.00
df = 5
χ2 =4.85, p = 0.087
df =2 bp = 0.582
CMIN/DF 14.07 2.44
TLI 0.82 0.98
SRMR 0.04 0.02
RMSEA 0.26 0.08
Page 135
Consumer Response to Sponsorship Leveraged Packaging PhD Thesis Frances Woodside
123
In relation to the fit of both the initial and adjusted measurement models, the adjusted
measurement model was superior to that of the initial model. The fit indices for the
initial measurement model (five items) showed a poor fit to the data (significant Chi
Square statistic p =.000; CMIN/DF well above acceptable range of 2-5; TLI below
acceptable 0.95 range, and RMSEA well above 0.08 acceptable range).
For the adjusted scale (four items) the Chi Square statistic was not significant. However,
given the non-normality of the data, the Bollen-Stine bootstrap p was a more appropriate
statistic for the evaluation of fit for this factor. The Bollen-Stine bootstrap (p = 0.58)
suggests the adjusted model has good fit. In addition, the CMIN/DF was well within the 2
to 5 range considered to be acceptable, an acceptable TLI statistic over the 0.95 desired
level, and the SRMR was well below 0.08. The RMSEA value was within the 0.05 to
0.08 range, which is considered to be mediocre (Browne & Cudeck 1993). This would
suggest that the adjusted measurement model for Sponsored Property Identification with
4 items has a better fit with the data than the initial model with 5 items.
Despite the improved fit of the adjusted model, the initial model showed higher factor
loadings, higher coefficient alpha and a lack of cross-loadings in the exploratory factor
analysis. With this in mind, it was decided to retain all the items in the measure at this
stage as proposed (five items) for testing in the structural stage of the analysis. In
retaining the item “I am interested in [sponsored property]‟, the high correlations suggest
possible item redundancy, which is reflected in the less than desirable model fit.
5.5.2 Sponsoring Brand Loyalty scale
All of the items included in this measure were sourced from the literature (see section
4.3.2). The factor loadings for these items were considered to be good to excellent (0.70
to 0.89) (Churchill 1979) and the resulting Cronbach alpha was also good (α= 0.91). The
results are shown in table 5.9. The initial exploratory factor analysis of the original six
items supported the uni-dimensionality of this scale. However, the exploratory factor
analysis suggested that an additional item ‗How likely is it that you would purchase this
particular product?‘ belonged to the Sponsoring Brand Loyalty scale. As explained in
Page 136
Consumer Response to Sponsorship Leveraged Packaging PhD Thesis Frances Woodside
124
section 5.5, it was determined that this item theoretically belongs to the Consumer
Response to SLP scale. Therefore for the confirmatory factor analysis the item was
included in the Consumer Response to SLP scale and not here (see section 5.5.3).
Table 5.9 – Sponsoring Brand Loyalty Scale
Variable
Confirmatory
factor loadings
initial model
Confirmatory
factor loadings
final model
Sponsoring Brand Loyalty α = 0.939 α = 0.949
I like this brand 0.92 0.92
This brand is reliable 0.90 0.91
I would recommend this brand to others 0.95 0.95
I have a favourable opinion of this brand 0.92 0.92
I am loyal to this brand 0.78 0.77
I would buy this brand even if comp. prices were lower 0.69 -
In the confirmatory analysis using AMOS, all of the six items were shown to contribute
to the measure of Sponsoring Brand Loyalty as the critical ratios were above 1.96. The
betas for the six variables were all at an acceptable level (above 0.5) and five out of the
seven variables were above 0.7, which is considered to be very good (Churchill 1979;
Hulland et al. 1996). In this measure, there were no standardised residuals higher than
2.5.
Table 5.10 – Item Correlations Sponsoring Brand Loyalty Scale
Item Like
Brand
Reliable
Brand
Recommend
Brand
Favourable
Opinion
Loyal to
Brand
Buy
Brand
I like this brand 1.00
This brand is reliable 0.86 1.00
I would recommend this brand to others 0.87 0.85 1.00
I have a favourable opinion of this brand 0.83 0.84 0.88 1.00
I am loyal to this brand 0.71 0.64 0.75 0.71 1.00
I would buy this brand even if
competitors prices were lower
0.62 0.54 0.68 0.60 0.75 1.00
There were high correlations between a number of items in this scale, however the
exploratory factor analysis showed no cross-loadings for the items. The modification
indices for these variables suggested that the fit of the model could be improved if the
following items were removed from the scale: ‗This brand is reliable‟ and ‗I would buy
this brand even if competitor‟s prices were lower‘.
Page 137
Consumer Response to Sponsorship Leveraged Packaging PhD Thesis Frances Woodside
125
In relation to the item ―this brand is reliable‘ there were high correlations between this
item and three other sponsoring brand loyalty items (see table 5.10) indicating possible
item redundancy. However, despite these high correlations, the item was shown to have a
high factor loading (beta = 0.90) with no standardised residuals higher than 2.5. As such,
the item was retained in this measure for testing in the structural stage of the analysis.
In considering the item ‗I would buy this brand even if competitor‟s prices were lower‘,
the item had a reasonable factor loading (beta = 0.69). This item was initially included in
the scale on the premise that consumers who were loyal to a particular brand would
purchase the product regardless of price. However, in FMCG markets, although
consumers might be loyal to particular brands, they are also generally very price sensitive
(Silayoi & Speece 2004). Therefore, even though a consumer may be loyal to a particular
brand, the literature suggests that they can be influenced to switch brands if a
competitor‘s price was cheaper (Pickton & Broderick 2005). As the mean for this item is
marginally over the middle point of the scale (mean = 3.06) indicating a neutral position,
there is also evidence that the item may not be adding much richness of interpretive data
to the scale. Therefore, it was decided to assess the scale with the removal of the item.
When comparing the two measurement models, an adjusted measurement model (5
items) had a better model fit (χ2
= 22.2, p = 0.00 df = 5 bp = 0.09) than did the initial
model with 6 items (χ2
=82.68; p = 0.00; df = 9). In the adjusted model the coefficient
alpha was improved (α = 0.949). The adjusted model had much improved multivariate
normality with Mardia‘s coefficient reduced to 30.81 and no large residuals. The Bollen
Stein p statistic was not significant suggesting reasonable fit given the non-normality of
the data. The CMIN/DF was between the accepted 2 to 5 range, again suggesting
reasonable fit to the model. The TLI statistic was acceptable (TLI > 0.95), and the
SRMR was well below 0.08. However, the RMSEA statistic was above the 0.06 level
(Hu & Bentler 1999; Hulland et al. 1996). Thus, the measurement model for Sponsoring
Brand Loyalty with five items could be said to have a reasonable fit with the data. The fit
statistics are shown in table 5.11.
Page 138
Consumer Response to Sponsorship Leveraged Packaging PhD Thesis Frances Woodside
126
With the improved model fit once the item ‗I would buy this brand even if competitor‟s
prices were lower‘ was removed from the scale and considering the items neutral mean, it
was decided to remove the item from the ‗Sponsoring Brand Loyalty‘ scale. The five item
scale for ‗Sponsoring Brand Loyalty‘ will be used in the structural stage of the analysis.
Table 5.11 – Measures of Fit for the Sponsoring Brand Loyalty Scale
Initial
Measurement scale
Final
measurement scale
Mardia’s coefficient 37.53 30.81
Standardised residuals above 2.57 None None
Chi Square χ2 =101.31 p = 0.00
df = 14 χ
2 = 22.2, p = 0.00
df = 5 bp = 0.09
CMIN/DF 7.23 4.44
TLI 0.90 0.97
SRMR 0.05 0.02
RMSEA 0.18 0.13
5.5.3 Consumer Response to Sponsorship Leveraged Packaging (SLP) scale
All of the items included in this measure were sourced from the literature (see section
2.6). The factor loadings for these items were considered to be fair to excellent (betas
ranged from 0.35 to 0.96) (Churchill 1979) and the Cronbach alpha was good (α=0.855).
The results are shown in table 5.12 below. The initial exploratory factor analysis of the
original seven items supported the uni-dimensionality of this scale, with the exception of
the item ‗How likely is it that you would purchase this particular product?‟ The
exploratory factor analysis indicated that this item might belong to the construct,
‗Sponsoring Brand Loyalty‘. As this item represents the consumer‘s purchase intention
toward the sponsored product (after exposure to SLP), it was included in this scale.
Table 5.12 – Consumer Response to Sponsorship Leveraged Packaging Scale
Variable
Confirmatory
factor loadings
initial model
Confirmatory
factor loadings
final model
Consumer Response to SLP α = .855 α = .892
This sponsorship improves my perception of [sponsored property] 0.92 0.92
This sponsorship makes me feel more favourable toward the
[sponsoring brand] 0.96 0.96
This sponsorship of [sponsored property] makes me like [sponsoring
brand] more than before 0.85 0.84
How likely is it that you would purchase this particular product? 0.35 -
Page 139
Consumer Response to Sponsorship Leveraged Packaging PhD Thesis Frances Woodside
127
Variable
Confirmatory
factor loadings
initial model
Confirmatory
factor loadings
final model
This sponsorship would not influence my purchase decision in any
way (reversed) 0.42 -
I would buy more of SLP product than unsponsored 0.61 0.59
I would purchase this SLP product even if compet. prices were lower 0.46 -
All of the items were shown in the confirmatory analysis using AMOS to contribute to
the measure of Consumer Response to SLP as the critical ratios were above 1.96. The
variable ‗I would buy more of SLP product than un-sponsored‘ had a beta of 0.61 and
three of the seven variables were above 0.7, which are considered to be very good
(Churchill 1979; Hulland et al. 1996). However, the betas (standardised regression
weights) for three of the seven variables were below the acceptable level of 0.5.
Furthermore, four of the seven variables had large standardised residuals (see table 5.14),
suggesting a possible specification error (Joreskog & Sorbom 1996). The exploratory
factor analysis showed no cross-loadings for the items, except for the item „I would
purchase this SLP product even if competitors‟ prices were lower‟. However, there were
high correlations between a number of items in this scale (see table 5.13). This indicates
that there may be item redundancy in the scale and it was necessary to examine the
individual items.
Table 5.13 – Item Correlations Consumer Response to SLP scale
Item Improves
Perception
Favour
Sponsor
Like
Sponsor
more
Likelihood
of
Purchase
Buy more Purchase
Competitors
Price
Not
Influence
This sponsorship improves my perception
of [sponsored property]
1.00
This sponsorship makes me feel more
favourable toward the [sponsoring brand]
0.89 1.00
This sponsorship of [sponsored property]
makes me like [sponsoring brand] more
than before
0.78 0.81 1.00
This sponsorship would not influence my
purchase decision in any way (reversed)
0.35 0.38 0.37 1.00
How likely is it that you would purchase
this particular product?
0.26 0.31 0.29 0.17 1.00
I would buy more of SLP product than un-
sponsored
0.50 0.58 0.54 0.57 0.28 1.00
I would purchase this SLP product even if
competitors prices were lower
0.40 0.42 0.39 0.33 0.49 0.53 1.00
Page 140
Consumer Response to Sponsorship Leveraged Packaging PhD Thesis Frances Woodside
128
Although the item ‗I would buy more of the SLP product than an un-sponsored product‘
had a large standardised residual, it did have a reasonable factor loading (beta = 0.61).
This item was considered particularly important for the research question, as it represents
the respondent‘s intention to purchase the sponsored product, above what would normally
be purchased, thus providing an indication of the impact of SLP. It was therefore
retained in the measure for testing in the model.
The remaining three items ‗How likely is it that you would purchase this particular
product?‘, ‗I would purchase this SLP product even if competitors prices were lower‘ and
‗This sponsorship would not influence my purchase decision in any way‘ had large
standardised residuals, and low factor loadings. This suggests possible item redundancy.
Correlations between these items were also quite low suggesting problems with
convergent validity. Taking these factors into consideration, it was decided to assess the
scale with the removal of these items.
Table 5.14 – Large Standardised Residuals Consumer Response to SLP Scale
Item Likelihood
of Purchase
Buy more
than
unsponsored
Purchase
Competitors
Price
Not
Influence
How likely is it that you would purchase this particular
product?
4.77
I would buy more of SLP product than un-sponsored 3.49 4.30
I would purchase this SLP product even if competitors
prices were lower
4.77 3.49
This sponsorship would not influence my purchase
decision in any way (reversed)
4.30
When these items were removed from the measure, the coefficient alpha was slightly
improved and acceptable (α = 0.89). The adjusted model had much improved
multivariate normality with Mardia‘s coefficient reduced to 9.63 and no large residuals.
When the two factor structures were compared, the final model (with items deleted)
appeared to be a better fitting model than the initial model for measuring Consumer
Response to SLP (χ2
= 6.26 df = 2, p = 0.045; bp = 0.53). The fit statistics for the scale
are shown in table 5.15.
Page 141
Consumer Response to Sponsorship Leveraged Packaging PhD Thesis Frances Woodside
129
Table 5.15 – Measures of Fit for the Consumer Response to SLP Scale
Initial Measurement
scale
Final measurement
scale
Mardia’s coefficient 16.936 6.19
Standardised residuals above 2.57 Three None
Chi Square χ2 = 135.19 p = 0.00
df =14 bp = 0.01 χ
2 = 6.26, p = 0.045
df = 2 bp = 0.53
CMIN/DF 9.66 3.00
TLI 0.78 0.98
SRMR 0.11 0.02
RMSEA 0.21 0.10
Given the non-normality of the data, the Bollen-Stine bootstrap p would be a more
appropriate statistic for the evaluation of fit for this factor. The Bollen-Stine bootstrap (p
= 0.532) suggests the final model has good fit. The CMIN/DF was between the 2 to 5
range considered to be acceptable (CMIN/DF = 3.1), the TLI statistic was over the 0.95
desired level, and the SRMR was well below 0.08. However, the RMSEA statistic was
slightly above the acceptable 0.06, though Brown and Cudeck (1993) suggest RMSEA
indices in the range from 0.08 to 0.1 indicate a mediocre fit. Thus, the measurement
model for Consumer Response to SLP with four items could be said to have a moderate
fit with the data and will be used in the structural stage of the analysis.
5.5.4 Perceived Fit Scale
Based on the exploratory factor analysis conducted earlier, the four variables ‗I like this
sponsorship pictured on this package‟, „The logo on the package is a good way to show
the sponsorship arrangement‟, „Its logical for [Sanitarium Weetbix /Sanitarium L & T] to
sponsor [Cricket Australia/ Breast Cancer Foundation]‟ and „[Sanitarium Weetbix
/Sanitarium L & T] and [Cricket Australia/ Breast Cancer Foundation] have a similar
image‟ were included in this scale in the confirmatory factor analysis. Two of the items
included in this measure were sourced from the literature (section 2.4.4). The items
relating to SLP were developed for this research.
The factor loadings for these items were considered to be fair to good (betas ranged from
0.56 to 0.72) (Churchill 1979) and the resulting Cronbach alpha was also good (α=
0.823). In the confirmatory analysis, all of the items were shown to contribute to the
Page 142
Consumer Response to Sponsorship Leveraged Packaging PhD Thesis Frances Woodside
130
measure of Perceived Fit as the critical ratios were above 1.96. The betas for the four
variables were all at an acceptable level (betas > 0.5) (Churchill 1979; Hulland et al.
1996). The results are shown in table 5.16.
Table 5.16 – Perceived Fit Scale
Variable
Confirmatory
factor loadings
initial model
Confirmatory
factor loadings
final model
Perceived Fit α = 0.823 α = 0.840
I like this sponsorship pictured on the package 0.56 -
The [Cricket Australia/ Breast Cancer Foundation] logo on the
package is a good way to show the sponsorship arrangement
between [Sanitarium Weetbix brand / Sanitarium L & T brand] and
[Cricket Australia/ Breast Cancer Foundation]
0.50 -
Its logical for [Sanitarium Weetbix /Sanitarium L & T] to sponsor
[Cricket Australia/ Breast Cancer Foundation] 0.72 0.89*
[Sanitarium Weetbix /Sanitarium L & T] and [Cricket Australia/
Breast Cancer Foundation] have a similar image
0.64 0.81*
*As it is not possible to perform CFA with two items, these items were tested in the four factor measurement model.
In this measure, there was one standardised residual higher than 2.5 between the items ‗I
like this sponsorship pictured on this package‘ and ‗The logo on the package is a good
way to show the sponsorship arrangement‘ (3.91). The exploratory factor analysis
showed cross-loadings for the first item, suggesting it might be problematic (see table
5.5). Considering the cross-loadings, marginal factor scores, and high-standardised
residuals, it was decided to assess the scale with the removal of the items.
As can be seen by the measures of fit for the initial measurement scale (see table 5.17),
the four item scale had very poor fit to the data. When the first item was removed from
the scale, the coefficient alpha was considerably reduced (α = 0.77). When both the first
and second items were removed from the scale, the factor scores for the two remaining
items were much improved (betas = 0.89 and 0.81) and the coefficient alpha was
acceptable (α = 0.84).
Taking into consideration the problematic nature of the first two items and the improved
scale reliability once the items were removed, it was decided that the first two items
would be removed from the scale and the remaining two items would be retained for
Page 143
Consumer Response to Sponsorship Leveraged Packaging PhD Thesis Frances Woodside
131
testing in the structural stage of the analysis. As it is not possible to perform a
confirmatory factor analysis when only two items are included in a scale, the remaining
two items in the Perceived Fit scale were tested in the next stage of the process, an
examination of the correlations between the constructs. This is discussed next.
Table 5.17 – Measures of Fit for the Perceived Fit Scale
Initial
Measurement
scale
Final
Measurement Scale
(Four Factor Model)*
Mardia’s coefficient 15.49 56.9
Standardised residuals above 2.57 One two
Chi Square χ2 =65.32, p = 0.00
df = 2
χ2 =164.76, p = 0.00
df = 84 bp = 0.003
CMIN/DF 32.66 1.96
TLI 0.44 0.96
SRMR 0.11 0.05
RMSEA 0.40 0.07
*It is not possible to perform CFA with two items therefore the scale was tested in the four factor measurement model.
5.5.5 Four Factor Measurement Model
The measurement model was assessed via confirmatory factor analysis (CFA) using
Analysis of Moment Structure (AMOS) 16 (Arbuckle & Wothke, 2007) with a maximum
likelihood estimation method. Goodness of fit of the measurement model and the factor
structures and dimensionalities of these constructs were examined. Further, relationships
between observable indicators and their latent constructs, specifically: Sponsored
Property Identification (SPI); Sponsoring Brand Loyalty (SBL); Consumer Response to
SLP (CRSLP); and Perceived Fit (PFIT) were examined.
Page 144
Consumer Response to Sponsorship Leveraged Packaging PhD Thesis Frances Woodside
132
Table 5.18 – Four Factor Measurement Model
Four Factor Measurement Model
Confirmatory
factor loadings
initial model
Confirmatory
factor loadings
final model
Sponsored Property Identification
I am a strong supporter of
[Cricket Australia/ Breast Cancer Foundation]
0.85 0.77
If a company sponsored [Cricket Australia/ Breast Cancer
Foundation], it would positively influence how I felt about that co.
0.84 0.90
I am interested in [Cricket Australia/ Breast Cancer Foundation] 0.86 -
It is good when company‘s sponsor [Cricket Australia/ Breast
Cancer Foundation](supporter)
0.70 0.66
I am more likely to purchase products of companies that sponsor
[Cricket Australia/ Breast Cancer Foundation]
0.88 0.90
Sponsoring Brand Loyalty
I like this brand 0.92 0.92
I think this brand is reliable 0.91 0.91
I would recommend this brand to others 0.95 0.95
I have a favourable opinion of this brand 0.92 0.92
I am loyal to this brand 0.76 0.76
Consumer Response to SLP
This sponsorship improves my perception of
[sponsoring brand]
0.92 0.92
This sponsorship makes me feel more favourable toward the
[sponsoring brand]
0.96 0.96
This sponsorship of [sponsored property] makes me like
[sponsoring brand] more than before
0.85 0.85
I would buy more of SLP product than unsponsored 0.59 0.59
Perceived Fit
Its logical for [Sanitarium Weetbix /Sanitarium L & T] to sponsor
[Cricket Australia/ Breast Cancer Foundation]
0.89 0.89
[Sanitarium Weetbix /Sanitarium L & T] and [Cricket Australia/
Breast Cancer Foundation] have a similar image
0.81 0.81
In the confirmatory analysis using AMOS, all of the items were shown to contribute to
the measure of factors impacting Consumer Response to SLP as the critical ratios were
above 1.96. The betas (standardised regression weights) for the items were all at an
acceptable level (beta > 0.5). Thirteen out of the fifteen factor loadings were considered
to be good to excellent (betas ranged from 0.76 to 0.95) (Churchill 1979; Hulland et al.
1996). In this measure, there were two standardised residual higher than 2.5 between two
pairs of items. Table 5.18 shows the factor loadings for the items in the Four Factor
Measurement Model. Table 5.19 shows the high standarised residuals.
Page 145
Consumer Response to Sponsorship Leveraged Packaging PhD Thesis Frances Woodside
133
Table 5.19 – Large Standardised Residuals Four Factor Measurement Model
Item
Confirmatory
factor
loadings
Good to
Sponsor
Likely to
Purchase
It is good that companies sponsor [sponsored property]‘ 0.66
Its logical for [specified sponsor] to sponsor [sponsored property] 0.89 2.90
I would buy more of SLP product than un-sponsored 0.59 2.90
I am more likely to purchase products of companies that sponsor
[sponsored property]
0.90
In relation to the first standardised residual, the beta values for these items are reasonable
(beta= 0.66 & 0.89). An examination of the Cronbach alpha results, suggest that the
Sponsored Property Identification scale reliability would increase only marginally if the
item ‗I think it is good that companies sponsor [sponsored property]‟ was deleted (α
increased from 0.88 to 0.89). Similarly, with no other variables highly correlated to the
item ‗It is logical for [sponsoring brand] to sponsor [sponsored property], there is
insufficient evidence to warrant the removal of the item. In spite of the large standardised
residuals, there was theoretical justification for the items to be retained in the model.
The second standardised residual involved the item ‗I would buy more of an SLP product
than an un-sponsored product‟ which had an acceptable factor loading (beta = 0.59). As
there were no high correlations with other items, or cross-loadings in the factor analysis,
careful consideration was given to whether there was sufficient justification to remove
the item. Given that one of the central tenants of this thesis is whether SLP has the
capacity to impact attitude towards the sponsoring brand and purchase intention towards
the sponsor‘s products, this item is particularly important to the research question. As
such, the item was retained for testing in the structural model.
In addition, the modification indices suggested that the model fit could be improved if
either of the items ‗I am interested in [sponsored property]‟ or ‗I am a strong supporter
of [sponsored property]‟ was removed from the scale. It was shown in section 5.5.1 that
there was high correlation between these items. Examination of the wording of these two
items suggests that the statements are capturing much of the same meaning i.e. the degree
to which a respondent is involved with the sponsored property. A review of the
Page 146
Consumer Response to Sponsorship Leveraged Packaging PhD Thesis Frances Woodside
134
correlation table indicated that the item „I am interested in [sponsored property]‟ showed
higher correlations with other items in the scale, than did the item „I am a strong
supporter of [sponsored property]‟. Therefore, in the interests of improving the model fit,
it was decided that the item ‗I am interested in [sponsored property]‟ would be removed
from the scale.
Overall model fit indices suggest that the final measurement model explains the data
reasonably well. Although the Chi Square statistic was significant, (χ2
=164.76, p = 0.00,
df = 84; bp = 0.003), the CMIN/DF (1.96) was below the suggested range of 2 – 5
indicating a very good fit to the model. The TLI statistic was over the 0.95 desired level,
the SRMR was well between the .05 and .08 accepted range, and an RMSEA statistic was
acceptable at 0.05 (Hu & Bentler 1999; Hulland et al. 1996). Composite reliabilities for
each construct exceeded 0.80, with the highest being for Sponsoring Brand Loyalty (α =
0.95) and the lowest being for Perceived Fit (α = 0.84). Therefore, the measurement
model was deemed acceptable. Fit statistics are shown in table 5.20.
Table 5.20 – Measures of Fit for the Four Factor Measurement Model
Initial Measurement
Model
Final Measurement
Model
Mardia’s coefficient 61.43 56.9
Standardised residuals above 2.57 two two
Chi Square χ2 =254.72, p = 0.00
df = 98 bp = 0.000
χ2 =164.76, p = 0.00
df = 84 bp = 0.003
CMIN/DF 2.59 1.96
TLI 0.93 0.96
SRMR 0.06 0.05
RMSEA 0.09 0.07
It is noted that in these analyses the fit indices in the majority of cases showed good or
reasonable fit. As χ2
has little power to detect a miss-specified model, particularly in cases
of non-normal data and small samples, the Bollen-Stine p statistic is a preferable statistic
to determine model fit (Mathieu et al. 1992). In each of the scales, with the exception of
the Four Factor CFA, the Bollen-Stine p was not significant, suggesting good model fit
for each of the four scales. In all cases the CMIN/DF was within the 2 – 5 range, which
is deemed to be acceptable for each scale. The TLI was within the suggested range (TLI
> 0.95) in each of the four scales.
Page 147
Consumer Response to Sponsorship Leveraged Packaging PhD Thesis Frances Woodside
135
The RMSEA for two of the scales (i.e. Sponsored Property Identification Scale &
Consumer Response to SLP scale) were within the acceptable range for mediocre fit
(between 0.6 and 1.00). However, the RMSEA for the Sponsoring Brand Loyalty scale
was outside the acceptable range for mediocre fit. As RMSEA has been found to over-
reject the true model in small samples such as is the case in the study, the RMSEA may
not be the most appropriate measure of fit in this instance (Hu & Bentler 1995).
The SRMR was acceptable for each of the four scales with SRMR statistics close to zero
indicating very good fit (Hu & Bentler 1995). In considering the non-normality of the
data, and the small sample size, the acceptable Bollen-Stine p, and the acceptable
CMIN/DF, TLI and SRMR indices suggest the measurement scales have reasonable fit to
the data. The poorer fit for the Four Factor Model can be explained by the two large
standardised residuals retained in the model with theoretical justification.
The exploratory factor analysis (EFA table 5.5) clearly identified factors associated with
Consumer Response to SLP, Sponsored Property Identification, Sponsoring Brand
Loyalty and Perceived Fit. Not all items in the exploratory factor analysis loaded on their
respective factors, but most did and the CFAs on each of the subscales supported the
overall factorial structure of the questionnaire, albeit with some items deleted. The
resulting reliability estimates for the subscales were all satisfactory.
Validity and Reliability
Having examined the measurement models for the four constructs, the reliability and
validity of the measures also needed consideration. Assessing the measurement model
has provided a confirmatory assessment of convergent validity and discriminant validity
by allowing examination of the correlations among the factors (Anderson & Gerbing
1988). The factor loadings on the scales met the test of both convergent and discriminant
validity.
Overall, the data suggested that evidence of validity and reliability for the survey scale
exists. The results suggested that the items used showed high internal consistency in
Page 148
Consumer Response to Sponsorship Leveraged Packaging PhD Thesis Frances Woodside
136
measuring the variables. For all four constructs, the indicators are sufficient in terms of
how the measurement model is specified (Hair et al. 1998; table 5.18). Assessing the
measurement model for each factor has provided a confirmatory assessment of
convergent validity and discriminant validity by allowing examination of the correlations
among the items for each scale.
The factor loadings on the four scales and the reported model fit indices, indicate that
each of the four scales met the test of both convergent validity and discriminant validity.
In addition, the internal consistency and reliability of the scales has been examined
through the use of Cronbach alpha, where all the scales exhibited alphas greater than 0.70
as recommended by Nunnally (1978). Having satisfied the measurement requirements,
the structural relationships of the variables were tested using structural equation
modeling. In this process the seven hypotheses proposed in section 3.6 will be tested.
5.6 Analysis of the Structural Models and Tests of Hypotheses
Now that the measures to be used in the conceptual models have been tested for their
validity and reliability, the specific research hypotheses and research models posed in
section 3.6 can be tested. As discussed in section 4.3.5, one approach to the treatment of
ordinal data sets is the parceling of items. This method reduces the degree of non-
normality in the data (such as is the case in this study) and increases the ratio of
parameters estimated to sample size. Given these advantages, item parceling was used in
the final measurement model. This section will commence with a review of the
descriptive statistics for the constructs in the model.
5.6.1 Descriptive Statistics
The summary statistics for each of the constructs in the model are reported in table 5.21.
The scales for each of the constructs are those reported from the previous section with
coefficient alphas, means and standard deviations. These scales used 5 point Likert
scales where a score of 1 indicated strong agreement, 3 indicated neutrality, and 5
indicated strong disagreement in the measure. These means and standard deviations
show no unexpected results in relation to the scales.
Page 149
Consumer Response to Sponsorship Leveraged Packaging PhD Thesis Frances Woodside
137
These results indicate that respondents generally considered themselves supporters of the
sponsored property (47% agreed/ 22% disagreed) and not loyal to the sponsoring brand
(mean of 3.27 where a score of 1 indicates high brand loyalty). When considering
Perceived Fit and Consumer Response to SLP, respondents indicated they agreed with
statements in the scales with means of 2.58 (CRSLP) and 2.81 (Perceived Fit) scale. The
next stage in the analysis was to explore the correlations between the constructs and
dependent variables.
Table 5.21 – Construct Descriptive Statistics
n = 201 α Mean Std. Deviation
*Sponsored Property Identification 0.884 2.94 0.787
*Sponsoring Brand Loyalty 0.949 3.27 0.906
*Consumer Response to SLP 0.892 2.58 0.850
*Perceived Fit 0.841 2.81 0.966
*The lower the mean the more the respondent indicated agreement with statements
5.6.2 Correlation Analysis
The next step in the analysis was to consider the correlations between the constructs. The
results show that Sponsored Property Identification is correlated with Consumer
Response to SLP. This is expected following the evidence provided in the literature and
in Study 1. Sponsoring Brand Loyalty is also correlated with Consumer Response to SLP,
although only slightly. This is not surprising given that Sponsoring Brand Loyalty was
proposed to have little impact on Consumer Response to SLP.
As can be seen in table 5.22, Sponsored Property Identification is correlated with
Perceived Fit and Consumer Response to Sponsorship Leveraged Packaging. Similarly,
Sponsoring Brand Loyalty is correlated with Perceived Fit and Consumer Response to
SLP. In addition, Perceived Fit is correlated with Consumer Response to SLP. This is
consistent with the literature, which suggests that Perceived Fit is extremely important in
predicting consumer response to sponsorship and logically is related to associations about
the brand and property. These results suggest that these measures are capturing the
dimensions of the constructs as intended. The correlations for all of the constructs are
consistent with the a priori assumptions and they reflect the expected pattern of
relationships amongst the variables in the study. Table 5.22 provides correlations
between the variables.
Page 150
Consumer Response to Sponsorship Leveraged Packaging PhD Thesis Frances Woodside
138
Table 5.22 – Correlation Table for Constructs in the Model
FIT SPI SBL CRSLP
Perceived Fit 1.00
Sponsored Property Identification 0.28 1.00
Sponsoring Brand Loyalty 0.25 0.00 1.00
Consumer Response to SLP 0.49 0.54 0.20 1.00
*Underlined correlations are significant at the 0.01 level (2 tailed).
5.6.3 Structural Equation Model Factors Impacting Consumer Response to SLP
The conceptual model of Factors Impacting Consumer Response to SLP using the four
measurement scales validated in the previous sections of this chapter was tested using
AMOS 16 (Arbuckle & Wothke, 2007). As discussed in section 4.3.5 in the interests of
increasing the stability of the data and reducing the degree of non-normality of the data,
item parceling was used in the final measurement model SEM.
The relationship between Sponsored Property Identification and Consumer Response to
SLP was significant (beta= 0.357; t=5.087; p<0.01). The relationship between Perceived
Fit and Consumer Response to SLP was significant (beta= 0.516; t=3.908; p=<0.01).
However, the relationship between Sponsoring Brand Loyalty and Consumer Response to
SLP was not significant (beta=0.131; t=1.605; p=.109).
These results indicate that consumer‘s identification with the sponsored property and the
perceived fit between the sponsored property and sponsoring brand are important factors
that influence Consumer Response to SLP. Thus, hypotheses 1 and 2 were supported.
However, the results also indicated that consumer‘s loyalty to the sponsoring brand had
little impact on their response to SLP, therefore Hypothesis 3 was not supported. The
structural model of Factors Impacting Consumer Response to SLP explained 43% of the
variance in the model. The SEM results for the conceptual model relating to the Factors
Impacting Consumer Response to SLP (Hypothesis 1-3) are shown in Figure 5.3. They
show that the variables Sponsored Property Identification, and Perceived Fit are
contributing significantly to the prediction of Consumer Response to SLP and the fit
statistics are indicative of a good fit (χ2(df 1) = 0.053, bp=.466; TLI = 1.02, RMSEA
0.00 and SRMR .02).
Page 151
Consumer Response to Sponsorship Leveraged Packaging PhD Thesis Frances Woodside
139
Figure 5.3 – Factors Impacting Consumer Response to SLP
*significant at 0.01 level
5.6.3.1 The Role of Perceived Fit in the Model
The role of Perceived Fit has been widely discussed in sponsorship literature with the
current debate reviewed in chapter 2 of this thesis (section 2.4.4). As discussed in this
section, Perceived Fit has been shown consistently to play an important role in relation to
consumer response to sponsorship. However whether this role is as a moderator or as a
mediator, or as an independent variable appears to be reliant on the combination of
variables in the study and there is no real consensus amongst the researchers in this field.
In addition to the importance of different variables in the models proposed to test
consumer response to sponsorship, the decision making context is also important. What
is known from prior research, is that consumers behave differently in low involvement
decision making contexts than they do in high involvement contexts (Summers et al.
2005). Further, there is also some evidence to suggest that the relationships between
variables in traditional models of marketing and consumer behavior change with different
levels of complexity and involvement by consumers (high versus low decision making
contexts) (Belch & Belch 2009). This led the researcher to question the roles of all
variables in the conceptual model during the exploratory phase of the research.
SPONSORED
PROPERTY
IDENTIFICATION
PERCEIVED
FIT
SPONSORING
BRAND
LOYALTY
CONSUMER
REPSPONSE
SLP
.35*
.51*
.13
Page 152
Consumer Response to Sponsorship Leveraged Packaging PhD Thesis Frances Woodside
140
Indeed, the exploratory results (reported in Chapter 3) supported this approach with a
number of the factors in the preliminary conceptual model being adapted (see section
3.8). In relation to Perceived Fit specifically, respondents indicated that they placed little
importance on the match between the sponsored property and sponsoring brand in their
decisions to purchase Fast Moving Consumer Goods. Further investigation suggested
that Perceived Fit appeared to be acting more as an independent variable in its own right
in this relationship in the low involvement decision making context than as a moderating
or mediating variable as suggested by some prior research.
Thus, the research model (figure 3.2) which was subsequently tested for this research
(and results reported in the previous section) placed the factor, Perceived Fit, in this role.
The results of the analysis (see previous section) also supported the placement of
Perceived Fit in the role of an Independent Variable (beta=0.516;t=3.908; p=<0.01) with
a positive influence on Consumer Response to SLP.
In spite of these findings and this theoretical reasoning, it was decided to perform a
statistical check of the role of Perceived Fit, in order to counter potential claims from
other researchers who may argue that the placement of Perceived Fit as an independent
variable was the result of serendipity rather than rigorous statistical testing and critical
theoretical analysis. Thus, a multi-group analysis was conducted in six stages as follows:
Step 1 - The variable Perceived Fit was removed as an independent variable.
Step 2 - As the Perceived Fit Scale had two items, it was necessary to sum the scores and
then average the scores. Based on this average score, the data were split into two files,
those with a score of 1 or 2 on the Perceived Fit (Group 1) and the second file, those with
a score between the range of 3 and 5 on the Perceived Fit Scale (Group 2).
Step 3 - Using a multi-group analysis with structural equation modeling, the two separate
files were identified and the appropriate files attached. The data analysis properties were
then specified to examine the five different models of: unconstrained, measurement
weights, structural weights, structural covariances, and structural residuals.
Page 153
Consumer Response to Sponsorship Leveraged Packaging PhD Thesis Frances Woodside
141
Step 4 - The SEM multi-group analysis was run and the results indicated that the models
fit the data well: unconstrained (bp=0.098), structural weights (bp=0.283), and structural
covariances (bp=0.072). However, the model for measurement residuals was significant
(bp=0.047), indicating that the residuals were not equal across the groups. Measures of fit
for the models are provided in Table 5.23 below.
Step 5 - It was discussed in section 5.5.5 that the Four Factor Measurement Model had a
number of large standardised residuals. The items associated with these large
standardised residuals were retained in the analysis of the model with theoretical
justification. However, it can be seen by the measurement residual model that the
standardised residuals were not equal across the groups. Therefore, the constraint on
measurement residuals was freed which enables the residuals to be calculated for each
group. The results of this test (bp=.098) indicate that the residuals are different for each
group.
Step 6 - The unstandardised regression weights were examined for both groups. The
results suggest that the positive relationship between Sponsored Property Identification
and Consumer Response to SLP is significant for Group 1 (beta 0.451; t= 3.896; p<0.01)
and also significant for Group 2 (beta=0.304; t=2.426; p=.015). However, the
relationship between Sponsoring Brand Loyalty was significant for Group 1 (beta =
0.138; t=1.366; p=.172), but not significant for Group 2 (beta=.138, t=1.366; p=.172).
These results confirm that Perceived Fit in this model of low involvement processing in
FMCG does act as a moderator in the relationship between Sponsoring Brand Loyalty
and Consumer Response to SLP. The regression coefficients, t values and p values are
provided in Table 5.24. However, when Perceived Fit is tested in the model as a
moderator, the overall variance accounted for is lower (35%) than when Perceived Fit is
tested as an independent variable (43%). Therefore, the pattern of relationships in the
model of Factors Impacting Consumer Response to SLP in a FMCG context is best
explained when Perceived Fit acts as an independent variable rather than as a moderator.
Following on from this analysis, the moderating hypotheses can now be tested and results
reported in the next section.
Page 154
Consumer Response to Sponsorship Leveraged Packaging PhD Thesis Frances Woodside
142
Table 5.23 – Measures of Model Fit – Multi-group Analysis Perceived Fit
Model Unconstrained Measurement
Weights
Structural
Weights
Structural
Covariances
Structural
Residuals
Bollen Stine p 0.463 0.098 0.098 0.283 0.072 0.047
CMIN/DF (1) 0.53 (2) 4.209 (2) 4.209 (4) 5.249 (6) 12.312 (7) 14.760
GFI 0.998 0.986 0.986 0.983 0.96 0.953
AGFI 0.989 0.918 0.918 0.949 0.919 0.920
TLI 1.022 0.857 0.857 0.960 0.864 0.856
RMSEA 0.000 0.075 0.075 0.040 .073 0.075
SRMR 0.023 0.006 0.006 0.030 0.046 0.043
Variance explained % 0.35 0.28 0.28 0.25 0.33 0.33
Table 5.24 – Regression Coefficients – Multi-group Analysis Perceived Fit
Unconstrained Measurement
Weights
Structural
Weights
Structural
Covariances
Structural
Residuals
Group 1 Est. t = p = Est. t = p = Est. t = p = Est. t = p = Est. t = p =
SPI CRSLP .451 3.89 ** .451 3.89 ** .451 7.11 *** .449 7.25 ** .449 7.17 **
SBL CRSLP .304 2.42 .015 .304 2.42 .015 .205 2.59 .009 .204 2.60 .009 .192 2.41 .016
Group 2
SPI CRSLP .442 5.86 ** .442 5.86 ** .451 7.11 *** .449 7.25 ** .449 7.17 **
SBL CRSLP .138 1.36 .172 .138 1.36 .172 .205 2.59 .009 .204 2.60 .009 .192 2.41 .016
** significant at 0.01
5.7 Moderating Hypotheses
In order to test the remaining hypotheses, a number of multi-group analyses were
conducted. These included comparing the Types of Sponsored Property, the Frequency of
Purchase of the sponsoring brand, awareness of the sponsored product, and respondent
characteristics to determine if there are differences between the groups. The hypothesis
tests for Type of Sponsored Property, Frequency of Purchase and Awareness of the
Sponsorship were tested using the same procedure previously outlined for the moderating
the role of Perceived Fit (see section 5.6.3.1). The moderating hypothesis for Respondent
Characteristics was tested using linear regression analysis to determine if Consumer
Response to SLP is related to the demographic characteristics of the respondents. Each
of these tests will be discussed in more detail.
Page 155
Consumer Response to Sponsorship Leveraged Packaging PhD Thesis Frances Woodside
143
5.7.1 Type of Sponsored Property
To determine the impact of the Type of Sponsored Property on Consumer Response to
SLP, the sample was divided into two groups. Group 1 comprised respondents who
completed questionnaire 1 where the sponsored property was that of Cricket Australia
sponsored by Sanitarium Weetbix. Group 2 comprised those respondents who completed
questionnaire 3 where the sponsored property was that of National Breast Cancer
Foundation sponsored by Sanitarium Light ‗n‘ Tasty. Group 1 consisted of 100
respondents and Group 2 consisted of 101 respondents. Following the same process
outlined in section 5.3.6.1, the type of sponsored property was subjected to a multi-group
analysis.
The results of the multi-group analysis for Type of Sponsored Property indicated that the
models fit the data well for the unconstrained (bp=0.466) and structural weights
(bp=0.644) models. However, the models for structural covariances (bp=0.072) and
measurement residuals were significant (bp=0.047), indicating that the covariances
residuals were not equal across the groups. Measures of fit for the models are provided in
Table 5.25.
Table 5.25 – Measures of Fit – Multi-group Analysis Type of Sponsored Property
Model Unconstrained Measurement
Weights
Structural
Weights
Structural
Covariances
Structural
Residuals
Bollen Stine p 0.466 0.644 0.644 0.200 0.023 0.032
CMIN/DF 2(df 1)
=0.053
2 (df 2)
=0.805
2 (df 2) =
0.805
2 (df 6) =
7.579
2 (df 10) =
23.08
2 (df 11) =
23.09
GFI 0.999 0.998 0.998 0.981 0.947 0.947
AGFI 0.987 0.980 0.980 0.925 0.893 0.903
TLI 1.02 1.059 1.059 0.949 0.871 0.892
RMSEA 0.000 0.000 0.000 0.051 0.081 0..074
SRMR 0.0196 0.0264 0.0265 0.0549 0.0606 0.0603
Variance explained % 0.43 0.45 0.45 0.46 0.41 0.41
The constraints on the covariances and measurement residuals were freed which enabled
the residuals to be calculated for each group. The results of this test (structural
covariances bp=.644; structural residuals bp=0.032) indicated that the covariances and
residuals are different for each group. Table 5.26 provides details of the measures of fit.
Page 156
Consumer Response to Sponsorship Leveraged Packaging PhD Thesis Frances Woodside
144
Table 5.26 – Measures of Fit Constraints freed – Type of Sponsored Property
Model Unconstrained Measurement
Weights
Structural
Weights
Structural
Covariances
Structural
Residuals
Bollen Stine p 0.466 0.644 0.644 0.200 0.644 0.644
CMIN/DF 2(df 1)
=0.053
2 (df 2)
=0.805
2 (df 2) =
0.805
2 (df 6) =
7.579
2 (df 2) =
0.805
2 (df 2 ) =
0.805
GFI 0.999 0.998 0.998 0.981 0.998 0.998
AGFI 0.987 0.980 0.980 0.925 0.980 0.989
TLI 1.02 1.059 1.059 0.949 1.059 1.059
RMSEA 0.000 0.000 0.000 0.051 0.000 0.000
SRMR 0.019 0.026 0.026 0.055 0.026 0.026
Variance explained % 0.43 0.45 0.45 0.46 0.41 0.41
The p values and unstandardised regression weights were examined for both groups and
the results suggested that the positive relationship between Sponsored Property
Identification and Consumer Response to SLP is significant for both groups (Group 1
b=0.337, p=0.01) (Group 2 b=0.337, p=0.15). Similarly, the relationship between
Perceived Fit and Consumer Response to SLP was significant for both groups (Group 1
b=0.509, p<0.01) (Group 2 b=0.502, p=0.45). However the relationship between
Sponsoring Brand Loyalty and Consumer Response was significant only for Group 2
(beta=0.372; t=2.710; p=0.007) (Group 1 beta=-0.023; t=-0.288; p=0.820).
This inverse relationship between these variables indicates that in the case of a sport
related sponsorship, loyalty to the sponsoring brand has little impact on Consumer
Response to SLP. Alternatively, in the case of cause related sponsorship, loyalty to the
sponsoring brand does impact Consumer Response to SLP. Furthermore, the impact of
Sponsoring Brand Loyalty had as much impact on Consumer Response (b=0.372) as the
consumers identification with the cause (b=0.337). This suggests a heightened
importance for the sponsoring brand itself when it is associated with a cause. The
regression coefficients, t values and p values are provided in Table 5.27.
Page 157
Consumer Response to Sponsorship Leveraged Packaging PhD Thesis Frances Woodside
145
Table 5.27 Regression Coefficients Multi-group Analysis Type of Sponsored Property
Unconstrained Measurement
Weights
Structural
Weights
Structural
Covariances
Structural
Residuals
Est. t = p = Est. t = p = Est. t = p = Est. t = p = Est. t = p =
Group 1 SPI CRSLP .377 4.263 ** ..377 4.263 ** .358 4.763 ** .36 4.77 ** .360 3.86 **
SBL CRSLP -.023 -.288 .820 -.023 -.288 .820 .128 1.555 .120 .133 1.61 .106 .131 1.59 .110
FIT CRSLP .509 3..32 ** .509 3..32 ** ..523 3.967 ** .514 3.86 ** .515 3.86 **
Group 2
SPI CRSLP .337 2.424 .015 .337 2.424 .015 ..358 3.967 .120 .36 4.77 .106 .360 4.77 **
SBL CRSLP .372 2.710 .007 .372 2.710 .007 .128 4.763 ** .133 1.61 ** .131 1.59 **
FIT CRSLP .502 2.001 .045 .502 2.001 .045 .523 1.555 ** .514 3.86 ** .515 3.86 .110
** significant at 0.01
This provides evidence that the Type of Sponsored Property (a cause or a sport in the
case of this research) moderates the relationship between Sponsoring Brand Loyalty and
Consumer Response to SLP. Thus, the results of this analysis show that in a FMCG
context, consumer response to SLP in the case of sponsorship of a cause comes from a
combination of the consumer‘s loyalty to the sponsoring brand, the perceived match
between the sponsoring brand and sponsored cause and identification with the sponsored
property. Whereas in the case of sponsorship of sport, consumer response comes from a
combination of the consumer‘s perception of match between the sponsoring brand and
sponsored cause as well as the consumer‘s identification with the sponsored sport.
Therefore, H5 was supported.
5.7.2 Prior Awareness of Sponsorship
To determine the impact of Awareness of Sponsorship on Consumer Response to SLP,
the sample was divided into two groups. Group 1 comprised respondents who indicated
they were aware of the selected sponsorship and Group 2 comprised the respondents who
indicated they were not aware of the selected sponsorship. Group 1 consisted of 66
respondents (33% of the sample) and Group 2 consisted of 135 respondents (67% of the
sample). The results of the multi-group analysis for Awareness of the Sponsorship,
indicated that the models fit the data well for the unconstrained (bp=0.956), structural
weights (bp=0.960) structural covariances (bp=0.825) and measurement residuals models
(bp=0.857), indicating support for both configural invariance and metric invariance.
Measures of fit for the models are provided in Table 5.28.
Page 158
Consumer Response to Sponsorship Leveraged Packaging PhD Thesis Frances Woodside
146
Table 5.28 – Measures of Fit – Awareness of the Sponsorship
Model Unconstrained Measurement
Weights
Structural
Weights
Structural
Covariances
Structural
Residuals
Bollen Stine p 0.466 0.956 0.956 0.960 0.825 0.857
CMIN/DF 2(df 1)
=0.053
2 (df 2)
=0.82
2 (df 2)
=0.82
2 (df 5)
=1.11
2 (df 10)
= 6.75
2 (df 11)
= 6.82
GFI 0.999 1.00 1.00 0.997 0.982 0..982
AGFI 0.987 0.998 0.998 0.989 0.966 0.967
TLI 1.02 1.096 1.096 0.107 1.033 1.038
RMSEA 0.00 0.000 0.000 0.000 0.000 0.000
SRMR 0.02 0.011 0.011 0.022 0.025 0.025
Variance explained % 0.43 0.40 0.40 0.44 0.41 0.42
The p values and unstandardised regression weights were examined for both groups. The
results suggest that there was no difference between the groups for the relationship
between Sponsored Property Identification and Consumer Response to SLP (Group 1
b=0.310, p=.019) (Group 2 b=0.405, p<0.01). The relationship was significant for both
groups. Similarly, there results suggest that there was no difference between the groups
for the relationship between Sponsoring Brand Loyalty and Consumer Response (Group
1 b=0.177, p=.178) (Group 2 b=0.082, p=0.447). The relationship was not significant for
both groups. However, the relationship between Perceived Fit and Consumer Response
to SLP was significant for Group 2 (b=0.499, t=3.109; p=.002) but not significant for
Group 1 (b=0.490; t=1.687; p=.092). Table 2.67 provides the regression coefficients for
these relationships.
This indicates that for consumers who were not aware of the sponsorship prior to
participating in this study, the perceived fit between the sponsoring brand and sponsored
property had a much bigger impact on Consumer Response to SLP, than for those
consumers who were aware of the sponsorship. Thus, Awareness plays a moderating role
the relationship between Perceived Fit and Consumer Response to SLP. Therefore, H6
was supported.
However, it should be noted that this sample size comes close to violating a principal
assumption in SEM. It has been proposed that an optimal ratio of the number of
participants to number of parameters to be estimated should be between 10:1 and 20:1,
Page 159
Consumer Response to Sponsorship Leveraged Packaging PhD Thesis Frances Woodside
147
with a ratio of less than 5:1 indicating that the parameter estimates may be unstable
(Kline 1998). Group 1 for this study had a ratio of 66:9, which equates to roughly 7:1.
Therefore, these results need to be interpreted with caution as the small group size may
have influenced the parameter estimates and therefore the measures of fit have a higher
chance of being serendipitous rather than a result of statistical significance.
Future research needs to consider this relationship further, with careful consideration
given to the sampling frame to ensure sufficient responses are collected from people who
were aware of the sponsorship prior to the study to allow a ratio of between 10:1 and
20:1. The regression coefficients, t values and p values for the multi-group analysis of
frequency of purchase are provided in Table 5.29.
Table 5.29 – Regression Coefficients –Awareness of the Sponsorship
Unconstrained Measurement
Weights
Structural
Weights
Structural
Covariances
Structural
Residuals
Est. t = p = Est. t = p = Est. T = p = Est. t = p = Est. t = p =
Group 1 SPI CRSLP .310 2.353 .019 .310 2.353 .019 ..368 4.983 ** .368 4.98 ** .367 4.97 **
SBL CRSLP .177 1.347 .178 .177 1.347 .178 .122 1.463 .144 .121 1.46 .144 .123 1.47 .140
FIT CRSLP .490 1.687 .092 .490 1.687 .092 .496 3.527 ** .496 3.51 ** .495 3.50 **
Group 2
SPI CRSLP .405 4.473 ** .405 4.473 ** ..368 4.983 ** ..36 4.98 ** ..367 4.97 **
SBL CRSLP .082 .760 .447 .082 .760 .447 .122 1.463 .144 .121 1.46 .144 .123 1.47 .140
FIT CRSLP .499 3.109 .002 .499 3.109 .002 .496 3.527 ** .496 3.51 ** .495 3.50 **
** significant at 0.01
5.7.3 Frequency of Purchase
To determine the impact of Frequency of Purchase of the sponsoring brand on Consumer
Response to SLP, the sample was divided into two groups. Group 1 comprised
respondents who indicated they regularly purchased the sponsoring brand (weekly,
fortnightly or monthly) (frequent purchasers) and Group 2 comprised those respondents
who either occasionally purchased the sponsored brand or did not purchase the
sponsoring brand (non-frequent purchasers). Group 1 consisted of 41 respondents (20%
of the sample) and group 2 consisted of 160 respondents (80% of the sample).
The results of the multi-group analysis for Frequency of Purchase, indicated that the
models fit the data well for the unconstrained (bp=0.728), structural weights (bp=0.475)
Page 160
Consumer Response to Sponsorship Leveraged Packaging PhD Thesis Frances Woodside
148
structural covariances (bp=0.291) and measurement residuals models (bp=0.330),
indicating support for both configural invariance and metric invariance. Measures of fit
for the models are provided in Table 5.30.
Table 5.30 – Measures of Fit – Multi-group Analysis Frequency of Purchase
Model Unconstrained Measurement
Weights
Structural
Weights
Structural
Covariances
Structural
Residuals
Bollen Stine p 0.466 0.728 0.728 0.475 0.291 0.330
CMIN/DF 2(df 1)
=0.053
2 (df 2)
=0.667
2 (df 2)
=0.667
2 (df 5) =
4.700
2 (df 10) =
13.71
2 (df 11)
=13.96
GFI 0.999 0.998 0.998 0.989 0.966 0.966
AGFI 0.987 0.983 0.983 0.956 0.930 0.937
TLI 1.02 1.062 1.062 1.006 0.965 0.975
RMSEA 0.000 0.000 0.000 0.000 0.043 0.037
SRMR 0.019 0.052 0.052 0.056 0.125 0.130
Variance explained% 0.43 0.37 0.37 0.39 0.42 0.42
The p value and unstandardised regression weights were examined for both groups. The
results suggest that the positive relationship between Sponsored Property Identification
and Consumer Response to SLP is significant for both groups, (Group 1 b=0.361,
p<0.01) (Group 2 b=0.361, p<0.01). The relationship between Sponsoring Brand Loyalty
and Consumer Response was not significant for both groups (Group 1 b=0.108, p=0.249)
(Group 2 b=0.108, p=0.249). The relationship between Perceived Fit and Consumer
Response to SLP was also significant for the both groups (Group 1 b=0.519, p=<0.01)
(Group 2 b=0.519, p=<0.01).
These results indicate the Frequency of Purchase of the sponsoring brand does not
moderate any of the relationships in the model. This indicates that in a FMCG context,
whether a person frequently uses the sponsoring brand or not has little impact on
Consumer Response to SLP. Therefore, H7 was not supported.
However, it should be noted that this sample size comes close to violating a principal
assumption in SEM. As mentioned in the previous section, the optimal ratio of the
number of participants to number of parameters to be estimated should be between 10:1
and 20:1, with a ratio of less than 5:1 indicating that the parameter estimates can be
unstable (Kline 1998). Group 1 for this study had a ratio of 44:9, which equates to
Page 161
Consumer Response to Sponsorship Leveraged Packaging PhD Thesis Frances Woodside
149
roughly 5:1. Therefore, these results need to be interpreted with caution as the small
group size may have influenced the parameter estimates and impact the reliability of the
fit indices. Future research needs to consider this relationship further, with careful
consideration given to the sampling frame to ensure sufficient respondents were sampled
who frequently purchased the product to allow a ratio of between 10:1 and 20:1. The
regression coefficients, t values and p values are provided in Table 5.31 below.
Table 5.31 – Regression Coefficients – Frequency of Purchase
Unconstrained Measurement
Weights
Structural
Weights
Structural
Covariances
Structural
Residuals
Est. t = p = Est. t = p = Est. t = p = Est. t = p = Est. t = p =
Group 1 SPI CRSLP .361 5.106 ** .361 5.106 ** .352 4.961 ** .350 5.08 ** .361 5.10 **
SBL CRSLP .108 1.152 .249 .108 1.152 .249 .090 .970 .332 .098 1.04 .296 .108 1.15 .249
FIT CRSLP .519 3.916 ** .519 3.916 ** .556 4.267 ** .532 4.01 ** .519 3.91 **
Group 2
SPI CRSLP .361 5.106 ** .361 5.106 ** .352 4.961 ** .350 5.08 ** .361 5.10 **
SBL CRSLP .108 1.152 .249 .108 1.152 .249 .090 .970 .332 .098 1.04 .296 .108 1.15 .249
FIT CRSLP .519 3.916 ** .519 3.916 ** .556 4.267 ** .532 4.01 ** .519 3.91 **
** significant at 0.01
Trial Intention In order to determine intention to trial the sponsored product, the sample
was sorted into respondents who had indicated that they either purchase the product
(weekly, fortnightly, monthly or occasionally) or do not purchase the product. A
frequency count showed that 48% of the sample had not previously bought the
sponsoring brand‘s product (n= 99). Of those respondents who had not previously
bought the sponsoring brand‘s product, 15% (n=15) indicated they would be likely to
purchase the sponsored product following their exposure to the SLP.
A MANOVER test was performed to determine if there was a significant difference
between the respondents who currently purchase the sponsoring brand (either regularly or
occasionally) and respondents who did not purchase at all and their purchase intentions
toward the sponsored product as a result of the SLP they were exposed to. The results
indicated that there was a significant difference between those who do purchase the brand
and those who do not (p=0.00).
Page 162
Consumer Response to Sponsorship Leveraged Packaging PhD Thesis Frances Woodside
150
These findings suggest that a small percentage of respondents, who do not normally
purchase the sponsoring brand, indicated that they would be likely to purchase the
sponsored product following exposure to the SLP on that product. These results are
worthy of interest (even if the numbers are low) as this supports the theoretical notion of
sponsorship, and SLP in particular, being capable of inducing trial in consumers.
5.7.4 Demographic Groups
To determine if any individual respondent characteristics influenced Consumer Response
to SLP in this study, tests of difference were carried out for each of age, income and
household status (whether children lived at home). The results of these tests showed that
there were no significant differences between the different income groups for any of the
variables in the model. However significant differences did exist between gender, age
and household status and the variables in the model. Each of these are now discussed.
Significant differences existed between the males and females in their response to SLP in
this study, particularly for the variable ‗This sponsorship improves my perception of
[sponsored property]‟ (p = 0.046). Females had a lower mean (mean= 2.98), than males
(mean= 3.37) (where a score of 1 = strongly agree) indicating that females were neutral
about this statement whereas males disagreed with the statement. The linear regression
results showed that respondent gender was positively related to the attitude toward the
sponsor variable „This sponsorship improves my perception of [sponsored property]‟
(beta = 0.141; p = 0.046). These results indicate that females were more likely to have
improved attitude toward the sponsor because of seeing the SLP and thus were more
likely to be influenced by sponsor messages on FMCG, than were males in this study.
Significant differences also existed between the various age groups in this study,
particularly for the variable ‗I think it is good that companies sponsor [Cricket Australia/
Breast Cancer Foundation]‟ (p = 0.00). This item formed part of the Sponsored Property
Identification scale, and when age was regressed onto this scale, there was a positive
relationship (beta = 0.23; p = 0.00). These results show that the age group 25-36 years
had a lower mean than the other age groups, which suggests that those in this age group
were more likely to support sponsorship of a favourite property than other age groups.
Page 163
Consumer Response to Sponsorship Leveraged Packaging PhD Thesis Frances Woodside
151
There were also significant differences for households with children for the variables, ‗I
think it is good that companies sponsor [sponsored property]‘ (p = 0.000); and ‗I am
more likely to purchase products of companies that sponsor [sponsored property]‘ (p=
0.038). These items formed part of the Sponsored Property Identification scale and
subsequent regression analysis showed a positive relationship between this scale and
household status (beta = 0.226; p = 0.001). Means and standard deviations are included in
Table 5.28. These findings indicate that families with children at home are likely to have
more strongly felt Sponsored Property Identification than families without children at
home.
These findings provide support that respondent characteristics impact Consumer
Response to SLP. In particular, it was found that gender impacts the consumer‘s attitude
toward the sponsoring brand. Furthermore, age and household status impacts consumer‘s
Sponsored Property Identification. Therefore, H8 was supported.
Table 5.32 – Moderating Hypotheses – Respondent Characteristics
Variable Group Mean SD B P
This sponsorship improves my perception of
[sponsored property]
Female 2.98 0.96 0.14 0.05
Male 3.37 1.02
I think it is good that companies sponsor [sponsored
property]
18-25 years 2.62 0.98 - 0.002
26-35 years 1.79 0.81
36-50 years 2.30 1.07
51-65 years 2.25 0.58
over 65 years 2.50 1.01
Sponsored Property Identification
18-25 years 2.84 0.92
0.23
0.00 26-35 years 2.42 0.95
36-50 years 2.94 0.88
51-65 years 2.87 1.19
over 65 years 3.75 0.96
If a company sponsored [sponsored property], it would
positively influence how I felt about that company
Children 2.81 1.05 0.21 0.00
No Children 3.34 1.04
I am more likely to purchase products of companies
that sponsor [sponsored property]
Children 2.88 1.05 0.15 0.04
No Children 3.24 1.04
Figure 5.4 shows the final model of Factors Impacting Consumer Response to SLP
including moderating variables of age, gender, household status, type of sponsored
property, frequency of purchase and awareness of the sponsorship.
Page 164
Consumer Response to Sponsorship Leveraged Packaging PhD Thesis Frances Woodside
152
Figure 5.4 – Final Model of Factors Impacting Consumer Response to SLP
5.8 Conclusions
This chapter reported the results of the data analysis for the major study of this thesis.
The chapter commenced with a revision of the conceptual model and hypotheses that
were put forward at the conclusion of the exploratory research (Chapter 3). The chapter
then presented a profile of sample respondents, confirming that the sample was
sufficiently representative of Australian household shoppers. Next, a preliminary
analysis of the data set was conducted to ensure that it was clean and that any outliers or
missing values were noted and dealt with according to the data analysis guidelines
discussed in Chapter 4. The few outliers that were identified were examined and retained
as being legitimate responses. The data were tested for normality and descriptive
statistics were examined. The data were identified as being non-normal and hence
maximum likelihood estimation techniques were adopted for the more detailed data
analysis stage. The descriptive statistics and the correlation matrices showed no
unexpected results.
The next stage of the data analysis used three distinct methods. Firstly, the measurement
models underlying the conceptual model were tested and validated. This analysis began
SPONSORED
PROPERTY
IDENTIFICATION
PERCEIVED
FIT
SPONSORING
BRAND
LOYALTY
CONSUMER
REPSPONSE
SLP
Type of
Sponsored
Property
Age
Household
Status
Awareness
Gender
Positive impact
Inverse impact
Page 165
Consumer Response to Sponsorship Leveraged Packaging PhD Thesis Frances Woodside
153
with an exploratory factor analysis to examine the underlying factor structures of all the
variables and followed by confirmatory factor analysis using structural equation
modeling to validate and confirm the factor structures. The second stage of the testing
examined the structural models hypothesised to impact Consumer Response to SLP.
Structural equation modeling was used to test the factors impacting Consumer Response
to SLP model, and multiple regression was used to test the moderating hypotheses.
The analysis suggested that when a respondent was highly involved with the sponsoring
property, there was positive impact on Consumer Response to SLP. Furthermore, when
the respondent perceived a match between the sponsoring brand and sponsored property,
there was a positive impact on Consumer Response. These relationships were moderated
by awareness of the sponsorship, the type of sponsored property and the demographic
characteristics of the respondent. Specific hypotheses tested in this chapter through the
structural equation analysis and multiple regression are summarised in table 5.29. The
implications of these will be discussed in the next chapter.
Table 5.33 – Results of Hypotheses Tests 1 – 8
H1 That there is a positive relationship between sponsored property identification and
consumer response to SLP. That is: as the degree of sponsored property
identification increases, there will be a positive impact on consumer response to
SLP
SUPPORTED
H2 That there is a positive relationship between perceived fit and consumer response
to sponsorship leveraged packaging. That is: as the degree of perceived fit
increases, there will be a positive impact on consumer response to SLP.
SUPPORTED
H3 That there is a negative relationship between sponsoring brand loyalty and consumer
response to SLP. That is: in cases of low sponsoring brand loyalty, there will be a
positive impact on consumer response to SLP.
NOT
SUPPORTED
H4 That consumer response to SLP is moderated by perceived fit. That is there will be
a difference in consumer response depending on the extent of perceived fit.
SUPPORTED
H5 That consumer response to SLP is moderated by type of sponsored property. That
is there will be a difference in consumer response depending on the type of
sponsored property.
SUPPORTED
H6 That consumer response to SLP is moderated by awareness of the sponsorship.
That is in cases where the respondent is aware of the sponsorship; there will be a
positive impact on Consumer Response to SLP.
SUPPORTED
H7 That consumer response to SLP is moderated by frequency of purchase of the
sponsoring brand. That is in cases where the respondent frequently purchases the
sponsoring brand; there will be a positive impact on Consumer Response to SLP
NOT
SUPPORTED
H8 That consumer response to SLP is moderated by respondent characteristics. That
is consumer response to SLP will vary depending on age, income, household
status & respondent gender.
SUPPORTED
Page 166
Consumer Response to Sponsorship Leveraged Packaging PhD Thesis Frances Woodside
154
Chapter 6
6.1 Introduction
The previous chapter reported the results of the analysis of data gathered for the major
study of this thesis. This chapter will draw conclusions and implications based on these
results.
This chapter has six sections as shown in figure 6.1. It will begin by summarizing the
earlier stages of the research (section 6.1). The conclusions regarding the hypotheses
tested in Chapter 5 will then follow in section 6.2 with conclusions relating to the
research aim in section 6.3. Following this, conclusions and implications for theory
(section 6.4) and for practice (section 6.5) will be presented. Finally, limitations of the
research will be addressed and future research directions will be proposed (section 6.6).
Figure 6.1 – Chapter Outline
6.1 Introduction
6.4 Implications for theory
6.6 Limitations and Future Research
6.5 Implications for practice
6.3 Conclusions regarding the research aim
6.2 Conclusion regarding each hypothesis Communications
Page 167
Consumer Response to Sponsorship Leveraged Packaging PhD Thesis Frances Woodside
155
The purpose of this program of research was to develop and test a model of factors
proposed to impact consumer response to sponsorship leveraged packaging, specifically
addressing the roles of Sponsored Property Identification, Sponsoring Brand Loyalty,
Perceived Fit and Type of Sponsored Property.
Specific objectives addressed in this program of research were:
1. to determine the factors that impact consumer response to sponsorship leveraged
packaging in a FMCG context
2. to develop and test a structural model that describes the network of relations among
these variables.
In Chapter 1, the research objectives were outlined in section 1.2 and a brief discussion of
the increasing economic and marketing importance of sponsorship was presented to set
the scene for this research. The importance and justification for the research was
discussed in terms of the lack of prior research in the area of consumer behaviour relating
to sponsorship generally, and in terms of Australian fast moving consumer goods
specifically (section 1.3). A three-stage research design was proposed to be the most
suitable to address the research purpose (section 1.4). These stages consisted of: 1) a
literature review; 2) exploratory research comprising focus groups, in-depth interviews
and a qualitative study; and 3) a major study with data gathered in the form of a self-
administered questionnaire (section 1.4.3). The scope of the thesis was limited to
Australian consumers who were responsible for the household shopping.
Following this, Chapter 2 reviewed the literature relating to the research objectives and
identified gaps in the theory. This chapter commenced with an introduction of the
marketing communications literature (section 2.2) and then moved onto a discussion of
the definition and application of sponsorship (section 2.3). The theoretical foundation for
the research was then outlined, particularly considering low level processing (given the
FMCG context) and brand image transfer. Two key constructs relevant to sponsorship
were also introduced in this section: Sponsored Property Identification and Perceived Fit
(section 2.4). The combined discipline areas of sponsorship leveraging and packaging
were then discussed to justify their relevance in marketing communications (section 2.5).
Page 168
Consumer Response to Sponsorship Leveraged Packaging PhD Thesis Frances Woodside
156
Following this, a review of the consumer behaviour literature was conducted including
justification of the constructs to be examined in this program of research (section 2.6).
Key findings from the literature that related to the research purpose were developed into a
number of propositions and into a conceptual model (section 2.7).
Chapter 3 presented the methodology and results of Study 1, which was designed to
inform the theory generation process, to assist in the identification of constructs and the
development and purification of measures. The chapter commenced with a discussion of
the theoretical foundation and relevant research paradigm (section 3.2). This was
followed by a discussion of the rationale for the exploratory research (section 3.3) before
moving into an outline and discussion of the methodological issues involved in this study.
The results were then presented (section 3.4) for the focus groups, in-depth interviews
and the qualitative survey. A discussion of the findings (section 3.5) was presented,
together with hypotheses and a revised conceptual model (section 3.6). Conclusions for
the chapter were then drawn (section 3.7).
Chapter 4 presented the rationale for the methodology chosen for the main study (section
4.2). As part of this discussion of the research design (section 4.3), the experimental
design (section 4.3.1), the questionnaire design and administration (section 4.3.2), the
sampling strategy (section 4.3.3), ethical consideration (section 4.3.4) and the data
analysis strategies were detailed (section 4.3.5). Conclusions for the chapter were
presented which summarized the methodological approach taken (section 4.4).
Chapter 5 reported the results from the analysis of data from Study 2. The chapter
commenced with a discussion of the results of Study 2 in relation to the hypotheses and
conceptual model proposed at the conclusion of Study 1, the exploratory study (section
5.2). From this, a profile and analysis of respondents was presented in section 5.3. The
results of the preliminary analysis including details of data cleaning and screening,
descriptive research and correlations were presented in section 5.4. Next, the conceptual
model was tested in three stages. Section 5.5 detailed the testing of the measurement
model with the scales used to measure the four constructs validated with both exploratory
Page 169
Consumer Response to Sponsorship Leveraged Packaging PhD Thesis Frances Woodside
157
and then confirmatory factor analysis. Section 5.6 detailed the testing of the structural
portion of the model and the first three hypotheses proposed. Finally, in section 5.7
moderating hypotheses were tested using tests of multi-group analysis and multiple
regression. The chapter concluded with a discussion of the findings (section 5.8) and
figures and tables were used to present the data.
In this chapter, conclusions will be drawn for each of the hypotheses and for the research
aims (section 6.2). The findings from Chapter 5 will be compared to the literature with
particular reference made to the contributions of the research in understanding the
research purpose (section 6.3). The chapter concludes with implications of the findings
for theory (section 6.4) and practice (section 6.5) followed by a discussion of the
limitations of the study and implications for future research (section 6.6)
6.2 Implications of Results of Study 2
This study was conducted to examine the Factors Impacting Consumer Response to SLP
and to develop a structural model, which would explain the relationships among
Sponsored Property Identification, Sponsoring Brand Loyalty, Perceived Fit and
Consumer Response to SLP. Results of the structural equation analysis generally support
the hypothesized relationships. Table 6.1 provides a summary of the hypotheses results.
Table 6.1 – Results of Hypotheses Tests 1 - 8
H1 That there is a positive relationship between sponsored property identification
and consumer response to SLP. That is: as the degree of sponsored property
identification increases, there will be a positive impact on consumer response to
SLP
SUPPORTED
H2 That there is a positive relationship between perceived fit and consumer
response to sponsorship leveraged packaging. That is: as the degree of
perceived fit increases, there will be a positive impact on consumer response to
SLP.
SUPPORTED
H3 That there is a negative relationship between sponsoring brand loyalty and
consumer response to SLP. That is: in cases of low sponsoring brand loyalty, there
will be a positive impact on consumer response to SLP.
NOT
SUPPORTED
H4 That consumer response to SLP is moderated by perceived fit. That is there will
be a difference in consumer response depending on the extent of perceived fit.
SUPPORTED
H5 That consumer response to SLP is moderated by type of sponsored property.
That is there will be a difference in consumer response depending on the type
of sponsored property.
SUPPORTED
Page 170
Consumer Response to Sponsorship Leveraged Packaging PhD Thesis Frances Woodside
158
H6 That consumer response to SLP is moderated by awareness of the sponsorship.
That is in cases where the respondent is aware of the sponsorship; there will be
a positive impact on Consumer Response to SLP.
SUPPORTED
H7 That consumer response to SLP is moderated by frequency of purchase of the
sponsoring brand. That is in cases where the respondent frequently purchases the
sponsoring brand; there will be a positive impact on Consumer Response to SLP
NOT
SUPPORTED
H8 That consumer response to SLP is moderated by respondent characteristics.
That is consumer response to SLP will vary depending on age, income,
household status & respondent gender.
SUPPORTED
Conclusions regarding each of these hypotheses will now be drawn by briefly
summarising the results of each hypothesis and explaining these results in relation to
earlier findings from stages one and two of the research.
Sponsored Property Identification - Hypothesis 1
The results from this study indicate that consumers who identify highly with a sponsored
property are likely to report greater response to the Sponsorship Leveraged Packaging
than consumers who did not identify with the sponsored property. Specifically, this
research identified a positive relationship between Sponsored Property Identification and
Consumer Response to SLP. This indicates that SLP, particularly in a FMCG context, has
the capacity to influence consumer response towards the sponsoring brand when
sponsored property identification is high. This finding is consistent with previous studies
that indicate that when consumers are emotionally involved with a sponsored property
and identify with it, this can lead to a strong sense of attachment with related sponsored
brands (Sirgy et al. 2007; Gwinner and Swanson 2003; Gwinner and Eaton 1999;
Madrigal 2000; Meenaghan 1991, 2001).
This finding is also consistent with previous studies generally conducted in high
involvement product contexts (Gwinner & Swanson 2003; Smith et al. 2008; Lardinoit &
Derbaix 2001; McDaniel 1999; Madrigal, 2000; Cornwell & Coote 2005). The results of
this study provide evidence that a consumer‘s identification with a favoured property
plays an important role in consumer response to SLP, even in a FMCG context. This
finding then, when combined with findings from previous sponsorship studies, indicates
that sponsored property identification is likely to impact consumer response to a
sponsorship regardless of the level and intensity of the decision-making context.
Page 171
Consumer Response to Sponsorship Leveraged Packaging PhD Thesis Frances Woodside
159
These findings lend considerable support to the process of Brand Image Transfer outlined
by authors such as Grohs and Gwinner in a number of studies (Grohs et al. 2004; Grohs
& Reisinger 2005; Gwinner & Eaton 1999; Gwinner & Swanson 2003). The Brand
Image Transfer Process discussed in these studies, suggest that favorable attitudes toward
a sponsored property can transfer to a sponsoring brand with little cognitive elaboration
(Pracejus 2004). The results of this study show that communication of the sponsorship
arrangement via product packaging under low involvement conditions, can lead to
improved consumer response. Although brand image was not specifically tested in this
study, the findings still provide some evidence of the Brand Image Transfer Process, in
particular, with little cognitive elaboration, as is the case in a FMCG context. Future
research should also examine brand image (and the associated brand image transfer) as a
consumer response to SLP to confirm these speculations (see section 6.6 Limitations and
Future Research).
Sponsoring Brand Loyalty - Hypothesis 3
This finding that loyalty to the sponsoring brand has little impact on consumer response
to SLP (except in the case of cause related sponsorship), is in contrast to the majority of
previous sponsorship research suggesting that positive attitudes toward a sponsor are
associated with favourable perceptions and intentions to purchase a sponsor‘s product
(Smith et al. 2008; Pope & Voges, 1999; Speed and Thompson 2000). The literature
reported in Chapter 2 suggests that attitudes and opinions are important precursors to
behavioral intentions in general, yet authors have found that particularly in FMCG,
positive opinions about the brand have a weak or limited impact on purchase intentions of
the sponsor‘s brand (Hoek 1999; Lacey et al. 2007). This would suggest that although
sponsorship can reinforce beliefs already held by consumers, it is unlikely to instill new
beliefs and it is even less likely to induce entirely new behaviour patterns in the context
of low involvement decision making and FMCG.
It was hypothesized that loyalty to the sponsoring brand would result in consumers
devoting little cognitive effort in processing SLP and as a result, there would be no
change in consumer response as a result of exposure to SLP. This proposition was
Page 172
Consumer Response to Sponsorship Leveraged Packaging PhD Thesis Frances Woodside
160
developed from Study 1 where focus group respondents indicated that their purchase
decision in an FMCG context was particularly dependent on how loyal they were to the
brands involved. In the exploratory research, respondents indicated that where they were
loyal to a brand, little time would be spent in making purchase decisions and that
alternative brands would be were given little or no consideration regardless of marketing
communications on SLP.
The results of this study, confirmed generally that loyalty to the sponsoring brand had
little influence on consumer response to SLP, in this FMCG context. However, this
relationship was shown (in the moderating hypothesis) to vary depending on a number of
conditions. These are discussed further in Hypotheses 4 – 8.
In this study, whilst there was some impact from the independent variables on Consumer
Response to SLP, the majority of this impact came from sponsored property
identification, not an a priori attitude toward the sponsor. This finding supports previous
studies in low involvement contexts that suggest this lack of impact may be a
consequence of the nature of the purchase decision process in FMCG. In these contexts,
consumers are generally price sensitive, expend little effort in considering various
alternatives, and often switch between brands (Silayoi & Speece 2004). This finding is of
particular importance to FMCG manufacturers who may be using SLP as a strategy to
specifically retain existing customers. These results indicate that SLP may be more
effective at influencing the purchase intentions of consumers only under quite specific
conditions. The first of these conditions uncovered in this study is perceived fit, and this
is discussed next.
Perceived Fit - Hypotheses 2 and 4
Perceived fit between a sponsoring brand and a sponsored property has been shown to
have a significant influence on variables such as attitude toward the sponsor and purchase
intentions in previous sponsorship research (Koo et al. 2006; Roy & Cornwell 2003;
Coppetti et al. 2009; Speed & Thompson 2000; Grohs et al. 2004; Smith et al. 2008).
However as reported in Chapter 3 much of this research was conducted in high
Page 173
Consumer Response to Sponsorship Leveraged Packaging PhD Thesis Frances Woodside
161
involvement purchase contexts and in relation to the purchase of shopping goods. This
research aimed to investigate whether perceived fit maintained its relevance in consumer
decision making in relation to sponsorship activity in low involvement decision contexts
particularly FMCG.
The results reported in Chapter 5 indicate that perceived fit did indeed play a role in how
consumers responded to SLP in a FMCG context. Specifically, there was evidence that
Perceived Fit had a positive moderate influence on Consumer Response to SLP. These
results provide evidence that a consumer‘s perception of the fit between the sponsored
property and sponsoring brand continues to play an important role in their response to
SLP even in a low involvement decision context. Literature to date (Speed & Thompson
2000; Becker-Olsen & Simmons 2002; Pracejus & Olsen 2004; Fleck & Quester 2007)
supports this finding by consistently reporting that effectiveness of sponsorship is
contingent on the fit between the sponsoring brand and sponsored property.
Specifically, studies of consumer responses to corporate sponsorships reveal that the
closer the perceived fit between a sponsor and a property the more accurate will be the
sponsor identification (Johar & Pham 1999). Further this relationship will also result in
more favorable attitudes toward the sponsor (Speed & Thompson 2000; Koo et al. 2006),
and there will be a strong image transfer from property to sponsor (Gwinner & Eaton
1999). Indeed, perceived fit between the brand and the property has been regarded as
critical for sponsorship success (Coppetti 2009). Yet despite considerable research
conducted into perceived fit, much of the research has focused on outcomes of fit rather
than on those variables that might influence fit (Gwinner & Bennett 2008). This study
looked at several variables in particular that were hypothesized to influence perceptions
of perceived fit in a FMCG context.
The findings reported in the previous chapter indicated that the level of sponsored
property identification affects consumer response to SLP. Furthermore, it was determined
that the level of perceived fit impacted consumer response to SLP. Results also indicated
that perceived fit moderated the relationship between sponsoring brand loyalty and
Page 174
Consumer Response to Sponsorship Leveraged Packaging PhD Thesis Frances Woodside
162
consumer response to SLP. These findings are important because they support prior
research by re-emphasizing the vital role that perceived fit plays in sponsor-related
evaluations (Dardis 2009). This will be an important finding for FMCG managers who
are considering the use of sponsorship leveraged packaging in their marketing activity. If
these marketing managers are able to increase the degree of perceived fit between their
brands and those sports or causes that they sponsor, there is likely to be a resultant
increase in consumer responses to the sponsorship. This reinforces the need for careful
and strategic selection of sponsorship alliances and associations for retail organizations.
Type of Sponsored Property - Hypothesis 5
It was hypothesised that the type of sponsored property would influence how a consumer
responded to SLP. The results of the focus group discussions suggested that some causes
(such as breast cancer) appeared to generate stronger positive emotions in consumers,
more so than their reactions and emotional attachment to sports. This lead the researcher
to hypothesize that cause related sponsorship may engender stronger responses in
consumers to SLP than would the same types of associations with a sport sponsorship.
The results reported in chapter 5 indeed supported this proposition. These results suggest
that the sponsorship of a cause (particularly a popular and well known one such as breast
cancer) appears more likely to engender favourable attitudes and purchase intentions
towards the sponsor than does sponsorship of a sport. Objectives of such sponsorship
arrangements are generally to associate the company with a charity, suggesting that the
business is fulfilling a societal obligation and to generate goodwill by enhancing the
image of the organisation (Dean 2002). Given that cause related sponsorship is generally
associated with humane causes it is unsurprising that these associations would create
strong positive emotions among consumers.
A number of authors previously have suggested that cause related sponsorship will
endear more positive attitudes toward sponsors than would corporate sponsorship
(Becker-Olsen & Simmons 2002; D‘astous & Bitz 1995) and this research has supported
these findings. What was not previously known was whether this relationship would be
Page 175
Consumer Response to Sponsorship Leveraged Packaging PhD Thesis Frances Woodside
163
maintained in a low involvement FMCG context? This study has confirmed this to be the
case. Further, these results show the importance of determining the target markets‘
emotional attachment to potential sponsorship properties, whether causes or sports, in
order to gain the most benefit from sponsorship arrangements by selecting properties that
the target audience value highly and feel an emotion connections to.
Awareness of the Sponsorship - Hypothesis 6
It was hypothesized that consumers who were aware of the sponsorship arrangements
prior to be exposed to the SLP would be more likely to have a more positive response to
SLP than those who were not previously aware. The results reported in Chapter 5
suggest that prior awareness of the sponsorship moderated the relationship between
Perceived Fit and Consumer Response to SLP. This means that when a consumer is
aware of the sponsorship relationship prior to exposure to SLP, that their perception of
the match between the sponsoring brand and sponsored property has a greater impact on
their response to that SLP.
In previous studies awareness of sponsorship has been shown to be impacted by strong
levels of property identification (Meenaghan 2001; Grohs et al. 2004) and perceived fit
between the sponsoring brand and the sponsored property (Crimmins & Horn 1996; Johar
& Pham 1999; Speed & Thompson 2000; Stipp & Schiavone 1996; Grohs et al. 2004).
Several studies have supported that sponsorship is an effective tool in increasing brand
awareness levels (Johar & Pham 1999; Rifon et al. 2001; Speed & Thompson 2000;
Apostolopoulou & Papadimitriou 2004; Chadwick & Thwaites 2005). In contrast, other
studies have demonstrated that the impact on consumers‘ attitudes or behaviours towards
a sponsoring brand as a result of exposure to sponsorship advertising can sometimes be
very weak (Grohs et al. 2004), and this can be more prominent in the case of high
familiarity brands such as found in FMCG contexts (Carrillat et al. 2005).
These results should also be considered in light of the discussion by sponsorship
researchers concerning the importance of brand familiarity. In this study, the brands
chosen for the questionnaire instrument were well known brands. Some research has
Page 176
Consumer Response to Sponsorship Leveraged Packaging PhD Thesis Frances Woodside
164
indicated that sponsorships are more effective for improving attitudes and purchase
intentions when the sponsoring brand is unfamiliar (Carrillat et al. 2005). According to
Pope and Voges (2000), consumers‘ intention to purchase can be derived from two
predominant influences: a positive attitude towards the brand; and brand familiarity,
which is obtained from brand exposure and prior use. This study demonstrated that in a
FMCG context, for those consumers who already are aware of the sponsorship, the
impact of the perceived fit or match between the sponsoring brand and sponsored
property was greater as a result of exposure to SLP, than for those who were not aware of
the sponsorship prior to exposure.
Given that the majority of companies who are involved with sponsorship, or sport
sponsorship in particular, have a primary objective of increasing brand awareness (Koo
2006), the findings from this study are particularly important. By increasing consumer
awareness of sponsorship relationships, sponsors try to influence the development and depth
of brand association and increase the chance that consumers will select a particular brand or
product (Crompton 2004). This would suggest that FMCG managers would benefit from
selecting those properties for which consumers already have a strong affinity or
identification and where they perceive a high level of fit with the sponsoring brand.
Frequency of Purchase - Hypothesis 7
The results reported in Chapter 5 suggest that frequency of purchase of the sponsoring
brand does not impact Consumers Response to SLP. The findings from this study are in
contrast to Pope and Voges (2000) who found that intention to purchase was significantly
related to the frequency of purchase of the sponsoring brand. This study found that in a
FMCG context, even if the consumer regularly purchased the un-sponsored product, this
did not positively impact their intention to purchase the sponsored product as a direct
result of SLP. This indicates that in FMCG product categories, the fact that a consumer
regularly purchases a product, does not necessarily guarantee that they would purchase
the same product with sponsored leveraged packaging.
Page 177
Consumer Response to Sponsorship Leveraged Packaging PhD Thesis Frances Woodside
165
Respondent Characteristics - Hypothesis 8
It was hypothesised that the characteristics of the respondents would moderate their
responses to SLP. The results of this study showed that for gender, age and household
status that this was the case. Gender was shown to moderate the respondent‘s response to
SLP and age and household status moderated the degree of Sponsored Property
Identification felt. These results suggest that demographics do play a role in determining
how consumers are likely to respond to SLP in a FMCG context.
In summary, sponsors who target 25-36 year old females with children living at home
might have an easier task in improving consumer response to sponsorship leveraged
packaging. Furthermore, the results of this study show that household status moderates
sponsored property identification. That is: families with children are more likely to
identify with the sponsored property, particularly in a FMCG context, than families
without children living at home.
These findings indicate that in FMCG markets, managers should carefully consider the
demographic profile of the sponsored properties and sponsoring brand‘s target market
and segment the market accordingly. As a result, sponsorship leveraged packaging can
then be fine tuned to meet both the sponsoring brand and sponsored property's target
markets needs, creating a more effective and cost effective sponsorship arrangement.
6.3 Conclusions about the Research Purpose
The purpose of this program of research was to develop and test a model of Factors
Impacting Consumer Response to Sponsorship Leveraged Packaging, specifically
addressing the roles of Sponsored Property Identification, Sponsoring Brand Loyalty,
Perceived Fit and various moderating variables including: Type of Sponsored Property;
Frequency of Purchase; Awareness of the Sponsorship; and Respondent Characteristics.
Specific objectives to be addressed in this program of research were:
1. to determine the factors that impact Consumer Response to SLP in a FMCG context
2. to develop and test a structural model that describes the network of relationships
among these variables.
Page 178
Consumer Response to Sponsorship Leveraged Packaging PhD Thesis Frances Woodside
166
In sum, the key finding of this research is that sponsorship leveraged packaging can
improve attitude and purchase intentions towards the sponsoring brand‘s products in a
FMCG context. This improvement in attitudes and purchase intention is based on two key
factors i.e. sponsored property identification and sponsoring brand loyalty.
In particular, when a consumer is highly involved with the sponsored property, there is a
corresponding increase Consumer Response to SLP. Of particular importance, is that
when the sponsored property is a cause, the impact on Consumer Response is likely to be
greater than for a sport related sponsorship alliance.
Furthermore, gender, age and the presence of children in the home are all likely to impact
how strongly a consumer will identify with the sponsored property and ultimately
respond to SLP. Specifically, female respondents exhibited higher improvement in
attitudes towards the sponsor than did male respondents as a direct result of exposure to
SLP. In addition, respondents aged between 25 – 36 years were more likely to support
sponsorship of a favourite property than other age groups. This highlights the importance
of careful selection of sponsorship properties based on the target market profile and their
identification with the potential sponsorship property. The second key factor in
understanding consumer response to SLP is the role played by sponsoring brand loyalty.
Traditional marketing literature has long supported the belief that as brand loyalty
increases vulnerability to competitive promotion is reduced (Aaker 1991). This study
showed that loyalty to the sponsoring brand had little impact on Consumer Response to
SLP in a FMCG context, except in the case of cause sponsorship, where loyalty to the
sponsoring brand moderated the impact of sponsoring brand loyalty on consumer
response to SLP. This suggests a heightened importance for the brand itself when it is
associated with a cause particularly in a FMCG context.
An important component in this relationship between sponsored property identification,
sponsoring brand loyalty and consumer response to SLP is the association between the
sponsored property and the sponsoring brand. This study found that when the sponsored
Page 179
Consumer Response to Sponsorship Leveraged Packaging PhD Thesis Frances Woodside
167
property and sponsoring brand were well matched in terms of image and logical fit, the
consumer‘s response improved when exposed to SLP.
The findings discussed in section 6.2 have both implications for theory (section 6.4) as
well as practical implications (section 6.5). These implications are considered next.
6.4 Theoretical Contribution
In recent years considerable research has been undertaken toward a better understanding
of how consumers process sponsorship messages. Many of these studies have sought to
discover theoretical explanations related to the cognitive processing of sponsorship
stimuli and the effects on response outcome. Cornwell et al. (2005) developed a
comprehensive model to explain consumer response to sponsorship, and suggested that
various theories explain how sponsorship works in consumers‘ minds (i.e. processing
mechanics). Their work also indicated that these processing mechanics are influenced by
both individual and group-level factors, market factors and management factors. This
study found support for this proposition in that individual factors such as sponsored
property identification, and demographic characteristics were found to influence
consumer response to SLP.
Specifically, the findings from this study indicate that a high level of sponsored property
identification improved consumer response toward the sponsor in an FMCG low
involvement context. In addition, respondent age and household status moderated
sponsored property identification and consumer response was higher for female
respondents than male. Furthermore, management factors such as the type of property
sponsored and the perceived fit between the sponsored property and sponsoring brand
were also shown to have an impact on how consumers responded to SLP. In particular,
sponsorship of a cause was found to have greater positive impact on consumer response
than sponsorship of a sport when exposed to SLP. In addition, consumer response was
higher when respondents perceived a high fit between the sponsoring brand and
sponsored property in the SLP.
Page 180
Consumer Response to Sponsorship Leveraged Packaging PhD Thesis Frances Woodside
168
Overall, this study provides support that various theoretical approaches such as low-level
processing, congruence and image transfer can be used together to complement each
other and to improve the outcomes of sponsorship alliances as suggested by Cornwell et
al. (2005). For example, the low-level processing theory explains that in the context of
this study (i.e. FMCG), little cognitive effort is expended in making purchase decisions.
There was evidence in the findings of this study of the image transfer process despite the
low involvement context (see section 6.2 Hypothesis 1). Furthermore, despite the finding
in the exploratory stage of the research that perceived fit had little impact on consumer
response to SLP, this study found a significant positive relationship between perceived fit
and consumer response to SLP. This indicates that although it may not be a conscious
decision to consider perceived fit in a low involvement context, its role is still important
in explaining the way that consumers respond to sponsorship leveraged packaging. This
demonstrates that the theories of low-level processing, congruence and image transfer
should not be used in isolation; rather elements of all three are needed to fully explain
how consumers are likely to respond to SLP in a FMCG context.
The nature of low involvement processing where little cognitive effort is expended in
purchase decisions, has led researchers to consider whether sponsorship has the capacity
to influence consumer response: be it awareness, attitudes, purchase intention or purchase
behaviour. Whilst previous research has advanced our understanding of factors that
impact consumer response to sponsorship, this study explains those factors in a new
context: that of sponsorship leveraged packaging in FMCG.
Specifically, the results of this study indicate that whilst some respondents had
progressed to the first stage of the hierarchy i.e. awareness; there was not in all cases, a
corresponding impact on attitudes or purchase intention. Importantly, researchers suggest
that it is critical to reinforce awareness of the relationship between the sponsoring brand
and sponsored property (Fullerton 2007), given that if awareness is not achieved, it is
difficult for the other stages of the hierarchy (such as attitudes and purchase behaviour) to
be achieved. Moreover, while sponsorship has been shown to be capable of creating
awareness (Johar and Pham 1999; Pham and Johar 2001; Rifon et al. 2004; Speed and
Page 181
Consumer Response to Sponsorship Leveraged Packaging PhD Thesis Frances Woodside
169
Thompson 2000; Apostolopoulou & Papadimitriou 2004; Chadwick & Thwaites 2005),
there has been inconclusive evidence that awareness or the subsequent development of
positive attitudes toward the sponsor, will prompt trial. In this study, a small percentage
of respondents who did not regularly purchase the product indicated intention to try the
product. This suggests that SLP does have some although small capacity to induce trial.
This capacity to induce trial could be explored in future research (see section 6.5).
Until now, few sponsorship studies have taken into account the respondent‘s brand usage
behaviour, and even fewer have considered sponsorship‘s capacity to induce trial in their
sponsorship research studies. The findings of this study are particularly important for
today‘s market place, where many consumers shop under high time pressure and products
are often bought without prior planning (Siloyai and Speece, 2004), this is especially true
for products in the FMCG context. Sponsorship leveraged packaging is just one tool
amongst a proliferation of marketing tools used by FMCG managers to create
differentiation in a very competitive marketplace. Having established that sponsorship
leveraged packaging has the capacity to improve consumer attitudes and purchase
intentions towards the sponsoring brand, as well as induce trial (in a limited capacity),
this study provides evidence of the capacity of SLP to impact consumer attitudes and
purchase intentions, particularly in a FMCG context.
There is insufficient evidence to determine whether SLP in a FMCG context operates
under a hierarchy of effects model or an ATR model. This program of research has
initiated work in this area by determining Factors that Impact Consumer Response to
SLP. However, more work is needed to further explore the relationship between SLP has
and consumers trial intention. Whether SLP is more or less effective than other FMCG
marketing communication tools in this regard could also be a topic for future research.
In summary, the findings from this study have advanced knowledge of consumer
response to sponsorship. The understanding provided in this study has advanced
sponsorship theory, in particular, the processing of sponsorship messages and their
Page 182
Consumer Response to Sponsorship Leveraged Packaging PhD Thesis Frances Woodside
170
capacity to impact consumer response in a FMCG context. In addition to the theoretical
contributions, this research also has implications for practice. These are discussed next.
6.5 Implications for Practice
The findings from this research are of importance to both FMCG brand managers and
property managers. This study provides understanding of the role of sponsored property
identification in consumer response to sponsorship leveraged packaging in FMCG. This
is relevant to two key elements of the sponsorship process: (1) the sponsorship selection
decision; and (2) the development of the sponsorship-leveraging strategy.
In the sponsorship selection decision, managers must choose between alternative
properties as vehicles for sponsorship. The results of this study show the importance of
sponsored property identification, indicating that managers need to have a good
understanding of the attitudes held by their target audience. In this way, sponsoring firms
may focus on the highly identified consumer due to their propensity for greater sponsor
recognition and higher levels of purchase intentions. Furthermore, brand managers
should target properties that their target market value highly. This will allow brand
managers and property managers to assess new and existing sponsorship arrangements to
maximize the benefit gained from such opportunities and to avoid costly mistakes.
Secondly, in developing the sponsorship-leveraging strategy, the findings provide support
for incorporating sponsorship leveraged packaging, particularly in a FMCG setting.
Sponsorship leveraged packaging provides opportunity to further engage the consumer
with the sponsor‘s product by reinforcing the link between the favoured property and the
sponsor. While providing a way to communicate the sponsorship arrangement to
consumers at a point closer to purchase than traditional sponsorship promotion (i.e. venue
and media advertising), marketers should also consider the role of sponsoring brand
loyalty in consumer response to SLP.
A further contribution this study makes is the identification of the inverse relationship
between loyalty to the sponsoring brand and consumer response to SLP. Specifically, the
Page 183
Consumer Response to Sponsorship Leveraged Packaging PhD Thesis Frances Woodside
171
findings from this study indicate that in cases of low loyalty to the sponsoring brand,
there was an improvement in consumer attitudes and purchase intention towards the
sponsor, as a result of SLP. Therefore, managers of lesser known brands would be well
advised to use sponsorships with a highly familiar property to counterbalance the high
awareness and high brand loyalty of well-known competitors‘ brands. Managers of lesser
known brands may decide to leverage their sponsorship agreements based not only on the
association with the property, but also on the association with the other sponsoring
brands. Alternatively, for prominent or familiar brands, sponsorship may be a good
preemptive strategy since it may limit direct competitors‘ access to popular properties.
Finally, the strongest managerial implication from this research is that it is not enough to
consider awareness alone when selecting and evaluating sponsorships. This study clearly
indicated that awareness alone does not result in improved purchase intention. For
sponsorship managers, this means that measuring awareness alone is not enough when
evaluating the effectiveness of sponsorship. For property managers, this means that
understanding the attitudes and brand loyalty of consumers towards possible sponsor
brands is crucial in selecting which sponsors to partner with.
Despite the aforementioned theoretical and practical contributions, there is a need for
further research on the impact of sponsorship leveraged packaging both with immediate
and long term effects. Limitations of this study and avenues for future research follow.
6.6 Limitations and Future Research
Several limitations exist in the current study. First, this study concentrated on a one off
treatment of the experiment condition i.e. exposure to sponsorship leveraged packaging
from a real world example. A longitudinal study considering the change of consumer
response over time would be beneficial to provide further insights into the area. It would
also be interesting to determine whether SLP is more or less effective than other FMCG
marketing communication tools. A study examining the effectiveness of SLP compared
to other tools (such as competitions, celebrity endorsement, licensing), and their capacity
to create awareness, improve brand attitudes and purchase intentions and induce trial, will
determine SLP‘s commercial value for FMCG managers.
Page 184
Consumer Response to Sponsorship Leveraged Packaging PhD Thesis Frances Woodside
172
Second, the product category chosen for this study (i.e. breakfast cereals) is one in which
considerable promotional activity occurs (e.g. sales promotions, free gifts with purchase,
competitions); the cereal category is a dynamic, quickly changing environment. As this
study specifically examined the breakfast cereal category, generalization to other FMCG
categories is tenuous. Future research could examine different FMCG categories and
determine whether the findings from this study hold strong for other product categories.
The use of a non-probability, self-administered questionnaire could also have affected the
result of this research for a number of reasons. Firstly, social desirability error is
common in self-reported surveys, where respondents will answer questions in a way that
will be socially acceptable, rather than a true and accurate record of their feelings and
behaviours (or in this case intentions). If such was the case in this study, respondents
may have overstated their attitudes and purchase intentions and therefore a less than
accurate measure of the consumers‘ response to SLP was given. On the other hand,
respondents may be reluctant to admit that promotion influences their decision-making
process, and again, a less than accurate answer is given.
Moreover, the female skewed sample may have contributed to the preference for the
breast cancer cause and a simple random sample of brand users could yield different
results. With regard to the characteristics of the sample, the cell counts of some of the
variables were not to the desired size and therefore, prediction of the impacts of SLP on
this basis is tenuous. In addition, the cell sizes for two of the moderating variables,
Awareness of the Sponsorship and Frequency of Purchase, were not large. Interpretation
of these results in particular should be exercised with caution.
Thirdly, as highlighted in the discussion area, this study measured behavioural intention
rather than actual behaviour. While it attempted to clarify this intention-behaviour link, a
study that followed actual consumer purchases in a controlled experiment would provide
most significant results. This could be achieved through a choice modeling experiment to
examine whether consumers do in fact behave as they have indicated in the survey.
Alternatively, behavioural measures (such as: competitions, merchandise, free gifts
Page 185
Consumer Response to Sponsorship Leveraged Packaging PhD Thesis Frances Woodside
173
redemption), may be used to enable researchers and practitioners to obtain better insights
into the behavioural consequences of sponsorships they might undertake. The
examination of scan data would also enable calculation of whether the investment in the
sponsorship was offset by the increase in sales that resulted.
Additionally, this study examined Perceived Fit and its impact on other variables
important to this study. The subjects for the study (i.e. Weetbix/CA and Light ‗n‘ Tasty/
NBCF) were current real market campaigns and thus the fit in each case would likely be
high. Future research may use fit as an experimental condition to determine whether
cases of low, medium or high fit perform better under similar conditions as this study.
Finally, the key finding of this research is that SLP can improve consumer response to
sponsorship. This improvement is based on two key factors i.e. sponsored property
identification and perceived fit. Theoretically and practically, this change in attitudes and
purchase intention occurs because of the brand image transfer process. It is not known,
whether in this process, if the brand image of the sponsored property is also transferred to
the sponsor as this was outside the scope of this program of research. Furthermore, it is
not known if a reciprocal transfer occurs where the image of the brand is transferred to
the sponsored property. Future research could determine if this is the case in a FMCG
context, where brand image of either the sponsoring brand or sponsored property is
transferred as a result of SLP.
Although sponsorship has become an increasingly important and popular means of
promotion, previous research has not considered its contribution in a packaging context.
This program of research has provided empirical evidence of the factors that impact
consumer response to SLP in a FMCG context. The key finding of this research is that
SLP can improve consumer response to the sponsoring brand. The outcomes from this
research contribute to a better understanding of sponsorship effects on consumer
behaviour and provide managers with the means to develop more effective sponsoring
leveraging.
Page 186
Consumer Response to Sponsorship Leveraged Packaging PhD Thesis Frances Woodside
174
LIST OF REFERENCES
Aaker, D 1991, Managing Brand Equity, The Free Press, New York, U.S.
Aaker, D, Kumar, V, Day, G, Lawley, M, & Stewart, D 2007, Marketing Research, 2nd
Edition, John Wiley & Sons Australia, Ltd.
Abratt, R & Grobler, T 1989, The evaluation of sports sponsorship, International Journal
of Advertising, vol. 8, no. 4, pp. 351-62.
Ahluwalia, R, Burnkrant, RE & Unnava, R 2000, Consumer response to negative publicity,
the moderating role of commitment, Journal of Marketing Research, vol. 37 (May),
pp.203–214.
Ailawadi, KL, Neslin, SA & Gedenk, K 2001, Pursuing the value-conscious consumer;
store brands versus national brand promotions, Journal of Marketing, vol. 65 (1), pp. 71 –
89.
Aitken, PP, Leather, DS & Squair, SI 1986, Children‘s awareness of cigarette brand
sponsorship of sports and games in the UK, Health Education Research, vol. 1(3), 203-211.
Alexandris, K. Douka, S, Bakaloumi, S & Tsasousi, E 2008, The influence of spectators‘
attitudes on sponsorship awareness: a study in three different leisure events, Managing
Leisure, vol. 13, January.
Ali, C, Cornwell, TB, Nguyen, D & Coote, L 2006, ‗Exploring the usefulness of a
consumer activity index in the sponsorship-linked marketing context‘, International
Journal of Sports Marketing & Sponsorship, January, Vol. 7, Issue 2, pp 115-123.
Alreck, PL & Settle, RB 1985, The survey research handbook, Irwin, USA.
Alwin, D & Hauser, R 1975, The decomposition of effects in path analysis, American
Sociological Review 40 (February): 37–47.
Ambler, T, Styles, C & Xiucum W 1999, The Effect of Channel Relationships and Guanxi
on the Performance of Inter-Province Export Ventures in the People's Republic of China,
International Journal of Research in Marketing, vol. 16, 75-87.
Amis, J, Slack, T & Berrett, T 1999, Sport sponsorship as distinctive competence,
European Journal of Marketing, vol. 33, pp. 14-25.
Anderson, JC & Gerbing, DW 1988, Structural equation modeling Practice: a review and
recommended two-step approach, Psychological Bulletin, Vol. 103, No. 3, pp. 411 - 423.
Angenendt, C 1993, Image transfer and acceptance sport sponsoring, Planning and
Analysis, 2, pp. 5–9.
Page 187
Consumer Response to Sponsorship Leveraged Packaging PhD Thesis Frances Woodside
175
Apostolopoulou, A & Papadimitriou, D 2004, ‗Welcome home‘: motivations and objectives
of the 2004 Grand National Olympic sponsors, Sport Marketing Quarterly, Vol. 13 No.4,
pp.180-92.
Arbuckle, J, 1999, Amos users‘ guide version 4.01, Smallwaters Corporation, USA.
Arbuckle, JL & Wothke, W, 2007 AMOS 16 User‘s Guide, Chicago, IL: SPSS.
Bagozzi, R, 1994, Measurement in Marketing Research: Basic Principles of Questionnaire
Design, in Principles of Marketing Research, ed. Bagozzi, R.P. Blackwell, USA.
Baron, RB & Kenny, DA 1986, The moderator-mediator variable distinction in social
psychology research: conceptual, strategic, and statistical considerations, Journal of
Personality and Social Psychology, Vol. 51, No. 6, pp 1173-1182.
Beck, A 1990, 'But Where Can We Find Heineken?' Commercial Sponsorship of the Arts
on Merseyside, The Political Quarterly, 61 (4), 393-401.
Bandalos, DL, 2002, The effects of item parceling on the goodness-of-fit and parameter
estimate bias in structural equation modeling Structural Equation Modeling, 9, 78-102.
Becker-Olsen, K & Simmons, CJ 2002, When Do Social Sponsorships Enhance or Dilute
Equity? Fit, Message Source, and the Persistence of Effects, Advances in Consumer
Research vol. 29, pp. 287-289.
Belch G & Belch M 2009, Advertising and Promotion, an Integrated Marketing
Communications Perspective, 8th
edition, McGraw Hill, New York.
Bennett, G, Cunningham, G & Dees, W 2006, Measuring the Marketing Communication
Activations of a Professional Tennis Tournament, Sport Marketing Quarterly, vol. 15,
pp.91-101.
Bennett, R 1999, Sport sponsorship spectator recall and false consensus, European Journal
of Marketing, vol. 33, pp. 291–313.
Bentler, PM & Dudgeon, P 1996, Covariance structure analysis: statistical practice, theory
and directions, Annual Review of Psychology, Vol. 47, pp. 563 – 592.
Berlson, B 1971, Content Analysis in Communication Research, Hafner Company, New
York.
Blaikie, N 1993, Approaches to social enquiry, Polity Press, Cambridge
Bloxham, M 1998, Brand affinity and television program sponsorship, International
Journal of Advertising, vol. 17(1), pp. 89–98.
Blythe, J 2003, Essentials of Marketing Communications 2nd
ed, Pearson Education,
England.
Page 188
Consumer Response to Sponsorship Leveraged Packaging PhD Thesis Frances Woodside
176
Bollen, KA 1989, A new incremental fit index for general structural equation models,
Sociological methods and research, Vol. 17, pp. 303-316.
Browne, MW & Cudeck, R 1989, Alternative ways of assessing model fit, in Structural
equation models, eds, K.A. Bollen and J.S. Long, Sage Publications, Newbury Park, pp.
136 – 162.
Burns, AC & Bush, RF 1998, Marketing Research, Prentice Hall, New Jersey.
Burns, AC & Bush, RF 2003, Marketing Research 4th Edition, Prentice Hall, New Jersey.
Busser, J, Benson, T & Feinstein, A, 2002, The Impact of Sponsorship Type and Exposure
on Spectator Recognition, HTL Science – Article 2002-1.
Campo, K, Gijsbrechts, E & Nison, P, 2000, Towards understanding consumer response to
stock-outs, Journal of Research, 79 (2), pp. 219 -242.
Carrillat, FA, Lafferty, B A & Harris, EG, 2005, Investigating sponsorship effectiveness:
Do less familiar brands have an advantage over more familiar brands in single and multiple
sponsorship arrangements? Journal of Brand Management, vol. 13, no. 1, pp. 50-65.
Carson, D, Gilmore, A, Perry, C & Gronhaug, K 2001, Qualitative marketing research,
Sage Publications, London.
Cégarra, JJ 1985, La communication par l'action. In Proceedings of the First Congress of
the French Marketing Association (AFM), April, pp. 253–270. LeTouquet: Association
Française de Marketing.
Cégarra, JJ 1986, L'utilisation du parrainage sportif par les collectivités publiques:
l'exemple de la course de l'Europe à la voile. In Proceedings of the Second Congress of the
French Marketing Association (AFM), April, pp. 323–342. Grenoble: Association
Française de Marketing.
Chadwick, S, & Thwaites, D 2005, Managing sport sponsorship programs: Lessons from a
critical assessment of English soccer, Journal of Advertising Research, vol. 45, 328-338.
Chapman, K, Nicholas, P, Banovic, D and Supamaniam, R, 2006 The extent and nature of
food promotion directed to children in Australian supermarkets, Health Promotion
International, Vol. 21 No. 4.
Cheng, PST & Stotlar, DK 1999, Successful sponsorship: a marriage between sport and
corporations for the next millennium, Cyber–Journal of Sport Marketing (online), Vol.
3(3), available at www.cjsm.com.vol3/cheng&stotlar33.htm.
Chien, PM, Cornwell, TB & Stokes, R 2005, A theoretical framework for analysis of image
transfer in multiple sponsorships, Proceedings of the 2005 ANZMAC Conference:
Advertising/Marketing Communication, in Fremantle Australia.
Page 189
Consumer Response to Sponsorship Leveraged Packaging PhD Thesis Frances Woodside
177
Churchill, GA 1979, A paradigm for developing better measures of marketing constructs,
Journal of Marketing Research, Vol. XVI (February), pp.64-73.
Churchill, GA 1991, Marketing Research: Methodological Foundations, Dryden Press,
USA.
Churchill, NC 1992, ‗Research issues in entrepreneurship‘, in D.L. Sexton & J.D. Kasarda
eds, The State of the Art of Entrepreneurship, PWS-Kent Publishing, Boston,
Massachusetts, pp. 579-596.
Close, GA, Finney RZ, Lacey, RZ & Sneath JZ 2006, Engaging the consumer through
event marketing: linking attendees with the sponsor, community and brand, Journal of
Advertising Research, December, Vol. 46, Issue 4, pp.420-434.
Cohen, I & Cohen, P 1983, Applied multiple regression/correlation analysis for the
behavioral sciences, Hillsdale, NJ: Erlbaum.
Coppetti, CF 2004, Building brands through event sponsorships: providing on-site
audiences with a vivid brand experience, unpublished doctoral dissertation, University of St
Gallen.
Coppetti, C, Wentzel, D, Tomczak, T &Henkel, S, 2009, Improving incongruent
sponsorships through articulation of the sponsorship and audience participation, Journal of
Marketing Communications, Vol. 15:Issue 1, pp.17 — 34
Cornwell TB & Coote LV 2005, Corporate sponsorship of a cause: the role of identification
in purchase intent, Journal of Business Research, vol. 58, p.268-276.
Cornwell, TB & Maignan, I 1998, An international review of sponsorship research, Journal
of Advertising, vol. 27, pp. 1-27.
Cornwell, TB, Maignan, I & Irwin, RL 1997, Long-term recall of sponsorship sources,
Asia-Australia Marketing Journal, vol. 5, no. 1, December, pp. 45-57.
Cornwell, TB, Pruitt, SW & Van Ness, R 2001, An exploratory analysis of the value of
winning in motor sports: sponsorship-linked marketing and shareholder wealth, Journal of
Advertising Research, vol. 41, no. 1, pp. 1-15.
Cornwell, TB, Roy, DP & Steinard, EA 2001, Exploring managers' perceptions of the
impact of sponsorship on brand equity, Journal of Advertising, vol. 30, pp. 41-51.
Cornwell, BT 2008, State of the Art and Science in Sponsorship-Linked Marketing,
Journal of Advertising, vol. 37, no. 3 (Fall), pp. 41–55.
Cornwell, TB, Humphreys, MS, Maguire, AM, Weeks, CS, & Tellegen, CL 2006,
Sponsorship-linked marketing: the role of articulation in memory, Journal of Consumer
Research, vol. 33, 312– 321.
Page 190
Consumer Response to Sponsorship Leveraged Packaging PhD Thesis Frances Woodside
178
Cornwell, TB, Humphreys, MS, Maguire, CS, & Tellegen, CL 2003 The Role of
Articulation in Sponsorship-linked Marketing in Proceedings of the 2003 Advertising and
Consumer Psychology Conference, Lynn R. Kahle and Chung-Hyun Kim, eds, Seoul:
Society for Consumer Psychology, 8-9.
Cornwell, TB, Weeks, CS, & Roy, DP 2005. Sponsorship-Linked Marketing: Opening the
Black Box, Journal of Advertising, vol. 34(2), 23-45.
Crabble, BD & Pinkerton, KA 1992, Sources of Bias in Health Commission and Tobacco
Industry Surveys in Australia, Australian Psychologist, Vol. 27(2) 103-108.
Crawford, CT 1992, IRS Attacks Exempt Organization Income from Corporate
Sponsorship Fees, The Journal of Taxation, (April), 230-234.
Creswell, J.W. 1994, Research Design: Qualitative and Quantitative Approaches, Sage
Publications, California.
Crimmins, J & Horn, M 1996, Sponsorship: From Management Ego Trip to Marketing
Success, Journal of Advertising Research, July/August, 11-21.
Crompton, J 2004, Conceptualization and alternate operationalizations of the measurement
of sponsorship effectiveness in sport, Leisure Studies, Vol. 23(3), 267-281.
Crompton, JL 1993, Sponsorship of Sport by Tobacco and Alcohol Companies: A Review
of the Issues, Journal of Sport and Social Issues, (December), 148-167.
Crowley, M 1991, Prioritising the sponsorship audience, European Journal of Marketing,
vol. 25, pp. 11-21.
Cunningham, P, Taylor, S, & Reeder, C 1993, Event marketing: the evolution of
sponsorship from philanthropy to strategic promotion, Proceedings of the 6th Conference
on Historical Research in Marketing and Marketing Thought, Michigan State University,
East Lansing, MI, .
D‘Astous A & Bitz, P 1995, Consumer Evaluations of Sponsorship Programmes. European
Journal of Marketing, Vol. 29 (12), pp. 6-22.
Dahl, D, Manchanda, RV & Argo, JJ 2001, Embarrassment, in consumer purchase, the
roles of social presence and purchase familiarity, Journal of Consumer Research, Vol. 28
(December, pp. 473 – 481.
Danaher, P, Bonfrer, A & Dhar, S 2008, The Effect of Competitive Advertising
Interference on Sales for Packaged Goods Journal of Marketing Research, vol. 211 Vol.
XLV (April 2008), 211–225
Daneshvary, R, Schwer, RK 2002, The Association Endorsement and Consumers‘ Intention
to Purchase, Journal of Consumer Marketing, vol. 17(3), 203-213.
Page 191
Consumer Response to Sponsorship Leveraged Packaging PhD Thesis Frances Woodside
179
Dardis, FE 2009, Attenuating the Negative Effects of Perceived Incongruence in
Sponsorship: How Message Repetition Can Enhance Evaluations of an ―Incongruent‖
Sponsor, Journal of Promotion Management, Vol. 15, pp. 36–56.
Davis, D and Cosenza, R, 1988, Business Research for Decision Making, PWS Kent
Publishing, USA.
Davis, S 2000, Brand Asset Management, Jossey-Bass, San Francisco, U.S.
Davis, D 2000, Business Research for Decision Making, 5th
Ed. Duxbury Thomson
Learning, Central.
De Pelsmacker, P, Geuens, M & Van Den Bergh J 2004, Marketing Communications - a
European Perspective, Harlow: FT Prentice Hall.
De Pelsmacker, P, Geuens, M & Van Den Bergh J 2001, Marketing Communications - a
European perspective, 3rd edition. Harlow, Prentice Hall.
De Pelsmacker, P, Geuens, M & Van Den Bergh J 2007, Marketing Communications - a
Pearson Education Limited, Harlow.
Dean, DH 1999, Brand endorsement, popularity, and event sponsorship as advertising cues
affecting consumer pre-purchase attitudes, Journal of Advertising, vol. 28, no. 3, pp. 1-12.
Dean, DH 2002, Associating the Corporation with a Charitable Event through Sponsorship:
Measuring Effects on Corporate Community Relations. Journal of Advertising, Vol.
31(4),77-87.
Diamantopoulos, A 1994, Modeling with LISREL: a guide for the uninitiated, Journal of
Marketing Management, Vol. 10, no. 1 – 3, pp. 105 – 136.
Dillman, DA 1978, Mail and telephone surveys – the total design method, Wiley, New
York.
Dudzik, T & Groppel-Klein, A 2005, The efficiency of integrated sponsorship advertising,
International Journal of Sports Marketing & Sponsorship, October, Vol. 7, Issue 1 pp.57-
67.
Ehrenberg, A 1974, Repetitive advertising and the consumer, Journal of Advertising
Research, vol. 14, no. 2, pp. 25-34.
Ehrenberg, A 1988, Repeat Buying - Facts, Theory and Applications, Aske, London.
Erdogan, B & Kitchen, P 1998, Managerial mindsets and the symbiotic relationship
between sponsorship and advertising, Marketing Intelligence & Planning, vol. 16, no. 6.
Farrelly, F & Quester, P 2003, The effects of market orientation on trust and commitment.
The case of the sponsorship business-to-business relationship, European Journal of
Marketing Vol. 37(3/4), 530-553.
Page 192
Consumer Response to Sponsorship Leveraged Packaging PhD Thesis Frances Woodside
180
Farrelly, F & Quester, P 2005, Examining important relationship quality constructs of the
focal sponsorship exchange, Industrial Marketing Management, Vol. 34(3), 211-219.
Farrelly, F & Quester, P & Burton, R 2005, Changes in sponsorship value: competencies
and capabilities of successful sponsorship relationships, Industrial Marketing Management,
Vol. 35 (8), 1016-1026.
Fahy, J, Farrelly, F & Quester, P 2004, Competitive advantage through sponsorship,
European Journal of Marketing Vol. 38(8), 1013-1030.
Farrelly, F & Quester, P 1997, In the name of the game, Asia-Australia Marketing Journal,
vol. 5, no. 1, December, pp. 5-7.
Farrelly, F, Quester, P & Smolianov, P 1998 The Australian Cricket Board: mapping
corporate relations, Corporate Communications: An International Journal, Vol. 3(4), pp.
150–155.
Fenton, W, 2009, The global sponsorship market, Journal of Sponsorship vol. 2 no. 2. 120–
130
Finch, J, West, SG & MacKinnon, DP 1997, Effects of sample size and non-normality on
the estimation of mediated effects in latent variable models, Structural equation modeling,
Vol. 4. No. 2, pp. 87 – 107.
Fishbein, M & Ajzen, I, 1975, Belief, Attitude, Intention and Behaviour: an introduction to
theory and research, Addison-Wesley Publishing Company Inc. USA.
Fleck, N.D & Quester P 2007, Birds of a feather flock together … definition, role and
measure of congruence: an application to sponsorship, Psychology & Marketing, Vol.
24(11), 975-1000.
Fullerton, S, 2007 Sports Marketing, McGraw-Hill, Boston.
Fullerton, S, 2010 Sports Marketing, McGraw-Hill, Boston.
Fullerton, S, Johnson Morgan, M & Garland, R, 2008, A Contemporary Snapshot of
Consumer Attitudes to Sport Sponsorship in Australia, Sport Marketing Association 6th
Annual Conference: Bridging the Gap: Bringing the World Down Under, 17-19 July 2008,
Gold Coast, Australia.
Furlong, R 1994, Tobacco Advertising Legislation and the sponsorship of sport, Australian
Business Law Review, 22 (3) 159-189.
Gardner, MP, Schuman, PJ 1988, Sponsorship and Small Business, Journal of Small
Business Management, Vol. 26(4), 44-52.
Geldard, E & Sinclair, L 2002, The Sponsorship Manual: Sponsorship Made Easy, The
Sponsorship Unit Pty Ltd, Upper Ferntree Gully, Victoria.
Page 193
Consumer Response to Sponsorship Leveraged Packaging PhD Thesis Frances Woodside
181
Gephart, R 1999, Paradigms and Research Methods, Research Methods Forum, Vol. 4,
http://division.aomonline.org/rm/1999_RMD_Forum_Paradigms_and_Research_Methods.
htm [available 5 August 2008].
Gerbing, DW & Hamilton, JG 1996, Validity of exploratory factor analysis as a precursor
to confirmatory factor analysis, Structural Equation Modeling, Vol. 3, No. 1., pp. 62 -72.
Gilbert, J 2005, Jazz, Gestalt, and the Year Ahead for Marketers, Journal of Advertising
Research, Vol. 34 (3), 294–295.
Godfrey, P & Hill, CWL 1995, The problem of unobservables in strategic management
research, Strategic Management Journal, Vol. 16, pp.519-533.
Gordon A, 2007, How a small charity with small properties works with big sponsors,
Journal of Sponsorship, Volume 1, Issue 1, pp. 1-9.
Grimes, E & Meenaghan, A 1998, Focusing commercial sponsorship on the internal
corporate audience, International Journal of Advertising, vol. 17, no. 1, pp. 51-74.
Grohs, R & Reisinger, H 2005, Image transfer in sports sponsorships: an assessment of
moderating effects, International Journal of Sports Marketing & Sponsorship, October Vol.
7, Issue 1, pp.42-48.
Grohs, R. Wagner, U. & Vsetecka, S 2004 Assessing the effectiveness of sport
sponsorships – an empirical examination, Schmalenbach Business Review, 56, pp.119-138.
Gross, B, Traylor, MB & Schuman, PJ 1987, Corporate sponsorship of art and sports events
in North America, paper presented to ESOMAR Congress.
Guba, EG & Lincoln, YS 1994, Competing paradigms in qualitative research in Denzin,
Norman K and Lincoln, Y.S (eds), Handbook of qualitative research, Sage Publications,
Thousand Oaks California, pp. 105-117
Gwinner, K 1997, A Model of Image Creation and Image Transfer in Event Sponsorship.
International Marketing Review, Vol. 14(3), 145-158.
Gwinner K & Swanson SR 2003, A model of fan identification: antecedents and
sponsorship outcomes, Journal of Services Marketing, Volume 17, Issue 3, pp.275-294.
Gwinner, K & Eaton, J 1999, Building Brand Image Through Event Sponsorships: The
Role of Image Transfer, Journal of Advertising, Vol. 28(4), 47-57.
Gwinner, K 1997, A Model of Image Creation and Image Transfer in Event Sponsorship,
International Marketing Review 14(3), 145-158.
Gwinner, K & Bennett, G 2008, The Impact of Brand Cohesiveness and Sport
Identification on Brand Fit in a Sponsorship Context, Journal of Sport Management, 2008,
22, 410-426.
Page 194
Consumer Response to Sponsorship Leveraged Packaging PhD Thesis Frances Woodside
182
Hair, JH, Anderson, RE, & Tathan, RL 1992, Multivariate Data Analysis: with readings,
Maxwell MacMillian International.
Hair, JH, Black, WC, Babin, BJ, Anderson, RE, & Tatham, RL 2006, Multivariate Data
Analysis (6th ed.). Upper Saddle River, New Jersey: Pearson Prentice Hall.
Hamlin, RP & Wilson, T, 2004, The impact of cause branding on consumer reactions to
products: Does product/cause ‗fit‘ really matter? Journal of Marketing Management, Vol.
20, 663-681.
Hansen, F & Scotwin, L 1995, An experimental enquiry into sponsoring: what effects can
be measured? Marketing and Research Today, August, pp. 173-81.
Harris, T 2000, In-Store Buying Habits Exposed, Professional Marketing, April/May p.25
Harvey, B 2001, Measuring the effects of sponsorships, Journal of Advertising Research,
vol. 41, no. 1, pp. 59-65.
Helmig, B, Huber, JA & Lefeflang, P, 2006, Explaining behavioural intentions toward co-
branded products, Working Paper Series Marketing WP MK No. 1 Chair of Nonprofit
Management & Marketing University of Fribourg Switzerland
Hermanns, A 2000, Sponsoring Trends 2000 cited in Grohs & Stephan, Correct Sponsor
Memorisation: Drivers And Moderators presented at the ANZMAC 2005 Fremantle WA.
Hoek J & Gendall, P 2001, Sponsorship Evaluation: Integrating Robust Research with
Wishful Thinking, New Zealand Market Research Conference 2001: Conference
proceedings [CD-ROM], October 3-5, Wellington, NZ. Auckland, NZ: Market Research
Society of New Zealand.
Hoek J & Gendall, P 2003, How does sponsorship work? Australia New Zealand Marketing
Academy Conference: Conference proceedings [CD-ROM], December 1-3, Adelaide,
Australia.
Hoek, J, Gendall, P & Sanders, J 1993, Sponsorship management and evaluations: Are
managers‘ assumptions justified?‘ Journal of Promotion Management 1, 53-66.
Hoek, J, Gendall, P, Jeffcoat, M & Orsman, D 1997, Sponsorship and advertising: a
comparison of their effects, Journal of Marketing Communications, vol. 3, pp. 21-32.
Hoek, J, Gendall, P, & Theed, K 1999, Sports sponsorship evaluation: A behavioural
How Message Repetition Can Enhance Evaluations of an ―Incongruent‖ Sponsor, Journal
of Promotion Management, 15:36–56.
Hu, L & Bentler, PM 1999, Cutoff criteria for fit indexes in covariance structure analysis:
Conventional criteria versus new alternatives, Structural equation modeling, Vol. 6, pp. 1-
55.
Page 195
Consumer Response to Sponsorship Leveraged Packaging PhD Thesis Frances Woodside
183
Hulland, J, Chow, YH & Lam, S, 1996, Use of causal models in marketing research: a
review, International Journal of Research in Marketing, vol. 13, pp. 181 – 197.
IEG (International Event Group) 1999, IEG's Complete guide to sponsorship, IEG,
Chicago.
IEG (International Event Group) 2007, Sponsorship growth to increase for fifth straight
year. Chicago.
IEG (International Event Group) 2009, Sponsorship Spending Revised, Growth Cut in
Half. Chicago.
Irwin, RL, Lachowetz, Cornwell, TB & Clark, J 2003 Cause-related sport sponsorship: an
assessment of spectator beliefs, attitudes, and behavioral intentions, Sport Marketing
Quarterly Vol. 12 (3), 131-139.
Irwin, RL & Asimakopoulos, MK 1992, An approach to the evaluation and selection of
sport sponsorship proposals, Sport Marketing Quarterly, vol. 1, no. 2, pp. 43-51.
Javalgi, RG, Traylor, MB, Gross, AC & Lampman, E 1994, Awareness of Sponsorship and
corporate image: An empirical investigation, Journal of Advertising, Vol. 23(4), 47-58.
Johar, GV & Pham, MT 1999, Relatedness, Prominence and Constructive Sponsor
Identification, Journal of Marketing Research, Vol. 36(3), 299-312.
Joreskog, KG & Sorbom, D 1981, LISREL 8 user‟s reference guide, Scientific Software
International, Uppsala.
Joyce, T 1967, What do we know about how advertising works?, Walter Thompson
Company, London.
Kearney, AT 2003, Corporate Logos for Sale [viewed 12 May 2005].
Keller, KL 1998, Strategic Brand Management: Building, Measuring, and Managing Brand
Equity. Upper Saddle River, NJ: Prentice Hall.
Keller, KL 1993, Conceptualizing, Measuring, and Managing Customer-Based Brand
Equity, Journal of Marketing 57(January), 1-22.
Keller, KL 1993, Conceptualizing, Measuring, and Managing Customer-Based Brand
Equity, Journal of Marketing, Vol. 57(January), 1-22.
Keller, KL 2001, Mastering the marketing communications mix: micro and macro
perspectives on integrated marketing communication programs, Journal of Marketing
Management, Vol. 17 (7/8), 819-847.
Kennedy, R & Ehrenberg, A 2000, Competitive brands' user-profiles hardly differ, paper
presented to MRS Conference (ed S.Broadbend), London.
Page 196
Consumer Response to Sponsorship Leveraged Packaging PhD Thesis Frances Woodside
184
Kitchen, PJ, Brignell, J, Li, T & Spickett Jones, G 2004, The Emergence of IMC: A
Theoretical Perspective, Journal of Advertising Research, Vol. 44 (March), 19-30.
Ko, YJ, Kyoungtae, K, Laussen, CL & Kim, TH 2008, The effects of sport involvement,
sponsor awareness and corporate image on intention to purchase sponsors‘ products,
International Journal of Sports Marketing & Sponsorship, January.
Kohl, F & Otker, T 1985, ‗Sponsorship - some practical experiences in Philips Consumer
Electronics‘, in proceedings of the ESOMAR seminar on below-the-line and sponsoring:
The use of promotion and sponsorship in the marketing mix, Milan, Italy, 6-8 November.
Koo, Gi-Yong, Quarterman, J & Flynn L, 2006, Effect of Perceived Sport Event and
Sponsor Image Fit on Consumers' Cognition, Affect, and Behavioral Intentions, Sport
Marketing Quarterly, Vol. 15, 80-90,
Lacey, R, Sneath, J, Finney, Z & Close A, 2005, The Impact of Repeat Attendance on
Event Sponsorship Effects, Journal of Marketing Communications Vol. 13, No. 4, 243–
255, December
Lardinoit, T & Quester, P 2001, Attitudinal effects of combined sponsorship and sponsor's
prominence on basketball in Europe, Journal of Advertising Research, January/February.
Lardinoit, T 1997, Réaction attitudinale des téléspectateurs aux campagnes de parrainage:
étude de l'incidence de la conjonction des parrainages terrain et T.V. In Proceedings of the
13th Congress of the French Marketing Association (AFM), May, pp. 668–697. Toulouse:
Association Française de Marketing.
Lardinoit, T 1998, Effet modérateur de limplication durable sur l'efficacité mémorielle de
la conjonction des parrainages terrain et T.V. In Proceedings of the 14th Congress of the
French Marketing Association (AFM), May, pp. 261–276. Bordeaux: Association Française
de Marketing.
Lardinoit, T 1999, Interaction des parrainages terrain et TV: impact sur deux niveaux de
memorization, In Proceedings of the 15th Congress of the French Marketing Association
(AFM), 19–21 May, pp. 585–602. Strasbourg: Association Française de Marketing.
Lavidge, RJ & Steiner, GA 1961, A model of predictive measurements of advertising
effectiveness, Journal of Marketing, vol. 25, no. October, pp. 59-62.
Leaderman, LC 1990, Assessing educational effectiveness: the focus group interview as a
technique for data collection, Community Education, Vol. 39, pp.117-127.
Ledwith, F 1984, Does Tobacco Sports Sponsorship on Television Act as Advertising to
Children? Health Education Journal, Vol. 43, No. 4, pp. 85-88.
Lee, S 2005, The influence of product involvement and fan identification on response to
team sponsor‟s products, unpublished doctoral thesis, Ohio State University.
Page 197
Consumer Response to Sponsorship Leveraged Packaging PhD Thesis Frances Woodside
185
Little, TD, Cunningham, WA, Shahar, G & Widaman, KF, 2002, To parcel or not to parcel:
Exploring the question, weighing the merits, Structural Equation Modeling, 9, 151-173.
Lyberger, MR & McCarthy, L 2001, An assessment of consumer knowledge of, interest in,
and perceptions of ambush marketing strategies, Sport Marketing Quarterly, vol. 10, no. 2,
pp.130-7.
Madrigal, R 2000, The Influence of Social Alliances with Sports Teams on Intentions to
Purchase Corporate Sponsor‘s Product, Journal of Advertising, Vol. 29(4), 455-469.
Madrigal, R 2001, Social Identity Effects in a Belief-Attitude-Intentions Hierarchy:
Implications for Corporate Sponsorship, Psychology and Marketing, Vol. 18(2), 145-165.
Malhotra, NK, Hall, J, Shaw, M & Crisp, M 1996, Marketing Research: an applied
orientation, Prentice Hall, New Jersey.
Mardia, KV 1974, Applications of some measures of multivariate skewness and kurtosis in
Testing normality and robustness studies, Sankhya, series B, Vol. 36, pp. 115 – 128,
Marketing Research Society of Australia, 1995, Code of Professional Behaviour, Sydney.
Marshall, DW & Cook, G 1992, The corporate (sports) sponsor, International Journal of
Advertising, vol. 11, pp. 307-24.
Martinez, M & Cardona, M, 1997, Study Shows POP Gaining Ground as Medium,
Advertising Age 24 November, p.43.
Mason, RB & Cochetel, F, 2006, Residual Brand Awareness Following the Termination
Long-term Event Sponsorship and the Appointment of a New Sponsor, Journal of
Marketing Communications, Vol. 12, No. 2, 125–144.
Mathieu, JE, Tannenbaum, SI & Salas, E, 1992, Influences of individual and situational
characteristics on measures of training effectiveness, Academy of Management Journal, 25,
828-847.
McCracken, G, 1989, Who Is the Celebrity Endorser? Cultural Foundations of the
Endorsement Process, Journal of Consumer Research, Vol. 16(3), 310-321.
McDaniel, SR, 1999, An Investigation of Match-Up Effects in Sport Sponsorship
Advertising: The Implications of Consumer Advertising schemas, Psychology & Marketing
16(2), 163-184.
McDaniel, SR & Mason, DM, 1999, An exploratory study of influences on public opinion
towards alcohol and tobacco sponsorship of sporting events, Journal of Services Marketing,
13(6), pp. 481–499.
Page 198
Consumer Response to Sponsorship Leveraged Packaging PhD Thesis Frances Woodside
186
McDaniel, SR & Kinney, L 1998, The implications of recency and gender effects in
consumer response to ambush marketing, Psychology and Marketing, vol. 15, no. 4, pp.
385-403.
McDonald, C 1991, Sponsorship and the image of the sponsor, European Journal of
Marketing Vol. 25(11), pp. 31-38.
Meenaghan, A 1983, Commercial sponsorship, European Journal of Marketing, vol. 7, no.
7, pp. 5-73.
Meenaghan, A 1998, Current developments and future directions in sponsorship,
International Journal of Advertising, vol. 10, no. 1, pp. 35-47.
Meenaghan, T & Shipley, D 1999, Media Effect in Commercial Sponsorship, European
Journal of Marketing, Vol. 33(3/4), 328-347.
Meenaghan, T 1991, Role of Sponsorship in the Marketing Communications Mix,
International Journal of Advertising, Vol. 10(1), 35-47.
Meenaghan, T 1996, Ambush marketing: a threat to corporate sponsorship, Sloan
Management Review, vol. 38, pp. 103-14.
Meenaghan, T 2001, Understanding Sponsorship Effects, Psychology & Marketing, Vol.
18, pp. 95 – 122.
Meenaghan, T 2005, Evaluating sponsorship effects, in Amis, J & Cornwell, TB (eds),
Global Sport Sponsorship, Oxford: Berg.
Miles, MB & Huberman, A.M. 1984, Qualitative Data Analysis, 2nd
Edition., Sage,
Thousand Oaks, C.A.
MJA 2000, What are Australian children eating and how does this compare with public
health guidelines? Medical Journal of Australia, 173, Supplement 7 August: S4-S5
Mueller, RO 1997, Structural Equation Modeling: Back to basics, Structural Equation
Modeling, Vol. 4, No. 4, pp. 353 – 369.
Nancarrow, C, Wright, LT, Brace, I 1998, Gaining competitive advantage from packaging
and labelling in marketing communications, British Food Journal, Vol. 100(2), 110-118.
Neuman, WL 2003, Social research methods: qualitative and quantitative approaches, 5th
Edition, Allyn and Bacon.
Nicholls JAF & Roslow, S 1999, Brand recall and brand preference at sponsored golf and
tennis tournaments, European Journal of Marketing, Vol. 33 No. 3/4, 1999, pp. 365-386.
Nunnally, JC & Bernstein, IH 1994, Psychometric Theory, New York, NY: McGraw Hill.
Nunnally, JC 1978, Psychometric Theory, 2nd
Edition, McGraw Hill, New York.
Page 199
Consumer Response to Sponsorship Leveraged Packaging PhD Thesis Frances Woodside
187
Olivier, AJ & Kraak, E 1997, Sponsorship effectiveness: what is driving consumer
response? paper presented to 210th ESOMAR "New Ways for Optimising Integrated
Communications", Paris, France, April 16-18.
Olkkonen, R 2001 Case study: the network approach to international sport sponsorship
arrangement, Journal of Business & Industrial Marketing, Vol. 16(4), pp.309–329.
Olkkonen, R & Tuominen, P 2006, Understanding relationship fading in cultural
sponsorship. Corporate Communications: an International Journal 11 (1), 64-77.
Olson, EL, Thjømøe, HM 2003, The Effects of Peripheral Exposure to Information on
Brand Performance, European Journal of Marketing 37(1/2), 243-255.
Orth, UR & Malkewitz, K 2006, Packaging design as resource for the constructions of
brand identify, Conference Proceedings, 3rd
International Wine Business Marketing
Conference, Montpelier, France, July.
Otker, T 1988, Exploitation: the key to sponsorship success, European Research, vol. 16,
no. 2.
Otker, T & Hayes, P 1987, Judging the efficiency of sponsorship: experience from the 1986
soccer World Cup, European Research, Vol. 15 (4), 3-8.
Peracchio, LA, Tybout, AM 1996, The Moderating Role of Prior Knowledge in Schema-
Based Product Evaluation, Journal of Consumer Research, Vol. 23, No. 3 (Dec., 1996), pp.
177-192
Perry, C, Reige, A & Brown, L, 1998, Realism Rules OK: Scientific Paradigms in
Marketing Research about networks, ANZMAC, Dunedin, 29th
November – 3 rd
December.
Petty, RE, Cacioppo, JT 1986, Communication and Persuasion: Central and Peripheral
Routes to Attitude Change, Springer-Verlag, New York, NY.
Petty, RE, Cacioppo, JT, Schumann, D 1983, Central and Peripheral Routes to Advertising
Effectiveness: The Moderating Role of Involvement, Journal of Consumer Research 10
(September), 135-146.
Pham, MT & Johar, GV 2001, Market prominence biases in sponsorship identification:
processes and consequentiality, Psychology & Marketing, 18(2), pp.123–143.
Pham, MT 1991, The Evaluation of Sponsorship Effectiveness: A Model and Some
Methodological Considerations, Gestion 2000, 47-65.
Pham, MT & Vanhuele, M 1997, Analysing the Memory Impact of Advertising Fragments,
Marketing Letters, Vol. 8(4), 407-417.
Page 200
Consumer Response to Sponsorship Leveraged Packaging PhD Thesis Frances Woodside
188
Pickton, D and Broderick, A 2005, Integrated Marketing Communications, 2nd
Ed,
Financial Times Prentice Hall.
Pitts, BG, & Stotlar, DR 2002, Fundamentals of sports marketing 2nd Edn. Morgantown,
WV: Fitness Information Technology.
Polonsky, MJ, & Speed, R 2001, Linking Sponsorship and Cause-Related Marketing:
Complementarities and Conflicts, European Journal of Marketing 35(11/12), 1361-1385.
Poon, DTY & Prendergast, G 2006, A new framework for evaluating sponsorship
opportunities, International Journal of Advertising, Vol. 25 (4), pp. 471-87.
POPAI Europe 1998, The POPAI Europe Consumer Buying Habits Study, Co-ordination
by Retail Marketing In-Store Services Limited, Watford, Herts: POPAI Europe cited in De
Pelsmacker 2001.
Pope, N 1998, Consumption values, sponsorship awareness, brand and product use, Journal
of Product & Brand Management, vol. 7, no. 2, pp. 124-36.
Pope, N & Voges, KE 1994, Sponsorship evaluation: Does it match the motive and the
mechanism? Sport Marketing Quarterly, vol. 3, no. 4, pp. 38-45.
Pope NKL & Voges, KE 1999, Sponsorship and image: a replication and extension,
Journal of Marketing Communications, 5, 17-28.
Pope, NK & Voges, KE 2000, The impact of sport sponsorship activities, corporate image,
and prior use on consumer purchase intention, Sport Marketing Quarterly, vol. 9, no. 2.
Pracejus, JW & Olsen, GD 2004, The Role of Brand/Cause Fit in the Effectiveness of
Cause-Related Marketing Campaigns, Journal of Business Research, Vol. 57(6), 635-640.
Pracejus, JW & Olsen, GD 2004, Seven Psychological Mechanisms Through Which
Sponsorship Can Influence Consumers, in Sports Marketing and the Psychology of
Marketing Communications, Lynn R. Kahle and Chris Riley, eds., Mahwah, NJ
Quester, P & Thompson, B 2001, Evidence of the impact of advertising and promotion
leverage on arts sponsorship effectiveness, Journal of Advertising Research, vol. 41, no. 1,
pp. 33-47.
Quester, PG & Farrelly, F 1998, Brand association and memory decay effects of
sponsorship: the case of the Australian Formula One Grand Prix, Journal of Product and
Brand Management, 7(6), pp. 539–556.
Quester, PG, Farrelly, F & Burton, R 1998, Sports sponsorship management: a
multinational comparative study, Journal of Marketing Communications, Vol. 4, pp.115–
128.
Page 201
Consumer Response to Sponsorship Leveraged Packaging PhD Thesis Frances Woodside
189
Rajaretnam, J 1994, The long-term effects of sponsorship on corporate and product image:
findings of a unique experiment, Marketing and Research Today, February, pp. 62-74.
Rifon, NJ, Choi, SM, Trimble, CS & Li, H 2004, Congruence effects in sponsorship:
The mediating role of sponsor credibility and consumer attributions of sponsor motive,
Journal of Advertising, Vol. 33(1), 29–42.
Rifon, NJ, Choi, SM, Trimble, C & Li, H 2001, 'Consumer attributions of corporate
sponsorship motive and the development of attitude toward the sponsor of health
information on the World Wide Web', paper presented to Annual Conference - American
Academy of Advertising, Salt Lake City, April.
Roper, S & Parker, C 2006, How (and where) the mighty have fallen: branded litter,
Journal of Marketing Management, Vol. 22, 473-487.
Roy Morgan 2008, Roy Morgan Supermarket Monitor, cited in Supermarket Insights
Woolworths Shopper Behaviour, Torchmedia, [online] www.torchmedia.com.au available: 19 January, 2009.
Roy, DP, Cornwell, TB 2004, The Effects of Consumer Knowledge on Responses to Event
Sponsorships, Psychology & Marketing 21(3), 185-207.
Royd-Taylor, L 2007, Cause-related marketing: a new perspective on archiving campaign
objectives amongst fast moving consumer goods, Journal of Strategic Change, Vol. 16 (1)
pp.79-86.
Ruth, JA & Simonin, BL 2003, Brought to you by brand A and brand B, Journal of
Advertising, vol. 32, no. 3, Fall.
Sandler, DM, and Shani, D 1989, Olympic sponsorship vs. ―ambush‖ marketing: who gets
the gold? Journal of Advertising Research 29 (August/September), 9-14.
Séguin, B 2003, Représentations d‟acteurs sociaux sur les relations entre le marketing et
les Jeux olympiques. Unpublished doctoral dissertation, Université Marc Bloch (Strasbourg
II), Strasbourg, France.
Séguin, B 2007, Sponsorship in the Trenches: Case Study Evidence of Its Legitimate Place
in the Promotional Mix, The Sport Journal Vol 10, No 1, Winter 2007-08-22
Sekaran, U 2000 Research Methods for Business; A skill business approach, John Wiley
and Sons, New York
Sen, S, Gurhan-Canli, Z & Morwitz, V 2001, Withholding consumption: a social dilemma
perspective on consumer boycotts, Journal of Consumer Research, 28 (December) pp. 399
– 417.
Shimp, T. A. (2000). Advertising, promotion, and supplemental aspects of integrated
Page 202
Consumer Response to Sponsorship Leveraged Packaging PhD Thesis Frances Woodside
190
Silayoi, P, Speece, M 2004, Packaging and purchase decisions: An exploratory study on the
impact of involvement level and time pressure, British Food Journal, Vol. 106 (8), 607-
628.
Smith, G 2004, Brand Image Transfer through Sponsorship: a Consumer Learning
Perspective, Journal of Marketing Management, Vol. 20, 457-474
Smith, A; Graetz B and Westerbeek H, 2008, Sport sponsorship, team support and purchase
intentions, Journal of Marketing Communications,14:5,387 — 404.
Sneath, JZ, Finney, RZ, & Close, AG 2005, An IMC Approach to Event Marketing: The
Effects of Sponsorship and Experience on Customer Attitudes, Journal of Advertising, Vol.
45, pp.373-381.
Speed, R & Thompson, P 2000, Determinants of Sports Sponsorship Response, Journal of
the Academy of Marketing Science 28(2), 226-238.
Steenkamp, J & van Trijp, CM 1991, The use of LISREL in Validating Marketing
Constructs, International Journal of Research in Marketing, Vol. 8, pp. 223-299.
Steiger, & Lind, JC 1981, Statistically based tests for the number of common factors, paper
presented at the annual meeting of the Psychometric Society, May Iowa.
Stipp, H 1998, The impact of Olympic sponsorship on corporate image, International
Journal of Advertising, Vol. 17(1), pp. 75– 87.
Stipp, H & Schiavone, N 1996, Modeling the impact of Olympic sponsorship on corporate
image. Journal of Advertising Research, 36, no. 4:22-28.
Stokes, D & Bergin, R 2006, Methodology or ―methodolatry‖? An evaluation of focus
groups and depth interviews‘ Qualitative Market Research Vol. 9 No. 1.
Stotlar, DK & Johnson DA 1989, Stadium ads get a boost, Athletic Business, Vol 13, No. 9
pp. 49-51.
Stotlar, DK 1993, Sponsorship and the Olympic Winter Games, Sport Marketing Quarterly,
vol. 2, no. 1, pp. 35-47.
Suchard, HT & Scott, D 1992, Sponsorship practices in Australia, Management Research
News, vol. 15, no. 4.
Sujan, M & Bettman, JR 1989, The Effects of Brand Positioning Strategies on Consumers'
Brand and Category Perceptions: Some Insights from Schema Research, Journal of
Marketing Research, Vol. 26, No. 4 (Nov., 1989), pp. 454-467.
Summers, J, Gardiner, M, Lamb, CW, Hair, JF, & McDaniel, C 2005, Essentials of
Marketing, 2nd
Edition, Thomson Learning, Australia.
Page 203
Consumer Response to Sponsorship Leveraged Packaging PhD Thesis Frances Woodside
191
Tabachnick, BG & Fidell, LS 1996, Using multivariate statistics, Harper Collins
Publishers, USA.
Tanaka, JS 1993, Multi-faceted conceptions of fit in structural equation models, in Testing
structural equation models, eds, K.A. Bollen and J.S. Long, Sage publications, Newbury
Park, pp. 10 – 37.
Thompson, B 2005, Sponsorship as Bilateral Relationship: the benefits of applying
relationship marketing principles in the sponsorship exchange, Asia Pacific Journal of Arts
and Cultural Management, 3 (1), 188-203.
Thwaites, D 1995, Professional football sponsorship – Profitable or profligate?
International Journal of Advertising 14(2), 149-164.
Thwaites, D, Aguilar-Manjarrez, R, & Kidd, C 1998, Sports sponsorship development in
leading Canadian companies: issues and trends, International Journal of Advertising 17 (1),
29-49.
Tripodi, JA 2001, Sponsorship – a confirmed weapon in the promotional armoury,
International Journal of Sports Marketing and Sponsorship 3(1), 95-116.
Tripodi, JA, Hirons, M, Bednall, D & Sutherland, M 2003, 'Cognitive evaluation: prompts
used to measure sponsorship awareness', International Journal of Market Research, vol. 45,
no. Quarter 4, pp. 435 - 55.
Tucker, LR & Lewis, C1973, A reliability coefficient for maximum likelihood factor
analysis, Psychometrika, Vol. 38, pp. 1 – 10.
Uncles, M, Ehrenberg, A & Hammond, K 1995, 'Patterns of buyer behaviour: regularities,
models and extensions', Marketing Science, vol. 14, no. 3, pp. 671-8.
Underwood, RL 2003, The communicative power of product packaging: creating brand
identify via lived and mediated experience, Journal of Marketing Theory and Practice,
Winter 11(1).
Underwood, RL, Klein, NM 2002, Packaging as Brand Communication: Effects of Product
Pictures on Consumer Responses to the Package and Brand, Journal of Marketing Theory
and Practice Fall, Vol. 10, Part 4, pages 58-68.
Varadarajan IR and Menon A 1988, Cause-related Marketing: A Co-alignment of
marketing strategy and Corporate Philanthropy, Journal of Marketing 52 July 58-74.
Vignali, C 1997, The MIXMAP–model for international sport sponsorship, European
Business Review, 97(4), pp. 187–193.
Wakefield, KL, Becker-Olsen, K & Cornwell. TB 2007, I Spy A sponsor: the effects of
sponsorship level, prominence, relatedness and cueing on recall Accuracy, Journal of
Advertising, vol. 36. no. 4 (Winter), pp.61-74.
Page 204
Consumer Response to Sponsorship Leveraged Packaging PhD Thesis Frances Woodside
192
Walliser, B 2003, An International Review of Sponsorship Research: Extension and
Update, International Journal of Advertising 22(1).
Walliser, B 1996, Le rôle de l'intensité des émotions éprouvées par le téléspectateur dans la
mémorisation des parrains. Recherche et Applications en Marketing, 11(1), pp. 6–19.
Walliser, B 1997, A comparison of the effectiveness of perimeter and outdoor advertising.
What sponsorship can learn from outdoor advertising, Asia–Australia Marketing Journal,
Vol. 5(1), pp. 21–31.
West, SG, Finch, JF & Curran, PJ, 1995, Structural equation models with nonnormal
variables. In RH Hoyle (Ed.) , Structural equation modeling: Concepts, issues, and
applications (pp. 56-75). Thousand Oaks, CA: Sage.
Westberg, K & Pope, N 2005, An examination of cause-related marketing in the context of
brand attitude, purchase intention, perceived fit and personal values, in Proceedings of 2005
ANZMAC Conference: Social, Not-for-Profit and Political Marketing in Fremantle
Australia, 5-7 December.
Wilson, GA 1997, ‗Does sport sponsorship have a direct effect on product sales? The
Cyber Journal of Sports Marketing, Vol. 1, October.
Witcher, B, Craigen, JG, Culligan, D, Harvey, A 1991, The links between objectives and
function in organisational sponsorship, International Journal of Advertising 10(1), 13-33.
Woods J & Walker K 2007 Choosing breakfast: How well does packet information on
Australian breakfast cereals, bars and drinks reflect recommendations? Nutrition &
Dietetics, Vol. 64: 226–233
Zajonc, RB 1980, Feeling and Thinking: Preferences Need no Inferences, American
Psychologist Vol. 35(2), 151-175.
Zikmund, W 1997, Exploring Marketing Research 6th ed., the Dryden Press, Fort Worth,
TX.
Zikmund, W 2003, Essentials of Marketing Research, USA: Thompson South-Western.
Page 205
Consumer Response to Sponsorship Leveraged Packaging PhD Thesis Frances Woodside
193
APPENDIX 1 – EXPLORATORY RESEARCH PROTOCOLS
Focus Group Protocol
Interview Protocol
Qualitative Survey
Page 206
Consumer Response to Sponsorship Leveraged Packaging PhD Thesis Frances Woodside
194
Focus Group Protocol Screening question - Do you do the grocery shopping in your household?
Orientation to grocery shopping
Q. Do you enjoy grocery shopping? Why/ why not? How often do you do grocery
shopping? Who uses a shopping list?
Q. Does any body buy things not on their shopping list? What sorts of things do you buy
not on the shopping list?
Q. When you are buying groceries do you look at the advertising you might find around
the store? What types of advertising do you see (add hint if necessary: e.g. product
demonstrations, signs or tickets on the shelves, displays etc)? What do you think of
these?
Q. Does anybody look at the product itself? What things do you look at? (size, price,
packaging)
Q. I now want you to consider a couple of different types of products that are frequently
purchased. This will help me to understand consumer behaviour a bit better. Who buys
breakfast cereals? Who buys bars such as cereal or muffin bars? When you purchase
these products, how do you decide which one to buy?
Image of Brand
Q. What do you think of when I mention Kelloggs? What are your thoughts, perceptions,
and images of Kelloggs? What do you think of when I mention Sanitarium? What are
your thoughts, perceptions, and images of Sanitarium? How do you see them in
relation to competitors? Who buys these products? Do you feel loyal to Kelloggs or
Sanitarium?
Q. Do you think the Kelloggs brand is strong or weak? Do you have a positive or negative
image of Kelloggs? Why? Do you think the Sanitarium brand is strong or weak? Do
you have a positive or negative image of Sanitarium? Why?
.
Packaging
Q. Getting back to when we talked about the things you look at when buying a product, do
you look at the packaging before you buy? Do you look at the packaging at home?
Perhaps while you are eating breakfast/ preparing lunches?
Q. What do you think of the packaging? Have you noticed that sometimes they have other
things on the packaging (if necessary give hint: e.g. competitions, giveaways, recipes on
them? What do you think of these?
Q. Have you noticed that sometimes the packaging has sponsorship on it? Can you think
of any examples?
Page 207
Consumer Response to Sponsorship Leveraged Packaging PhD Thesis Frances Woodside
195
Q. Do you recognise any of these packages? (show examples – then ask specifically about
SLP examples)
Perceptions of Sponsorship
Q. How would you define sponsorship? What is your opinion of sponsorship in general?
Q. Who sponsors ………………………………What is your opinion of ………..
sponsoring these [sports]?
Q. Do you think ….. is a good match with ……?
Q. Has the presence of (sponsor)……… influenced your perceptions of the
…………(property)?
Q. Do you have any involvement with the …………. (property) (give hint if necessary )
e.g. play the sport, watch on t.v., favourite team to support?
Q. Do you think the ………… (property) has influenced your perceptions of ………….
(sponsor)?
Q. Who buys this brand/s? How do you think the sponsoring of ……………..(property)
affects your feelings toward …………… (sponsor)?
Q. Do you think the sponsorship influences your opinion of the sponsor ………….?
Do you think the sponsorship influences whether you buy the product or not?
Q. Do you think you benefit from these/ this sponsorship in any way? Do you think the
sponsorships has added value to you as customer?
Q. Why do you think the sponsor …………….. participates in this sponsorship
arrangement?
Page 208
Consumer Response to Sponsorship Leveraged Packaging PhD Thesis Frances Woodside
196
Interview Protocol Screening question - Do you do the main grocery shopping in your household? yes no
Orientation to grocery shopping
Do you enjoy grocery shopping? Why/ why not?
How often do you do grocery shopping?
Where do you do the majority of grocery shopping?
When you are buying groceries, do you look at the product itself?
When choosing grocery products, what things do you consider to be important?
What things do you look at?
Why do you think you look at these features?
How do you think they influence you?
Do you buy store brands? Woolworths/ IGA homebrands)
Image of Brand
Can you tell me some products or brands that are favourites?
Why do you favour them?
Do you think other members of your family/ or friends influence what you buy?
How do they influence you?
Do you buy breakfast cereals or muesli and muffin bars?
When you purchase these products, how do you decide which one to buy?
Do you think other members of your family/ or friends influence what you buy?
What do you think of when I mention (Kelloggs)? What are your thoughts, perceptions, and
images of Kelloggs?
What do you think of when I mention (Kleenex)? What are your thoughts, perceptions, and
images of Kleenex?
What do you think of when I mention (Kleenex)? What are your thoughts, perceptions, and
images of Kleenex?
How do you see them in relation to competitors?
Page 209
Consumer Response to Sponsorship Leveraged Packaging PhD Thesis Frances Woodside
197
Do you feel loyal to Kelloggs or Kleenex?
Packaging
Do you look at the packaging before you buy? Yes No Sometimes
I now want you to think about a typical shopping trip when you are not too pressured for
time. For the following types of products, do you look at the packaging:
Cereals/muesli b baking ingredients personal care bathroom/laundry fresh
food/meat
yes no yes no yes no yes no yes no
rice/pastas recipe blends snack foods coffee/tea
yes no yes no yes no yes no
Do you look at the packaging at home? Perhaps while you are eating breakfast/ preparing
lunches? _What do you notice?
What do you think of the packaging?
Have you noticed that sometimes they have other things on the packaging (e.g. celebrity
endorsement, causes, sponsorship, gift promotions
Please list packaging promotions that you can remember
What do you think of these?
Have you noticed that sometimes the packaging has sponsorship on it?
Can you think of any examples?
How would you define sponsorship?
Do you recognise any of these packages? (show examples – then ask specifically about
SLP examples)
What is your opinion of sponsorship in general?
Has the presence of (sponsor)……… influenced your perceptions of the ……(property)?
Do you have any interest in the (property) e.g. play the sport, watch on t.v., support
Do you think the (property) has influenced your perceptions of (sponsor)?
How do you think it has influence your perceptions?
Do you think the sponsorship influences your opinion of the property? Do you think the sponsorship influences whether you buy the product or not?
Why do you think this is?
When do you think sponsorship packaging might be effective?
Do you think you benefit from these/ this sponsorship in any way?
Why do you think the sponsor participates in this sponsorship arrangement?
Page 210
Consumer Response to Sponsorship Leveraged Packaging PhD Thesis Frances Woodside
198
Page 211
Consumer Response to Sponsorship Leveraged Packaging PhD Thesis Frances Woodside
199
Page 212
Consumer Response to Sponsorship Leveraged Packaging PhD Thesis Frances Woodside
200
Page 213
Consumer Response to Sponsorship Leveraged Packaging PhD Thesis Frances Woodside
201
Page 214
Consumer Response to Sponsorship Leveraged Packaging PhD Thesis Frances Woodside
202
APPENDIX 2 – STUDY 2 QUESTIONNAIRE VERSIONS
Version 1 Sanitarium Weetbix/ Cricket Australia
Version 2 Sanitarium Weetbix (NO SLP)
Version 3 Sanitarium Light ‘n’ Tasty/ NBCF
Version 4 Sanitarium Light ‘n’ Tasty/ (NO SLP)
Page 215
Consumer Response to Sponsorship Leveraged Packaging PhD Thesis Frances Woodside
203
APPENDIX 3 – CORRELATION MATRIX
Page 216
Consumer Response to Sponsorship Leveraged Packaging PhD Thesis Frances Woodside
204
Correlation Matrix – Factors Impacting Consumer Response to SLP
I am a
strong
supporter of . [property]
I am
interested
in [property]
If a
company
sponsored [property]
I think it is
good that
companies
sponsor [property]
I am more
likely to
purchase
products of
companies
that sponsor [property]
How often
do you
purchase
[sponsor brand]
I like this brand
This brand is reliable
I would
recommend
this brand to others
I have a
favourable
opinion of this brand
I am loyal
to this brand
I would buy
this brand
even if
competitors
prices were lower
This
sponsorship
improves
my
perception
of [sponsor brand]
This
sponsorship
makes me
feel more
favourable
toward the sponsor
This
sponsorship
of [
] makes me
like
[sponsor brand]more
SLP not
influence (reversed)
How likely
is it that
you would
purchase
this
particular product
I would buy
more of this
product
with the
sponsorship
than non-sponsored
I would
purchase
this product
with this
sponsorship even...
I like this
sponsorship
pictured on the package
Its logical
for [sponsor
brand] to
sponsor [ ]
[sponsor
brand] and
[property]
have a
similar image
the
[property]
logo on the
packaging
is a good
way to show ....
I am a strong supporter of [property] 1.000 .831 .675 .575 .701 -.144 -.074 -.139 -.086 -.071 -.032 .059 .364 .348 .375 .321 .052 .407 .266 .406 .195 .112 .205
I am interested in [property] .831 1.000 .653 .647 .723 -.101 -.079 -.136 -.084 -.071 .014 .064 .373 .338 .327 .314 .074 .393 .293 .475 .245 .139 .221
If a company sponsored [property] it would positively influence how I felt about that co.
.675 .653 1.000 .572 .815 -.069 -.031 -.054 -.014 -.006 .055 .128 .548 .547 .456 .402 .105 .463 .345 .486 .320 .226 .245
I think it is good that companies sponsor [property]
.575 .647 .572 1.000 .587 -.084 .024 -.010 .083 .034 .042 .046 .395 .360 .361 .251 .067 .284 .254 .483 .417 .330 .288
I am more likely to purchase products of companies that sponsor ........
.701 .723 .815 .587 1.000 -.092 -.062 -.091 -.073 -.091 .033 .076 .462 .477 .415 .413 .050 .497 .372 .434 .246 .177 .182
How often do you purchase Sanitarium? -.144 -.101 -.069 -.084 -.092 1.000 .616 .561 .537 .525 .545 .461 .007 .030 .039 .042 .558 .019 .287 -.097 .062 .039 -.035
I like this brand -.074 -.079 -.031 .024 -.062 .616 1.000 .863 .869 .829 .708 .623 .145 .172 .113 .141 .581 .124 .305 .119 .152 .203 .185
This brand is reliable -.139 -.136 -.054 -.010 -.091 .561 .863 1.000 .846 .840 .641 .540 .155 .170 .101 .097 .498 .091 .241 .096 .126 .191 .218
I would recommend this brand to others -.086 -.084 -.014 .083 -.073 .537 .869 .846 1.000 .880 .749 .680 .154 .176 .132 .108 .498 .134 .317 .114 .208 .266 .148
I have a favourable opinion of this brand -.071 -.071 -.006 .034 -.091 .525 .829 .840 .880 1.000 .708 .599 .141 .159 .072 .091 .424 .107 .257 .090 .167 .183 .172
I am loyal to this brand -.032 .014 .055 .042 .033 .545 .708 .641 .749 .708 1.000 .746 .080 .128 .091 .155 .519 .144 .366 .137 .177 .235 .097
I would buy this brand even if competitors prices were lower
.059 .064 .128 .046 .076 .461 .623 .540 .680 .599 .746 1.000 .171 .194 .169 .156 .538 .243 .554 .151 .185 .219 .069
This sponsorship improves my perception of [sponsor brand]
.364 .373 .548 .395 .462 .007 .145 .155 .154 .141 .080 .171 1.000 .887 .781 .349 .260 .500 .399 .529 .479 .409 .466
This sponsorship makes me feel more favourable toward the [sponsor brand
.348 .338 .547 .360 .477 .030 .172 .170 .176 .159 .128 .194 .887 1.000 .807 .382 .308 .576 .411 .531 .457 .416 .472
This sponsorship of [sponsored property] makes me like [sponsor] more than before
.375 .327 .456 .361 .415 .039 .113 .101 .132 .072 .091 .169 .781 .807 1.000 .369 .285 .538 .385 .426 .436 .378 .343
SLP not influence (reversed) .321 .314 .402 .251 .413 .042 .141 .097 .108 .091 .155 .156 .349 .382 .369 1.000 .173 .569 .325 .261 .122 .066 .154
How likely is it that you would purchase this particular product
.052 .074 .105 .067 .050 .558 .581 .498 .498 .424 .519 .538 .260 .308 .285 .173 1.000 .275 .491 .160 .264 .220 .198
I would buy more of this product with the sponsorship than non-sponsored
.407 .393 .463 .284 .497 .019 .124 .091 .134 .107 .144 .243 .500 .576 .538 .569 .275 1.000 .534 .366 .202 .197 .229
I would purchase this product with this sponsorship even if competitors' prices were lower
.266 .293 .345 .254 .372 .287 .305 .241 .317 .257 .366 .554 .399 .411 .385 .325 .491 .534 1.000 .325 .250 .254 .178
I like this sponsorship pictured on the package
.406 .475 .486 .483 .434 -.097 .119 .096 .114 .090 .137 .151 .529 .531 .426 .261 .160 .366 .325 1.000 .507 .436 .681
Its logical for [sponsor brand] to sponsor [sponsored property]
.195 .245 .320 .417 .246 .062 .152 .126 .208 .167 .177 .185 .479 .457 .436 .122 .264 .202 .250 .507 1.000 .722 .466
[sponsor brand] and [sponsored property] have a similar image
.112 .139 .226 .330 .177 .039 .203 .191 .266 .183 .235 .219 .409 .416 .378 .066 .220 .197 .254 .436 .722 1.000 .400
the [sponsored property] logo on the packaging is a good way to show the sponsorship arrangement
.205 .221 .245 .288 .182 -.035 .185 .218 .148 .172 .097 .069 .466 .472 .343 .154 .198 .229 .178 .681 .466 .400 1.000