RAND Journal of Economics Vol. 48, No. 4, Winter 2017 pp. 972–1003 Consumers’ activism: the cottage cheese boycott Igal Hendel ∗ Saul Lach ∗∗ and Yossi Spiegel ∗∗∗ We study a consumer boycott on cottage cheese, organized in Israel on Facebook in the summer of 2011 following a steep price increase since 2006. The boycott led to an immediate decline in prices, which remain low even six years later. We find that (i) demand at the start of the boycott would have been 30% higher but for the boycott, (ii) own- and especially cross-price elasticities increased substantially after the boycott, and (iii) post-boycott prices are substantially below the levels implied by the post-boycott demand elasticities, suggesting that firms were concerned with public backlash due to high prices. 1. Introduction Consumer activism, and boycotts in particular, can serve as an effective countermeasure to market power. Consumers can discipline firms directly through product boycotts and can also affect business strategy by exerting public pressure on regulators to intervene on their behalf (Wolfram, 1999; Ellison and Wolfram, 2006). We study these intertwined aspects of consumer activism as they evolved during the consumer boycott of cottage cheese organized in Israel on Facebook during the summer of 2011. The cottage cheese boycott was intended to pressure firms to lower their prices. The price of cottage cheese, which is a staple food in Israel, increased by 43% since deregulation in 2006 (The Knesset Research and Information Center, 2011). Following the steep increase, and the ensuing ∗ Northwestern University; [email protected]. ∗∗ The Hebrew University of Jerusalem and CEPR; [email protected]. ∗∗∗ Tel Aviv University, CEPR, and ZEW; [email protected]. We thank Steve Berry, Tim Feddersen, Andrea Ichino, Robin Lee, Jesse Shapiro, Manuel Trajtenberg, Christine Zulehner, and seminar participants at The Hebrew University, The London School of Economics, the 2014 “The Economics of Information and Communications Technologies” conference in Paris, the 2014 IIOC meetings in Chicago, the JIE-CEPR applied Industrial Organization in Athens, and the 2014 Economics of ICT conference in Mannheim, for useful comments. We also thank Dan Aks and Max Bocharenko for excellent research assistance. Lach gratefully acknowledges financial support from the Israel Science Foundation (Grant no. 858/11) and from the Wolfson Family Charitable Trust. 972 C 2017, The RAND Corporation.
Transcript
RAND Journal of EconomicsVol. 48, No. 4, Winter 2017pp. 972–1003
Consumers’ activism: the cottage cheeseboycott
Igal Hendel∗Saul Lach∗∗and
Yossi Spiegel∗∗∗
We study a consumer boycott on cottage cheese, organized in Israel on Facebook in the summerof 2011 following a steep price increase since 2006. The boycott led to an immediate decline inprices, which remain low even six years later. We find that (i) demand at the start of the boycottwould have been 30% higher but for the boycott, (ii) own- and especially cross-price elasticitiesincreased substantially after the boycott, and (iii) post-boycott prices are substantially below thelevels implied by the post-boycott demand elasticities, suggesting that firms were concerned withpublic backlash due to high prices.
1. Introduction
� Consumer activism, and boycotts in particular, can serve as an effective countermeasureto market power. Consumers can discipline firms directly through product boycotts and can alsoaffect business strategy by exerting public pressure on regulators to intervene on their behalf(Wolfram, 1999; Ellison and Wolfram, 2006). We study these intertwined aspects of consumeractivism as they evolved during the consumer boycott of cottage cheese organized in Israel onFacebook during the summer of 2011.
The cottage cheese boycott was intended to pressure firms to lower their prices. The price ofcottage cheese, which is a staple food in Israel, increased by 43% since deregulation in 2006 (TheKnesset Research and Information Center, 2011). Following the steep increase, and the ensuing
∗ Northwestern University; [email protected].∗∗ The Hebrew University of Jerusalem and CEPR; [email protected].∗∗∗ Tel Aviv University, CEPR, and ZEW; [email protected] thank Steve Berry, Tim Feddersen, Andrea Ichino, Robin Lee, Jesse Shapiro, Manuel Trajtenberg, Christine Zulehner,and seminar participants at The Hebrew University, The London School of Economics, the 2014 “The Economics ofInformation and Communications Technologies” conference in Paris, the 2014 IIOC meetings in Chicago, the JIE-CEPRapplied Industrial Organization in Athens, and the 2014 Economics of ICT conference in Mannheim, for useful comments.We also thank Dan Aks and Max Bocharenko for excellent research assistance. Lach gratefully acknowledges financialsupport from the Israel Science Foundation (Grant no. 858/11) and from the Wolfson Family Charitable Trust.
extensive news coverage, a Facebook event calling for a boycott of cottage cheese was createdon June 14, 2011, demanding a price reduction from about 7 New Israeli Shekel (NIS) to 5 NISper 250-gram container.1 The Facebook event was an instant success: a day after it started, nearly30,000 Facebook users joined it; by June 30, the number surpassed 105,000. The boycott wasalso a success as the average price of cottage dropped by 24% virtually overnight, and it remainswell below the 2011 price even today, more than six years after the boycott. This long-lastingeffect is due not only to consumers becoming more price sensitive after the boycott, but also tofirms’ realization that they cannot ignore the possibility that increasing prices may trigger massivepublic backlash in the form of renewed government regulation in the market.
Social media such as Facebook and Twitter play an increasingly important role in facilitatingpolitical mobilization.2 It is therefore not surprising that social media can also become a powerfultool for mobilizing consumers to pressure firms to lower prices, as the cottage cheese boycottdemonstrates. Another recent example, also organized via social media, is the 2011 boycott onBank of America, Wells Fargo, JPMorgan Chase, and SunTrust following their plan to chargea $5 monthly fee on debit cards.3 Because of the rapid and widespread growth of social media,we are likely to witness more such cases in the future, and the lessons from the cottage cheeseboycott should therefore be of interest to consumers, firms, and policy makers alike.
We use daily, store-level data from all supermarkets and most grocery stores in Israel toestimate a demand system which we use to quantify the harm the boycott inflicted on firms, tostudy its long-run impact on demand and, finally, to understand firms’ reactions to the boycott.Our main findings are as follows. First, we use the estimated demand functions to computecounterfactual sales during the boycott. Given the new low prices, sales at the start of the boycottwould have been 30% higher, but for the boycott. The effect was particularly strong in areas withhigher exposure to social networks. After about six weeks, however, sales recovered and matchedthe expected demand at observed prices.
Second, the boycott had a long-lasting impact on demand. Comparing estimated demandbefore and after the boycott, we find substantially higher own- and especially cross-price elas-ticities after the boycott, possibly reflecting increased price awareness and more willingness tosubstitute across brands. Interestingly, the magnitude of these changes is not uniform and variesacross brands. The increased price elasticities inflict an additional harm on firms by forcing themto set lower prices.
Third, we follow the industrial organization tradition and use the conditions for a Nashequilibrium in the cottage cheese market, together with the estimated price elasticities, to showthat the observed price decline following the boycott was much larger than the decline implied bythe increase in demand elasticities. This unexplained part of the observed price decline could bedue to firms’ concerns about the boycott spreading to other products and their wanting to protecttheir brand and image, and also to their concern about public backlash in the form of regulatoryintervention or class action lawsuits. To examine the latter possibility, we present a simple modelof firm behavior under the threat of public backlash in the spirit of Glazer and McMillan (1992)and Tanaka (2011). Using the model, along with our demand estimates and external informationon the marginal cost for one of the brands, we proxy the cost of public backlash from the brandmanufacturer’s perspective due to a price increase. We find that the boycott increased the costof potential public backlash due to a price increase, as perceived by the manufacturer, by 63%
1 See www.facebook.com/events/203744079670103/.2 The 2009–2010 Iranian election protests and the 2011 uprisings in Egypt and Tunisia are often referred to as
“the Facebook revolution” or “the Twitter revolution” (Andersen, 2011). Facebook and Twitter played an important rolein facilitating protests in Bulgaria, Turkey, Brazil, and Bosnia in 2013 (e.g., Faiola and Moura, 2013) and in Russia in2011–2012 (Enikolopov, Makarin, and Petrova, 2016).
3 A month after the boycott started, Bank of America announced that “We have listened to our customers veryclosely over the last few weeks ... As a result, we are not currently charging the fee and will not be moving forward withany additional plans to do so” (Siegel Bernard, 2011).
per unit of cottage cheese. To put the extra cost in perspective, the post-boycott fear of backlashmakes firms behave as if their marginal cost were 18% lower than they really are.
Our findings highlight the limitations of using first-order conditions, and elasticities, tocapture firms’ incentives. This traditional industrial organization approach may miss importantconsiderations which affect firm behavior, such as reputation, image, and the concern for regula-tory intervention. The threat of regulation appears to have shaped the pricing of cottage cheese,but such incentives are not captured in the traditional analysis. The cottage boycott was successfulpartly because it put pressure on policy makers to act which, in turn, induced firms to restraintheir prices.
There is a small empirical literature that examines firms’ pricing to curb public pressure forregulatory intervention. Erfle and McMillan (1990) show that during the 1979 oil crisis, majorUS oil firms held down the prices of home heating oil and diesel fuel more than the prices ofless visible fuels used by electric power generators, because the former were subject to publicscrutiny and therefore likely to trigger regulatory intervention. The effect was greatest for highlyvisible firms. Wolfram (1999) finds that the markups of British electricity generators were belowaverage in the four weeks after the energy regulator has released price statements expressingdissatisfaction with the high prices of electricity, but were above average in the four weekspreceding the release of the price statements. Electricity generators appear to restrain pricesafter the statements are released and attract public attention but may deliberately raise pricesbefore the statements are released, realizing that contemporaneous price data is not incorporatedinto the price statements. Ellison and Wolfram (2006) find evidence that pharmaceutical compa-nies possibly altered their price increases during the early years of the Clinton administration toforestall potential regulatory intervention. Similarly, Stango (2003) reports that credit card issuerslowered interest rates following threatened legislation to cap rates.
The additional considerations that appear to have influenced firms (fear of the spread ofthe boycott, of reregulation, etc.) also constitute the main difference between our article andother articles on consumer boycotts. Most of these articles study “proxy boycotts,” namely,boycotts in which firms are punished as a proxy for their country of origin. Proxy boycotts havea fundamentally different underlying cause than boycotts intended to curb market power and,more importantly, have little implications for business strategy and public policy, as firms cannotdo much to avert the harm. The cottage boycott, instead, was geared to counter market power.4
Consumer activism on social media was apparently able to discipline firms and had a long-lastingimpact on business strategy. For example, in January 2013, the Chief Marketing Officer of Tnuva(the market leader), said in the annual meeting of the Israel Marketing Association that “Thecottage cheese crisis taught us a lesson of modesty and humility” and in July 2013, Tnuva’s ChiefExecutive Officer said that “The cottage protests caused Tnuva to emphasize the opinion of theconsumer and his needs. Part of this policy is putting cottage under self-regulation.” The notionof self-regulation seems to be working: the Ministry of Agriculture and Rural Development(MOAG) decided to reregulate the price of “white cheese” (a close substitute for cottage cheese,that was deregulated around the time cottage cheese was deregulated) as of the start of 2014 dueto “exceptional profitability” but found no need to reregulate the price of cottage cheese for thetime being, because it did not find “unreasonable profitability as in the past.”5 The cottage boycottdemonstrates that consumers can indeed get organized on social media and apply pressure onmanufacturers and retailers to lower prices.6
4 The cottage boycott is an example of private politics (e.g., Baron, 2003, and Baron and Diermeier, 2007), wheredairy manufacturers and retailers seem to be self-regulating due to consumers’ activism, as in the Bank of America, WellsFargo, JPMorgan Chase, and SunTrust cases mentioned earlier.
5 The ministry stated, however, that it will continue to monitor the profitability of cottage cheese, and it did not ruleout reregulation should its profitability become “unreasonable” (MOAG, 2013a).
6 For analysis of self-regulation, see Harrison and Scorse (2010) and Abito, Besanko, and Diermeier (2016).
A necessary condition for the success of a consumer boycott is that activists or organizersgarner the support of a group of followers who feel strongly enough about the issue.7 Unlike manyother consumer boycotts, which are organized by interest groups (like Greenpeace), the cottageboycott did not have organized backing. Social media was essential for getting the message out andcoordinating action. Moreover, boycotts are susceptible to a common problem: consumers realizethat unless others join the cause, their personal sacrifice is futile. Social media like Facebookand Twitter can credibly convey the number of followers rallying behind the cause, and hence,encourage others to join. Indeed, we show results which suggest that the boycott’s negative impacton demand was stronger in areas with higher exposure to social networks.
To the best of our knowledge, our article is the first to study a boycott intended to curbfirms’ exercise of market power, and to directly quantify the boycott’s impact on actual sales(revenue). Perhaps due to lack of firm-level data, most of the empirical literature on consumerboycotts examined stock market price reactions. Stock market studies (Friedman, 1985; Pruittand Friedman, 1986; Pruitt, Wei, and White, 1988; Davidson, Worrell, and El-Jelly, 1995; Koku,Akhigbe, and Springer, 1997; Teoh, Welch, and Wazzan, 1999; Epstein and Schnietz, 2002) findmixed evidence for boycott effects. More recently, Fisman, Hamao, and Wang (2014) find thatadverse shocks to Sino-Japanese relations in 2005 and 2010 had a negative effect on the stockprices of Japanese firms with high China exposure, and Chinese firms with high Japanese expo-sure. They also find a larger negative effect on Japanese firms operating in industries dominatedby Chinese state-owned enterprises, but a smaller effect on firms with high Chinese employment.Our article, in contrast, uses daily, store-level data on prices and quantities sold, allowing us tostudy the direct effect of the boycott on store-level sales.
A few articles study the effects of calls for consumer boycotts on firms’ sales. These articles,however, exclusively study proxy boycotts where there is little room for firms’ reactions. Bentzenand Smith (2002) study how sales of French wine in Denmark were affected by a call for a boycottof French products in response to the French nuclear testing in the South Pacific in 1995–1996;Chavis and Leslie (2009) and Ashenfelter, Ciccarella, and Shatz (2007) study whether Frenchwine was boycotted in the United States following the French opposition to the Iraq war in early2003; Hong et al. (2011) study the boycott of French automobiles in 2008 in China following thedisruption of the Olympic torch relay in Paris in April 2008 and the French president’s decisionto meet with the Dalai Lama in late 2008; and Clerides, Davis, and Michis (2015) study the effectof anti-American sentiment (but not an open boycott) caused by the 2003 Iraq war on sales of USsoft drinks and laundry detergents in nine Arab countries.8
Our article is also related to the literature that studies the effect of social networks on collec-tive action. This literature has focused on the effects of social networks on political participation invarious countries, for example, Acemoglu, Hassan, and Tahoun (2014), Iskander (2011), Breuer(2012), Enjolras, Steen-Johnsen, and Wollebaek (2012), Tufekci and Wilson (2012), Valenzuela,Arriagada, and Scherman (2012), and Gonzalez-Bailon and Wang (2013). There is also a recentliterature that studies the link between the Internet and voter turnout in elections in different Eu-ropean countries, for example, Campante, Durante, and Sobbrio (2013), Czernich (2012), Falck,Gold, and Heblich (2014), Gavazza, Nardotto, and Valletti (2015), and Miner (2015).
The article is organized as follows. In Section 2, we describe the background leading tothe boycott. Section 3 introduces the data, and Section 4 describes the evolution of prices andquantities and demand. In Section 5, we test whether price elasticities changed after the boycott.In Section 6, we look at the effect of demographics proxying for social networks. In Section 7,we examine how firms’ incentives were affected. Conclusions appear in Section 8.
7 Diermeier (2012) mentions four factors that are key to a boycott’s success: (i) customers must care passionatelyabout the issue, (ii) the cost of participation must be low (relatively small sacrifice by consumers), (iii) the issues must beeasy to understand, and (iv) the boycott must be widely covered in the mass media.
8 Fershtman and Gandal (1998) use product-level data to study the effect of the Arab boycott on Israel on consumerand producer welfare in the Israeli automobile market. This boycott, however, was imposed by Arab countries on Japanesecar manufacturers rather than by consumers.
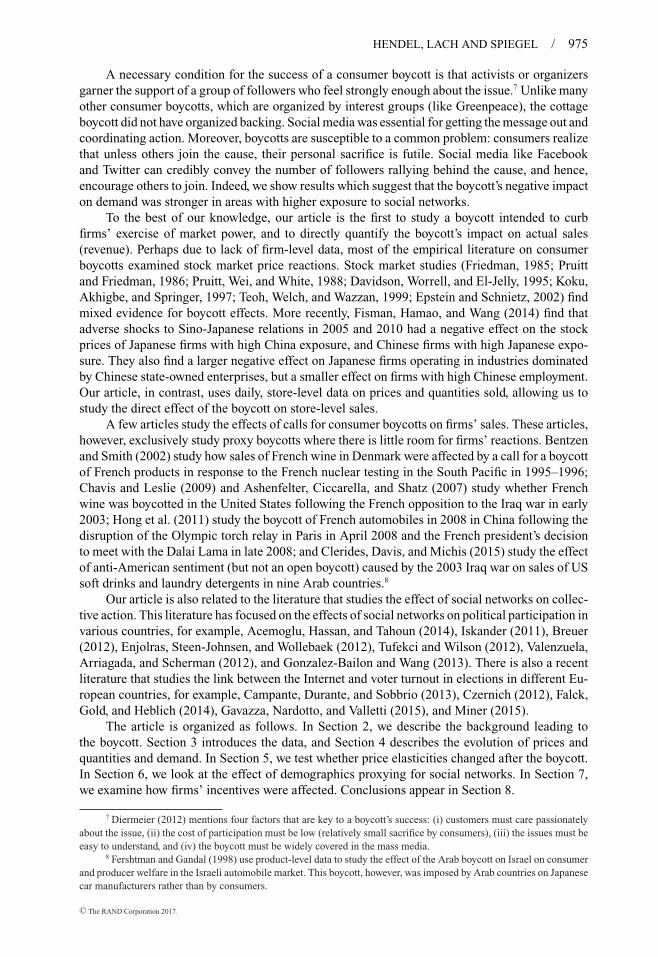
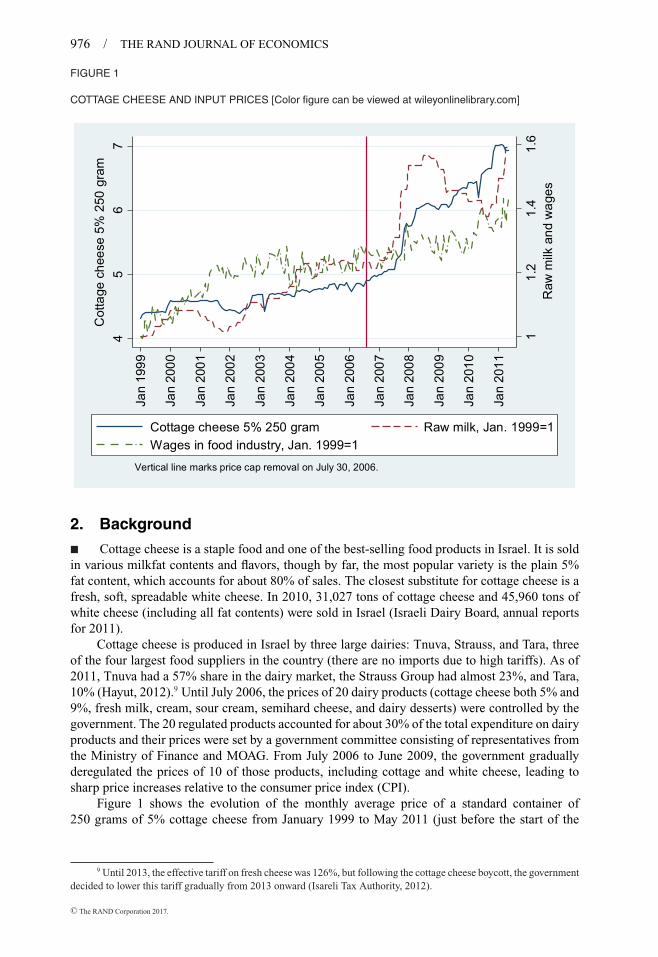
COTTAGE CHEESE AND INPUT PRICES [Color figure can be viewed at wileyonlinelibrary.com]
11.
21.
41.
6R
aw m
ilk a
nd w
ages
45
67
Cot
tage
che
ese
5% 2
50 g
ram
Jan
1999
Jan
2000
Jan
2001
Jan
2002
Jan
2003
Jan
2004
Jan
2005
Jan
2006
Jan
2007
Jan
2008
Jan
2009
Jan
2010
Jan
2011
Cottage cheese 5% 250 gram Raw milk, Jan. 1999=1Wages in food industry, Jan. 1999=1
Vertical line marks price cap removal on July 30, 2006.
2. Background
� Cottage cheese is a staple food and one of the best-selling food products in Israel. It is soldin various milkfat contents and flavors, though by far, the most popular variety is the plain 5%fat content, which accounts for about 80% of sales. The closest substitute for cottage cheese is afresh, soft, spreadable white cheese. In 2010, 31,027 tons of cottage cheese and 45,960 tons ofwhite cheese (including all fat contents) were sold in Israel (Israeli Dairy Board, annual reportsfor 2011).
Cottage cheese is produced in Israel by three large dairies: Tnuva, Strauss, and Tara, threeof the four largest food suppliers in the country (there are no imports due to high tariffs). As of2011, Tnuva had a 57% share in the dairy market, the Strauss Group had almost 23%, and Tara,10% (Hayut, 2012).9 Until July 2006, the prices of 20 dairy products (cottage cheese both 5% and9%, fresh milk, cream, sour cream, semihard cheese, and dairy desserts) were controlled by thegovernment. The 20 regulated products accounted for about 30% of the total expenditure on dairyproducts and their prices were set by a government committee consisting of representatives fromthe Ministry of Finance and MOAG. From July 2006 to June 2009, the government graduallyderegulated the prices of 10 of those products, including cottage and white cheese, leading tosharp price increases relative to the consumer price index (CPI).
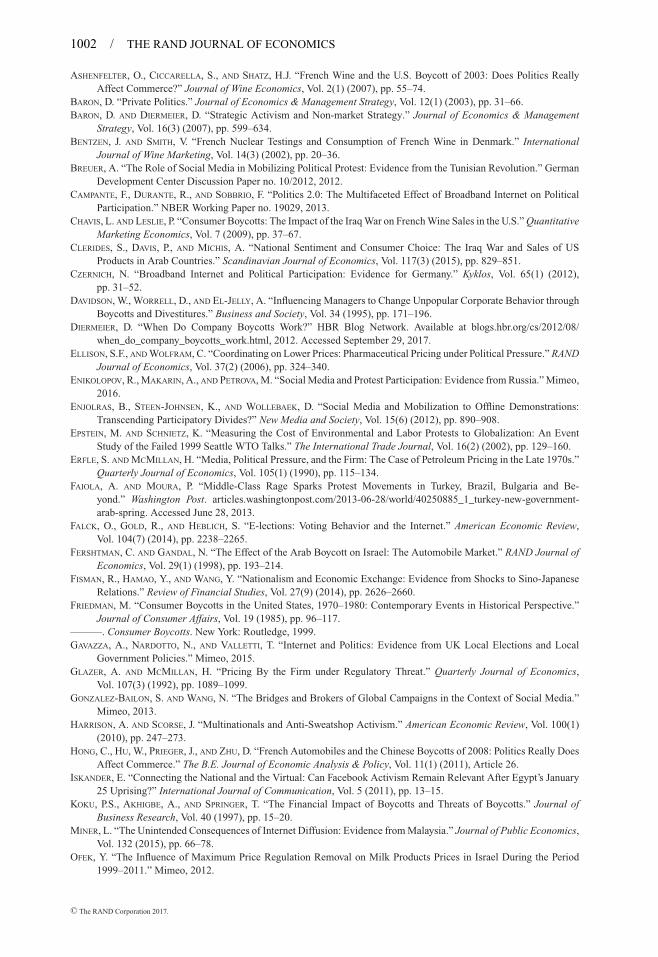
Figure 1 shows the evolution of the monthly average price of a standard container of250 grams of 5% cottage cheese from January 1999 to May 2011 (just before the start of the
9 Until 2013, the effective tariff on fresh cheese was 126%, but following the cottage cheese boycott, the governmentdecided to lower this tariff gradually from 2013 onward (Isareli Tax Authority, 2012).
cottage boycott).10 Figure 1 also shows the prices—relative to January 1999—of raw milk andwages in the food industry, two of the main cost drivers of cottage cheese (plotted on the right-handside axis).
As the figure shows, the price of cottage cheese hovered around 4.5–5 NIS until its deregu-lation on July 30, 2006. Following deregulation, the price increased sharply, reaching 7 NIS onthe eve of the boycott. This represents a 43% increase between July 2006 and May 2011. Bycomparison, the mean price of regulated dairy products increased by 10% over the same period(State Comptroller of Israel, 2012), and the index of food prices increased from 2005 to 2011by 31.6% (The Knesset Research and Information Center, 2011). The price of raw milk alsoincreased sharply in 2007, and this can account for part of the steep rise in the price of cottagecheese.11 However, the decline in the price of raw milk, which started at the end of 2008, wasnot passed-through to cottage prices. Wages exhibited less fluctuations over time, increasing byabout 11% during the post-deregulation period. Thus, only part of the price increase of cottagecheese after deregulation can be attributed to increases in input prices.
� The cottage boycott. In general, food prices in Israel increased substantially since 2005.12
Starting on May 31, 2011, a series of articles, describing this surge in food prices, as well as thegeneral high cost of living in Israel, were published in newspapers and on TV.13 The news reportswere followed by a sequence of events summarized in Appendix A.
On June 14, 2011, a Facebook event was created calling for a boycott of cottage cheese,starting on July 1, 2011. The Facebook event was widely covered by radio, TV, and newspapers.A day after the Facebook event started, nearly 30,000 Facebook users joined, and three days later,the number grew to 70,000. By June 30, 2011, the number surpassed 105,000. As a result of thissuccess, the event leaders announced on June 16, 2011 that the boycott would start immediatelyrather than on July 1, 2011, and recommended buying cottage and white cheese only if theirprices drop under 5 NIS.
The effect of the boycott was almost immediate: several supermarket chains started, alreadyon June 14, to offer cottage cheese and other dairy products at a special sale price.14 The protestleaders, however, argued that they would not stop the protest until the price of cottage fallspermanently under 5 NIS. Some politicians and government ministers also called for variousmeasures to control food prices.
On June 24, the chairperson of Tnuva’s board, announced in a TV interview that Tnuvawill not unilaterally lower its cottage cheese prices.15 Following the interview, three new groupsformed on Facebook, calling to boycott Tnuva’s products. In response to the new threats, Tnuvalowered the wholesale price of cottage cheese to 4.55 NIS, and soon after, the Strauss Group andTara followed suit.
10 The price plotted in the figure is based on monthly prices of cottage cheese collected from a cross-section ofstores in Israel by the Central Bureau of Statistics for the purposes of computing the monthly CPI. The figure plots thecross-sectional mean of prices. The data in the figure come from Ofek (2012).
11 The cost of raw milk accounted for 36.5% of the retail price of cottage cheese in January 2006 and 27.8% of theprice of cottage cheese in June 2011 (The Knesset Research and Information Center, 2011).
12 The cumulative annual growth rate of food prices in Israel between September 2005 and June 2011 was 5%,compared with 2.1% for the period January 2000 to September 2005, and compared with 3.2% in the Organisation forEconomic Co-operation and Development (OECD) countries for the 2005–2011 period (the Kedmi Committee Report,2012).
13 The stories were first published in the evening financial newspaper Globes (Globes, 2011), though other news-papers and TV news soon followed.
14 For instance, Rami Levy announced that they will offer Tnuva, Strauss, and Tara cottage cheese for a few daysat a special price of 4.90 NIS, instead of the regular price of 6.50 NIS, while Shufersal, which is the largest supermarketchain in Israel, announced a special “buy one get one free” sale for a few days on Tnuva and Tara cottage cheese forshoppers who spend more than 75 NIS (Kristal, 2011a; Yefet, 2011).
15 Specifically, the chairperson said that Tnuva will agree to lower its prices only if both dairy farmers, supermarkets,and the government will contribute to the price reduction (Leibzon, 2011).
In July 2011, the “tents protest,” which also started on Facebook, led thousands of peopleto set up tents in the center of cities around the country to protest the rising cost of living anddemanding social justice. Motivated by the protest, the student associations in 12 colleges anduniversities announced at the beginning of September 2011 that they intend to boycott Tnuvauntil it lowers its prices.
In response to the boycott, the government appointed on June 27, 2011, a joint committeeto review the level of competition and prices in Israel (the Kedmi Committee). The committeesubmitted its recommendations on the dairy market by mid-July 2011. Among other things, itrecommended a gradual opening of the dairy market to competition, removing import tariffs, andeliminating the exemptions to produce distributors from antitrust action.
On September 25, 2011, the Israeli Antitrust Authority (IAA) raided Tnuva’s offices, as partof an open investigation on the extent of competition in the dairy industry. According to the press,the IAA seized, among other things, a 2008 McKinsey report which advised Tnuva to raise pricesby at least 15% due to inelastic demand (YNET, 2011).16 Shortly after the raid, on October 2,2011, the chairperson of Tnuva’s board announced her resignation, which was followed by pricecuts of around 15% on dozens of products.17
3. Data, sample selection, and aggregation
� We purchased data from a private company providing data services to the retail sector.The raw data record the daily transactions of the cottage and white cheese categories in 2169stores throughout the country, over the period January 1, 2010–April 30, 2012. Each observationrepresents the total quantity and total revenue recorded by the cash register on a specific item—identified by its unique barcode—in a specific store and day. The raw data set has over 22 millionobservations on 339 items over time and across stores.
Items vary in terms of physical attributes (weight, flavors, fat content, packaging, kashrutstandards, etc.), as well as manufacturer. We restrict attention to the most popular configurations:250-gram containers of plain cottage and white cheese, with 3% and 5% fat content, producedby the three major manufacturers, which for confidentiality reasons, we label A, B, and C (weuse the terms “brand” and “manufacturer” interchangeably). These 12 configurations accountfor about 80% of cottage cheese sales in the original data, and 30% of white cheese sales.After aggregation and further elimination of stores with infrequent sales and observations onsales on Saturdays (most stores are closed on Saturday for religious reasons), we are left with6,596,052 observations from 1127 stores over 729 days between January 1, 2010 and April 30,2012 (excluding Saturdays). The deleted observations represent about 5% of the total sales. InAppendix B, we describe in detail how we cleaned the data.
Because the prices of the 3% and 5% fat varieties of the same brand are highly cor-related (the correlation is above 95% for cottage cheese and around 85% for white cheese),we aggregated the sales of 3% and 5% cottage cheese and 3% and 5% white cheese of thesame brand into a single product. Hence, our sample includes six products: one cottage cheeseand one white cheese per brand. For instance, brand A cottage cheese refers to “brand A cot-tage cheese of 3% and 5% fat.” In 55% of the store-date observations, all six products aresold. About 75% sell at least five products. Thus, in most observations, most of the prod-ucts are being transacted, which is not surprising given the popularity of cottage and whitecheeses.
16 Mckinsey was asked to write the report by Apax Partners, which is a U.S. private equity fund, after it acquiredTnuva in January 2008. Prior to the acquisition, Tnuva was a cooperative of 620 kibbutzim and moshavim (agriculturalcommunities).
17 Interestingly, Tnuva’s chief economist opposed McKinsey’s recommendation to raise prices by 15% and “warnedthe company that raising prices was liable to blow up in their faces” (Hayut, 2011).
Convenience stores 54 5 0.3Grocery stores 84 7 0.8Minimarkets 320 28 8.9Main local supermarket chains 290 26 28.6Main HD supermarket chains 227 20 36.6Other HD supermarket chains 152 13 24.9
Total 1127 100 100
The price per 250 grams (the standard size of a container) of cottage cheese of brandb = A, B, C , in store s at time t is computed as follows:
pcbst = 250 × r c
bst
qcbst
, (1)
where r cbst is the total revenue from selling 3% and 5% cottage cheese of brand b in store s at time
t , and qcbst is the corresponding quantity in grams.18 The price of white cheese, pw
bst, is definedsimilarly. These prices can be thought of as the quantity-weighted mean price across all dailyindividual transactions (for a given product and store).19
Table 1 shows the business formats of the 1127 stores in our final data set. “HD supermarkets”are large format stores that offer hard discounts (HD). “Local supermarkets” are smaller stores,carry fewer products, and tend to have higher prices. The “Other HD supermarkets” comprisessmaller chains which were founded for the most part in the 1990s, and operate 10–30 stores each.
Most stores—46%—belong to the main supermarket chains and these stores are similarlydistributed between HD and local supermarkets. These stores account for 65% of the sales in oursample. Other HD supermarkets account for only 13% of the stores in the sample, but for almost25% of the sales. The smaller store formats (convenience stores, groceries, and minimarkets),represent 40% of the stores, but only 10% of the sales. The largest metropolitan area in Israel—theTel Aviv region—accounts for almost a quarter of the stores. The remaining stores are equallydistributed across the rest of the country.
4. Anatomy of the cottage boycott
� We first look at the evolution of prices. We then turn to quantities in order to assess the harmconsumers inflicted on manufacturers. We later estimate demand functions to assess the impact ofthe boycott on demand and examine how demand changes correlate with various demographicsproxying for exposure to social networks.
� Firms’ reaction to the boycott: prices. Figure 2 shows the daily, quantity-weighted meanprice of cottage cheese by brand. Prices are computed using equation (1), for each brand b =A, B, C , and averaged across stores using quantity weights.20 Several points are worth mentioning.First, the prices of the three brands are fairly close to each other, which is surprising in light ofthe very different own-price elasticities reported in the next section.
18 To avoid keying errors (typos), we deleted from the sample 15,682 observations with prices below 3.75 NIS orabove 9 NIS per 250-gram container. These observations represent a quarter of 1% of the observations; the bottom andupper 1 percentiles are 4.60 NIS and 7.90 NIS.
19 Weighting by quantity will only matter if prices differ across transactions within the same day (e.g., due toquantity discounts), but we are not aware of this happening in cottage and white cheeses. The price of an item not beingsold in a store in a given day is set to missing.
20 The price lines are not smooth because the weights change on a daily basis, even though prices change lessfrequently. These prices are consistent with the Central Bureau of Statistics data shown earlier in Figure 1.
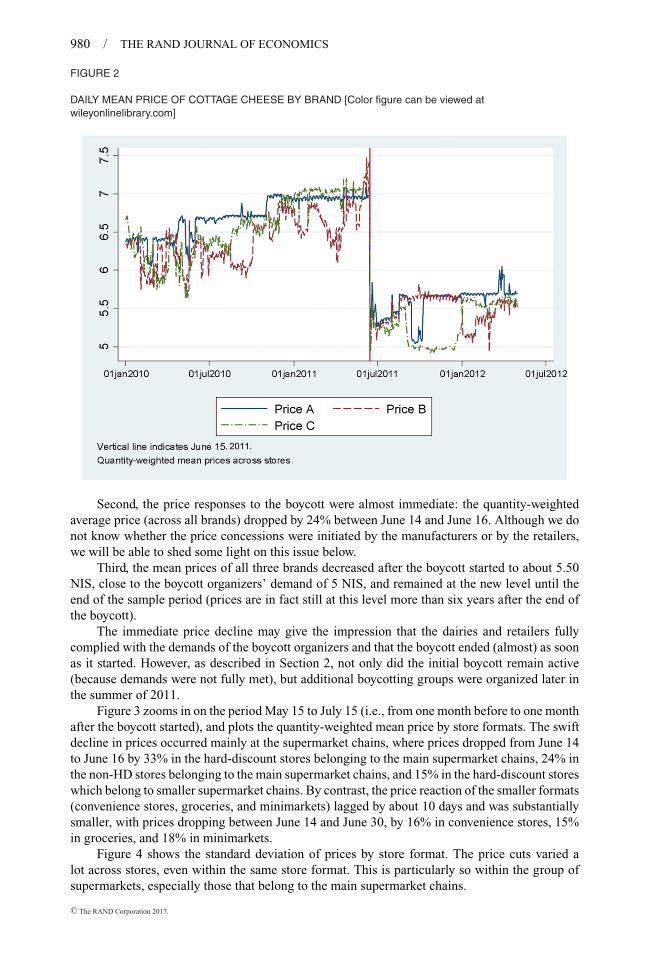
DAILY MEAN PRICE OF COTTAGE CHEESE BY BRAND [Color figure can be viewed atwileyonlinelibrary.com]
Second, the price responses to the boycott were almost immediate: the quantity-weightedaverage price (across all brands) dropped by 24% between June 14 and June 16. Although we donot know whether the price concessions were initiated by the manufacturers or by the retailers,we will be able to shed some light on this issue below.
Third, the mean prices of all three brands decreased after the boycott started to about 5.50NIS, close to the boycott organizers’ demand of 5 NIS, and remained at the new level until theend of the sample period (prices are in fact still at this level more than six years after the end ofthe boycott).
The immediate price decline may give the impression that the dairies and retailers fullycomplied with the demands of the boycott organizers and that the boycott ended (almost) as soonas it started. However, as described in Section 2, not only did the initial boycott remain active(because demands were not fully met), but additional boycotting groups were organized later inthe summer of 2011.
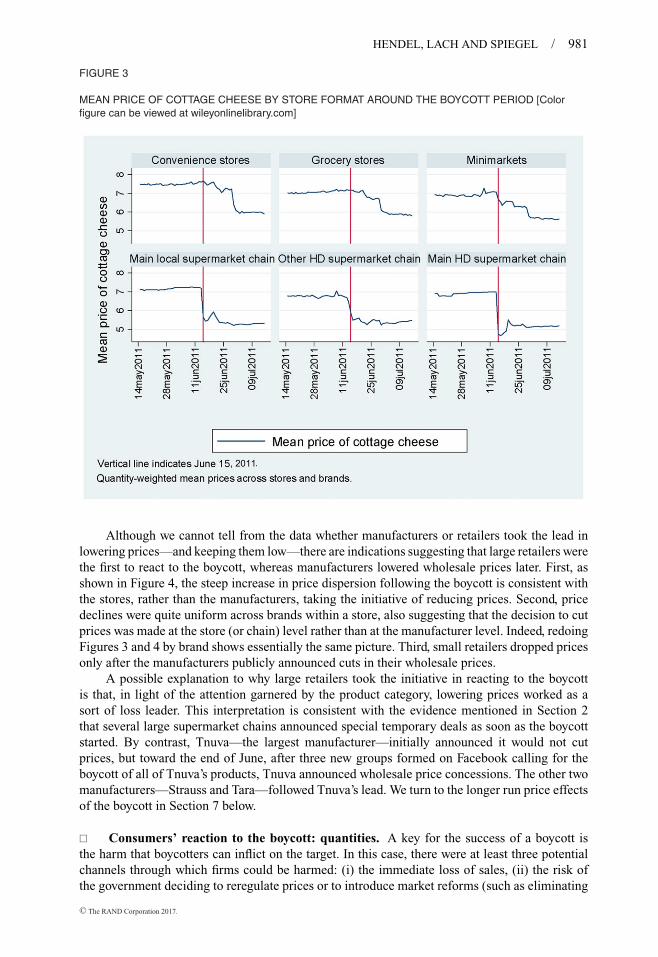
Figure 3 zooms in on the period May 15 to July 15 (i.e., from one month before to one monthafter the boycott started), and plots the quantity-weighted mean price by store formats. The swiftdecline in prices occurred mainly at the supermarket chains, where prices dropped from June 14to June 16 by 33% in the hard-discount stores belonging to the main supermarket chains, 24% inthe non-HD stores belonging to the main supermarket chains, and 15% in the hard-discount storeswhich belong to smaller supermarket chains. By contrast, the price reaction of the smaller formats(convenience stores, groceries, and minimarkets) lagged by about 10 days and was substantiallysmaller, with prices dropping between June 14 and June 30, by 16% in convenience stores, 15%in groceries, and 18% in minimarkets.
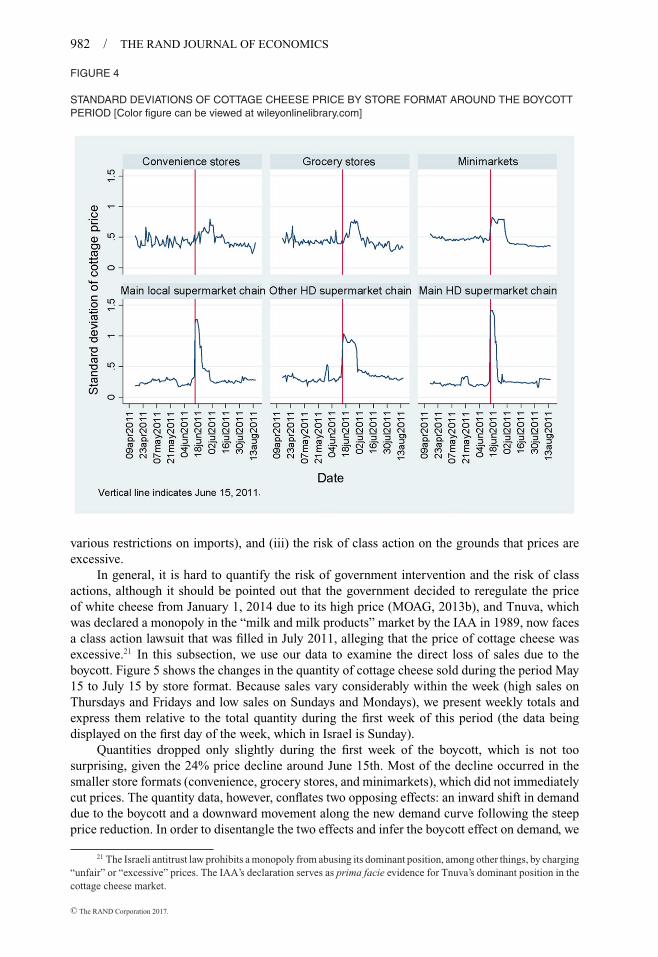
Figure 4 shows the standard deviation of prices by store format. The price cuts varied alot across stores, even within the same store format. This is particularly so within the group ofsupermarkets, especially those that belong to the main supermarket chains.
MEAN PRICE OF COTTAGE CHEESE BY STORE FORMAT AROUND THE BOYCOTT PERIOD [Colorfigure can be viewed at wileyonlinelibrary.com]
Although we cannot tell from the data whether manufacturers or retailers took the lead inlowering prices—and keeping them low—there are indications suggesting that large retailers werethe first to react to the boycott, whereas manufacturers lowered wholesale prices later. First, asshown in Figure 4, the steep increase in price dispersion following the boycott is consistent withthe stores, rather than the manufacturers, taking the initiative of reducing prices. Second, pricedeclines were quite uniform across brands within a store, also suggesting that the decision to cutprices was made at the store (or chain) level rather than at the manufacturer level. Indeed, redoingFigures 3 and 4 by brand shows essentially the same picture. Third, small retailers dropped pricesonly after the manufacturers publicly announced cuts in their wholesale prices.
A possible explanation to why large retailers took the initiative in reacting to the boycottis that, in light of the attention garnered by the product category, lowering prices worked as asort of loss leader. This interpretation is consistent with the evidence mentioned in Section 2that several large supermarket chains announced special temporary deals as soon as the boycottstarted. By contrast, Tnuva—the largest manufacturer—initially announced it would not cutprices, but toward the end of June, after three new groups formed on Facebook calling for theboycott of all of Tnuva’s products, Tnuva announced wholesale price concessions. The other twomanufacturers—Strauss and Tara—followed Tnuva’s lead. We turn to the longer run price effectsof the boycott in Section 7 below.
� Consumers’ reaction to the boycott: quantities. A key for the success of a boycott isthe harm that boycotters can inflict on the target. In this case, there were at least three potentialchannels through which firms could be harmed: (i) the immediate loss of sales, (ii) the risk ofthe government deciding to reregulate prices or to introduce market reforms (such as eliminating
STANDARD DEVIATIONS OF COTTAGE CHEESE PRICE BY STORE FORMAT AROUND THE BOYCOTTPERIOD [Color figure can be viewed at wileyonlinelibrary.com]
various restrictions on imports), and (iii) the risk of class action on the grounds that prices areexcessive.
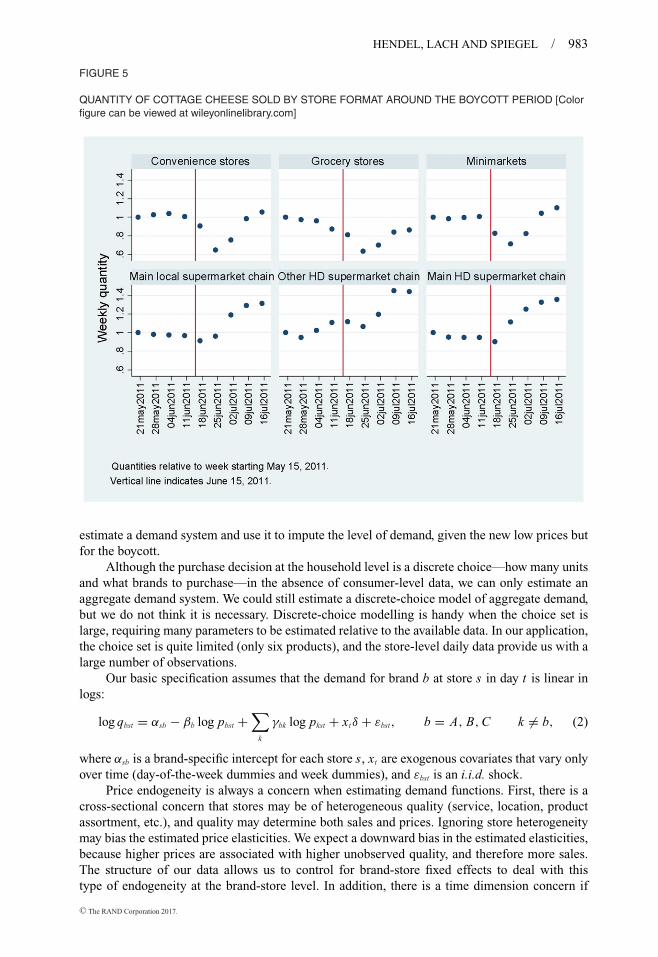
In general, it is hard to quantify the risk of government intervention and the risk of classactions, although it should be pointed out that the government decided to reregulate the priceof white cheese from January 1, 2014 due to its high price (MOAG, 2013b), and Tnuva, whichwas declared a monopoly in the “milk and milk products” market by the IAA in 1989, now facesa class action lawsuit that was filled in July 2011, alleging that the price of cottage cheese wasexcessive.21 In this subsection, we use our data to examine the direct loss of sales due to theboycott. Figure 5 shows the changes in the quantity of cottage cheese sold during the period May15 to July 15 by store format. Because sales vary considerably within the week (high sales onThursdays and Fridays and low sales on Sundays and Mondays), we present weekly totals andexpress them relative to the total quantity during the first week of this period (the data beingdisplayed on the first day of the week, which in Israel is Sunday).
Quantities dropped only slightly during the first week of the boycott, which is not toosurprising, given the 24% price decline around June 15th. Most of the decline occurred in thesmaller store formats (convenience, grocery stores, and minimarkets), which did not immediatelycut prices. The quantity data, however, conflates two opposing effects: an inward shift in demanddue to the boycott and a downward movement along the new demand curve following the steepprice reduction. In order to disentangle the two effects and infer the boycott effect on demand, we
21 The Israeli antitrust law prohibits a monopoly from abusing its dominant position, among other things, by charging“unfair” or “excessive” prices. The IAA’s declaration serves as prima facie evidence for Tnuva’s dominant position in thecottage cheese market.
QUANTITY OF COTTAGE CHEESE SOLD BY STORE FORMAT AROUND THE BOYCOTT PERIOD [Colorfigure can be viewed at wileyonlinelibrary.com]
estimate a demand system and use it to impute the level of demand, given the new low prices butfor the boycott.
Although the purchase decision at the household level is a discrete choice—how many unitsand what brands to purchase—in the absence of consumer-level data, we can only estimate anaggregate demand system. We could still estimate a discrete-choice model of aggregate demand,but we do not think it is necessary. Discrete-choice modelling is handy when the choice set islarge, requiring many parameters to be estimated relative to the available data. In our application,the choice set is quite limited (only six products), and the store-level daily data provide us with alarge number of observations.
Our basic specification assumes that the demand for brand b at store s in day t is linear inlogs:
log qbst = αsb − βb log pbst +∑
k
γbk log pkst + xtδ + εbst, b = A, B, C k �= b, (2)
where αsb is a brand-specific intercept for each store s, xt are exogenous covariates that vary onlyover time (day-of-the-week dummies and week dummies), and εbst is an i.i.d. shock.
Price endogeneity is always a concern when estimating demand functions. First, there is across-sectional concern that stores may be of heterogeneous quality (service, location, productassortment, etc.), and quality may determine both sales and prices. Ignoring store heterogeneitymay bias the estimated price elasticities. We expect a downward bias in the estimated elasticities,because higher prices are associated with higher unobserved quality, and therefore more sales.The structure of our data allows us to control for brand-store fixed effects to deal with thistype of endogeneity at the brand-store level. In addition, there is a time dimension concern if
unobserved demand shocks drive both prices and quantities. We therefore include “day-of-the-week” dummies to control for within-week consumption variation, and dummies for each of the121 weeks in the sample to control, in a flexible way, for main holidays, seasonality, and othertrends for each brand of cottage cheese. The price variation used for estimation is, therefore,store-level deviations from the daily mean price (which itself evolves over time) for each brand.As suggested by Figure 1, most of the variation in prices is over time and can be traced tonational-level (wholesale) changes generated by manufacturers. As shown in Figure 4, however,there is also some variation in prices across stores, even after controlling for store format. Forexample, in supermarkets belonging to the main retail chains, prices are likely to be set at thechain level rather than by individual store managers. Discussions with insiders suggest that themain retail chains set prices by geographical and socioeconomic areas (unknown to us), whichin turn generates variation in prices across stores at a given point in time. In other words, thevariation in store-level prices is related to the differential timing and depth by which wholesaleprice changes are passed through to local store levels. Importantly, wholesale price changes arenot likely to be driven by changes in store-specific demand. Thus, given our understanding ofpricing in this market and using the added controls, we believe that endogeneity of store-levelprices is not a major concern in this context.
Decomposing the variation of (log) price for each of the three brands we find that, on average,store and week dummies account for 13% and 64% of the total variation (the differences acrossbrands are minor). “Day-of-the-week” dummies account for almost nothing. Thus, most of thevariation in prices is over time. Naturally, the week dummies capture the break in prices due tothe boycott but, redoing the variance decomposition for the subperiod before the boycott (beforeMay 15, 2011) and for the subperiod after the boycott (after October 2, 2011), we find that weekdummies account for a substantial 27% of (log) price variation.
An additional endogeneity concern, not addressed by store and week fixed effects, is dueto store- or chain-specific promotions. Although cottage cheese products are not the subjectof specific promotions (as indicated to us by industry insiders) there are retailer-brand-levelpromotions (including cottage cheese) which may create a spurious relation between prices andquantity. We expect the estimated elasticities to be upward biased (in absolute value) as low pricesmay capture promotional activities.
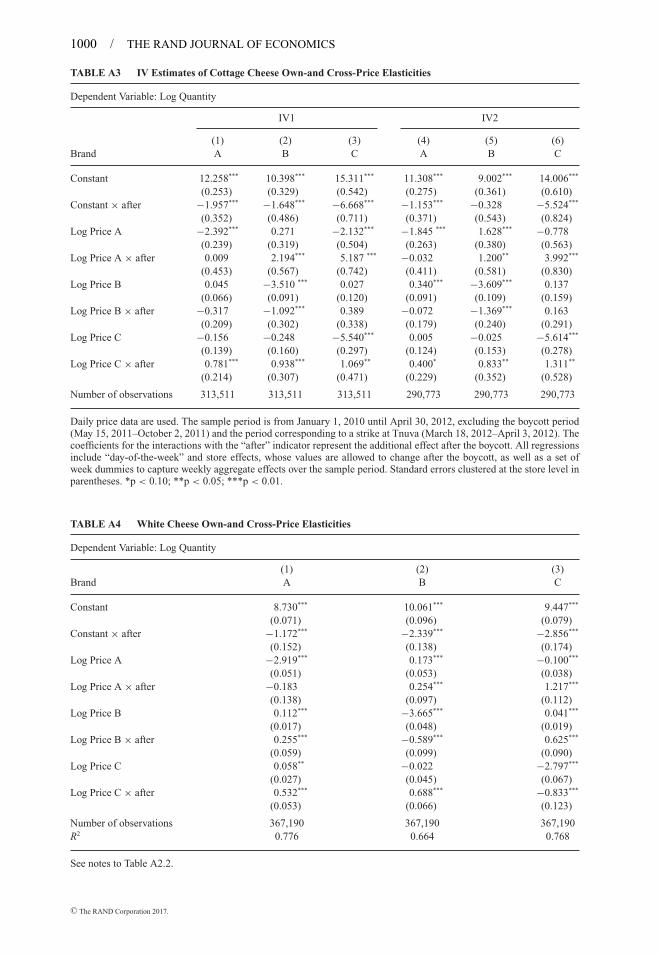
To verify that promotional activity does not substantially affect our estimated elasticities,we use prices in other cities, prices of other chains in the same city, and prices of other chains inother cities to instrument for prices in equation (2). Instrumenting leads to very limited qualitativedifferences; elasticities remain of the same order of magnitude. These estimates are shown inTable A3 in Appendix A. The IV estimates, however, are sensitive to which specific instrumentsand which fixed effects are used, and often result in negative cross-prices effects.22 For thesereasons, we are more confident in our OLS-fixed effect estimator of equation (2), which we adoptfor the rest of the article. Notice also that our interest is in “before and after” and “across locations”comparisons, and therefore our conclusions should remain valid as long as any potential biasesare not systematically different across these dimensions.
OLS-fixed effects estimates of the demand parameters are shown in Table 2 and describedlater in Section 5. For now, we only use the estimated parameters for the pre-boycott period(January 1, 2010–June 14, 2011) from the basic specification (columns (1)–(3)) to predict quantityunder the pre-boycott demand function at post-boycott prices. Formally, we define the boycottindex at time t as follows:
BI(pt , qt ) = 100 ×(
qt
q̂pre(pt )− 1
),
22 A possible reason for this fragility is that the retail chain information is less reliable than our price data as it wasput together by matching stores’ addresses to information available on the Internet on retail chain branches.
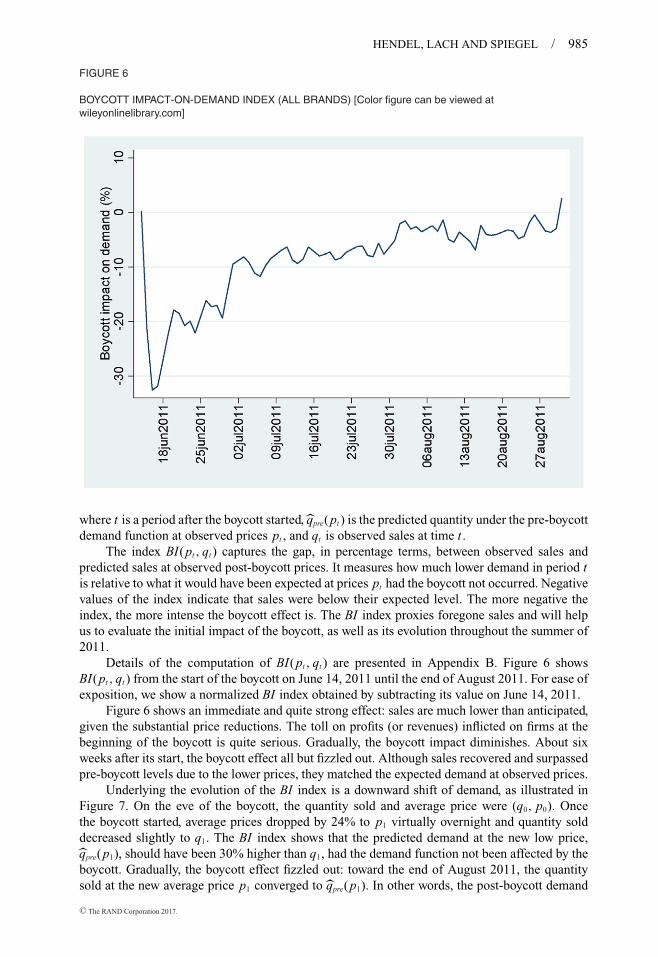
BOYCOTT IMPACT-ON-DEMAND INDEX (ALL BRANDS) [Color figure can be viewed atwileyonlinelibrary.com]
where t is a period after the boycott started, q̂pre(pt ) is the predicted quantity under the pre-boycottdemand function at observed prices pt , and qt is observed sales at time t .
The index BI(pt , qt ) captures the gap, in percentage terms, between observed sales andpredicted sales at observed post-boycott prices. It measures how much lower demand in period tis relative to what it would have been expected at prices pt had the boycott not occurred. Negativevalues of the index indicate that sales were below their expected level. The more negative theindex, the more intense the boycott effect is. The BI index proxies foregone sales and will helpus to evaluate the initial impact of the boycott, as well as its evolution throughout the summer of2011.
Details of the computation of BI(pt , qt ) are presented in Appendix B. Figure 6 showsBI(pt , qt ) from the start of the boycott on June 14, 2011 until the end of August 2011. For ease ofexposition, we show a normalized BI index obtained by subtracting its value on June 14, 2011.
Figure 6 shows an immediate and quite strong effect: sales are much lower than anticipated,given the substantial price reductions. The toll on profits (or revenues) inflicted on firms at thebeginning of the boycott is quite serious. Gradually, the boycott impact diminishes. About sixweeks after its start, the boycott effect all but fizzled out. Although sales recovered and surpassedpre-boycott levels due to the lower prices, they matched the expected demand at observed prices.
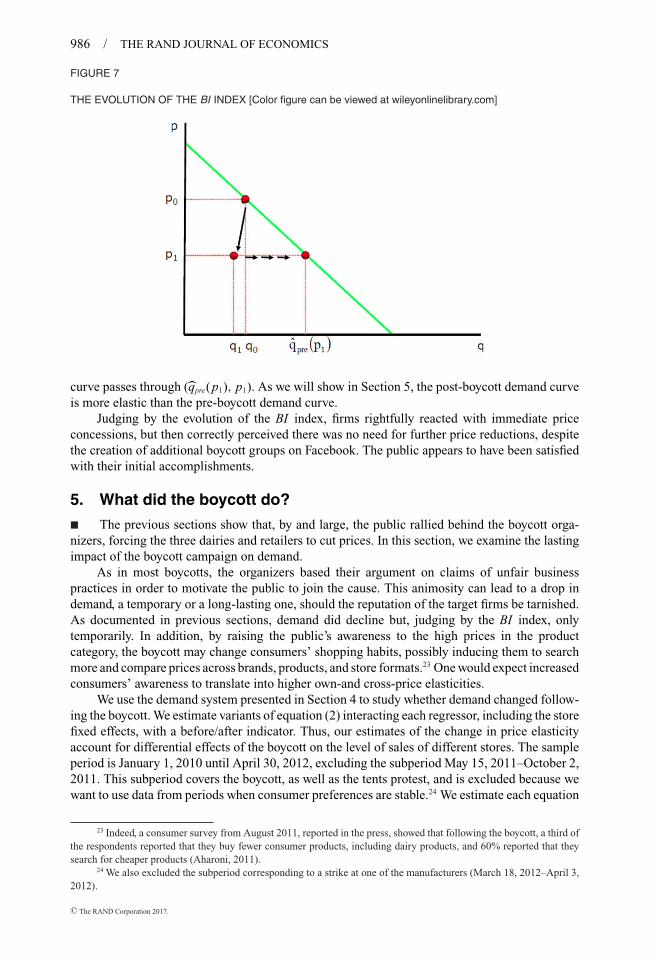
Underlying the evolution of the BI index is a downward shift of demand, as illustrated inFigure 7. On the eve of the boycott, the quantity sold and average price were (q0, p0). Oncethe boycott started, average prices dropped by 24% to p1 virtually overnight and quantity solddecreased slightly to q1. The BI index shows that the predicted demand at the new low price,q̂pre(p1), should have been 30% higher than q1, had the demand function not been affected by theboycott. Gradually, the boycott effect fizzled out: toward the end of August 2011, the quantitysold at the new average price p1 converged to q̂pre(p1). In other words, the post-boycott demand
THE EVOLUTION OF THE BI INDEX [Color figure can be viewed at wileyonlinelibrary.com]
curve passes through (̂qpre(p1), p1). As we will show in Section 5, the post-boycott demand curveis more elastic than the pre-boycott demand curve.
Judging by the evolution of the BI index, firms rightfully reacted with immediate priceconcessions, but then correctly perceived there was no need for further price reductions, despitethe creation of additional boycott groups on Facebook. The public appears to have been satisfiedwith their initial accomplishments.
5. What did the boycott do?
� The previous sections show that, by and large, the public rallied behind the boycott orga-nizers, forcing the three dairies and retailers to cut prices. In this section, we examine the lastingimpact of the boycott campaign on demand.
As in most boycotts, the organizers based their argument on claims of unfair businesspractices in order to motivate the public to join the cause. This animosity can lead to a drop indemand, a temporary or a long-lasting one, should the reputation of the target firms be tarnished.As documented in previous sections, demand did decline but, judging by the BI index, onlytemporarily. In addition, by raising the public’s awareness to the high prices in the productcategory, the boycott may change consumers’ shopping habits, possibly inducing them to searchmore and compare prices across brands, products, and store formats.23 One would expect increasedconsumers’ awareness to translate into higher own-and cross-price elasticities.
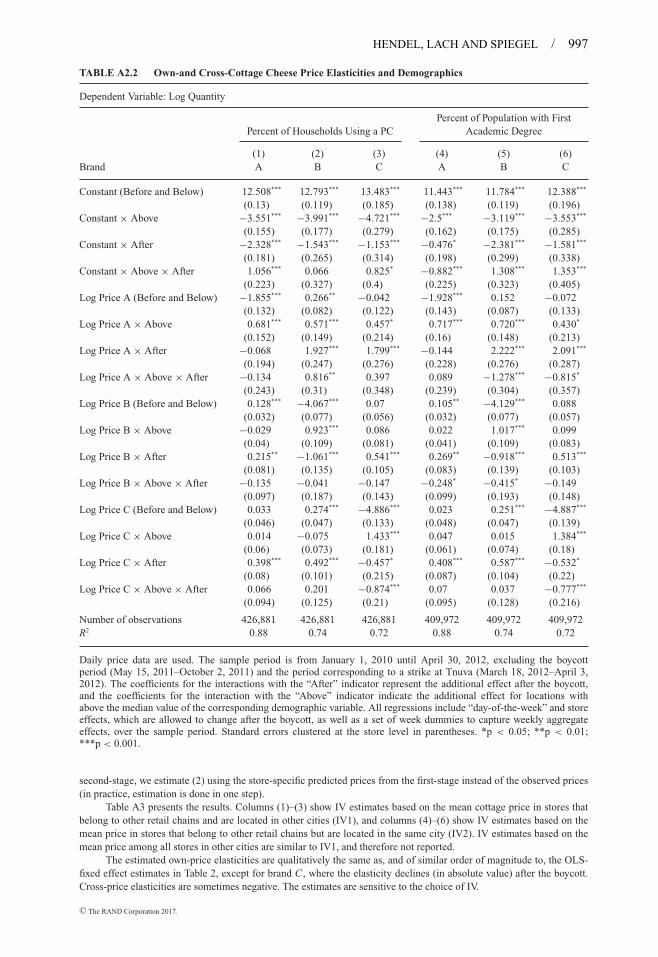
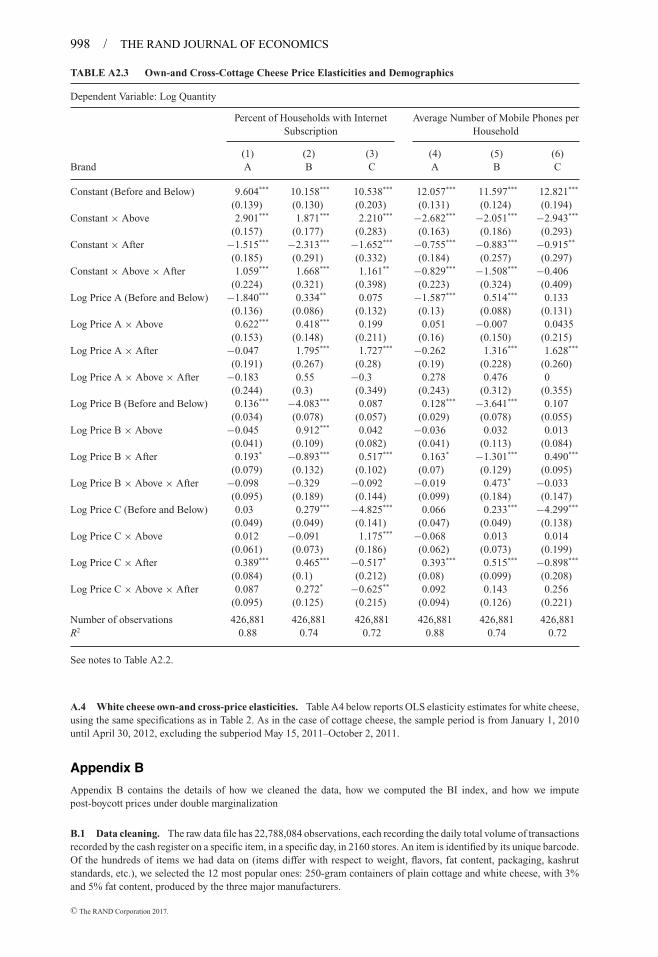
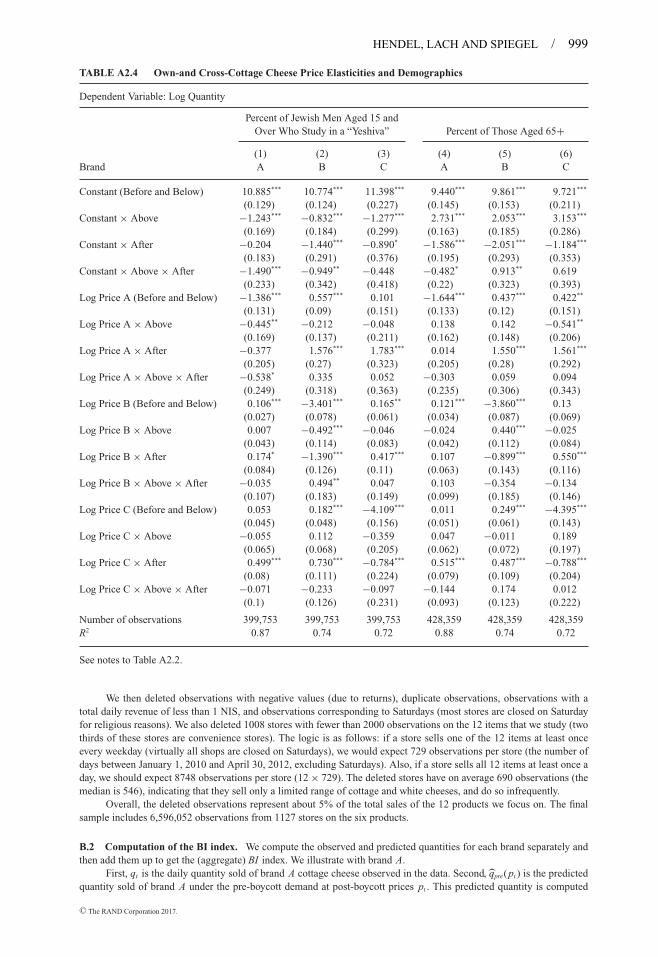
We use the demand system presented in Section 4 to study whether demand changed follow-ing the boycott. We estimate variants of equation (2) interacting each regressor, including the storefixed effects, with a before/after indicator. Thus, our estimates of the change in price elasticityaccount for differential effects of the boycott on the level of sales of different stores. The sampleperiod is January 1, 2010 until April 30, 2012, excluding the subperiod May 15, 2011–October 2,2011. This subperiod covers the boycott, as well as the tents protest, and is excluded because wewant to use data from periods when consumer preferences are stable.24 We estimate each equation
23 Indeed, a consumer survey from August 2011, reported in the press, showed that following the boycott, a third ofthe respondents reported that they buy fewer consumer products, including dairy products, and 60% reported that theysearch for cheaper products (Aharoni, 2011).
24 We also excluded the subperiod corresponding to a strike at one of the manufacturers (March 18, 2012–April 3,2012).
(0.028) (0.046) (0.108)Log Price C × after 0.436*** 0.569*** −0.771*** 0.372*** 0.365** −1.931***
(0.033) (0.042) (0.105) (0.065) (0.113) (0.208)Log Price A white cheese – – – −0.207*** −0.084* −0.166***
(0.029) (0.038) (0.051)Log Price A white cheese × after – – – 0.127* 0.187 0.521***
(0.074) (0.105) (0.114)Log Price B white cheese – – – 0.012 0.019 0.034
(0.015) (0.024) (0.032)Log Price B white cheese × after – – – 0.009 0.364*** −0.019
(0.044) (0.086) (0.073)Log Price C white cheese – – – −0.037* 0.003 −0.373***
(0.021) (0.034) (0.051)Log Price C white cheese × after – – – 0.074* 0.192** 1.053***
(0.044) (0.08) (0.115)
Number of observations 431,954 431,954 431,954 330,907 330,907 330,907R2 0.88 0.74 0.72 0.87 0.72 0.71
Daily price data are used. The sample period is from January 1, 2010 until April 30, 2012, excluding the boycott period(May 15, 2011–October 2, 2011) and the period corresponding to a strike at Tnuva (March 18, 2012–April 3, 2012). Thecoefficients for the interactions with the “after” indicator represent the additional effect after the boycott. All regressionsinclude “day-of-the-week” and store effects, whose values are allowed to change after the boycott, as well as a set ofweek dummies to capture weekly aggregate effects over the sample period. Standard errors clustered at the store level inparentheses. *p < 0.10; **p < 0.05; ***p < 0.01.
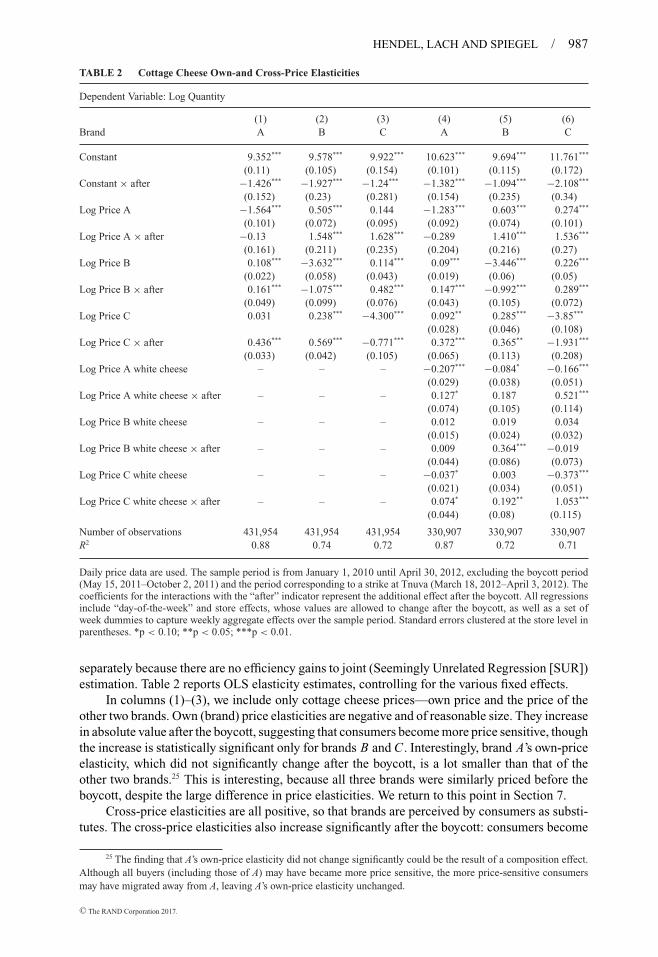
separately because there are no efficiency gains to joint (Seemingly Unrelated Regression [SUR])estimation. Table 2 reports OLS elasticity estimates, controlling for the various fixed effects.
In columns (1)–(3), we include only cottage cheese prices—own price and the price of theother two brands. Own (brand) price elasticities are negative and of reasonable size. They increasein absolute value after the boycott, suggesting that consumers become more price sensitive, thoughthe increase is statistically significant only for brands B and C . Interestingly, brand A’s own-priceelasticity, which did not significantly change after the boycott, is a lot smaller than that of theother two brands.25 This is interesting, because all three brands were similarly priced before theboycott, despite the large difference in price elasticities. We return to this point in Section 7.
Cross-price elasticities are all positive, so that brands are perceived by consumers as substi-tutes. The cross-price elasticities also increase significantly after the boycott: consumers become
25 The finding that A’s own-price elasticity did not change significantly could be the result of a composition effect.Although all buyers (including those of A) may have became more price sensitive, the more price-sensitive consumersmay have migrated away from A, leaving A’s own-price elasticity unchanged.
DAILY MEAN PRICE OF WHITE CHEESE BY BRAND [Color figure can be viewed at wileyonlinelibrary.com]
more willing to substitute. The increase in cross-price elasticities is quite substantial: the averageof the six cross-brand price elasticities, over the three equations, was 0.198 before the boycott andincreased five-fold to 1.002 after the boycott. Especially large is the increase in substitutabilitybetween brands A and C .
The change in own- and in cross-price elasticities is consistent with the boycott havingincreased consumers’ awareness, prompting them to engage in more active search for lowerprices and in more substitution across brands.
In columns (4)–(6), we add the prices of the three brands of white cheese. The number ofobservations is reduced by about 23%, because many stores do not sell all six products on anygiven day. Although many of the estimated white cheese price coefficients are significant, in mostcases, the cottage cheese price elasticities do not change much. Because the latter are the mainfocus of the article, we omit white cheese prices from the regressions that follow for the sake ofparsimony and in order to use a larger sample.
The estimates in Table 2 are robust to different specifications of the regression model andclustering. For example, aggregating the data to a weekly frequency gives similar estimates of theprice elasticities. Clustering at the city level to account for spatial correlations among stores in thesame city generates very similar standard errors and does not change the statistical significanceof any of the estimates.
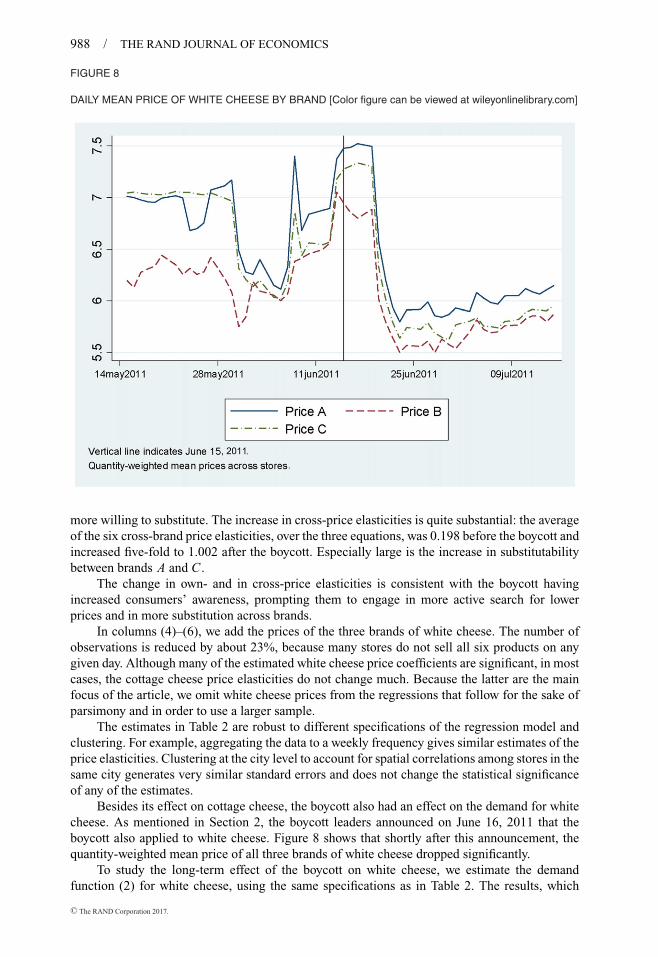
Besides its effect on cottage cheese, the boycott also had an effect on the demand for whitecheese. As mentioned in Section 2, the boycott leaders announced on June 16, 2011 that theboycott also applied to white cheese. Figure 8 shows that shortly after this announcement, thequantity-weighted mean price of all three brands of white cheese dropped significantly.
To study the long-term effect of the boycott on white cheese, we estimate the demandfunction (2) for white cheese, using the same specifications as in Table 2. The results, which
Coefficient of:Percent of those aged 15 and over with bachelor’s degree −.658*** 838
(0.138)Percent of men over 15 who study in a “yeshiva” (religious school) .195*** 817
(0.048)Percent of those aged 65+ −.007 886
(0.07)Percent of households using a PC −.362*** 882
(0.059)Percent of households with an Internet subscription −.360*** 882
(0.077)Average number of mobile phones per household −7.96*** 882
(1.639)
Standard errors clustered at the statistical area level in parentheses. ***p < 0.001.
appear in Table A4 in Appendix A, show that, similarly to cottage cheese, the own- (brand)price elasticities increased in absolute value after the boycott, though the increase is statisticallysignificant only for brands B and C , and the cross-brand price elasticities increased substantiallyafter the boycott.
6. Demographics and social networks
� Although the boycott led to a swift decrease in the price of cottage cheese all over thecountry, the intensity of the boycott and its impact on price elasticities were not uniform acrossregions. In this section, we examine the reaction of consumers in more detail by correlating theimpact of the boycott on demand and the changes in price elasticities with demographic variables.Some of these variables (e.g., Internet connection) may serve as proxies for the use of socialnetworks.
The demographic data come from the 2008 Israel Census of Population conducted by theCentral Bureau of Statistics. They correspond, when available, to the statistical area in whichthe store is located. A statistical area is a relatively small, homogeneous geographical area (withpopulation between 2000 and 5000) within cities, defined by the Central Bureau of Statistics(similarly to census tracts in the United States). When we do not have data at the statistical area,the match is done using demographic data at the subquarter, quarter, or city level.
� Who participated in the boycott? To examine how the impact of the boycott on demandvaried across different regions, we define for each store s, the average BI index for that store overthe period June 15–August 31, 2011:
BIs = 1
Ts
Ts∑t=1
100 ×(
qst
q̂pre(pst)− 1
),
where Ts is the number of days for which we have price and quantity observations for stores during the period. The index BIs shows the average daily percentage point decrease in salesof cottage cheese in store s during June 15–August 31, 2011 relative to what would have beenexpected at post-boycott prices had the boycott not occurred.
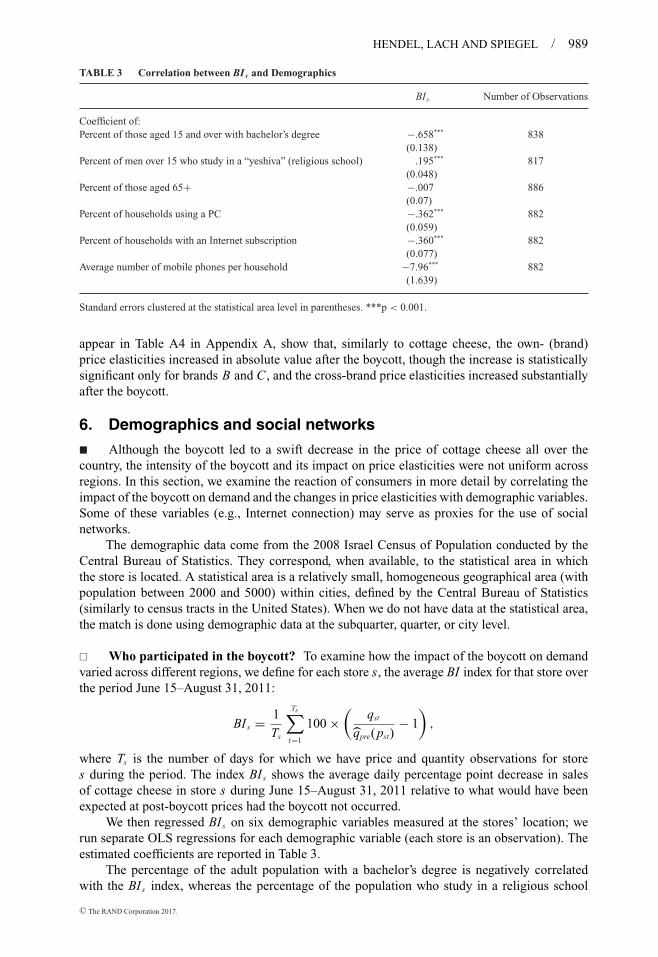
We then regressed BIs on six demographic variables measured at the stores’ location; werun separate OLS regressions for each demographic variable (each store is an observation). Theestimated coefficients are reported in Table 3.
The percentage of the adult population with a bachelor’s degree is negatively correlatedwith the BIs index, whereas the percentage of the population who study in a religious school
Standard errors clustered at the store level in parentheses. *p < 0.10; **p < 0.05; ***p < 0.01.
is positively correlated with the BIs index. This means that the decrease in demand for cottagecheese was stronger in areas with a more educated and a less religious population. The correlationsalso indicate that the boycott effect was stronger in areas where more households had a personalcomputer (PC), mobile phones, and Internet connection. To the extent that these variables arepositively correlated with exposure to social media, these results suggest that the boycott impact ondemand was stronger in areas with higher exposure to social networks. Of course, our demographicproxies do not reveal the causal effect of social media on the boycott’s impact, because they arealso correlated with other unobserved characteristics that are likely to affect quantity demanded.Nevertheless, they seem to work in the anticipated direction: namely, the impact of the boycott isstronger in locations where the demographics would suggest that the population was more likelyto be exposed to social networks. This finding validates our conclusion that the boycott had anegative impact on the demand for cottage cheese.
� Who was influenced by the boycott? We now examine whether demand changed differ-entially by demographic composition. To this end, we estimated the demand functions for eachbrand of cottage cheese, allowing the elasticities to vary with demographics, as well as with theboycott. We do this by interacting prices, as well as the store effects, with two indicators: one forthe store’s location being above the median value of each demographic variable, and the other forthe period after the boycott. We can thus assess the relation between demographics and demandelasticity and, more importantly, the relation between demographics and changes in elasticitiesfollowing the boycott.
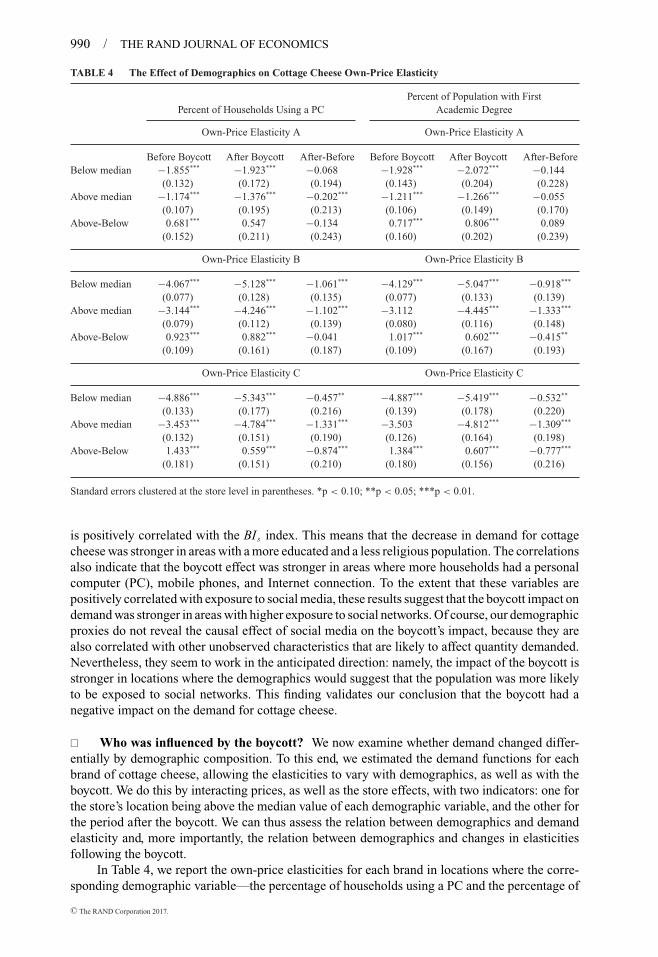
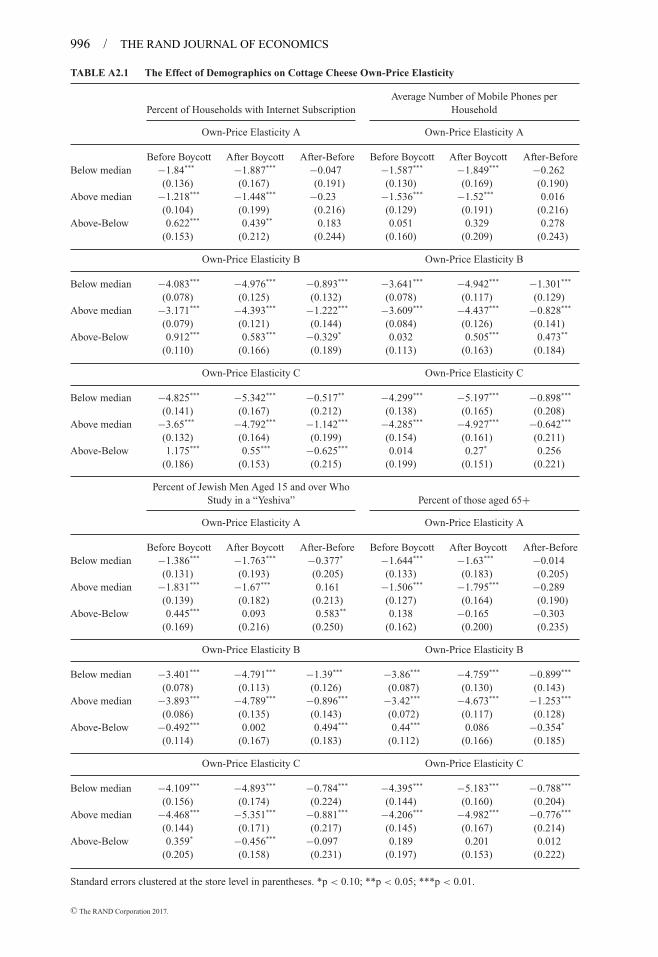
In Table 4, we report the own-price elasticities for each brand in locations where the corre-sponding demographic variable—the percentage of households using a PC and the percentage of
population aged 15 and over with a bachelor’s degree—is above and below the median, as well asbefore and after the boycott. We display above-below and after-before differences and their esti-mated difference-in-difference (in the bottom right cell). Results for the other four demographicvariables appear in Table A2.1 in Appendix A (the underlying estimates of the demand functionare shown in Tables A2.2–A2.4).
Three results are worth mentioning. First, demand is less price elastic in localities with highercomputer usage and with a more educated population, both before and after the boycott (the above-below difference is always positive and significant in all but one case). Because higher computerusage and a more educated population are likely to be associated with higher income levels(we do not have income data), our findings suggest, as one might expect, that richer householdswere less price sensitive both before and after the boycott had started. Second, the elasticities ofbrands B and C increase (in absolute value) after the boycott (the after-before difference is alwaysnegative and significant for brands B and C). In case of brand A, the after-before difference isalso negative, but it is significant only in one case out of four. Third, there is some evidence thatthe (absolute) increase in price elasticity after the boycott was larger in locations with highercomputer usage and with a more educated population: the difference-in-difference estimate isnegative for brands B and C (though is not significant for brand B in one of the two cases).To the extent that the demographics are correlated with exposure to social media, these findingssuggest that locations which are more exposed to social media became more price sensitive afterthe boycott. As mentioned above, even if we cannot infer the causal effect of media utilization,the interactions between the change in elasticities and demographics help validate our estimation,as the implied boycott impact is stronger where it is expected to be.
7. Firms’ behavior
� There are at least three plausible hypotheses for the swift price reductions. The first is thatfirms may have been concerned that the boycott might spill over to other product categories andwanted to protect their brand and image. Unfortunately, though, we do not have detailed data onother dairy products beside cottage and white cheese to examine whether their demands werealso affected by the boycott. We note, however, that Central Bureau of Statistics data show thatprices of several dairy products, like plain yogurt, hard cheese, and sour cream, were not affectedby the boycott, save for Tnuva’s 15% reduction in the prices of dozens of products shortly afterthe IAA dawn raid on Tnuva’s offices on October 2, 2011.
In this section, we therefore consider the two other hypotheses for the swift price reduction:(i) firms may have responded optimally to the increase in the elasticities of demand, and (ii) firmsmay have feared public backlash in the form of government intervention (e.g., reregulation ofprices or the elimination of import barriers), or class action lawsuits.
� Firms’ response to the boycott. The evidence presented in Section 4 suggests that theswift price reduction following the boycott was initially due to temporary special sales by largesupermarket chains, which probably tried to draw customers to their stores with low prices ofcottage cheese. In this section, we turn to the long-run effects of the boycott, once a new equi-librium has been reached. Having estimated demand elasticities before and after the boycott, wecan follow the industrial organization tradition and assume that the prices of the three brandswere determined in a Nash equilibrium of a simultaneous pricing game.26 We use the equilibrium
26 If firms were colluding pre-boycott, prices might not have been determined by the first-order conditions. Webelieve, however, that pre-boycott collusion is unlikely, because the three dairies were heavily scrutinized by the IAA(including a dawn raid on Tnuva’s offices in October 2011) and, as far as we know, no evidence for collusion was found.Moreover, none of the many class action lawsuits that were filled against the dairy manufacturers after the boycott allegescollusion (they are all based on abuse of dominant position arguments).
conditions to solve for the expected price increase associated with the changes in demand elas-ticities. This exercise allows us to assess the extent to which the observed price decline can beexplained by the change in preferences (elasticities).
We begin by assuming that the price of each brand b was set jointly by retailers andthe manufacturer. This assumption is a reasonable approximation: discussions with one of themanufacturers reveal that manufacturers and retailers bargain over many issues, including whole-sale prices, who bears the cost of various sales and promotions, slotting allowances, and an-nual bonuses. This implies that every pair of retailer and manufacturer sets prices to maxi-mize the joint profits of the vertical structure. The inverse elasticity rule for each brand b isgiven by pb−cb
pb= 1
ηb, or pb = ηbcb
ηb−1, where cb represents marginal cost of brand b, and ηb is its
pre-boycott own-price elasticity. Assuming cb did not change from before to after the boycott,we have,
p′b
pb
= η′b
η′b − 1
(ηb − 1)
ηb
, (3)
where p′b and η′
b are, respectively, the post-boycott price and own-price elasticity of demand ofbrand b.
It should be noted that because we estimate constant elasticities demand system (see equation(2)), the first-order condition of each brand is independent of the prices of rival brands. Althoughthis is a potential drawback of our approach, we do not believe it creates a problem for our mainexercise, which involves the comparison of elasticities before and after the boycott. First, weestimate different elasticities before the boycott, when all prices were high, and after the boycott,when all prices, including those of rival brands, were much lower. Second, we also estimateda richer demand system, with the added terms δbi log pbt log pit + δbj log pbt log pjt . Under thismodified system, which can be interpreted as a flexible polynomial in logs, the elasticity ofdemand for brand b is given by βb − δbi log pit − δbj log pjt , so now the first-order condition ofeach brand does depend on the prices of the other two brands. Although several of the interactionsand cross-prices elasticity estimates were not statistically significant, due to high collinearity, wewere able to use the point estimates to compute elasticities. The new estimated elasticities differedfrom our reported elasticities by less than 1%.
Back to equation (3), we can now plug the estimated pre- and post-boycott price elasticitiesfrom Table 2 into equation (3), to examine which part of the price decline following the boycottcan be explained by the change in the elasticities of demand. Because Table 2 shows no significantchange in A’s own-price elasticity, the 24% price drop of brand A cannot be explained by changesin preferences. Also, although the own-price elasticities of demand of brands B and C did increasefollowing the boycott, the computation shows that the post-boycott prices should have been only8% below the pre-boycott price for brand B and only 5% below the pre-boycott price for brandC . Hence, the higher own-price elasticities of demand for brands B and C explain only a fractionof the 24% decline in their respective prices.
Although we assume realistically that the price of brand b is chosen to maximize the jointprofit of the manufacturer and retailer, our conclusion continues to hold when we assume insteadthat the manufacturer of brand b unilaterally sets the wholesale price, wb, and the retailersunilaterally set the retail price, pb. In Appendix B, we show that the price of brand A should nothave changed even in this alternative setting, whereas the prices of brands B and C should havedropped by only 15.4% and 8.6%, respectively; these estimates are still far below the actual dropof 24%.
The finding that actual prices were set substantially below the ones implied by the elasticitiesof demand highlights the fact that the tradition of using first-order conditions to impute markupsmay miss important considerations about the business environment, which are not reflected inthe demand function. In our case, it seems that the missing considerations have been the concern
about public backlash in the form of damaged image, or the possibility of government interventionin the market. We explore these possibilities in the next subsection.
Interestingly, we mentioned in Section 2 that according to the press, the IAA raid on Tnuva’sheadquarters seized a McKinsey report advising Tnuva back in 2008 to raise prices by at least15%, due to low elasticity of demand. In retrospect, it seems that this advice may have contributedto the public backlash. Thus, a message of this article is that insofar as pricing decisions are madesolely on the basis of demand elasticities, ignoring features of the business environment, noteasily captured by first-order conditions, may lead to undesirable outcomes.
� The threat of regulatory intervention. We now quantify the role of regulatory threat.We do so by imputing the threat which rationalizes the observed prices. Following Glazer andMcMillan (1992) and Tanaka (2011), we allow for an expected loss from public backlash orgovernment intervention, captured by μ(p), which is an increasing and convex function of thecurrent price p. Each firm chooses its price p to maximize its value V (p) = (p − c)Q(p) − μ(p),where c is the per-unit cost. The first-order condition for p is
Q(p) + (p − c)Q ′(p) − μ′(p) = 0.
Assuming that (p − c)Q(p) is concave in p, together with the convexity of μ(p), ensure that thefirst-order condition is sufficient for a maximum. At the optimum, firms trade off the effect of p onthe short-run profit, (p − c)Q(p), against the expected marginal loss from public backlash, μ′(p).Using η to denote the own-price elasticity of demand, we can express the first-order condition asa modified inverse elasticity rule:
p − c − μ′(p)Q′(p)
p= 1
η. (4)
The expression μ′(p)Q′(p)
is the derivative of μ(p) with respect to the quantity produced (note that∂μ(p)∂ Q
= μ′(p) ∂p∂ Q
= μ′(p)Q′(p)
) and can therefore be interpreted as the marginal decrease in the expected
loss from public backlash when output is expanded. Equation (4) shows that because μ′(p)Q′(p)
< 0,the firm has an extra incentive to expand output when it faces a larger perceived threat of publicbacklash. Such perceived threat therefore leads to lower prices.
In the previous section, we used the standard first-order conditions to show that the increasedelasticities cannot fully explain the observed price decline. The next step is to use equation (4) toback out μ′(p)
Q′(p).
Because we do not have precise cost data, we will perform a back-of-the-envelope calculationbased on data collected by MOAG. In what follows, we restrict our attention to brand A becausethe MOAG data are believed to be mostly relevant to this brand. The MOAG reports that thegross margin on cottage cheese (defined as the Value Added Tax [VAT]-exclusive retail pricenet of the cost of raw milk) in 2010 was 13.30 NIS per kilogram, or 3.33 NIS per container(the Kahal Report, 2011). Because the average VAT-inclusive retail price of cottage cheese in2010 was 25.86 NIS per kilogram, or 6.47 NIS per container (the Kahal Report, 2011), andbecause VAT was 16% in 2010–2011, the price of raw milk was equal to 6.47
1.16− 3.33 = 2.25
NIS per container. According to the MOAG, raw milk accounts for 58.7% of the cost of dairyproducts (MOF, 2011). Hence, the cost of a container of cottage cheese is estimated to be2.250.587
= 3.83 NIS.Using this cost estimate, recalling that the (16% VAT-exclusive) pre- and post-boycott prices
per container were 71.16
= 6.03 NIS and 5.51.16
= 4.74, and noting from Table 2 that the estimatedown-price elasticity of demand for brand A was 1.564 both before and after the boycott, equation(4) implies that μ′(p)
Q′(p)was 1.65 NIS before the boycott, but rose (in absolute value) to 2.12 NIS
after the boycott. In other words, after the boycott, brand A chose its production level as if itsmarginal cost of production was reduced by 0.47 NIS, which is 18% of the estimated cost of
3.83 NIS per container, and hence expanded output in a way that led to a 24% drop in the retailprice.
Another way to examine the boycott’s effect on prices is to rewrite equation (4) as follows:
p − c
p= 1
η
[1 − μ′(p)
Q(p)
]. (5)
Here, μ′(p)Q(p)
represents the marginal loss of firm value from a price increase due to public backlashper unit of output, which in our case is a 250-gram container. Substituting the same numbers asabove into (5) reveals that μ′(p)
Q(p)for brand A was 0.43 NIS per container before the boycott, but
rose to 0.70 NIS after the boycott. This calculation suggests that the 24% drop in the retail priceof brand A is consistent with a 63% increase (from 0.43 NIS to 0.70 NIS) in the cost per containerfrom public backlash, as perceived by the manufacturer of brand A.
8. Summary and conclusions
� We study a consumer boycott organized through Facebook aimed at forcing manufacturersand retailers to lower prices in a concentrated market. We find that, on average, prices droppedvirtually overnight by about 24%. The price decline was not uniform across stores and storeformats. It was particularly large in the main supermarket chains, especially in the hard-discountstores. Only after the main manufacturers announced a decrease in their wholesale prices, theretail price also fell in the small format stores and remained at the new low level until the end ofour sample period.
Demand declined by about 30% during the initial week of the boycott, relative to its predictedlevel had the boycott not occurred. The decline in demand was more pronounced in stores locatedin areas with more educated and less religious population and higher penetration of personalcomputers, Internet, and mobile phones, where exposure to social networks is likely to be high.Although demand gradually rebounded within 6–8 weeks, demand elasticities nonetheless becomemuch larger than they were before the boycott. This increase is particularly large for cross-priceelasticities which, on average, increased fivefold relative to their pre-boycott level. The increasein price elasticities can be due to increased price awareness. We find that the change in elasticitiesor preference only explains part of the price decline. The rest can be attributed to firms’ fear ofthe boycott spreading to other products and to the fear of public backlash in the form of renewedregulation and possibly other market interventions.
Overall, it appears that the consumer boycott was successful. Prices dropped from around 7NIS per container to about 5.5 NIS per container, and although the boycotters’ demands to lowerthe price of cottage cheese to 5 NIS per container were never met in full, the price of cottagecheese remains relatively low even today, more than six years after the boycott. This is particularlystriking given that over the same period, the prices of many other dairy products increased, somequite substantially. For instance, the average price of unsalted butter rose between May 2011and April 2013 by 25%, natural yogurt rose by 18%, and fresh milk and hard cheese rose by8%. Over the same period, the average price of cottage cheese dropped by 12% and the averageprice of white cheese dropped by 6% (the Center for Research and Information, Israeli Knesset,2013).
The economic literature has already shown that the Internet can provide timely and cheap in-formation on prices and thereby enhance competition and lower prices. Our article describesa detailed example of how social media, such as Facebook, can play a role in allowingatomistic consumers to organize into an effective force that disciplines firms into loweringprices.
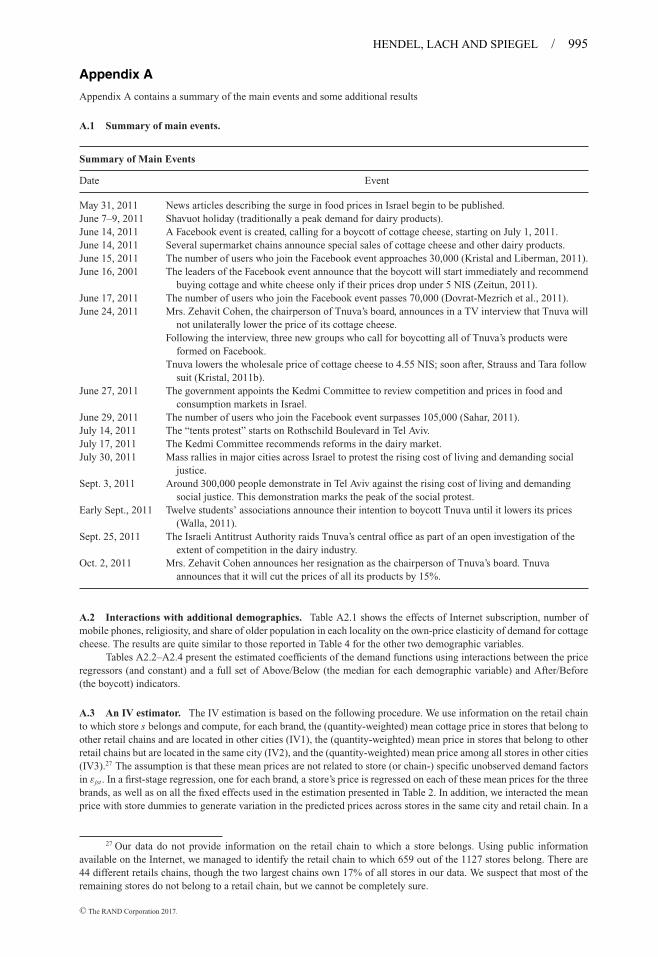
Appendix A contains a summary of the main events and some additional results
A.1 Summary of main events.
Summary of Main Events
Date Event
May 31, 2011 News articles describing the surge in food prices in Israel begin to be published.June 7–9, 2011 Shavuot holiday (traditionally a peak demand for dairy products).June 14, 2011 A Facebook event is created, calling for a boycott of cottage cheese, starting on July 1, 2011.June 14, 2011 Several supermarket chains announce special sales of cottage cheese and other dairy products.June 15, 2011 The number of users who join the Facebook event approaches 30,000 (Kristal and Liberman, 2011).June 16, 2001 The leaders of the Facebook event announce that the boycott will start immediately and recommend
buying cottage and white cheese only if their prices drop under 5 NIS (Zeitun, 2011).June 17, 2011 The number of users who join the Facebook event passes 70,000 (Dovrat-Mezrich et al., 2011).June 24, 2011 Mrs. Zehavit Cohen, the chairperson of Tnuva’s board, announces in a TV interview that Tnuva will
not unilaterally lower the price of its cottage cheese.Following the interview, three new groups who call for boycotting all of Tnuva’s products were
formed on Facebook.Tnuva lowers the wholesale price of cottage cheese to 4.55 NIS; soon after, Strauss and Tara follow
suit (Kristal, 2011b).June 27, 2011 The government appoints the Kedmi Committee to review competition and prices in food and
consumption markets in Israel.June 29, 2011 The number of users who join the Facebook event surpasses 105,000 (Sahar, 2011).July 14, 2011 The “tents protest” starts on Rothschild Boulevard in Tel Aviv.July 17, 2011 The Kedmi Committee recommends reforms in the dairy market.July 30, 2011 Mass rallies in major cities across Israel to protest the rising cost of living and demanding social
justice.Sept. 3, 2011 Around 300,000 people demonstrate in Tel Aviv against the rising cost of living and demanding
social justice. This demonstration marks the peak of the social protest.Early Sept., 2011 Twelve students’ associations announce their intention to boycott Tnuva until it lowers its prices
(Walla, 2011).Sept. 25, 2011 The Israeli Antitrust Authority raids Tnuva’s central office as part of an open investigation of the
extent of competition in the dairy industry.Oct. 2, 2011 Mrs. Zehavit Cohen announces her resignation as the chairperson of Tnuva’s board. Tnuva
announces that it will cut the prices of all its products by 15%.
A.2 Interactions with additional demographics. Table A2.1 shows the effects of Internet subscription, number ofmobile phones, religiosity, and share of older population in each locality on the own-price elasticity of demand for cottagecheese. The results are quite similar to those reported in Table 4 for the other two demographic variables.
Tables A2.2–A2.4 present the estimated coefficients of the demand functions using interactions between the priceregressors (and constant) and a full set of Above/Below (the median for each demographic variable) and After/Before(the boycott) indicators.
A.3 An IV estimator. The IV estimation is based on the following procedure. We use information on the retail chainto which store s belongs and compute, for each brand, the (quantity-weighted) mean cottage price in stores that belong toother retail chains and are located in other cities (IV1), the (quantity-weighted) mean price in stores that belong to otherretail chains but are located in the same city (IV2), and the (quantity-weighted) mean price among all stores in other cities(IV3).27 The assumption is that these mean prices are not related to store (or chain-) specific unobserved demand factorsin εjst . In a first-stage regression, one for each brand, a store’s price is regressed on each of these mean prices for the threebrands, as well as on all the fixed effects used in the estimation presented in Table 2. In addition, we interacted the meanprice with store dummies to generate variation in the predicted prices across stores in the same city and retail chain. In a
27 Our data do not provide information on the retail chain to which a store belongs. Using public informationavailable on the Internet, we managed to identify the retail chain to which 659 out of the 1127 stores belong. There are44 different retails chains, though the two largest chains own 17% of all stores in our data. We suspect that most of theremaining stores do not belong to a retail chain, but we cannot be completely sure.
(0.06) (0.073) (0.181) (0.061) (0.074) (0.18)Log Price C × After 0.398*** 0.492*** −0.457* 0.408*** 0.587*** −0.532*
(0.08) (0.101) (0.215) (0.087) (0.104) (0.22)Log Price C × Above × After 0.066 0.201 −0.874*** 0.07 0.037 −0.777***
(0.094) (0.125) (0.21) (0.095) (0.128) (0.216)
Number of observations 426,881 426,881 426,881 409,972 409,972 409,972R2 0.88 0.74 0.72 0.88 0.74 0.72
Daily price data are used. The sample period is from January 1, 2010 until April 30, 2012, excluding the boycottperiod (May 15, 2011–October 2, 2011) and the period corresponding to a strike at Tnuva (March 18, 2012–April 3,2012). The coefficients for the interactions with the “After” indicator represent the additional effect after the boycott,and the coefficients for the interaction with the “Above” indicator indicate the additional effect for locations withabove the median value of the corresponding demographic variable. All regressions include “day-of-the-week” and storeeffects, which are allowed to change after the boycott, as well as a set of week dummies to capture weekly aggregateeffects, over the sample period. Standard errors clustered at the store level in parentheses. *p < 0.05; **p < 0.01;***p < 0.001.
second-stage, we estimate (2) using the store-specific predicted prices from the first-stage instead of the observed prices(in practice, estimation is done in one step).
Table A3 presents the results. Columns (1)–(3) show IV estimates based on the mean cottage price in stores thatbelong to other retail chains and are located in other cities (IV1), and columns (4)–(6) show IV estimates based on themean price in stores that belong to other retail chains but are located in the same city (IV2). IV estimates based on themean price among all stores in other cities are similar to IV1, and therefore not reported.
The estimated own-price elasticities are qualitatively the same as, and of similar order of magnitude to, the OLS-fixed effect estimates in Table 2, except for brand C , where the elasticity declines (in absolute value) after the boycott.Cross-price elasticities are sometimes negative. The estimates are sensitive to the choice of IV.
(0.061) (0.073) (0.186) (0.062) (0.073) (0.199)Log Price C × After 0.389*** 0.465*** −0.517* 0.393*** 0.515*** −0.898***
(0.084) (0.1) (0.212) (0.08) (0.099) (0.208)Log Price C × Above × After 0.087 0.272* −0.625** 0.092 0.143 0.256
(0.095) (0.125) (0.215) (0.094) (0.126) (0.221)
Number of observations 426,881 426,881 426,881 426,881 426,881 426,881R2 0.88 0.74 0.72 0.88 0.74 0.72
See notes to Table A2.2.
A.4 White cheese own-and cross-price elasticities. Table A4 below reports OLS elasticity estimates for white cheese,using the same specifications as in Table 2. As in the case of cottage cheese, the sample period is from January 1, 2010until April 30, 2012, excluding the subperiod May 15, 2011–October 2, 2011.
Appendix B
Appendix B contains the details of how we cleaned the data, how we computed the BI index, and how we imputepost-boycott prices under double marginalization
B.1 Data cleaning. The raw data file has 22,788,084 observations, each recording the daily total volume of transactionsrecorded by the cash register on a specific item, in a specific day, in 2160 stores. An item is identified by its unique barcode.Of the hundreds of items we had data on (items differ with respect to weight, flavors, fat content, packaging, kashrutstandards, etc.), we selected the 12 most popular ones: 250-gram containers of plain cottage and white cheese, with 3%and 5% fat content, produced by the three major manufacturers.
(0.065) (0.068) (0.205) (0.062) (0.072) (0.197)Log Price C × After 0.499*** 0.730*** −0.784*** 0.515*** 0.487*** −0.788***
(0.08) (0.111) (0.224) (0.079) (0.109) (0.204)Log Price C × Above × After −0.071 −0.233 −0.097 −0.144 0.174 0.012
(0.1) (0.126) (0.231) (0.093) (0.123) (0.222)
Number of observations 399,753 399,753 399,753 428,359 428,359 428,359R2 0.87 0.74 0.72 0.88 0.74 0.72
See notes to Table A2.2.
We then deleted observations with negative values (due to returns), duplicate observations, observations with atotal daily revenue of less than 1 NIS, and observations corresponding to Saturdays (most stores are closed on Saturdayfor religious reasons). We also deleted 1008 stores with fewer than 2000 observations on the 12 items that we study (twothirds of these stores are convenience stores). The logic is as follows: if a store sells one of the 12 items at least onceevery weekday (virtually all shops are closed on Saturdays), we would expect 729 observations per store (the number ofdays between January 1, 2010 and April 30, 2012, excluding Saturdays). Also, if a store sells all 12 items at least once aday, we should expect 8748 observations per store (12 × 729). The deleted stores have on average 690 observations (themedian is 546), indicating that they sell only a limited range of cottage and white cheeses, and do so infrequently.
Overall, the deleted observations represent about 5% of the total sales of the 12 products we focus on. The finalsample includes 6,596,052 observations from 1127 stores on the six products.
B.2 Computation of the BI index. We compute the observed and predicted quantities for each brand separately andthen add them up to get the (aggregate) BI index. We illustrate with brand A.
First, qt is the daily quantity sold of brand A cottage cheese observed in the data. Second, q̂pre(pt ) is the predictedquantity sold of brand A under the pre-boycott demand at post-boycott prices pt . This predicted quantity is computed
(0.139) (0.160) (0.297) (0.124) (0.153) (0.278)Log Price C × after 0.781*** 0.938*** 1.069** 0.400* 0.833** 1.311**
(0.214) (0.307) (0.471) (0.229) (0.352) (0.528)
Number of observations 313,511 313,511 313,511 290,773 290,773 290,773
Daily price data are used. The sample period is from January 1, 2010 until April 30, 2012, excluding the boycott period(May 15, 2011–October 2, 2011) and the period corresponding to a strike at Tnuva (March 18, 2012–April 3, 2012). Thecoefficients for the interactions with the “after” indicator represent the additional effect after the boycott. All regressionsinclude “day-of-the-week” and store effects, whose values are allowed to change after the boycott, as well as a set ofweek dummies to capture weekly aggregate effects over the sample period. Standard errors clustered at the store level inparentheses. *p < 0.10; **p < 0.05; ***p < 0.01.
TABLE A4 White Cheese Own-and Cross-Price Elasticities
Dependent Variable: Log Quantity
(1) (2) (3)Brand A B C
Constant 8.730*** 10.061*** 9.447***
(0.071) (0.096) (0.079)Constant × after −1.172*** −2.339*** −2.856***
(0.152) (0.138) (0.174)Log Price A −2.919*** 0.173*** −0.100***
(0.051) (0.053) (0.038)Log Price A × after −0.183 0.254*** 1.217***
(0.138) (0.097) (0.112)Log Price B 0.112*** −3.665*** 0.041***
(0.017) (0.048) (0.019)Log Price B × after 0.255*** −0.589*** 0.625***
(0.059) (0.099) (0.090)Log Price C 0.058** −0.022 −2.797***
(0.027) (0.045) (0.067)Log Price C × after 0.532*** 0.688*** −0.833***
(0.053) (0.066) (0.123)
Number of observations 367,190 367,190 367,190R2 0.776 0.664 0.768
in two steps. Denote by q̂pre(p) the fitted (predicted) quantity demand estimated using the pre-boycott estimates. Theexpected increase in quantity attributed to the observed price decline (a move along the demand curve) is given byq̂pre(pt ) − q̂pre(pt0 ), where pt0 are prices at a pre-boycott time t0. Thus, predicted sales are:
q̂pre(pt ) = qt0 + [̂qpre(pt ) − q̂pre(pt0 )],
where qt0 is the observed average quantity sold at the pre-boycott time t0.We use the demand function to estimate changes in quantity, rather than its level, because in this way, we do not
need to use the numerous estimated fixed effects, and we rely on observed quantities until the start of the boycott, makingthe predicted quantity at post-boycott prices more reliable.
We use the estimated parameters of the demand function appearing in the first three columns in Table 2 to computethe expected change in demand between the initial period t0 and t , q̂pre(pt ) − q̂pre(pt0 ),
where β̂A , γ̂B and γ̂C are, respectively, the own-and cross-price elasticities from the first column in Table 2 before theboycott started, and log pAt0 , log pBt0 , log pCt0 are prices in the pre-boycott period, being set equal to the mean price duringJune 9–June 13, 2011.
We then have, for brand A,
q̂pre(pt ) = qt0 + el̂n q A (pt )−l̂n q A (pt0 ),
and similarly for the other brands.We then add up the observed and predicted quantities over the three brands and compute the aggregate BI index. The
daily variation in quantity sold during the week is also reflected in the BI index. We therefore remove “day-of-the-week”effects by using the residuals from a regression of the BI index on day-of-the-week fixed effects. Furthermore, for easeof exposition, in Figure 6, we show a normalized BI index obtained by subtracting its value on June 14, 2011.
B.3 The imputed post-boycott prices under double marginalization. Suppose that the manufacturer of brand bsets the wholesale price wb, and the retailers set the retail price pb . Let εb be the elasticity of demand faced by themanufacturer at the wholesale level, and recall that ηb is the elasticity of demand at the retail level. Then, the inverse
elasticity rules at the retail and at the wholesale levels imply that pb = ηbεb cbεb −1
ηb−1= ηbεb cb
(ηb−1)(εb−1). To compute εb, recall from
equation (2) that we assume that the demand for brand b is given by a constant elasticity demand function qb = Ab p−ηbb ,
where ηb is the elasticity of demand for brand b at the retail level, and Ab is a constant that depends on the prices ofthe rival brands, store-brand fixed effects, and demographics. The inverse demand function at the retail level is then
pb = ( qb
Ab)− 1
ηb , and the marginal revenue function, which is also the inverse demand function faced by the manufacturer,
is given by A1ηbb ( ηb−1
ηb)q
− 1ηb
b . Hence, given a wholesale price wb, the wholesale demand function faced by the manufacturer
is qb = Ab( ηb−1ηb
)ηb w−ηbb . It is now easy to check that the elasticity of wholesale demand faced by the manufacturer
is εb = ηb , just like the elasticity of demand at the retail level. Consequently, the equilibrium retail price should be
pb = ηbεb cbεb−1
ηb−1= ( ηb
ηb−1)2cb, which in turn implies that cb = ( ηb−1
ηb)2 pb. Hence, the post-boycott price of brand b, p′
b , shouldbe equal to
p′b =
(η′
b
η′b − 1
)2
cb =(
η′b
η′b − 1
)2 (ηb − 1
ηb
)2
pb, (B1)
where η′b is the post-boycott own-price elasticity of demand of brand b.
As before, the boycott should not have affected the price of brand A, because the own-price elasticity of brand Adid not change significantly. Therefore, it appears that the 24% decline in the price of brand A was fully due to an attemptto contain the potential repercussions of the boycott. Substituting ηB = 3.632 and η′
B = 4.707 for brand B, and ηC = 4.3and η′
C = 5.071 for brand C , into equation (B1) reveals that the post-boycott prices should have been 15.4% below thepre-boycott price for brand B and 8.6% below the pre-boycott price for brand C . Because the actual price of brands Band C came down 24%, we can conclude again that the boycott directly influenced the pricing of brands B and C aboveand beyond what was implied by the higher own-price elasticities of demand.
References
ABITO, J., BESANKO, D., AND DIERMEIER, D. “Corporate Reputational Dynamics, Private Regulation, and Activist Pressure.”Strategy Beyond Markets, Advances in Strategic Management, Vol. 34 (2016), pp. 235–299.
ACEMOGLU, D., HASSAN, T.A., AND TAHOUN, A. “The Power of the Street: Evidence from Egypt’s Arab Spring.” NBERWorking Paper no. 20665, 2014.
ANDERSEN, K. “The Protester.” Time Magazine. www.time.com/time/specials/packages/article/0,28804,2101745_2102132,00.html. Accessed December 14, 2011.
ASHENFELTER, O., CICCARELLA, S., AND SHATZ, H.J. “French Wine and the U.S. Boycott of 2003: Does Politics ReallyAffect Commerce?” Journal of Wine Economics, Vol. 2(1) (2007), pp. 55–74.
BARON, D. “Private Politics.” Journal of Economics & Management Strategy, Vol. 12(1) (2003), pp. 31–66.BARON, D. AND DIERMEIER, D. “Strategic Activism and Non-market Strategy.” Journal of Economics & Management
Strategy, Vol. 16(3) (2007), pp. 599–634.BENTZEN, J. AND SMITH, V. “French Nuclear Testings and Consumption of French Wine in Denmark.” International
Journal of Wine Marketing, Vol. 14(3) (2002), pp. 20–36.BREUER, A. “The Role of Social Media in Mobilizing Political Protest: Evidence from the Tunisian Revolution.” German
Development Center Discussion Paper no. 10/2012, 2012.CAMPANTE, F., DURANTE, R., AND SOBBRIO, F. “Politics 2.0: The Multifaceted Effect of Broadband Internet on Political
Participation.” NBER Working Paper no. 19029, 2013.CHAVIS, L. AND LESLIE, P. “Consumer Boycotts: The Impact of the Iraq War on French Wine Sales in the U.S.” Quantitative
Marketing Economics, Vol. 7 (2009), pp. 37–67.CLERIDES, S., DAVIS, P., AND MICHIS, A. “National Sentiment and Consumer Choice: The Iraq War and Sales of US
Products in Arab Countries.” Scandinavian Journal of Economics, Vol. 117(3) (2015), pp. 829–851.CZERNICH, N. “Broadband Internet and Political Participation: Evidence for Germany.” Kyklos, Vol. 65(1) (2012),
pp. 31–52.DAVIDSON, W., WORRELL, D., AND EL-JELLY, A. “Influencing Managers to Change Unpopular Corporate Behavior through
Boycotts and Divestitures.” Business and Society, Vol. 34 (1995), pp. 171–196.DIERMEIER, D. “When Do Company Boycotts Work?” HBR Blog Network. Available at blogs.hbr.org/cs/2012/08/
when_do_company_boycotts_work.html, 2012. Accessed September 29, 2017.ELLISON, S.F., AND WOLFRAM, C. “Coordinating on Lower Prices: Pharmaceutical Pricing under Political Pressure.” RAND
Journal of Economics, Vol. 37(2) (2006), pp. 324–340.ENIKOLOPOV, R., MAKARIN, A., AND PETROVA, M. “Social Media and Protest Participation: Evidence from Russia.” Mimeo,
2016.ENJOLRAS, B., STEEN-JOHNSEN, K., AND WOLLEBAEK, D. “Social Media and Mobilization to Offline Demonstrations:
Transcending Participatory Divides?” New Media and Society, Vol. 15(6) (2012), pp. 890–908.EPSTEIN, M. AND SCHNIETZ, K. “Measuring the Cost of Environmental and Labor Protests to Globalization: An Event
Study of the Failed 1999 Seattle WTO Talks.” The International Trade Journal, Vol. 16(2) (2002), pp. 129–160.ERFLE, S. AND MCMILLAN, H. “Media, Political Pressure, and the Firm: The Case of Petroleum Pricing in the Late 1970s.”
Quarterly Journal of Economics, Vol. 105(1) (1990), pp. 115–134.FAIOLA, A. AND MOURA, P. “Middle-Class Rage Sparks Protest Movements in Turkey, Brazil, Bulgaria and Be-
yond.” Washington Post. articles.washingtonpost.com/2013-06-28/world/40250885_1_turkey-new-government-arab-spring. Accessed June 28, 2013.
FALCK, O., GOLD, R., AND HEBLICH, S. “E-lections: Voting Behavior and the Internet.” American Economic Review,Vol. 104(7) (2014), pp. 2238–2265.
FERSHTMAN, C. AND GANDAL, N. “The Effect of the Arab Boycott on Israel: The Automobile Market.” RAND Journal ofEconomics, Vol. 29(1) (1998), pp. 193–214.
FISMAN, R., HAMAO, Y., AND WANG, Y. “Nationalism and Economic Exchange: Evidence from Shocks to Sino-JapaneseRelations.” Review of Financial Studies, Vol. 27(9) (2014), pp. 2626–2660.
FRIEDMAN, M. “Consumer Boycotts in the United States, 1970–1980: Contemporary Events in Historical Perspective.”Journal of Consumer Affairs, Vol. 19 (1985), pp. 96–117.
———. Consumer Boycotts. New York: Routledge, 1999.GAVAZZA, A., NARDOTTO, N., AND VALLETTI, T. “Internet and Politics: Evidence from UK Local Elections and Local
Government Policies.” Mimeo, 2015.GLAZER, A. AND MCMILLAN, H. “Pricing By the Firm under Regulatory Threat.” Quarterly Journal of Economics,
Vol. 107(3) (1992), pp. 1089–1099.GONZALEZ-BAILON, S. AND WANG, N. “The Bridges and Brokers of Global Campaigns in the Context of Social Media.”
Mimeo, 2013.HARRISON, A. AND SCORSE, J. “Multinationals and Anti-Sweatshop Activism.” American Economic Review, Vol. 100(1)
(2010), pp. 247–273.HONG, C., HU, W., PRIEGER, J., AND ZHU, D. “French Automobiles and the Chinese Boycotts of 2008: Politics Really Does
Affect Commerce.” The B.E. Journal of Economic Analysis & Policy, Vol. 11(1) (2011), Article 26.ISKANDER, E. “Connecting the National and the Virtual: Can Facebook Activism Remain Relevant After Egypt’s January
25 Uprising?” International Journal of Communication, Vol. 5 (2011), pp. 13–15.KOKU, P.S., AKHIGBE, A., AND SPRINGER, T. “The Financial Impact of Boycotts and Threats of Boycotts.” Journal of
Business Research, Vol. 40 (1997), pp. 15–20.MINER, L. “The Unintended Consequences of Internet Diffusion: Evidence from Malaysia.” Journal of Public Economics,
Vol. 132 (2015), pp. 66–78.OFEK, Y. “The Influence of Maximum Price Regulation Removal on Milk Products Prices in Israel During the Period
PRUITT, S. AND FRIEDMAN, M. “Determining the Effectiveness of Consumer Boycotts: A Stock Price Analysis of TheirImpact on Corporate Targets.” Journal of Consumer Policy, Vol. 9 (1986), pp. 375–387.
PRUITT, S., WEI, K.C.J., AND WHITE, R. “The Impact of Union-Sponsored Boycotts on the Stock Prices of Target Firms.”Journal of Labor Research, Vol. 9(3) (1988), pp. 285–289.
SIEGEL BERNARD, T. “In Retreat, Bank of America Cancels Debit Card Fee.” New York Times, Nov. 1, 2011. www.nytimes.com/2011/11/02/business/bank-of-america-drops-plan-for-debit-card-fee.html?_r=0.
STANGO, V. “Strategic Responses to Regulatory Threat in the Credit Card Market.” Journal of Law and Economics,Vol. 46 (2003), pp. 427–452.
TANAKA, M. “The Effects of Uncertain Divestiture as Regulatory Threat.” Journal of Industry, Competition, and Trade,Vol. 11(4) (2011), pp. 385–397.
TEOH, S.H., WELCH, I., AND WAZZAN, C.P. “The Effect of Socially Activist Investment Policies on the Financial Markets:Evidence from the South African Boycott.” Journal of Business, Vol. 72 (1999), pp. 35–89.
TUFEKCI, Z. AND WILSON, C. “Social Media and the Decision to Participate in Political Protest: Observations from TahrirSquare.” Journal of Communication, Vol. 62 (2012), pp. 363–379.
VALENZUELA, S., ARRIAGADA, A., AND SCHERMAN, A. “The Social Media Basis of Youth Protest Behavior: The Case ofChile.” Journal of Communication, Vol. 62 (2012), pp. 99–314.
WOLFRAM, C. “Measuring Duopoly Power in the British Electricity Spot Market.” American Economic Review, Vol. 89(4)(1999), pp. 805–826.
News articles and official documents in Hebrew.
AHARONI, E. Globes. August 18, 2011. Available at www.globes.co.il/news/article.aspx?did=1000674348), 2011.DOVRAT-MEZRICH, A., ROSENBREG KENDEL, R., LEVIN, R., AZRAN, E., KOREN, O., AND ZRAHIYA, Z. The Marker. June 17,
2011. Available at www.themarker.com/markets/1.656978.Globes. June 29, 2011. Available at www.globes.co.il/news/article.aspx?did=1000655975, 2011.HAYUT, I. Globes. January 9, 2012. Available at http://www.globes.co.il/news/article.aspx?did=1000713569.HAYUT, I. Globes. June 26, 2011. Available at www.globes.co.il/serveen/globes/docview.asp?did=1000657979&fid=1725.Israeli Tax Authority. 2012. Available at taxes.gov.il/customs/Documents/Mekach/help%201696.pdf.KAHAL, Y. “Examination of the Need for Regulation on Dairy Products.” Ministry of Agriculture and Rural Development,
2011.KRISTAL, M. YNET, June 15 (2011a). Available at www.ynet.co.il/articles/0,7340,L-4082055,00.html.———. YNET, October 7 (2011b). Available at www.ynet.co.il/articles/0,7340,L-4132530,00.html.KRISTAL, M. AND LIBERMAN, K. YNET, June 16, 2011. Available at www.ynet.co.il/articles/0,7340,L-4082323,00.html.LEIBZON, Y. Galaz. June 24, 2011. Available at qa-galatz.scepia-sites.co.il/1404-38999-he/Galatz.aspx.Ministry of Agriculture and Rural Development (MOAG). 2013a. Available at www.moag.gov.il/yhidotmisrad/
dovrut/publication/2013/pages/Price_Supervision.aspx.———. 2013b. Available at www.moag.gov.il/yhidotmisrad/dovrut/publication/2013/pages/prices_change_jan_2014.
aspx.Ministry of Finance (MOF). 2011. Available at www.mof.gov.il/releases/documents/milk2011.doc.SAHAR, L. Bizportal, June 29, 2011. Available at www.bizportal.co.il/general/news/article/276783.State Comptroller of Israel. “Opinion on Regulation of Food Prices and Regulation on Dairy Product Prices.” September
2012. Available at www.icba.org.il/news/files/food_milk.pdf.The Center for Research and Information, Israeli Knesset. “The Increase in Food Prices in Israel.” July 3, 2011. Available
at www.knesset.gov.il/mmm/data/pdf/m02879.pdf.———. “Analysis of the Effect of Concentration in the Food Market on the Increase in Food Prices in Israel.” July 2,
2013. Available at www.knesset.gov.il/mmm/data/pdf/m03256.pdf.The “Kedmi Committee” Report (The Competitiveness in the Food and Consumer Goods Market Committee), 2012. Avail-
able at www.moit.gov.il/NR/rdonlyres/2301FA18-DDC9-4983-AF08-AD473CBB9400/0/reportMilk180712.pdf.Walla. September 8, 2011. Available at news.walla.co.il/?w=/3/1858515.YEFET, O. Calcalist. June 14, 2011. Available at www.calcalist.co.il/marketing/articles/0,7340,L-3520937,00.html.YNET. July 17, 2011. Available at www.ynet.co.il/articles/0,7340,L-4256063,00.html.ZEITUN, Y. YNET, June 16, 2011. Available at www.ynet.co.il/articles/0,7340,L-4083268,00.html.